Embed Size (px)
Citation preview
Pertanika 5(1), 39--44 (1982)
An Evaluation of An Inductively Coupled Plasma (ICP)Emission Spectrometer
C.K. LEE, K.S. LOW and R. HOH2
Department of Chemistry, Faculty of Science and Environmental Studies, Universities Pertanian Malaysia,Serdang, Selangor, Malaysia.
Key words: ICP; resettability; reliability; spectral interference; SD; RSD.
RINGKASAN
Prestasi satu spektrometer pancaran yang berjenis Plasma Berganding secara Aruhan (ICP) telahdikaji dari segi kepersisan monokromator, kestabilan penjana ICP, dan had-had pengesanan. Kajian-kajianini menunjukkan bahawa prestasi sistem analitik ini adalah sama dengan spektrometer yang memberikancatitan langsung dengan serentak. Kepersisan bagi monokromator, pelaras ketinggian suluh serta kestabilanunit sumber disahkan.
SUMMARY
The performance of an Inductively Coupled Plasma (ICP) emission spectrometer was evaluated in'terms of its monochromator resettability, ICP generator stability and detection limits. The studies showedthat the analytical system exhibited similar performance to simultaneous direct reading spectrometers. Thereliability of the monochromator, torch heigh t adjustor and the stability of the source unit were confirmed.
INTRODUCTION
In the past few years there has been anincreasing application of inductively coupledplasma (ICP) as an excitation source for opticalemission spectrometers (Greenfield, 1975; Barnes,1978; Fassel, 1978). Most of the analytical systemsusing this technique resorted to polychromatorsas the optical unit (Barnes, 1979). These directreading simultaneous polychromators had theadvantage of providing for simultaneous determination of an excess of 20 elements. The limitation occurred when matrix composition varied andwhen semi-qualitative analysis was required. Amajority of polychromators therefore incorporateda scanning monochromator for this reason (Lowe,1980). The extension of such a development inemission spectrometers was the introduction ofsequential scanning monochromators which arecomputer-controlled and capable of multielementdeterminations. Several of these sequen tial scanningICP emission spectrometers have recently beenevaluated (Spillman, 1976; Ediger, 1979; Floyd,1980; Nippus, 1980).
In this paper, the performance of a sequentialsystem in terms of monochromator resettability,ICP generator stability, spectral interference anddetection limits was evaluated.
EXPERIMENTAL
InstrumentA Labtest Equipment Co. Model 710
P1asmascan sequential emission spectrometer wasused. The operating conditions are summarisedin Table 1. The standard software supplied withthe systel]l comprises general routines like CreateFile, Wavelength Calibrate, Peak Find, Calibrateand Run Unknowns. These i routines are selfexplanatory.
Monochromator PerformanceThe monochromator performance was eva
luated using two methods. The first method wasto use the Peak Find routine to 'peak' two elementsCa(3933.66A) and Mn (2576.10A). Ten sets ofreadings were taken and the standard deviation(SD) for each element wavelength was calculated.In the second method, three elements (Ca, Mn andNa) were used. Relative standard deviations(RSD) for each element using 1.0 Jlg cm-3 solutions were calculated for ten 1G-second integrationruns at each wavelength of interest. The RSD's forten 1G-second integration scans using the autorunroutine were also computed.Torch Height Adjustment
The instrument has an electronically controlled torch height adjustment. The torch heights
1 This is a modified version of a paper presented at the First Asian Pacific Chemical Congress, April, 1981, Singapore.2 Associated Technical Service, Kuala Lumpur.
39

C.K. LEE, K.S. LOW AND R. HOH
Monochromater : 0.75 m Czerny-Turner Monochromater
TARLE 1Operating Conditions
Wavelength Range: 1700 - 3100 A3100-8000A
InterferencesThe effects of spectral interferences on six
elements were determined using 1000.0 J1g cm-3
solutions of a selected list of elements. Each 'interference element' was aspired into the plasma, aftersetting the monochromator to the analyticalwavelength of the 'interfered element'.
concentration used'
Signal to background ratio at C
relative standard deviation of theblank solution.
where C
SBR
(RSD)b
De tection LimitsDetection limits and signal to background
ratios On/Ia) using 1.0 ,ug cm-3 solution of sixelements were determined. Detection Limits werecalculated using the equation recommended by the'ICP Detection Limits Committee' (1979).
CDL 3 (RSD)b x SBR
2nd Order1st Order
: 300 Kpa
: 3.7 A/mm 2nd Order7.4 A/mm 1st Order
: 27.12 MHz, 2000W rating,operated at 1.2W forwardpower, 5W reflected power
: Pneumatic modified Babbington type, (G.M.K.) using a10 roller Gilson PeristalticPump.
: Sample 0.6 dm3 /minCoolant 12 dm 3 /min
R.F Generator
Liner Dispersion
Nebuliser System
Nebuliser GasPressure
Ar Flow Rates
were set using a ten-turn potentiometer with dialsettings. Each turn in the potentiometer gave a4.7 mm change in observation height from the topof the coil to the viewing aperture. The SD of tenmeasurements after each torch height adjustmentwas determined. The resettability of torch heightat two observation zones were evaluated using1.0,ug cm- 3 solution of Mn.
: 2 cm3 /min
: 15 mm, unless otherwisestated.
The nature of the interference of Co and Feon Cu was studied and interference correctionswere then computed.
for six elements in theto 1000 ,ug cm-3 were
Calibration CurvesCalibration curves
range 1.0 ,ug cm-3
computed.
Standard SolutionsAll standard solutions, except :ln, were pre
pared from A. R. grade nitrate of the elements in1% nitric acid. Zn metal was dissolved in nitricacid and the strength was adjusted to 1%. A 1%nitric acid was used as blank. This was to eliminateany possible matrix effects.
20J1rn110,um
: EntranceExit
Slits
Solution UptakeRate
ObservationHeif(h t
Integration TimesThe computer software required that an
integration time be defined for each element file.A 1.0 ,ug cm-3 solution of Mn was used to establish an optimum integration time with respectto RSDs. At each integration time entered, countsfor 10 runs were recorded and the RSD wascalculated. Integration times of 1, 2, 4, 8,..10,20,30 seconds were entered consecutively after eachset of ten runs.
Observation HeightThe signal to background ratio (In/Ib) was
measured at various heights for Cu, Ca, Cr, Zn, Ni,Fe, Co, Mn, Na and K. Except for Mn and K, theconcentration of each element studied was 10.0,ugcm-3 • The concentrations for Mn and K were 1.0,ug cm-3 and 1000 ,ug cm-3 respectively.
RESULTS AND DISCUSSION
Table 2 shows the results on the evaluationof the monochromator performance. The SD foreach wavelength obtained from the Peak Findrou tine was within ± 0.04A. There was no significant difference between the RSD's of the 1.0,ugcm-3 solution calculated from ten 10-second integration runs and the RSD's of ten 1O-second integration scans using the au to-run rou tine.
The results indicate that the monochromatorwas sufficiently resettable to give reproducibleanalytical values. Similar scanning monochromatorsystems have reported SD for wavelength resettability of ± 0.04)\ (Floyd et al., 1980; Nippus, 1980).
40

AN EVALUATION OF AN ICP EMISSION SPECTROMETER
TABLE 2Monoclu:omator Resettability
Element Wavelength (A) Peak Found (A) Mono Setting (A)
Ca 3933.66 3933.24 3933.24
Mn 2576.10 2576.05 5152.10
SD calculated from 10 peak find routines
Element Wavelength (A) Peak Found (A) Mono Setting (A)
Ca 3933.66 3933.25 3933.25
Mn 2576.10 2576.05 5152.10
Na 5889.95 5889.56 5889.56
RSD
0.0127
0.0128
0.0171
SD
± 0.04/\
± O.OIA
RSD (Scan)
0.0209
0.0080
0.0132
Note; RSD calculated from 10 ten-second in tegrations using 1.0 /lg/cm 3 solu tions.
TABLE 3Torch Height Resettability
The results of the torch height adjustmentare given in Table 3. There is no significant difference in the RSD for each torch heigh t setting.The RSD of ten 10-second integrations at a fixedtorch height was 8.70 X 10⁻³
• Since the torchheight was resettable with precision, the systemallowed for studies of effect on signal to background ratios with varying observation heights.
Torch Height
20mm
10mm
RSD (Fixed)
*8.70 X 10⁻³
RSD (Changed)
7.67 X 10⁻³
7.73 X 10⁻³
30r-------------·-------~
.~
"-'----- -----~-
taneous direct reading spectrometers, compromised observation heights were necessarily used.
Sequential scanning spectrometers, however,need not have this limitation. In routine analysis,a compromised height (15 mm) was selected forthe sequential instrument. However, when lowdetection limits were required, the optimum heightwas set for that particular element.
Fig. 1. RSD at various intergration times.Intergration Time (sec)
3025201510o
The graphical representation of RSD againstvarying integration time using a 1.0 /lg cm-3
solution of Mn is given in Fig. 1. The minimumintegration time should be not less than 10 secondsif RSD was not to be sacrificed. Similar sequentialscanning systems had used 2-second integrationtimes without reporting their RSD. (Hoult, 1980).
Note:RSD calculated from 10 ten-second integrations using1. 0 /lg/cm3 Mn solutions.Measured resettability of torch height is ± 0.01 mm.
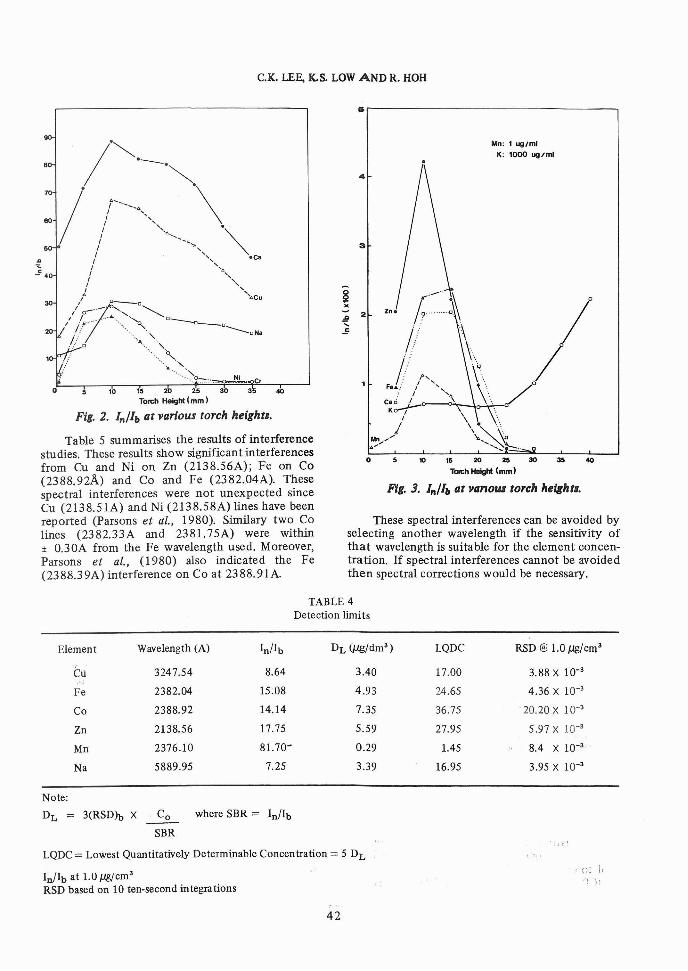
The changes in signal to background ratio(In/Ib) at various observation heights for theelements studied are shown in Fig. 2 and 3. Theresults illustrate that each element had an optimumobservation height which mayor may not be identical to each other. These results are characteristicof ICP systems. (Barnes, 1978, 1979). In simul-
Table 4 gives the detection limits, signal tobackground ratios, and RSD's for each 1.0 /lg cm-3
solution of the six elements under study. Mostelements showed RSD levels within 1%. The(In/lb) values were higher than anticipated, butthe detection limits were not lower than thoseestimated by Wing et al., (1979).
41
C.K. LEE, K.S. LOW AND R. HOH
15r------------------~
These spectral interferences can be avoided byselecting another wavelength if the sensitivity ofthat wavelength is suitable for the element concentration. If spectral interferences cannot be avoidedthen spectral corrections would be necessary.
Mn: 1 ug/ml
K: 1000 ug/ml
403510 15 20 25 30
Torch Helghl (mm)
Fig. 3. In/I" at vanora torch height'.
o
3
E 2....oS
ro ffi U ~ 3 ~
Torch Height (mm )
Fig. 2. In/I" at various torch height'.
Table 5 summarises the results of interferencestudies. These results show significant interferencesfrom Cu and Ni on Zn (2138.56A); Fe on Co(2388.92A) and Co and Fe (2382.04A). Thesespectral interferences were not unexpected sinceCu (2138.51A) and Ni (2138.58A) lines have beenreported (Parsons et al., 1980). Similary two Colines (2382.33A and 2381.75A) were within± 0.30A from the Fe wavelength used. Moreover,Parsons et al., (1980) also indicated the Fe(2388.39A) interference on Co at 2388.91A.
~
e- 40
TABLE 4Detection limits
Element Wavelength (A) In/lb DL {J1I!,/dm3) LQDC
eli 3247.54 8.64 3.40 17.00,I;
Fe 2382.04 15:08 4.93 24.65
Co 2388.92 14.14 7.35 36.75
Zn 2138.56 17.75 5.59 27.95
Mn 2376.10 81.70- 0.29 1.45
Na 5889.95 7.25 3.39 16.95
RSD @ 1.0 J1g/cm 3
3.88 X 10⁻³
4.36 X 10⁻³
20.20 X 10⁻³
5.97 X 10⁻³
8.4 X 10⁻³ .
3.95 X 10⁻³
Note:
DL = 3(RSD~ X ,Co where SBR = In/lb
SBR
LQDC = Lowest Quantitatively Determinable Concentration = 5 DL
In/lb at 1.0 J1g/cm 3
RSD based on 10 ten-second integrations
) (' !
I I ~ ~ ,
42

AN EVALUATION OF AN ICP EMISSION SPECTROMETER
TABLE 5Interference Studies
Interfering Apparent Concentration (JJ.g/cm 3) of Interfered Element
Element Cu Zn Fe Co Mn Na
Cu * 7.527 0.036 0.045 0.003
Ca 0.021 0.013 0.005 0.013 0.119
Cr 0.013 0.155 0.026 0.130 0.258 0.039
Zn -0.011 * 0.045 0.024 0.012
Ni 0.019 3.996 0.156 0.195 0.007 0.074
Fe 0.096 0.572 * 2.915 0.409 0.078
Co 0.054 0.233 2.545 * 0.137 0.496
Mn 0.022 0.541 0.258 0.293 * 0.030
Na -0.004 0.004 0.005 0.003 *K -0.007 0.005 0.012 0.003 -0.002 0.779
Note: 1000 lJi,/cm 3 interfering element on interfered element wavelength.
The interference of Co and Fe on Cu wasfound to affect parallel shift along the linear calibration of Cu. Table 6 gives the interferencecorrections. The equation shows that the interference effect was not a linear relationship. Moreover coefficients of the second order polynomialrelationship indicated that the actual correctionwas minimal.
TABLE 6Interelement Correction
(CU)T = (Cu)A + f(Fe) + f(Co)
where (Cu)T = true concentration of Cu
(Cu)A = Apparent concentration ofCu
Now f(Fe) -2.684373E - 04(Fe) + 1.070595E- 08(Fe)'
f(Co) -2.283135£ - 04(Co) + 1.463613£- 08(Co)'
Then (Cu)T= (Cu)A + 1.070595£ - 08(Fe)' 2.684373E - 04(Fe)(Cu)A + 1.463413£ - 08(Co)' 2.283135E - 04(Co)
Fig. 4, 5 and 6 give the calibration curves forthe six elements under study. All the curvesillustrate linearity over three to four orders ofmagnitude as reported by Barnes (1978). A twopoint calibration routine would, therefore, besufficient for most elements.
43
Fig. 4. Calibration curves ofMn and Cu.
Fig. 5. Calibration curves of Fe and Zn.

C.K. LEE, K.S. LOW AND R. HOH
Con;~/'C."})
Fig. 6. Calibration curves of Co and Na.
CONCLUSION
Studies on the sequential scanning rep emissionspectrometer show that the analytical systemexhibited similar performances to simultaneousdirect reading spectrometers. The reliability ofthe monochromator, torch height adjustor andstability of the source unit were all confirmed.
Data accumulated from these and futurestudies on spectral interferences will eventuallyallow for the routine use of the instrument inquantitative analysis.
R.EFERENCES
BARNES, R.M. (1978): Recent Advances in EmissionSpectroscopy; Inductively Coupled Plasma DischargeFor Spectrochemical Analysis. CRC Crit. Rev. Anal.Chern. 7, 203.
BARNES, R.M. (1979): Application of Plasma EmissionSpectrochemistry. London: Heyden and Son.
44
BARNES, R.M. (1979): ICP Detection LimitsCommittee:Publication of An ICP Detection Limits Program.ICP Information Newsletter. 5, 295.
EDIGER, R.D., WILSON, D.L., (1979): The Performanceof An Inductively Coupled Plasma on The Model5000 Atomic Absorption Spectrometer. AtomicAbsorption Newsletter. 18, 41.
FASSEL, V.A. (1978): Quantitative Elemental AnalysisBy Plasma Emission Spectroscopy. Science. 202,183.
FLOYD, M.A., FASSEL, V.A., WINGE, R.K., KATZENBERGER, 1.M., D. SILVA, A.P. (1980): InductivelyCoupled Plasma - Atomic Emission Spectroscopy:A Computer Controlled, Scanning MonochromatorSystem For The Rapid Sequential Determination ofThe Elements. Anal. Chern. 52,431.
GREENFIELD, S., lONES, I.L., Mc GEACHIN, H.M.,SMITH, P.B. (1975): Automatic. multi-samplesimultaneous Multielement Analysis With A HighFrequency Plasma Torch And Direct-ReadingSpectrometer. Anal Chern. Acta. 74,225.
HOULT, D.W., BEATY, M.W., WALLACE, G.F. (1980):Automated, Sequential, Multielement Analysis ofAgricultural Samples by Inductively Coupled PlasmaEmission Spectroscopy. Atomic Spectroscopy. 1,157.
LOWE, R.M., WILLIS, 1.B. (1980): Inductively CoupledPlasma in Australia. ICP Information Newsletter.6,7.
NIPPUS, M. (1980): Computer Controlled ICP EmissionSpectrometer. ICP Information Newsletter. 6, 297.
PARSONS, M.L., FORESTER, A., ANDERSON, D.(1980): An Atlas of Spectral Interference in ICPSpectroscopy. New York. Plenum Press.
SPILLMAN, R.W., MALMSTADT, H.V. (1976): Computer-Controlled Programmable MonochromatorSystem With Automated Wavelength CalibrationAnd Background Correction. Anal. Chern. 48, 303.
WINGE, R.K., PETERSON, V.l., FASSEL, V.A. (1979):Inductively Coupled Plasma - Atomic EmissionSpectroscopy: Prominant Lines. Applied Spec. 33,206.
(Received 10 September 1981)


![24941-100-30R-G01-00073 Tunra 6299 Report Final[1]](https://img.pdfslide.us/doc/110x75/55261cd35503468e6e8b4b4d/24941-100-30r-g01-00073-tunra-6299-report-final1.jpg)