Embed Size (px)
Citation preview

Submitted 16 April 2014Accepted 23 September 2014Published 14 October 2014
Corresponding authorErrol Strain,[email protected]
Academic editorKeith Crandall
Additional Information andDeclarations can be found onpage 21
DOI 10.7717/peerj.620
Copyright2014 Pettengill et al.
Distributed underCreative Commons CC-BY 4.0
OPEN ACCESS
An evaluation of alternative methods forconstructing phylogenies from wholegenome sequence data: a case study withSalmonellaJames B. Pettengill, Yan Luo, Steven Davis, Yi Chen,Narjol Gonzalez-Escalona, Andrea Ottesen, Hugh Rand,Marc W. Allard and Errol Strain
Center for Food Safety & Applied Nutrition, U.S. Food & Drug Administration, College Park,MD, USA
ABSTRACTComparative genomics based on whole genome sequencing (WGS) is increasinglybeing applied to investigate questions within evolutionary and molecular biology,as well as questions concerning public health (e.g., pathogen outbreaks). Given theimpact that conclusions derived from such analyses may have, we have evaluatedthe robustness of clustering individuals based on WGS data to three key factors: (1)next-generation sequencing (NGS) platform (HiSeq, MiSeq, IonTorrent, 454, andSOLiD), (2) algorithms used to construct a SNP (single nucleotide polymorphism)matrix (reference-based and reference-free), and (3) phylogenetic inference method(FastTreeMP, GARLI, and RAxML). We carried out these analyses on 194 wholegenome sequences representing 107 unique Salmonella enterica subsp. enterica ser.Montevideo strains. Reference-based approaches for identifying SNPs produced treesthat were significantly more similar to one another than those produced under thereference-free approach. Topologies inferred using a core matrix (i.e., no missingdata) were significantly more discordant than those inferred using a non-core matrixthat allows for some missing data. However, allowing for too much missing data likelyresults in a high false discovery rate of SNPs. When analyzing the same SNP matrix,we observed that the more thorough inference methods implemented in GARLI andRAxML produced more similar topologies than FastTreeMP. Our results also confirmthat reproducibility varies among NGS platforms where the MiSeq had the lowestnumber of pairwise differences among replicate runs. Our investigation into the ro-bustness of clustering patterns illustrates the importance of carefully considering howdata from different platforms are combined and analyzed. We found clear differencesin the topologies inferred, and certain methods performed significantly better thanothers for discriminating between the highly clonal organisms investigated here. Themethods supported by our results represent a preliminary set of guidelines and astep towards developing validated standards for clustering based on whole genomesequence data.
Subjects Bioinformatics, Evolutionary Studies, Food Science and Technology, Microbiology,Public HealthKeywords Salmonella, Outbreak, Congruence, Phylogenetics, Next generation sequencing,Single nucleotide polymorphism
How to cite this article Pettengill et al. (2014), An evaluation of alternative methods for constructing phylogenies from whole genomesequence data: a case study with Salmonella. PeerJ 2:e620; DOI 10.7717/peerj.620

BACKGROUNDThe increasing availability and decreasing costs of next-generation sequencing (NGS)
has made it possible to apply this technique to investigate non-model organisms and
myriad questions within evolutionary and molecular biology. Next-generation sequencing
as a means to acquire whole genome sequences (WGS) has also revolutionized applied
research, where it is now, for example, being employed to investigate issues related
to public health such as pathogenic outbreaks (Lienau et al., 2011; Parkhill & Wren,
2011; Roetzer et al., 2013; Underwood et al., 2013). In this situation, the vastly increased
information content in WGS data provides a genome perspective of differences among
isolates, which can be used to identify gene specific differences associated with virulence
and pathogenicity. The information content within WGS data also provides superior
discriminatory power with which the evolutionary relationships among highly clonal
strains can be inferred. This phylogeny can then be used to identify clinical cases properly
belonging to outbreaks and establish links between clinical and environmental isolates.
Outbreaks have been studied with NGS both retrospectively, as a means to better
understand a past outbreak, and during an outbreak, to aid in real time decision-making.
A well known example illustrating the utility of NGS to investigate a food-borne disease
outbreak is that of the virulent Shiga toxin (Stx)-producing Escherichia coli O104:H4
associated with contaminated sprouts in Germany; NGS data has been used to better
understand differences in virulence (Bielaszewska et al., 2011) and evolutionary relation-
ships (Mellmann et al., 2011) among outbreak and non-outbreak isolates. A number of
recent cases of salmonellosis also have been investigated by clustering isolates based on
SNP (single nucleotide polymorphism) differences identified by WGS data. For example,
two studies, which used data produced on different NGS platforms and using different
bioinformatic methods, unequivocally identified the source of a multistate outbreak
of Salmonella enterica subsp. enterica serovar Montevideo associated with spiced-meat
(Allard et al., 2012; den Bakker et al., 2011). With regards to human diseases, phylogenetic
reconstruction based on WGS data proved useful in the investigation and determination
of the source of Vibrio cholerae associated with an outbreak that occurred in Haiti in 2010
(Chin et al., 2011; Hendriksen et al., 2011; Keim et al., 2011).
Recent studies in the hospital setting illustrate how NGS can contribute to the real-time
management of disease outbreaks. Koser et al. (2012) utilized WGS data to rapidly
investigate an outbreak of methicillin-resistant Staphylococcus aureus (MRSA) within a
neonatal intensive care unit. Such an approach was able to distinguish among isolates that
belonged to a single lineage, which was likely impossible using traditional typing methods.
As a result, NGS data was shown to rapidly (i.e., within a timeframe that could influence
patient health) provide clinically important data (Koser et al., 2012). Health officials
investigating a hospital outbreak of Klebsiella pneumoniae found that using whole-genome
sequencing yielded “actionable insights” by discerning among alternative transmission
routes and, thus, containment of the infection (Snitkin et al., 2012).
The recent publication dates of the studies discussed above illustrate just how new
the use of NGS data within public health is. Given the potential impact of public health
Pettengill et al. (2014), PeerJ, DOI 10.7717/peerj.620 2/26

decisions based on NGS data, the robustness of NGS-based results must be evaluated.
Three factors that may differ within or among studies are (1) the NGS platform on which
the sequences were generated, (2) the method used to detect variant sites and create a SNP
matrix, and (3) the phylogenetic inference method used to cluster samples. With regards
to NGS platform, it is well documented that performance (e.g., error rates and error
structure) differs among them (Harismendy et al., 2009; Loman et al., 2012; Mardis, 2013;
Shendure & Ji, 2008). Although some may argue this is not a significant issue as certain
platforms are no longer maintained or less likely to be used in the future (e.g., SOLiD and
Roche 454), the fact that large amounts of data have been produced under such platforms
means that NGS platform artifacts will need to be accounted for within analyses that
incorporate historical data. The rapid incorporation of NGS data within many disciplines
has produced many bioinformatic tools, all of which may produce different results when
trying to accomplish the same task. For example, comparative studies have shown that
not all de novo assemblers are equal (Bradnam et al., 2013; Magoc et al., 2013; Salzberg
et al., 2012; Zhang et al., 2011) nor are mapping algorithms (Hatem et al., 2013; Ruffalo,
LaFramboise & Koyuturk, 2011) or variant detection algorithms (Cheng, Teo & Ong, 2014).
As for phylogenetic inference, performance comparisons of recently developed maximum-
likelihood methods to handle the large matrices often associated with WGS data show that
those methods do not always produce the same topology (Liu, Linder & Warnow, 2011).
In this study, our objective was to advance the use of WGS data within the public
health realm, and in general, by investigating the robustness of the inferred phylogenetic
relationships to several key factors that can vary among analyses. Here, we define
robustness as the sensitivity of results to differences in the acquisition and analysis of
data. In our case, data acquisition and analysis represent the combination of different
sequencing platforms, SNP detection methods, and phylogenetic inference algorithms; the
results are the inferred topology. We first present the reference-based approach we have
developed to identify SNPs among the WGS data we are routinely producing. We then
quantified the congruence among our method and three other SNP detection methods
(one reference-based and two reference-free) by comparing the topologies produced
with the same phylogenetic inference package. We evaluated the influence of sequencing
platform by determining the degree to which replicate runs of the same strain clustered
together and the number of differences among replicate runs of the same strain on the
same platform. We also assessed the influence of three different phylogenetic inference
methods by comparing topologies created using the same data matrix. These analyses
were performed on a set of Salmonella enterica subsp. enterica Serovar Montevideo isolates
sequenced on five different NGS platforms. Many of the isolates were implicated in an
outbreak of salmonellosis and the evolutionary relationships of a subset of isolates were
investigated within two previous studies (Allard et al., 2012; den Bakker et al., 2011).
Pettengill et al. (2014), PeerJ, DOI 10.7717/peerj.620 3/26

Table 1 Distribution of samples by platform. The number of samples run on both platforms; diagonalelements contain the number of sequencing runs per platform.
454 HiSeq IonTorrent MiSeq Solid
454 68 0 17 17 0
HiSeq 1 0 0 0
IonTorrent 30 24 6
MiSeq 47 5
Solid 48
MATERIALS AND METHODSSequence dataAll 194 samples included in this study were downloaded from the SRA archive (Table S1)
from which fastqs or sff files were extracted using the SRA Toolkit v2.1.6. SOLiD SRA
files were converted to colorspace fastq (csfastq). The 194 samples represent 107 unique
strains, 3 of which are Salmonella enterica ssp. enterica serovar Pomona that served as
an outgroup and the others are Montevideo (Table 1). Samples were from one of five
platforms: Illumina MiSeq and HiSeq, Life Technologies IonTorrent, Roche 454 FLX
Titanium, and Applied Biosystems SOLiD. Thirty-two strains were sequenced on more
than one sequencing technology (Table 1 and Table S1). All but the 454 runs for strain
IA 2009159199 are replicates from independent passages (overnight cultures) and, thus,
from different library preparations for sequencing.
In addition to the full dataset of 194 samples, we constructed a dataset containing
only those samples present in Allard et al. (2012). With the Allard dataset (116 runs, 47
strains) our primary focus was on how the conclusions within a traceback investigation
(i.e., linking clinical isolates that sickened people to environmental sources) would differ
under the three factors being considered (i.e., NGS platform, SNP detection method, and
phylogenetic inference method). The conclusions based on NGS data within that study are
also supported by epidemiological data.
Given that we analyzed empirical data, we do not know the true evolutionary relation-
ships among the individuals. However, we do have replication of a number of isolates and,
therefore, have expectations for how those isolates should cluster (i.e., be monophyletic)
and the number of SNP differences that should exist among them (i.e., zero). For analyses
comparing topologies (see below), we were not able to determine the accuracy of the
methods but rather focused on the variance among methods where we were working under
the assumption that methods that produced more similar trees are superior to methods
that result in different topologies.
Variant detection methodsWe investigated the performance of four different SNP detection methods, which can
be broadly separated into reference-based and reference-free. The primary difference
between the two types is that reference-based methods use a genome, either a closed or
Pettengill et al. (2014), PeerJ, DOI 10.7717/peerj.620 4/26
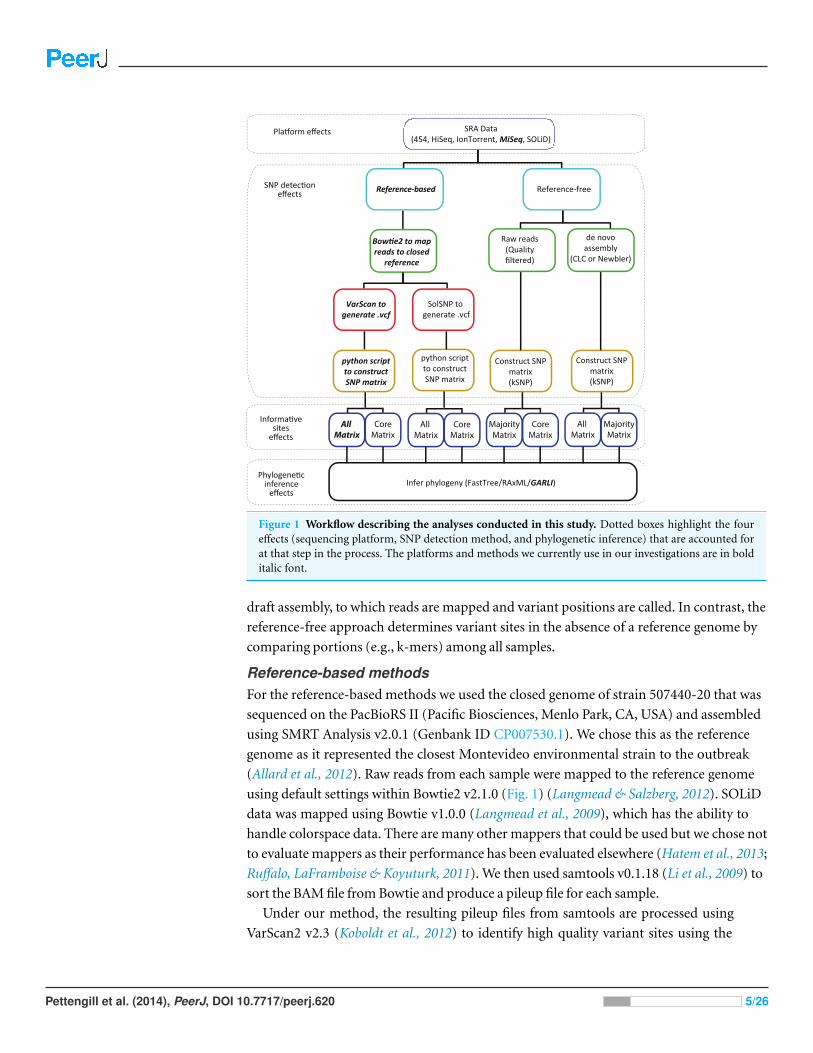
Figure 1 Workflow describing the analyses conducted in this study. Dotted boxes highlight the foureffects (sequencing platform, SNP detection method, and phylogenetic inference) that are accounted forat that step in the process. The platforms and methods we currently use in our investigations are in bolditalic font.
draft assembly, to which reads are mapped and variant positions are called. In contrast, the
reference-free approach determines variant sites in the absence of a reference genome by
comparing portions (e.g., k-mers) among all samples.
Reference-based methodsFor the reference-based methods we used the closed genome of strain 507440-20 that was
sequenced on the PacBioRS II (Pacific Biosciences, Menlo Park, CA, USA) and assembled
using SMRT Analysis v2.0.1 (Genbank ID CP007530.1). We chose this as the reference
genome as it represented the closest Montevideo environmental strain to the outbreak
(Allard et al., 2012). Raw reads from each sample were mapped to the reference genome
using default settings within Bowtie2 v2.1.0 (Fig. 1) (Langmead & Salzberg, 2012). SOLiD
data was mapped using Bowtie v1.0.0 (Langmead et al., 2009), which has the ability to
handle colorspace data. There are many other mappers that could be used but we chose not
to evaluate mappers as their performance has been evaluated elsewhere (Hatem et al., 2013;
Ruffalo, LaFramboise & Koyuturk, 2011). We then used samtools v0.1.18 (Li et al., 2009) to
sort the BAM file from Bowtie and produce a pileup file for each sample.
Under our method, the resulting pileup files from samtools are processed using
VarScan2 v2.3 (Koboldt et al., 2012) to identify high quality variant sites using the
Pettengill et al. (2014), PeerJ, DOI 10.7717/peerj.620 5/26

mpileup2snp option, which are stored in individual .vcf files. We used the default values for
variant detection except the minimum variant allele frequency was set to 0.90. As a result,
we refer to this method as VarScan. We used a custom python script to parse the .vcf files
and construct a SNP matrix, which included two steps. First, a ‘snplist’ file is generated by
identifying all variant sites across the individual .vcf files, which represents all the positions
that will make up the SNP matrix. Second, for each sample an additional pileup file is
generated that contains only those positions found in the ‘snplist’ file. It is from these
second pileup files that we determine the nucleotide state for each position in SNP matrix.
Determining the state of each position in the snplist file is based on the following rules:
(a) if different nucleotides were called at the position, the one with frequency larger than
50% was the consensus call for that position but this threshold can be altered to match
a different user defined value; and (b) if different nucleotides were called at a position
but none had a frequency larger than 50%, that position for that individual was coded as
missing data. Positions identified as indels in the .vcf file were ignored in the construction
of the SNP matrix. Additional information (e.g., our code and instructions) is at https://
github.com/CFSAN-Biostatistics/snp-pipeline.
To evaluate the sensitivity of our reference-based method, we also constructed SNP
matrices using the variant detection algorithm implemented in SolSNP v1.11 (Fig. 1)
(Robbins et al., 2011). Like our own method, reads were mapped to a closed reference using
Bowtie1 or Bowtie2. However, in contrast to our method that uses VarScan, the resulting
bam files were then processed with SolSNP, which uses a Kolmogorov–Smirnov statistic as
a distance measure to call the most likely nucleotide state with respect to the reference. The
resulting .vcf files were parsed using our python script to construct the SNP matrices for
downstream phylogenetic analyses. All SolSNP analyses were conducted using the default
parameters.
For the reference-based methods, in addition to the all matrix that consists of all SNPs
discovered in the analysis that had 0.7%–0.8% missing data (Table 2), we constructed
a core matrix that consisted of only those SNP positions for which every sample had a
nucleotide called (Fig. 1).
Reference-free methodsWe used the program kSNP v2.0 (Gardner & Hall, 2013) to produce SNP matrices without
using a reference sequence. kSNP uses a k-mer approach to identify homologous single
nucleotide polymorphisms among a group of individuals. Briefly, the program uses
jellyfish (Marcais & Kingsford, 2011) to index all draft genomes into k-mers and SNPs
are identified using MUMmer (Kurtz et al., 2004). Although we are aware of at least one
other k-mer based approach, it requires paired-end data (Schwartz et al., 2013).
We used kSNP on two different treatments of the sequence data. Under the first we
used filtered fastq files; reads were filtered using seqtk (https://github.com/lh3/seqtk),
which masked bases with Q-scores <20. Under the second treatment, we performed
de novo assemblies that were then used as the input for kSNP. We chose an assembler
that was well suited for the sequencing platform from which the reads came, which was
CLC Genomics Workbench 6.0.5 (CLC Bio, Cambridge, MA, USA) for the Illumina,
Pettengill et al. (2014), PeerJ, DOI 10.7717/peerj.620 6/26

Table 2 SNP matrix characteristics. Summary of the differences across the SNP detection methods bymatrix (Core, All, 50%) in terms of the number of SNPs, percent missing data, and number of identicalsequences.
SNP detection Method Matrix Number of SNPs Missing Nidenticalb
Reference-based VarScan Core 8,056 na 114
All 49,307 0.7% 1
SolSNP Core 7,179 na 123
All 45,388 0.8% 2
Reference-free kSNP de novo Corea 0 na na
50% 51,261 11% 0
All 73,236 37% 0
kSNP raw Core 749 na 135
50% 54,157 11% 1
Alla 2,990,475 96% 0
Notes.na, not applicable.
a Not analyzed.b Number of identical sequences within the matrix.
SOLiD, and IonTorrent data and Newbler v2.6 for the 454 data. As was the case with the
mapping software under the reference-based approach, our objective here was not to
evaluate multiple de novo assemblers as that has been done elsewhere (Magoc et al., 2013;
Salzberg et al., 2012; Zhang et al., 2011). In both kSNP analyses, the k-mer size was set to 25.
For both the de novo and raw read approaches, three SNP matrices were produced,
an “all” matrix, a “majority” matrix, and a “core” matrix. The all and core matrices are
as defined for the reference-based methods. The majority matrix contained only those
positions in the all matrix for which at least 50% of samples had a nucleotide base called.
With the de novo approach, the core matrix had 0 nucleotides present (likely due to
missing data associated with the poorer assemblies; Fig. 2) so we only analyzed the all
and majority matrix under that approach. The all matrix constructed with the raw reads
had 96% missing data and contained 2,990,475 positions (Table 2), which does not seem
biologically reasonable as it suggests that nearly 66% of the genome contains variable
positions. As a result, we do not perform any of the subsequent analyses on this matrix.
Analyses of replicate runsWithin each matrix, we calculated the proportional pairwise number of SNP differences
among replicates of a strain run on the same NGS platform. Analyses were conducted using
the dist.dna function within the ape package (Paradis, Claude & Strimmer, 2004) in R (R
Development Core Team, 2011)
We used the genealogical sorting index (gsi) (Cummings, Neel & Shaw, 2008) to quantify
the degree to which replicate runs of the same strain clustered together, which provides
insight into the robustness of the phylogenetic relationships to differences in sequencing
platform and bioinformatic approaches. The gsi varies from 0 (a completely random
assortment of individuals from the same group (e.g., strain) on the tree) to 1 (replicates
Pettengill et al. (2014), PeerJ, DOI 10.7717/peerj.620 7/26

Figure 2 Characteristics of sample reads by platform. (A) Average number of reads produced, (B)percent of reads mapped to the reference sample, (C) the number of contigs within the assembly,(D) total number of basepairs assembled; dashed red line represent the bps in the reference, and (E)the N50 of the assembly. Boxes depict the interquartile (IQR) range and whiskers indicate 1.5 IQR;the horizontal black line represents the mean. The IonTorrent platform is abbreviated as IonT. Pointsrepresent observed values; points were also offset from one another (‘jittered’) to reduce overlap. SeeTable 1 for sample sizes per NGS platform.
Pettengill et al. (2014), PeerJ, DOI 10.7717/peerj.620 8/26

are reciprocally monophyletic). Generally speaking, the gsi is based on the number of
nodes uniting all individuals from the same group divide by the observed number of
nodes uniting those members. We calculated the gsi statistic for two different cases: (1) all
replicates of a given strain comprise a single group and (2) replicates run on the same
platform comprise a group. We chose these two groupings because they allowed us to
characterize, as best we could given the dataset, the influence of within and between
platform variation. To account for phylogenetic uncertainty, we estimated the weighted
gsi value under which 100 bootstrap replicates for each matrix (e.g., VarScan, kSNP de
novo) by phylogenetic inference comparison were analyzed.
Phylogenetic analysisTopologies based on each of the matrices created under the different SNP detection
methods were created using three phylogenetic inference methods (FastTreeMP (Price,
Dehal & Arkin, 2010), GARLI (Zwickl, 2006), and RaxML (Stamatakis, 2006)). Each of
the three methods uses a different approach to increase computational feasibility when
analyzing large matrices. When evaluating the robustness of the results to different SNP
detection methods or NGS platforms, we only compared topologies produced using the
same phylogenetic inference method. To assess the robustness of results to differences in
phylogenetic inference method, we only compared topologies constructed with the same
SNP matrix.
For the FastTreeMP v2.1.7 analyses, we used the -gtr -nt -cat 4 flags; analyses were
run on a single desktop machine with dual 2.93 GHz 6-Core Intel Xeon processors and
48 GB of shared RAM. We used phylip’s seqboot (Felsenstein, 1989) option to produce 100
bootstrap replicates of the dataset, each of which were then analyzed with FastTreeMP
as was done with the non-bootstrapped dataset. Given that the other two methods
were carried out conducting traditional non-parametric bootstrapping we thought it
appropriate to do the same with FastTreeMP rather than rely on the SH-like local support
values that program can also produce. We used the default parameter setting for the GARLI
v2.0 analyses including the GTR + I + Γ. We ran 100 replicate GARLI analyses for each
of the observed matrices, and present the topology with the best likelihood score to which
support values based on 1,000 bootstrap replicates were added. GARLI analyses were
performed on a high performance computer within the FDA’s Scientific Computing Lab;
batches of up to 20 runs were performed simultaneously on this resource where compute
nodes contain 8 Intel Xeon 2.67 GHz processors and 24 GB of shared RAM. For RAxML
v7.9.1, we used raxmlHPC-PTHREADS-AVX, the -m GTRCAT flag, and -b flag to perform
1,000 non-parametric standard bootstrap replicates; analyses were run on a Linux machine
with 32 Intel Xeon 2.00 GHz processors and 64 GB of shared RAM.
Topological congruenceWe quantified the congruence among topologies using the symmetric difference statistic
(Steel & Penny, 1993) (i.e., the Robinson–Foulds distance, Robinson & Foulds, 1981)
implemented in the phangorn package (Schliep, 2011) in R. The symmetric difference
statistic is twice the number of internal nodes that differ in their branching between two
Pettengill et al. (2014), PeerJ, DOI 10.7717/peerj.620 9/26

trees. Our interpretations of the symmetric difference statistic are based on the assumption
that methods or matrix types that result in similar topologies are superior to those that
do not. As was the case with the gsi analyses, to account for phylogenetic uncertainty, we
calculated the symmetric difference between all pairwise comparisons of 100 bootstrap
replicates (e.g., pairwise comparisons between 100 GARLI bootstrap replicates of the
VarScan and kSNP de novo matrices).
RESULTSMapping and de novo assembly summary statisticsAlthough the number and lengths of reads varied greatly among the platforms, at least 50%
of the reads could be mapped for all but a few samples (Fig. 2). The number of contigs and
N50 values varied among platforms but for the majority of the samples, except perhaps the
SOLiD runs, the length of the assemblies were close to the expected 4.5 Mbp genome size of
an S. Montevideo (Fig. 2). These mapping and assembly summary statistics are promising
in that they suggest that similar amounts of data can be extracted from runs on different
platforms.
Platform effectsTo characterize platform variability, we examined replicate runs of the same sample se-
quenced on the same platform (Fig. 3). Ideally these replicates would have no proportional
pairwise differences and be identical. In reality we found that the 454 platform had the
greatest number of differences, followed by Ion Torrent, and then by MiSeq. This pattern
was generally consistent across the different variant detection methods except for the kSNP
de novo datasets where IonTorrent replicates were more different from one another than
on the 454 platform. (The SOLiD platform had no replicate runs and was not assessed.)
We note that many of the replicate samples are not pure platform replicates, but were
from independent cultures often performed at different labs, which means our observed
differences are not just due to platform variability.
To examine the effect of platform on clustering, we computed the weigthed gsi with
classes assigned by strain and with classes assigned by the combination of strain and
platform. Regardless of matrix type and SNP detection method, the strain replicates did
not cluster together and, thus, gsi values for many strain classes were <1 (Fig. 4). When
classes were defined by the combination of strain and platform, there was a much higher
average gsi score. This implies that replicates do cluster together more reliably when run
on the same platform. However, despite the differences in reproducibility and gsi values
between the classes, we did not find evidence to suggest that there is a strong platform effect
when clustering (e.g., clades were not found consisting of only samples run on a single
platform; Fig. S1).
Matrix size effectsOur results indicate that a matrix that accepts some level of missing data, while not
including all sites for which only a few samples have nucleotides states, is optimal for
phylogenetic inference. For example, topologies created using core matrices within which
Pettengill et al. (2014), PeerJ, DOI 10.7717/peerj.620 10/26

Figure 3 Proportional number of SNP differences between replicate runs of the same strain on thesame platform across the different matrices investigated. Boxes depict the interquartile (IQR) rangeand whiskers indicate 1.5 IQR; the horizontal black line represents the mean.
Pettengill et al. (2014), PeerJ, DOI 10.7717/peerj.620 11/26

Figure 4 Boxplots of gsi values for the different topologies inferred and different groupings. Boxesdepict the interquartile (IQR) range and whiskers indicate 1.5 IQR; the horizontal black line representsthe mean. Points represent observed values; points were also offset from one another (‘jittered’) to reduceoverlap. See Table S2 for the number of representatives under each grouping.
Pettengill et al. (2014), PeerJ, DOI 10.7717/peerj.620 12/26
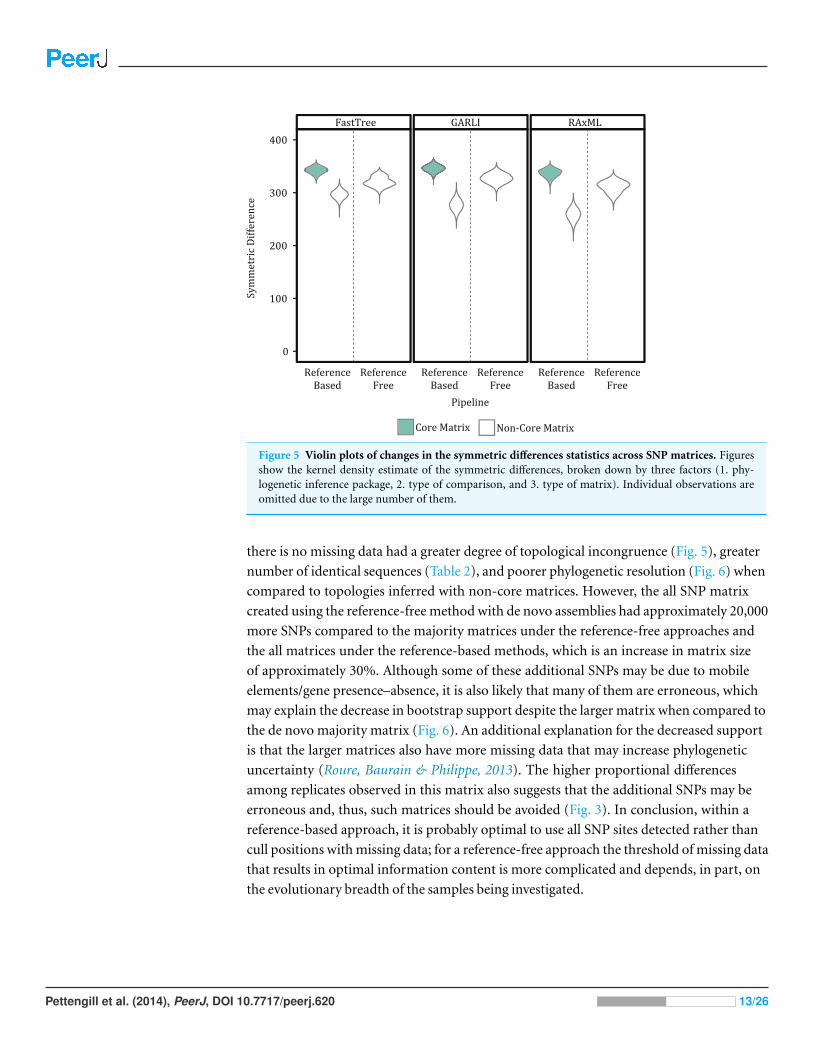
Figure 5 Violin plots of changes in the symmetric differences statistics across SNP matrices. Figuresshow the kernel density estimate of the symmetric differences, broken down by three factors (1. phy-logenetic inference package, 2. type of comparison, and 3. type of matrix). Individual observations areomitted due to the large number of them.
there is no missing data had a greater degree of topological incongruence (Fig. 5), greater
number of identical sequences (Table 2), and poorer phylogenetic resolution (Fig. 6) when
compared to topologies inferred with non-core matrices. However, the all SNP matrix
created using the reference-free method with de novo assemblies had approximately 20,000
more SNPs compared to the majority matrices under the reference-free approaches and
the all matrices under the reference-based methods, which is an increase in matrix size
of approximately 30%. Although some of these additional SNPs may be due to mobile
elements/gene presence–absence, it is also likely that many of them are erroneous, which
may explain the decrease in bootstrap support despite the larger matrix when compared to
the de novo majority matrix (Fig. 6). An additional explanation for the decreased support
is that the larger matrices also have more missing data that may increase phylogenetic
uncertainty (Roure, Baurain & Philippe, 2013). The higher proportional differences
among replicates observed in this matrix also suggests that the additional SNPs may be
erroneous and, thus, such matrices should be avoided (Fig. 3). In conclusion, within a
reference-based approach, it is probably optimal to use all SNP sites detected rather than
cull positions with missing data; for a reference-free approach the threshold of missing data
that results in optimal information content is more complicated and depends, in part, on
the evolutionary breadth of the samples being investigated.
Pettengill et al. (2014), PeerJ, DOI 10.7717/peerj.620 13/26

Figure 6 Phylograms inferred with RAxML under each of the different matrices created either using a reference-free or reference-basedapproach. Red circles represent bootstrap support values greater than 0.85.
Pettengill et al. (2014), PeerJ, DOI 10.7717/peerj.620 14/26

Differences due to SNP detection methodThe proportion of SNP differences among replicate samples run on the same platform var-
ied, although not substantially, across the matrices created under either the reference-free
or reference-based approach (Fig. 3). Given that all methods are (1) working with the same
raw reads and (2) either the same assemblies or bam files for kSNP de novo and reference
based approaches, respectively, these differences are predominantly due to the differences
in algorithms used to identify variant sites.
The method used to construct the SNP matrix had a significant effect on the degree
of congruence among trees (Figs. 5 and 7). For example, trees constructed using a
reference-based method were more similar to one another (i.e., had a lower symmetric
difference score) than those produced under a reference-free approach or when comparing
trees created under the different methods.
Phylogenetic inference methodFor both the reference-free and reference-based approaches there was greater topological
congruence when comparing a tree produced under RAxML and GARLI than when
either of the trees produced under those methods were compared to one inferred with
FastTreeMP. For example, more topological rearrangements are required to reconcile
FastTreeMP trees with either GARLI or RAxML (Fig. 7). As we do not know the true
topology, we note that when comparing the different inference methods we are working
under the assumption that methods that result in similar topologies are optimal. This also
means that we cannot assess the accuracy of the methods but, rather, we are estimating the
variance among the topological differences they produce.
Allard et al. (2012) samplesTo explore the consequences of differences observed among topologies as a result
of a combination of NGS platform and SNP detection method within an outbreak
scenario, we pared down the dataset to include the 116 runs that represented only the
47 strains present in Allard et al. (2012). Here, we refer to outbreak isolates as those
whose phylogenetic placement clusters them with the clinical samples from infected
individuals and non-outbreak samples are those whose topological placement is outside
of the cluster containing the focal clinical samples. We focused on whether outbreak
runs clustered together; if they did, that would provide support that significant patterns
related to outbreak investigations are robust to combining runs across different sequencing
platforms and using different SNP detection and/or phylogenetic inference packages.
When using RAxML or GARLI to infer a topology, the VarScan, SolSNP, kSNP de novo
and kSNP raw matrices constructed with the Allard et al. (2012) dataset resulted in strong
support (100 to 81 BP (bootstrap probability); Table 3) differentiating non-outbreak
from outbreak isolates that were consistent with the results of that study (Fig. 8). The
de novo reference-free approach had the lowest level of bootstrap support among both
the GARLI (BP = 81) and RAxML (BP = 91) trees. The results using FastTreeMP were
only congruent with the previous results when analyzing the kSNP de novo, kSNP all
and VarScan core matrices, the latter two had low support (≤65 BP) (Table 3; Fig. S2).
Pettengill et al. (2014), PeerJ, DOI 10.7717/peerj.620 15/26
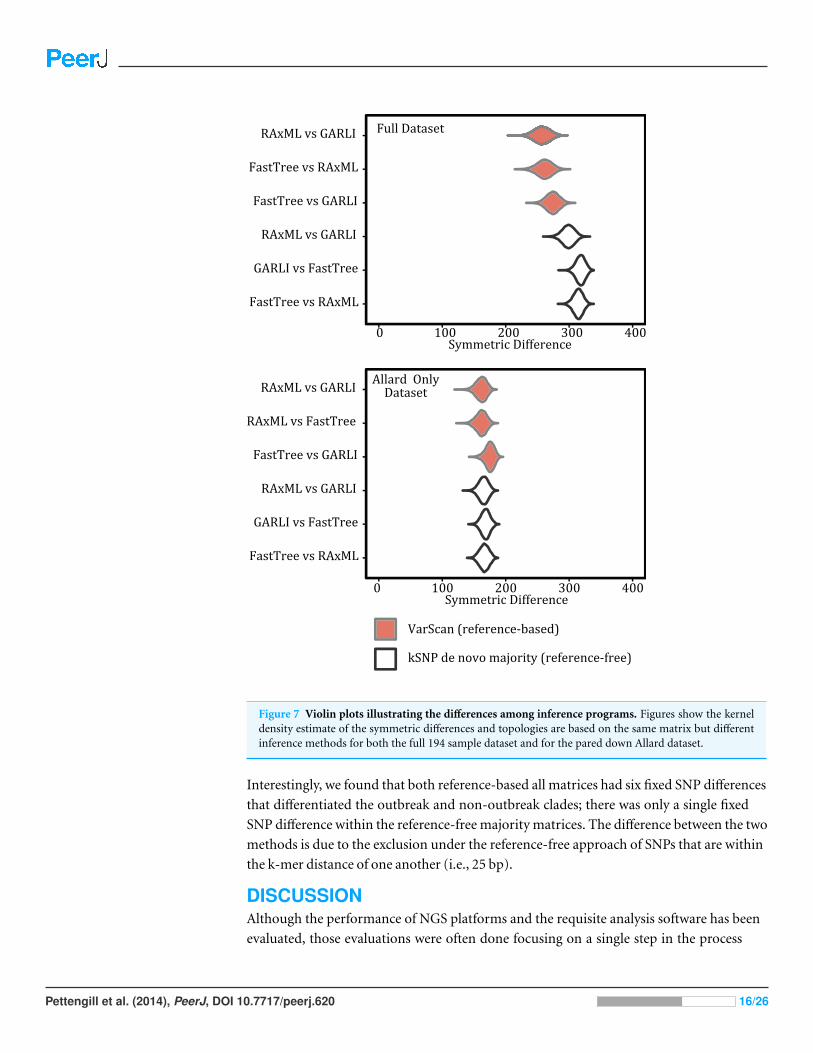
Figure 7 Violin plots illustrating the differences among inference programs. Figures show the kerneldensity estimate of the symmetric differences and topologies are based on the same matrix but differentinference methods for both the full 194 sample dataset and for the pared down Allard dataset.
Interestingly, we found that both reference-based all matrices had six fixed SNP differences
that differentiated the outbreak and non-outbreak clades; there was only a single fixed
SNP difference within the reference-free majority matrices. The difference between the two
methods is due to the exclusion under the reference-free approach of SNPs that are within
the k-mer distance of one another (i.e., 25 bp).
DISCUSSIONAlthough the performance of NGS platforms and the requisite analysis software has been
evaluated, those evaluations were often done focusing on a single step in the process
Pettengill et al. (2014), PeerJ, DOI 10.7717/peerj.620 16/26
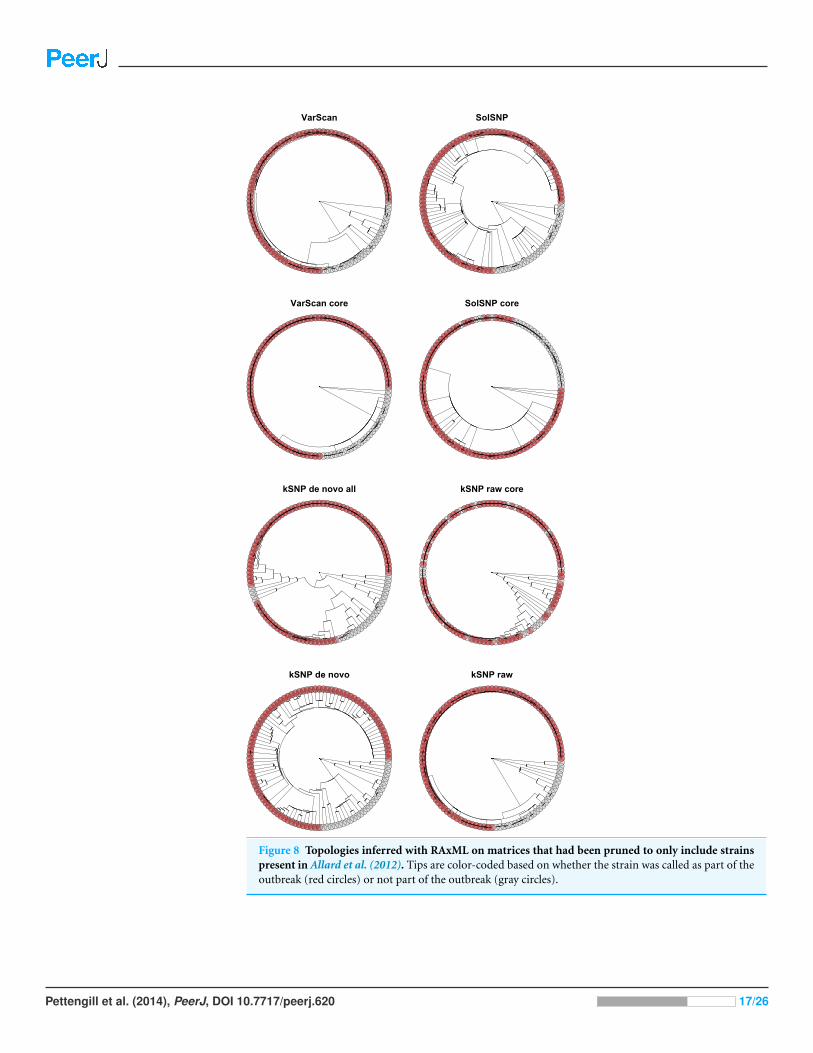
Figure 8 Topologies inferred with RAxML on matrices that had been pruned to only include strainspresent in Allard et al. (2012). Tips are color-coded based on whether the strain was called as part of theoutbreak (red circles) or not part of the outbreak (gray circles).
Pettengill et al. (2014), PeerJ, DOI 10.7717/peerj.620 17/26

Table 3 Bootstrap support values under each phylogentic inference method and SNP matrix for thebifurcation differentiating outbreak from non-outbreak samples in the Allard et al. (2012) dataset.
Matrix RAxML GARLI FastTree
VarScan 93 99 na
VarScan core na na 55
SolSNP 98 97 na
SolSNP core na na na
kSNP de novo 91 81 83
kSNP de novo all na na 65
kSNP raw 100 94 na
kSNP raw core na na na
Notes.na, not applicable.
(e.g., mapping, de novo assembly, or phylogenetic inference). Here, we have considered
the entire process from the sequence platform to phylogenetic clustering. Examination of
the full process is important in elucidating best practices to increase the consistency and
accuracy of such analyses. We found that within each of the three factors we evaluated there
were differences in the results produced and, thus, were able to identify some guidelines for
how NGS data should be analyzed for the purpose of clustering.
Variability among NGS platformsIdeally, different next-generation sequencers would produce identical nucleotide sequences
when provided with the same sample. Unsurprisingly however, differences in the chemistry
and engineering of different platforms mean they do not agree exactly, but have different
error rates and error structure. For example, studies of “benchtop” NGS platforms have
repeatedly found that the MiSeq has the lowest single-base error rate followed by Roche’s
454 GS Junior followed by the Ion Torrent PGM (Junemann et al., 2013; Loman et al., 2012;
Quail et al., 2012); unlike the MiSeq, homopolymer-associated indel errors were an artifact
of the latter two platforms (Loman et al., 2012). SOLiD, with much smaller read lengths
than the other platforms investigated, had the lowest sequencing accuracy, lowest coverage
rate, and highest false-positive rate when compared to Roche 454 and Illumina GA data
(Harismendy et al., 2009).
Given the differences between NGS platforms, we must ask if the differences are
significant enough to obscure the relationships among individuals. From our analysis
of sequencing runs of the same strain carried out on different platforms and labs, it is
clear that replicate runs were not identical (Fig. 3) and, consequently, replicates did not
always result in a monophyletic clade (Fig. 4). However, replicates of a strain sequenced
on the same platform were more likely to represent such a clade (Fig. 4). And although
replicates did not always cluster together they were not likely to be found in different
strongly supported clades. These results suggest that it would be ideal to analyze samples
sequenced on a single NGS platform but that platform variation is unlikely to result in
strongly supported erroneous relationships.
Pettengill et al. (2014), PeerJ, DOI 10.7717/peerj.620 18/26

Reference-free vs. reference-based approachesThe analysis of WGS is non-trivial, and there are a number of possible approaches that
exist. Here we focused on one possible way that such data could be used: to identify
variant sites to construct a SNP matrix from which a phylogeny could be inferred. Some
of the approaches (e.g., Mauve; Darling, Mau & Perna, 2010) that can accomplish this
are applicable for smaller data sets as they are based on whole genome alignments and
were not considered here as we wish to construct a SNP matrix and a resulting phylogeny
for 100 s–1000 s of runs. We considered a number of methods that are suitable for large
datasets (i.e., reference-free and reference-based) and, therefore, likely represent those
most likely to be employed in future studies.
We use a reference-based method in our outbreak investigations because it was assumed
to have lower false-discovery rate and naturally excludes variants within the mobilome
(e.g., prophages and plasmids), which the results presented here support. However, the
primary drawback of a reference-based method is that it will fail to detect SNPs within a
region shared among non-reference samples but that is absent in the reference genome
either due to using a reference whose genome has not been closed (e.g., an incomplete draft
assembly) or the genomic region actually being absent in the reference. In contrast, the
reference-free approach will detect SNPs within regions missing from a subset of the runs
(depending on the percent presence threshold). This additional detection ability comes at
the cost of having to decide what threshold of missing data one should use; we used the
50% majority but other values could include the percent of the dataset that represents the
ingroup samples. Without a threshold on the percent of missing data, the reference-free
approach may have a much higher false-discovery rate most likely due to sequencing error
(e.g., jackpot mutations; (Kraytsberg & Khrapko, 2005)), which is well illustrated by the
all matrix using raw reads having approximately three million basepairs. However, even
when minimizing the number of false positive SNPs in the matrix through a threshold, the
reference-free method still produced more incongruent trees than the matrices constructed
with the reference-based methods (Fig. 5).
Phylogenetic inferenceThe three phylogenetic inference methods we evaluated did not produce the same
topology when analyzing the same SNP matrix (Fig. 7). However, many of the topological
differences were likely among poorly supported clades (Fig. 5). The topologies produced
with RAxML and GARLI did recover the general clustering pattern that differentiates
outbreak from non-outbreak isolates more frequently than FastTreeMP. This result is
consistent with previous work (Liu, Linder & Warnow, 2011) indicating that RAxML
has higher accuracy than FastTreeMP. (This does come with a speed trade-off. For the
194 sample dataset with approximately 50,000 bp per sample analyzed here, a phylogeny
could be inferred with FastTreeMP in a matter of minutes and for RAxML and GARLI
it was on the order of hours and days, respectively, to obtain a topology and bootstrap
replicates.) RAxML and GARLI topologies were fairly congruent with one another for
Pettengill et al. (2014), PeerJ, DOI 10.7717/peerj.620 19/26

strongly supported branch-points. As a result, for closely related organisms like those
studied here there may be a real cost in using faster but less thorough search algorithms.
An important aspect of our phylogenetic analyses is that the substitution models we
employed may not be optimal for the types of matrices we were analyzing within which
every site is variable. To our knowledge there have been few studies investigating the effects
of applying traditional nucleotide substitution models to such matrices. One such study
found that under the GTR + Γ model, phylogenetic accuracy decreased when invariant
sites were excluded (Bertels et al., 2014). Although these SNP matrices may be better
modeled as binary data to which the Mk or Mkv models (Lewis, 2001) could be applied.
However, that model is computationally demanding and may not be well suited for the
large matrices associated with WGS data; it also has a number of assumptions that SNP
matrices likely violate (e.g., an infinite sites model and equal substitution rates between
states). Within the RAxML package, the ASC GTRGAMMA option which models no
invariant sites and, thus, may be appropriate but that model also corrects for ascertainment
bias, which is not appropriate for the matrices we constructed. Given this potential for
model misspecification, an avenue of future research that would strengthen the robustness
of inferring phylogenies from SNP matrices would be to determine the consequences of
model violations and the development of more appropriate nucleotide substitution models
for such matrices
Signal vs. noiseWe have evaluated the robustness of topologies to a number of factors that may differ
among analyses on a particularly vexing group of samples that are highly clonal and very
closely related. Within the original analyses describing the relationships among 47 of the
strains, there were only five unique SNP differences between outbreak and non-outbreak
isolates (Allard et al., 2012). Within this study the reference-based non-core matrices had
six fixed SNP differences while the reference-free approaches had only one. This raises the
question of whether there is the possibility that within the current study noise, either due
to sequencing errors, variation in SNP detection method, and/or phylogenetic inference,
would render impossible our ability to recover the outbreak/non-outbreak structure. Such
issues are less likely to arise when investigating a greater degree of evolutionary divergence
assuming that a sufficient number of homologous sites can be identified since there will
be many more real SNP differences and, thus, a single topology is likely to emerge from
different methods. However, due to a number of issues (e.g., lack of a suitable reference
genome and difficulties detecting k-mers present in all samples) there will also be an
upper bound to the evolutionary breadth of relationships that can be investigated with the
methods we have evaluated.
The results presented here indicate it is possible to recover the outbreak structure
in a dataset of this type, but care should be taken when deciding on the methods to
employ. Methodological choices include: (1) deciding to combine data from different
NGS platforms, (2) choosing a method to use for identifying variants, and (3) choosing
what phylogenetic inference method should be used. Our results suggest good options
Pettengill et al. (2014), PeerJ, DOI 10.7717/peerj.620 20/26

for each of these choices and indicate that they allow detection of the biological outbreak
signal even among these closely related samples. For example, we found strong bootstrap
support for the differentiation of outbreak and non-outbreak samples results when
using the non-core matrices constructed using a reference-based method and inferring
a phylogeny with either RAxML or GARLI (Table 3). Although we did not evaluate it here,
we note that care should also be taken regarding the choice of a reference, as there are a
number of studies that have found that topological accuracy and the number of erroneous
SNPs detected depends on the reference chosen (Bertels et al., 2014; Pightling, Petronella &
Pagotto, 2014).
CONCLUSIONSThe robustness of phylogenetic inference to data acquisition and analysis methodology
is critically important in many studies (e.g., traceback investigations, systematics,
and phylogeography). Our results illustrate how topologies may differ depending on
methodological approaches employed—a particularly important issue when investigating
closely related samples. Our results also show that good methods do exist that provide
robust results when attempting to differentiate between outbreak and non-outbreak
samples. For example, the best choice appears to be the use of a reference-based approach
allowing for some missing data in the matrix and constructing trees using a thorough
inference program. We believe that these general conclusions are likely to be observed
across different datasets (e.g., within other taxonomic groups and across a range of genome
complexity) than the one investigated here and future studies will reveal whether that
assumption is correct.
This work represents our ongoing efforts to build, characterize, and validate our
WGS methodology and pipeline for food-borne outbreak investigations. The questions
we address are applicable to many in the WGS analysis community, and we hope that
the results presented here will contribute to the establishment, through additional
investigations, of well-defined pipelines for clustering based on WGS data.
ACKNOWLEDGEMENTSWe thank Cong Li and Charles Wang for helping to produce whole genome sequence
data. We would like to acknowledge Henk den Bakker and Martin Weidman from
Cornell University; and Furtado Manohar, Craig Cummings, and Lavorka Degoticija from
LifeTech for producing the SOLiD and some of the IonTorrent data. We also acknowledge
the staff at the FDA’s Scientific Computing Lab for assistance with running analyses on the
HPC. We thank Eric Brown, Peter Evans and Steve Musser for promoting this research.
ADDITIONAL INFORMATION AND DECLARATIONS
FundingThis work was supported by the Center for Food Safety and Applied Nutrition at the US
Food and Drug Administration. The funders had no role in study design, data collection
and analysis, decision to publish, or preparation of the manuscript.
Pettengill et al. (2014), PeerJ, DOI 10.7717/peerj.620 21/26

Competing InterestsThe authors declare there are no competing interests, financial, non-financial, professional,
personal or otherwise.
Author Contributions• James B. Pettengill conceived and designed the experiments, performed the experi-
ments, analyzed the data, wrote the paper, prepared figures and/or tables, reviewed
drafts of the paper.
• Yan Luo conceived and designed the experiments, performed the experiments.
• Steven Davis analyzed the data, contributed reagents/materials/analysis tools.
• Yi Chen, Narjol Gonzalez-Escalona and Andrea Ottesen contributed reagents/
materials/analysis tools.
• Hugh Rand conceived and designed the experiments, analyzed the data, wrote the paper,
reviewed drafts of the paper.
• Marc W. Allard reviewed drafts of the paper.
• Errol Strain conceived and designed the experiments, performed the experiments,
analyzed the data, reviewed drafts of the paper.
Supplemental InformationSupplemental information for this article can be found online at http://dx.doi.org/
10.7717/peerj.620#supplemental-information.
REFERENCESAllard MW, Luo Y, Strain E, Li C, Keys CE, Son I, Stones R, Musser SM, Brown EW. 2012. High
resolution clustering of Salmonella enterica serovar Montevideo strains using a next-generationsequencing approach. BMC Genomics 13:32 DOI 10.1186/1471-2164-13-32.
Bertels F, Silander OK, Pachkov M, Rainey PB, Van Nimwegen E. 2014. Automatedreconstruction of whole-genome phylogenies from short-sequence reads. Molecular Biologyand Evolution 31:1077–1088 DOI 10.1093/molbev/msu088.
Bielaszewska M, Mellmann A, Zhang WL, Kock R, Fruth A, Bauwens A, Peters G, Karch H.2011. Characterisation of the Escherichia coli strain associated with an outbreak of haemolyticuraemic syndrome in Germany, 2011: a microbiological study. Lancet Infectious Diseases11:671–676 DOI 10.1016/S1473-3099(11)70165-7.
Bradnam KR, Fass JN, Alexandrov A, Baranay P, Bechner M, Birol I, Boisvert S, Chapman JA,Chapuis G, Chikhi R, Chitsaz H, Chou WC, Corbeil J, Del Fabbro C, Docking TR,Durbin R, Earl D, Emrich S, Fedotov P, Fonseca NA, Ganapathy G, Gibbs RA, Gnerre S,Godzaridis E, Goldstein S, Haimel M, Hall G, Haussler D, Hiatt JB, Ho IY, Howard J,Hunt M, Jackman SD, Jaffe DB, Jarvis ED, Jiang H, Kazakov S, Kersey PJ, Kitzman JO,Knight JR, Koren S, Lam TW, Lavenier D, Laviolette F, Li Y, Li Z, Liu B, Liu Y, Luo R,Maccallum I, Macmanes MD, Maillet N, Melnikov S, Naquin D, Ning Z, Otto TD, Paten B,Paulo OS, Phillippy AM, Pina-Martins F, Place M, Przybylski D, Qin X, Qu C, Ribeiro FJ,Richards S, Rokhsar DS, Ruby JG, Scalabrin S, Schatz MC, Schwartz DC, Sergushichev A,Sharpe T, Shaw TI, Shendure J, Shi Y, Simpson JT, Song H, Tsarev F, Vezzi F, Vicedomini R,Vieira BM, Wang J, Worley KC, Yin S, Yiu SM, Yuan J, Zhang G, Zhang H, Zhou S, Korf IF.
Pettengill et al. (2014), PeerJ, DOI 10.7717/peerj.620 22/26
2013. Assemblathon 2: evaluating de novo methods of genome assembly in three vertebratespecies. Gigascience 2:10 DOI 10.1186/2047-217X-2-10.
Cheng AY, Teo YY, Ong RTH. 2014. Assessing single nucleotide variant detection andgenotype calling on whole-genome sequenced individuals. Bioinformatics 30:1707–1713DOI 10.1093/bioinformatics/btu067.
Chin CS, Sorenson J, Harris JB, Robins WP, Charles RC, Jean-Charles RR, Bullard J,Webster DR, Kasarskis A, Peluso P, Paxinos EE, Yamaichi Y, Calderwood SB, Mekalanos JJ,Schadt EE, Waldor MK. 2011. The origin of the Haitian cholera outbreak strain. New EnglandJournal of Medicine 364:33–42 DOI 10.1056/NEJMoa1012928.
Cummings MP, Neel MC, Shaw KL. 2008. A genealogical approach to quantifying lineagedivergence. Evolution 62:2411–2422 DOI 10.1111/j.1558-5646.2008.00442.x.
Darling AE, Mau B, Perna NT. 2010. progressiveMauve: multiple genome alignment with genegain, loss, and rearrangement. PLoS ONE 5(6):e11147 DOI 10.1371/journal.pone.0011147.
den Bakker HC, Switt AIM, Cummings CA, Hoelzer K, Degoricija L, Rodriguez-Rivera LD,Wright EM, Fang RX, Davis M, Root T, Schoonmaker-Bopp D, Musser KA, Villamil E,Waechter H, Kornstein L, Furtado MR, Wiedmann M. 2011. A whole-genome singlenucleotide polymorphism-based approach to trace and identify outbreaks linked to a commonSalmonella enterica subsp enterica serovar montevideo pulsed-field gel electrophoresis type.Applied and Environmental Microbiology 77:8648–8655 DOI 10.1128/AEM.06538-11.
Felsenstein J. 1989. PHYLIP—Phylogeny Inference Package (Version 3.2). Cladistics 5:164–166.
Gardner SN, Hall BG. 2013. When whole-genome alignments just won’t work: kSNP v2 softwarefor alignment-free SNP discovery and phylogenetics of hundreds of microbial genomes. PLoSONE 8:e81760 DOI 10.1371/journal.pone.0081760.
Harismendy O, Ng PC, Strausberg RL, Wang XY, Stockwell TB, Beeson KY, Schork NJ,Murray SS, Topol EJ, Levy S, Frazer KA. 2009. Evaluation of next generationsequencing platforms for population targeted sequencing studies. Genome Biology10:DOI 10.1186/gb-2009-10-3-r32.
Hatem A, Bozdag D, Toland AE, Catalyurek UV. 2013. Benchmarking short sequence mappingtools. BMC Bioinformatics 14:DOI 10.1186/1471-2105-14-184.
Hendriksen RS, Price LB, Schupp JM, Gillece JD, Kaas RS, Engelthaler DM, Bortolaia V,Pearson T, Waters AE, Upadhyay BP, Shrestha SD, Adhikari S, Shakya G, Keim PS,Aarestrup FM. 2011. Population genetics of Vibrio cholerae from Nepal in 2010: evidenceon the origin of the Haitian outbreak. mBio 2:e00157–e00111 DOI 10.1128/mBio.00157-11.
Junemann S, Sedlazeck FJ, Prior K, Albersmeier A, John U, Kalinowski J, Mellmann A,Goesmann A, Von Haeseler A, Stoye J, Harmsen D. 2013. Updating benchtop sequencingperformance comparison. Nature Biotechnology 31:294–296 DOI 10.1038/nbt.2522.
Keim PS, Aarestrup FM, Shakya G, Price LB, Hendriksen RS, Engelthaler DM, Pearson T. 2011.Reply to “South Asia instead of Nepal may be the origin of the Haitian cholera outbreak strain”.mBio 2:DOI 10.1128/mBio.00245-11.
Koboldt DC, Zhang QY, Larson DE, Shen D, McLellan MD, Lin L, Miller CA, Mardis ER,Ding L, Wilson RK. 2012. VarScan 2: somatic mutation and copy number alteration discoveryin cancer by exome sequencing. Genome Research 22:568–576 DOI 10.1101/gr.129684.111.
Koser CU, Holden MT, Ellington MJ, Cartwright EJ, Brown NM, Ogilvy-Stuart AL, Hsu LY,Chewapreecha C, Croucher NJ, Harris SR, Sanders M, Enright MC, Dougan G, Bentley SD,Parkhill J, Fraser LJ, Betley JR, Schulz-Trieglaff OB, Smith GP, Peacock SJ. 2012. Rapidwhole-genome sequencing for investigation of a neonatal MRSA outbreak. New England Journalof Medicine 366:2267–2275 DOI 10.1056/NEJMoa1109910.
Pettengill et al. (2014), PeerJ, DOI 10.7717/peerj.620 23/26

Kraytsberg Y, Khrapko K. 2005. Single-molecule PCR: an artifact-free PCR approach forthe analysis of somatic mutations. Expert Review of Molecular Diagnostics 5:809–815DOI 10.1586/14737159.5.5.809.
Kurtz S, Phillippy A, Delcher AL, Smoot M, Shumway M, Antonescu C, Salzberg SL. 2004.Versatile and open software for comparing large genomes. Genome Biology 5:R12DOI 10.1186/gb-2004-5-2-r12.
Langmead B, Salzberg SL. 2012. Fast gapped-read alignment with Bowtie 2. Nature Methods9:357–359 DOI 10.1038/nmeth.1923.
Langmead B, Trapnell C, Pop M, Salzberg SL. 2009. Ultrafast and memory-efficientalignment of short DNA sequences to the human genome. Genome Biology10:DOI 10.1186/gb-2009-10-3-r25.
Lewis PO. 2001. A likelihood approach to estimating phylogeny from discrete morphologicalcharacter data. Systematic Biology 50:913–925 DOI 10.1080/106351501753462876.
Li H, Handsaker B, Wysoker A, Fennell T, Ruan J, Homer N, Marth G, Abecasis G, Durbin R,1000 Genome Project Data Processing Subgroup. 2009. The sequence alignment/map formatand SAMtools. Bioinformatics 25:2078–2079 DOI 10.1093/bioinformatics/btp352.
Lienau EK, Strain E, Wang C, Zheng J, Ottesen AR, Keys CE, Hammack TS, Musser SM,Brown EW, Allard MW, Cao G, Meng J, Stones R. 2011. Identification of a salmonellosisoutbreak by means of molecular sequencing. New England Journal of Medicine 364:981–982DOI 10.1056/NEJMc1100443.
Liu K, Linder CR, Warnow T. 2011. RAxML and FastTree: comparing two methodsfor large-scale maximum likelihood phylogeny estimation. PLoS ONE 6(11):e27731DOI 10.1371/journal.pone.0027731.
Loman NJ, Misra RV, Dallman TJ, Constantinidou C, Gharbia SE, Wain J, Pallen MJ. 2012.Corrigendum: Performance comparison of benchtop high-throughput sequencing platforms.Nature Biotechnology 30:562 DOI 10.1038/nbt0612-562f.
Magoc T, Pabinger S, Canzar S, Liu XY, Su Q, Puiu D, Tallon LJ, Salzberg SL. 2013. GAGE-B:an evaluation of genome assemblers for bacterial organisms. Bioinformatics 29:1718–1725DOI 10.1093/bioinformatics/btt273.
Marcais G, Kingsford C. 2011. A fast, lock-free approach for efficient parallel counting ofoccurrences of k-mers. Bioinformatics 27:764–770 DOI 10.1093/bioinformatics/btr011.
Mardis ER. 2013. Next-generation sequencing platforms. Annual Review of Analytical Chemistry6:287–303 DOI 10.1146/annurev-anchem-062012-092628.
Mellmann A, Harmsen D, Cummings CA, Zentz EB, Leopold SR, Rico A, Prior K,Szczepanowski R, Ji YM, Zhang WL, McLaughlin SF, Henkhaus JK, Leopold B,Bielaszewska M, Prager R, Brzoska PM, Moore RL, Guenther S, Rothberg JM, Karch H.2011. Prospective genomic characterization of the German enterohemorrhagic escherichiacoli O104:H4 outbreak by rapid next generation sequencing technology. PLoS ONE6:DOI 10.1371/journal.pone.0022751.
Paradis E, Claude J, Strimmer K. 2004. APE: analyses of phylogenetics and evolution in Rlanguage. Bioinformatics 20:289–290 DOI 10.1093/bioinformatics/btg412.
Parkhill J, Wren BW. 2011. Bacterial epidemiology and biology—lessons from genomesequencing. Genome Biology 12:DOI 10.1186/gb-2011-12-10-230.
Pightling AW, Petronella N, Pagotto F. 2014. Choice of reference sequence and assembler foralignment of listeria monocytogenes short-read sequence data greatly influences rates of errorin SNP analyses. PLoS ONE 9:e104579 DOI 10.1371/journal.pone.0104579.
Pettengill et al. (2014), PeerJ, DOI 10.7717/peerj.620 24/26

Price MN, Dehal PS, Arkin AP. 2010. FastTree 2—approximately maximum-likelihood trees forlarge alignments. PLoS ONE 5:e9490 DOI 10.1371/journal.pone.0009490.
Quail MA, Smith M, Coupland P, Otto TD, Harris SR, Connor TR, Bertoni A, Swerdlow HP,Gu Y. 2012. A tale of three next generation sequencing platforms: comparison ofIon Torrent, Pacific Biosciences and Illumina MiSeq sequencers. BMC Genomics13:DOI 10.1186/1471-2164-13-341.
R Development Core Team. 2011. R: a language and environment for statistical computing. Vienna:R Foundation for Statistical Computing.
Robbins CM, Tembe WA, Baker A, Sinari S, Moses TY, Beckstrom-Sternberg S, Beckstrom-Sternberg J, Barrett M, Long J, Chinnaiyan A, Lowey J, Suh E, Pearson JV, Craig DW,Agus DB, Pienta KJ, Carpten JD. 2011. Copy number and targeted mutational analysisreveals novel somatic events in metastatic prostate tumors. Genome Research 21:47–55DOI 10.1101/gr.107961.110.
Robinson DF, Foulds LR. 1981. Comparison of phylogenetic trees. Mathematical Biosciences53:131–147 DOI 10.1016/0025-5564(81)90043-2.
Roetzer A, Diel R, Kohl TA, Ruckert C, Nubel U, Blom J, Wirth T, Jaenicke S, Schuback S,Rusch-Gerdes S, Supply P, Kalinowski J, Niemann S. 2013. Whole genome sequencing versustraditional genotyping for investigation of a mycobacterium tuberculosis outbreak: a longitudi-nal molecular epidemiological study. PLoS Medicine 10:DOI 10.1371/journal.pmed.1001387.
Roure B, Baurain D, Philippe H. 2013. Impact of missing data on phylogenies inferredfrom empirical phylogenomic data sets. Molecular Biology and Evolution 30:197–214DOI 10.1093/molbev/mss208.
Ruffalo M, LaFramboise T, Koyuturk M. 2011. Comparative analysis of algorithmsfor next-generation sequencing read alignment. Bioinformatics 27:2790–2796DOI 10.1093/bioinformatics/btr477.
Salzberg SL, Phillippy AM, Zimin A, Puiu D, Magoc T, Koren S, Treangen TJ, Schatz MC,Delcher AL, Roberts M, Marcais G, Pop M, Yorke JA. 2012. GAGE: a critical evaluationof genome assemblies and assembly algorithms. Genome Research 22:557–567DOI 10.1101/gr.131383.111.
Schliep KP. 2011. phangorn: phylogenetic analysis in R. Bioinformatics 27:592–593DOI 10.1093/bioinformatics/btq706.
Schwartz RS, Harkins K, Stone AC, Cartwright RA. 2013. A composite genome approachto identify phylogenetically informative data from next-generation sequencing. ArXivpreprint. arXiv:1305.3665.
Shendure J, Ji HL. 2008. Next-generation DNA sequencing. Nature Biotechnology 26:1135–1145DOI 10.1038/nbt1486.
Snitkin ES, Zelazny AM, Thomas PJ, Stock F, Group NCSP, Henderson DK, Palmore TN,Segre JA. 2012. Tracking a hospital outbreak of carbapenem-resistant Klebsiellapneumoniae with whole-genome sequencing. Science Translational Medicine 4:148ra116DOI 10.1126/scitranslmed.3004129.
Stamatakis A. 2006. RAxML-VI-HPC: maximum likelihood-based phylogeneticanalyses with thousands of taxa and mixed models. Bioinformatics 22:2688–2690DOI 10.1093/bioinformatics/btl446.
Steel MA, Penny D. 1993. Distributions of tree comparison metrics—some new results. SystematicBiology 42:126–141.
Pettengill et al. (2014), PeerJ, DOI 10.7717/peerj.620 25/26

Underwood AP, Dallman T, Thomson NR, Williams M, Harker K, Perry N, Adak B,Willshaw G, Cheasty T, Green J, Dougan G, Parkhill J, Wain J. 2013. Public health value ofnext-generation DNA sequencing of enterohemorrhagic escherichia coli isolates from anoutbreak. Journal of Clinical Microbiology 51:232–237 DOI 10.1128/JCM.01696-12.
Zhang WY, Chen JJ, Yang Y, Tang YF, Shang J, Shen BR. 2011. A practical comparison of denovo genome assembly software tools for next-generation sequencing technologies. PLoS ONE6(3):e17915 DOI 10.1371/journal.pone.0017915.
Zwickl DJ. 2006. Genetic algorithm approaches for the phylogenetic analysis of large biologicalsequence datasets under the maximum-likelihood criterion. Ph.D, The University of Texas atAustin.
Pettengill et al. (2014), PeerJ, DOI 10.7717/peerj.620 26/26