Embed Size (px)
Citation preview

FINAL
AN EVALUATION OF A COVERED ANAEROBIC LAGOON FOR FLUSHED DAIRY CATTLE MANURE STABILIZATION
AND BIOGAS PRODUCTION
Submitted to:
Kurt Roos AgSTAR Program
U.S. Environmental Protection Agency Ariel Rios Building
1200 Pennsylvania Ave. NW (6202J) Washington, DC 20460
Submitted by:
Eastern Research Group, Inc. 1600 Perimeter Park Drive
Morrisville, NC 27560
Prepared By: John H. Martin, Jr. Ph.D.
17 June 2008 (revised)
EPA Contract No. GS-10F-0036K Work Assignment/Task Order No. 0219

CONTENTS
Section Page
Preface iv
Acknowledgements vi
1. Summary and Conclusions 1
2. Introduction 6
3. Methods and Materials 8
4. Results 13
5. Discussion 19
References 26
i
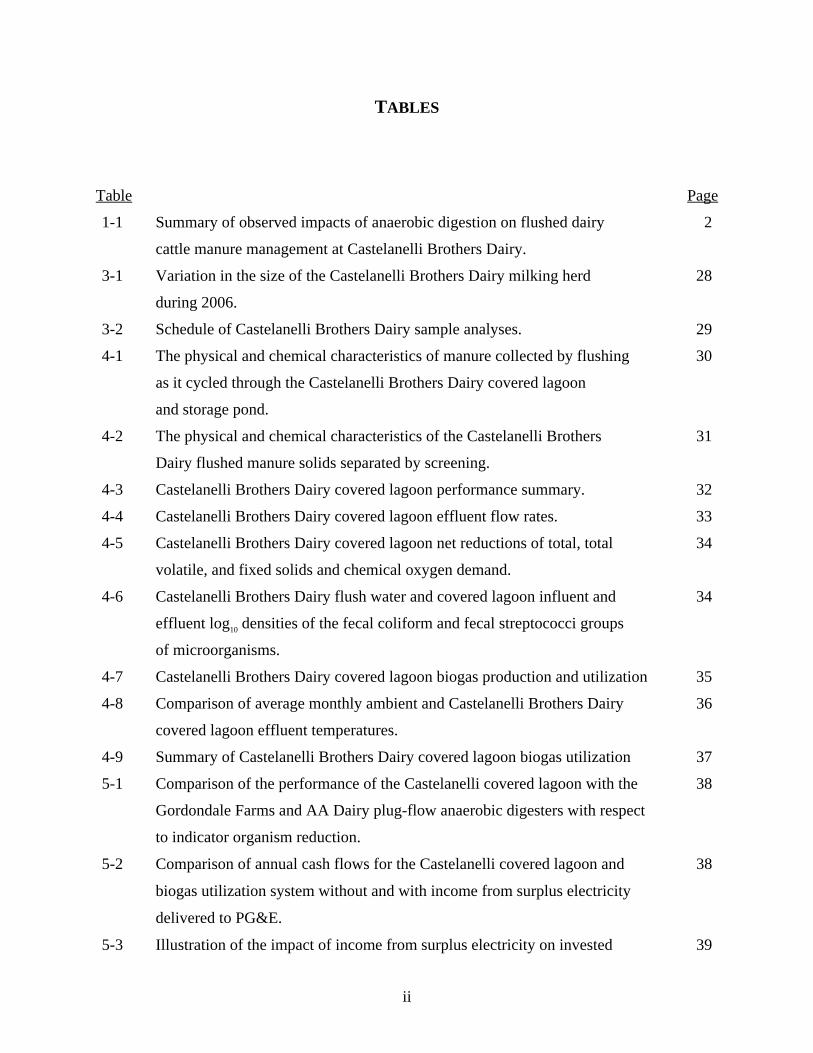
TABLES
Table Page
1-1 Summary of observed impacts of anaerobic digestion on flushed dairy 2
cattle manure management at Castelanelli Brothers Dairy.
3-1 Variation in the size of the Castelanelli Brothers Dairy milking herd 28
during 2006.
3-2 Schedule of Castelanelli Brothers Dairy sample analyses. 29
4-1 The physical and chemical characteristics of manure collected by flushing 30
as it cycled through the Castelanelli Brothers Dairy covered lagoon
and storage pond.
4-2 The physical and chemical characteristics of the Castelanelli Brothers 31
Dairy flushed manure solids separated by screening.
4-3 Castelanelli Brothers Dairy covered lagoon performance summary. 32
4-4 Castelanelli Brothers Dairy covered lagoon effluent flow rates. 33
4-5 Castelanelli Brothers Dairy covered lagoon net reductions of total, total 34
volatile, and fixed solids and chemical oxygen demand.
4-6 Castelanelli Brothers Dairy flush water and covered lagoon influent and 34
effluent log10 densities of the fecal coliform and fecal streptococci groups
of microorganisms.
4-7 Castelanelli Brothers Dairy covered lagoon biogas production and utilization 35
4-8 Comparison of average monthly ambient and Castelanelli Brothers Dairy 36
covered lagoon effluent temperatures.
4-9 Summary of Castelanelli Brothers Dairy covered lagoon biogas utilization 37
5-1 Comparison of the performance of the Castelanelli covered lagoon with the 38
Gordondale Farms and AA Dairy plug-flow anaerobic digesters with respect
to indicator organism reduction.
5-2 Comparison of annual cash flows for the Castelanelli covered lagoon and 38
biogas utilization system without and with income from surplus electricity
delivered to PG&E.
5-3 Illustration of the impact of income from surplus electricity on invested 39
ii

capital recovery without interest for the Castelanelli covered lagoon and
biogas utilization system.
5-4 Illustration of the impact of income from surplus electricity on net 39
income after the recovery of the capital invested in the Castelanelli
covered lagoon and biogas utilization system over 20 years at 6%.
iii

PREFACE
This report summarizes the results from one of a series of AgSTAR studies designed to more fully characterize: 1) the air and water quality improvements provided by anaerobic digestion for managing manure and other wastes in the swine and dairy industries, and 2) the associated costs. The objective of this effort is to develop a better understanding of: 1) the potential of individual system components and combinations of these components to ameliorate the impacts of swine and dairy cattle manures on environmental quality, and 2) the relationships between design and operating parameters and the performance of the biological and physical/chemical processes involved. A clear understanding of both is essential for the rational planning and design of these waste management system components. With this information, swine and dairy producers, engineers, and the regulatory community can better identify specific processes that will effectively address air and water quality problems of concern.
The following schematic illustrates the comprehensive mass balance approach that is being used
for each unit process in these performance evaluations. When a system is comprised of more
than one unit process, the performance of each process is characterized separately. Then the
results are aggregated to characterize overall system performance. This is the same approach
commonly used to characterize the performance of domestic and industrial wastewater treatment
and chemical manufacturing unit processes. Past characterizations of individual process and
systems performance frequently have been narrowly focused and have ignored the generation of
side streams of residuals of significance and associated cross media environmental quality
impacts. A standardized approach for cost analysis using uniform boundary conditions also is a
key component of this comparative effort.
iv

Feed Animals
Wastes (I)
Losses (L)
Accumulation (A)
Residuals (R)
System Boundary
Animal Products
Products of Biological or
Physical/Chemical Transformations
Ultimate Disposal (Cropland and/or Alternative Use
Accumulation Within the
Unit Process
Waste Management
Unit Process (Biological or
Physical/Chemical)
Confinement
Facility
Performance parameters •Oxygen demand •Nutrients—Nitrogen & phosphorus •Indicator organisms & pathogens •Metals
Where: L = I - (R + A) (I and R are measured and
L and A are estimated) Figure 1. Illustration of a standardized mass balance approach to characterize the performance
of animal waste management unit processes.
v

vi
ACKNOWLEDGEMENTS
The cooperation of Castelanelli Brothers Dairy, Lodi, California is gratefully acknowledged as is
the assistance of Dr. Deanne Meyer, University of California—Davis and Mr. Allen Dusault of
Sustainable Conservation, San Francisco, California.
SECTION 1
SUMMARY AND CONCLUSIONS
The objective of this study was to characterize the performance of an unheated, covered
anaerobic lagoon for the stabilization of and biogas production from flushed dairy cattle manure
in a subtropical climate. The performance of this waste management system was evaluated
based on the: 1) reductions in potential air and water quality impacts, 2) net energy recovered
from the biogas produced, and 3) differential between the sum of annualized capital and
operating costs and income realized from the biogas produced.
The site of this study was Castelanelli Brothers Dairy; a 550-acre operation located Lodi,
California. The study began in January 2006 and ended in January 2007. Generally, the size of
the Castelanelli milking herd is between 1,500 and 1,600 cows with 400 to 450 dry cows and
1,200 to 1,400 heifers over three months old. The milking herd and dry cows are housed in
open-sided free-stall barns with sand used as bedding. Heifers are confined in paved open lots
with free-stalls, where separated manure solids are used as bedding. Both groups have access to
unpaved corrals during the dry season of the year, typically April or May through October or
November.
Castelanelli Brothers Dairy uses a covered anaerobic lagoon for the stabilization of manure
collected by flushing the free-stall alleys. Stored covered lagoon effluent is used for flush water.
Before entering the covered lagoon, the flushed manure flows through a gravity-settling basin to
remove sand and then into a lift station sump before screening to remove coarse solids.
Captured biogas is used to fuel a 180 kW engine-generator set, which is interconnected with the
local electric utility, the Pacific Gas and Electric (PG&E) Company, under a net metering
agreement. The covered lagoon and biogas utilization system, which has been in operation since
September 2004, was designed and constructed by RCM Digesters, Inc. of Berkley, California.
The results of this study confirm the environmental quality benefits realized by the anaerobic
digestion of dairy cattle manure with biogas collection for the generation of electricity. These
results also confirm that the economic value of the electricity generated can be adequate to
recover the capital investment in a reasonable period and then generate a long-term income
stream if there is a reasonable rate of compensation for surplus electricity delivered to the grid.
The findings of the study are summarized in Table 1-1 and discussed below.
1
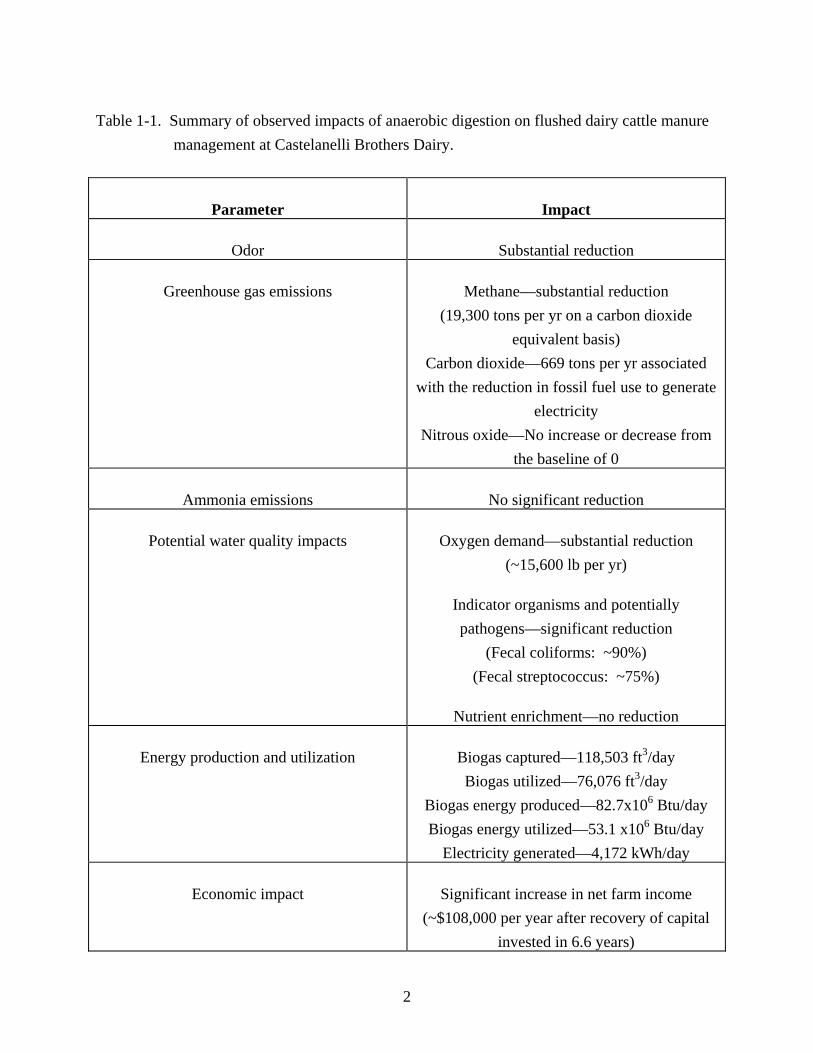
Table 1-1. Summary of observed impacts of anaerobic digestion on flushed dairy cattle manure management at Castelanelli Brothers Dairy.
Parameter Impact
Odor Substantial reduction
Greenhouse gas emissions Methane—substantial reduction (19,300 tons per yr on a carbon dioxide
equivalent basis) Carbon dioxide—669 tons per yr associated
with the reduction in fossil fuel use to generate electricity
Nitrous oxide—No increase or decrease from the baseline of 0
Ammonia emissions No significant reduction
Potential water quality impacts Oxygen demand—substantial reduction (~15,600 lb per yr)
Indicator organisms and potentially pathogens—significant reduction
(Fecal coliforms: ~90%) (Fecal streptococcus: ~75%)
Nutrient enrichment—no reduction
Energy production and utilization Biogas captured—118,503 ft3/day Biogas utilized—76,076 ft3/day
Biogas energy produced—82.7x10⁶ Btu/day Biogas energy utilized—53.1 x10⁶ Btu/day
Electricity generated—4,172 kWh/day
Economic impact Significant increase in net farm income (~$108,000 per year after recovery of capital
invested in 6.6 years)
2
Odors
The most readily apparent benefit of the use of anaerobic digestion at Castelanelli Brothers Dairy is the low level of the noxious odors commonly associated with dairy cattle manure management systems. This is the direct result of the degree of waste stabilization provided by anaerobic digestion under controlled conditions. Total volatile solids were reduced by 62 percent, chemical oxygen demand by 60 percent, and volatile acids during by ~100 percent. With these reductions and additional degradation during storage of lagoon effluent, odors are minimized.
Greenhouse Gas Emissions
Perhaps the most significant air quality impact is the reduction of methane emissions. Methane is a greenhouse gas with 21 times the heat-trapping capacity of carbon dioxide. Based on the observed biogas production rate of 118,503 ft3 per day with a methane content of 70.1 percent, the reduction in methane emissions, on a carbon dioxide equivalent basis, was determined to be 19,300 tons per year. In addition, the electricity generated using biogas has the potential of further reducing carbon dioxide emissions by displacing fossil fuel combustion that otherwise would have been used to generate the electricity on the grid. This emission reduction is estimated to be 669 tons carbon dioxide per year. The potential for nitrous oxide emissions is nil because of the absence of oxidized forms of nitrogen in dairy cattle manure and anaerobic conditions that exist in the anaerobic lagoon.
Other Gaseous Emissions
Analysis of the biogas produced at Castelanelli Brothers Dairy indicated the presence of only a trace concentration of ammonia. This finding in combination with the lack of a statistically significant difference between covered lagoon influent and effluent concentrations of total Kjeldahl nitrogen (Table 4-1) confirms that the loss of nitrogen via ammonia volatilization in covered anaerobic lagoons for dairy cattle manure is negligible. Thus, it appears reasonable to conclude that ammonia is not present in sufficient quantity during biogas combustion to cause a significant increase in emissions of nitrogen oxides relative to emissions from the thermal conversion of atmospheric nitrogen. Likewise, the concentration of hydrogen sulfide found in the Castelanelli Brothers Dairy biogas, 0.0086 percent by volume, indicates that emissions of sulfur oxides during biogas combustion probably are not significant.
Water Quality Impacts
Oxygen Demand—The study results show (Table 4-5) that substantial net reductions in the
3

masses of total volatile solids (62.4 percent) and chemical oxygen demand (59.7 percent) are occurring in the covered anaerobic lagoon with conversion to biogas being the primary mechanism. These reductions translate directly into a lower potential for depletion of dissolved oxygen in natural waters. Although anaerobically digested dairy cattle manure cannot be discharged directly to surface or ground waters, these reductions still are significant due to the potential for these wastes to enter surface waters by nonpoint source transport mechanisms.
Pathogens—The mean densities of the fecal coliform and fecal streptococcus groups of enteric bacteria were reduced by more than 90 and 75 percent, respectively, in the covered lagoon. These groups of bacteria serve as indicators of pathogen destruction potential and suggest that anaerobic digestion can achieve significant reductions in the densities of any pathogens present, such as Mycobacterium avium paratuberculosis. M. avium paratuberculosis is responsible for chronic enteritis (paratuberculosis or Johne’s disease) in cattle and other ruminants and is suspected to be the causative agent in Crohn’s disease in humans (Merck and Company, Inc., 1998). Thus, it appears that anaerobic digestion of dairy cattle manure also can reduce the potential for the contamination of natural waters by both non-pathogenic and pathogenic microorganisms.
Nutrient Enrichment— The nitrogen and phosphorus concentrations in the manure collected that
cycles through the Castelanelli covered lagoon and storage pond (Table 4-1) suggest that no long term sequestering of organic nitrogen is occurring, but there appears to be some marginal accumulation of particulate phosphorus in the covered lagoon effluent storage pond. In addition, it does not appear that stationary screening before anaerobic digestion is an effective method for
removing or concentrating organic nitrogen or phosphorus, which typically increase in
concentration as particle size decreases. Thus, the potential for nutrient enrichment of surface
waters adjacent to land application sites is not increased or decreased by anaerobic digestion.
Biogas Production
Biogas production averaged 118,503 ft3 per day over the course of the study. Production ranged
from a high of 142,947 ft3 per day in April 2006 to 87,121 ft3 per day by the end of the study in
January 2007. Biogas production declined because less manure was being fed to the digester
over the course of the study. The lower loading rate was caused by reduced feed consumption
and increased animal mortality due to abnormally high summer temperatures, and a reduction in
the amount of manure collected in summer when the cows had access to corrals. There was no
discernable impact on biogas production from the use of the ionophore, monensin sodium, to
inhibit rumen methane production and increase feed conversion efficiency.
4

Economic Impact
The results of this study confirm that the covered lagoon with biogas utilization can be an
economically attractive approach for managing flushed dairy manure even without federal or
state financial assistance if there is a reasonable rate of compensation for surplus electricity
delivered to the local utility1. Assuming maximum on-site use of the electricity generated but no
compensation for surplus electricity delivered to the grid, it is estimated that the Castelanelli
Brothers Dairy could recover the total capital cost of the biogas system without interest (i.e.,
simple payback method) in approximately 12.6 years and then increase net farm income by
approximately $70,241 per year over the remaining useful life of the system. However,
considering a return on capital at an interest rate of six percent, capital recovery would require
20 years (the estimated useful life of the system) and result in an annual loss of $6,664.
With compensation for the surplus electricity delivered to the PG&E at the rate of $0.0605 per
kWh, the time to recover the capital investment without interest would be reduced to
approximately 8.2 years and then the annual net income realized would be $107,694 per year
over the remaining system useful life. With 100 percent financing at an interest rate of six
percent, debt service would be $76,905 per year. Thus, the project would generate net income of
$35,755 annually for 20 years in addition to providing significant environmental quality benefits.
1 The net metering contract that was in place during the study did not require compensation to the Castelanelli Brothers Dairy for surplus electricity delivered to PG&E.
5
SECTION 2
INTRODUCTION
Conventional anaerobic lagoons are essential components of livestock waste management systems that remove manure from confinement facilities by flushing or the periodic draining of pull plug pits. In these waste management systems, which have been in use in the United Sates for more than 50 years, anaerobic lagoons provide two primary functions. Because they are not mixed and are operated as fill and draw reactors, anaerobic lagoons provide solids separation through gravitational settling and a degree of waste stabilization. Stabilization occurs as readily biodegradable complex organic compounds are reduced microbially to methane and carbon dioxide, a mixture commonly described as biogas. As result of these two processes, lagoon supernatant can be used in place of potable water for flushing or pit recharge thereby reducing ultimate disposal requirements. The second primary function is storage, which allows the scheduling of land application events to maximize the use of stabilized manure as a nutrient for crop production while minimizing any associated adverse water quality impacts.
Although the alternatives of mechanically aerated lagoons, oxidation ditches, etc. can provide a superior degree of odor control (Martin and Loehr, 1976, Martin et al., 1981, and others), anaerobic lagoons have prevailed as a preferred option for livestock manure stabilization and storage due to relatively low initial cost, negligible operating costs, and simplicity of operation. However, atmospheric emissions of methane from anaerobic lagoons used in livestock waste management systems have received increasing attention in recent years because methane is a potent greenhouse gas with approximately 21 times the heat trapping capacity of carbon dioxide. In addition, these emissions represent the loss of a renewable source of energy that can be used as a boiler or furnace fuel or as a fuel to generate electricity and reduce fossil fuel use.
Although the idea of covering anaerobic lagoons is relatively new, interest in the anaerobic digestion of livestock manures with the capture of the biogas produced for use as a fuel dates back at least to the early 1800s and the work of Davy (1814) and Gayon, who was a student of Pasteur (Dubaquie, 1943; LeSage and Abiet, 1952). It appears that interest in the idea of producing biogas from livestock manures in substantial quantities first occurred in the United States in the 1930s (Buswell and Hatfield, 1939) and in Germany and France during and immediately after World War II in response to disruptions in conventional fuel supplies (Tietjen, 1975). This was followed by a renewal of interest in anaerobic digestion of livestock and poultry manures in the mid-1970s, stimulated primarily by the OPEC oil embargo of 1973 and
6

the subsequent price increases for crude oil and other fuels. In both instances, this interest dissipated rapidly, however, due to technical problems and as supplies of conventional fuels increased and prices declined. Most of the anaerobic digesters constructed at livestock and poultry operations in the 1970s failed for a variety of reasons. However, the experience gained during this period led to refined system design and operating parameters and the demonstration of technical viability.
In the early to mid-1990s, four factors stimulated a renewal of interest in anaerobic digestion by livestock and poultry producers. One was the need for a cost-effective strategy for reducing odors from manure storage facilities, including anaerobic lagoons, and land application sites. Another was the re-emerging concern about the impacts of livestock and poultry manures on water quality. The third was recognition that many of the technical problems encountered in the 1970s had been resolved. Finally, the level of concern about global climate change was intensifying and the significance of methane emissions was receiving increased attention. Recognition of the magnitude of methane emissions from the uncontrolled anaerobic decomposition of livestock and poultry manures led to the creation of the U.S. Environmental Protection Agency’s AgSTAR Program. The primary mission of AgSTAR is to encourage the use of methane recovery technologies at confined animal feeding operations that manage manure
as liquids or slurries.
Objective
The objective of this study was to characterize the performance of an unheated, covered
anaerobic lagoon for the stabilization of and biogas production from flushed dairy cattle manure
in a subtropical climate. Characterization of the performance of this waste management system
was based on the: 1) reductions in potential air and water quality impacts, 2) net energy
recovered from the biogas produced, and 3) differential between capital and operating costs and
income realized from the biogas produced.
7
SECTION 3
METHODS AND MATERIALS
Study Site
The site of this study was Castelanelli Brothers Dairy; a 550-acre operation located Lodi,
California, which is in California’s Central Valley between Sacramento and Stockton. The study
began in January 2006 and ended in January 2007. Generally, the size of the Castelanelli
milking herd is between 1,500 and 1,600 cows with 400 to 450 dry cows and 1,200 to 1,400
heifers over three months old. However, the size of the milking herd during the second half of
this study generally was less than 1,500 (Table 3-1) due, at least in part, to atypically high due to
a severe heat wave during the summer of 2006. In addition, the heat wave reduced feed
consumption and thus manure production. Unfortunately, calves and heifers are only counted
once per year, so the monthly numbers are not available.
The milking herd is fed a high-energy ration with milk production typically averaging about
22,200 lb per cow-year. The ionophore, monensin sodium, is fed to the lactating herd to inhibit
rumen methane production to increase feed conversion efficiency.
The milking herd and dry cows are housed in open-sided free-stall barns with sand bedding.
Heifers are confined in paved open lots with free-stalls, where separated manure solids are used
as bedding. Both groups have access to unpaved corrals during the dry season of the year,
typically April or May through October or November.
Manure is flushed from both the free-stall barn and the open lot free-stall alleys three times per
day using stored effluent from the covered anaerobic lagoon. Before entering the covered
lagoon, the flushed manure flows through a gravity-settling basin to remove sand and then into a
lift station sump before screening to remove coarse solids. A stationary wedge wire screen is
used to remove coarse solids with the liquid effluent then discharged to the covered lagoon for
stabilization and biogas capture. The separated solids are stacked to allow drainage of free water
and partial drying before use as bedding or disposal. Before the covered anaerobic lagoon was
placed in operation in September 2004, the liquid effluent from the stationary screen was
discharged into two conventional anaerobic lagoons, which now serve as storage ponds for the
covered lagoon effluent. Disposal of excess covered lagoon effluent and accumulated
precipitation is by irrigation on approximately 220 acres of cropland. Manure scrapped from the
unpaved corrals and separated solids not used for bedding are applied to 300 acres of additional
8

cropland for disposal.
The covered lagoon and biogas utilization system, which has been in continuous operation since
September 2004, was designed and constructed by RCM Digesters, Inc. of Berkley, California.
The lagoon is 600 ft long by 200 ft wide and has an operating depth of 21 ft. The design
hydraulic retention time (HRT) was 40 days based on the assumed flow rate of 400,000 gal
(53,469 ft3) per day. The lagoon has a compacted clay liner to prevent leakage and groundwater
contamination and a biogas supported flexible cover. The system was design to produce
between 60,000 to130,000 ft3 per day of biogas and 90 to 180 kW of electrical generating
capacity. Although the Castelanelli covered lagoon is not heated to maintain a specific
temperature, excess engine coolant heat that is not collected for on-farm use is transferred to the
lagoon contents for dissipation.
Captured biogas is used to fuel a 180 kW engine-generator set. The engine, a Caterpillar
3406TA, is a diesel engine modified by the addition of spark ignition system to use low
pressure/low energy biogas as a fuel. The generator is an induction type unit with the following
specifications: three phase, 480 volts, and 312 amps at 1,835 rpm. The engine-generator set is
interconnected with the local electric utility, the Pacific Gas and Electric (PG&E) Company,
under a Net Energy Metering Service for Biogas Customers-Generators Interconnection
Agreement. Biogas delivered to the engine-generator set in excess of utilization capacity is
flared as is all biogas delivered during periods when the engine-generator set is out of service for
maintenance and repairs.
Data Collection
The performance of the Castelanelli Brothers’ covered lagoon with respect to waste stabilization
was characterized by continuously measuring the manure flow rate into the system and by
periodically sampling and analyzing the composition of the influent and effluent manure.
Samples of the following were collected semi-monthly from 18 January 2006 to 9 January 2007
for analysis:
1. Stored covered lagoon effluent used as flush water,
2. Flushed manure before screening,
3. Covered lagoon influent, which is the liquid fraction of the flushed manure after
screening,
4. Covered lagoon effluent, and
5. Separated solids.
9

To ensure representative sampling, all manure samples were composites of a series of grab
samples collected over a one-hour period.
An Isco Model 3010 Ultrasonic Flow Transmitter was used to estimate the volumetric flow rate
through the covered lagoon. This unit was located in the covered lagoon’s effluent structure,
which contains a weir to control the liquid depth in the covered lagoon.
During each sampling episode, the volume of biogas sent to the generator set and the flare was determined using two Roots Specialty Service Meters. The total volume of biogas was measured, as was the volume of biogas flared, with the difference being the volume of biogas utilized. The kWh of electricity generated since the last sampling episode was determined using PG&E’s kWh meter that records delivery of electrical energy to their distribution system. During this study, most of the biogas-generated electricity produced was delivered to PG&E because PG&E would not wheel biogas-generated electricity through their distribution system to different locations on the farm. Castelanelli Brothers Dairy has multiple points of connection to the PG&E distribution system and is in the process of constructing an internal distribution system so that the farm can use the electricity being generated on-site to meet on-site energy demand. The hours of engine-generator set operation between sampling episodes also was recorded to ascertain on-line efficiency.
Sample Analyses
Physical and Chemical Parameters—All samples of flush water; stationary screen influent; covered lagoon influent (which is the liquid phase effluent from the stationary screen); covered lagoon effluent; and solids separated by screening collected were analyzed on an “as-received” basis for the physical and chemical parameters listed in Table 3-2. American Public Health Association (2005) methods were used to determine total solids (TS), total volatile solids (TVS), chemical oxygen demand (COD), soluble chemical oxygen demand (SCOD), volatile acids (VA), total Kjeldahl nitrogen (TKN), ammonia nitrogen (NH4-N), and pH. U.S. Environmental Protection Agency (1983) methods were used for total phosphorus (TP) and total soluble phosphorus (TSP) determinations, and an ASTM method was used for total sulfur determinations. Minnesota Valley Testing Laboratories, Inc. in Nevada, Iowa, performed all analyses. The company is certified by the states of Iowa, Minnesota, and North Dakota for water and wastewater analysis. All samples were shipped in ice filled, insulated containers and were delivered to the analytical laboratory within 24 hours of collection.
Biodegradability—A 50-day batch study was conducted to estimate the biodegradable and
10
refractory fractions of TVS in a random sample of as-excreted manure from Castelanelli Brothers Dairy. The study was a laboratory scale study in which two liters of manure was maintained at 95 °F (35 °C) in a glass reactor. A water trap was used to vent the biogas produced and maintain anaerobic conditions in the reactor. The contents of the reactor were sampled and analyzed to determine TVS concentration on days 0, 15, 20, 30, 45, and 55. The Eastern Research Group, Inc., Morrisville, North Carolina, performed the biodegradability study.
Microbial Parameters—Two microbial parameters were used to characterize the potential fate of pathogenic microorganisms in the Castelanelli Brothers Dairy waste management system. One parameter was the fecal coliform group of bacteria (fecal coliforms), a group of bacteria that includes Escherichia coli, Klebsiella pneumoniae, and other species that are common inhabitants of the gastro-intestinal tract of all warm-blooded animals. The second parameter was the fecal streptococcus (fecal strep) group of bacteria, a group of bacteria that includes S. faecalis, S. faecium, and other species that also are common inhabitants of the gastro-intestinal tract of all warm-blooded animals. The presence of fecal coliforms and fecal streptococci are a commonly used indicator of fecal contamination and the possible presence of pathogenic microorganisms. In addition, a reduction in fecal coliform and fecal streptococci densities serves as an indicator of reductions in the densities of pathogenic microorganisms that also may be present. Densities of both groups of indicator organisms were estimated by Minnesota Valley Testing Laboratories, Inc. using the multiple tube fermentation technique (American Public Health Association, 2005).
Biogas Composition—A random sample of Castelanelli covered lagoon biogas was analyzed by
gas chromatography using ASTM Method D1946 (ASTM International, 1990) to determine
methane and carbon dioxide content. In addition, the sample was analyzed to determine
concentrations of hydrogen sulfide (H2S) and ammonia (NH3). The determination of the H2S
and NH3 concentrations were performed using ASTM Method D-5504 (ASTM International,
1990) and EPA Method 350.1, respectively.
Data Analysis
Each data set generated in this study was analyzed statistically for the presence of extreme observations or outliers using Dixon’s criteria for testing extreme observations in a single sample (Snedecor and Cochran, 1980). If the probability of the occurrence of a suspect observation based on order statistics was less than five percent (P<0.05), the suspect observation was considered an outlier and not included in subsequent statistical analyses.
With the exception of bacterial densities before log10 transformation, all data sets were found to
11
be approximately normally distributed and the null hypothesis that two means do not differ significantly (P<0.01) was tested using the Student’s t test. For multiple comparisons, one-way analysis of variance (ANOVA) was used. If the null hypothesis that the means do not differ significantly (P<0.01) was rejected, Tukey’s Honest Significance Test for pair-wise comparisons of means (Steel and Torrie, 1980) was used. To equalize variances, densities of fecal coliform and fecal streptococcus bacteria were transformed logarithmically before means were compared statistically.
The refractory fraction of TVS in the as-excreted manure was estimated using the results of the batch biodegradability study. The estimate was based on the assumption that the biodegradable fraction of TVS approaches zero as the solids retention time (SRT) approaches infinity. Therefore, the fraction of TVS can be determined graphically by plotting a time series of ratios of TVS concentrations to the initial TVS concentration versus the inverse products of the initial TVS concentration and the corresponding unit of time. Because the resulting relationship theoretically is linear, the ordinate axis intercept represented the refractory fraction of TVS.
12
SECTION 4
RESULTS
Wastewater and Separated Solids Characteristics
Table 4-1 provides an overview of the physical and chemical characteristics of the manure
collected by flushing as it cycles through the Castelanelli covered lagoon and effluent storage
ponds. The relatively small differences among the compositions of the flush water, covered
lagoon effluent, and the influent to the stationary screen are indicative of the large volume of
flush water being used. The absence of any statistically significant differences (P<0.01) between
the stationary screen influent and covered lagoon influent (stationary screen liquid phase
effluent) characteristics, also are noteworthy. This is an indication, confirmed by visual
observation, that the stationary screen is removing only the coarse fibrous fraction of the flushed
manure solids. These solids have very little biogas production potential because they generally
are not readily biodegradable. If not removed, they can form a floating mat that can impede both
biogas and liquid flows in the anaerobic lagoon.
The physical and chemical characteristics of the solids separated by screening are summarized in
Table 4-2. Comparing the ratio of organic nitrogen to total solids in the stationary screen
influent (2.84 percent) with the separated solids (0.15 percent) supports the observation that the
stationary screen is mainly removing coarse fiber. Similarly, the substantial difference between
the percentages of total phosphorus to total solids in the screen influent (1.26 percent) and the
separated solids (0.019 percent) suggests that stationary screening before anaerobic digestion is
not an effective method for removing and concentrating organic nitrogen or phosphorus.
Concentrations of organic nitrogen and phosphorous in manure typically increase in
concentration as particle size decreases.
A comparison of the physical and chemical characteristics of the Castelanelli covered lagoon
influent and effluent (Table 4-3) indicates a significant reduction in the organic fraction of the
flushed manure, based on the decreases in TVS, COD, SCOD, and VA concentrations. The
reduction in fixed solids indicates that the reductions in the organic fraction were the result of a
combination of microbial degradation and some settling, as would be expected.
13

The absence of any statistically significant differences between the mean influent and effluent
nitrogen and phosphorus concentrations suggest that the organic nitrogen and phosphorus
entering the covered lagoon is associated with small particles, and possibly colloidal matter, with
very low settling velocities. The minimal differences in concentrations of organic nitrogen and
total phosphorus in the covered lagoon effluent and influent water appear to support this
hypothesis.
Wastewater Flow
The volumetric flow rate though the Castelanelli covered lagoon was estimated by measuring effluent flow using an ultrasonic flow meter. Over the 12 months of the study, the average flow was about 645,000 gal per day but with semi-monthly values ranging from 503,962 to 771,312 gal per day (Table 4-4). This flow exceeds the rate for which the digester system was designed. The high average rate of flush water use is due to the low degree of slope of the free-stall and connecting alleys. This flow translates into an average HRT of approximately 25 days with a range of approximately 21 to 32 days. As explained on page 18, the actual HRT is higher than this nominal rate
Two factors contribute to the observed variability in average flow rates. First, all precipitation event runoff from the flushed confinement areas is discharged to the covered lagoon. Second, the volume of flush water used per day varies. The flush water pumps operate for a constant period of time each day but the volume of water pumped varies as a function the head differential between the covered lagoon effluent storage ponds and the free-stall alleys, which varies with inputs to and withdrawals from these ponds.
Covered Lagoon Performance
As shown in Table 4-3, the anaerobic lagoon substantially reduced concentrations of TS, TVS,
FS, COD, SCOD, and VA. The reductions, which are due to a combination of microbial
degradation and settling, ranged from 16.5 percent for FS to 74.0 percent for VA. However,
these reductions are biased negatively by the substantial concentrations of TS, TVS, COD,
SCOD, and VA in the recycled lagoon effluent used for flushing. With the repeated passage of
the flush water through the covered lagoon and the effluent storage ponds, it appears reasonable
to consider these concentrations to be essentially refractory from an engineering perspective.
Table 4-5 estimates covered lagoon performance by subtracting the mean flush water
concentrations from both the influent and effluent concentrations of the covered lagoon. By
14
adjusting for the refractory concentrations, the reductions in the covered lagoon in TS, TVS, FS,
and COD are substantially higher (Table 4-5). This analysis indicates that the atypically high
volume of flush water used at this farm did not adversely affect lagoon performance.
Unfortunately, flush water volatile acid concentrations were not determined. There were no
statistically significant reductions (P<0.01) in TKN, NH4-N, TP, SP, or TS concentrations.
Biodegradability
The batch biodegradability study of the influent to the Castelanelli covered lagoon indicates that
24 percent of the TVS are readily biodegradable and 76 percent are refractory. This relatively
low readily biodegradable TVS fraction appears reasonable given the dilution effect of the
substantial amount of covered lagoon effluent used for flushing especially when the further
stabilization occurring in the effluent storage ponds is considered. In addition, some readily
biodegradable TVS are being removed as flushed manure is screened prior to discharge into the
covered lagoon. As noted in Table 4-3, comparison of mean covered lagoon influent and
effluent concentrations indicate a TVS reduction of 26.3 percent across the covered lagoon. It is
important to remember that the biodegradability analysis was conducted on the influent to the
covered lagoon and not freshly excreted dairy cattle manure, for which biodegradability typically
is significantly higher.
Indicator Organism and Pathogen Reduction
As shown in Table 4-6, the log10 densities of both the fecal coliform and fecal streptococcus groups of indicator microorganisms were reduced in the Castelanelli Brothers Dairy covered lagoon. On a colony-forming unit (CFU) per 100 ml of manure basis, the reduction in the density of fecal coliforms was over 90 percent and the reduction in fecal streptococcus was approximately 75 percent. The lack of difference between the covered lagoon effluent and the flush water in both fecal coliform and fecal streptococcus densities indicates that re-growth did not occur in the storage pond nor was there any further reduction.
Biogas Production and Characteristics
Biogas Production—As shown in Table 4-7, average measured biogas production was 118,503
ft3 per day. An average of 76, 067 ft3 per day was utilized to generate electricity and 42,435 ft3
per day (35 percent) disposed of by flaring. The measured rate of biogas production is consistent
with the average TVS loading rate of 14,128 lb per day and translates into an average biogas
production rate of 8.4 ft3 per lb TVS added. This conversion rate is higher than those observed
in performance evaluations of plug-flow digesters for dairy cattle manure but appears reasonable
15

given that the less readily biodegradable TVS were being removed from the covered lagoon
influent by screening. The biogas production data (Table 4-7) suggest that the combined
capacity of the engine-generator set and flare was sufficient to combust the maximum daily
average rate of production, which was 142,947 ft3 per day.
The system developer, RCM Digesters, Inc., indicated that some biogas was being vented
directly to the atmosphere during the summer months of the study, but the amount vented could
not be measured. Venting occurs to avoid damage to the lagoon cover from excessive pressure
when biogas production exceeded the capacity of the engine-generator set and flare.
Although total biogas production could not be measured due to the venting of a portion of the
biogas produced, both measured biogas collected and biogas flared followed similar slightly
decreasing trends over the course of the study. Thus, it seems reasonable to conclude that total
biogas production also decreased slightly. This reduction probably is a reflection of the slight
decrease in the number of lactating cows due to mortality during the study period; the reduction
in the amount of manure collected by flushing when the lactating herd, dry cows, and
replacements had access to corrals from the early spring to the late fall; and reduced feed
consumption due to the severe hot weather during the summer of 2006.
Although some seasonal variation in biogas production was expected, none was discernable
perhaps due to the effects of reduced manure collection during warm weather. Less manure was
collected due to the use of the unpaved corrals during the spring, summer, and fall; animal
mortality; and the effects of the abnormally high summer temperatures on manure production.
However, there was a significant degree of seasonal variation in the temperature of the covered
lagoon effluent with a decline to a minimum of 54.4 °F in February followed by a gradual
increase to a maximum of 83.6 °F in July. As shown in Table 4-8, the average monthly
temperature of the digester effluent always was higher than the average monthly ambient
temperature with the maximum differential of 15.3 °F occurring in January.
Biogas Composition—Methane and carbon dioxide concentrations averaged 70.1 and 29.9
percent by volume, respectively, with only a trace amount of ammonia. The average
concentration of hydrogen sulfide also was only nominal, 0.0086 percent. These lower carbon
dioxide and hydrogen sulfide concentrations, as compared to concentrations in biogas produced
in heated digesters, are the result of the increasing solubility of both compounds as temperature
decreases. Because methane is essentially insoluble in water, methane concentration in biogas
will increase as carbon dioxide desorption decreases. The solubility of carbon dioxide in water
at 20 °C (68 °F) is almost twice its solubility at 95 °F (35 °C), and a similar relationship exists
16
for hydrogen sulfide and ammonia. Because of the higher solubility of carbon dioxide at lower
temperatures, biogas production on a cow-day or similar basis from dairy cattle manure in
unheated anaerobic digestion systems, such as covered lagoons, will be slightly lower than from
heated systems, such as plug-flow digesters. However, methane production will not be effected
because of the insolubility of methane in water.
Conversion Rates to Biogas
Assuming the conversion rate of 12 ft3 of biogas per lb of TVS destroyed (Metcalf and Eddy,
Inc. (2003), the average rate of measured biogas production of 118,503 ft3 per day (Table 4-7)
translates into an average rate of TVS destruction of 9,875 lb per day. Based on the average
methane content of 70.1 percent, the average rate of methane production from the Castelanelli
covered lagoon was 83,071 ft3 per day. Theoretically, 5.62 ft3 of methane is produced per lb of ultimate biochemical oxygen demand (BODu) destroyed under anaerobic conditions (Metcalf and Eddy, 2003). Although not all COD is biodegradable, it can be assumed that a microbially mediated reduction of COD is equal to a reduction of the same magnitude in BODu. Therefore, it appears reasonable to assume that an average of at least 14,781 lb per day of COD was being reduced to methane in this covered lagoon.
Biogas Utilization
During this 12-month study, Castelanelli Brothers Dairy generated 1,489,511 kWh of electricity. The daily generation rate was 4,172 ± 715 kWh per day. The relatively high degree of variability, 17.1 percent was due to the degree of variability in on-line efficiency (Table 4-9) caused primarily by engine cooling system problems. Excess engine coolant heat was
transferred to the lagoon contents for disposal, and the heat transfer capacity of this system was
not adequate during the abnormally hot weather during June, July, and August. Due to the low on-line efficiency during this period, overall on-line efficiency was only 90.4 percent. However, the on-line efficiency during the other 9 months was 95.9 percent.
As indicated in Table 4-9, the observed thermal conversion efficiency (biogas to electricity) was 27.8±3.6 percent. This mean conversion efficiency is close to the estimated maximum value for the conversion of biogas to electricity of 30 percent (Koelsch and Walker, 1981) with the added potential of recovering up to 60 percent of biogas energy as heat energy. For the Castelanelli system, thermal conversion efficiency increased as engine-hours per day increased with no apparent logical explanation. Regression analysis (Equation 4-1) indicates this relationship with a coefficient of determination (R2) of 0.79.
17
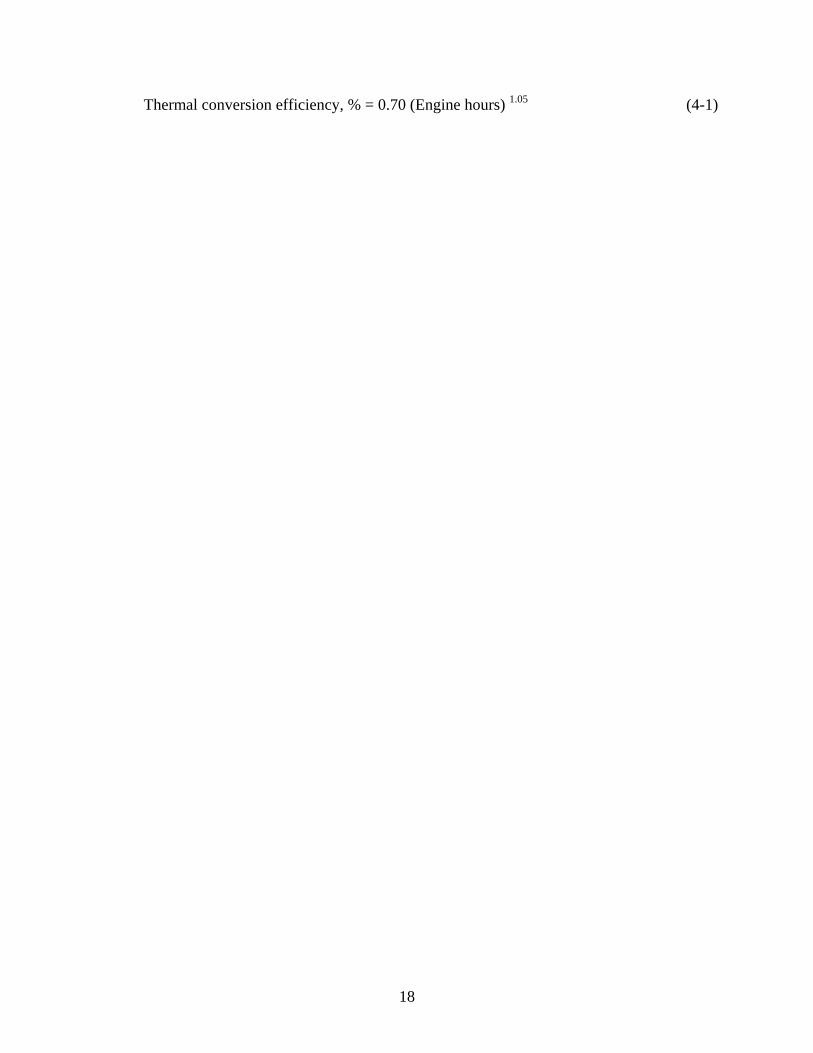
Thermal conversion efficiency, % = 0.70 (Engine hours) 1.05 (4-1)
18

SECTION 5
DISCUSSION
The primary objectives for constructing the Castelanelli Brothers covered lagoon and biogas
utilization system were to reduce noxious odors and generate revenue from the on-site use and
sale of electricity to offset the capital and operating and maintenance costs of the system. The
results of this study demonstrate that odor control has been achieved and objective has been
achieved and the economic objective appears achievable although not yet realized.
Manure Production and Characteristics
Because of the uncertainty regarding the variability in numbers of dry cows and replacement heifers and the seasonal use of unpaved and scraped corrals, it was not possible to determine manure production rates and compare them to typical values in the literature. However, a comparison of the average net mass of COD in the flushed manure before screening and the expected value for the average number of mature cows and replacements present suggests that approximately 75 percent of the manure excreted was being discharged to the covered lagoon. The expected value was derived using typical COD excretion rates for dairy cattle (U.S. Department of Agriculture, 1992). Thus, it appears that approximately 25 percent of the excreted manure was accumulating in the corrals.
Anaerobic Digester Performance and Biogas Utilization
Waste Stabilization—The Castelanelli Brothers Dairy covered lagoon was designed to operate at a nominal HRT of 40 days based on the assumed flow rate of 400,000 gal (53,469 ft3) per day.
However, the observed mean flow rate during this study of 644,674 gal (86,175 ft3) per day was
substantially higher. The corresponding nominal HRT of approximately 25 days was
significantly lower than the design value. However, nominal HRT is not an accurate indicator of
retention time in this study because of the unusually high volume of lagoon effluent that was
recycled back through the system as flush water. The ratio of flush water to manure was
estimated to be on the order of 25 to 1 during this study. Thus, the actual average HRT is substantially higher as is the more critical solids retention time due partially to the accumulation of settleable solids in the covered lagoon. Actual retention time was more than adequate as
demonstrated by system performance with respect to waste stabilization and biogas production.
Although it was not possible for several reasons to estimate the actual HRT, best professional
judgment suggests it was in excess of 100 days.
19

As noted in Table 4-5, the average net reduction in COD in the covered lagoon was 59.7 percent
or 15,621 lb per day. This reduction translates directly into the reduction of the potential impact
of oxygen-demanding organic compounds on surface waters adjacent to covered lagoon effluent
disposal sites. The rate of methane production suggests that only about 5 percent of this COD
reduction was due to the settling and accumulation of particulate matter in the lagoon with the
remainder due to the conversion to biogas. Given that coarse solids were removed from the
covered lagoon influent by screening, it seems reasonable to conclude that the rate of
accumulation of settled solids and therefore COD in the lagoon is extremely low. This finding
indicates that covered lagoons with high recycle ratios can be operated successfully in
subtropical climates at relatively short nominal HRTs. It also suggests that the previously noted
estimate by RCM Digesters, Inc. that an additional 40,000 ft3 of biogas was being produced and
vented is overly optimistic.
Assuming the conversion rate of 12 ft3 of biogas per lb of TVS destroyed, the average rate of
measured biogas production of 118,503 ft3 per day (Table 4-7) translates into the destruction of
69.9 percent of influent TVS. This is somewhat higher than the estimated 62.4 percent rate of
TVS reduction based on comparison of measured influent and effluent concentrations (Table 4-
5). Given this difference, it appears that the conversion rate of TVS to biogas in the Castelanelli
covered lagoon was somewhat higher, 13.4 ft3 per lb TVS destroyed, which is in the expected
range of values of 12 and 18 ft3 of biogas per lb of TVS destroyed (Metcalf and Eddy, Inc.,
2003). However, the difference in estimates of TVS destruction also may merely be a reflection
of measurement error given the scale of the Castelanelli covered lagoon and the inability to
directly measure the rate of particulate matter settling. Nevertheless, the comparative estimate
based on biogas production suggests that the mass balance estimate based on influent and
effluent concentrations is realistic.
There was no statistically significant difference between mean covered lagoon influent and
effluent concentrations of ammonia nitrogen (Table 4-1) indicating that the mineralization of
organic nitrogen to ammonia is essentially complete before anaerobic digestion. In addition,
both influent and effluent concentrations are similar to those measured in the two covered lagoon
effluent storage ponds in March 2002 when they operated as conventional anaerobic lagoons
prior to the construction of the covered lagoon (Meyer, 2007). This suggests that anaerobic
digestion in unheated, covered lagoons does not exacerbate the potential for nitrate
contamination of ground or surface water.
Pathogen Reduction—As shown in Table 5-1, the reductions in the densities of the fecal coliform and fecal streptococcus groups of indicator organisms in the Castelanelli covered
20
lagoon were substantially lower than those previously observed in performance evaluations of mesophilic, plug-flow digesters. Two factors appear to be primarily responsible for the lower reductions in fecal coliform and fecal streptococcus densities in the covered lagoon. One is the lower average operating temperature, 69 °F for the covered lagoon (Table 4-8) versus 95 °F for the plug-flow digesters. The second is the absence of any further reductions during effluent storage (Table 4-6) in combination with the high volume of effluent used for flushing.
Biogas Production—Biogas generation averaged 118,503 ft3 per day. It was not possible to characterize biogas production on a per animal basis (e.g. ft3 per lactating cow-day) for comparison with other studies because of data limitations. Data were unavailable to determine the mass of manure excreted daily due to the lack of monthly information on the variation in the numbers and ages of the replacement herd and the fraction of the manure collected by flushing. However, comparison of the estimated COD reduction (14,781 lb per day based on methane production and 15,621 lb per day based on the difference between net mean influent and effluent concentrations) suggests that the biogas production potential is being maximized. If the assumption that only 75 percent of the excreted manure currently is being collected by flushing is valid, it appears that an increase in biogas production from 118,503 to 158,004 ft3 per day is possible with collection of 100 percent of the manure produced.
Biogas Utilization—The full potential for generating electricity from the biogas produced at Castelanelli Brothers Dairy was not being realized during this study primarily because the rate of biogas production exceeded engine-generator set capacity. At the conversion rate of 18.2 ft3 of biogas per kWh (12.8 ft3 of methane per kWh), utilization of the biogas flared could have increased the average rate of electricity generation from 4,172 to 6,511 kWh per day. If all excreted manure was collected by flushing for anaerobic digestion, the potential for generating electricity increases further to possibly to 8,681 kWh per day.
One of the more significant results of this study is that maximizing utilization of internal combustion engine-generator set capacity markedly increases the thermal conversion efficiency of biogas to electricity. This finding demonstrates that there is a significant penalty for over sizing generating capacity. In addition, it appears that the maximum value of 30 percent suggested by Koelsch and Walker, 1981 can be exceeded although the higher-than-typical biogas methane content of 70.1 percent in the Castelanelli system may be a factor in increasing thermal efficiency.
The average on-line efficiency observed in this study of 90.4 percent (Table 4-9) demonstrates that the anaerobic digestion of livestock manure can provide a reliable source of electricity
21
comparable to utility and merchant operated generating facilities. The engine cooling system problem that reduced average on-line efficiency from June through August 2006 to 75.6 percent was the result of a flawed design, caused by incorrect heat transfer rate assumption, and has been corrected. Accordingly, on-line efficiency should increase in the future.
Greenhouse Gas Emissions—During the study period, Castelanelli Brothers Dairy is estimated to have reduced greenhouse gas emissions by 19,900 tons CO2 equivalent per year. This reduction is comprised of methane emission reductions on-site and displaced CO2 emissions from the electrical grid.
During the study period, methane emissions were reduced by an average of 5,028 lb per day or approximately 918 tons per year through methane capture and combustion. This estimate was made using the methodology currently employed by the U.S. Environmental Protection Agency for developing the annual inventory of U.S. greenhouse gas emissions and sinks (U.S. Environmental Protection Agency, 2005). In this methodology, it is assumed that the methane emission reduction at a covered unheated lagoon is equivalent to the methane captured.2 Because methane has approximately 21 times the heat trapping capacity of carbon dioxide (U.S. Environmental Protection Agency, 2005), the reduction in methane emission is equivalent to an emission reduction of approximately 19,300 tons of carbon dioxide per year.
The reduction in greenhouse gas emissions due to biogas production and utilization is not limited to the reduction in methane. The use of the biogas to generate electricity reduces the demand for electricity generated using fossil fuels. This reduction in demand reduces carbon dioxide emissions from the use of fossil fuels to generate electricity delivered to the grid. Based on 2004 data, 879 lb of carbon dioxide per MWh are emitted from the generating of electricity supplied by PG&E in the Lodi, California area according to the USEPA’s Power Profiler (www.epa.gov/cleanenergy/powerpro/screen1.html). Accordingly, the estimated 1,522,780 kWh of electricity generated in 2006 by the Castelanelli Brothers Dairy using biogas reduced fossil fuel-derived carbon dioxide emissions by an additional 669 tons per year.
2The combustion of biogas has no effect on carbon dioxide emissions. The carbon dioxide emissions from biogas
combustion are not considered to contribute to the increase of greenhouse gases in the atmosphere because these
carbon dioxide emissions are not derived from a sequestered carbon source. Rather, this emission is part of the
natural short-term carbon cycle where carbon dioxide is fixed by photosynthesis and then is regenerated as the plant
matter produced is degraded microbially and by higher animals.
22
Economic Analysis
One of the objectives of this study was to quantify the impact of anaerobic digestion with biogas capture and utilization to generate electricity on the cost of dairy cattle manure management.
Capital Cost—The estimated cost of the installation of the covered lagoon and engine-generator set at Castelanelli Brothers Dairy is $882,136. This cost includes all associated structures, equipment, and electricity distribution system modifications. Based on the design herd size of 1,600 lactating cows, the capital cost of the Castelanelli Brothers system is $551 per lactating cow or $4,901 per installed kW of electrical generating capacity.
Value of Electricity Generated—During the study period, Castelanelli Brothers Dairy received only a nominal amount of income from the generation of biogas electricity. Only a small fraction of the electricity could be used on site because the farm has numerous service drops (electrical meters) and was not configured to receive electricity at these locations except through the grid. PG&E did not “wheel” biogas-generated electricity through their distribution system to these different locations on the farm. As a result, the only biogas-generated electricity that was used on-site during the study was service through a single meter for a covered lagoon pump. Accordingly, most of the electricity was delivered to PG&E at no charge. Under California net metering policy in place during this study, utilities were not required to pay for the net annual excess electricity delivered to their transmission system.
To increase revenue, the Castelanelli Brothers Dairy has been reconfiguring their electrical distribution system so that they can increase the on-site use of the biogas electricity being generated and reduce the electricity being purchased from PG&E. From PG&E electric bills, it was determined that Castelanelli Brothers Dairy purchased 903,716 kWh in 2005 at a cost of $93,083, which translates into an average cost of $0.103 per kWh including demand charges. The annualized cost for rewiring the farm to reduce the kWh purchased from PG&E would have to be subtracted from this revenue stream.
A second revenue stream would be available if the local net metering policy required the utility to purchase excess electricity generated. Based on the average rate of biogas electricity generation of 4,172 kWh per day (Table 4-9), Castelanelli Brothers Dairy generated 1,522,780 kWh of electricity during 2006, which is about 1.7 times the kWh purchased from PG&E in 2005. Based on total on-farm demand of 903,716 kWh in 2005, the potential exists to reduce the cost of electricity purchased from PG&E by at least $93,083 annually and sell the excess 619,064 kWh. If PG&E had to pay a minimum of $0.0605 per kWh for this electricity, as
23

suggested by Krich et al., 2005, an additional $37,453 annual income would be generated, increasing gross annual revenue to $130,536 (before consideration of the re-wiring cost).
Annual Operation and Maintenance Costs—Because the digester system at Castelanelli Brothers Dairy has been in operation only since September 2004, there is no long-term record on which to base an estimate of annual operating and maintenance costs. Previously, Wright and Perschke (1998) and Nelson and Lamb (2002) have estimated operation and maintenance costs for the anaerobic digestion of dairy cattle manure with biogas utilization to generate electricity to be $0.015 per kWh of electricity generated. Because covered anaerobic lagoons are simple to operate, essentially all of the operation and maintenance costs are associated with engine-generator set operation. Assuming the operation and maintenance cost rate of $0.015 per kWh is applicable to the Castelanelli operation, the annual operation and maintenance cost is estimated to be $22,842.
Economic Viability—Because of the combined effect of the electrical configuration of the farm and the California net metering policy in place during this study, the Castelanelli Brothers Dairy has been unable to realize the maximum economic potential from anaerobic digestion with biogas utilization to generate electricity. Accordingly, economic potential was assessed under two hypothetical situations: 1) Assuming that the farm was configured to maximize utilization of biogas-generated electricity to offset all on-site electricity needs, and 2) assuming the same and a net metering policy that allows compensation to the farm for surplus electricity delivered to the grid. The results of these two scenarios with respect to net annual revenue are assessed in Table 5-2.
With full on-site utilization of biogas-generated electricity but without compensation for the
surplus electricity delivered to PG&E’s transmission system, the maximum net revenue available
to recover the capital invested in the Castelanelli biogas system is estimated to be $70,241 per
year (Table 5-2). With compensation for the surplus electricity delivered to PG&E at the rate of
$0.0605 per kWh, as suggested by Krich et al., 2005, the net annual revenue after capital
recovery would increase to $107,694 per year. The additional compensation of $37,453 per year
for surplus electricity delivered to PG&E would substantially improve the financial
attractiveness of the Castelanelli biogas system. Using simple payback, this additional revenue
reduces the time for recovery of invested capital from approximately 12.6 to 8.2 years (Table 5-
3). In addition, net income over the 20-year useful life of the system would increase from
$519,783 to $1,270,789.
24

Another measure of the attractiveness of any investment is the ability to generate income
sufficient to recover the capital invested at a rate of return that is competitive with other
investment opportunities. Table 5-4 analyzes the same two scenarios under a required internal
rate of return on capital of 6 percent. Amortizing the capital cost of the biogas system over the
20 year useful life of the system at an interest rate of six percent would require annual revenue
for principal plus interest of $76,905. Without compensation for surplus electricity delivered to
PG&E, there would be a loss $6,664 per year or $133,280 over the useful life of the system
resulting in a reduction in net farm income. With compensation for the surplus electricity, net
farm income would be $30,789 per year, or $615,780 over the 20-year life of the system. Thus,
without compensation for excess electricity, anaerobic digestion with biogas collection and
utilization may not provide a return on investment. If, however, odor control or some other
benefit provided by anaerobic digestion is necessary to continue or expand the farm enterprise,
an acceptable rate of return would be somewhat less than other investment alternatives if the
general farm operation remains profitable.
The results of these cost analyses, which do not consider the federal and state funding received
for this project, clearly demonstrate that anaerobic digestion of dairy cattle manure with biogas
collection and utilization can provide significant environmental quality benefits while
concurrently producing a significant source of income. However, this system is viable as a
stand-alone economic enterprise only with a net metering policy that provides a reasonable rate
of compensation for surplus electricity delivered to the grid. Otherwise, government assistance
in the form of grants or low interest loans will remain necessary.
Although the alternative of aerobic lagoons without biogas capture and use can provide some of
the same environmental quality benefits, no income would be produced to offset capital and
operating costs. Thus, total farm income would be decreased rather than enhanced.
25

REFERENCES
American Public Health Association. 2005. Standard Methods for the Examination of Water and Wastewater, 21th Ed. A.D. Eaton, L.S. Clescrei, E.W. Rice, and A.E. Greenberg, Eds. American Public Health Association, Washington, DC.
ASTM International. 1990. Standard Practice for Analysis of Reformed Gas by Gas Chromatography, ASTM D1946-90. ASTM International, West Conshohocken, Pennsylvania.
Buswell, A.M. and W.D. Hatfield. 1939. Anaerobic Fermentations. State of Illinois, State Water Survey Bulletin No. 132, Urbana, Illinois. 193 pp.
Davy, H. 1814. Elemente der Agrikulturchemie. Uebers. v. F. Wolff, Berlin, Germany.
Dubaquie, J. 1943. Le Gaz de Fumier. Compte-rendu de l’Academie d’Agriculture de France, séance de l déc.
Krich, K., D. Augenstein, J.P. Batmale, J. Benemann, B. Rutledge, and D. Salour. 2005. Biomethane from Dairy Waste: A Source book for the Production and Use of Renewable Natural Gas in California. Prepared for Western United Dairymen, Sacramento, California.
Koelsch, R. and L.P. Walker. 1981. Matching Dairy Farm Energy Use and Biogas Production. In: Methane Technology for Agriculture. Northeast Regional Agricultural Engineering Service, Ithaca, New York. pp. 114-136.
LeSage, E. and P. Abiet. 1952. Gaz de Fumier. Soissons. 132 pp.
Martin, J.H., Jr. 2005. An Evaluation of a Mesophilic, Modified Plug-Flow Digester for Dairy Cattle Manure. Final Report submitted by the Eastern Research Group, Inc., Boston, Massachusetts to the AgSTAR Program, U.S. Environmental Protection Agency, Washington, DC.
Martin, J.H., Jr. 2003. Comparison of Dairy Cattle Manure Management with and without Anaerobic Digestion and Biogas Utilization. Final Report submitted by the Eastern Research Group, Inc., Boston, Massachusetts to the AgSTAR Program, U.S. Environmental Protection Agency, Washington, DC.
Martin, J.H., Jr. and R.C. Loehr. 1976. Demonstration of Aeration Systems for Poultry Wastes. EPA-600/2-76-186. U.S. Environmental Protection Agency, Athens, Georgia, 152 pp.
Martin, J.H., Jr., R.C. Loehr, and R.J. Cummings. 1981. The Oxidation Ditch as a Dairy Cattle Waste Management Alternative. In: Livestock Waste: A Renewable Resource. American Society of Agricultural Engineers, St. Joseph, Michigan, pp. 346-349.
Merck and Company, Inc. 1998. The Merck Veterinary Manual, Eighth Edition, S.E. Aiello, Ed. Merck and Company, Inc., Whitehouse Station, New Jersey.
26
Metcalf and Eddy, Inc. 2003. Wastewater Engineering: Treatment and Reuse, 4th ed. revised by G. Tchobanoglous, F.L. Burton, and H.D. Stencil. McGraw-Hill Publishing Company, New York, New York.
Meyer, D. 2007. Department of Animal Science, University of California—Davis, Unpublished data.
Nelson, C. and J. Lamb. 2002. Final Report: Habenschild Farms Anaerobic Digester Updated! The Minnesota Project, St. Paul, Minnesota. 35 pp.
Snedecor, G. W. and W.G. Cochran. 1980. Statistical Methods, 7th Ed. The Iowa State University Press, Ames, Iowa.
Steel, R.G.D. and J.H. Torrie. 1980. Principles and Procedures of Statistics, 2nd Ed. McGraw-Hill Book Company, New York, New York.
Tietjen, C. 1975. From Biodung to Biogas—Historical Review of European Experience. In: Energy, Agriculture, and Waste Management, W.J. Jewell Ed. Ann Arbor Science Publishers, Inc. Ann Arbor, Michigan. pp. 247-259.
U.S. Department of Agriculture. 1992. Agricultural Waste Management Field Handbook, rev 1, July 1996. Natural Resources Conservation Service, Washington, DC.
U.S. Environmental Protection Agency. 1983. Methods for Chemical Analysis of Water and Wastes. PB84-128677. Environmental Monitoring and Support Laboratory, Cincinnati, Ohio.
U.S. Environmental Protection Agency. 2005. Inventory of U.S. Greenhouse gas Emissions and Sinks: 1990-2003. EPA 430-R-05-003. Office of Atmospheric Programs, Washington, DC.
Wright, P. and S.P. Perschke. 1998. Anaerobic Digestion and Wetland Treatment Case Study: Comparing Two Manure Odor Control System for Dairy farms. ASAE Paper No. 98-4105, American Society of Agricultural Engineers, St. Joseph, Michigan. 11 pp.
27
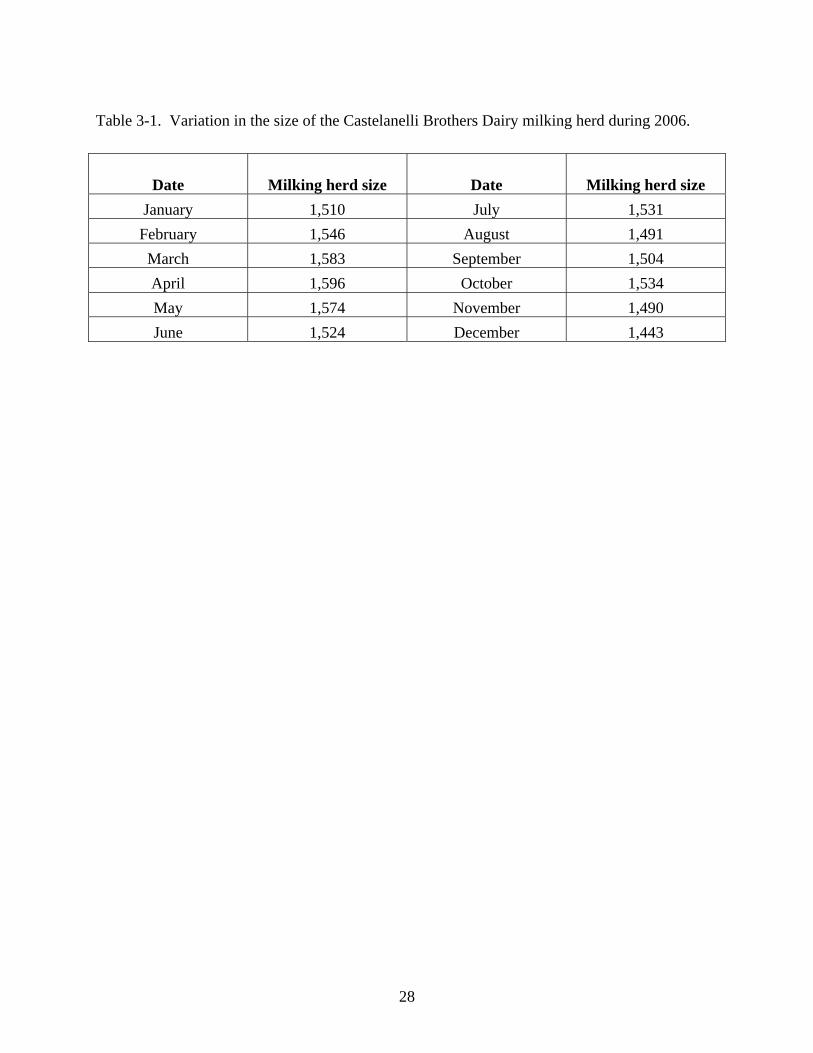
Table 3-1. Variation in the size of the Castelanelli Brothers Dairy milking herd during 2006.
Date Milking herd size Date Milking herd size
January 1,510 July 1,531
February 1,546 August 1,491
March 1,583 September 1,504
April 1,596 October 1,534
May 1,574 November 1,490
June 1,524 December 1,443
28

Table 3-2. Schedule of Castelanelli Brothers Dairy sample analyses.
Parameter
Flush water
Stationary screen
influent
Covered lagoon influent
Covered lagoon effluent
Separated
solids
Total solids X X X X X
Total volatile solids
X X X X X
Chemical oxygen demand
X
X
X
X
—
Soluble chemical oxygen demand
—
—
X
X
—
Volatile acids — — X X —
Total Kjeldahl nitrogen
X
X
X
X
X
Ammonia nitrogen
X X X X X
Total phosphorus
X X X X X
Total soluble phosphorus
X
X
X
X
X
Total sulfur X X X X X
pH X X X X X
29

Table 4-1. The physical and chemical characteristics of manure collected by flushing as it cycles through the Castelanelli Brothers Dairy covered lagoon and storage pond*.
Parameter,
mg/L
Flush water Stationary
screen influent Covered lagoon
influent Covered lagoon
effluent
Total solids 7,963a±1,282 11,138b±1,541 11,771b±3,131 9,216a±2,270
Total volatile solids
3,610a±1,214 6,085b±1,710 6,236b±2,765 4,598a±1,900
Fixed solids 4,353a±829 5,053b±964 5,535b ±1,242 4,618a±781
Chemical oxygen demand
5,966a±1,438 10,668b±2,351 10,830b±2,201 7,928a±2,960
Soluble chemical oxygen demand
— — 5,106a±1,026 3,672b±715
Volatile acids — — 300a±106 78.0b±32.1
Total Kjeldahl nitrogen
1,059a±103 1,166a ±106 1,196a±93 1,123a±97
Organic nitrogen 251a±90 317b±83 352b±79 283a±100
Ammonia nitrogen
808a±62 849a±68 843a±70 840a±75
Total phosphorus 92a±27 140b±47 134b±53 128b±56
Soluble phosphorus
15.7a±8.4 16.5a±10.0 14.4a±9.3 15.5a±9.1
Total sulfur 357a±221 268a±186 271a±169 287a±219
pH 7.8a±0.2 7.9a±0.1 7.9a±0.1 7.7a±0.2 *Means in a row with a common superscript are not significantly different (P<0.01, n=24).
30

Table 4-2. The physical and chemical characteristics of the Castelanelli Brothers Dairy flushed manure solids separated by screening.
Parameter Mean ± Standard Deviation*
Total solids, %† 13.3±2.7
Total volatile solids, % 12.1±2.6
Fixed solids, % 1.2±0.5
Total Kjeldahl nitrogen, mg/kg# 2,210±500
Organic nitrogen, mg/kg 1,533±538
Ammonia nitrogen, mg/kg 677±141
Total phosphorus, mg/kg 190±71
Soluble phosphorus, mg/kg 22.7±35.1
Total sulfur, mg/kg 482±184
pH 7.8±0.5 *n=24 †wet basis #total solids basis
31
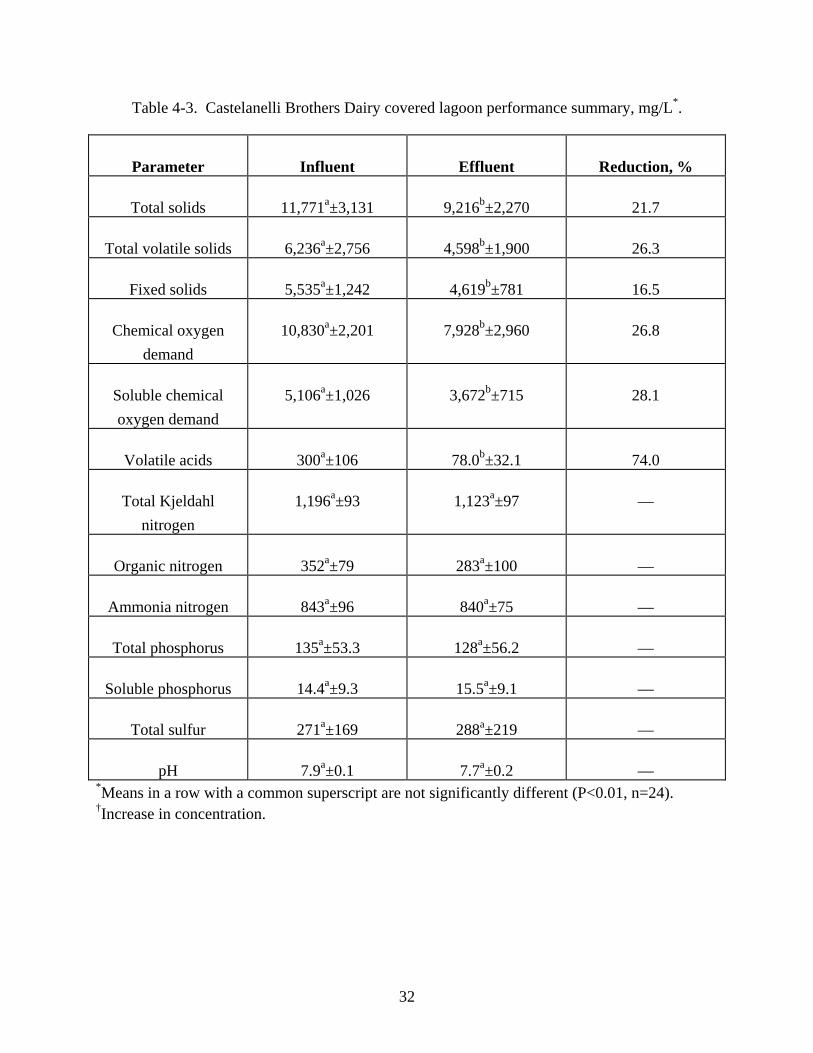
Table 4-3. Castelanelli Brothers Dairy covered lagoon performance summary, mg/L*.
Parameter Influent Effluent Reduction, %
Total solids 11,771a±3,131 9,216b±2,270 21.7
Total volatile solids 6,236a±2,756 4,598b±1,900 26.3
Fixed solids 5,535a±1,242 4,619b±781 16.5
Chemical oxygen demand
10,830a±2,201 7,928b±2,960 26.8
Soluble chemical oxygen demand
5,106a±1,026 3,672b±715 28.1
Volatile acids 300a±106 78.0b±32.1 74.0
Total Kjeldahl nitrogen
1,196a±93 1,123a±97 —
Organic nitrogen 352a±79 283a±100 —
Ammonia nitrogen 843a±96 840a±75 —
Total phosphorus 135a±53.3 128a±56.2 —
Soluble phosphorus 14.4a±9.3 15.5a±9.1 —
Total sulfur 271a±169 288a±219 —
pH 7.9a±0.1 7.7a±0.2 — *Means in a row with a common superscript are not significantly different (P<0.01, n=24). †Increase in concentration.
32

Table 4-4. Castelanelli Brothers Dairy covered lagoon effluent flow rates.
Average Flow Rate Period Gal/day Ft3/day
1/24-2/6/06 611,571 81,750 2/7-2/21/06 771,312 103,103 2/22-3/5/06 716,627 95,793 3/06-3/19/06 637,229 85,180 3/20-4/4/06 648,047 86,626 4/5-4/25/06 667,099 89,172 4/26-5/7/06 743,434 99,376 5/8-5/21/06 753,263 100,690 5/22-6/5/06 700,186 93,595 6/6-6/20/06 711,623 95,124 6/21-7/4/06 621,911 83,132 7/5-7/16/06 741,200 99,078 7/17-7/31/0- 643,356 85,999 8/1-8/13/06 651,604 87,101 8/14-9/5/06 592,074 79,144 9/6-9/24/06 601,030 80,341 9/25-10/8/06 536,896 71,768 10/9-10/22/06 503,962 67,366 10/23-11/6/06 539,704 72,143 11/7-11/26/06 554,626 74,138 11/27-12/10/06 579,786 77,501 12/11/06-1/8/07 656,297 87,729
Mean 644,674 86,175 Standard Deviation 76,043 10,165
33
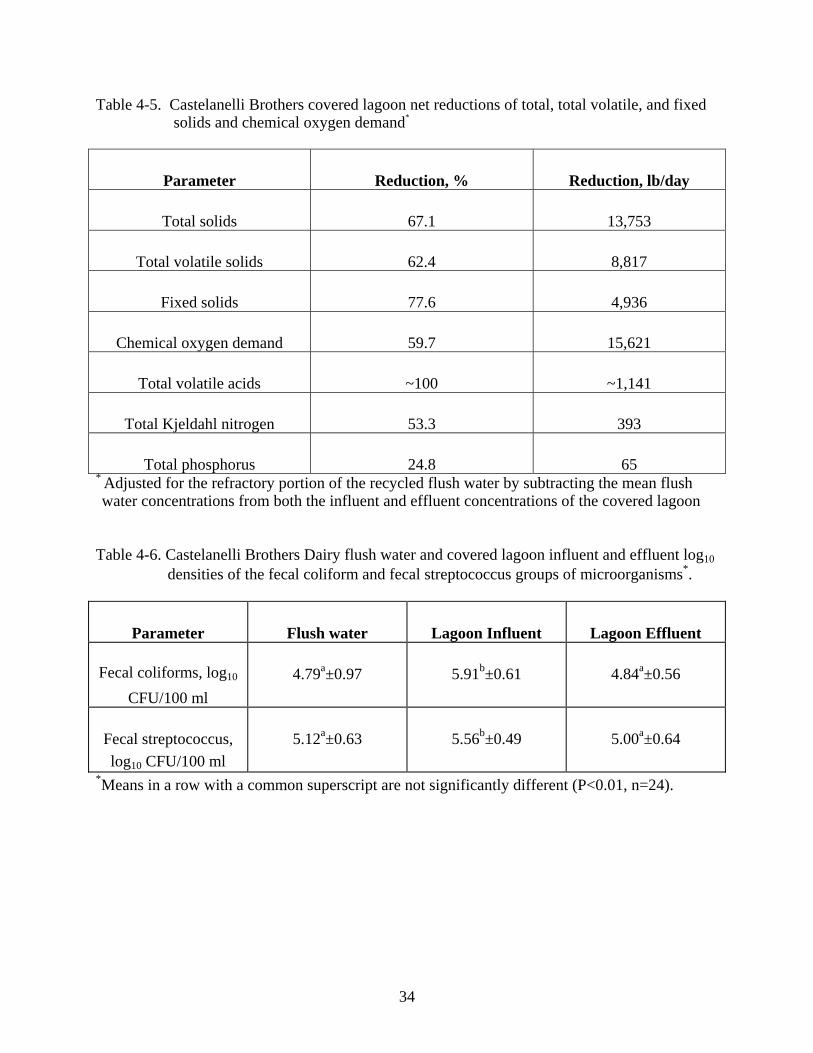
Table 4-5. Castelanelli Brothers covered lagoon net reductions of total, total volatile, and fixed solids and chemical oxygen demand*
Parameter Reduction, % Reduction, lb/day
Total solids 67.1 13,753
Total volatile solids 62.4 8,817
Fixed solids 77.6 4,936
Chemical oxygen demand 59.7 15,621
Total volatile acids ~100 ~1,141
Total Kjeldahl nitrogen 53.3 393
Total phosphorus 24.8 65 * Adjusted for the refractory portion of the recycled flush water by subtracting the mean flush water concentrations from both the influent and effluent concentrations of the covered lagoon
Table 4-6. Castelanelli Brothers Dairy flush water and covered lagoon influent and effluent log10 densities of the fecal coliform and fecal streptococcus groups of microorganisms*.
Parameter Flush water Lagoon Influent Lagoon Effluent
Fecal coliforms, log10 CFU/100 ml
4.79a±0.97 5.91b±0.61 4.84a±0.56
Fecal streptococcus, log10 CFU/100 ml
5.12a±0.63 5.56b±0.49 5.00a±0.64
*Means in a row with a common superscript are not significantly different (P<0.01, n=24).
34

Table 4-7. Castelanelli Brothers Dairy biogas production and utilization.
Biogas, ft3/day
Period Production Utilized Flared
1/18-1/23/06 120,492 83,775 36,717 1/24-2/6/06 121,764 70,521 51,243 2/7-2/21/06 126,413 72,486 53,927 2/22-3/5/06 134,217 76,567 57,650 3/06-3/19/06 125,407 68,678 56,729 3/20-4/4/06 142,947 78,927 64,020 4/5-4/25/06 131,819 75,819 56,000 4/26-5/7/06 132,758 80,875 51,883 5/8-5/21/06 124,736 79,522 45,214 5/22-6/5/06 120,833 76,046 44,787 6/6-6/20/06 107,593 45,206 62,387 6/21-7/4/06 116,200 64,636 51,564 7/5-7/16/06 123,592 74,234 49,358 7/17-7/31/0- 114,267 62,947 51,320 8/1-8/13/06 124,277 79,185 45,092 8/14-9/5/06 114,273 89,578 24,695 9/6-9/24/06 110,132 73,679 36,453 9/25-10/8/06 111,107 84,686 26,421 10/9-10/22/06 105,907 85,907 20,000 10/23-11/6/06 109,133 80,413 28,720 11/7-11/26/06 109,970 82,910 27,060 11/27-12/10/06 110,600 82,114 28,486 12/11/06-1/8/07 87,121 80,835 6,286
Mean 118,503 76,076 42,435
Standard Deviation 11,880 9,424 15,199
35
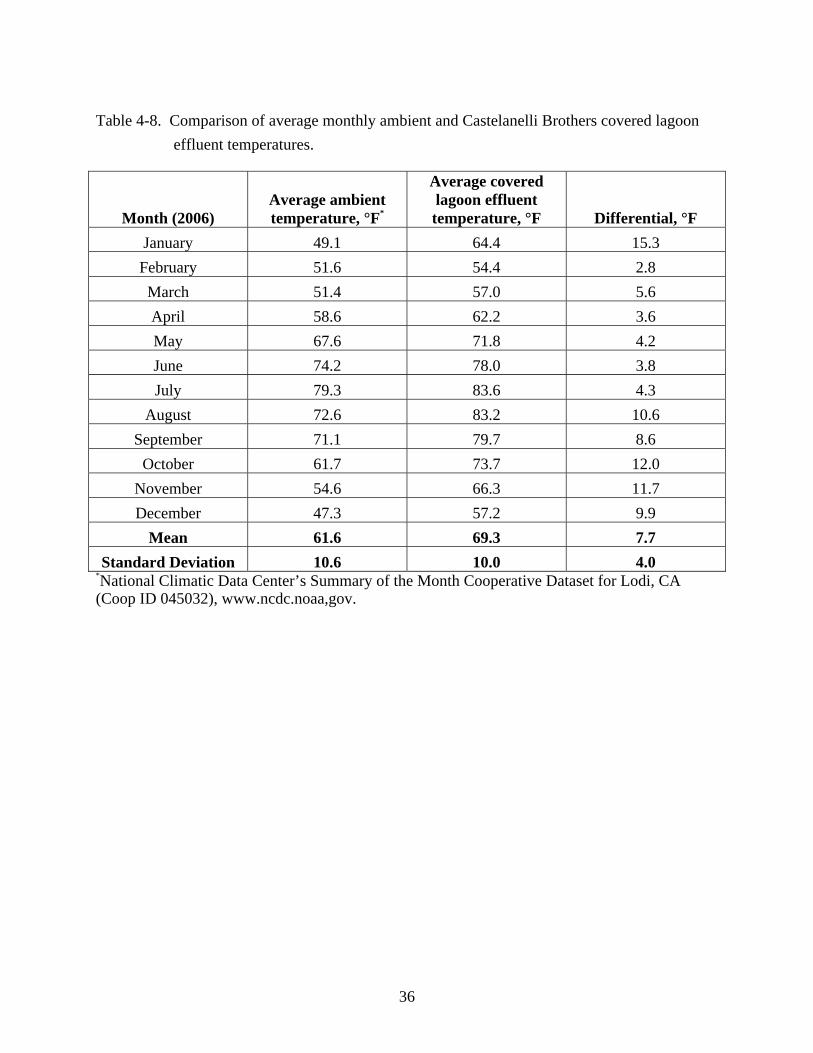
Table 4-8. Comparison of average monthly ambient and Castelanelli Brothers covered lagoon
effluent temperatures.
Month (2006)
Average ambient temperature, °F*
Average covered lagoon effluent temperature, °F
Differential, °F
January 49.1 64.4 15.3
February 51.6 54.4 2.8
March 51.4 57.0 5.6
April 58.6 62.2 3.6
May 67.6 71.8 4.2
June 74.2 78.0 3.8
July 79.3 83.6 4.3
August 72.6 83.2 10.6
September 71.1 79.7 8.6
October 61.7 73.7 12.0
November 54.6 66.3 11.7
December 47.3 57.2 9.9
Mean 61.6 69.3 7.7
Standard Deviation 10.6 10.0 4.0 *National Climatic Data Center’s Summary of the Month Cooperative Dataset for Lodi, CA (Coop ID 045032), www.ncdc.noaa,gov.
36

Table 4-9. Summary of Castelanelli Brothers Biogas Utilization.
Period
On-line Efficiency, engine-hours/day
Electricity Generated, kWh/day
Thermal Efficiency,
% 1/18-1/23/06 16.0 3,117 18.9 1/24-2/6/06 23.8 4,643 33.4 2/7-2/21/06 24.0 4,687 32.8 2/22-3/5/06 24.0 4,975 33.0 3/06-3/19/06 22.8 4,464 33.0 3/20-4/4/06 23.9 4,606 29.6 4/5-4/25/06 23.9 4,624 30.9 4/26-5/7/06 24.0 4,643 29.1 5/8-5/21/06 23.2 4,643 29.6 5/22-6/5/06 22.2 3,987 26.6 6/6-6/20/06 12.1 2,080 23.3 6/21-7/4/06 16.8 3,157 24.8 7/5-7/16/06 19.6 3,758 25.7 7/17-7/31/0- 16.9 3,047 24.5 8/1-8/13/06 21.0 3,854 24.7 8/14-9/5/06 22.5 4,091 23.2 9/6-9/24/06 20.8 4,037 27.8 9/25-10/8/06 23.6 4,621 27.7 10/9-10/22/06 23.9 4,636 27.4 10/23-11/6/06 24.0 4,640 29.3 11/7-11/26/06 23.9 4,580 28.0 11/27-12/10/06 24.0 4,607 28.5 12/11/06-1/8/07 23.1 4,466 28.0
Mean 21.7 4,172 27.8 Standard deviation 3.3 715 3.6
Coefficient of variation, %
15.1
17.1
13.0
37

Table 5-1. Comparison of the performance of the Castelanelli covered lagoon with the Gordondale Farms and the AA Dairy plug-flow, anaerobic digesters with respect to indicator organism reduction.
Parameter
Castelanelli Brothers
Dairy
Gordondale Farms#
AA Dairy*
Fecal coliforms, log10 1.1 2.3 2.8
Fecal streptococcus, log10
0.6 1.3 — *Martin, 2005 #Martin, 2003 Table 5-2. Comparison of annual cash flows for the Castelanelli covered lagoon and biogas
utilization system without and with income from surplus electricity delivered to PG&E.
Without income from surplus electricity
With income from surplus electricity@ $0.0605 per kWh
Annual revenue from biogas generated electricity used on-
site @ $0.103 per kWh $93,083 $93,083
Annual revenue from biogas generated electricity sold to
PG&E 0 $37,453
Gross annual income $93,083 $130,536
Annual operation and maintenance cost @ $0.02 per
kWh $22,842 $22,842
Net annual revenue $70,241 $107,694
38
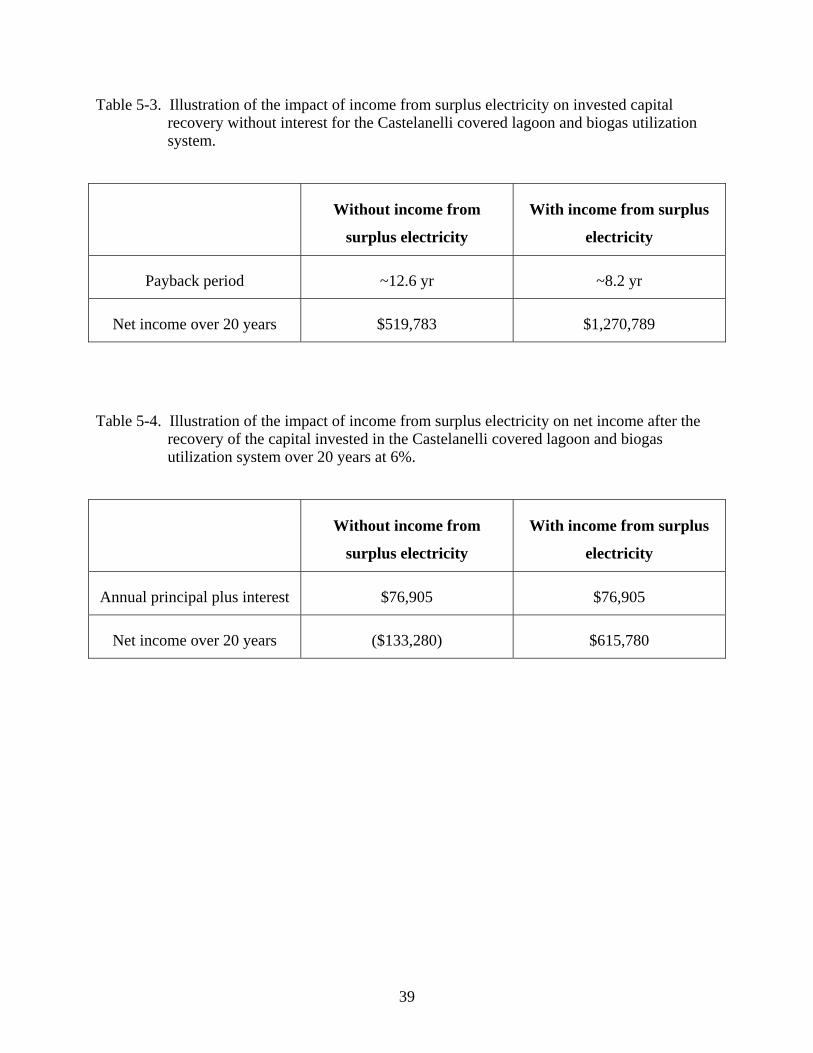
39
Table 5-3. Illustration of the impact of income from surplus electricity on invested capital recovery without interest for the Castelanelli covered lagoon and biogas utilization system.
Without income from
surplus electricity
With income from surplus
electricity
Payback period ~12.6 yr ~8.2 yr
Net income over 20 years $519,783 $1,270,789
Table 5-4. Illustration of the impact of income from surplus electricity on net income after the recovery of the capital invested in the Castelanelli covered lagoon and biogas utilization system over 20 years at 6%.
Without income from
surplus electricity
With income from surplus
electricity
Annual principal plus interest $76,905 $76,905
Net income over 20 years ($133,280) $615,780