Embed Size (px)
Citation preview

Rochester Institute of Technology Rochester Institute of Technology
RIT Scholar Works RIT Scholar Works
Theses
9-13-2016
An environmental lifecycle comparison of road deicers using An environmental lifecycle comparison of road deicers using
hybrid modeling techniques to capture effects during early hybrid modeling techniques to capture effects during early
processing stages processing stages
Mary Elizabeth Warner [email protected]
Follow this and additional works at: https://scholarworks.rit.edu/theses
Recommended Citation Recommended Citation Warner, Mary Elizabeth, "An environmental lifecycle comparison of road deicers using hybrid modeling techniques to capture effects during early processing stages" (2016). Thesis. Rochester Institute of Technology. Accessed from
This Thesis is brought to you for free and open access by RIT Scholar Works. It has been accepted for inclusion in Theses by an authorized administrator of RIT Scholar Works. For more information, please contact [email protected].
An environmental lifecycle comparison of road deicers
using hybrid modeling techniques to capture effects
during early processing stages
by
Mary Elizabeth Warner
A Thesis Submitted in Partial Fulfillment
of the Requirements for the Degree of
Master of Science in Sustainable Engineering
Department of Industrial and Systems Engineering
Kate Gleason College of Engineering
September 13, 2016
ii
Committee Members
Brian Thorn, Ph.D
Advisor
Professor
Industrial and Systems Engineering Department
Kate Gleason College of Engineering
Rochester Institute of Technology
Scott Grasman, Ph.D
Department Head, Professor
Industrial and Systems Engineering Department
Kate Gleason College of Engineering
Rochester Institute of Technology
Scott Wolcott, P.E
Professor
Civil Engineering Technology, Environmental Management and Safety
College of Applied Science and Technology
Rochester Institute of Technology

iii
Department of Industrial and Systems Engineering
Kate Gleason College of Engineering
Rochester Institute of Technology
Rochester, NY
CERTIFICATE OF APPROVAL
M.S. Degree Thesis
The M.S. Degree thesis of Mary E. Warner
has been examined and approved by the thesis
committee as satisfactory for the thesis
requirements for the Master of Science degree
Approved by:
Brian Thorn, Ph.D.
Scott Grasman, Ph.D.
Scott Wolcott, P.E.
iv
Table of Contents
Table of Contents ........................................................................................................................... iv
List of Figures ............................................................................................................................... vii
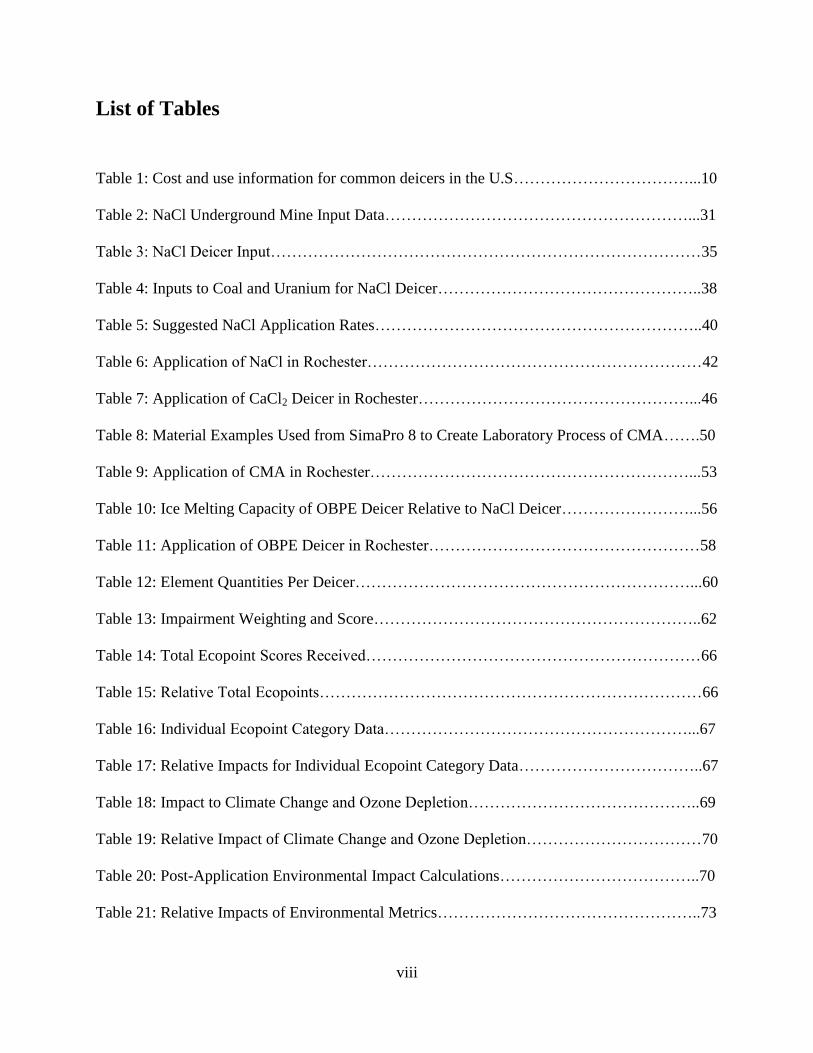
List of Tables ............................................................................................................................... viii
List of Nomenclature ...................................................................................................................... x
Abstract ......................................................................................................................................... xii
1. Introduction ............................................................................................................................. 1
1.1 Global Thermohaline Circulation ......................................................................................... 1
1.2 Goldilocks Range: Clausius-Clapeyron Relation ................................................................. 2
1.3 Current Weather Patterns ...................................................................................................... 3
1.4 Current Snow Removal ......................................................................................................... 4
2. Background ................................................................................................................................. 5
2.1 Current Road Deicers Use .................................................................................................... 5
2.2 Deicer Impacts ...................................................................................................................... 6
2.2.1 Impacts to Soil .......................................................................................................... 7
2.2.2 Impacts to Water ....................................................................................................... 7
2.2.3 Impacts to Vegetation ............................................................................................... 8
2.3 Usefulness of Lifecycle Assessment ..................................................................................... 9
3. Methodology ............................................................................................................................. 11
3.1 Problem Statement .............................................................................................................. 11
3.2 LCA Framework ................................................................................................................. 12
3.2.1 Scope ....................................................................................................................... 13
3.2.2 Functional Unit ....................................................................................................... 14
3.2.3 Impact Categories ................................................................................................... 15
3.2.4 System Boundaries.................................................................................................. 15
3.2.5 Additional Considerations ...................................................................................... 18
3.2.6 Lifecycle Inventory ................................................................................................. 18
3.2.7 Impact Assessment.................................................................................................. 19
v
3.2.8 Interpretation ........................................................................................................... 20
3.3 Post-Application Model ...................................................................................................... 20
3.3.1 Measuring Waterway Impacts ................................................................................ 21
3.3.2 Measuring Soil Structure Impact ............................................................................ 22
3.3.3 Measuring Human and Aquatic Health Impact ...................................................... 23
3.3.4 Environmental Impact Model ................................................................................. 23
4. Data Collection ......................................................................................................................... 25
4.1 Libraries and Databases ...................................................................................................... 25
4.2 Data Organization ............................................................................................................... 26
4.3 Case Study .......................................................................................................................... 26
4.4 Processes Creation .............................................................................................................. 27
5. SimaPro Model ......................................................................................................................... 27
5.1 NaCl Inputs ......................................................................................................................... 29
5.1.1 NaCl Material Creation ........................................................................................... 30
5.1.2 NaCl Application .................................................................................................... 39
5.1.3 NaCl Transportation................................................................................................ 42
5.2 CaCl2 Inputs ........................................................................................................................ 43
5.2.1 CaCl2 Material Creation .......................................................................................... 43
5.2.2 CaCl2 Application ................................................................................................... 44
5.2.3 CaCl2 Transportation .............................................................................................. 46
5.3 CMA Inputs ........................................................................................................................ 47
5.3.1 CMA Material Creation .......................................................................................... 47
5.3.2 CMA Application................................................................................................... 51
5.3.3 CMA Transportation ............................................................................................... 53
5.4 OBPE Inputs ....................................................................................................................... 54
5.4.1 OBPE Material Creation ......................................................................................... 55
5.4.2 OBPE Application .................................................................................................. 55
5.4.3 OBPE Transportation .............................................................................................. 59
5.5 Environmental Impact Inputs .............................................................................................. 59
6. Results ....................................................................................................................................... 63
6.1 SimaPro Results .................................................................................................................. 64
vi
6.2 Post-Application Results ..................................................................................................... 70
6.3 Results Overview ................................................................................................................ 72
6.4 Sensitivity Analysis ............................................................................................................ 73
6.4.1 Flat Rate Deicer Application Effects ...................................................................... 74
6.4.2 Varied Weight Scales ................................................................................................... 85
6.4.3 Sensitivity Analysis Results Summary ................................................................... 89
7. Discussion ................................................................................................................................. 90
7.1 Results Analysis and Interpretation .................................................................................... 90
7.2 Quantifying Results ............................................................................................................ 93
7.3 Impact of Post-Application Model ...................................................................................... 94
7.4 Relevance of Temperature .................................................................................................. 96
7.5 Considerations Out of Scope .............................................................................................. 97
8. Significance............................................................................................................................... 98
8.1 Significance of Results ....................................................................................................... 99
8.2 Significance of Model ....................................................................................................... 100
9. Future Work ............................................................................................................................ 101
10. Conclusion ............................................................................................................................ 102
11. References ............................................................................................................................. 104
12. Appendices ............................................................................................................................ 113
APPENDIX A: Weather Data ................................................................................................. 114
APPENDIX B: CaCl2 Calculations ........................................................................................ 119
APPENDIX C: Process Contributions .................................................................................... 121
APPENDIX D: NaCl Process Tree ......................................................................................... 124
APPENDIX E: CaCl2 Process Tree ........................................................................................ 126
APPENDIX F: OBPE Process Tree ........................................................................................ 128
vii
List of Figures
Equation 1: August-Roche-Magnus Formula……………………………………………………..3
Equation 2: CMA Chemical Equation………………………………………………………….. 48
Figure 1: Lifecycle Assessment Framework……………………………………………………..12
Figure 2: NaCl System Boundaries………………………………………………………………16
Figure 3: CaCl2 System Boundaries…………………………………………………………......16
Figure 4: CMA System Boundaries……………………………………………………………...17
Figure 5: OBPE System Boundaries……………………………………………………………..17
Figure 6: Inputs in SimaPro 8 to Create Dolomitic Lime Process……………………………….49
Figure 7: Total Ecopoints for Each Deicer………………………………………………………66
Figure 8: Relative Percentage of Impact…………………………………………………………67
Figure 9: Normalized Results of Climate Change Impacts from SimaPro 8…………………….68
Figure 10: Normalized Results of Ozone Depletion Contributions from SimaPro 8……………69
Figure 11: Post-Application Environmental Impact Scores……………………………………..71
Figure 12: Inputs for the Product Stages of Four Deicers for Flat Rate Sensitivity Analysis…...75
Figure 13: Total Ecopoints for Deicers with Flat Rate Quantity Applied……………………….78
Figure 14: Relative Percentage of Impact from Ecopoints for Flat Rate Quantity of Deicer……79
Figure 15: Normalized Impacts to Climate Change Using Flat Rate Quantity of Deicer……….80
Figure 16: Normalized Impacts to Ozone Depletion Using Flat Rate Quantity of Deicer……...80
Figure 17: Total Environmental Impact Score for Flat Rate Deicer Quantity…………………...84
Figure 18: Graphical Display of Impacts from Equal Weights in Post-Application Model……..86
Figure 19: Graphical Display of Impacts from 1, 3, 5 Weights in Post-Application Model…….88
Figure 20: CMA Deicer Network from SimaPro 8………………………………………………92
viii
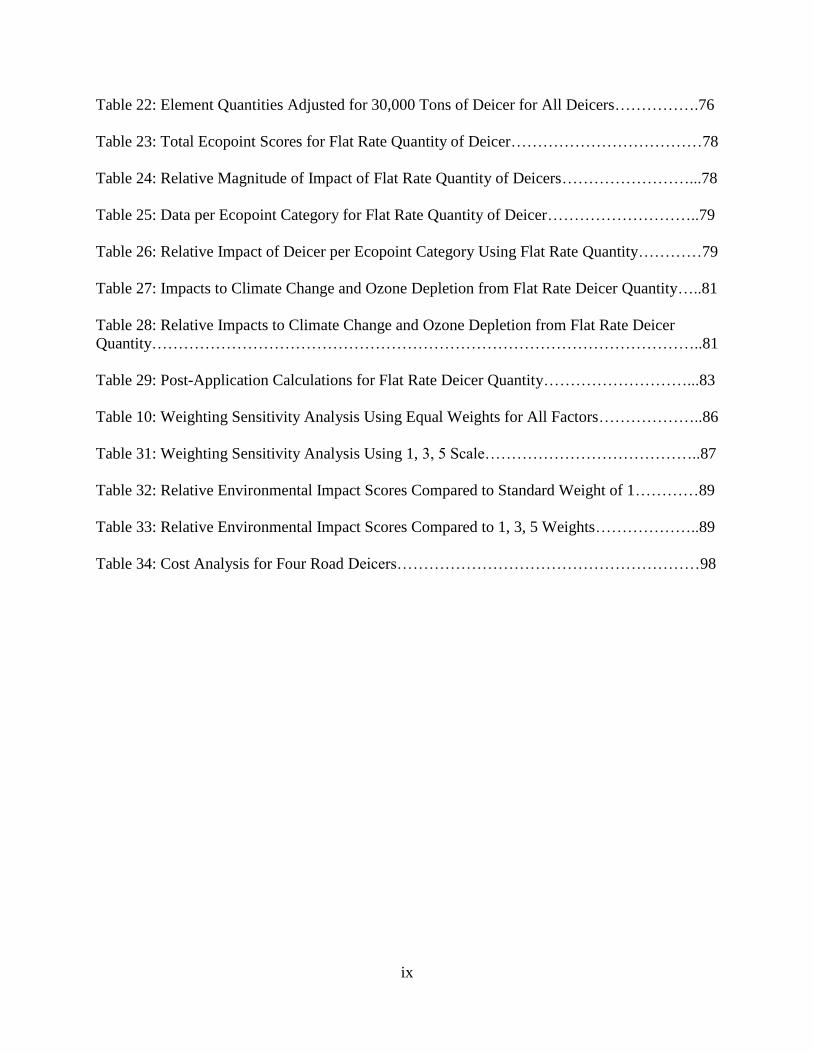
List of Tables
Table 1: Cost and use information for common deicers in the U.S……………………………...10
Table 2: NaCl Underground Mine Input Data…………………………………………………...31
Table 3: NaCl Deicer Input………………………………………………………………………35
Table 4: Inputs to Coal and Uranium for NaCl Deicer…………………………………………..38
Table 5: Suggested NaCl Application Rates……………………………………………………..40
Table 6: Application of NaCl in Rochester………………………………………………………42
Table 7: Application of CaCl2 Deicer in Rochester……………………………………………...46
Table 8: Material Examples Used from SimaPro 8 to Create Laboratory Process of CMA…….50
Table 9: Application of CMA in Rochester……………………………………………………...53
Table 10: Ice Melting Capacity of OBPE Deicer Relative to NaCl Deicer……………………...56
Table 11: Application of OBPE Deicer in Rochester……………………………………………58
Table 12: Element Quantities Per Deicer………………………………………………………...60
Table 13: Impairment Weighting and Score……………………………………………………..62
Table 14: Total Ecopoint Scores Received………………………………………………………66
Table 15: Relative Total Ecopoints………………………………………………………………66
Table 16: Individual Ecopoint Category Data…………………………………………………...67
Table 17: Relative Impacts for Individual Ecopoint Category Data……………………………..67
Table 18: Impact to Climate Change and Ozone Depletion……………………………………..69
Table 19: Relative Impact of Climate Change and Ozone Depletion……………………………70
Table 20: Post-Application Environmental Impact Calculations………………………………..70
Table 21: Relative Impacts of Environmental Metrics…………………………………………..73
ix
Table 22: Element Quantities Adjusted for 30,000 Tons of Deicer for All Deicers…………….76
Table 23: Total Ecopoint Scores for Flat Rate Quantity of Deicer………………………………78
Table 24: Relative Magnitude of Impact of Flat Rate Quantity of Deicers……………………...78
Table 25: Data per Ecopoint Category for Flat Rate Quantity of Deicer………………………..79
Table 26: Relative Impact of Deicer per Ecopoint Category Using Flat Rate Quantity…………79
Table 27: Impacts to Climate Change and Ozone Depletion from Flat Rate Deicer Quantity…..81
Table 28: Relative Impacts to Climate Change and Ozone Depletion from Flat Rate Deicer
Quantity…………………………………………………………………………………………..81
Table 29: Post-Application Calculations for Flat Rate Deicer Quantity………………………...83
Table 10: Weighting Sensitivity Analysis Using Equal Weights for All Factors………………..86
Table 31: Weighting Sensitivity Analysis Using 1, 3, 5 Scale…………………………………..87
Table 32: Relative Environmental Impact Scores Compared to Standard Weight of 1…………89
Table 33: Relative Environmental Impact Scores Compared to 1, 3, 5 Weights………………..89
Table 34: Cost Analysis for Four Road Deicers…………………………………………………98
x
List of Nomenclature
' Feet
" Inches
$ US Dollars
ARS American Rock Salt
BOM Bill of Material
Ca Calcium
CaCl2 Calcium Chloride
CaMg2(CH3COO)6 Calcium Magnesium Acetate
CH3CO2K Potassium Acetate
Cl Chloride
CMA Calcium Magnesium Acetate
CO2 Carbon Dioxide
DALY Disability-adjusted life year
DO Dissolved Oxygen
DOT Department of Transportation
EOL End of Life
EPA Environmental Protection Agency
Eq Equivalent
ft Feet
gal Gallons
GHG Greenhouse Gas
HCOONa Sodium Formate
in Inches
ISO International Organization for Standardization
kg Kilograms
kW Kilowatts
kWh Kilowatt-hours
lb Pounds
LCA Lifecycle Analysis

xi
LCI Lifecycle Inventory
LM Lane-miles
m Meters
m2 Square meters
m2a Square meter-years
m3 Cubic meters
Mg Magnesium
MPtMegapoint
MJ Megajoules
Na Sodium
NaCl Sodium Chloride
NOx Nitrogen Oxides
NOAA National Oceanic and Atmospheric Association
NYC New York City
OBPE Organic Based Performance Enhancer
P Unit
SO2 Sulfur Dioxide
ROC Rochester
SOx Sulfur Oxides
t Tons
TDS Total Dissolved Solids
tkm Tonne-kilometers
US United States
USD U.S. Dollars
USGS United States Geological Survey
xii
Abstract
For decades the United States has relied on application of road deicers for the purpose of winter
road maintenance to provide safe transportation for the majority of U.S. commuters in northern
states. Road deicers are a necessity but are linked to contamination of surrounding environments,
including effects on water systems, vegetation, and soil quality. While sodium chloride is the
most common road deicer, a variety of alternatives have been implemented. Each deicer
alternative has different deicing abilities and a range of environmental impacts that, thus far,
have primarily been compared during their application phase. This research conducts an
environmental lifecycle analysis of four road deicers in order to incorporate the manufacturing,
processing, transportation, and distribution phases along with the effects associated with the
product’s end-of-life application. The four road deicers that are investigated include sodium
chloride, calcium chloride, magnesium chloride acetate, and beet juice molasses (OBPE). They
are evaluated based on a case study performed in Rochester, New York. This case study is used
to represent population densities and environmental composition in regions where this research
would be most applicable. This paper offers a framework to holistically compare environmental
effects of road deicers pre- and post- application.
Keywords Lifecycle assessment, Life Cycle Analysis, Deicer, Industrial Engineering, Winter Road
Maintenance, OBPE, Beet Juice Molasses
1
1. Introduction
Climate change trends and effects have been widely observed on a global scale, but the ways in
which climate change manifests itself varies regionally. Temperatures have been rising globally,
but within the contiguous United States the land area receiving what is defined as “unusually
light snowfall” has remained relatively constant since the mid-1970’s (Kunkel et al., 2013).
Within the past 50 years the United States has, in fact, seen more than twice the number of
extreme snowstorms observed in the preceding 60 years. Of these extreme snowstorms in the
U.S., over one third have been in winter seasons with warmer-than-average temperatures and
approximately 30% have been during winter seasons with lower-than-average precipitation
(Kunkel et al., 2013).
1.1 Global Thermohaline Circulation
It is believed that some regions, both globally and within the United States, may experience
cooler than average temperatures due to slowing of the Global Thermohaline Circulation and the
weakened Gulf Stream (Wursch, 2002). Global Thermohaline Circulation refers to the way in
which ocean water is transported throughout the globe and the “overturning” effect in which
warm water and cool water travel and displace each other. Although there are many components
to determine oceanic movements, the transportation of heat and salinity are the key components
to what define Global Thermohaline Circulation (Tyrell, 2011). When temperatures warm,
average surface water temperature increases and therefore is less dense than the deeper, cooler
waters. In areas where those warm surface waters may begin to cool and sink, an increase of
fresh water has entered the oceans from the melting of ice caps and glaciers; this prevents the
surface waters from sinking. Therefore, the process in which the ocean waters overturn and are
constantly at evolving temperatures and salinity levels will slow.
2
What becomes problematic is that the slower rates of overturned water result in decreased rates
of warmer surface water being brought north. Water that is brought north in this process serves
to replace the colder North Atlantic waters. Because water temperatures are highly correlated
with air temperatures, it is predicted that Western Europe and land masses located in or adjacent
to the North Atlantic region could see cooler temperatures by several degrees dependent on the
rate of slowed Global Thermohaline circulation (Tyrell, 2011). In its current state, the
overturning and circulation has slowed by 15-20% over the twentieth century and therefore may
contribute further to seeing cooler temperatures in some regions despite overall global warming
(Rahmstorf et al., 2015).
1.2 Goldilocks Range: Clausius-Clapeyron Relation
At the same time, many more areas are seeing warmer temperatures as a result of human-induced
climate change. Although it is often assumed that warmer temperatures result in a decrease of
snow, this is not true for many regions, especially within the United States (IPCC, 2007a). The
ideal temperature for snowfall typically lies somewhere in the range of 28°F and 32°F. This
temperature range is colloquially referred to as the “Goldilocks Range,” because temperatures
too high (above 32°F) produce precipitation as rain, but when temperatures are just below
freezing the atmosphere can still hold higher concentrations of moisture and is therefore more
likely to produce snowfall (Lawrence, 2005).
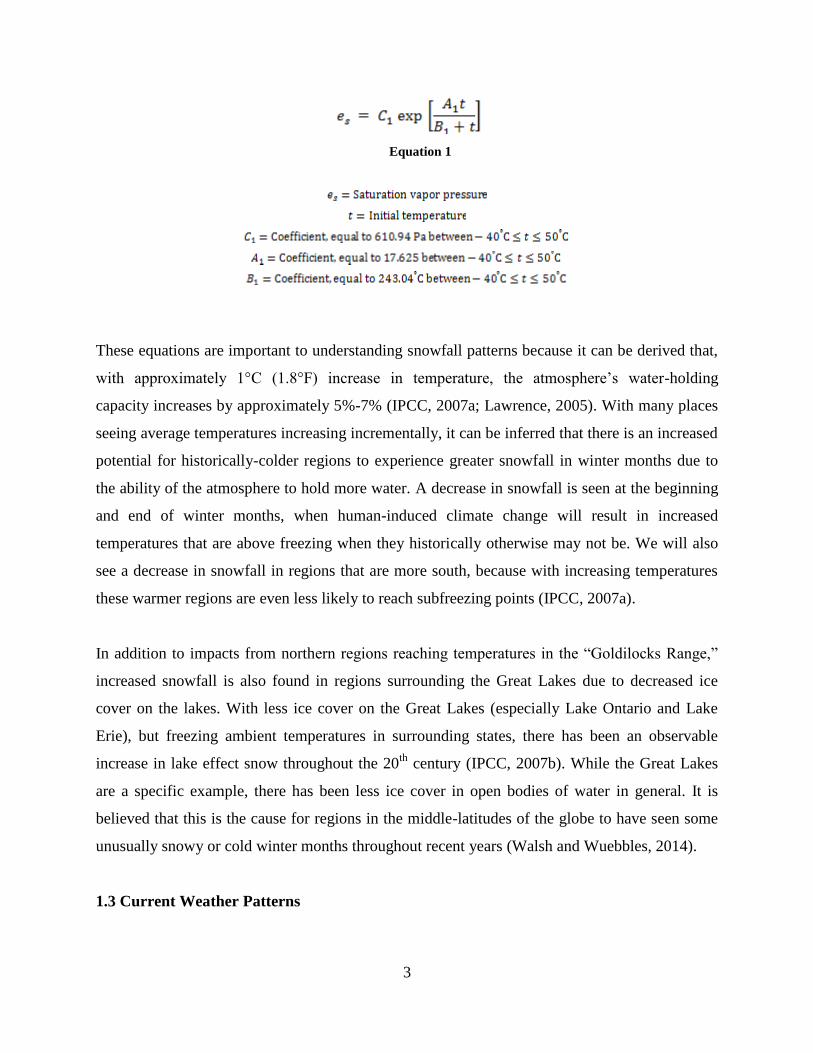
This “Goldilocks” phenomenon is a product of the August-Roche-Magnus formula (in some
cases known as the Magnus Formula) and Clausius-Clapeyron relation. The August-Roche-
Magnus formula (Equation 1) provides the equation indicating that saturation vapor pressure is
dependent on temperature. From this formula can be derived the Clausius-Clapeyron relation,
which uses the relationship between pressure and temperature to determine vapor pressure in the
atmosphere at any given temperature (Lawrence, 2005).
3
Equation 1
These equations are important to understanding snowfall patterns because it can be derived that,
with approximately 1°C (1.8°F) increase in temperature, the atmosphere’s water-holding
capacity increases by approximately 5%-7% (IPCC, 2007a; Lawrence, 2005). With many places
seeing average temperatures increasing incrementally, it can be inferred that there is an increased
potential for historically-colder regions to experience greater snowfall in winter months due to
the ability of the atmosphere to hold more water. A decrease in snowfall is seen at the beginning
and end of winter months, when human-induced climate change will result in increased
temperatures that are above freezing when they historically otherwise may not be. We will also
see a decrease in snowfall in regions that are more south, because with increasing temperatures
these warmer regions are even less likely to reach subfreezing points (IPCC, 2007a).
In addition to impacts from northern regions reaching temperatures in the “Goldilocks Range,”
increased snowfall is also found in regions surrounding the Great Lakes due to decreased ice
cover on the lakes. With less ice cover on the Great Lakes (especially Lake Ontario and Lake
Erie), but freezing ambient temperatures in surrounding states, there has been an observable
increase in lake effect snow throughout the 20th
century (IPCC, 2007b). While the Great Lakes
are a specific example, there has been less ice cover in open bodies of water in general. It is
believed that this is the cause for regions in the middle-latitudes of the globe to have seen some
unusually snowy or cold winter months throughout recent years (Walsh and Wuebbles, 2014).
1.3 Current Weather Patterns
4
The slowing of the Global Thermohaline has caused some northern regions adjacent to the North
Atlantic to experience more severe winter weather conditions. Additionally, other northern
regions throughout the globe are seeing temperatures more ideal for holding water in the
atmosphere. Therefore we have many reasons to believe that fluctuations in snowfall will
continue to impact our daily lives.
Increased rates of urbanization and a continuously growing population mean that, specifically
within the U.S., we are increasingly in demand of efficient snow-removal methods to assure safe
commutes (Morgan, 2014). Within the last two years many major metropolitan areas have been
faced with extreme snowfalls and blizzards, and snow removal has been critical in returning
cities like these to normal operations. Examples include the blizzard, entitled Winter Storm
Jonas, which hit the east coast on January 23, 2016. This blizzard caused 11 states to declare
states of emergency due to the high volumes of snowfall, ranging from 18 to 48 inches of
accumulation throughout the affected areas (Osborne, 2016). In a similar fashion, the winter
storms that hit Boston in January and February of 2015 resulted in breaking the record for the
most snow in a 30-day period as well as the record for 2014-2015 being the snowiest winter
season in history (NOAA, 2016). While these may seem like isolated events, it is important to
note that Boston has seen four of its five snowiest winter seasons within the last 22 years
(NOAA, 2016).
There is now evidence that indicates the Great Lakes and Great Plains regions in the U.S have
seen an increase in total seasonal snowfall, and the Midwest and Northeast have seen heavier
snowfalls in the past 10-20 years (Walsh and Wuebbles, 2014). If we continue to see extreme
winter events occurring, such as these, it only increases the importance of evaluating snow-
removal procedures.
1.4 Current Snow Removal
Deicing of roads has been the primary method for maintaining safe and clear winter roadways
since the early 20th
century, but recent research indicates a wide range of environmental effects
from common road deicers (Warner and Ayotte, 2014). Because the demand for and use of road
5
deicers has been increasing since the 1950’s, it is important to take a holistic approach to
analyzing long-term environmental impacts of commercially-available road deicers, particularly
in the face of changing climate (Warner and Ayotte, 2014). The efficiencies of deicers will vary
based upon changes in climate, including factors such as how frequently deicer will need to be
applied, the depth and severity of snowfall events, ambient temperatures during snowfall, and
other factors that have changed since the 1950’s even though road salt remains our primary
deicer. In order to make a recommendation on the least environmentally impactful deicer these
factors need to be considered.
2. Background
Although many road deicers have been studied, still many research gaps exist. Providing
comprehensive information on snow removal processes is essential for the purpose of safety,
efficiency, and protection of surrounding environments. In order to evaluate and understand what
research areas have been filled and where the research gaps lie, background information has been
compiled and the literature has been reviewed.
A lifecycle analysis is the suggested method with which to conduct research on road deicers. A
lifecycle analysis provides comprehensive and comparable results on impacts to the environment
by analyzing inputs and impacts during all lifecycle stages. The compiled information in this
section is critical to understanding and creating a thorough lifecycle analysis because lifecycle
analyses require large datasets.
2.1 Current Road Deicers Use
Sodium chloride (NaCl) is the most common road deicer in the United States with application
rates of approximately 15 million tons per year nationwide (USEPA, 2010). Road deicing has
been used on a large scale to clear roads since the 1950’s, but application and use have tripled
6
since the 1970’s (Warner and Ayotte, 2014). Highway deicing consumes 43% of the total salt in
use in the U.S. (Kostick, 2010). The northeastern United States is one of the largest consumers of
road salt due to its weather conditions and concentrated populations, with New York State being
the largest consumer of NaCl for winter maintenance throughout the United States. New York,
alone, applies 836,020 tons of untreated NaCl to public roads annually (Lashmet and Thompson,
2012).
Factors such as urbanization have also increased the amount of deicing substances found in the
environment. Urbanization increases the demand for paved roadways and, as a result, also
increases the demand for deicers. An increase of approximately 2.5 to 2.9 times the amount of
deicer is found in surrounding environments after urban development begins (Kelting, Laxson, &
Yerger, 2012). These surrounding environments can be significantly impacted because
approximately 55% of chloride ions from deicers are transported directly to waterways and the
remaining 45% infiltrate soils (Fishel, 2001).
In recent years some states and regions have begun to experiment with using alternative road
deicers to mitigate impacts and demand for NaCl. Common alternatives include, but are not
limited to, CaCl2 (Calcium Chloride), MgCl2 (Magnesium Chloride), CaMg2 (CH3COO)6
(Calcium Magnesium Acetate), CH3CO2K (Potassium Acetate), HCOONa (Sodium Formate),
and byproduct additives (Robidoux and Delisle, 2001; Fu et al., 2012). In most cases, these
alternative deicers are used as a secondary or temporary option and therefore widespread concern
over their environmental impacts has not yet occurred.
2.2 Deicer Impacts
The intention for seeking an alternative deicer is to reduce the environmental impacts from the
application of NaCl. The intended goal is to reduce NaCl impacts to the environment either
through the increased effectiveness of the alternative deicer products or by the reduction of
harmful molecules and ions to the environment. For example, even at very high concentrations,
the acetate deicers are not known to cause osmotic stress and have decreased impacts to soils and
water (Kelting and Laxson, 2010). Agricultural byproducts are typically used as additives and
7
therefore reduce the need for the base substance to which they are being applied (Fu et al., 2012).
There are many known harmful impacts to the environment as a result of NaCl application, yet
high costs and lower availability of alternative deicers have been the primary inhibitors to their
widespread use. The increase in research and concern over deicer use has the potential to impact
these inhibiting factors (USEPA, 2010; Robidoux and Delisle, 2001; Fu et al., 2012).
2.2.1 Impacts to Soil
Deicing has been linked to many negative environmental impacts as a result of runoff and/or
bouncing off the pavement during the application process. Chloride-based deicers, which are
currently the most common deicers in the U.S., have been linked to increasing the infiltration of
heavy metals in soil (Kelting and Laxson, 2010). Initial introduction of heavy metals to the
environment is often from fuels, traveling vehicles, and surrounding road infrastructure. These
metal pollutants remain as one of the greatest concerns to the environment due to their long-term
toxicity (Kelting, Laxson, & Yerger, 2012).
Soils closest to roadways have indicated metal concentrations—including Cd, Cr, Cu, Pb, Ni,
and Zn—up to 30 times greater than the reference point (Mayer, Rochfort, Borgman, &
Snodgrass, 2007). Detected metals are most concentrated within the top five centimeters of soil
(USEPA, 2006). Chloride-based deicers not only permeate the soil themselves, but also risk
contributing to the leaching of these heavy metals to further depths in the soils (Klufe,
Werkenthin, & Wessolek, 2014).
2.2.2 Impacts to Water
Water is also impacted by deicers, with most current research emphasizing the impacts of NaCl
and other chloride-based deicers. Chloride levels can increase up to 66 times in small, low-
flowing waterways within 300 feet of highways that have recently been deiced. These high levels
of chloride to the environment can persist for up to half a year if dilution is slow (Fishel, 2001).
8
Road deicing remains one of the primary sources of NaCl to watersheds. Although sewage and
water softeners are often cited as potential contributors, it has been found that these two sources
only account for 4% and 3% of NaCl loads in watersheds, respectively (Kelting, Laxson, &
Yerger, 2012). Agricultural practices have also been linked to runoff to the environment but their
primary contribution to the environment is nitrates (Warner and Ayotte, 2014).
Dilution of accumulated deicer may occur during spring seasons and times in which more
freshwater melt occurs (USEPA, 2006). Although it is rare for ions from road deicers to be
present in water at acute toxicity levels, there is a growing concern for small, freshwater ponds
and streams that may meet the aquatic chronic toxicity level standards. The standards, as set by
the US Environmental Protection Agency (EPA), correlate to 860 mg/L over one hour (chloride-
based) for acute toxicity and 230 mg/L over four days for chronic toxicity (Fishel, 2001).
Continued exposure of a water system to elevated chloride levels can lead to eutrophication,
anoxia, and osmotic stress on ecosystems (Kelting and Laxson, 2010).
Alternative deicers have the potential to impact waterways, but the EPA is currently most
concerned with chloride levels. The EPA has set specific human and aquatic health standards for
chloride. Current deicers and their alternatives have the greatest potential to impact turbidity,
total dissolved solids (TDS) or specific conductance, and dissolved oxygen content. (USGS, n.d.)
2.2.3 Impacts to Vegetation
Impacts of deicers on soil and water quality will also affect surrounding flora and fauna. It is
estimated that 5-10% of trees within 100ft of roadways die as a direct result of chloride exposure
(Fishel, 2001). Concentrations of 70-140 ppm of chloride in water or soil will result in damage to
sensitive roadside flora and concentrations of 140-350 will damage tolerant species (Warner and
Ayotte, 2014; Kelting and Laxson, 2010). This indicates that road deicing may encourage growth
of invasive, more salt tolerant species and reduce biodiversity (Kelting, Laxson, and Yerger,
2012). In addition, it is estimated that as much as 10% of all aquatic species in surrounding
ponds and streams are adversely affected by chronic exposure to chloride toxicity (Gardner and
Royer, 2010).

9
Impacts to flora and fauna may occur from non-chloride based deicers as well, but these impacts
have not been extensively studied as a direct result of deicing. Input of solids to the environment
has the ability to vary levels of dissolved oxygen (D.O.), change pH, and increase concentrations
of total dissolved solids (T.D.S.), which could impact flora and fauna (Warner and Ayotte,
2014).
2.3 Usefulness of Lifecycle Assessment
Concerns associated with use of alternative deicers include the environmental impacts from
material inputs and manufacturing processes associated with each product. Little quantitative and
comparable research has been done to analyze the environmental impacts associated with
laboratory work, mining, agricultural production, etc. to create alternative deicers. Although
research is extensive with regards to environmental impacts once deicers have been applied to
roadways (application and post-application phase), environmental impacts such as emissions and
resource depletion associated with earlier lifecycle phases of deicers have yet to be
comprehensively explored nor compared alongside application effects.
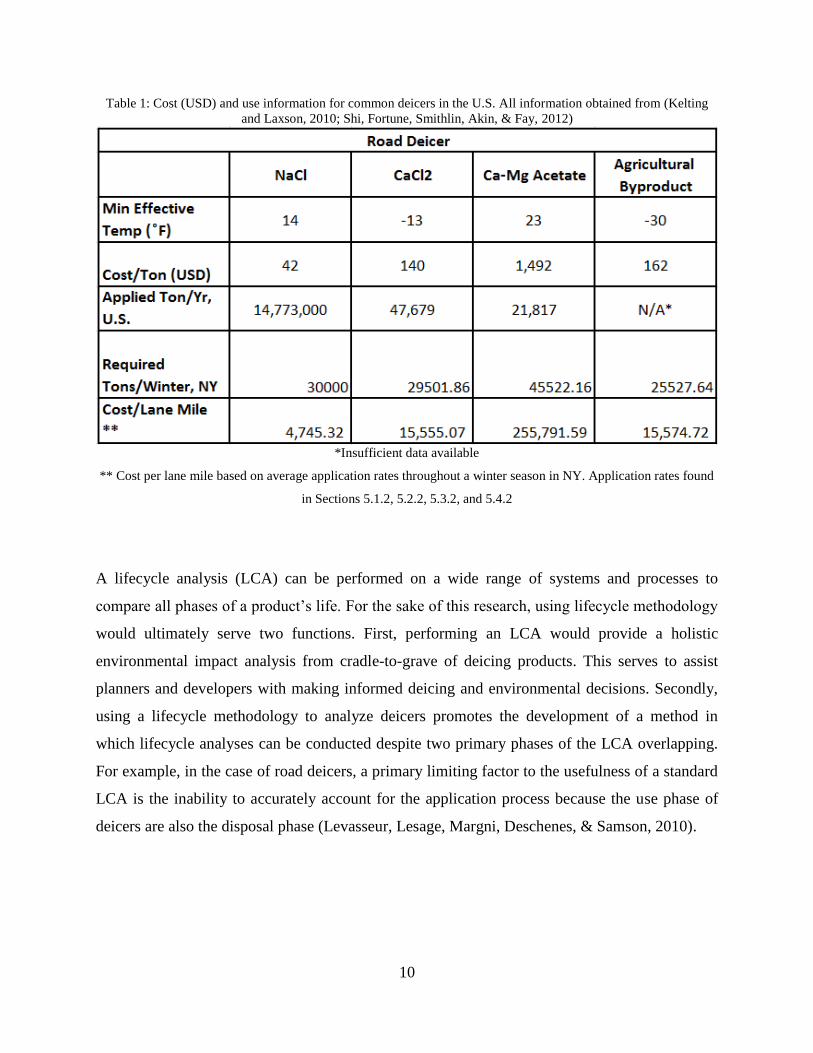
Common road deicers vary in their effectiveness, with each deicer being optimally effective at
different temperatures and under different conditions (Table 1). A lifecycle analysis can
equitably capture the environmental impacts associated with all lifecycle phases by using a
functional unit that reflects the differences in deicer effectiveness. For example, the use of a
functional unit would capture the difference between a deicer that is 100% effective at 20 F
versus another deicer that is only 50% effective at 20 F.
10
Table 1: Cost (USD) and use information for common deicers in the U.S. All information obtained from (Kelting
and Laxson, 2010; Shi, Fortune, Smithlin, Akin, & Fay, 2012)
*Insufficient data available
** Cost per lane mile based on average application rates throughout a winter season in NY. Application rates found
in Sections 5.1.2, 5.2.2, 5.3.2, and 5.4.2
A lifecycle analysis (LCA) can be performed on a wide range of systems and processes to
compare all phases of a product’s life. For the sake of this research, using lifecycle methodology
would ultimately serve two functions. First, performing an LCA would provide a holistic
environmental impact analysis from cradle-to-grave of deicing products. This serves to assist
planners and developers with making informed deicing and environmental decisions. Secondly,
using a lifecycle methodology to analyze deicers promotes the development of a method in
which lifecycle analyses can be conducted despite two primary phases of the LCA overlapping.
For example, in the case of road deicers, a primary limiting factor to the usefulness of a standard
LCA is the inability to accurately account for the application process because the use phase of
deicers are also the disposal phase (Levasseur, Lesage, Margni, Deschenes, & Samson, 2010).
11
3. Methodology
In order to perform a lifecycle analysis comparing various road deicers, multiple tools must be
used to conduct and organize research. Microsoft Excel will be used as a platform to which data
can be exported and organized and will provide visual graphics and information displays. A
standard lifecycle analysis will be conducted using SimaPro 8 for all pre-application deicer
processes. Results from SimaPro 8 will be exported to Excel, in which the data can be compared
and analyzed alongside the impacts from the post-application phases. Post-application processes
will be determined based upon calculated rates at which deicers enter the environment, and
quantifiable measures of impact. Data from all lifecycle phases will be manipulated in Excel in
order to compare and contrast the potential effects of each deicer.
3.1 Problem Statement
The goal of this study is to account for all lifecycle phases of road deicers by using lifecycle
assessment methodology. Deicers are a necessity in clearing roadways and maintaining
transportation safety in the winter. Because the application of deicers is necessary, it is important
to have a holistic understanding of their impacts to the environment and the ability to make
informed decisions. Due to changing global temperatures and weather patterns, impacts to the
environment from deicer choices are of increasing concern.
Most research on deicing has been done with respect to the impacts on the environment once a
deicer has been applied, but many environmental impacts are associated with the production,
transportation, and earlier processing. As a result, pre-application impacts of deicers cannot be
ignored when making an informed, environmentally-conscious decision. Therefore, unlike
previous research that focuses on environmental effects of deicers once applied to roadways, this
research aims to quantify impacts of deicers at all lifecycle stages. The goal is to create a
methodology based on lifecycle assessment framework in order to compare the environmental
impacts at all stages and determine which road deicer is the least environmentally impactful
(Fishel, 2001). The primary purpose is to provide a comprehensive analysis of the impact of road
12
deicers to the environment—pre- and post-application—and the secondary purpose of this
research is to serve as a model for similar products in which the use phase and disposal phase of
an LCA overlap.
The research questions can be posed as: (1) which road deicer is least environmentally impactful
throughout its entire lifecycle? and (2) how can we accurately capture the impacts at all stages?
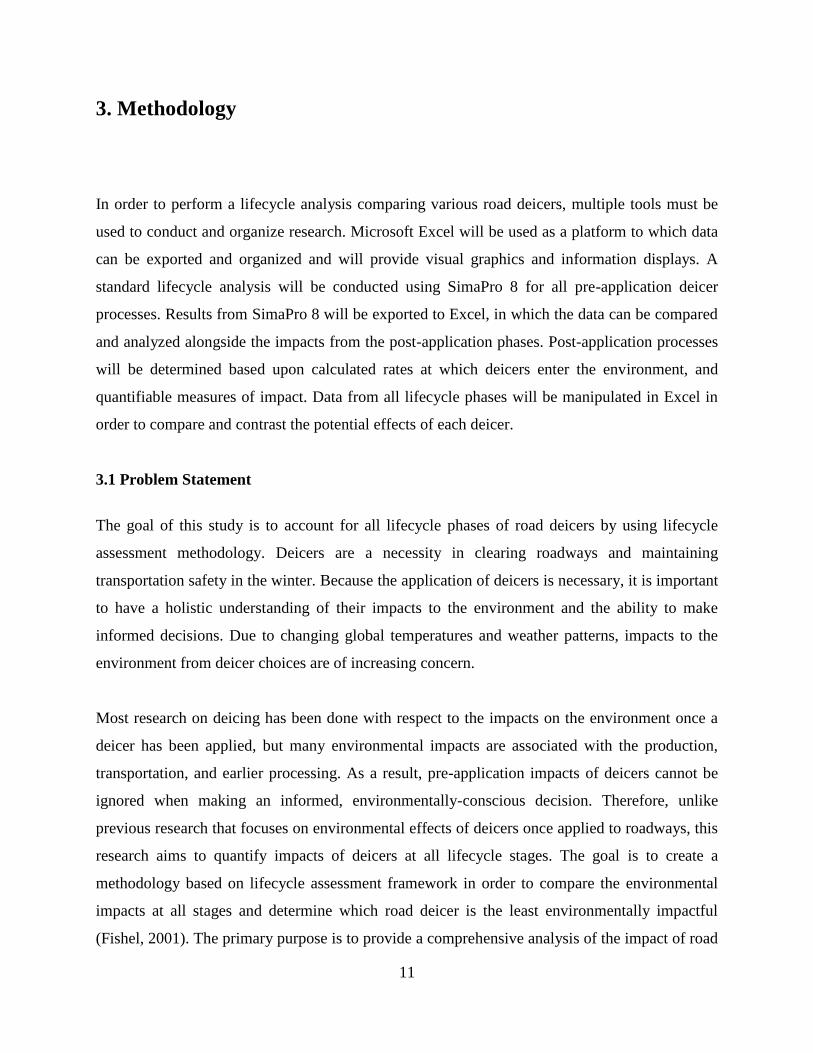
3.2 LCA Framework
Standard lifecycle analyses are based upon the framework and standards of ISO 14040:2006
“Environmental management - Life cycle assessment - Principles and framework” and ISO
14044:2006 “Environmental management - Life cycle assessment - Requirements and
guidelines” which are outlined in Figure 1 (International Organization of Standardization, n.d.).
This framework is used to guide this research and establish system boundaries. The LCA
framework, as outlined by these standards, will be adhered to as closely as possible. This
research, though, will not be referred to as a “Lifecycle assessment” because it does not undergo
the ISO requirement of review by LCA practitioners. Instead, the methodology in this research
will be referred to as a lifecycle analysis. From this point forward an LCA will refer solely to the
lifecycle analysis being performed in this paper.
Figure 1 - Lifecycle Assessment Framework
13
3.2.1 Scope
The first step in performing an LCA is to create a specific goal and scope. This process includes
outlining what will be modeled, defining the functional unit, determining impact categories and
methods, and defining system boundaries and data quality (Baumann and Tillman, 2004).
This analysis will attempt to gather the environmental effects of four primary road deicers using
a cradle-to-grave methodology. The four road deicers that are being studied include sodium
chloride (NaCl), calcium chloride (CaCl2), calcium magnesium acetate (CMA), and an
agricultural byproduct of sugar beets known as an organic-based performance enhancer (OBPE).
These four deicers have been selected based upon their variety in chemical composition and
proven effectiveness.
NaCl was chosen because it represents the most commonly used road deicer in America. CaCl2
was chosen because (1) it is a common secondary choice of road deicer, (2) it will still be
representative of chloride-based deicers, and (3) it is effective at temperatures well below NaCl
(Kelting and Laxson, 2010). CMA was chosen because (1) scientific literature indicates the
potential for decreased environmental impacts from application (Kelting and Laxson, 2010) and
(2) it is representative of a non-chloride based alternative that has had some success (Fishel,
2001). Finally, OBPE is being used in this study to represent the use of agricultural byproducts in
deicing. More specifically we are interested in determining if there is substance to the rhetoric
that a natural, agricultural substitute would offset environmental impacts to road deicing.
All deicers, by definition, are applied once snowfall has begun. This is unlike anti-icing, which is
a preventative application measure that typically consists of a liquid being sprayed on to
pavement. All deicers in this study must be in solid form in order to be effective, including CaCl2
and OBPE; CaCl2 and OBPE most commonly occur in liquid states and can also be used in anti-
icing applications. Therefore, NaCl and CMA will remain in their pure, solid form and CaCl2 and
OBPE will be used as additives.
14
Although agricultural byproduct additives are currently being tested in many forms, including
but not limited to pickle brine, cheese brine, ethanol, and urea, the basis on which these additives
contribute to the deicing process is the reaction of their natural sugars in combination with the
solid deicer base (Shi, Fortune, Smithlin, Akin, & Fay, 2012). Sugar beet molasses has been
chosen as the agricultural byproduct additive in this study because it is the additive with the most
readily available information.
NaCl will be the assumed base substance to which the additives are applied because it is the least
expensive and most readily available deicer per ton (Kelting and Laxson, 2010). The additives
could be combined with any dry, solid form of deicer, but NaCl is considered the base in this
research because it is the most economically feasible deicer and likely to be used in practice.
3.2.2 Functional Unit
The functional unit will be the amount of deicer necessary to clear roads for one winter season.
This is equivalent to the amount of deicer needed to clear 1,602.1 lane miles, which is the
number of lane miles contained within the City of Rochester (a case study used for the purpose
of this research and discussed further in Section 4.2) (City of Rochester, n.d.). A lane mile (LM)
is the common measurement used for deicing practices within the Department of Transportation
(DOT). This measurement accounts for the number of miles of lanes of road. It is important to
use lane miles because deicing practices are determined based upon clearing each lane of road.
This functional unit was chosen because the primary function of deicing is to provide safe and
effective roadway transportation and this functional unit will preserve the differences in
application quantities (Kelting and Laxson, 2010). More specifically, the functional unit captures
the differences from the application of multiple deicers during various temperatures. Based upon
the guidelines set within each state, a deicing product will be applied at varying quantities over
the course of a winter season. One winter season, though, will have the same number of snow
days and the same daily temperatures for all tested deicers yet will result in different uses and
application rates.
15
3.2.3 Impact Categories
The impact categories and methods in the SimaPro 8 model include climate change (kg CO2 eq),
ozone depletion (kg CFC-11 eq), and total environmental impact (Ecopoints). Climate change
and ozone depletion were chosen as impact categories because they are concepts that are well
understood by a wide range of people. The metrics used to calculate impact to climate change
and impact to ozone depletion is discussed more thoroughly in Section 6.1.
Total environmental impact in Ecopoints was chosen because it provides a holistic comparison
of all environmental effects from each product and allows data to be interpreted relatively. From
this point forward, the total environmental impacts measured in terms of Ecopoints, during the
pre-application lifecycle phases, will simply be referred to by its metric (“Ecopoints”). The
purpose for this is to avoid confusion with total environmental impacts measured during the post-
application stage. Further information regarding impact categories and reporting methodology
can be found in Section 4.1.
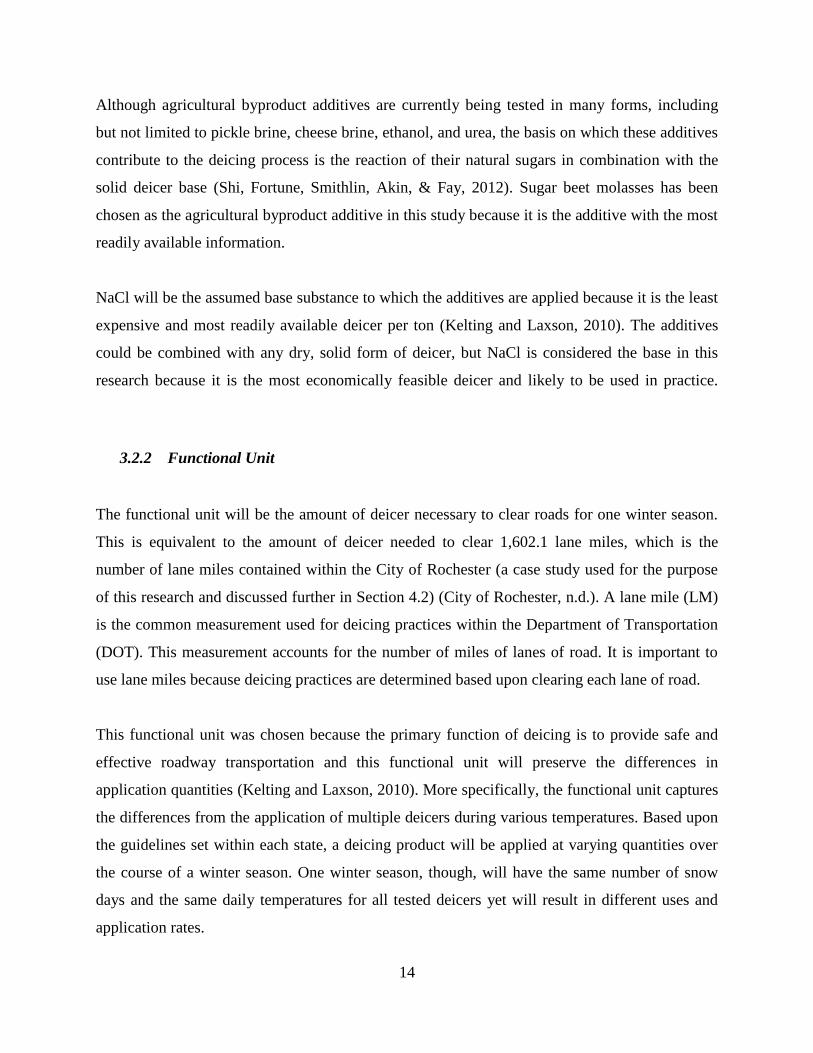
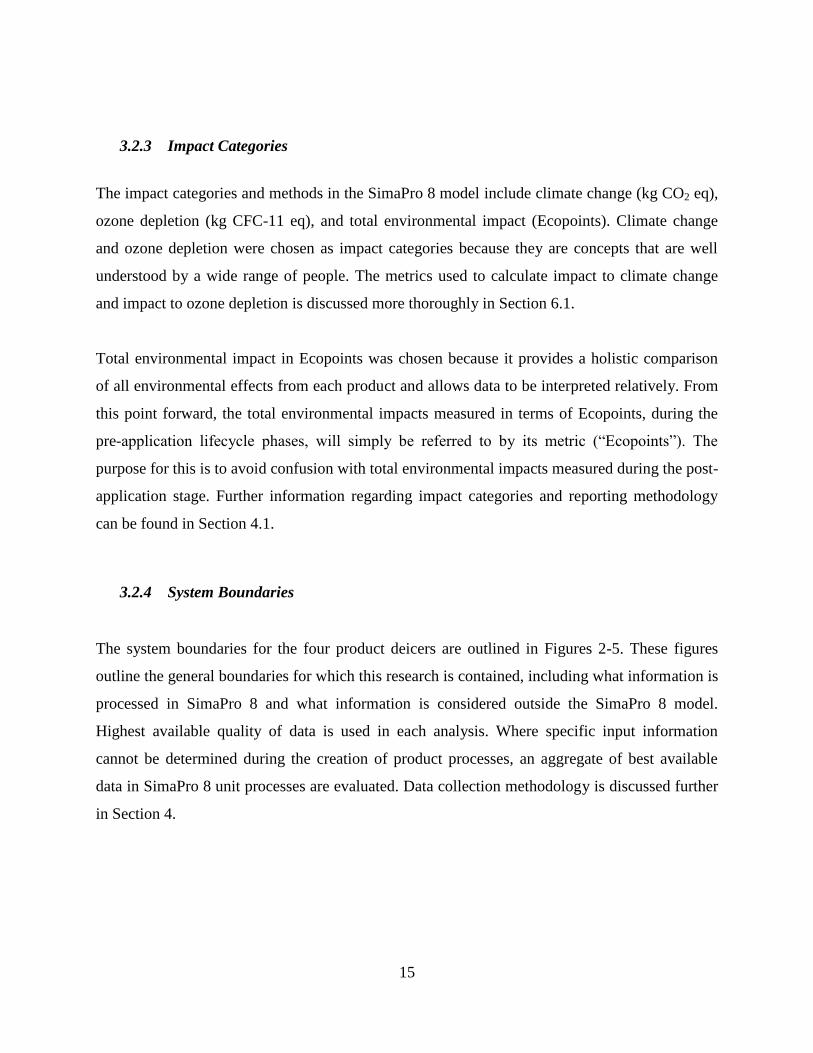
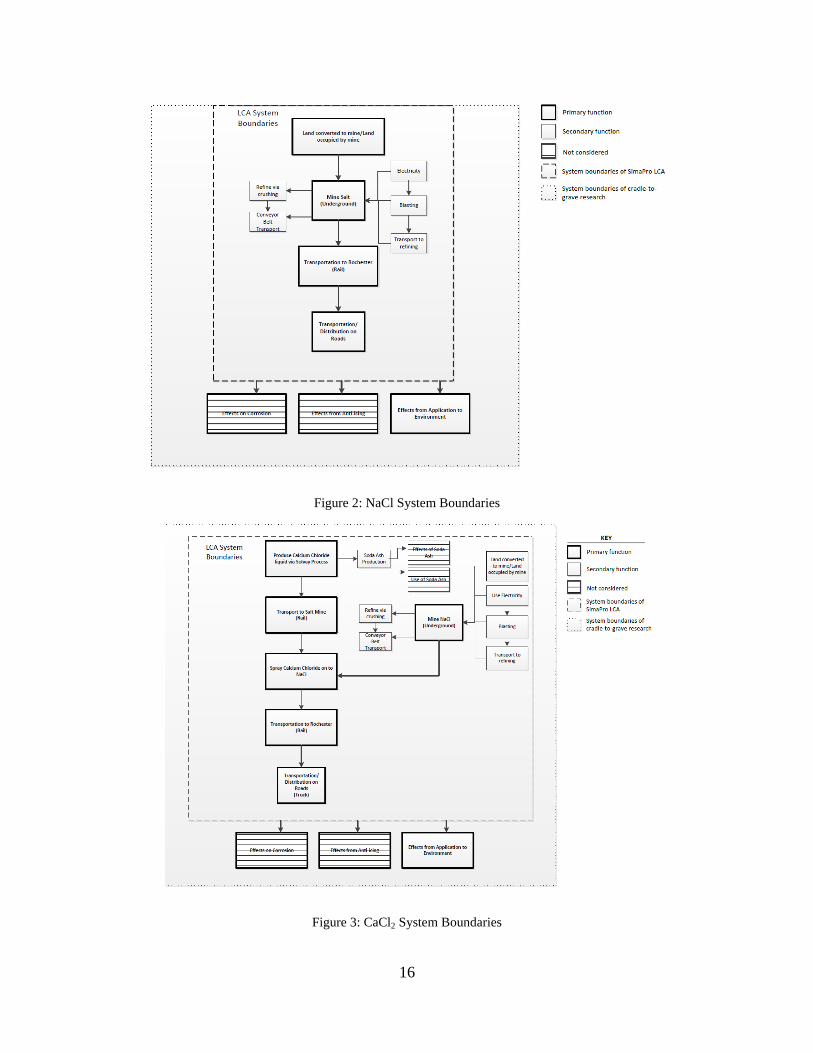
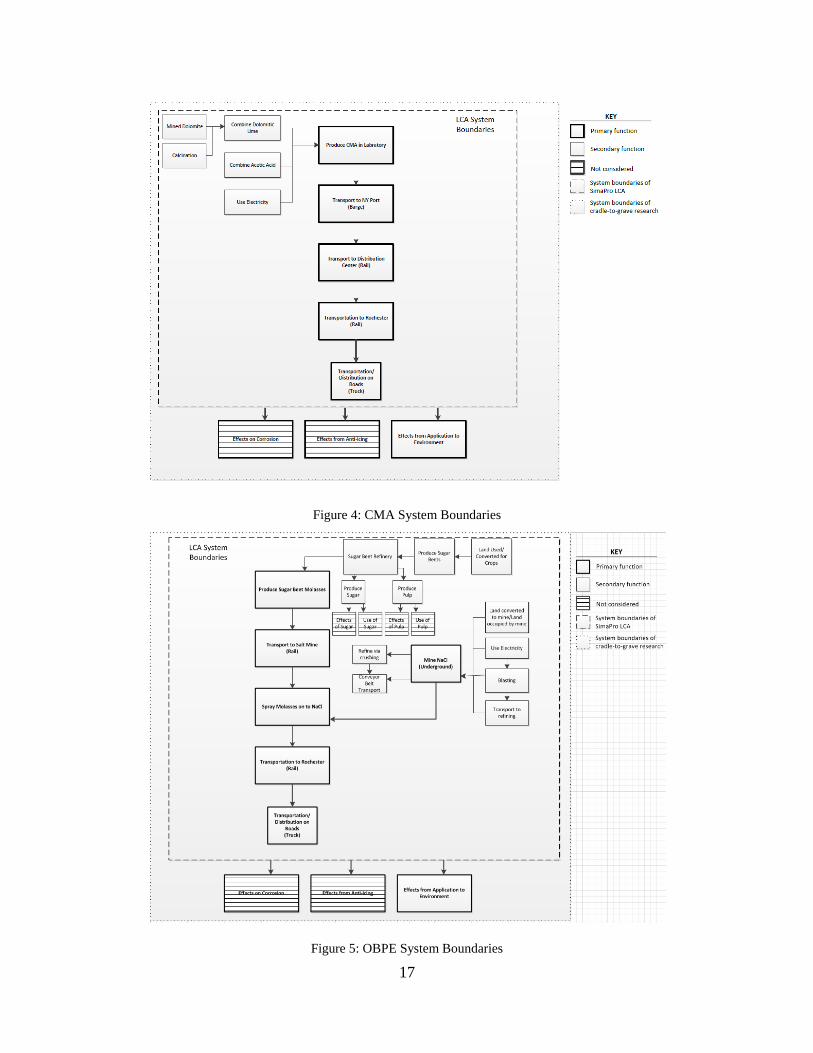
3.2.4 System Boundaries
The system boundaries for the four product deicers are outlined in Figures 2-5. These figures
outline the general boundaries for which this research is contained, including what information is
processed in SimaPro 8 and what information is considered outside the SimaPro 8 model.
Highest available quality of data is used in each analysis. Where specific input information
cannot be determined during the creation of product processes, an aggregate of best available
data in SimaPro 8 unit processes are evaluated. Data collection methodology is discussed further
in Section 4.
16
Figure 2: NaCl System Boundaries
Figure 3: CaCl2 System Boundaries
17
Figure 4: CMA System Boundaries
Figure 5: OBPE System Boundaries
18
3.2.5 Additional Considerations
As noted in Figures 2-5, for the sake of this lifecycle analysis, corrosion and anti-icing effects are
considered to be outside the scope of the study. The effects of corrosion are wide in range and—
while important—would detract from the primary area of interest in this research. Corrosion
inhibitors have also become widely available for use in road infrastructure and vehicles and, in
areas of greater concern, can be easily mitigated (Fishel, 2001). Costs related to and best use
practices associated with corrosion inhibitors could be considered in further research. Anti-icing
is also not considered because, while some regions choose to apply anti-icers, it does not provide
the same function as deicing and is not a requirement for the application of deicers.
Additionally, aesthetic impacts will not be considered. It is assumed that all deicers will have
some aesthetic effects, including but not limited to residue on vehicles and surrounding roadway
infrastructure. Differences in the cleaning and maintenance associated with aesthetic measures
remain negligible, non-quantifiable, and are assumed to be relatively standard regardless of the
deicing substance used (Stripple, 2001).
3.2.6 Lifecycle Inventory
The second stage required in performing a lifecycle analysis is conducting the lifecycle inventory
methodology. The lifecycle inventory (LCI) defines the quantity and type of inputs throughout
the lifecycle of the products and their processes. In order to accurately do this, ISO standards
require a flowchart defining system boundaries and flow of materials and processes (Figures 2-5)
as well as collecting information on all flowchart component inputs and their environmental
outputs per functional unit (Baumann and Tillman, 2004).
To capture data on all inputs to the lifecycle analysis, and their corresponding environmental
outputs per functional unit, SimaPro 8 EcoInvent Unit Processes and USLCI databases are used.
19
These databases are two of the most widely used LCI databases provided by SimaPro 8 and are
used in this research because they have a breadth of comprehensive data on most common
materials and processes. The only LCI data that was not retrieved from EcoInvent or USLCI was
the LCA Food DK database, which was used thrice in constructing the CMA Deicer. LCA Food
DK database was used due to a lack of otherwise available information on acetic acid production.
When possible, U.S. specific materials and processes were chosen. Where not possible, the
European average was chosen.
3.2.7 Impact Assessment
An impact assessment is performed in order to describe the impact of the processes created in
SimaPro 8 and do so in a way in which the information can be easily understood and compared.
Inventory results from the LCI may not be easily comparable because the inventory is often large
in quantity and difficulties can arise in attempting to directly compare the relative impacts of
emissions, environmental depletion, etc. The impact assessment uses overarching categories—
such as climate change, ozone depletion, ecotoxicity, etc—to aggregate inventory results and
make those results easier to understand and easier to compare (Baumann and Tillman, 2004).
Not only does the impact assessment allow for ease of understanding and comparability but it
also reduces the metrics for which we must evaluate the product and processes (Baumann and
Tillman, 2004). The four deicers evaluated in this research had results with inventories ranging
from 725-903 materials and processes, but by conducting an impact assessment by
characterizations these metrics were reduced to 17 categories that encompassed the entire
inventory. These categories can be reduced further to reflect the impact categories selected in
Section 3.1.2. Additionally, impact assessments can be performed in terms of a damage
assessment or one single score, which groups characterization impacts in a way that is easily
comparable. The damage assessments are reported in terms of a percentage of impact and the
single scores are reported in terms of Ecopoints. Single scores provide impacts for Human
Health, Ecosystems, and Resources.
20
As mentioned in Section 3.2.3, the specific impact categories reported in this research include
climate change (kg CO2 eq), ozone depletion (kg CFC-11 eq), and total environmental impact
(EcoPoints).
3.2.8 Interpretation
Interpretation is the most critical aspect of any LCA. The LCI and impact assessment produce
large datasets that require interpretation and analysis in order to extract meaningful conclusions.
SimaPro 8 allows the user to analyze one product or process at a time as well as providing the
ability to compare products. Additionally, SimaPro 8 provides many visual aids including tables,
flowcharts, and graphs that can be manipulated and scaled to a certain degree.
In this research the visual aids created in SimaPro 8 provide the basis for interpretation. Because
SimaPro 8 has a limited ability to manipulate the presentation and formatting of the visual aids,
all data and visuals are imported to Microsoft Excel. The benefits in using Microsoft Excel is
that it (1) allows for direct access to and use of the raw data and (2) allows for control over all
visual aids and the way in which they are presented such that important information is easily
conveyed.
3.3 Post-Application Model
It is commonly understood that in a product’s lifecycle there are five main stages: (1)
premanufacture, (2) product manufacture, (3) product delivery, (4) product use, and (5)
refurbishment, recycling, disposal (Graedel, 1999). In the case of deicers, the product use phase
overlaps with the refurbishment, recycling, and disposal phase. Therefore, for the purpose of this
research, lifecycle analysis methodology is used to determine impacts of the four common road
deicers prior to their application and a second environmental impact model is created to
determine the impact of the deicers once they have been applied. Both these results are in
relative terms, comparing the impact of each deicer to the others.
21
As detailed in Section 3.2, this analysis will use SimaPro 8 software to model the
premanufacture, product manufacture, and product delivery phases of the deicers’ lifecycle,
which include but are not limited to the effects of raw material acquisition, manufacturing and
processing, transportation, and distribution of each deicer.
Some models have attempted to capture impacts of deicers to the environment during and after
application by using SimaPro 8. These models created disposal phases that dispose of all deicers
to water, which then undergoes wastewater treatment. This is an overly simplified method that
fails to capture the full impacts to waterways as well as the ways in which soil structure and the
other surrounding environment is impacted. These methods are also not able to account for the
fluctuating rates at which deicers reach waterways, particularly in a way that aligns with the
lifecycle assessment framework (Fitch, Smith, & Clarens, 2013).
Therefore, due to the limitations of SimaPro 8 to effectively capture environmental impacts of
deicer accumulation during the use and disposal phases of deicer application, the post-
application effects of each deicer are modeled using a relative weighting scale and five
impairment categories. These five impairment categories are discussed in Sections 3.3.1 through
3.3.4.
3.3.1 Measuring Waterway Impacts
An increase of deicing compounds has not been linked to large bodies of water due to the rapid
rate of dilution. Effects of road deicers to water primarily impact small freshwater ponds and
low-flowing streams. Water downstream and within 100 feet of the roadways is the water that
most often has detectable concentrations of road deicers (Fishel, 2001). Although continuous
long-term application rates have the potential to infiltrate groundwater supplies, the primary
concern of deicers is to surface water (Warner and Ayotte, 2014; Fishel, 2001).
The risk of greatest concern to surface waters from deicers is decreased dissolved oxygen content
either in the form of eutrophic conditions or increased salinity levels (Warner and Ayotte, 2015;
Fishel, 2001; Kelting and Laxson, 2010; Van Meter, Swan, & Snodgrass, 2011). Dissolved
22
oxygen (D.O) content of a body of water is critical for the survival of plants, animals, and other
living organisms that rely on the oxygen content of their habitat for survival. An input of organic
matter or imbalance of molecules is linked to decreased dissolved oxygen content, which in turn
causes eutrophic conditions. Low D.O. levels impact the quality of water, the biodiversity, and
overall habitat (USGS, n.d.).
A secondary concern of water quality is the total dissolved solids (TDS) content. TDS is a
measure of the organic or inorganic substances found in a freshwater system and, while TDS
does not inherently imply poor or toxic water quality, it is an indicator of impurities. Deicers can
contribute to the TDS of waterways, which would potentially impact habitat quality or, in the
case of wells, drinkability (Warner and Ayotte, 2014).
3.3.2 Measuring Soil Structure Impact
The primary risk of deicers to soil includes transport of heavy metals and, at high concentrations,
potential fluctuations in pH (Kelting and Laxson, 2010; Klufe, Werkenthin, & Wessolek, 2014).
This, in turn, impacts permeability of soil and survival of plants and bacteria that depend upon
the soil. Heavy metal leaching is considered the greatest impact to soil because the effects can be
long-term and severe.
The highest concentrations of road deicers in soil are found within 10 feet of roadways but some
studies found traces of high concentrations up to 100 feet from roadways (Warner and Ayotte,
2014). Although deicers have the ability to impact pH, these concentrations would have to be
very high and persist over a relatively long period of time to have any impact. Because deicers in
soil are able to be quickly diluted, impacts to pH will not be considered as part of the analysis for
of soils (Kelting and Laxson, 2010).
23
3.3.3 Measuring Human and Aquatic Health Impact
Human and aquatic health are considered separately from the measures outlined in Sections 3.3.1
and 3.3.2. While deicers have the ability to impact soil and water, these impacts may decrease
environmental quality but do not necessarily pose as an immediate health risk. While the impacts
of deicers to soil and water has the ability to impact human and aquatic health, because not all
risks are created equal. The EPA has established detection limits for elements whose
concentrations pose greatest risk to either human or aquatic health. For example the EPA has set
detection limits for chloride but not for magnesium because it is either not prevalent enough in
the environment at levels that would pose a significant risk, or because those levels would need
to be extremely high to warrant concern. For the sake of this research, if an EPA detection limit
is set for a deicer element then that element will be considered correlated with impacting human
and/or aquatic health. The purpose of considering these impacts separately from the other
measures is to provide a proper impact adjustment for elements that are of greatest concern.
3.3.4 Environmental Impact Model
In order to capture the impact of deicers to the environment, a newly proposed model has been
created that allows for easy comparison between results from deicers post-application with
results from SimaPro 8 prior to application. More specifically, I am proposing this as a method
and exploring this modeling method using Rochester and deicers as a case study. This model is
being developed as a way in which to capture impacts from all lifecycle stages when the use and
disposal lifecycle stages overlap. Deicers are the product of concern in this research although
other products may face this issue as well, such as lawn maintenance products (fertilizers, pest
control, etc.) and hygiene products (soaps, shampoos, etc.). This is the first attempt at using this
model, but it has the potential to be developed and customized further for other similar products
that are not deicers.
24
This model uses the number of elements added to the environment from each deicer to determine
impact each deicers impact. The inputs and results are based upon the annual quantity of deicer
applied, the molar weight of each element, and the molecular composition.
Five impairment factors will be considered and weighted in this specific model: D.O., TDS,
Heavy Metal Leaching, Human Health, and Aquatic Health. These impairment factors were
chosen for this research based upon known primary impacts of deicers to surrounding
environments from application and elaborated upon in Sections 2.2.1 through 2.2.3 (Kelting,
Laxson, &Yerger, 2012; Kelting and Laxson, 2010). These impairment factors are quantifiable
metrics that reflect impact deicers have to soils, waterways, and vegetation. Other impairment
factors can be selected for different products at the discretion of the researcher.
Each impairment factor is then provided a weight based upon the severity of impacts that arise
from that factor. For example, impacts to human health will be considered of greater concern in
this research, and will therefore have a greater weight, than potential changes in TDS. Weighting
is based upon a review of the literature and these weights reflect relative impacts of each
impairment factor as compared to one another. While there is some discretion required in the
weighting process, each assigned weight should have an associated substantive rationale and, if
repeated, should provide similar results.
Once weights have been assigned to each impairment factor, an element from a deicer will be
marked as either “yes” or “no” to having direct associated changes to one of the five impairment
factors. All weights from impairment factors that received a “yes” are added and then multiplied
by the quantity at which that element is being added to the environment from its deicer. This is
repeated for all elements that comprise a deicer. The final sum of all the quantities of weighted
elements is classified as the Environmental Impact Score—a term used and developed for this
research—that can be compared with the results from other deicers.
Each deicer will receive an Environmental Impact Score. These scores will be plotted graphically
to best show which deicer has the greatest impact to the environment once it has been applied.
Because the number of factors selected, as well as the scale of their weights, can be somewhat
25
subjective, the Environmental Impact Scores must be considered relative scores that cannot be
directly compared to other metrics from SimaPro 8. Instead, the relative results from SimaPro 8
and the results from the post-application Environmental Impact Model will be compared and
analyzed and, based upon these results, a conclusion and recommendation can be drawn. The
ability of this model to assist with lifecycle analyses of non-deicing products is discussed in
Section 7.
4. Data Collection
The data interpretation and analysis of results from this research will be based on a case study in
Rochester, New York in order to use specific data and create more accurate results. The data will
be interpreted based on the results from SimaPro 8 and the post-application Environmental
Impact Model. These results are compiled in Excel and a sensitivity analyses will be performed.
4.1 Libraries and Databases
This analysis is performed using SimaPro 8 software and based on the ISO 14040 and ISO 14044
standards as a guide. In order to capture the effects from all processes and materials, EcoInvent
unit processes and USLCI libraries are primarily used. These two libraries provide a
comprehensive index of necessary information to build processes and systems for the purpose of
this study. The following materials and processes will be evaluated in SimaPro 8: mining,
harvesting, laboratory/industrial work, displaced land, transportation, distribution, special
equipment, chemical use, and the emissions, resource consumption, and energy usage associated
with each.
To accurately measure all outputs ReCiPe Endpoint Hierarchical methodology – also referred to
as ReCiPe Endpoint (H)—is used. ReCiPe is the primary methodology for evaluating LCAs
using a comprehensive series of human and environmental impact indicators. Hierarchical was
26
chosen as the specific method type because it is the consensus model perspective, as opposed to
using an Individualist or Egalitarian perspective, which are less commonly used in scientific
research. (Ministerie Van Volkshuisvesting, 2013)
4.2 Data Organization
As discussed in Section 3.2.3, the impact categories used to capture the environmental effects of
deicers prior to their application include climate change (kg CO2 eq), ozone depletion (kg CFC-
11 eq), and Ecopoints. These categories were selected because they will best represent the
impacts of each deicer so that they are most easily understood by the greatest number of people.
Ecopoints will be primary measure in which the comprehensive and collective impacts from
deicers can easily be compared. Ecopoints is a numeric measure that indicates total
environmental impact with relation to materials, products, processes, or services (Edge
Environment, n.d.). Ecopoints provide a quantification of all environmental impacts and
therefore simplify comparisons between the deicers for each impact category. All environmental
impact data from these impact categories will be extracted from SimaPro 8 and imported to
Microsoft Excel in order to organize and present the information.
All data created for each deicer in SimaPro 8 will be organized in Microsoft Excel along with the
post-application impacts. Data will be characterized by impact category and displayed
graphically. Raw data will also be used to format charts and graphs that show comparative
impacts of each deicer at different phases. A sensitivity analysis will be performed and results
will be displayed similarly for easy comparison.
4.3 Case Study
In order to quantitatively capture the effects of deicers on the environment, Rochester, NY was
selected as a case study because its population is reflective of that of a medium sized city (US
Census Bureau, 2013). In addition, Rochester is located in the northeastern part of the United
States, which is the region that has continuously high potential to be affected by snow and cold
weather (Kunkel et al., 2013; Kelting and Laxson, 2010). While climate change has resulted in a
27
global average increased temperature, regional effects have varied widely. The Northeastern
United States has experienced dramatic fluctuations in winter weather such as decreased average
temperatures and increased snowfall (Kunkel et al., 2013). Therefore, Rochester would serve as
an indicator for the locations most likely to be using road deicers. Finally, Rochester has a wide
variety of ecosystems and species and could therefore accurately represent the holistic effects of
deicers.
4.4 Processes Creation
Each deicer process was created in SimaPro 8 using the best available information. The NY State
Department of Transportation Highway Maintenance Guidelines was used as the initial basis for
determining application rates and solution concentrations (Highway Maintenance Guidelines,
2006). When information was not available from the NY State Department of Transportation
Highway Maintenance Guidelines, the preferred secondary source was an alternative Department
of Transportation resource. In some cases specific product guidelines were used.
5. SimaPro Model
The four deicer products chosen for this research include NaCl, CaCl2, CMA, and OBPE. The
City of Rochester contains roadways distinguished as highways and municipal
roads/expressways. For the purpose of this research all roads are presumed to operate under
regular service as defined by the New York State Department of Transportation (Highway
Maintenance Guidelines, 2006). By this definition the maximum allowable accumulation of
snow would be 2.0 inches. As a result, to prevent snow accumulation, all detectable traces of
snow would begin to be serviced immediately and are considered in this research. In addition, at
current standards, when snow is falling at more than 1 inch per hour, deicing is delayed until the
rate has slowed because it is deemed too costly to maintain. This typically happens no more than
28
once or twice per year (Highway Maintenance Guidelines, 2006). For the purpose of this
research it will be assumed that all snowfall is serviceable. This is assumed in part because the
occurrence of an unserviceable snowstorm is rare and in other part because, in its current state,
NaCl is the primary deicer and this research is attempting to determine if an alternative deicer
may be more efficient.
Trucks that carry the deicer travel from the storage facility throughout the roads of Rochester to
distribute the product. The number of trucks will not vary with the variations of deicer because
the truck holding capacity is designed to carry more than the amount of NaCl necessary.
Temperature and snowfall data were collected for Rochester from 2012-2016. This data will be
used to determine application rates and quantities needed. The application rate will be what
varies for each deicer (Highway Maintenance Guidelines, 2006).
Each deicer truck is considered to be a standard truck with a spinner and spray chute attached to
the rear to distribute deicer product. After every heavy snow storm the trucks run through a
checklist of cleaning and maintenance practices and a more thorough cleaning and maintenance
at the beginning and end of each winter season. It is assumed that the yearly maintenance of the
trucks and the truck design will be the same for all products because all products in this research
are in solid form and relatively similar in size.
For the purpose of this research we will be using air temperature and snow fall to determine the
amount of deicer to be applied. While the temperature of pavement can be higher than air
temperature during mid-morning and onward, the temperature of pavement is also considered to
be lower than the air temperature from evening through morning (Highway Maintenance
Guidelines, 2006). Therefore, it is assumed that those differences will balance and an average
can be taken.
The rate of application is based upon a standard dilution potential and best and worst case
scenarios are created. The best case scenario assumes ice has not yet bonded to pavement and the
worst case scenario assumes ice has already bonded to pavement. Most application rates were
determined in Microsoft Excel based upon the NY State Department of Transportation
29
Guidelines (Highway Maintenance Guidelines, 2006) and the National Cooperative Highway
Research Program Snow and Ice Control Guidelines (Blackburn, Bauer, Amsler, Boselly, &
McElroy, 2004). For all municipal roads and expressways that have one lane going in one
direction, deicer is applied to the middle third of the lane. For all highways in which there is
more than one lane traveling in the same direction, all lanes have deicer applied to the middle
(Highway Maintenance Guidelines, 2006).
Application rates are reported in amounts of deicer per lane mile because there will be
significantly more lane miles than there are miles of road. For all highways and expressways,
deicing trucks are assumed to travel at a rate of 35 miles per hour and for all municipal roads
deicing trucks are assumed to travel at 15 miles per hour (Highway Maintenance Guidelines,
2006).
5.1 NaCl Inputs
NaCl is assumed to be obtained from American Rock Salt Company located 42 miles (67.59 km)
south of Rochester (American Rock Salt, 2016). At American Salt Rock Company, the salt is
derived via a mining process on site. The salt can be found in a halite deposit from the dolostone
and limestone deposits south of Rochester and approximately 0.50 miles beneath surface level
(USGS, n.d.b). This mine was chosen because it is nearest and has the capacity to provide
Rochester with its salting needs; American Rock Salt is the largest operating salt mine in the
U.S. and produces between 10,000 and 18,000 tons of salt each day from the mining process
(American Rock Salt, 2016). This is a room-and-pillar mine.
The salt is excavated through a blasting process. Holes are drilled in to walls of a room and these
holes are filled with an explosive, typically a mixture of ammonium nitrate and diesel fuel, and
then detonated. (American Rock Salt, 2016)
Once a wall or area has been blasted a loader truck brings the raw salt materials to a conveyor
where the salt is carried through a crushing and screen process to bring the mined salt to a more
appropriate size. The processed salt then gets brought to the surface level via conveyor and
30
stored in large mills or in grain elevators ready to be picked up in bulk and delivered to the City
of Rochester via freight train.
In the City of Rochester, all deicers are brought to covered “salt barns” where it they stored for
distribution. These are standard, covered barns located upon cement to prevent leaching in to the
environment (Highway Maintenance Guidelines, 2006). Upon a snow event trucks are loaded up
and dispersed to various areas of the city to apply the untreated NaCl to the roads.
5.1.1 NaCl Material Creation
NaCl was modeled based on the system boundaries outlined in Figure 2. SimaPro8 had Salt
(NaCl) as a raw material in its database but the raw material did not capture the mining and
extraction processes. “Sodium Chloride, at plant” was also available but this sodium chloride
was obtained using solution mining, whereas American Rock Salt uses room-and-pillar mining.
Therefore, the mining process first needed to be created for NaCl before the rest of the product
could be modeled.
A standard underground NaCl mining process was not available in SimaPro 8. Therefore data
was collected for minerals extracted through similar underground mining processes. The three
underground mines with data already available in SimaPro 8 were “Uranium Underground
Mine,” “Underground Mine, Hard Coal,” and “Phosphate Rock Mine.” Although the materials
extracted from these mines may not be identical to NaCl, the mining processes themselves have
similarities. The inputs to these three underground mining processes were therefore used as a
basis for creating the NaCl Rock Salt Underground Mine, in combination with data from
literature and industry.
Table 2 represents all of the inputs used to create “Uranium Underground Mine,” “Underground
Mine, Hard Coal,” and “Phosphate Rock Mine” as well as their averages and medians. The
actual inputs and their corresponding values used in this research to create the NaCl Rock Salt
Underground Mine are highlighted in gold. The method for determining actual quantities varies
based upon available data and are discussed below.
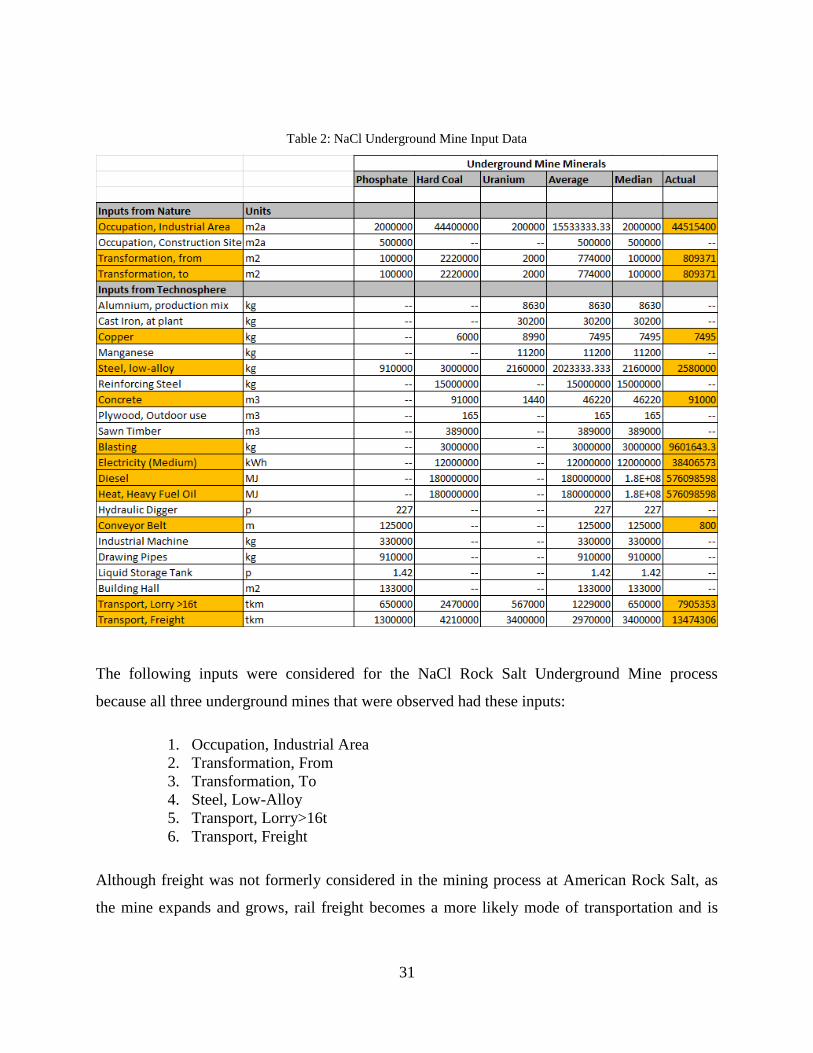
31
Table 2: NaCl Underground Mine Input Data
The following inputs were considered for the NaCl Rock Salt Underground Mine process
because all three underground mines that were observed had these inputs:
1. Occupation, Industrial Area
2. Transformation, From
3. Transformation, To
4. Steel, Low-Alloy
5. Transport, Lorry>16t
6. Transport, Freight
Although freight was not formerly considered in the mining process at American Rock Salt, as
the mine expands and grows, rail freight becomes a more likely mode of transportation and is
32
historically present in underground mines. Although all six inputs were used, specific inputs to
NaCl Rock Salt Underground Mine process were not based solely on the calculated averages.
Occupation, Transformations, and Transportation were calculated for NaCl using specific data
and are elaborated upon further below. “Steel, Low-Alloy” was calculated for NaCl Rock Salt
Underground Mine process by taking the average input for the Hard Coal Underground Mine
process and Uranium Underground Mine process because the input for the Phosphate
Underground Mine process was an outlier compared to how relatively close the other two inputs
were.
Copper and concrete were also considered because they were present in two of the three
observed mines. Copper is associated with the machining and transportation. Concrete is often
used to seal mine shafts when they are no longer in use. “Blasting” and “Conveyor Belt” were
added to the NaCl Rock Salt Underground Mine process because they are both known to be
present in the NaCl mines. The depth of the mine is known to be approximately half a mile,
therefore the input for the conveyor in the NaCl Rock Salt Underground Mine process is 800
meters.
Before calculating the amount of blasting, transportation, and land usage required for the NaCl
Rock Salt Underground Mine process, the amount of salt produced per year by the mine and the
corresponding area occupied need to be considered. “Electricity, Medium Voltage” is also an
input for NaCl Rock Salt Underground Mine process because it is known that electricity is
needed for processes such as running the conveyor operating machinery. The amount of salt
produced per year and the area of the mine are also needed in order to calculate electricity.
According to American Rock Salt, 200 acres of surface land were purchased for the mine and
10,000 acres of mining rights were obtained (American Rock Salt, 2016). This was used to create
the input for “Transformation.” It is assumed that the land is transformed from an unknown use
to an industrial area, and the transformation processes for NaCl Rock Salt Underground Mine
reflects the land surface required for this mine.
33
The occupational process—“Occupation, Industrial Area”—reflects this occupied land surface
multiplied by the duration that the facilities will be in use (reported in m2a). It was assumed that
the rock salt mine in question would have a lifetime of 50 years and would operate 5 days a week
with 8 vacation days in which the mine does not operate, based upon the Bureau of Labor
Statistics (US Department of Labor, 2013). While the age of a mine can vary significantly, the
age of the NaCl Rock Salt Underground Mine was estimated using data from the other
underground mines. Rock salt mines around the world date back thousands of years but the
Cayuga Salt Mine, which is closest in geographic region to the American Rock Salt mine,
opened in 1916 and anticipates remaining in use for the next 20-50 years (Cargill, n.d.). The
Hard Coal Underground Mine process modeled in SimaPro 8 is based on a lifetime of 30 years.
The Uranium Underground Mine process modeled in SimaPro 8 appears to be based upon an
operation of 20 years as determined by its “Transformation” and “Occupation” values. The life
of the Phosphate Underground Mine process is unclear.
The NaCl Rock Salt Underground Mine process is assumed to operate 252 days of the year, and
annually will produce 3,528,000 tons of salt per year specifically to be allocated for deicing
needs in Rochester. This is equivalent to 176,400,000 tons per life time. (US Department of
Labor, 2013; Cargil, n.d.)
These three inputs—“Transformation, to,” “Transformation, from,” and “Occupation”—are
based on the European system CORINE Land Cover, which is an acronym for Coordination of
Information on the Environment. It is a system developed in the European Union as a means to
inventory environmental uses and impacts throughout many areas of interest (European Union
Environment Agency, 2000).
Electricity and energy inputs are based upon that of the Hard Coal Underground Mine. It is
assumed, like the Hard Coal Underground Mine process, that “Diesel,” “Heat, Heavy Fuel Oil,”
and “Electricity, Medium Voltage” are needed in the NaCl Rock Salt Underground Mine process
to operate the machinery and provide workable conditions. According to the EcoInvent Unit
Processes database that models LCI for the Hard Coal Underground Mine, the mine is assumed
to have a total lifetime production of 30 million tonnes (33,069,339.328 tons) of coal. Therefore,
34
because the underground mines for NaCl process and Hard Coal process are relatively same in
operation, the inputs for “Diesel,” “Heat, Heavy Fuel Oil,” and “Electricity, Medium Voltage”
can be scaled relative to the differences in lifetime production.
The “Transportation, Lorry >16t” and “Transportation, Freight” are again determined based upon
the Hard Coal Underground Mine process. In this case, the Hard Coal Underground Mine
process was used instead of the average because the land transformation and occupational
input—which represents the amount of land used and the duration for which it is used—most
closely resembled that of the NaCl Rock Salt Underground Mine. The “Transportation, Lorry
>16t” and “Transportation, Freight” were scaled; NaCl Rock Salt Underground Mine process
produces approximately 3.2 times as much product by weight as the Hard Coal Underground
Mine process and therefore is assumed to require 3.2 times as much “Transportation, Lorry >16t”
and “Transportation, Freight” as the Hard Coal Underground Mine process.
No other inputs or outputs were reported for these three mines and therefore were not considered
for NaCl Rock Salt Underground Mine process.
By creating the NaCl Rock Salt Underground Mine process, the NaCl Deicer production process
could be created. Again, because SimaPro 8 did not already have NaCl Deicer in its LCI
databases the product and had to be created. In order to create the NaCl Deicer process, data was
collected from minerals with similar composition and/or qualities to that of NaCl. These mineral
products were used to determine what common inputs and outputs would be associated with that
of NaCl Deicer process.
In order to determine appropriate quantities of the inputs and outputs, these minerals, as well as
the Uranium process and Coal process were used. The Uranium process and Coal process were
used to determine input and output quantities because, although they might not otherwise
resemble NaCl, Uranium and Coal are created using similar underground mining processes and,
where appropriate, would serve as a close representation of how NaCl might be created.
Processes for Phosphate were not available in its raw form for consideration.
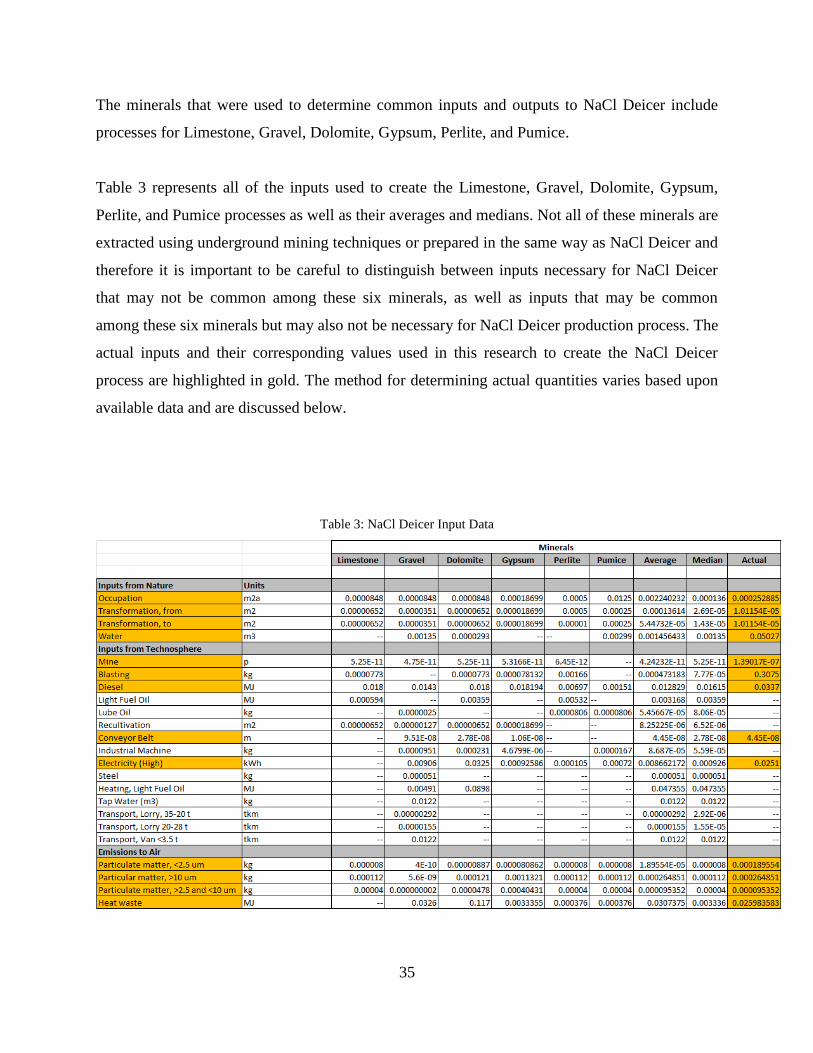
35
The minerals that were used to determine common inputs and outputs to NaCl Deicer include
processes for Limestone, Gravel, Dolomite, Gypsum, Perlite, and Pumice.
Table 3 represents all of the inputs used to create the Limestone, Gravel, Dolomite, Gypsum,
Perlite, and Pumice processes as well as their averages and medians. Not all of these minerals are
extracted using underground mining techniques or prepared in the same way as NaCl Deicer and
therefore it is important to be careful to distinguish between inputs necessary for NaCl Deicer
that may not be common among these six minerals, as well as inputs that may be common
among these six minerals but may also not be necessary for NaCl Deicer production process. The
actual inputs and their corresponding values used in this research to create the NaCl Deicer
process are highlighted in gold. The method for determining actual quantities varies based upon
available data and are discussed below.
Table 3: NaCl Deicer Input Data
36
When five of the six observed minerals had a similar input or output, those inputs and outputs
were considered to be an input/output for NaCl Deicer process. These include:
1. Occupation, Mineral Extraction Site
2. Transformation, From
3. Transformation, To
4. Mine
5. Diesel
6. Electricity, High Voltage
7. Particulate Matter, <2.5 um
8. Particulate Matter, >10 um
9. Particulate Matter, >2.5 and <10 um
10. Heat waste
In addition to these 10 inputs and outputs, “Water,” “Blasting,” and “Conveyor Belt” were also
added as inputs to the NaCl Deicer process. Water is required in underground mining because
conditions can be very dry. In some cases it is pumped in to provide humidity while in other
cases it is provided for cleaning or employee comfort. “Blasting” and “Conveyor Belt” are also
considered because we know that there is some blasting associated with retrieving NaCl Deicer
that are not capture from the “Mine” input. The “Mine” input accounts for blasting associated
with creating the mine whereas some blasting is also required for breaking apart and extracting
the NaCl Deicer. “Conveyor Belt” is accounted for in the “Mine” input for transportation, but
“Conveyor Belt” is also required for NaCl Deicer to assist and move NaCl in the “Crushing”
process.
“Crushing” is not present in any of the six observed minerals but it is known that crushing is
required for the NaCl Deicer process to reduce the size of the NaCl to a usable size. “Crushing”
is therefore considered an input to the NaCl Deicer process at 1.176 kg, which represents the
amount of deicer that would need to be crushed to create 1 kg of NaCl Deicer based upon LCI
data from similar products.
The average of the efficiencies of production of Limestone, Gravel, Dolomite, Gypsum, Perlite,
and Pumice is 90% and the average of the efficiencies of Coal and Uranium is 85% as derived
from the available LCI SimaPro data. It is assumed that there is an 85% efficiency of extraction
of usable NaCl Deicer, which corresponds to the production of 1.176 kg of NaCl to get 1 kg of
37
NaCl Deicer. An efficiency of 85% production for the NaCl Deicer process was chosen because
it is assumed that there are more losses associated with extracting usable product from an
underground mine than from surface mines which might be used in the case of the six observed
minerals. The inability to transport 100% of NaCl from the blast site, inability to collect and
refine all NaCl during the crushing process, and inability to transport 100% of NaCl from the
bottom of the mine to outside the mine account for these losses and inefficiencies.
Coal and Uranium processes were also used to determine the quantities for the “Water,” “Mine,”
and “Blasting,” whereas “Diesel” and “Electricity (High Voltage)” quantities were determined
from the Coal process alone. Averages of the input quantities for “Water,” “Mine,” and
“Blasting” from Coal and Uranium processes were determined to be preferable because these
two products will require inputs quantities much closer to that of NaCl Deicer; this is due to the
fact that they are created and extracted through the same underground mining process. The
average input quantity of “Water” would be 3% less if all six observed minerals averages were
used as opposed to the average of the Coal and Uranium processes. The average input quantity of
“Mine” would be 0.03% less if all six observed minerals averages were used as opposed to the
average of Coal and Uranium processes. And the average input quantity of “Blasting” would be
0.15% less if all six observed mineral process averages were used as opposed to the average of
Coal and Uranium processes. This verifies that, for the purpose of this research, the input
discrepancies would not significantly vary if the averages of the six minerals were used to
calculate quantities.
“Diesel” and “Electricity (High Voltage)” quantities were determined from the Coal process
alone because, although this is one data point, it properly attributes the “Diesel” and “Electricity
(High Voltage)” already consumed in the underground mine as opposed to what is required for
the production of NaCl Deicer. Averages from the six minerals could also have been used to
determine input quantities for “Diesel” and “Electricity (High Voltage)” as opposed to using the
Coal process alone, but retrieving a product from an underground mine is assumed to require
more energy input and therefore these averages are likely an underestimate and would have to be
scaled up.
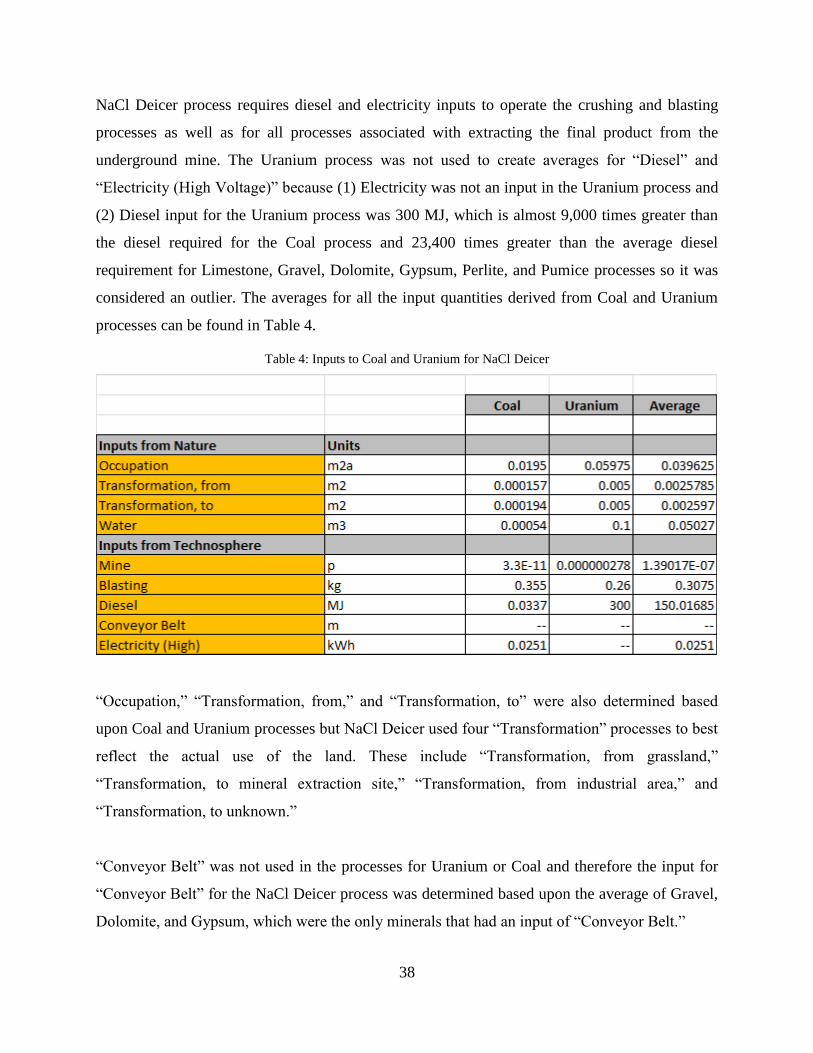
38
NaCl Deicer process requires diesel and electricity inputs to operate the crushing and blasting
processes as well as for all processes associated with extracting the final product from the
underground mine. The Uranium process was not used to create averages for “Diesel” and
“Electricity (High Voltage)” because (1) Electricity was not an input in the Uranium process and
(2) Diesel input for the Uranium process was 300 MJ, which is almost 9,000 times greater than
the diesel required for the Coal process and 23,400 times greater than the average diesel
requirement for Limestone, Gravel, Dolomite, Gypsum, Perlite, and Pumice processes so it was
considered an outlier. The averages for all the input quantities derived from Coal and Uranium
processes can be found in Table 4.
Table 4: Inputs to Coal and Uranium for NaCl Deicer
“Occupation,” “Transformation, from,” and “Transformation, to” were also determined based
upon Coal and Uranium processes but NaCl Deicer used four “Transformation” processes to best
reflect the actual use of the land. These include “Transformation, from grassland,”
“Transformation, to mineral extraction site,” “Transformation, from industrial area,” and
“Transformation, to unknown.”
“Conveyor Belt” was not used in the processes for Uranium or Coal and therefore the input for
“Conveyor Belt” for the NaCl Deicer process was determined based upon the average of Gravel,
Dolomite, and Gypsum, which were the only minerals that had an input of “Conveyor Belt.”
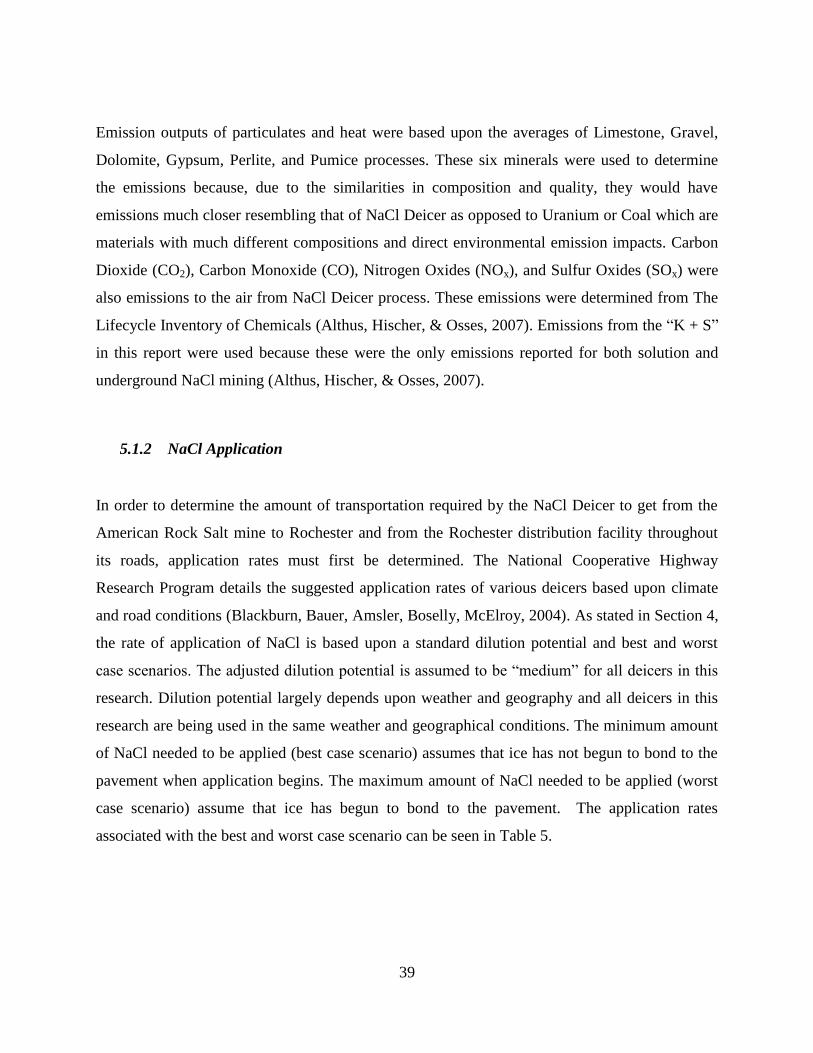
39
Emission outputs of particulates and heat were based upon the averages of Limestone, Gravel,
Dolomite, Gypsum, Perlite, and Pumice processes. These six minerals were used to determine
the emissions because, due to the similarities in composition and quality, they would have
emissions much closer resembling that of NaCl Deicer as opposed to Uranium or Coal which are
materials with much different compositions and direct environmental emission impacts. Carbon
Dioxide (CO2), Carbon Monoxide (CO), Nitrogen Oxides (NOx), and Sulfur Oxides (SOx) were
also emissions to the air from NaCl Deicer process. These emissions were determined from The
Lifecycle Inventory of Chemicals (Althus, Hischer, & Osses, 2007). Emissions from the “K + S”
in this report were used because these were the only emissions reported for both solution and
underground NaCl mining (Althus, Hischer, & Osses, 2007).
5.1.2 NaCl Application
In order to determine the amount of transportation required by the NaCl Deicer to get from the
American Rock Salt mine to Rochester and from the Rochester distribution facility throughout
its roads, application rates must first be determined. The National Cooperative Highway
Research Program details the suggested application rates of various deicers based upon climate
and road conditions (Blackburn, Bauer, Amsler, Boselly, McElroy, 2004). As stated in Section 4,
the rate of application of NaCl is based upon a standard dilution potential and best and worst
case scenarios. The adjusted dilution potential is assumed to be “medium” for all deicers in this
research. Dilution potential largely depends upon weather and geography and all deicers in this
research are being used in the same weather and geographical conditions. The minimum amount
of NaCl needed to be applied (best case scenario) assumes that ice has not begun to bond to the
pavement when application begins. The maximum amount of NaCl needed to be applied (worst
case scenario) assume that ice has begun to bond to the pavement. The application rates
associated with the best and worst case scenario can be seen in Table 5.
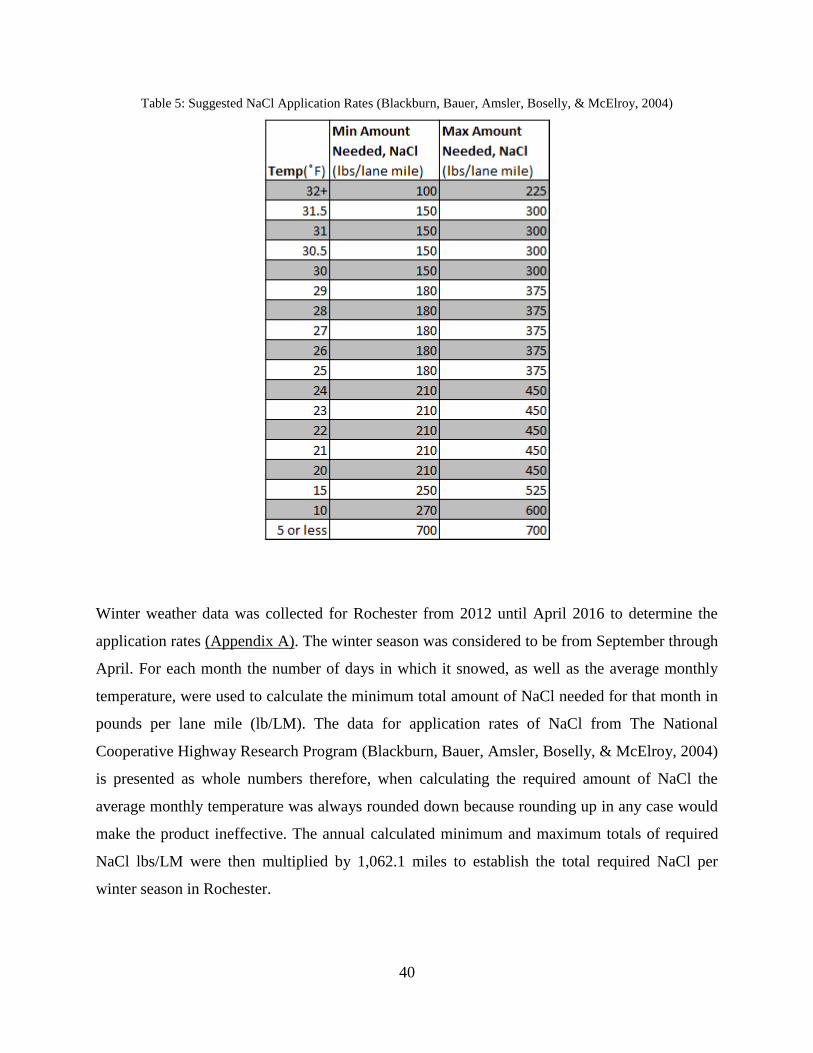
40
Table 5: Suggested NaCl Application Rates (Blackburn, Bauer, Amsler, Boselly, & McElroy, 2004)
Winter weather data was collected for Rochester from 2012 until April 2016 to determine the
application rates (Appendix A). The winter season was considered to be from September through
April. For each month the number of days in which it snowed, as well as the average monthly
temperature, were used to calculate the minimum total amount of NaCl needed for that month in
pounds per lane mile (lb/LM). The data for application rates of NaCl from The National
Cooperative Highway Research Program (Blackburn, Bauer, Amsler, Boselly, & McElroy, 2004)
is presented as whole numbers therefore, when calculating the required amount of NaCl the
average monthly temperature was always rounded down because rounding up in any case would
make the product ineffective. The annual calculated minimum and maximum totals of required
NaCl lbs/LM were then multiplied by 1,062.1 miles to establish the total required NaCl per
winter season in Rochester.
41
The average minimum calculated required NaCl for all winters seasons from 2012-2015 was
4,415.68 tons of NaCl. The average maximum calculated required NaCl for all winters seasons
from 2012-2015 was 9,399.59 tons of NaCl. Collectively this provides us with an average winter
NaCl use of 6,907.63. According to Dwayne Aycock, who works for the Monroe County
Department of Transportation (Aycock, 2016), Rochester typically applies 10,000 tons of NaCl
to the roads he oversees. The roads that he oversees consist of approximate one fourth to one
third of the entire area of Rochester. Therefore, based on a conservative estimate, it is assumed
that the actual application of NaCl is 30,000 tons.
The calculations do not align with the actual consumption provided by Mr. Aycock because the
calculations assumed there was only one pass made per day for road deicing. Road deicing
occurs during the time in which snow is falling (Lashmet and Thompson, 2012). Therefore more
than one pass through each road may be required depending upon the duration of a snowfall
event. The calculations are off by a factor of 4.34. This is important information because the rate
at which all other road deicers are applied and the corresponding totals will use the same
methodology as NaCl but there will be no available information on actual consumption.
Therefore, results on application rates for CaCl2, CMA, and OBPE will be increased by the
factor of 4.34. Results for NaCl application can be found in Table 6.
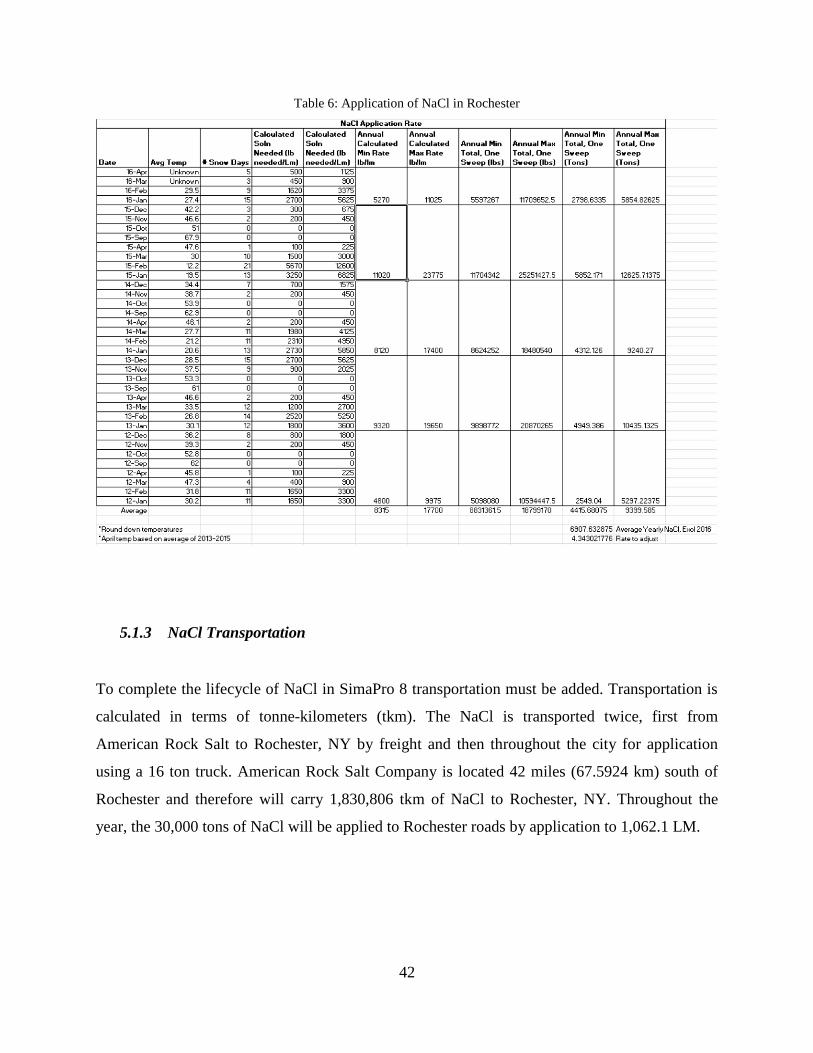
42
Table 6: Application of NaCl in Rochester
5.1.3 NaCl Transportation
To complete the lifecycle of NaCl in SimaPro 8 transportation must be added. Transportation is
calculated in terms of tonne-kilometers (tkm). The NaCl is transported twice, first from
American Rock Salt to Rochester, NY by freight and then throughout the city for application
using a 16 ton truck. American Rock Salt Company is located 42 miles (67.5924 km) south of
Rochester and therefore will carry 1,830,806 tkm of NaCl to Rochester, NY. Throughout the
year, the 30,000 tons of NaCl will be applied to Rochester roads by application to 1,062.1 LM.
43
5.2 CaCl2 Inputs
As per the New York State Department of Transportation Best Practices, Calcium Chloride
(CaCl2) is applied to rock salt (NaCl) in liquid form (Blackburn, Bauer, Amsler, Boselly, &
McElroy, 2004). According to these guidelines, in its aqueous state, it is recommended that a
solution of 32% CaCl2 and H2O (well water) be sprayed on to NaCl. The result is dampened
solid pellets that can be distributed in the same manner as NaCl from spreader trucks but with
different melting capabilities. For the purpose of this research, the aqueous CaCl2 and solid NaCl
mixture is referred to as CaCl2 Deicer.
CaCl2 Deicer in the U.S. is primarily derived from two processes: as a byproduct of the Solvay
process and as evaporite. For the purpose of this research it is assumed that 100% of CaCl2 used
will be from the Solvay process because it is more common (Kemp and Keegan, 2000). The
Solvay process produces CaCl2 in an aqueous solution that, once purified, can be directly applied
to NaCl (Kemp and Keegan, 2000).
It is assumed that the aqueous CaCl2 is transported to the American Rock Salt Mine and is
sprayed on the NaCl by a field sprayer. The CaCl2 derived from the Solvay process comes from
Midland, Michigan where Dow Chemical Manufacturing Facility manufactures 35% of the
CaCl2 available in the U.S. This is located approximately 524 miles (843.30 km) west of
Rochester, NY. The CaCl2 would be transported by freight train, applied to the NaCl, and then
transported to Rochester via freight train (Dow, n.d.).
5.2.1 CaCl2 Material Creation
A solution of 32% CaCl2 and 68% H2O is the standard solution composition for application to
NaCl and it is applied at the rate of 8 gallons per ton of NaCl (Lashmet and Thompson, 2012).
Based upon the molar weight of CaCl2 and H2O there would need to be 13.09 times as much
H2O than CaCl2 to create a mixture that is 68% H2O by weight. This implies that to create 8
gallons, 7.43 gallons of H2O are needed and 0.57 gallons of CaCl2 are needed. From the densities
44
of CaCl2 and H2O the weights per gallon of CaCl2 and H2O are calculated to determine the tons
of total solution needed (0.036 tons solution for every 1 ton of NaCl).
To simplify results in SimaPro 8, the process is created in terms of 1 kg of CaCl2 Deicer. With
the known ratio of solution weight to the weight of NaCl, it is determined that 0.965 kg of NaCl
are required and 0.035 kg of solution are needed. From the calculated quantities of the solution,
by weight and by gallons, 0.005 kg of CaCl2 is needed and 0.008 gallons of H2O are needed.
Calculations to determine all values in this section can be found in Appendix B.
5.2.2 CaCl2 Application
The rate at which CaCl2 Deicer is applied is based upon the same model used in Section 4.1.2 for
NaCl Deicer. The application rates are provided by The National Cooperative Highway Research
Program for both solid and liquid deicer (Blackburn, Bauer, Amsler, Boselly, & McElroy, 2004).
The minimum amount of CaCl2 Deicer needed to be applied (best case scenario) assumes that ice
has not begun to bond to the pavement when application begins. The maximum amount of CaCl2
Deicer needed to be applied (worst case scenario) assume that ice has begun to bond to the
pavement. A medium rate of dilution is assumed.
Equivalent application rates normalized to 100 lb/LM of NaCl are provided by The National
Cooperative Highway Research Program for CaCl2 Deicer. To determine the quantity of CaCl2
Deicer needed, the normalized equivalent rate is multiplied with the factor by which NaCl is
applied at any specific temperature. For example, the normalized equivalent application rate of
solid CaCl2 at 31 F is 111 lb/LM. At 31 F it is suggested that NaCl be applied at 150 lb/LM.
Therefore, to determine the application rate of CaCl2 at 31 F, the normalized rate of 111 lb/LM is
multiplied by the 1.5. The normalized rate is multiplied by 1.5 because this is the factor greater
than 100 that NaCl must be applied at 31 F. The result is an application rate of 166.5 lb/LM of
CaCl2.
45
The deicer studied in this research is not 100% solid CaCl2 nor 100% liquid CaCl2. Therefore the
quantity of liquid CaCl2 solution and solid NaCl must also be calculated. Approximate 2.33% of
the CaCl2 Deicer is CaCl2 solution by weight. At any given temperature the amount of CaCl2
Deicer is determined by multiplying the calculated quantity of 100% liquid CaCl2 by 2.33% and
multiplying the calculated necessary quantity of solid NaCl at the same temperature by 97.7%
and then adding these weights to determine the total CaCl2 Deicer weight.
Winter weather data collected for Rochester from 2012 until April 2016 (Appendix A) was used
to determine the actual application rates. The winter season was considered to be from
September through April. For each month the number of days in which it snowed, as well as the
average monthly temperature, were used to calculate the minimum total amount of CaCl2 Deicer
needed for that month in pounds per lane mile (lb/LM). The data for application rates from The
National Cooperative Highway Research Program (Blackburn, Bauer, Amsler, Boselly, &
McElroy, 2004) is presented as whole numbers therefore, when calculating the required amount
of CaCl2 Deicer the average monthly temperature was always rounded down because rounding
up in any case would make the product ineffective. The annual minimum and maximum totals of
required CaCl2 Deicer lbs/LM were then multiplied by 1,062.1 miles to establish the total
required CaCl2 Deicer per winter season in Rochester.
The average minimum required CaCl2 Deicer for all winters seasons from 2012-2015 was
calculated to be 4,388.48 tons of CaCl2 Deicer. The average calculated maximum required CaCl2
Deicer for all winters seasons from 2012-2015 was 9,197.39 tons of CaCl2 Deicer. Collectively
this provides us with an average winter CaCl2 Deicer use of 6,792.93 tons.
No available information was provided by the Rochester or Monroe County Department of
Transportation for actual CaCl2 Deicer application. Therefore, as stated in the NaCl analysis, the
total calculated amount of deicer must be multiplied by a factor of 4.34 in order to account for
multiple passes of deicing during snowfall events with longer durations. Therefore, 29,501.86
tons of CaCl2 Deicer was calculated to be used, on average, in Rochester between the 2012-2015
winter seasons. Table 7 shows all calculations for CaCl2 Deicer.
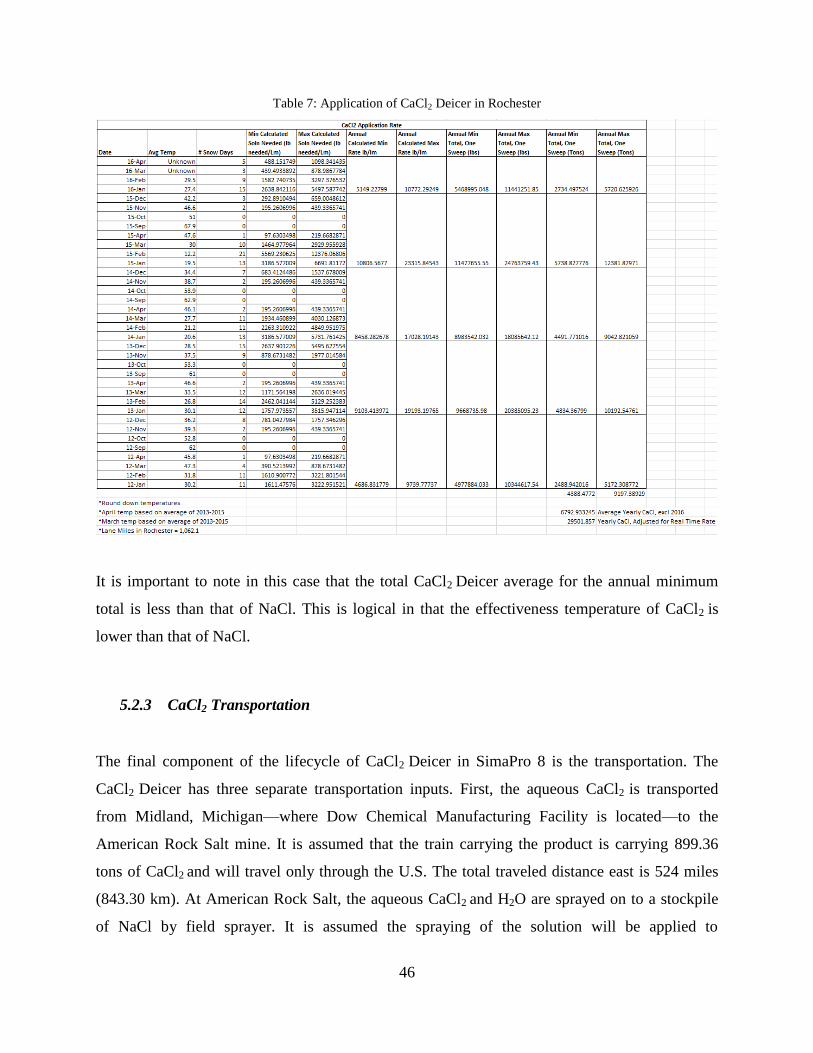
46
Table 7: Application of CaCl2 Deicer in Rochester
It is important to note in this case that the total CaCl2 Deicer average for the annual minimum
total is less than that of NaCl. This is logical in that the effectiveness temperature of CaCl2 is
lower than that of NaCl.
5.2.3 CaCl2 Transportation
The final component of the lifecycle of CaCl2 Deicer in SimaPro 8 is the transportation. The
CaCl2 Deicer has three separate transportation inputs. First, the aqueous CaCl2 is transported
from Midland, Michigan—where Dow Chemical Manufacturing Facility is located—to the
American Rock Salt mine. It is assumed that the train carrying the product is carrying 899.36
tons of CaCl2 and will travel only through the U.S. The total traveled distance east is 524 miles
(843.30 km). At American Rock Salt, the aqueous CaCl2 and H2O are sprayed on to a stockpile
of NaCl by field sprayer. It is assumed the spraying of the solution will be applied to
47
approximately 50 m by 50 m worth of NaCl for a total coverage of 2,500 m2. This amount is an
estimate based on the large quantity of NaCl needed for CaCl2 Deicer.
Secondly, the CaCl2 Deicer is transported from American Rock Salt to Rochester by freight train.
American Rock Salt Company is located 42 miles (67.5924 km) south of Rochester and therefore
will carry 1,800,406 tkm of CaCl2 Deicer to Rochester, NY. Throughout the year, the 29,501.857
tons of CaCl2 Deicer will be applied to Rochester roads by application to 1,062.1 LM.
5.3 CMA Inputs
Calcium Magnesium Acetate (CMA) is produced in a laboratory by creating a reaction between a
calcium-magnesium compound (Mg(0H)2/Ca(OH)2) and acetic acid. The chemical formula for
CMA is (CaMg2(CH3COO)6). There have been several proposed methods for creating CMA,
including fermentation of acetic acid in which acetic acid can be continuously recovered in the
CMA process. For the purpose of this research, the fermentation and recovery process will not be
considered because they are newer and more complex methodologies. The industry
methodology, based upon the Gancy standard methodology from 1988 is used in this research
(Reisinger, Huber, & King, 1995).
It is assumed that the closest primary provider of CMA would supply Rochester in bulk. This
office is based out of Lynbrook, NY. The producer, Schoenberg Salt Company, provides CMA
produced in Hong Kong by a manufacturing company, Asiatech52, and the product is shipped to
Albany where it is held in storage at a distribution site (Shoenberg Salt Company, n.d.). CMA is
available in the form of solid pellets, similar to that of NaCl, and therefore would be transported
and applied in a similar fashion to NaCl.
5.3.1 CMA Material Creation
48
CMA is a product that is entirely created in a manufacturing setting by reacting dolomitic lime
with an acetic acid solution (Gancy and Hinkle, n.d.). The chemical reaction formula used to
create CMA for the purpose of this research is as follows:
Equation 2
CaO.MgO is dolomitic lime and Ac is used to represent acetate. Dolomitic lime is not found in
nature but is instead the result of calcination of dolomite. Dolomitic lime is also not modeled in
SimaPro 8 and therefore a process needs to be constructed in order to use it in the production of
CMA. Dolomitic lime is created when dolomite has been heated above 900 C (1,652 F). This
heating process transforms dolomite, which has a chemical composition of CaCO3.MgCO3, first
to half-burnt dolomite with a chemical composition of CaCO3.MgCO and then to dolomitic lime
with a chemical composition of CaO.MgO (L Hoist Mineral and Lime Producer, n.d.).
In order to create the dolomitic lime in SimaPro 8, the molar weights of dolomite and dolomitic
lime were first calculated to determine the quantity of dolomite needed. The quantity of dolomite
needed was determined based upon the ratio of dolomitic lime molar weight to dolomite molar
weight. Based on this calculation, it was determined that 1.9134 kg of dolomite would be
required to create 1 kg of dolomitic lime. The process for calcinating and creating dolomitic lime
was based upon the process for creating “Quicklime” which was modeled in SimaPro 8.
Quicklime is the calcium oxide component of CaO.MgO and therefore serves as a good model
for creating dolomitic lime. The inputs used to create “Quicklime” were used as inputs for
dolomitic lime but were scaled relative to the quantity and need requirements for dolomitic lime.
All quantities and inputs are shown in Figure 6. Additionally, 0.0051 kg of solid waste in
sanitary landfill was input as a “Known Output to Technosphere.”
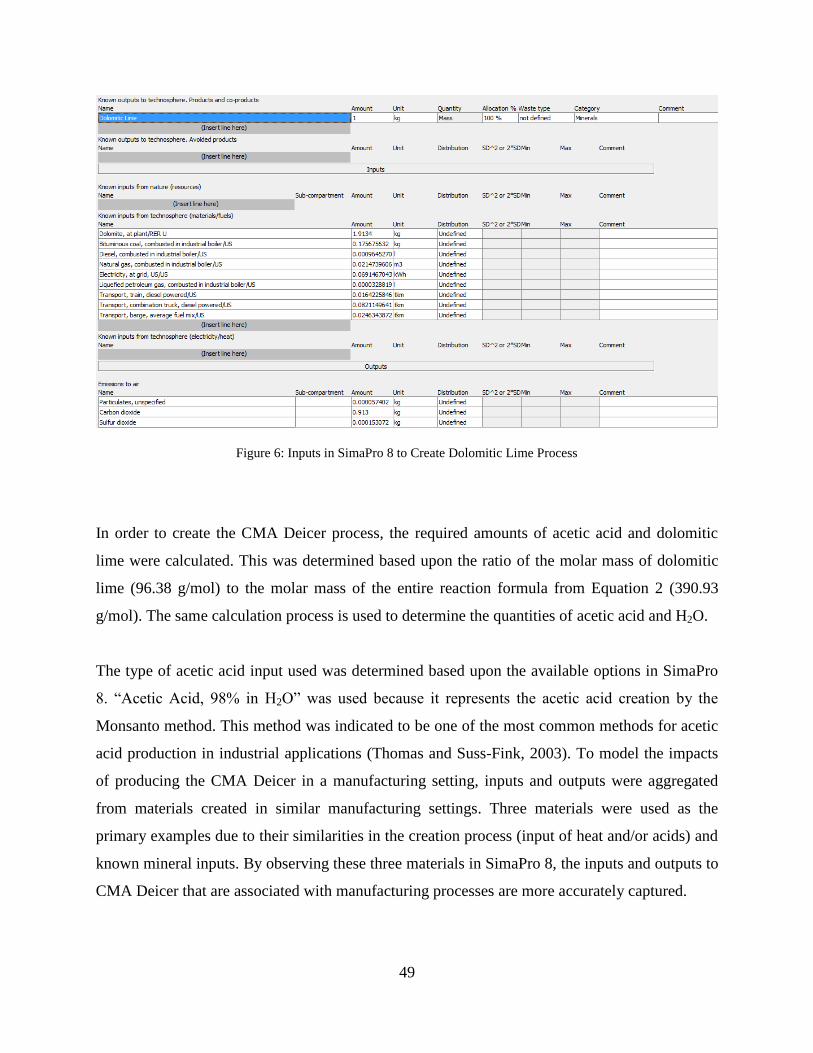
49
Figure 6: Inputs in SimaPro 8 to Create Dolomitic Lime Process
In order to create the CMA Deicer process, the required amounts of acetic acid and dolomitic
lime were calculated. This was determined based upon the ratio of the molar mass of dolomitic
lime (96.38 g/mol) to the molar mass of the entire reaction formula from Equation 2 (390.93
g/mol). The same calculation process is used to determine the quantities of acetic acid and H2O.
The type of acetic acid input used was determined based upon the available options in SimaPro
8. “Acetic Acid, 98% in H2O” was used because it represents the acetic acid creation by the
Monsanto method. This method was indicated to be one of the most common methods for acetic
acid production in industrial applications (Thomas and Suss-Fink, 2003). To model the impacts
of producing the CMA Deicer in a manufacturing setting, inputs and outputs were aggregated
from materials created in similar manufacturing settings. Three materials were used as the
primary examples due to their similarities in the creation process (input of heat and/or acids) and
known mineral inputs. By observing these three materials in SimaPro 8, the inputs and outputs to
CMA Deicer that are associated with manufacturing processes are more accurately captured.
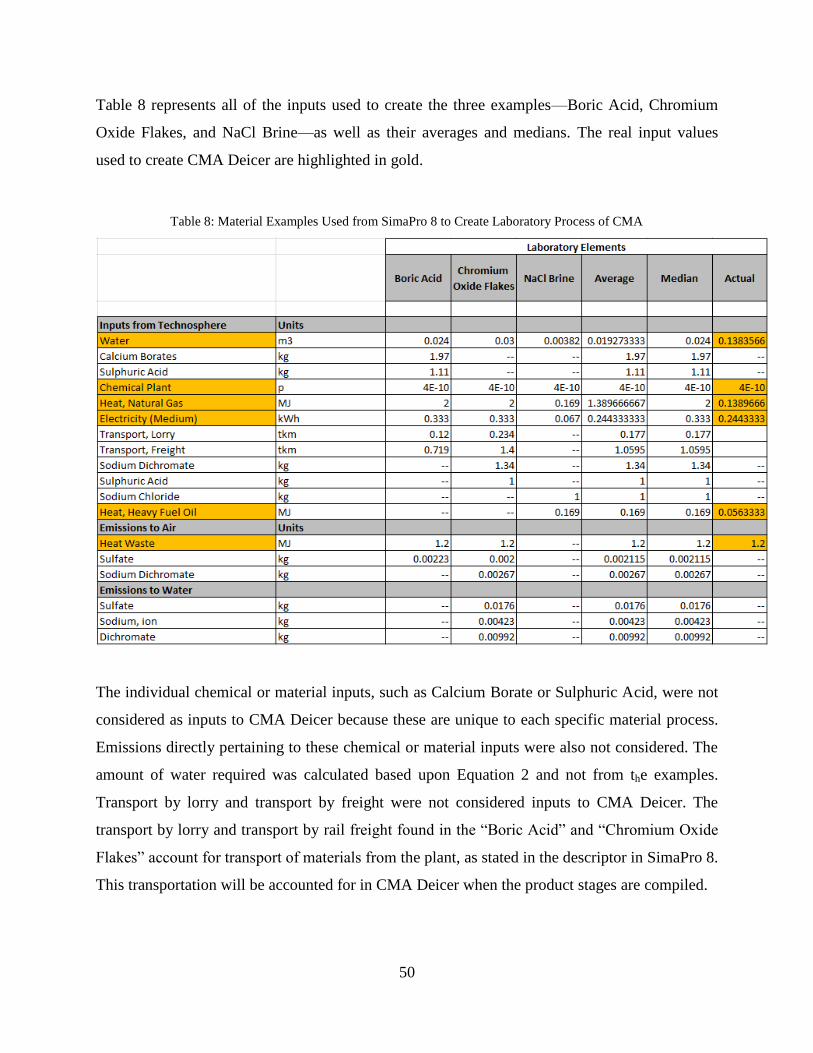
50
Table 8 represents all of the inputs used to create the three examples—Boric Acid, Chromium
Oxide Flakes, and NaCl Brine—as well as their averages and medians. The real input values
used to create CMA Deicer are highlighted in gold.
Table 8: Material Examples Used from SimaPro 8 to Create Laboratory Process of CMA
The individual chemical or material inputs, such as Calcium Borate or Sulphuric Acid, were not
considered as inputs to CMA Deicer because these are unique to each specific material process.
Emissions directly pertaining to these chemical or material inputs were also not considered. The
amount of water required was calculated based upon Equation 2 and not from the examples.
Transport by lorry and transport by freight were not considered inputs to CMA Deicer. The
transport by lorry and transport by rail freight found in the “Boric Acid” and “Chromium Oxide
Flakes” account for transport of materials from the plant, as stated in the descriptor in SimaPro 8.
This transportation will be accounted for in CMA Deicer when the product stages are compiled.
51
For all other example inputs, the average input quantities for all observed materials wer used to
determine the corresponding input quantity for CMA Deicer. In the case of “Heat, Heavy Fuel
Oil” the average of the input quantities was recalculated to reflect the missing inputs from “Boric
Acid” and “Chromium Oxide Flakes” and reflect those missing inputs as zeros. This was not
done in the case of “Heat Waste” because the median of the materials’ input values was also 1.2
and therefore justified the calculation.
5.3.2 CMA Application
The rate at which CMA is applied is based upon the same model used in Section 4.1.2 and 4.2.2.
The application rates are provided by The National Cooperative Highway Research Program for
both solid and liquid deicer (Blackburn, Bauer, Amsler, Boselly, & McElroy, 2004). The
minimum amount of CMA needed to be applied (best case scenario) assumes that ice has not
begun to bond to the pavement when application begins. The maximum amount of CMA needed
to be applied (worst case scenario) assumes that ice has begun to bond to the pavement. A
medium rate of dilution is assumed.
Equivalent application rates normalized to 100 lb/LM of NaCl are provided by The National
Cooperative Highway Research Program for CMA. To determine the quantity of CMA needed,
the normalized equivalent rate is multiplied by the factor greater than 100 that NaCl application
rates are given. The CMA in this research is solid and therefore converting application rates are
relatively simple.
Winter weather data collected for Rochester from 2012 until April 2016 was used to determine
the application rates (Appendix A). The winter season was considered to be from September
through April. For each month the number of days in which it snowed, as well as the average
monthly temperature, were used to calculate the minimum total amount of CMA needed for that
month in pounds per lane mile (lb/LM). The data for application rates from The National
Cooperative Highway Research Program (Blackburn, Bauer, Amsler, Boselly, & McElroy, 2004)
is presented as whole numbers therefore, when calculating the required amount of CMA the
52
average monthly temperature was always rounded down because rounding up in any case would
make the product ineffective. The annual minimum and maximum totals of required CMA
lbs/LM were then multiplied by 1,062.1 miles to establish the total required CMA per winter
season in Rochester.
The average minimum calculated CMA for all winters seasons from 2012-2015 was 6,703.87
tons of CMA. The average maximum calculated CMA for all winters seasons from 2012-2015
was 14,259.49 tons of CMA. Collectively this provides us with an average winter CMA use of
10,481.68 tons.
No available information was provided by the Rochester or Monroe County Department of
Transportation for actual CMA Deicer application. Therefore, as stated in Section 4.1.2 and
4.2.2, the total calculated amount of deicer must be multiplied by a factor of 4.34 in order to
account for multiple passes of deicing during snowfall events with longer durations. This
calculation determines that 45,522.16 tons of CMA would be used on average in Rochester
between the 2012-2015 winter seasons. Table 9 shows all calculations for CMA applications.
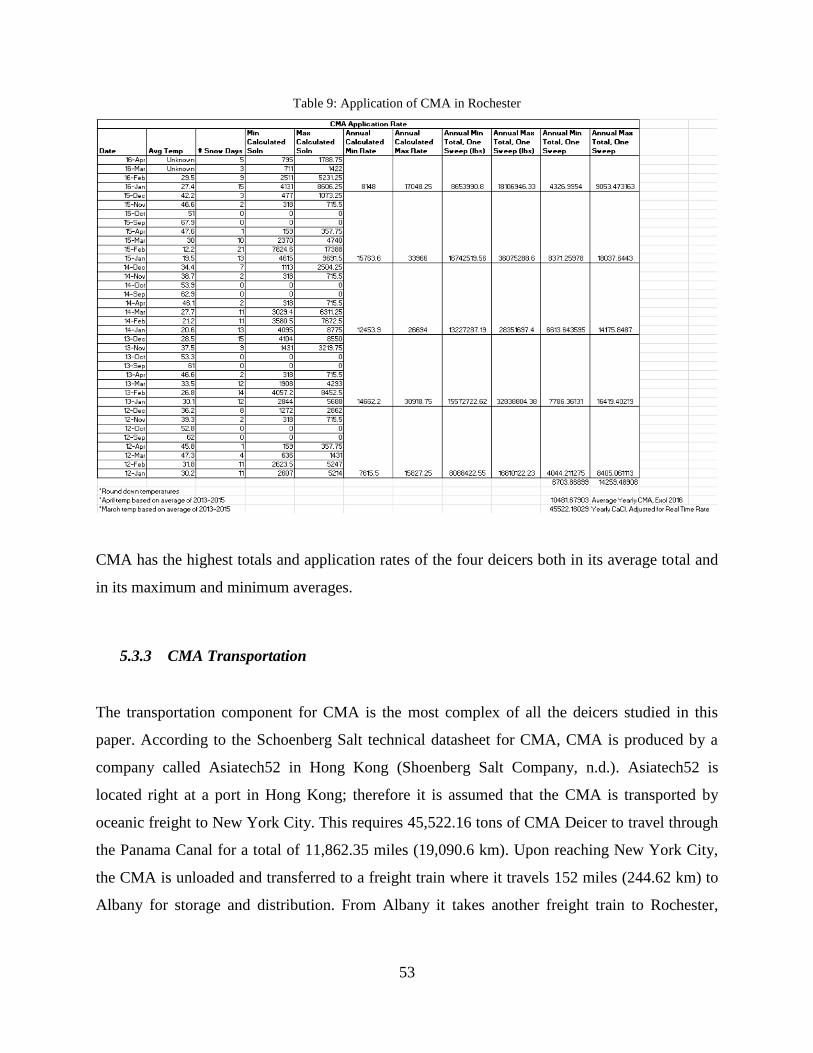
53
Table 9: Application of CMA in Rochester
CMA has the highest totals and application rates of the four deicers both in its average total and
in its maximum and minimum averages.
5.3.3 CMA Transportation
The transportation component for CMA is the most complex of all the deicers studied in this
paper. According to the Schoenberg Salt technical datasheet for CMA, CMA is produced by a
company called Asiatech52 in Hong Kong (Shoenberg Salt Company, n.d.). Asiatech52 is
located right at a port in Hong Kong; therefore it is assumed that the CMA is transported by
oceanic freight to New York City. This requires 45,522.16 tons of CMA Deicer to travel through
the Panama Canal for a total of 11,862.35 miles (19,090.6 km). Upon reaching New York City,
the CMA is unloaded and transferred to a freight train where it travels 152 miles (244.62 km) to
Albany for storage and distribution. From Albany it takes another freight train to Rochester,
54
adding an additional 226 miles (363.71 km). When the CMA reaches Rochester the 45,522.16
tons of deicer are applied over 1,062.1 LM.
5.4 OBPE Inputs
As mentioned in Section 3.2.1, for the purpose of this research the Organic Based Performance
Enhancer (OBPE) will refer to deicer that uses a beet juice product as an additive. Because
deicing using OBPE is a relatively new process, both in its manufacturing as well as in its
application as a road deicer, there is not as much scientific data readily available. Therefore,
where scientific literature is lacking, the current products available on market will be used as a
reference point.
It is assumed that the beet juice additive will be a molasses derived as a byproduct of sugar beet
production. Sugar beets are used in the U.S., and in other countries throughout the world, as an
alternative method of sugar production. Sugar beets are grown primarily in the Midwestern
regions of the country and then transported to refineries where they are separated in to their three
primary components: sugar, molasses, and pulp. When sugar is the primary product being
sought, the molasses will go through additional refining processes to ensure no sugar is wasted.
Upon refining to obtain sugar, the molasses and pulps are discarded but the possibility of using
sugar beet molasses for deicing provides a potential opportunity to utilize this waste material
(USDA, n.d.).
It is assumed that sugar beet molasses is transported by rail from Michigan, the closest region to
the Northeast that produces sugar beets on a large scale (USDA, n.d.). More specifically, this
product is assumed to come from Michigan Sugar Company in Bay City, which produces
650,000 tons of molasses annually (Michigan Sugar Company, n.d.). Because this company
owns large amounts of land, most of the farming and refinery processes are located on site. It is
assumed that the sugar beets are brought directly from the farms, where they were harvested, and
refined at the factories on site to create the products and byproducts (Michigan Sugar Company,
n.d.).
55
5.4.1 OBPE Material Creation
The sugar beet production process, including farms, pulp, sugar and molasses, is modeled in
SimaPro 8. The process for “Molasses” includes transportation to and inputs from the farm and
the refinery. The inputs and quantities are based upon the production of 250 kilotons of sugar
and the product inventory overview states, “Sweet juice is extracted from the sugar beets by
diffusion. The juice is then purified and crystallized to sugar. Molasses comes as a by-product of
the crystallization process.”
Sugar beet molasses is added directly to a solid road deicer to enhance its performance and/or
decrease its environmental impact. For the purpose of this research, OBPE will be added to NaCl
because, in its current state, NaCl is the least expensive product on market and therefore is most
likely to be the base deicer in practice.
In order to create the OBPE Deicer, the guidelines from U.S. Patent 6416684 B1 were used. This
patent states that approximately 8 gallons of molasses is to be added per ton of solid road deicer
(Bloomer, 2002), which aligns with the guidelines from NYS DOT (Blackburn, Bauer, Amsler,
Boselly, & McElroy, 2004). In addition, approximately 10.7 lbs of molasses are in one gallon. It
can be computed, then, that in order to make 1 kg of OBPE Deicer, 0.957 kg of NaCl are
required and 0.059 kg of Sugar Molasses are required.
No other inputs are considered in the OBPE Deicer process. All additional inputs from nature
and the technosphere are capture in the NaCl, NaCl Mine, Sugar Beet Refinery, Sugar Beet
Farm, and Molasses production.
5.4.2 OBPE Application
The rate at which OBPE Deicer is applied is based upon the same model used in Section 4.1.2,
4.2.2, and 4.3.2. Unlike the other deicers studied in this research, OBPE Deicer application rates
were not provided by The National Cooperative Highway Research Program nor were they
provided by the NYS DOT. Therefore, the application rates for OBPE Deicer were determined
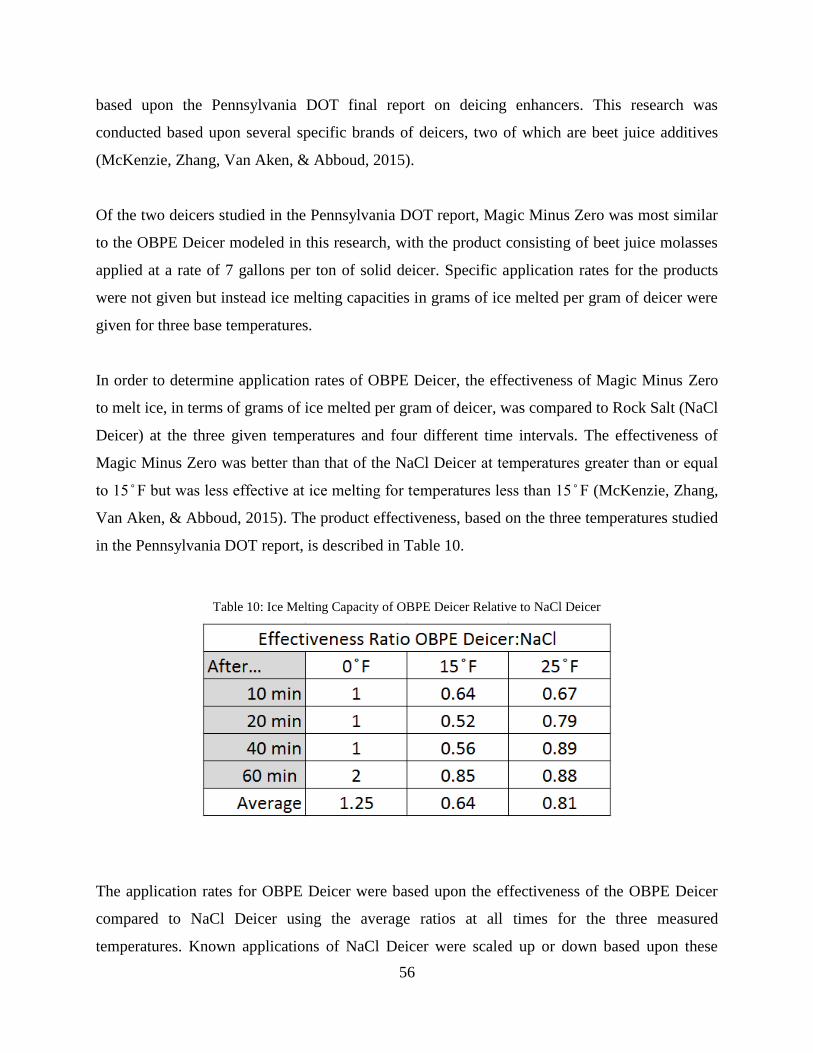
56
based upon the Pennsylvania DOT final report on deicing enhancers. This research was
conducted based upon several specific brands of deicers, two of which are beet juice additives
(McKenzie, Zhang, Van Aken, & Abboud, 2015).
Of the two deicers studied in the Pennsylvania DOT report, Magic Minus Zero was most similar
to the OBPE Deicer modeled in this research, with the product consisting of beet juice molasses
applied at a rate of 7 gallons per ton of solid deicer. Specific application rates for the products
were not given but instead ice melting capacities in grams of ice melted per gram of deicer were
given for three base temperatures.
In order to determine application rates of OBPE Deicer, the effectiveness of Magic Minus Zero
to melt ice, in terms of grams of ice melted per gram of deicer, was compared to Rock Salt (NaCl
Deicer) at the three given temperatures and four different time intervals. The effectiveness of
Magic Minus Zero was better than that of the NaCl Deicer at temperatures greater than or equal
to 15 F but was less effective at ice melting for temperatures less than 15 F (McKenzie, Zhang,
Van Aken, & Abboud, 2015). The product effectiveness, based on the three temperatures studied
in the Pennsylvania DOT report, is described in Table 10.
Table 10: Ice Melting Capacity of OBPE Deicer Relative to NaCl Deicer
The application rates for OBPE Deicer were based upon the effectiveness of the OBPE Deicer
compared to NaCl Deicer using the average ratios at all times for the three measured
temperatures. Known applications of NaCl Deicer were scaled up or down based upon these
57
ratios using the intervals of [0 F, 15 F), [15 F, 25 F), and 25 F and greater. In only one instance
was the average monthly temperature less than 15 F.
The NaCl Deicer application rate, from which the OBPE Deicer application is being determined,
is based upon The National Cooperative Highway Research Program (Blackburn, Bauer, Amsler,
Boselly, & McElroy, 2004). As stated in Section 4.1.2, the rate of application of NaCl is based
upon a standard dilution potential and best and worst case scenarios. The adjusted dilution
potential is assumed to be “medium” for all deicers in this research. The minimum calculated
amount of NaCl needed to be applied (best case scenario) assumes that ice has not begun to bond
to the pavement when application begins. The maximum calculated amount of NaCl needed to
be applied (worst case scenario) assume that ice has begun to bond to the pavement.
Application rates of NaCl Deicer can be found in Table 6. Calculated application rates of OBPE
Deicer can be found in Table 11. OBPE Deicer has the lowest calculated required application per
winter season in Rochester, NY with an average of 25,527.64 tons required.
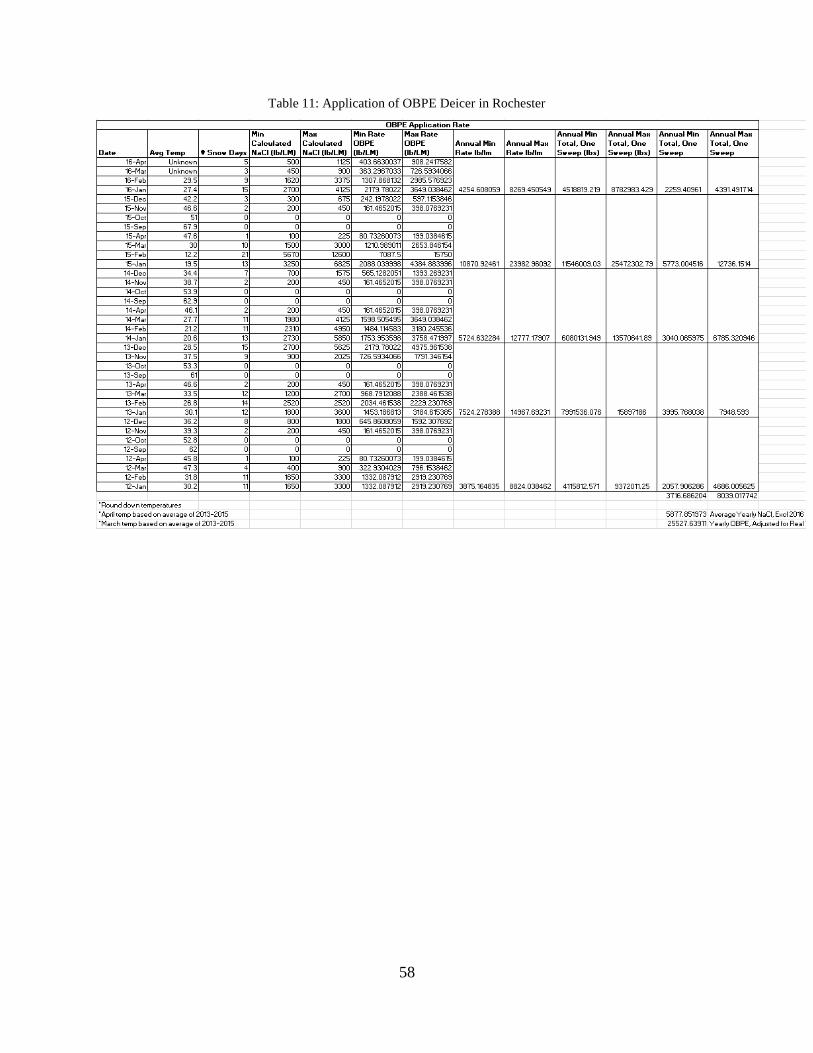
58
Table 11: Application of OBPE Deicer in Rochester
59
5.4.3 OBPE Transportation
The final component of the lifecycle of OBPE Deicer in SimaPro 8 is the transportation. The
OBPE Deicer has three separate transportation inputs. First, the sugar beet molasses must be
transported from Bay City, Michigan—where the Michigan Sugar Company is located—to the
American Rock Salt mine. It is assumed that the train carrying the product is carrying 1,092.58
tons of sugar beet molasses and will travel only through the U.S. The total traveled distance east
is 507 miles (815.94 km). At American Rock Salt, the sugar beet molasses and H2O are sprayed
on to a stockpile of NaCl by field sprayer.
The CaCl2 Deicer was used as a base for determining how much of the field sprayer would be
required. The total amount of solid NaCl required for CaCl2 Deicer and OBPE Deicer was
calculated. The ratio of solid NaCl required for CaCl2 Deicer and OBPE Deicer is 0.86.
Therefore, because CaCl2 Deicer was assumed to require 2,500 m2 of field spraying, OBPE
Deicer is assumed to require 2,145.4 m2 of field spraying.
Secondly, the OBPE Deicer is transported from American Rock Salt to Rochester by freight
train. American Rock Salt Company is located 42 miles (67.5924 km) south of Rochester and
therefore will carry 1,557,872 tkm of OBPE Deicer to Rochester, NY. Throughout the year, the
25,527.64 tons of OBPE Deicer will be need for Rochester roads by application to 1,062.1 LM.
5.5 Environmental Impact Inputs
The outline of the environmental impact methodology is found in Section 3.3.4. In order to
capture the impact of deicers post-application, the number of chemical elements added to the
environment is calculated. This is calculated using the molar weights of each chemical element
and the percentage of deicer molecule that is comprised of an individual chemical element.
These percentages were used to determine the amount of the deicer that is comprised of a
specific chemical element. The elements considered in this research from the four deicers are Ca,
Cl, Mg, and Na.
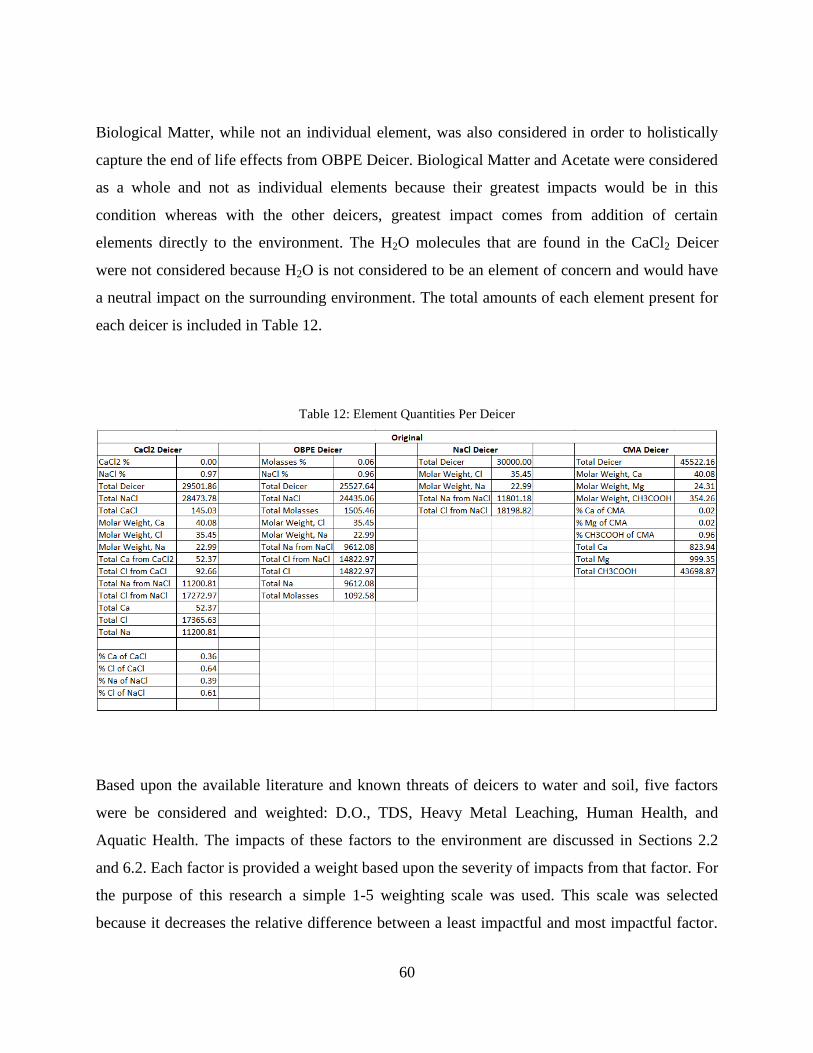
60
Biological Matter, while not an individual element, was also considered in order to holistically
capture the end of life effects from OBPE Deicer. Biological Matter and Acetate were considered
as a whole and not as individual elements because their greatest impacts would be in this
condition whereas with the other deicers, greatest impact comes from addition of certain
elements directly to the environment. The H2O molecules that are found in the CaCl2 Deicer
were not considered because H2O is not considered to be an element of concern and would have
a neutral impact on the surrounding environment. The total amounts of each element present for
each deicer is included in Table 12.
Table 12: Element Quantities Per Deicer
Based upon the available literature and known threats of deicers to water and soil, five factors
were be considered and weighted: D.O., TDS, Heavy Metal Leaching, Human Health, and
Aquatic Health. The impacts of these factors to the environment are discussed in Sections 2.2
and 6.2. Each factor is provided a weight based upon the severity of impacts from that factor. For
the purpose of this research a simple 1-5 weighting scale was used. This scale was selected
because it decreases the relative difference between a least impactful and most impactful factor.
61
Any scale can be chosen as long as it accurately represents the difference in impacts post-
application. The results from this model will be relative to one another, but by varying the
weighting scale the difference in impact of each deicer will vary.
As discussed in Section 3.3.4, the factors chosen and their associated weights should be based
upon a review of the literature. The goal is to accurately capture the potential ways in which a
product may impact the environment post-application. While there is some discretion required in
the selection and weighting process, thorough literature review, research, and analysis should
provide substantive rationale behind all inputs.
Upon determining weights and factors, all chemical components (Ca, Cl, Mg, Na, Acetate, and
Biological Matter) associated with the deicers will be marked as either “yes” or “no” to having
direct associated changes with one of the five factors. If an element is marked as “yes” to having
a direct association with one of the environmental factors, the assigned weight of that
environmental factor is added together with all other impairment factor weights that were
marked “yes.” The sum of all weights is then multiplied by the total quantity of the chemical
component present. Chemical component quantities will vary from each deicer. For the purpose
of this research, this final number is called the Environmental Impact Score. An Environmental
Impact Score can be assigned to each deicer based upon its chemical composition of these
elements.
The terminology and methodology for creating an Environmental Impact Score is unique to this
research and cannot be directly compared to any other metric or impact score that is not included
in this model. This research serves as a first-time case study for this model, which has been
developed to capture effects of deicing post-application and compare the results with standard
lifecycle analysis results from SimaPro 8.
In Table 13 the weights and Total Impairment Scores for each chemical component are given. As
discussed, the weights were based on a 1-5 scale. This scale was chosen in order to show the
differences in severity of each factor without over-inflating differences between factors. A
weight of one was considered to represent minute impact, two represents some impact, three
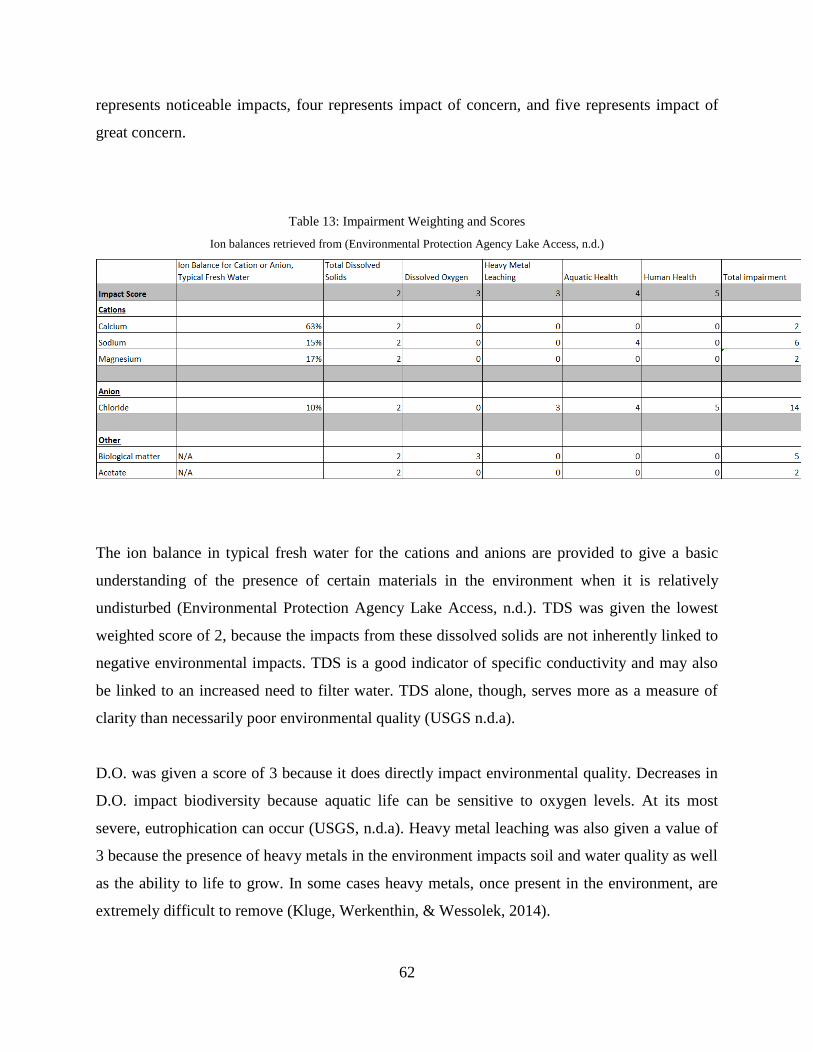
62
represents noticeable impacts, four represents impact of concern, and five represents impact of
great concern.
Table 13: Impairment Weighting and Scores
Ion balances retrieved from (Environmental Protection Agency Lake Access, n.d.)
The ion balance in typical fresh water for the cations and anions are provided to give a basic
understanding of the presence of certain materials in the environment when it is relatively
undisturbed (Environmental Protection Agency Lake Access, n.d.). TDS was given the lowest
weighted score of 2, because the impacts from these dissolved solids are not inherently linked to
negative environmental impacts. TDS is a good indicator of specific conductivity and may also
be linked to an increased need to filter water. TDS alone, though, serves more as a measure of
clarity than necessarily poor environmental quality (USGS n.d.a).
D.O. was given a score of 3 because it does directly impact environmental quality. Decreases in
D.O. impact biodiversity because aquatic life can be sensitive to oxygen levels. At its most
severe, eutrophication can occur (USGS, n.d.a). Heavy metal leaching was also given a value of
3 because the presence of heavy metals in the environment impacts soil and water quality as well
as the ability to life to grow. In some cases heavy metals, once present in the environment, are
extremely difficult to remove (Kluge, Werkenthin, & Wessolek, 2014).
63
Finally, aquatic and human health were assigned values of 4 and 5 respectively. An element was
determined to be directly correlated with aquatic health or human health if there is a
corresponding standard set for that elements presence in the environment. A standard set by the
EPA implies there have been or continue to be issue, or that impacts to aquatic health or
environmental health can be extensive. Aquatic health was assigned a 4 and human health was
assigned a 5 because human health is often prioritized. (New Hampshire Department of
Environmental Services, 2016)
Direct association of an element with one of the five factors was based upon information from
government resources such as the EPA and USGS, as well as from readily available scientific
literature (USGS, n.d.a; New Hampshire Department of Environmental Services, 2016; Bang and
Johnston, 1998; Warner, 2016; USGS, 2014; Brener and Horner, 1992; Siegel, 2007).
6. Results
To calculate results, the deicers impacts were calculated per functional unit. The environmental
impacts of the deicers are displayed graphically and in tables in order to best show how the
impacts compare to one another. The pre-application impacts come from the results of the
SimaPro 8 inputs. Impacts are broken up into three categories: Ozone Depletion (kg CFC-11 eq),
Climate Change (kg CO2 eq), and Ecopoints (MPt). Ecopoints are calculated and determined
using ReCiPe Endpoint Hierarchical methodology whereas ozone depletion and climate change
are calculated and determined using ReCiPe Midpoint Hierarchical methodology. The purpose of
using Midpoint Hierarchical methodology is to reduce the number of assumptions that must be
made in SimaPro 8. ReCiPe Endpoint Hierarchical methodology is used to measure Ecopoints
because a single score cannot be determined using Midpoint Hierarchical methodology
(International Organization of Standardization, n.d.).
64
Climate Change and Ozone Depletion are measured in kg of CO2 equivalent and kg of CFC-11
equivalent, respectively. These measures are an aggregate of impacts of emissions, depletion of
resources, etc. and converted to be equivalent to how much CO2 or CFC-11 would be added to
the environment. CO2 and CFC-11 are both greenhouse gases that are known to impact the
environment. Climate change is distinguishable from ozone depletion in that ozone depletion
specifically measures impacts to the ozone whereas climate change measures overall impact.
These metrics are similar but important to differentiate.
The post-application impacts to the environment are not included in this information and are
displayed separately based upon each deicer’s Environmental Impact Score.
All environmental impact categories, both pre- and post-application show that CMA Deicer is
least impactful while NaCl Deicer is most impactful in every category. The impacts of NaCl
Deicer, CaCl2 Deicer, and OBPE Deicer had impacts scores that were relatively close to one
another whereas CMA Deicer had only a fraction of the impacts of the other three deicers across
all assessments.
6.1 SimaPro Results
In all results from the SimaPro 8 model, CMA Deicer was the least impactful to the environment
whereas NaCl Deicer was the most impactful to the environment. The single score, represented
in Ecopoints (MPt), was calculated first and broken down in to impacts to human health,
ecosystems, and resources. As displayed in Figure 7, NaCl Deicer had the highest total Ecopoints
score, followed by CaCl2 Deicer, then OBPE Deicer, and CMA Deicer had the fewest total
Ecopoints. The total Ecopoint scores received for each deicer are found in Table 14. NaCl Deicer
also scored the highest in the categories of human health, ecosystems, and resources and CMA
Deicer also had the fewest Ecopoints in all three categories. To better understand the relative
impacts of all deicers in terms of Ecopoints, Table 15 shows the relative magnitude of impact of
each deicer as compared to CMA Deicer. Table 15 indicates that NaCl Deicer has a score 11.45
times greater than CMA Deicer. CaCl2 Deicer has a score 11 times greater than CMA Deicer.
OBPE Deicer has a score 9.33 times greater than CMA Deicer.
65
Figure 8 displays the relative percentage of impact in terms of Ecopoints for each Deicer. This
information coincides with the single scores of Ecopoints associated with each deicer and serves
to visually demonstrate relative impact in terms of Ecopoints and categorized by impacts to
human health, ecosystems, and resources. Table 16 provides the specific data per category from
which the Ecopoints were derived. Ecopoints were calculated within SimaPro 8 and are intended
to be a single metric of aggregated impact information that allows for easy comparison. Table 16
displays some of the information from which the Ecopoints were determined. Human health is
reported in DALYs, impact to ecosystems is reported in species-years, and impact to resources is
reported in USD. DALY (Disability-Adjusted Life Year) is a measure that equates to one lost
year of healthy life. This is calculated by summing the average years of life lost as a result of
premature death with the years of life lost due to health conditions. Species-year is a measure of
the extinction rate of species by determining the extinction rate of a set number of species over a
set number of years (World Health Organization, 2016).
Table 17 indicates the relative impacts of each deicer, per category, as based upon the original
units. Each deicers magnitude of impact relative to CMA Deicer (the least impactful deicer) is
displayed. In the categories of human health and ecosystems, impacts relative to CMA Deicer
range from 12-18 times more impactful. In the category of resources, the difference is less
profound, ranging from 4-6 times more impactful than CMA Deicer.
In all results from the SimaPro 8 model, transportation and application of the deicers were the
least impactful to the process. As displayed in Appendix C, total transportation accounts for
approximately 0.52% of the NaCl Deicer process, 0.54% of the CaCl2 Deicer process, and 0.60%
of the OBPE Deicer process. The exception is that transportation accounts for approximately
24.22% of the CMA Deicer process. From this information, it is assumed that the production and
mining processes are the largest contributors to a deicer’s pre-application environmental effects.
This is discussed more in Section 7.
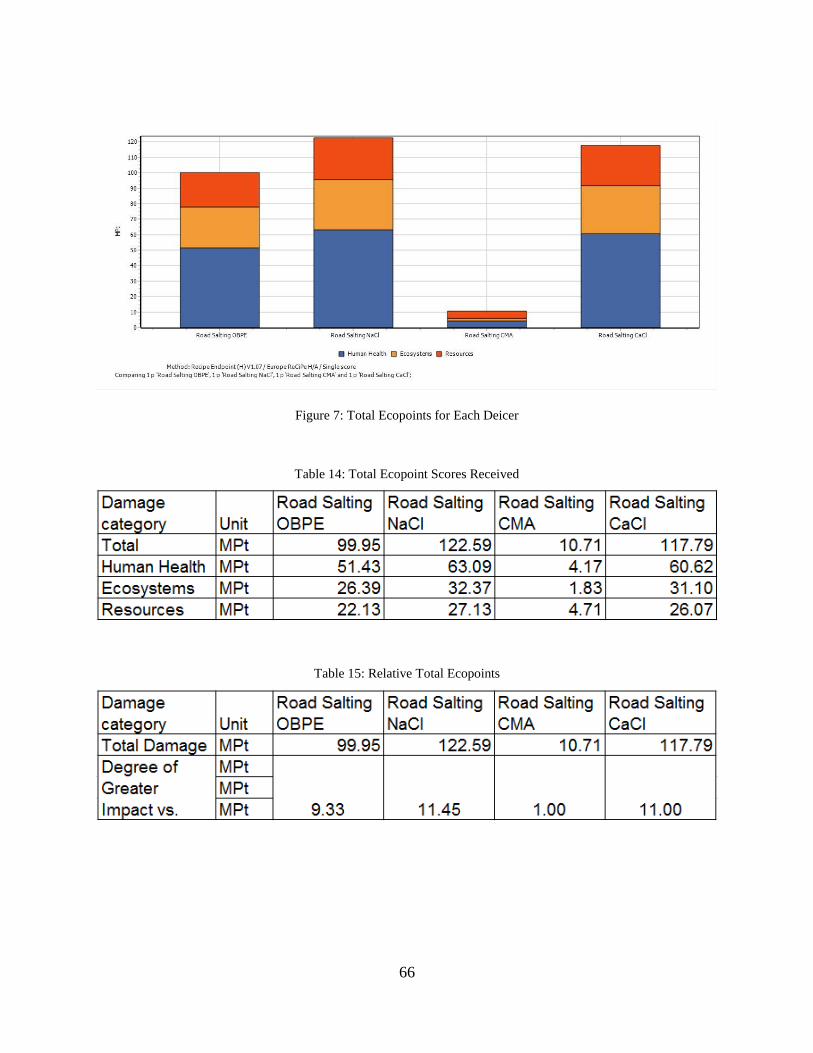
66
Figure 7: Total Ecopoints for Each Deicer
Table 14: Total Ecopoint Scores Received
Table 15: Relative Total Ecopoints
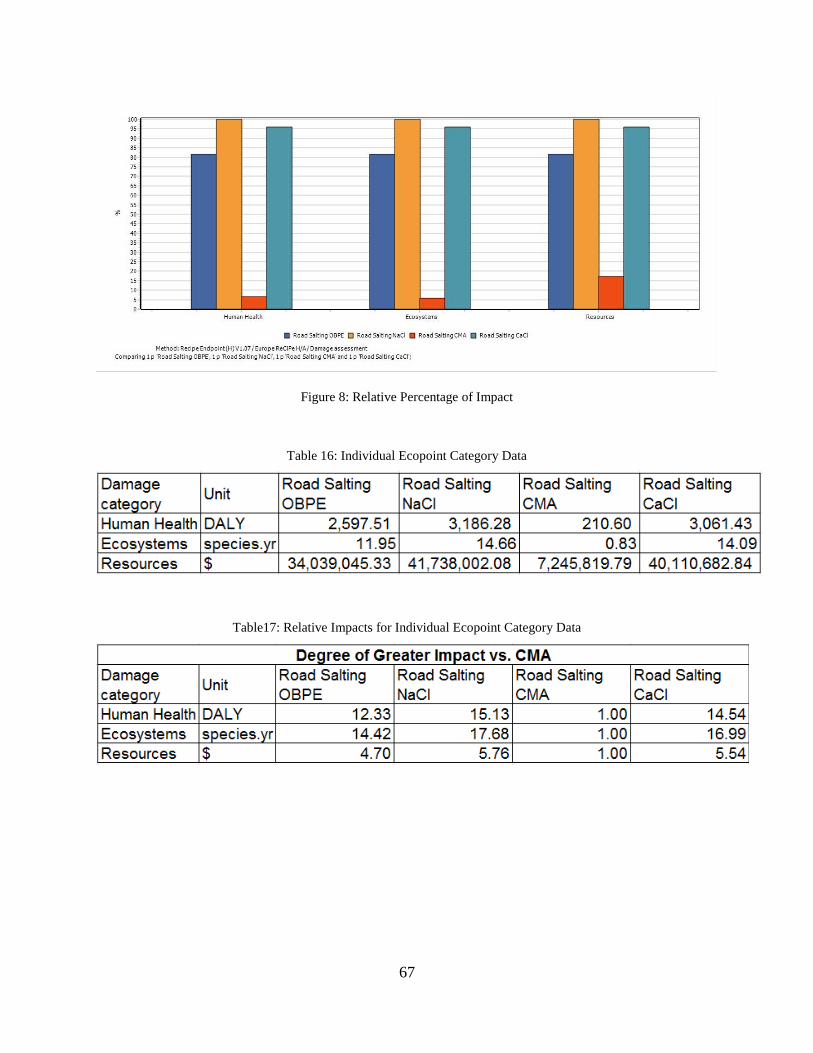
67
Figure 8: Relative Percentage of Impact
Table 16: Individual Ecopoint Category Data
Table17: Relative Impacts for Individual Ecopoint Category Data
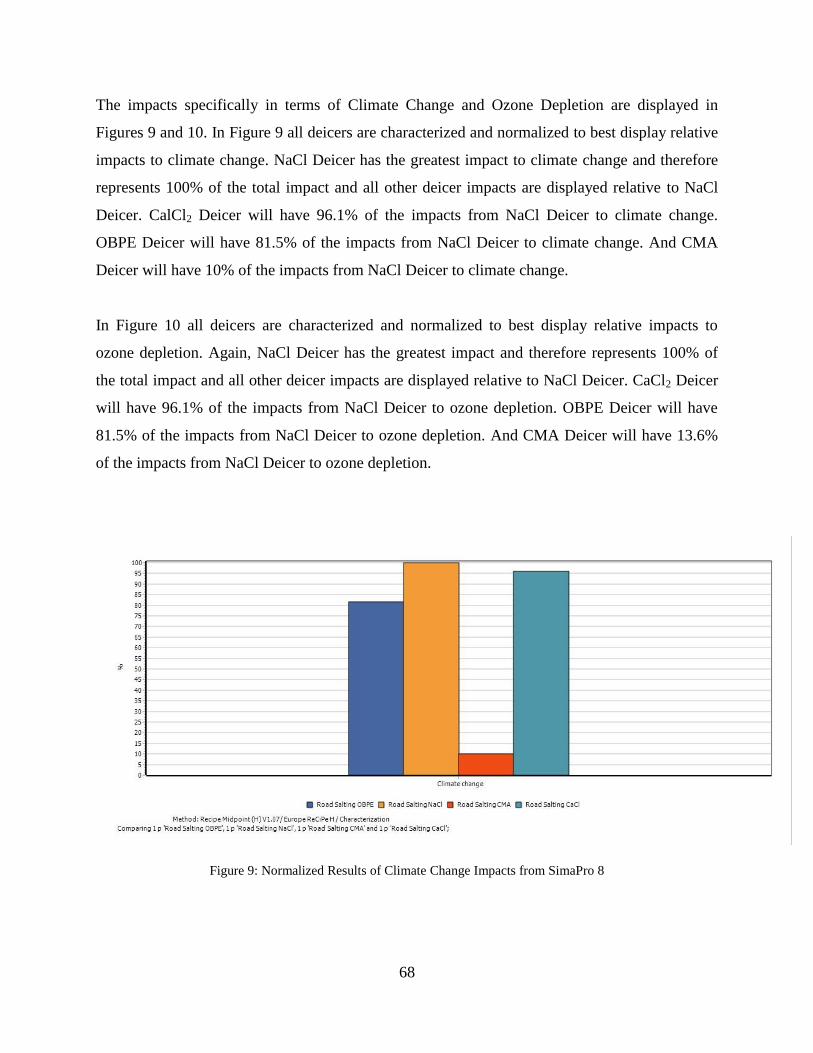
68
The impacts specifically in terms of Climate Change and Ozone Depletion are displayed in
Figures 9 and 10. In Figure 9 all deicers are characterized and normalized to best display relative
impacts to climate change. NaCl Deicer has the greatest impact to climate change and therefore
represents 100% of the total impact and all other deicer impacts are displayed relative to NaCl
Deicer. CalCl2 Deicer will have 96.1% of the impacts from NaCl Deicer to climate change.
OBPE Deicer will have 81.5% of the impacts from NaCl Deicer to climate change. And CMA
Deicer will have 10% of the impacts from NaCl Deicer to climate change.
In Figure 10 all deicers are characterized and normalized to best display relative impacts to
ozone depletion. Again, NaCl Deicer has the greatest impact and therefore represents 100% of
the total impact and all other deicer impacts are displayed relative to NaCl Deicer. CaCl2 Deicer
will have 96.1% of the impacts from NaCl Deicer to ozone depletion. OBPE Deicer will have
81.5% of the impacts from NaCl Deicer to ozone depletion. And CMA Deicer will have 13.6%
of the impacts from NaCl Deicer to ozone depletion.
Figure 9: Normalized Results of Climate Change Impacts from SimaPro 8
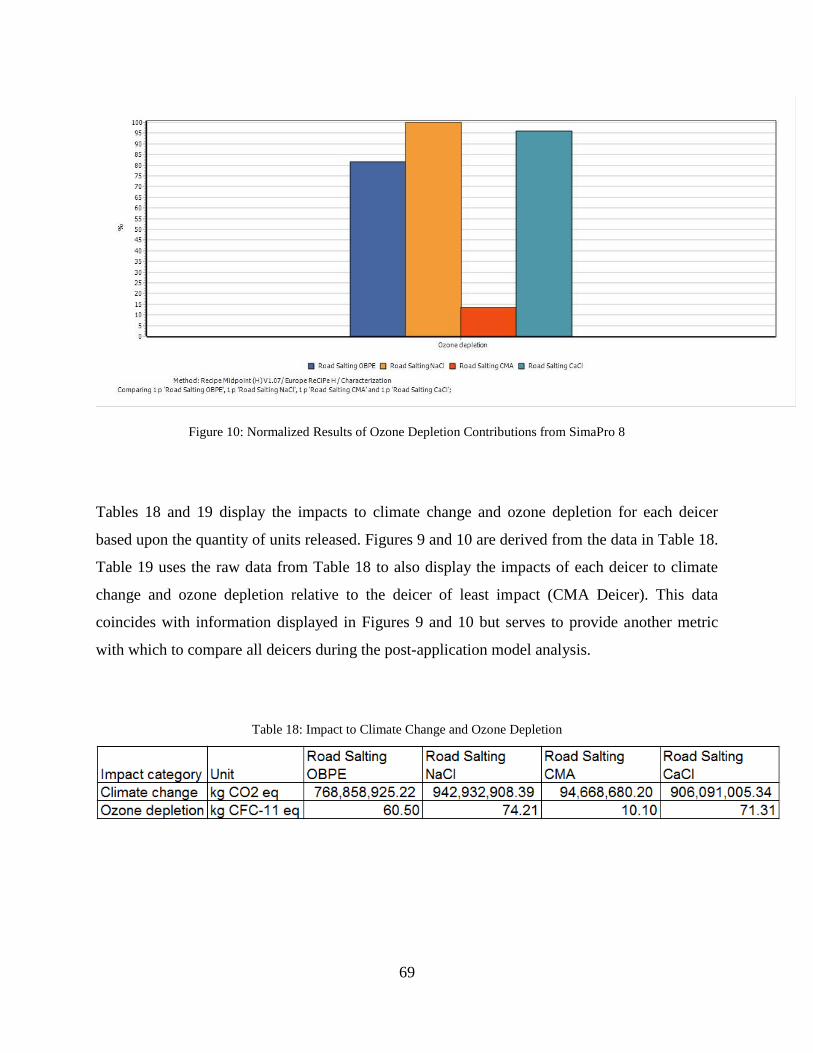
69
Figure 10: Normalized Results of Ozone Depletion Contributions from SimaPro 8
Tables 18 and 19 display the impacts to climate change and ozone depletion for each deicer
based upon the quantity of units released. Figures 9 and 10 are derived from the data in Table 18.
Table 19 uses the raw data from Table 18 to also display the impacts of each deicer to climate
change and ozone depletion relative to the deicer of least impact (CMA Deicer). This data
coincides with information displayed in Figures 9 and 10 but serves to provide another metric
with which to compare all deicers during the post-application model analysis.
Table 18: Impact to Climate Change and Ozone Depletion
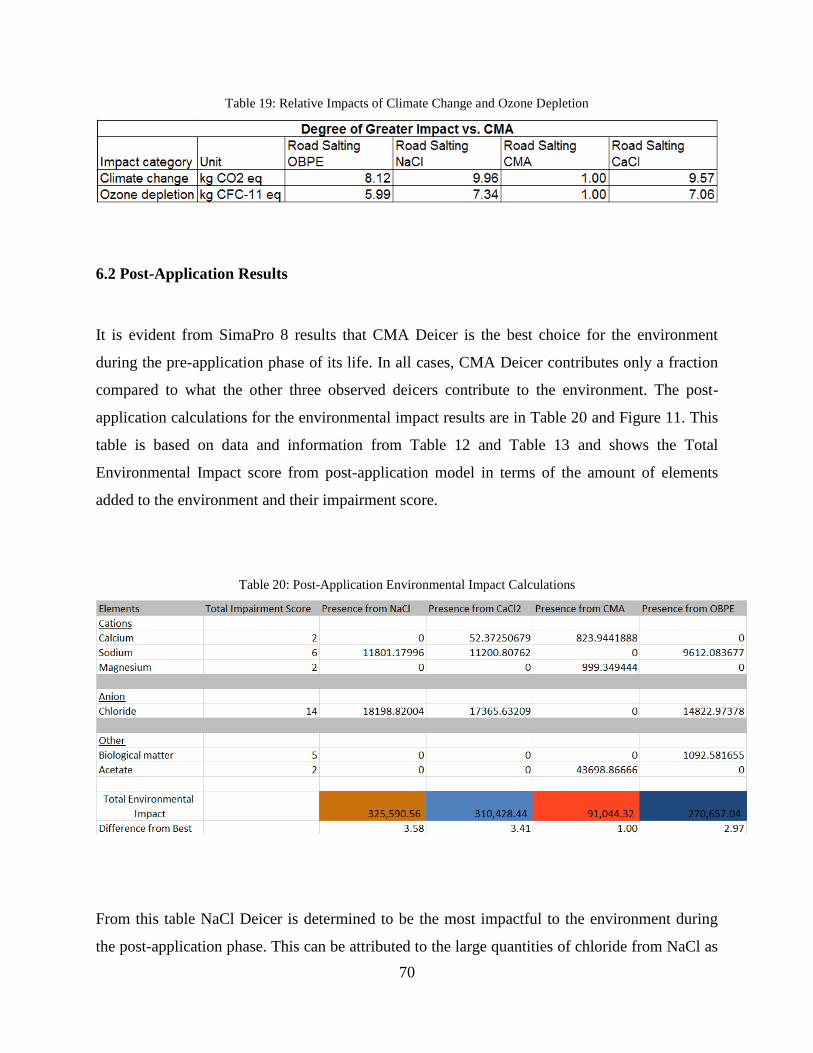
70
Table 19: Relative Impacts of Climate Change and Ozone Depletion
6.2 Post-Application Results
It is evident from SimaPro 8 results that CMA Deicer is the best choice for the environment
during the pre-application phase of its life. In all cases, CMA Deicer contributes only a fraction
compared to what the other three observed deicers contribute to the environment. The post-
application calculations for the environmental impact results are in Table 20 and Figure 11. This
table is based on data and information from Table 12 and Table 13 and shows the Total
Environmental Impact score from post-application model in terms of the amount of elements
added to the environment and their impairment score.
Table 20: Post-Application Environmental Impact Calculations
From this table NaCl Deicer is determined to be the most impactful to the environment during
the post-application phase. This can be attributed to the large quantities of chloride from NaCl as
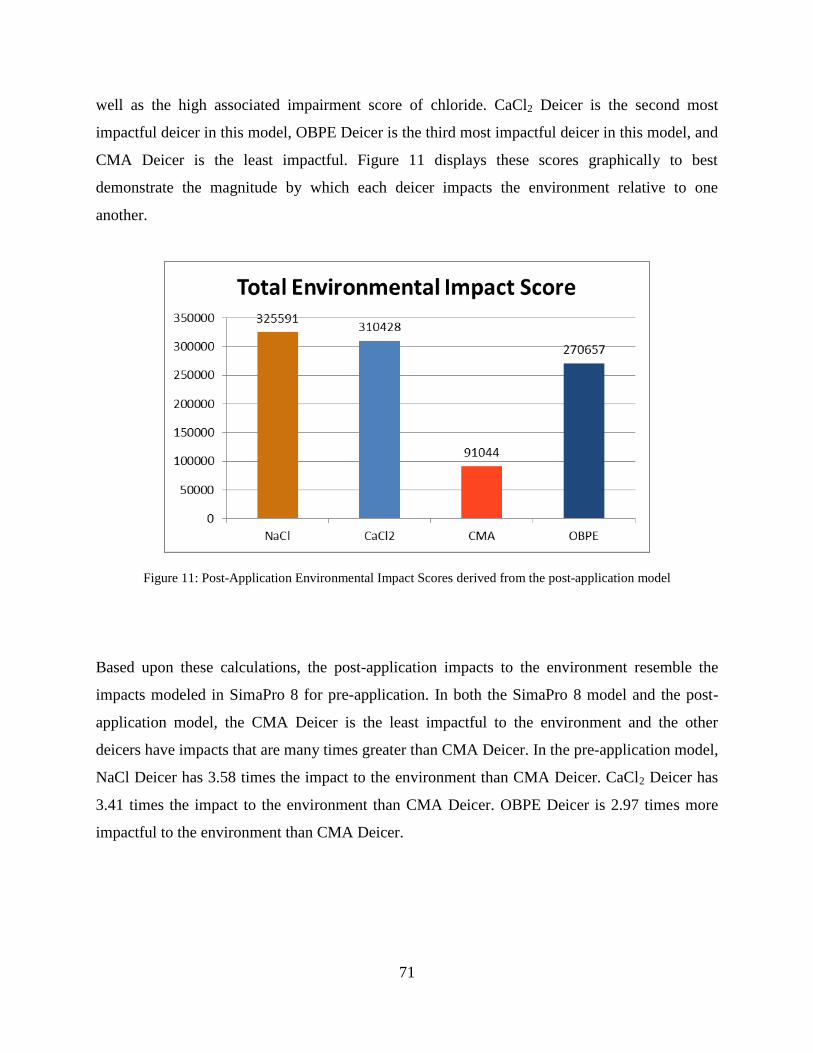
71
well as the high associated impairment score of chloride. CaCl2 Deicer is the second most
impactful deicer in this model, OBPE Deicer is the third most impactful deicer in this model, and
CMA Deicer is the least impactful. Figure 11 displays these scores graphically to best
demonstrate the magnitude by which each deicer impacts the environment relative to one
another.
Figure 11: Post-Application Environmental Impact Scores derived from the post-application model
Based upon these calculations, the post-application impacts to the environment resemble the
impacts modeled in SimaPro 8 for pre-application. In both the SimaPro 8 model and the post-
application model, the CMA Deicer is the least impactful to the environment and the other
deicers have impacts that are many times greater than CMA Deicer. In the pre-application model,
NaCl Deicer has 3.58 times the impact to the environment than CMA Deicer. CaCl2 Deicer has
3.41 times the impact to the environment than CMA Deicer. OBPE Deicer is 2.97 times more
impactful to the environment than CMA Deicer.
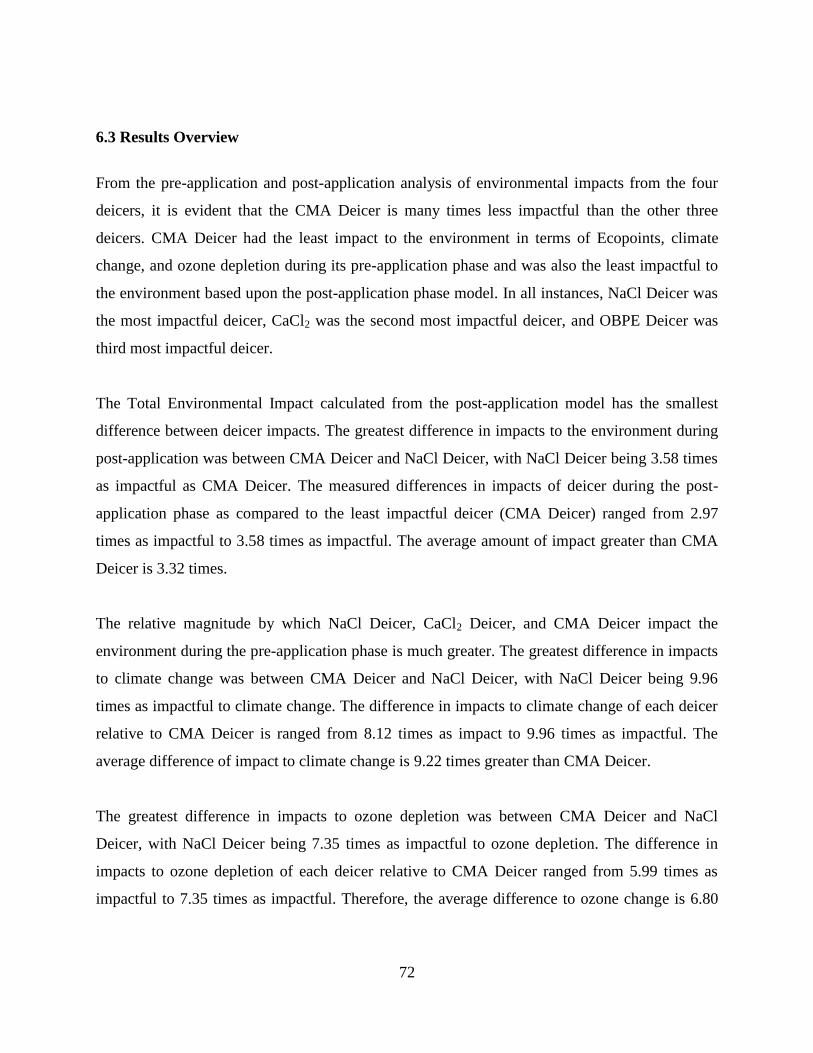
72
6.3 Results Overview
From the pre-application and post-application analysis of environmental impacts from the four
deicers, it is evident that the CMA Deicer is many times less impactful than the other three
deicers. CMA Deicer had the least impact to the environment in terms of Ecopoints, climate
change, and ozone depletion during its pre-application phase and was also the least impactful to
the environment based upon the post-application phase model. In all instances, NaCl Deicer was
the most impactful deicer, CaCl2 was the second most impactful deicer, and OBPE Deicer was
third most impactful deicer.
The Total Environmental Impact calculated from the post-application model has the smallest
difference between deicer impacts. The greatest difference in impacts to the environment during
post-application was between CMA Deicer and NaCl Deicer, with NaCl Deicer being 3.58 times
as impactful as CMA Deicer. The measured differences in impacts of deicer during the post-
application phase as compared to the least impactful deicer (CMA Deicer) ranged from 2.97
times as impactful to 3.58 times as impactful. The average amount of impact greater than CMA
Deicer is 3.32 times.
The relative magnitude by which NaCl Deicer, CaCl2 Deicer, and CMA Deicer impact the
environment during the pre-application phase is much greater. The greatest difference in impacts
to climate change was between CMA Deicer and NaCl Deicer, with NaCl Deicer being 9.96
times as impactful to climate change. The difference in impacts to climate change of each deicer
relative to CMA Deicer is ranged from 8.12 times as impact to 9.96 times as impactful. The
average difference of impact to climate change is 9.22 times greater than CMA Deicer.
The greatest difference in impacts to ozone depletion was between CMA Deicer and NaCl
Deicer, with NaCl Deicer being 7.35 times as impactful to ozone depletion. The difference in
impacts to ozone depletion of each deicer relative to CMA Deicer ranged from 5.99 times as
impactful to 7.35 times as impactful. Therefore, the average difference to ozone change is 6.80
73
times greater than CMA Deicer. This difference is greater than that from the post-application
Total Environmental Impact but is less than the differences from analyzing climate change.
Finally, the greatest difference in impacts to Ecopoints was between CMA Deicer and NaCl
Deicer where NaCl Deicer was 11.45 times greater than CMA Deicer. The differences in impact
from deicers ranged from 9.33 times as many Ecopoints as CMA Deicer to 11.45 times as many
Ecopoints as CMA Deicer. The average of the magnitude of differences between Ecopoints for
CMA Deicer and Ecopoints of all other deicers is 10.59.
The difference in impact between CMA Deicer and all other deicers is most pronounced in when
considering Ecopoints and least pronounced when observing post-application Total
Environmental Impact. All calculated differences in impacts are displayed in Table 21. This table
represents the difference between the score of one deicer and CMA Deicer. From this table, on
average, NaCl Deicer will be 8.08 times as impactful as CMA Deicer, CaCl2 Deicer will be 7.76
times as impactful as CMA Deicer, and OBPE Deicer will be 6.60 times as impactful as CMA
Deicer.
Table 21: Relative Impacts of Environmental Metrics
6.4 Sensitivity Analysis
In these results, NaCl Deicer was always the most impactful and CMA Deicer was always the
least impactful. As a result, the scale used in the Total Environmental Impact model was not a
74
deciding factor as to determining which deicer was most and least impactful overall but instead
primarily impacted the magnitude by which each deicer impacted the environment. For future
research, ensuring that an appropriate weighting scale is used is critical to receiving accurate
results especially when all impact categories do not reach the same conclusion.
In the original results, the calculated rate at which each deicer is applied was dependent upon
temperatures and associated lbs/LM provided by the NYS DOT, Pennsylvania DOT, and
National Cooperative Highway Research Program. If seasonal temperatures increase or decrease
then each deicers application rate would increase or decrease as well. In order to provide an
accurate sensitivity analysis, it will be assumed that each deicer is applied at the same rates and
quantities.
The rationale for measuring impacts of deicers when the quantities are all the same is to account
for real-time error in practice. Those that apply deicers to roads are separate from those that
create the manuals and guidelines of application rates. If adjustments are not made by those
applying deicers to the roads then it is assumed that all deicers will be applied at the same rate
NaCl Deicer is applied. This analysis will serve to demonstrate the impacts to the environment
suffered from these errors.
In addition, a sensitivity analysis is performed on the post-application model. As mentioned in
Section 6.3, the weight scale used for each factor has the potential to greatly impact results,
especially if an inappropriate weight scale was used. In this sensitivity analysis, two different
weight scales are used to determine how varying the weights impacts overall results.
6.4.1 Flat Rate Deicer Application Effects
The changes in the quantity of deicer and the associated transportation and spraying adjustments
made from the application changes are found in Figure 12 and Table 22. These are the new
inputs to SimaPro 8 and the post-application model for using a flat rate of deicing. Because NaCl
Deicer is the only deicer in this research for which we know the exact quantity applied in
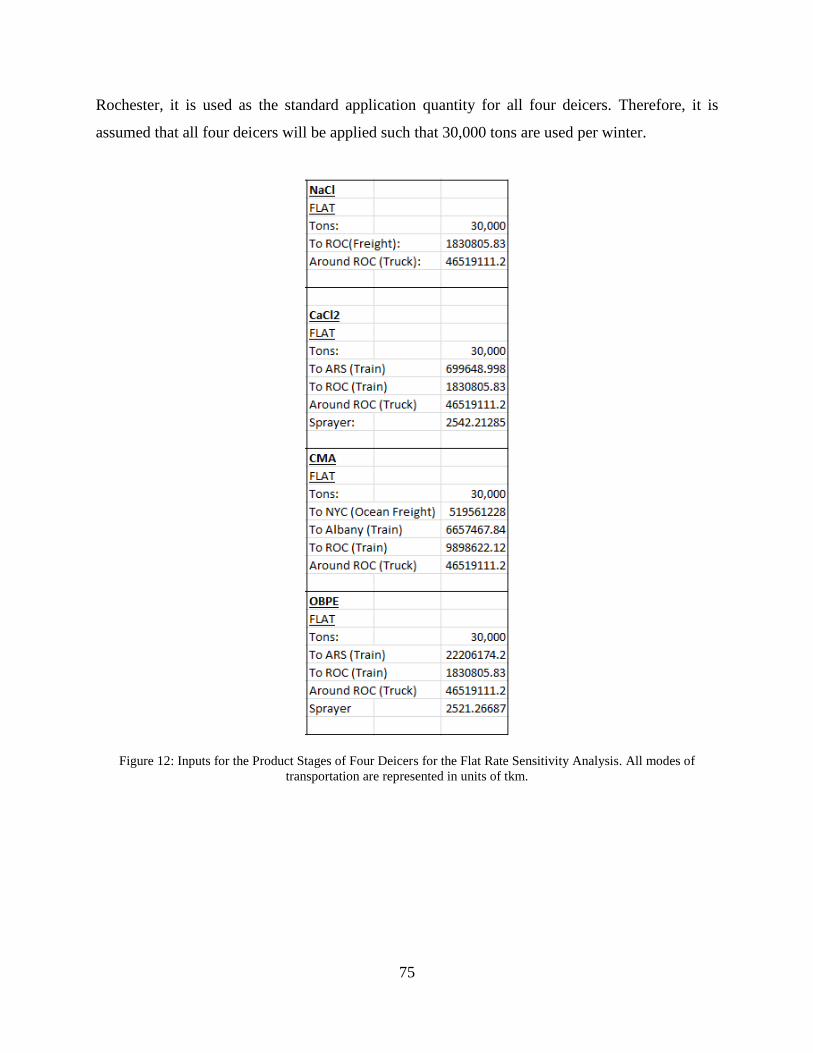
75
Rochester, it is used as the standard application quantity for all four deicers. Therefore, it is
assumed that all four deicers will be applied such that 30,000 tons are used per winter.
Figure 12: Inputs for the Product Stages of Four Deicers for the Flat Rate Sensitivity Analysis. All modes of
transportation are represented in units of tkm.
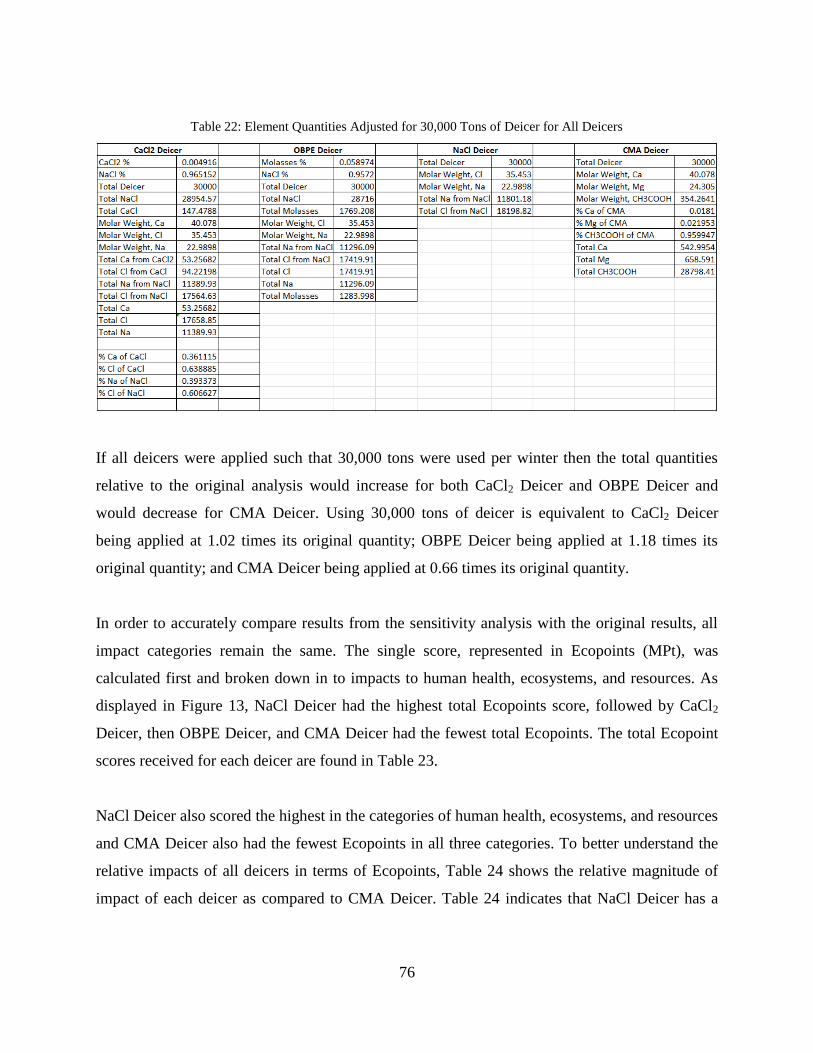
76
Table 22: Element Quantities Adjusted for 30,000 Tons of Deicer for All Deicers
If all deicers were applied such that 30,000 tons were used per winter then the total quantities
relative to the original analysis would increase for both CaCl2 Deicer and OBPE Deicer and
would decrease for CMA Deicer. Using 30,000 tons of deicer is equivalent to CaCl2 Deicer
being applied at 1.02 times its original quantity; OBPE Deicer being applied at 1.18 times its
original quantity; and CMA Deicer being applied at 0.66 times its original quantity.
In order to accurately compare results from the sensitivity analysis with the original results, all
impact categories remain the same. The single score, represented in Ecopoints (MPt), was
calculated first and broken down in to impacts to human health, ecosystems, and resources. As
displayed in Figure 13, NaCl Deicer had the highest total Ecopoints score, followed by CaCl2
Deicer, then OBPE Deicer, and CMA Deicer had the fewest total Ecopoints. The total Ecopoint
scores received for each deicer are found in Table 23.
NaCl Deicer also scored the highest in the categories of human health, ecosystems, and resources
and CMA Deicer also had the fewest Ecopoints in all three categories. To better understand the
relative impacts of all deicers in terms of Ecopoints, Table 24 shows the relative magnitude of
impact of each deicer as compared to CMA Deicer. Table 24 indicates that NaCl Deicer has a
77
score 17.37 times greater than CMA Deicer. CaCl2 Deicer has a score 16.97 times greater than
CMA Deicer. OBPE Deicer has a score 16.64 times greater than CMA Deicer.
Figure 14 displays the relative percentage of impact in terms of Ecopoints for each Deicer. This
information coincides with the single scores of Ecopoints associated with each deicer and serves
to visually demonstrate relative impact in terms of Ecopoints and categorized by impacts to
human health, ecosystems, and resources. Table 25 provides the specific data per category from
which the Ecopoints were derived. Ecopoints were calculated within SimaPro 8 and are intended
to be a single metric of aggregated impact information that allows for easy comparison. Table 25
displays some of the information from which the Ecopoints were determined.
Table 26 indicates the relative impacts of each deicer, per category, as based upon the original
category units. Each deicers magnitude of impact relative to CMA Deicer (the least impactful
deicer) is displayed. In the categories of human health and ecosystems, impacts relative to CMA
Deicer range from 22-26 times more impactful. In the category of resources, the difference is
much less profound, ranging between 8-9 times more impactful than CMA Deicer.
In this pre-application phase of the sensitivity analysis, the impacts to the environment from
CMA Deicer decrease even further due to the fact that the application rate has decreased. The
total Ecopoints associated with each deicer increases/decreases by the amount that its total
quantity was increased or decreased. The result is that the Ecopoints associated with NaCl
Deicer, CaCl2 Deicer, and OBPE Deicer are even closer in quantity. In the original analysis,
CaCl2 Deicer had 96.08% of the Ecopoints that NaCl Deicer had and OBPE Deicer had 81.15%
of the Ecopoints of NaCl Deicer. When quantity of deicer applied is held constant at 30,000 tons,
CaCl2 Deicer has 97.71% of the Ecopoints that NaCl Deicer has and OBPE Deicer has 95.82%
of the Ecopoints of NaCl Deicer.
Additionally, the magnitude of difference in impacts between CMA Deicer and the other three
deicers significantly increases when using a flat rate of application for all deicers. NaCl Deicer
has 17.37 times more Ecopoints than CMA Deicer; CaCl2 Deicer has 16.97 times more
Ecopoints than CMA Deicer; OBPE Deicer has 16.64 times more Ecopoints than CMA Deicer.
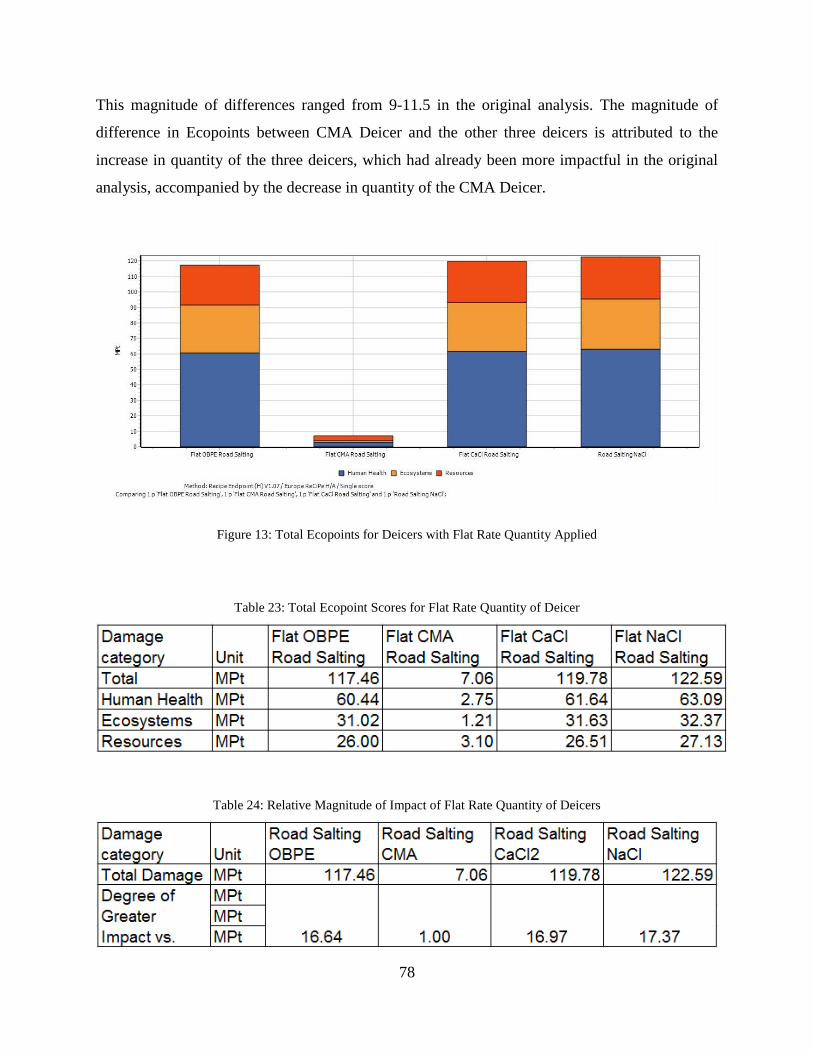
78
This magnitude of differences ranged from 9-11.5 in the original analysis. The magnitude of
difference in Ecopoints between CMA Deicer and the other three deicers is attributed to the
increase in quantity of the three deicers, which had already been more impactful in the original
analysis, accompanied by the decrease in quantity of the CMA Deicer.
Figure 13: Total Ecopoints for Deicers with Flat Rate Quantity Applied
Table 23: Total Ecopoint Scores for Flat Rate Quantity of Deicer
Table 24: Relative Magnitude of Impact of Flat Rate Quantity of Deicers
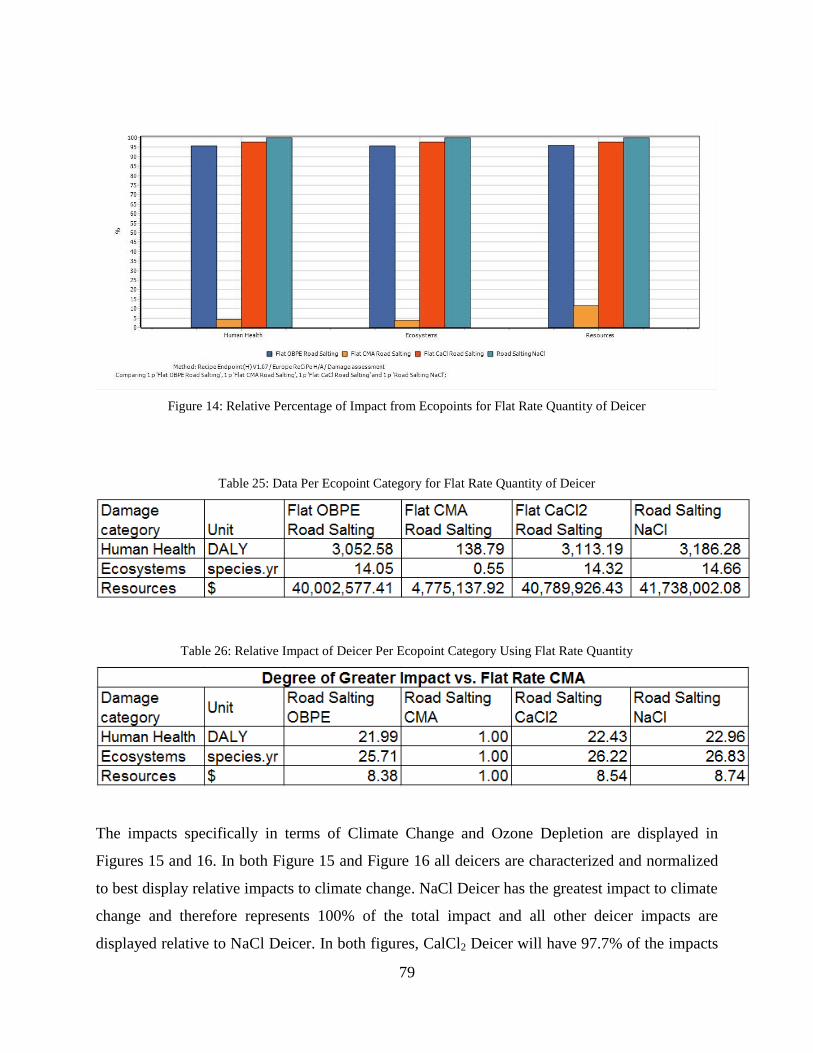
79
Figure 14: Relative Percentage of Impact from Ecopoints for Flat Rate Quantity of Deicer
Table 25: Data Per Ecopoint Category for Flat Rate Quantity of Deicer
Table 26: Relative Impact of Deicer Per Ecopoint Category Using Flat Rate Quantity
The impacts specifically in terms of Climate Change and Ozone Depletion are displayed in
Figures 15 and 16. In both Figure 15 and Figure 16 all deicers are characterized and normalized
to best display relative impacts to climate change. NaCl Deicer has the greatest impact to climate
change and therefore represents 100% of the total impact and all other deicer impacts are
displayed relative to NaCl Deicer. In both figures, CalCl2 Deicer will have 97.7% of the impacts
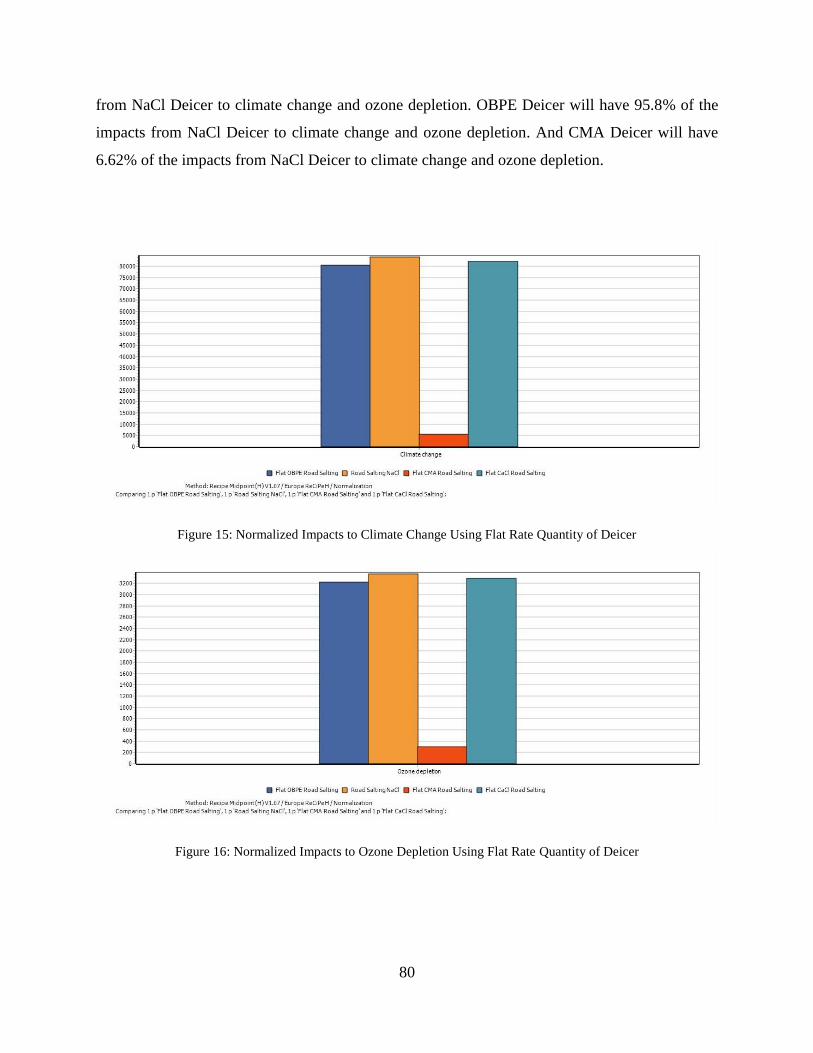
80
from NaCl Deicer to climate change and ozone depletion. OBPE Deicer will have 95.8% of the
impacts from NaCl Deicer to climate change and ozone depletion. And CMA Deicer will have
6.62% of the impacts from NaCl Deicer to climate change and ozone depletion.
Figure 15: Normalized Impacts to Climate Change Using Flat Rate Quantity of Deicer
Figure 16: Normalized Impacts to Ozone Depletion Using Flat Rate Quantity of Deicer
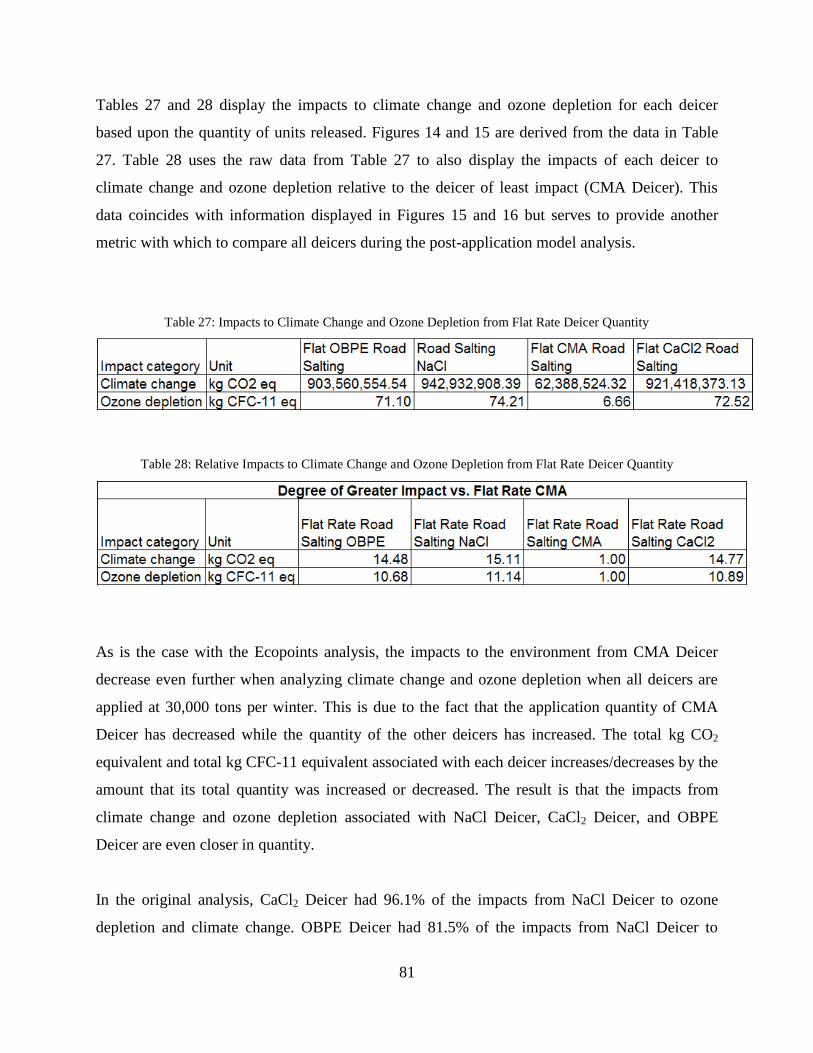
81
Tables 27 and 28 display the impacts to climate change and ozone depletion for each deicer
based upon the quantity of units released. Figures 14 and 15 are derived from the data in Table
27. Table 28 uses the raw data from Table 27 to also display the impacts of each deicer to
climate change and ozone depletion relative to the deicer of least impact (CMA Deicer). This
data coincides with information displayed in Figures 15 and 16 but serves to provide another
metric with which to compare all deicers during the post-application model analysis.
Table 27: Impacts to Climate Change and Ozone Depletion from Flat Rate Deicer Quantity
Table 28: Relative Impacts to Climate Change and Ozone Depletion from Flat Rate Deicer Quantity
As is the case with the Ecopoints analysis, the impacts to the environment from CMA Deicer
decrease even further when analyzing climate change and ozone depletion when all deicers are
applied at 30,000 tons per winter. This is due to the fact that the application quantity of CMA
Deicer has decreased while the quantity of the other deicers has increased. The total kg CO2
equivalent and total kg CFC-11 equivalent associated with each deicer increases/decreases by the
amount that its total quantity was increased or decreased. The result is that the impacts from
climate change and ozone depletion associated with NaCl Deicer, CaCl2 Deicer, and OBPE
Deicer are even closer in quantity.
In the original analysis, CaCl2 Deicer had 96.1% of the impacts from NaCl Deicer to ozone
depletion and climate change. OBPE Deicer had 81.5% of the impacts from NaCl Deicer to
82
ozone depletion and climate change. CMA Deicer had 13.6% of the impacts from NaCl Deicer to
ozone depletion and 10% of the impacts from NaCl Deicer to climate change. In this sensitivity
analysis, using a flat rate of 30,000 tons of deicer applied results in CalCl2 Deicer having 97.7%
of the impacts from NaCl Deicer to climate change and ozone depletion; OBPE Deicer having
95.8% of the impacts from NaCl Deicer to climate change and ozone depletion; and CMA Deicer
had 6.62% of the impacts from NaCl Deicer to climate change and ozone depletion.
Additionally, the magnitude of difference in impacts to climate change and ozone depletion,
between CMA Deicer and the other three deicers, significantly increases when using a flat rate of
application for all deicers. NaCl Deicer has 15.11 times greater impact on climate change than
CMA Deicer and 11.14 times greater impact on ozone depletion than CMA Deicer. CaCl2 Deicer
has 14.77 times greater impact on climate change than CMA Deicer and 10.89 times greater
impact on ozone depletion than CMA Deicer. Finally, OBPE Deicer has 14.48 times greater
impact on climate change than CMA Deicer and 10.68 times greater impact on ozone depletion
than CMA Deicer. This magnitude of differences ranged from 5.5-7.5 in the original analysis of
ozone depletion and ranged from 8-10 in the original analysis of climate change. The increase in
difference between CMA Deicer and the other three deicers was constant between climate
change, ozone depletion, and Ecopoints. This can be attributed to the same increase or decrease
in inputs to calculate results.
The SimaPro 8 results indicate that CMA Deicer is the best choice for the environment during
the pre-application phase of its life both in the original analysis and even more so when using a
flat rate of applied deicer. In all cases, CMA Deicer contributes only a fraction compared to what
the other three observed deicers contribute to the environment. The post-application calculations
for the environmental impact results are in Table 29 and Figure 16. This table is based on the
amount of elements added to the environment and their impairment score. The amount of
elements added to the environment is determined based upon the molar weights of each material
component as well as the total quantity of the deicer being applied.
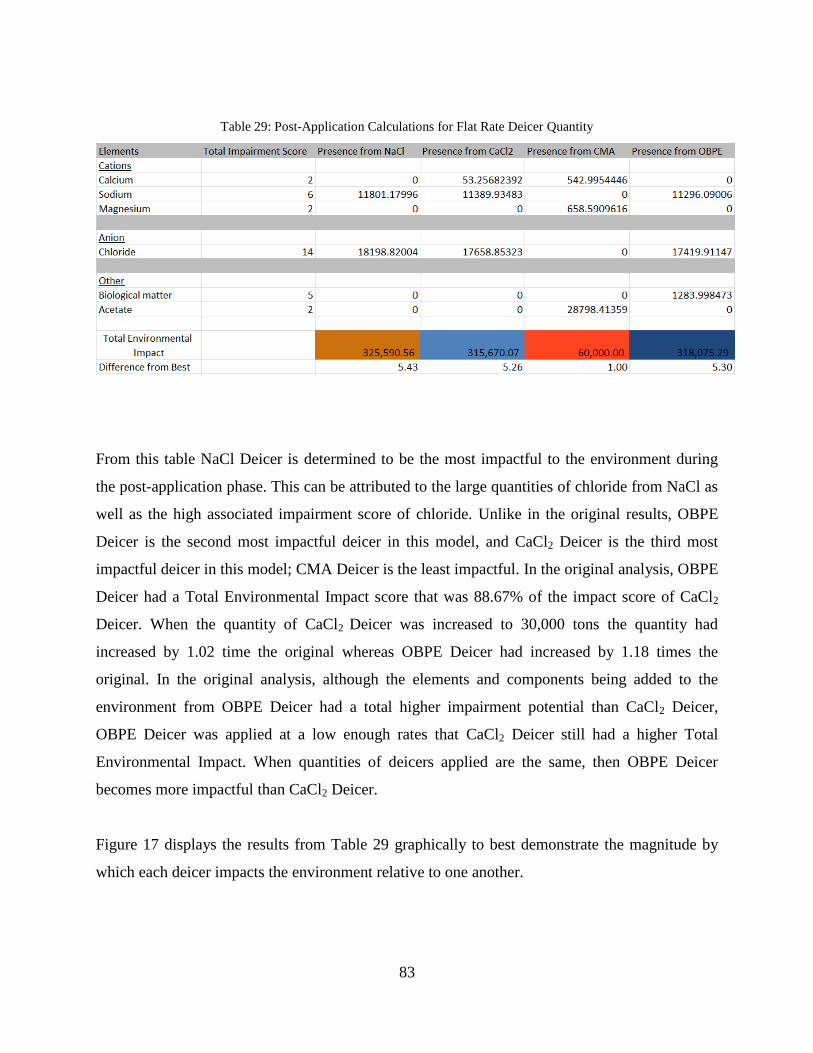
83
Table 29: Post-Application Calculations for Flat Rate Deicer Quantity
From this table NaCl Deicer is determined to be the most impactful to the environment during
the post-application phase. This can be attributed to the large quantities of chloride from NaCl as
well as the high associated impairment score of chloride. Unlike in the original results, OBPE
Deicer is the second most impactful deicer in this model, and CaCl2 Deicer is the third most
impactful deicer in this model; CMA Deicer is the least impactful. In the original analysis, OBPE
Deicer had a Total Environmental Impact score that was 88.67% of the impact score of CaCl2
Deicer. When the quantity of CaCl2 Deicer was increased to 30,000 tons the quantity had
increased by 1.02 time the original whereas OBPE Deicer had increased by 1.18 times the
original. In the original analysis, although the elements and components being added to the
environment from OBPE Deicer had a total higher impairment potential than CaCl2 Deicer,
OBPE Deicer was applied at a low enough rates that CaCl2 Deicer still had a higher Total
Environmental Impact. When quantities of deicers applied are the same, then OBPE Deicer
becomes more impactful than CaCl2 Deicer.
Figure 17 displays the results from Table 29 graphically to best demonstrate the magnitude by
which each deicer impacts the environment relative to one another.
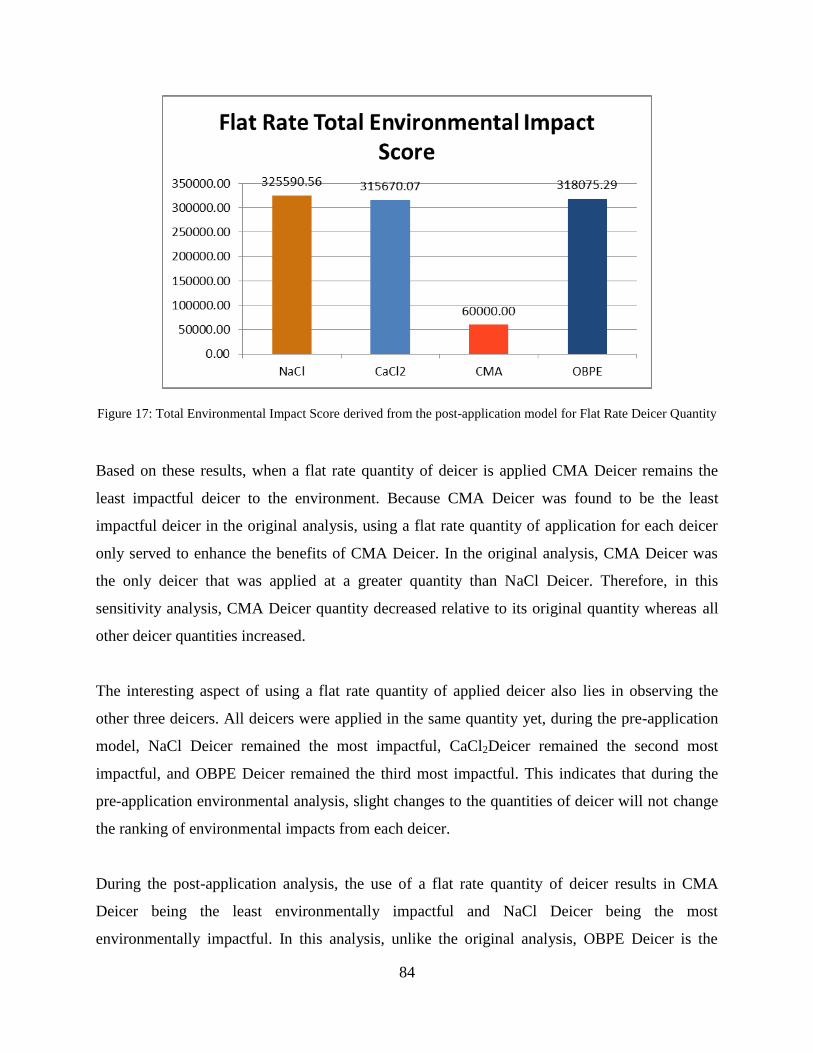
84
Figure 17: Total Environmental Impact Score derived from the post-application model for Flat Rate Deicer Quantity
Based on these results, when a flat rate quantity of deicer is applied CMA Deicer remains the
least impactful deicer to the environment. Because CMA Deicer was found to be the least
impactful deicer in the original analysis, using a flat rate quantity of application for each deicer
only served to enhance the benefits of CMA Deicer. In the original analysis, CMA Deicer was
the only deicer that was applied at a greater quantity than NaCl Deicer. Therefore, in this
sensitivity analysis, CMA Deicer quantity decreased relative to its original quantity whereas all
other deicer quantities increased.
The interesting aspect of using a flat rate quantity of applied deicer also lies in observing the
other three deicers. All deicers were applied in the same quantity yet, during the pre-application
model, NaCl Deicer remained the most impactful, CaCl2Deicer remained the second most
impactful, and OBPE Deicer remained the third most impactful. This indicates that during the
pre-application environmental analysis, slight changes to the quantities of deicer will not change
the ranking of environmental impacts from each deicer.
During the post-application analysis, the use of a flat rate quantity of deicer results in CMA
Deicer being the least environmentally impactful and NaCl Deicer being the most
environmentally impactful. In this analysis, unlike the original analysis, OBPE Deicer is the
85
second most impactful deicer whereas CaCl2 Deicer is the third most impactful. This is a result
of the weights of the OBPE Deicer being collectively greater than those of the CaCl2 Deicer and,
when both deicers are applied at the same quantities, OBPE Deicer then becomes more impactful
during post-application. This also reinforces the importance of properly weighting all factors to
ensure accuracy. Based on the original model and using an application of 30,000 tons of deicer,
the weight of “Biological Matter” in OBPE Deicer could decrease to as low as 3.1 and still result
in a Total Environmental Impact score higher than that of CaCl2 Deicer. Similarly, Ca weighted
score would have to increase to 47.2 for CalCl2 Deicer in order to surpass the Total
Environmental Impact of OBPE Deicer.
6.4.2 Varied Weight Scales
The use of an accurate weighting system is essentially to accurately capturing the impacts of a
product pre- and post-application. In the original analysis a simple 1-5 scale was used to weight
environmental factors in the model. As a result, relative differences of impacts from deicers were
the least during the post-application as compared to the differences in impacts from deicers
during the pre-application analysis. Two alternative weighted scaling systems are proposed to
determine how this might impact overall results.
The first proposed alternative weighting system is seen in Table 30. In this analysis, all
environmental impact factors are weighted the same. This method was selected to represent a
case in which it is unclear as to the relative impact of any given factor to the environment. D.O.,
TDS, Heavy Metal Leaching, Aquatic Health, and Human Health are all given a weight of one.
The deicers are, again, broken down in to their elements and components and the quantities of
each are multiplied by total impairment factor score. Using this method, Ca has a total
impairment score of 1, Na has a total impairment score of 2, Mg has a total impairment score of
1, Cl has a total impairment score of 4, Biological Matter has a total impairment score of 2, and
Acetate has a total impairment score of 1. As a result, Cl still has the highest total weight
followed by Acetate but the difference between those scores and all other components have
decreased.
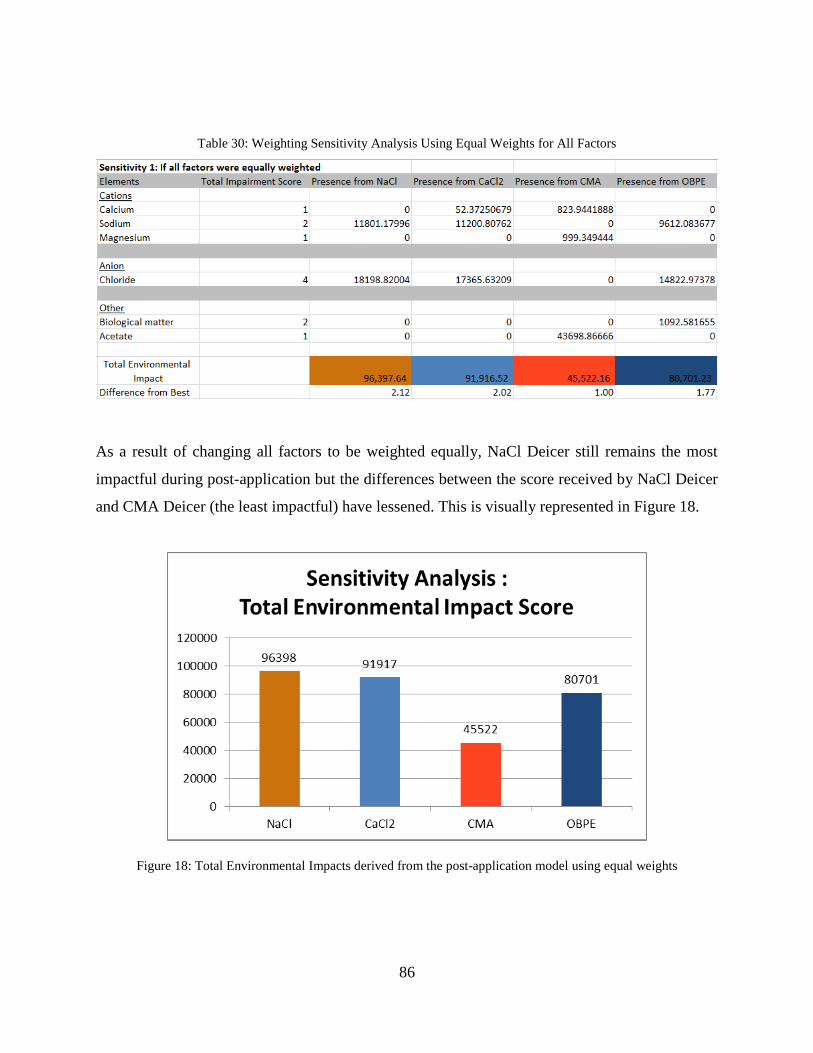
86
Table 30: Weighting Sensitivity Analysis Using Equal Weights for All Factors
As a result of changing all factors to be weighted equally, NaCl Deicer still remains the most
impactful during post-application but the differences between the score received by NaCl Deicer
and CMA Deicer (the least impactful) have lessened. This is visually represented in Figure 18.
Figure 18: Total Environmental Impacts derived from the post-application model using equal weights
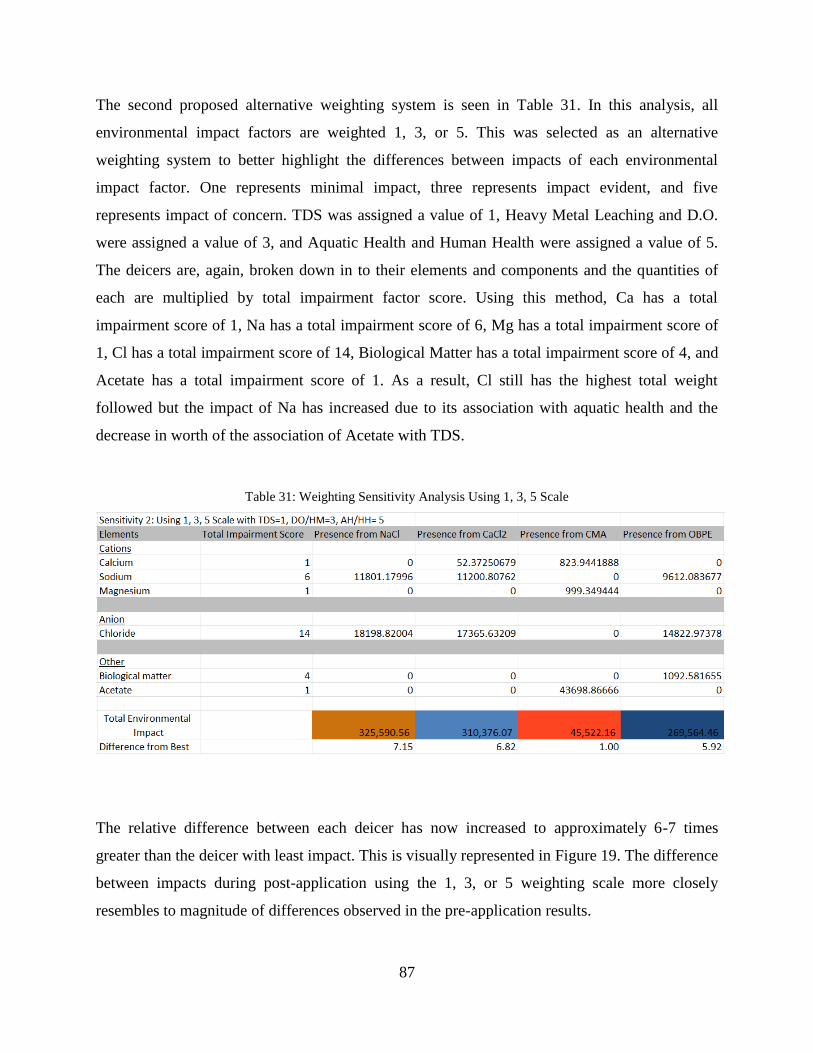
87
The second proposed alternative weighting system is seen in Table 31. In this analysis, all
environmental impact factors are weighted 1, 3, or 5. This was selected as an alternative
weighting system to better highlight the differences between impacts of each environmental
impact factor. One represents minimal impact, three represents impact evident, and five
represents impact of concern. TDS was assigned a value of 1, Heavy Metal Leaching and D.O.
were assigned a value of 3, and Aquatic Health and Human Health were assigned a value of 5.
The deicers are, again, broken down in to their elements and components and the quantities of
each are multiplied by total impairment factor score. Using this method, Ca has a total
impairment score of 1, Na has a total impairment score of 6, Mg has a total impairment score of
1, Cl has a total impairment score of 14, Biological Matter has a total impairment score of 4, and
Acetate has a total impairment score of 1. As a result, Cl still has the highest total weight
followed but the impact of Na has increased due to its association with aquatic health and the
decrease in worth of the association of Acetate with TDS.
Table 31: Weighting Sensitivity Analysis Using 1, 3, 5 Scale
The relative difference between each deicer has now increased to approximately 6-7 times
greater than the deicer with least impact. This is visually represented in Figure 19. The difference
between impacts during post-application using the 1, 3, or 5 weighting scale more closely
resembles to magnitude of differences observed in the pre-application results.
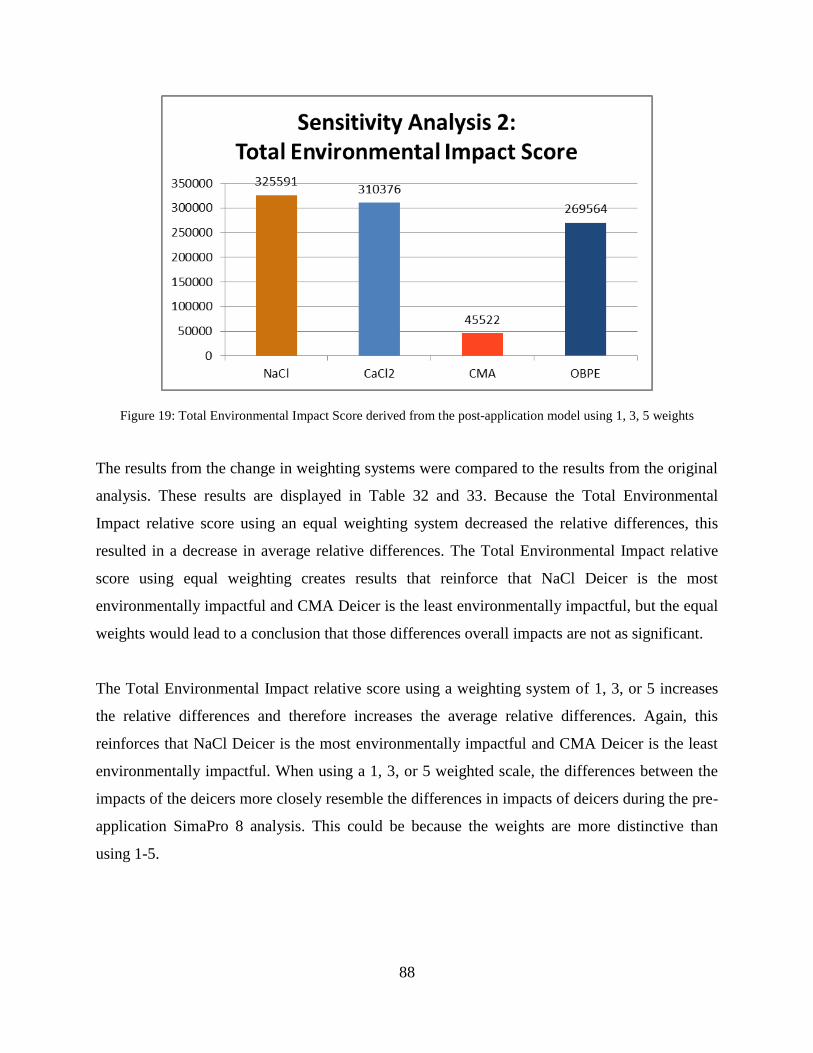
88
Figure 19: Total Environmental Impact Score derived from the post-application model using 1, 3, 5 weights
The results from the change in weighting systems were compared to the results from the original
analysis. These results are displayed in Table 32 and 33. Because the Total Environmental
Impact relative score using an equal weighting system decreased the relative differences, this
resulted in a decrease in average relative differences. The Total Environmental Impact relative
score using equal weighting creates results that reinforce that NaCl Deicer is the most
environmentally impactful and CMA Deicer is the least environmentally impactful, but the equal
weights would lead to a conclusion that those differences overall impacts are not as significant.
The Total Environmental Impact relative score using a weighting system of 1, 3, or 5 increases
the relative differences and therefore increases the average relative differences. Again, this
reinforces that NaCl Deicer is the most environmentally impactful and CMA Deicer is the least
environmentally impactful. When using a 1, 3, or 5 weighted scale, the differences between the
impacts of the deicers more closely resemble the differences in impacts of deicers during the pre-
application SimaPro 8 analysis. This could be because the weights are more distinctive than
using 1-5.
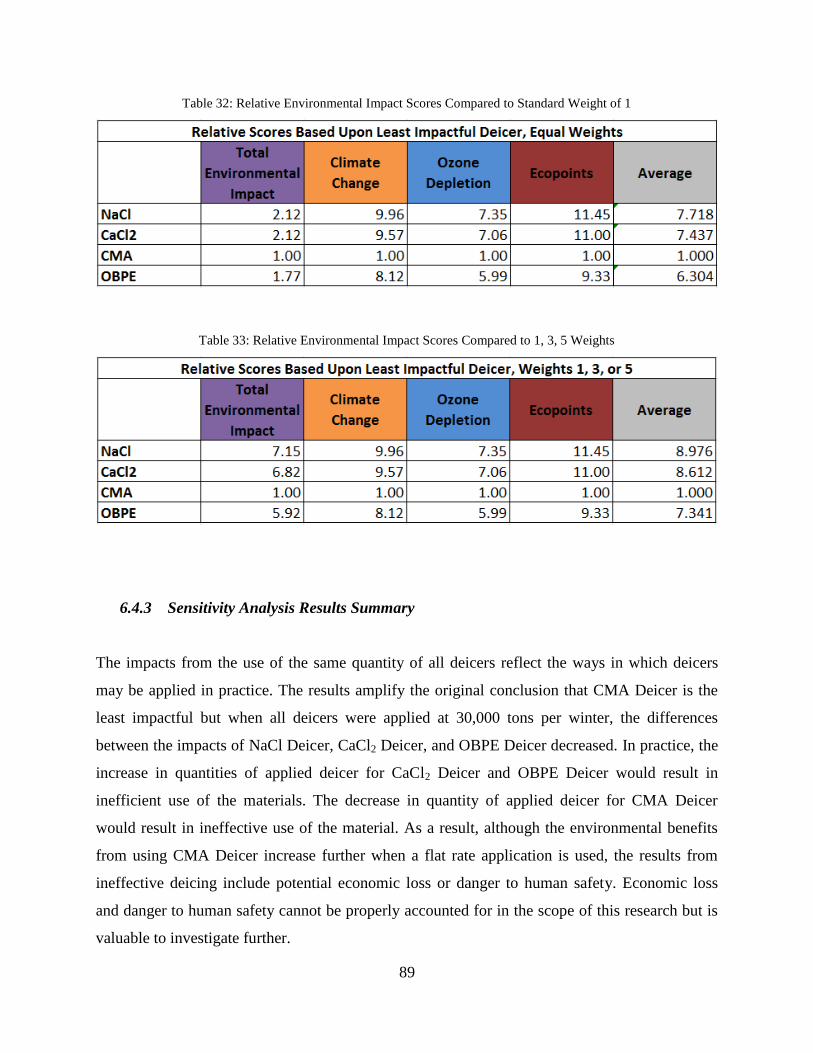
89
Table 32: Relative Environmental Impact Scores Compared to Standard Weight of 1
Table 33: Relative Environmental Impact Scores Compared to 1, 3, 5 Weights
6.4.3 Sensitivity Analysis Results Summary
The impacts from the use of the same quantity of all deicers reflect the ways in which deicers
may be applied in practice. The results amplify the original conclusion that CMA Deicer is the
least impactful but when all deicers were applied at 30,000 tons per winter, the differences
between the impacts of NaCl Deicer, CaCl2 Deicer, and OBPE Deicer decreased. In practice, the
increase in quantities of applied deicer for CaCl2 Deicer and OBPE Deicer would result in
inefficient use of the materials. The decrease in quantity of applied deicer for CMA Deicer
would result in ineffective use of the material. As a result, although the environmental benefits
from using CMA Deicer increase further when a flat rate application is used, the results from
ineffective deicing include potential economic loss or danger to human safety. Economic loss
and danger to human safety cannot be properly accounted for in the scope of this research but is
valuable to investigate further.
90
The impacts from changing the weights did not change the order of environmental impact of
each deicer during post-application (NaCl Deicer remained the most impactful and CMA Deicer
was the least impactful) but it did change the magnitude of differences between each deicer.
Using an equal weighting system decreased the magnitude of difference whereas using a scale of
1, 3, or 5 increased the magnitude of differences.
7. Discussion
The results from the pre- and post-application analysis indicated that CMA Deicer is the best
deicer to use when attempting to minimize impact to the environment. This is somewhat
unexpected because CMA Deicer was applied at the highest quantity, but these results lend
themselves to several important conclusions that assist in the better understanding of both
deicing and the use of this hybrid lifecycle analysis model.
7.1 Results Analysis and Interpretation
The CMA Deicer had the lowest impact on the environment relative to any of the other studied
deicers. The other three deicers studied were many times more impactful such that, even when
adjusting for inaccuracies in application, the other three deicers still had anywhere from 3 to 12
times the impacts as the CMA Deicer. This is interesting because CMA Deicer required the
largest applied quantity per functional unit. CMA Deicer required 1.5-1.8 times the quantity
required of the other three deicers. In addition, the CMA Deicer is the only product not
manufactured within the U.S. and therefore the distance traveled for CMA Deicer greatly
exceeded that of the other three deicers. CMA Deicer had a total input of 13,302.45 miles
(21,408.22 km) traveled which is 8.17 times greater than CaCl2 Deicer, 8.26 times greater than
OBPE Deicer, and 12.05 times greater than NaCl Deicer.
91
In order to understand why CMA Deicer had such a small relative environmental impact it is
important to look at its inventory data as displayed in Figure 20 and more in-depth in Appendix
C. In Appendix C it is evident that transportation contributes approximately 24% of the overall
impact of the deicing process in CMA Deicer. The greatest impact from transportation to the
CMA deicing process is from oceanic freight, which contributes approximately 14.6%. This is
much greater than any of the other three deicers whose transportation impacts account for less
than 1% of their total impacts.
The SimaPro 8 networks for the NaCl, CaCl2, and OBPE deicing processes are found in
Appendix D, E, and F respectively. It is clear from these networks that the largest contributor to
their environmental impacts is the process associated with the NaCl mine. For all three of these
deicers, some NaCl is required whereas CMA Deicer does not require any NaCl and therefore
any associated mining process.
It can be observed that the quantity NaCl required per deicer corresponds to the relative pre-
application environmental impact that deicer has. OBPE Deicer requires the least amount of
NaCl per functional unit and NaCl requires the greatest amount per functional unit. In the
sensitivity analysis when the quantity of applied deicer is adjusted to be equal, the impacts from
each deicer with NaCl become much closer. This is likely due to the fact that OBPE Deicer and
CaCl2 Deicer primarily consist of NaCl coated with an additive. The NaCl accounts for 95.7%
and 96.5% of the weight of each deicer, respectively. This percentage of NaCl composition,
along with the slight variations in transportation, results in the close impacts from using a
constant 30,000 ton of deicer.
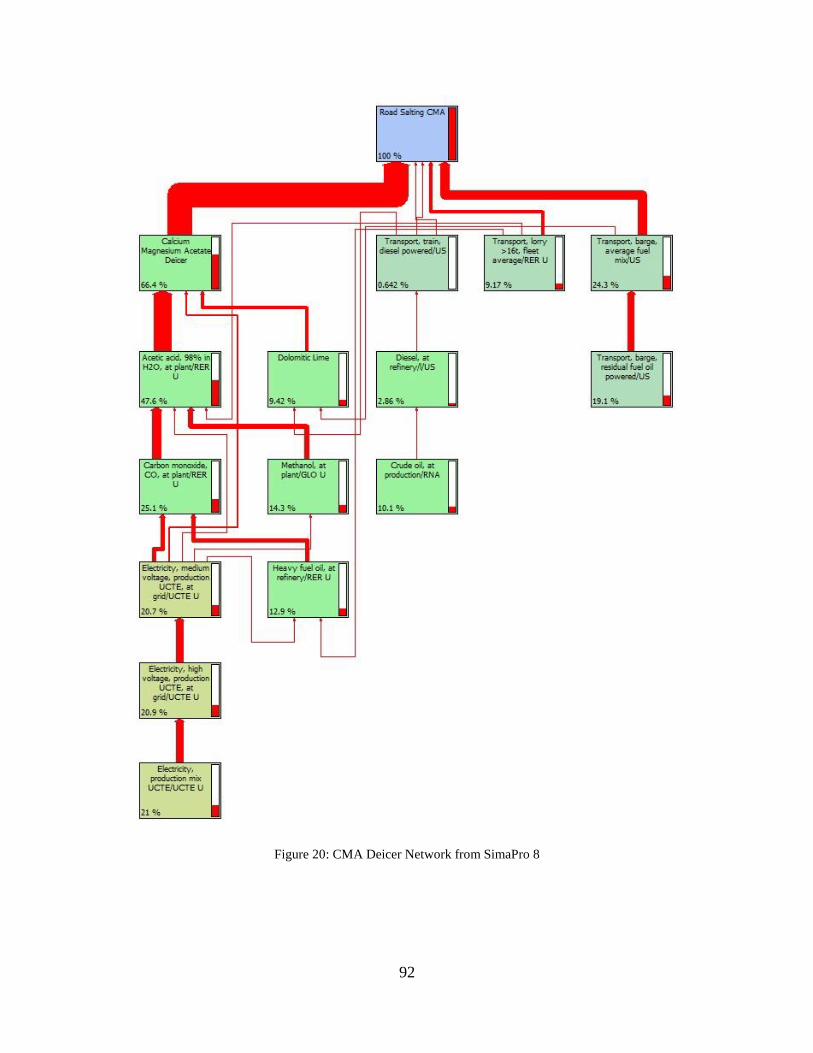
92
Figure 20: CMA Deicer Network from SimaPro 8
93
Although CMA Deicer does not have any NaCl input, CMA Deicer does have a mining process
contained within its inputs. This mining process is not as closely associated with the CMA
production, though. Dolomitic lime is required for CMA Deicer and to obtain the dolomitic lime,
dolomite is heated. Dolomite is obtained through limestone mining but significantly less area of
mining is required to obtain the necessary dolomite. Therefore, the mining process is far enough
removed in the CMA Deicer production that it does not as great impact its environmental effects.
In addition to the pre-application impacts of CMA Deicer, CMA Deicer also was the least
impactful to the environment during the post-application phase of its life. The sum of the total
impairment scores for the elements contained within CMA Deicer is equal to 6. The sum of the
total impairment score for the elements contained within: NaCl Deicer is equal to 20, CaCl2
Deicer is equal to 22, and OBPE Deicer is equal to 25. Therefore, the quantity of the elements in
CMA Deicer must be approximately 3 to 4 times greater than any of the other deicers to have
comparative post-application environmental impacts.
The CaCl2 Deicer, OBPE Deicer, and NaCl Deicer have total impairment scores much closer to
one another such that the quantity of each element from a deicer can impact its relative effect on
the environment. This was demonstrated in the sensitivity analysis: OBPE Deicer was the third
most impactful deicer in the model during the original analysis but became the second most
impactful deicer in the post-application model when the quantity of deicer was held constant.
7.2 Quantifying Results
It is important to note that the primary use of the results from the hybrid model is relative. The
Ecopoints, kg of CO2 eq, and kg of CFC-11 eq are specific and measurable metrics but when
compared to impacts from post-application effects these results are all relative to the products
being researched.
The results from this research should be used as a comparative measure, which can then be used
for decision making. To know the rate at which one deicer will impact the environment
94
compared to another deicer can help mitigate poor decision making in environmentally sensitive
areas or areas that receive heavy snowfalls. If specific information on exact quantity of
measurable impact is necessary then quantities of emissions (such as CO2 emissions) or impact
to water or soil quality can be measured but the purpose of this research was to find a way in
which to compare those measures. Based upon the results, the goal was successfully met.
7.3 Impact of Post-Application Model
The environmental impact model that was created for the purpose of this research provided
relative impacts of deicers that were easily compared to impacts from the SimaPro 8 analysis.
The results were all relative and did not provide specific changes from deicing to D.O., TDS,
heavy metal leaching, or any of the other observed factors. Future research could be improved by
using specific water and soil quality samples to directly measure impact and correlation a deicer
has with any of the given factors.
This research did not weigh the importance of impacts at any given stage of the products’
lifecycles. Therefore, all stages associated with the pre-application analysis in SimaPro 8 were
considered to be equally as important as post-application (disposal). Various weighting schemes
were tested to determine how changing the weighting of the factors could change the results.
Chloride had the highest total impairment score in all three tested scenarios. The impacts of
chloride on the environment are well studied and documented and therefore can confirm that
chloride should have a higher impairment score. The magnitude by which chloride was
considered to be impactful varied based upon the weighting scenarios. The first weighting
system used a 1-5 scale. This scale provided a solid basis with which to capture relative impacts
of deicers but did not well-distinguish between receiving a weight of, for example, 2 versus a
weight of 3. As a result the differences in impact post-application were not as great in scale as
the differences between deicers from SimaPro 8 results.
A weighting system was also tested in which all factors were equally weighed and received a
score of 1. This removed the discretionary aspect required that would weigh a certain
95
environmental metric to be of greater importance than another. Although this removes the
discretionary aspect, it could also theoretically equate change in water hardness with water
depletion: one is primarily of aesthetic concern while the other reduces the quantity of a life-
sustaining substance. A standard weighting system of 1 had the same final results—CMA Deicer
was the least impactful and NaCl Deicer was the most impactful—but the magnitude of
difference between all deicers was decreased from the original results.
Finally, a scale of 1, 3, or 5 was tested. This weighting system was used to better distinguish
between impacts and importance of environmental metrics. The final results were the same as the
other two weighting systems—CMA Deicer was the least impactful and NaCl Deicer was the
most impactful—but the magnitude of difference between each deicer increased. This is likely
due to the fact that by using a scale of 1, 3, or 5, the differences between weights is more
pronounced. These results aligned more closely with the magnitude of differences between
deicers from the SimaPro 8 results.
Although it might appear in this research that a scale of 1, 3, or 5 is the recommended scale to be
used all scales provided the same overall results with differences in magnitude of impacts. The
benefit of using a scale of 1-5 is that it allows for smaller incremental impacts of environmental
metrics to be included. The benefit of using a standard weight is that it removes some of the
discretionary aspect that is initially required. The benefit of using a scale of 1, 3, or 5 is that it
better captures the differences between each weight.
Further research must be conducted to determine the most accurate method of weighting and a
way in which to decide the weights that will be used. In its current state, the post-application
model developed in this research provides a relatively easy way in which to compare effects of
products to the environment with results from SimaPro 8 when use and disposal phases are not
distinguishable and separate. For accuracy it is recommended that several weighting scenarios
are tested to determine how the weighting impacts results.
96
7.4 Relevance of Temperature
Observing the impacts of the weather data is also critical to evaluating the results of this
research. In this research there were 36 months observed and considered to be winter season
months with the potential for snow. Of those 36 months, 75% of the time the average monthly
temperature was greater than or equal to 30 F and 89% of the time the average monthly
temperature was greater than or equal to 25 F. If only the months that received some snowfall
are considered, then 68% of the time the average temperature was greater than or equal to 30 F
and 86% of the time the temperature was greater than or equal to 25 F. Average temperatures
were considered in this research because data on temperatures during exact time of snowfall was
not readily available dating back over a year. The average temperature was believed to have
captured the fluctuations in high and low temperatures during snowfalls. Months in which the
average temperature exceeded 32 F and there was snow present, it was assumed that the snow
occurred with temperatures at or around 32 F.
Despite each deicer having a different freezing point, suggested application rates always
increased in lbs per LM as temperature decreased because the effectiveness of deicing
diminishes as the solutions reached their freezing points. The rate at which quantities increased
or decreased with fluctuations in temperature was not consistent between deicers but changes
were incremental and followed a negative correlation to temperature. OBPE Deicer had the
lowest freezing point and required the least amount of deicer; CMA Deicer had the highest
freezing point and required the most amount of deicer.
If average monthly temperatures each increased by 5 F then 89% of average temperatures would
be greater than or equal to 30 F and 94% of average temperatures would be greater than or equal
to 25 F. If average monthly temperatures each decreased by 5 F then 53% of average
temperatures would be 30 F or greater and 75% would be equal to or greater than 25 F.
Therefore, temperatures for the majority of any winter season will be at or above 25 F.
It is when average temperatures continue to decrease that the effectiveness of using a deicer with
a lower freezing point becomes amplified because application rates are 7-8 times greater at 5 F
97
than they are at 32 F. Average temperatures do not typically fluctuate more than 5 F within the
same region unless over the course of many years or under extreme conditions. If this were to be
the case then the DOT might consider more closely evaluating their application rates and
effectiveness at lower temperatures or they might consider creating more detailed guidelines for
OBPE Deicer.
For the purpose of this research, applying a flat rate quantity of deicer demonstrated that the
impacts from NaCl Deicer, CaCl2 Deicer, and OBPE Deicer are relatively close at the same
quantities. This research also showed that using a flat rate quantity of applied deicer and
adhering to the deicing guidelines both drew the same conclusion that CMA Deicer is the
significantly least environmentally impactful choice. Therefore, as it stands, the relative
quantities and impacts from deicers in this research should continue to be reflective of the
temperatures, rates, and general deicing practice. Magnitude of impact from deicing should vary
with changes in temperatures but it would appear that CMA will remain the least
environmentally impactful.
7.5 Considerations Out of Scope
This research did not perform a cost analysis for each deicer. The cost in resources lost is
reported, as well as the average cost per ton, but the specific lifecycle costs such as those
associated with the production, manufacturing, and travel were not considered. Cost is a very
critical factor for many city planners who manage deicing practices.
The purpose of this paper was to find and conduct research to determine the least
environmentally impactful deicer, so lifecycle costing is considered outside the scope of this
research. Because cost may be important in understanding and conducting future research, data
on cost that was easily available is aggregated in Table 34. This table displays the costs for each
deicer and the relative cost per environmental impact.
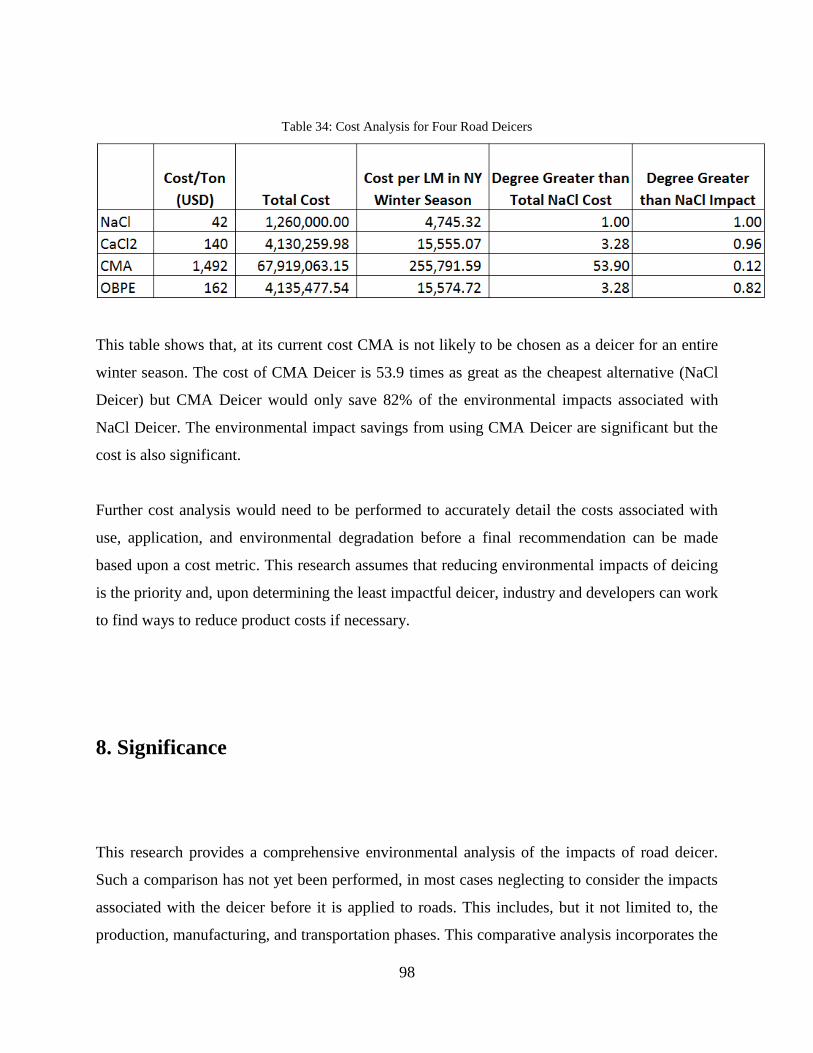
98
Table 34: Cost Analysis for Four Road Deicers
This table shows that, at its current cost CMA is not likely to be chosen as a deicer for an entire
winter season. The cost of CMA Deicer is 53.9 times as great as the cheapest alternative (NaCl
Deicer) but CMA Deicer would only save 82% of the environmental impacts associated with
NaCl Deicer. The environmental impact savings from using CMA Deicer are significant but the
cost is also significant.
Further cost analysis would need to be performed to accurately detail the costs associated with
use, application, and environmental degradation before a final recommendation can be made
based upon a cost metric. This research assumes that reducing environmental impacts of deicing
is the priority and, upon determining the least impactful deicer, industry and developers can work
to find ways to reduce product costs if necessary.
8. Significance
This research provides a comprehensive environmental analysis of the impacts of road deicer.
Such a comparison has not yet been performed, in most cases neglecting to consider the impacts
associated with the deicer before it is applied to roads. This includes, but it not limited to, the
production, manufacturing, and transportation phases. This comparative analysis incorporates the
99
environmental effects associated with early phases of road deicers, which provides a holistic
environmental impact that can assist city planners and environmental officials whose task it is to
maintain safe roads and safe environments.
Cities apply millions of tons of deicer each year in order to maintain roads during winter months,
all of which must eventually be released in to the environment. Although alternative road deicers
have been proposed as more environmentally friendly products a full lifecycle comparison is
crucial to make an environmentally informed decision. This study provides the data and research
for government officials and city planners to make such decisions.
8.1 Significance of Results
As cities are becoming more aware and concerned for the effects of deicers on the environment,
many have sought to use environmentally friendly alternatives to NaCl Deicer. OBPE Deicer,
while a better alternative with respect to environmental impacts than NaCl Deicer, is not the best
deicer choice for the environment. Common rhetoric assumes that the use of a plant-based, or
“natural,” substance to reduce NaCl application would always be preferable. It was found that
the impacts that come with OBPE, NaCl, and CaCl2 Deicer from NaCl mining during the pre-
application phase as well as from chloride during the post-application phase make CMA the
recommended deicer.
This is significant because CMA is manufactured and shipped from China, yet this research
reveals that the emissions and impact from transportation are not significant in comparison to the
three deicer alternatives. CMA Deicer also required the largest quantities and therefore had more
tkm associated with it during the application transportation. This indicates that the material
composition and production processes significantly outweigh impacts associated with deicing
and, more specifically, the use of NaCl should always be mitigated when possible. On average,
the three alternative deicers were 6 to 8 times more environmentally harmful than CMA Deicer.
This will provide a significant push to find ways to reduce the cost of CMA Deicer.
100
8.2 Significance of Model
Not only does this research provide information to cities and governments on best practices for
road maintenance, it also serves as a way in which to incorporate data from SimaPro 8 and
lifecycle analysis methodology in combination with external data. The use phase and the disposal
phase of road deicers are intertwined and therefore it is difficult to use standard LCA
methodology and SimaPro 8 to fully model the impacts. This paper created a way in which a
product can be broken up in to its parts and assigned an environmental impact score based upon
the effects of its parts on the environment.
In this case the deicers were broken up in to their individual elements and components because
there is extensive information available on the impacts of these components to the environment.
Products that are more complex do not have to be broken down to the molecular level but must
be broken down to a level in which the effects of the components is understood by the user. In its
current state, this model is best designed for products whose chemical compositions are well-
understood.
The number of components is multiplied by an impairment score and the deicer received a final
Total Environmental Impact score. The final number is a number which can be used to compare
the products and processes with one another and these relative scores are also comparable to
Ecopoints and other results from SimaPro 8.
This is significant because the use LCA methodology is a critical way to understand the
comprehensive effects of various products and processes on the environment. Products and
processes without distinct lifecycle phases cannot be accurately captured in SimaPro 8 and,
therefore, having a model in which this becomes available is essential. This research provides a
way in which all lifecycle phases can be captured particularly when the use and disposal phases
are not readily distinguishable. The model that was created can be researched further and tested
for accuracy and efficiency with other non-deicing products.
101
9. Future Work
In future work it would be worth looking at impacts of deicers not included in the scope of this
research. Corrosion and aesthetic impacts from deicers would be a primary focus of interest in
developing further analysis. Although these two factors were considered outside the scope of this
study, they have potential to affect choices in regions of the country and world where those
factors might be of greater importance. CMA is considered non-corrosive, whereas NaCl and
CaCl2 are considered very corrosive and extremely corrosive, respectively (Melancon, Mehta, &
Jahan, 2012). The CMA and agricultural byproduct, therefore, might logically offset corrosion
on vehicles and infrastructure, which in return could potentially mitigate environmental costs
associated with replacement of parts and construction. This paper does not draw these
conclusions, but it is suggested for further research.
Additionally, similar research can be done in the future, using this research as a model, to
determine if OBPE Deicer and CaCl2 Deicer would be better environmental alternatives to NaCl
if the solid base deicer to which they are applied is not NaCl. This research did not consider
additional solid bases but, based upon finally analysis, impacts from the mining of NaCl may be
mitigated if a more appropriate solid base can be determined.
This research also does not thoroughly address cost. Upfront costs in terms of cost per ton were
displayed but this does not fully capture the lifecycle costs. In addition future research should
place valuation on natural resources and the environment when considering lifecycle costs. To
capture costs outside of labor, tools, and the product itself a cost evaluation can be performed in
the future that places cost on depletion of resources and environment. While this process is very
rigorous it has the potential to provide a holistic understanding of true cost of each deicer. Costs
are important to municipalities and planners and therefore this will be a critical follow-up
component to this research.
Finally, additional work should establish a method for testing proper weighting schemes and
determine a methodical way for selecting a proper weighting scheme in the post-application
102
model. Some additional weighting schemes were proposed but there is no research yet as to
scientifically determine the most accurate or most appropriate weights. This paper introduced the
model but more work must be done in order to use the model across many lifecycle analyses.
10. Conclusion
In conclusion, CMA Deicer is the least environmentally impactful deicer across all categories,
both pre- and post-application. When sensitivity analyses was performed by keeping the quantity
of deicer constant as well as in varying the weights in the post-application model, CMA Deicer
remained the least environmentally impactful. This is most likely due to the lack of a closely
associated mining process with CMA Deicer during its pre-application SimaPro 8 analysis, as
well as it containing no chloride elements for impact during the post-application model. As a
result, CMA Deicer is much less impactful than the three other deicers analyzed. In all categories
and sensitivity analyses, NaCl Deicer was the most impactful with an average relative impact
8.08 times more than CMA Deicer.
The hybrid LCA model created in this research was used to capture the environmental effects of
deicers before they were applied to roads and after they had been applied. The post-application
model that was created serves as a way in which to relatively compare products and processes.
This is essential for comparison to results in SimaPro. The model provides a basis on which to
comprehensively analyze products where distinct lifecycle phases may not be evident. The
model that was created was used in this research with deicing in Rochester as a case study. The
impacts from each deicer during the post-application phase were easily compared to the impacts
during the pre-application phase. The results from the post-application model also indicated that
NaCl Deicer was the most impactful to the environment and CMA Deicer was the least impactful
to the environment.
103
Future research should consider developing the post-application model proposed in this research.
More specifically, the method for selecting weights must be further explored. In addition,
lifecycle costs should be considered in the future in order to fully capture the upfront, overhead,
and hidden costs associated with deicers. Finally, because CaCl2 and OBPE are additives, future
research should consider measuring and comparing the environmental impacts of these additives
if the solid base deicer were to not be NaCl.
104
11. References
1. Althus, H., Hischer, R., Osses, M., et al, 2007, “Life Cycle Inventories of Chemicals,”
Swiss Center for Lifecycle Inventories, EcoInvent Report No. 8.
2. American Rock Salt, 2016, https://www.americanrocksalt.com/
3. Bang, S. and Johnston, D., 1998, “Environmental effects of sodium Acetate/Formate
deicer.” Environmental Contamination and Toxicology, vol. 35 (4), 580-587.
http://www.ncbi.nlm.nih.gov/pubmed/9776775
4. Baumann, H., & Tillman, A.-M. (2004). The Hitch Hiker's Guide to LCA: An orientation
in lifecycle assessment methodology and application. Lund, Sweden: Studentlitteratur.
5. Blackburn, R., Bauer, K., Amsler, D., Boselly, S., and McElroy, A., 2004, “Snow and Ice
Control Guidelines for Materials and Methods,” National Cooperative Highway Research
Program, Report 526. http://onlinepubs.trb.org/onlinepubs/nchrp/nchrp_rpt_526.pdf
6. Bloomer, Todd A. Anti-freezing and Deicing Composition and Method. Grain Processing
Corp, assignee. Patent US 6416684 B1. 9 July 2002.
https://www.google.com/patents/US6416684
7. Brenner, M. and Horner, R, 1992, “Effects of calcium magnesium acetate (CMA) on
dissolved oxygen in natural waters,” Resources, Conservation, and Recycling, vol. 7,
7239-265 http://www.sciencedirect.com/science/article/pii/092134499290019X
8. Cargill, Inc., History of the Cayuga Salt Mine. n.d. Web.
105
9. City of Rochester. Equipment Service, n.d. Web.
<http://www.cityofrochester.gov/article.aspx?id=8589944488>.
10. CMA Calcium Magnesium Acetate Rock Salt Deicier Buy Bulk CMA Distributor.
Schoenberg Salt Company, n.d. Web.
11. Dow. Home Page, http://www.dow.com/michigan/
12. Dwayne Aycock, Monroe West Resident Engineer: NYS Department of Transportation.
Phone Interview. March 15, 2016.
13. Edge Environment. What Are Ecopoints? (n.d.): n.
http://edgeenvironment.com.au/docs/Australian%20Ecopoints.pdf
14. European Union: European Environment Agency Department of Informatics and
Telecommunications. Corine Land Cover 2000 Seamless Vector Data. The European
Topic Centre on Spatial Information and Analysis., Apr. 2012. Web.
15. Environmental Protection Agency Lake Access, “General Lake Chemistry,”
http://www.lakeaccess.org/ecology/lakeecologyprim6.html
16. Fishel, M., 2001, “Evaluation of Selected Deicers Based on a Review of the Literature,”
Colorado Department of Transportation report number CDOT-DTD-R-2001-15.
17. Fitch, M.G., Smith, J.A., and Clarens, A.F. "Environmental Life-Cycle Assessment of
Winter Maintenance Treatments for Roadways." Journal of Transportation Engineering
J. Transp. Eng. 139.2 (2013): 138-46. Crandall University. Web.
18. Fu, Liping, Raqib Omer, and Chaozhe Jiang. "Field test of organic deicers as prewetting
and anti-icing agents for winter road maintenance." Transportation Research Record:
Journal of the Transportation Research Board 2272.1 (2012): 130-135.
106
19. Gancy, A.B., Hinkle, R.G., “PILOT PLANT PRODUCTION OF CALCIUM
MAGNESIUM ACETATE DEICER,” Gancy Chemical Company.
https://www.marsmineral.com/pdf/CaMgAcetate.pdf
20. Gardner, K. and Royer, T., 2010, “Effect of Road Salt Application on Seasonal Chloride
Concentrations and Toxicity in South-Central Indiana Streams,” Journal of
Environmental Quality, vol. 39, 1036-1041
21. Graedel, T. (1999). Streamlined Lifecycle Assessment. Upper Saddle River, NJ: Prentice
Hall.
22. Highway Maintenance Guidelines. Rep. N.p.: New York State Department of
Transportation, n.d. Chapter 5: Snow and Ice Control. Operations Division Office of
Transportation Maintenance, Apr. 2006. Web. Revised January 2012
23. Kelting, D. and Laxson, C., 2010, “Review of Effects and Costs of Road De-icing with
Recommendations for Winter Road Management in the Adirondacks,” Adirondacks
Watershed Institute Report No. AWI2010-01, 1-84.
24. Kelting, D. Laxson, C., and Yerger, E., 2012, “Regional analysis of the effect of paved
roads on sodium and chloride in lakes,” Water Research: A Journal of the International
Water Association, vol. 46, 2749-2758.
25. Kluge, B., Werkenthin, M., and Wessolek, G., 2014, “Metal leaching in a highway
embankment on field and laboratory scale,” Science of Total Environment, vol. 493, 495-
504.
26. Kostick, Dennis. Mineral Commodity Studies: Salt. Rep. U.S. Geological Survey, Jan.
2010. Web.
107
27. Kunkel, K., Karl, T., Brooks, H., et. al, 2013, “Monitoring and Understanding Trends in
Extreme Storms,” Bulletin of the American Meteorological Society, 94(4), 507-511.
28. International Organization for Standardization. Homepage, n.d. Web. July 2016.
<http://www.iso.org/iso/home.htm>.
29. IPCC Fourth Assessment Report: Climate Change 2007. Rep. no. FAQ 3.2 How Is
Precipitation Changing? Intergovernmental Panel on Climate Change, n.d. Web.
30. IPCC Fourth Assessment Report: Climate Change 2007. Rep. no. 3.3.2.3 Changes in
Snowfall. Intergovernmental Panel on Climate Change, n.d. Web.
31. Kelly L. Warner, Chief of Water Quality: United States Geological Survey. Personal
Interview. July 05, 2016
32. Kemp, R. and Keegan, S., 2000. Calcium Chloride, Encyclopedia of Industrial Chemistry
33. Ketcham, S., Minsk, D., et al. 1996. “Manual of Practice for an Effective Anti-icing
Program: A Guide For Highway Winter Maintenance Personnel,” Federal Highway
Administration Office of Engineering Research and Development. Report No. FHWA-
RD-95-202. https://www.fhwa.dot.gov/reports/mopeap/mop0296a.htm
34. L Hoist Mineral and Lime Producer, “All About Lime and Minerals,”
http://www.lhoist.com/want-know-more-about%E2%80%A6
35. Lashmet, M. and Thompson, J. Snow and Ice. New York State Department of
Transportation. Office of Operations NYSDOT, n.d. Print. Transportation Systems
Maintenance Training.
108
36. Lawrence, Mark G. "The Relationship between Relative Humidity and the Dewpoint
Temperature in Moist Air: A Simple Conversion and Applications." Bull. Amer. Meteor.
Soc. Bulletin of the American Meteorological Society 86.2 (2005): 225-33. Web.
37. Levasseur, A., Lesage, P., Margni, M., Deschenes, L., & Samson, R. (2010). Considering
time in LCA: Dynamic LCA and its application to global warming impact
assessments. Environmental science & technology, 44(8), 3169-3174.
38. Liquidow Calcium Chloride, “Product Information Sheet.”
http://www.liquidcalciumchloride.com/Literature/ProductInfo/LIQUIDOWProdInfo.pdf
39. Mayer, T., Rochfort, Q., Borgmann, U., and Snodgrass, W., 2007, “Geochemistry and
toxicity of sediment porewater in a salt-impacted urban stormwater detention pond,”
Journal of Environmental Pollution, issue 156, 143-151.
40. McKenzie, E. R, Zhang, H., Van Aken, B., and Abboud, B., 2015, “Effective Use and
Application of Winter Roadway Maintenance Material Enhancers.” Pennsylvania
Department of Transportation and Temple University.
http://www.dot7.state.pa.us/BPR_PDF_FILES/Documents/Research/Complete%20Projec
ts/Maintenance/Task_6.1_Final_Report.pdf
41. Melancon, B., Mehta, Y., and Jahan, K. Potential for Natural Brine for Anti-Icing and
De-Icing. Rep. no. Task Assignment No. C-06-07 Final Report. NYSDOT, Sept. 2012.
Web.
42. Michigan Sugar. Michigan Sugar Company, n.d. Web.
<http://www.michigansugar.com/contact/#facilities>.
43. Ministerie Van Volkshuisvesting. ReCiPe 2008: A Life Cycle Impact Assessment Method
Which Comprises Harmonised Category Indicators at the Midpoint and the Endpoint
109
Level. First Edition (1.08) ed. Netherlands: Ruimtelijke Ordening En Milieubeheer, 2013.
Report I: Characterisation. May 2013. Web.
44. Morgan, Ray. "Stream Conductivity and Road Salt Relationships to Land Use and Fish
Assemblages in Maryland Streams." 144th Annual Meeting of the American Fisheries
Society. Afs, 2014.
45. National Oceanic and Atmospheric Association, 2016. “U.S. Daily Snowfall and Snow
Depth Data.” National Centers for Environmental Information.
http://www.ncdc.noaa.gov/snow-and-ice/daily-snow/
46. Nerbrand, C., Agreus, L., Lenner, R.A., et al., 2008, “The influence of calcium and
magnesium in drinking water and diet on cardiovascular risk factors in individuals living
in hard and soft water areas with differences in cardiovascular mortality,” Biomedical
Public Health, vol 3 (1). http://www.ncbi.nlm.nih.gov/pmc/articles/PMC198279/
47. New Hampshire Department of Environmental Services, 2016, “Environmental, Health
and Economic Impacts of Road Salt,”
http://des.nh.gov/organization/divisions/water/wmb/was/salt-reduction-
initiative/impacts.htm#waterquality
48. Osborne, S., 2016, “January 2016 Storm Was A Category 5 Event.” National Oceanic
and Atmospheric Association.
49. Rahmstorf, Stefan, Jason E. Box, Georg Feulner, Michael E. Mann, Alexander Robinson,
Scott Rutherford, and Erik J. Schaffernicht. "Exceptional Twentieth-century Slowdown
in Atlantic Ocean Overturning Circulation." Nature Climate Change Nature Climate
Change 5.5 (2015): 475-80. Web.
110
50. Robidoux, P. and Delisle, C., 2001, “Ecotoxicological Evaluation of Three Deicers
(NaCl, NaFo, CMA)—Effect on Terrestrial Organisms,” Ecotoxicology and
Environmental Safety, vol. 38, 128-139.
51. Reisinger, Hubert, and King, C.J. "Extraction and Sorption of Acetic Acid at PH above
PKa to Form Calcium Magnesium Acetate." Industrial & Engineering Chemistry
Research Ind. Eng. Chem. Res. 34.3 (1995): 845-52. Web.
52. Shi, X., Fortune, K., Smithlin, R., Akin, M., and Fay, L., 2012, “Exploring the
performance and corrosivity of chloride deicer solutions: Laboratory investigation and
quantitative modeling,” Cold Regions Science and Technology, vol. 86, 36-44.
53. Siegel, L.,2007, “Hazard Identification for Human and Ecological Effects of Sodium
Chloride Road Salt,” State of New Hampshire Department of Environmental Services.
http://www.rebuildingi93.com/documents/environmental/Chloride%20TMDL%20Toxico
logical%20Evaluation.pdf
54. Stripple, H., 2001, “Life Cycle Assessment of Roads,” IVL Swedish Environmental
Institute, Report B 1210, Second Revised Edition
55. Thomas, C. and Suss-Fink, G, 2003, “Ligand effects in rhodium-catalyzed carbonylation
of methanol,” Coordination Chemistry Reviews. Issue 243, 125-142.
https://www.researchgate.net/publication/222208912_Ligand_effects_in_the_rhodium-
catalyzed_carbonylation_of_methanol
56. Tyrrell, T. "Anthropogenic Modification of the Oceans." Philosophical Transactions:
Mathematical Physical and Engineering Sciences.Vol. 369, No. 1938, The Anthropocene:
a New Epoch of Geological Time? (2011): 887-908. Web.
57. United States Census Bureau, 2013,
http://quickfacts.census.gov/qfd/states/36/3663000.html
111
58. United States Department of Agriculture. USDA ERS - Sugar & Sweeteners:
Background. United States Department of Agriculture Economic Research Service, n.d.
Web. 29 July 2016.
59. US Department of Labor; Bureau of Labor Statistics. Division of Information and
Marketing Service. Paid Leave in Private Industry over the past 20 Years. By Robert W.
Van Giezen. 18th ed. Vol. 2. Washington, D.C.: US Bureau of Labor Statistics, 2013.
60. United States Environmental Protection Agency, 2006, “Voluntary Estuary Modeling
Manual, Ch. 14,” Second edition, EPA-842-B-06-003,
http://www.epa.gov/owow/estuaries/monitor/
61. United States Environmental Protection Agency, 2010, “Managing Highway Deicing to
Prevent Contamination of Drinking Water,” Office of Water (4606), USEPA East, 1-10.
62. United States Geological Survey, 2014, “Health-Based Screening Levels for Evaluating
Water-Quality Data.” http://cida.usgs.gov/hbsl/apex/f?p=104:1
63. United States Geological Survey. "Water Properties and Measurements." Water
Properties, U.S. Geological Survey Water Science School. U.S. Department of the
Interior; USGS, n.d. Web.
64. United States Geological Survey. USGS Mineral Resources On-Line Spatial Data By
State. "New York Geologic Map Data,” n.d. Web. 29 July 2016.
65. Van Meter, R., Swan, C., and Snodgrass, J., 2011, “Salinization alters ecosystem
structure in urban detention stormwater detention ponds,” Urban Ecosystems, vol. 14,
723-736
112
66. Walsh, John, and Wuebbles, D.. National Climate Assessment. Rep. United States Global
Change Research Program, 2014. Web.
67. Warner, K.L., and Ayotte, J.D., 2014, Water quality in the glacial aquifer system,
northern United States, 1993–2009: U.S. Geological Survey Circular 1352,
http://pubs.usgs.gov/circ/1352/.
68. World Health Organization, 2016, “World Health Statistics and Information Systems.”
http://www.who.int/healthinfo/global_burden_disease/metrics_daly/en/
69. Wursch, C. "Oceanography: What Is the Thermohaline Circulation?" Science 298.5596
(2002): 1179-181. Web.

113
12. Appendices

114
APPENDIX A: Weather Data
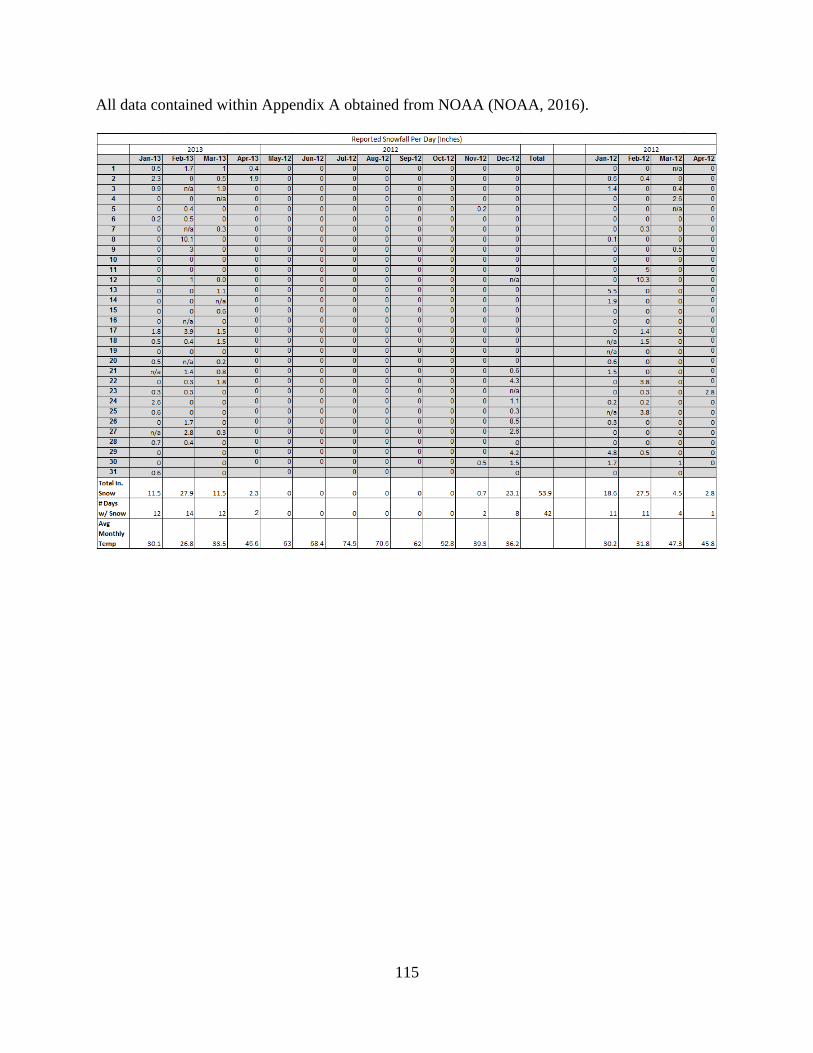
115
All data contained within Appendix A obtained from NOAA (NOAA, 2016).
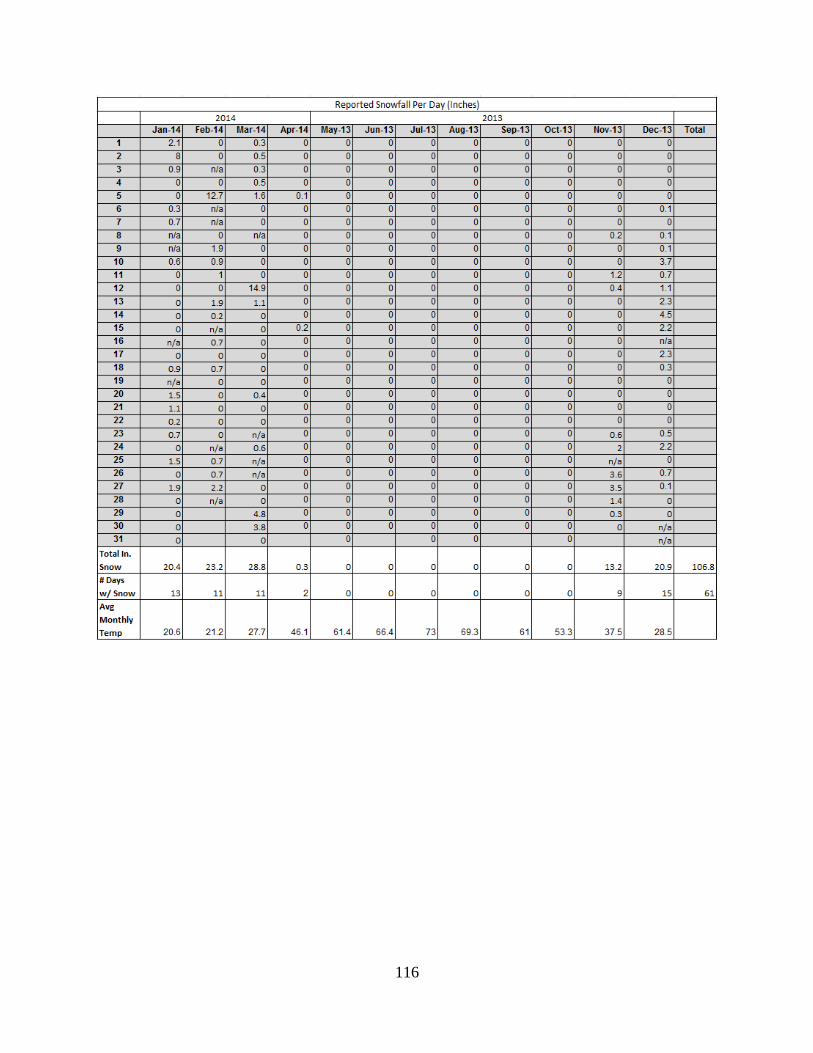
116
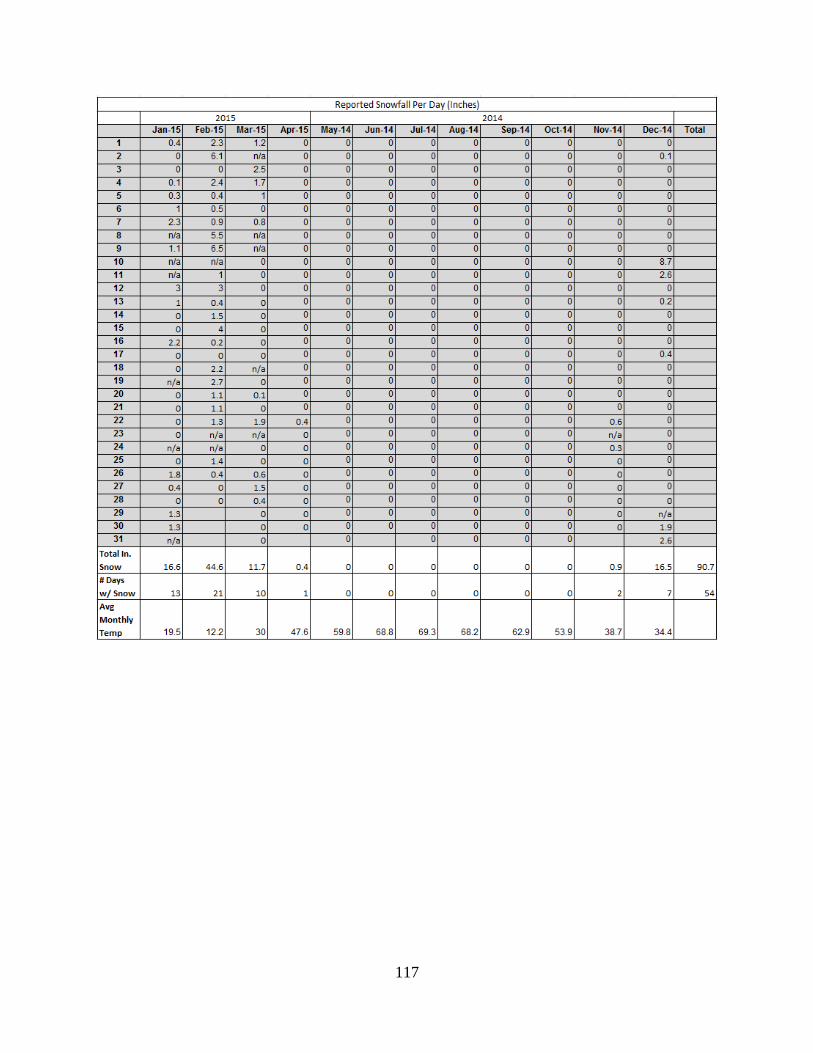
117
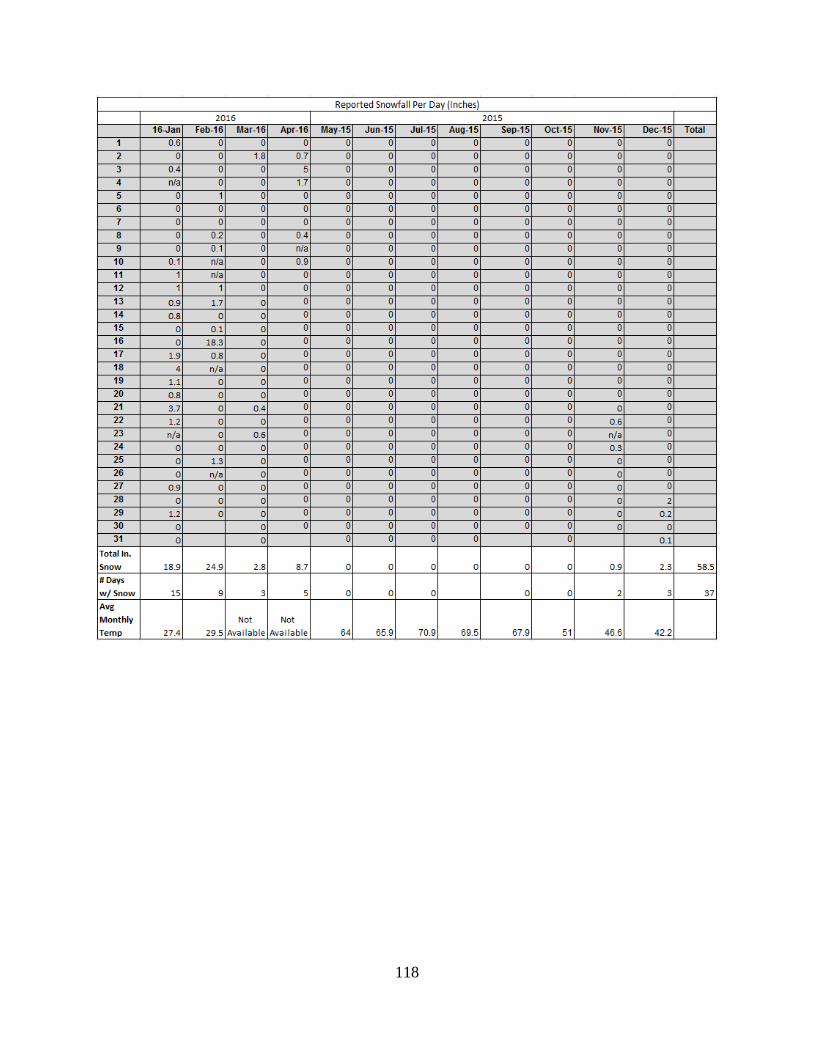
118
119
APPENDIX B: CaCl2 Calculations
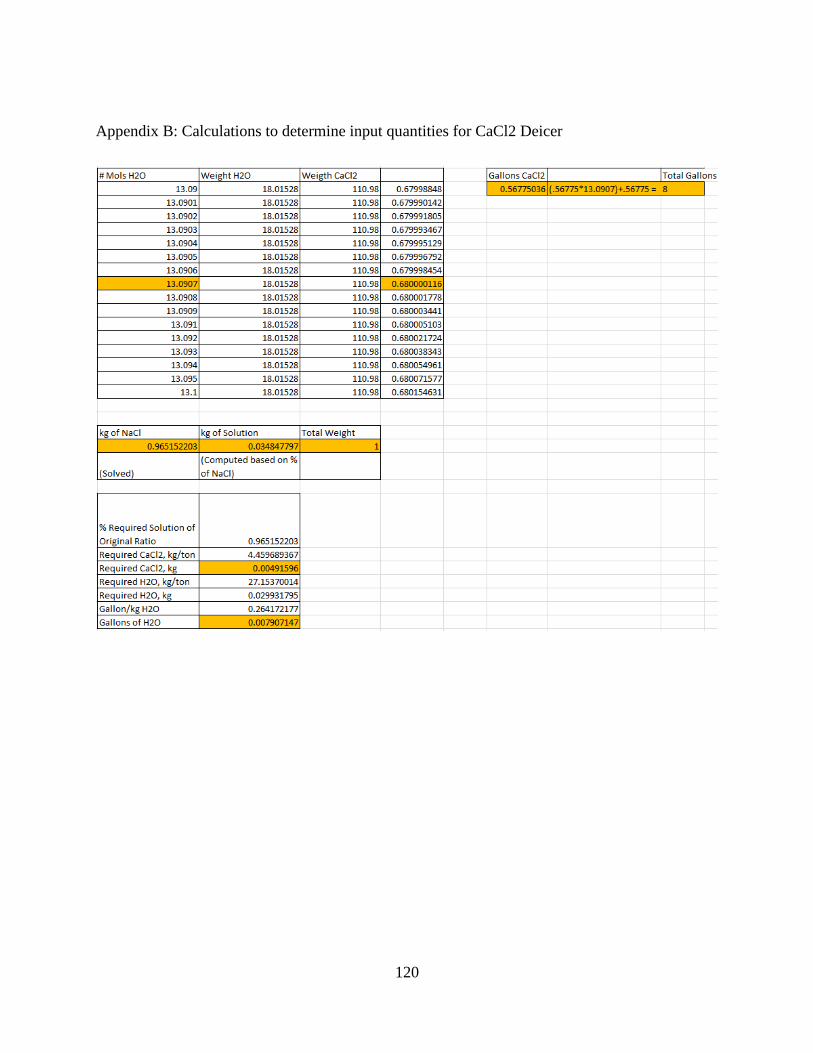
120
Appendix B: Calculations to determine input quantities for CaCl2 Deicer

121
APPENDIX C: Process Contributions
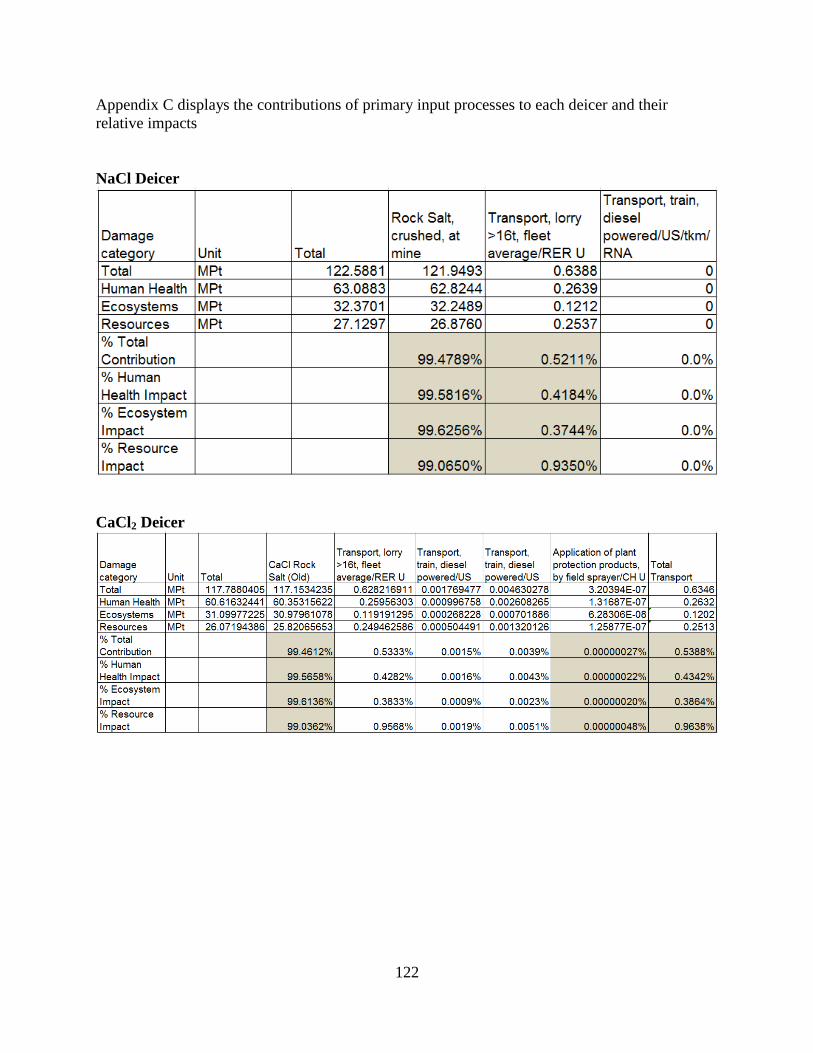
122
Appendix C displays the contributions of primary input processes to each deicer and their
relative impacts
NaCl Deicer
CaCl2 Deicer
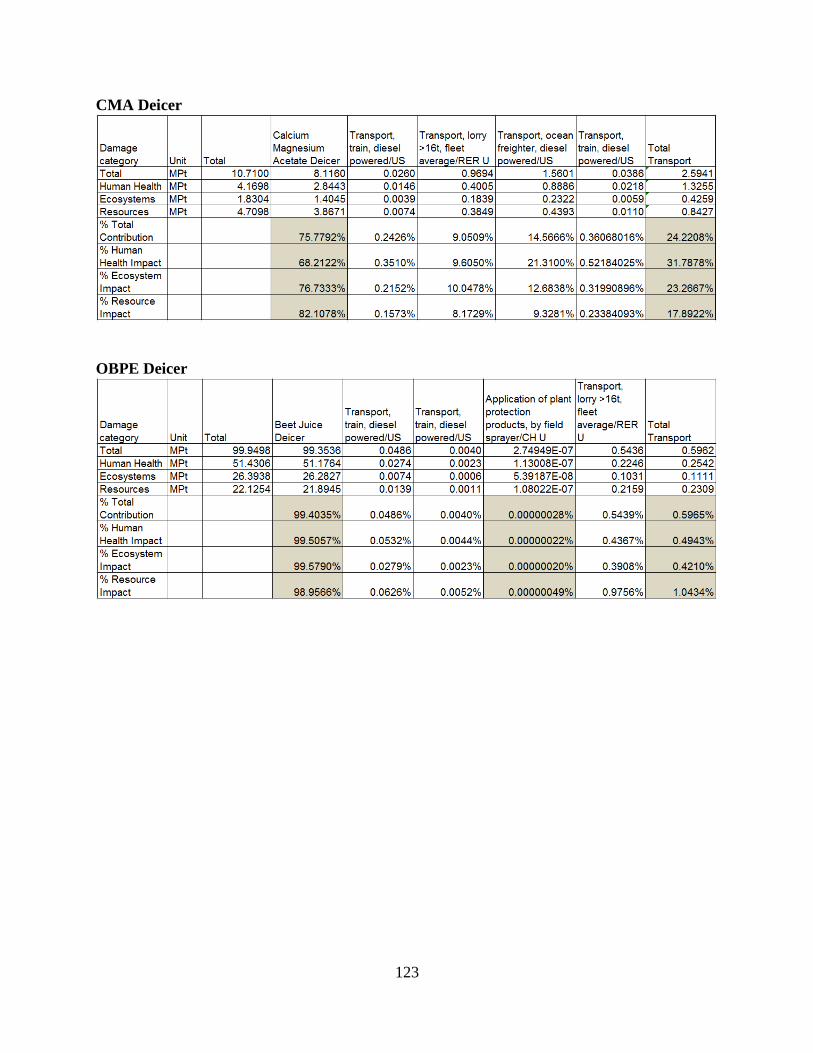
123
CMA Deicer
OBPE Deicer

124
APPENDIX D: NaCl Process Tree
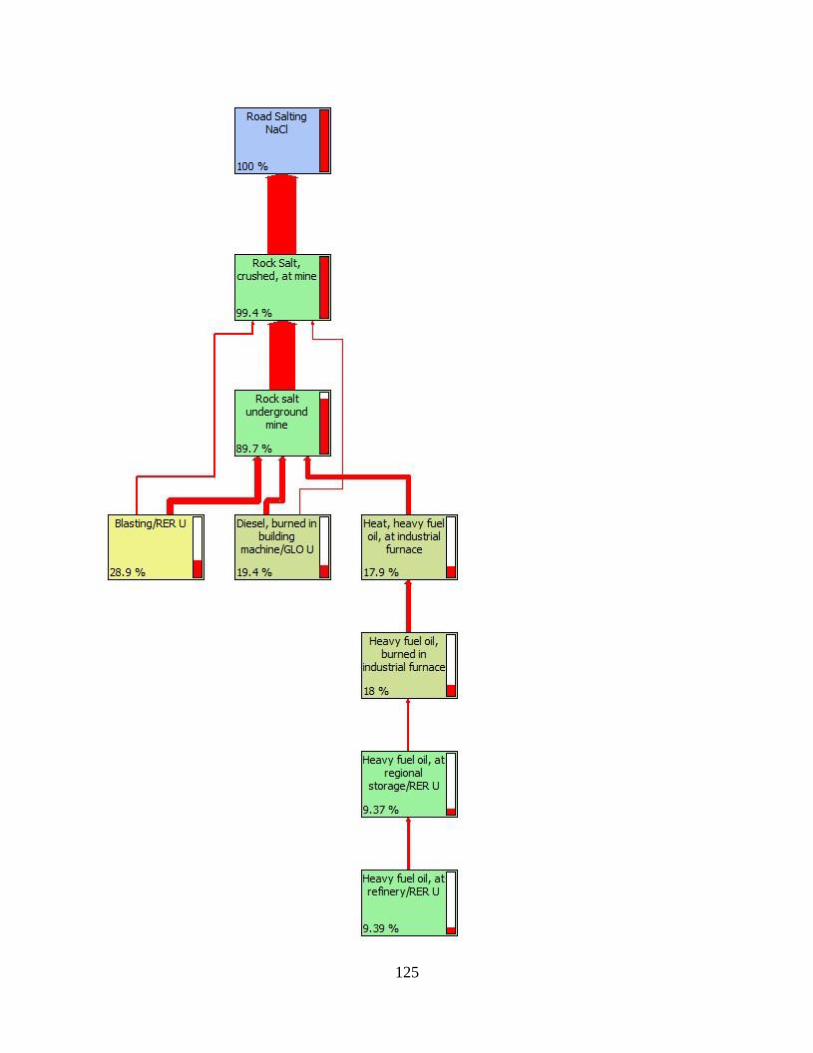
125
126
APPENDIX E: CaCl2 Process Tree

127

128
APPENDIX F: OBPE Process Tree
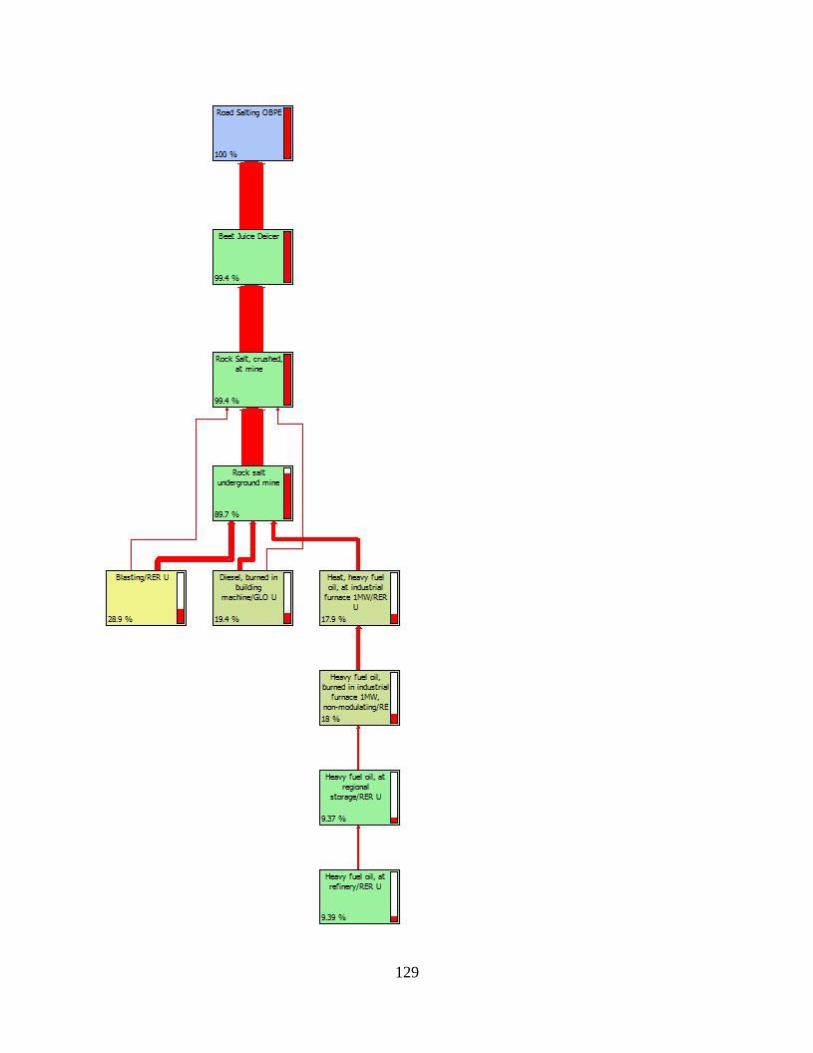
129