Embed Size (px)
Citation preview
An Energy Evolution:Alternative Fueled Vehicle
ComparisonsPresented to the DOE EERE Office
July 26, 2010Presented by Patrick Serfass, VP, National Hydrogen
AssociationPrepared by C. E. (Sandy) Thomas, Ph.D., ex-President
H2Gen Innovations, Inc.Alexandria, Virginia
and Director, National Hydrogen Association
www.CleanCarOptions.com
2
Outline
• Main Results from 100-year simulation– Greenhouse Gas Emissions– Oil consumption
• Battery vs. Fuel Cell system comparison• Capital investments (industry & Government)
required for:– Hydrogen infrastructure– Electrical charging infrastructure
• Government Incentives required for:– BEVs– FCEVs
• Natural Gas Vehicle Comparisons
3
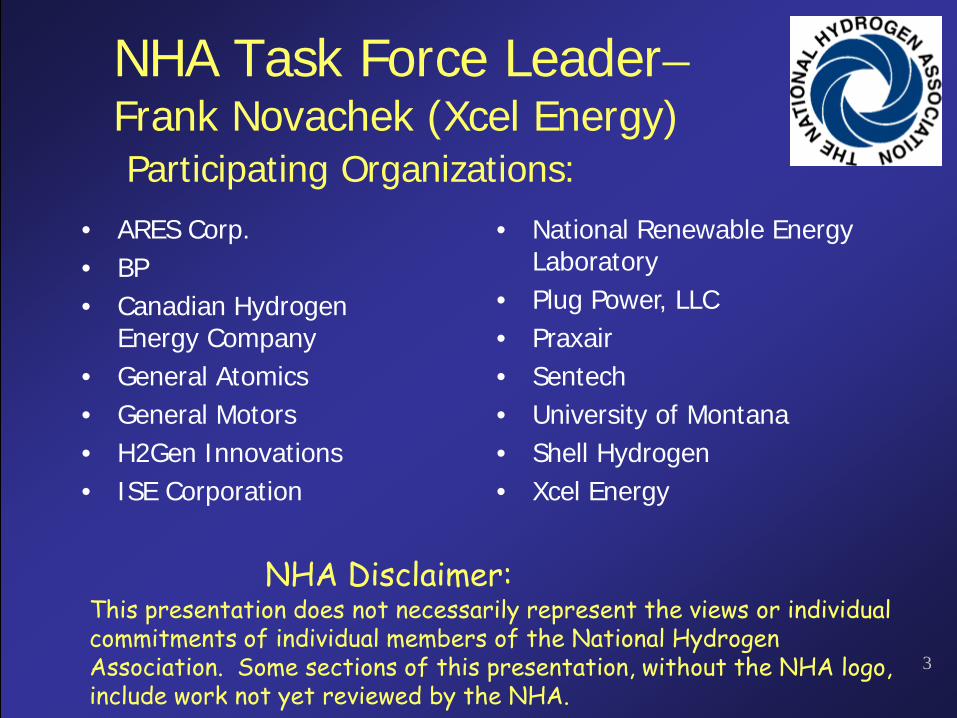
NHA Task Force Leader–Frank Novachek (Xcel Energy)Participating Organizations:
• ARES Corp.• BP• Canadian Hydrogen
Energy Company • General Atomics • General Motors• H2Gen Innovations• ISE Corporation
• National Renewable Energy Laboratory
• Plug Power, LLC• Praxair• Sentech• University of Montana• Shell Hydrogen• Xcel Energy
This presentation does not necessarily represent the views or individual commitments of individual members of the National Hydrogen Association. Some sections of this presentation, without the NHA logo, include work not yet reviewed by the NHA.
NHA Disclaimer:
4
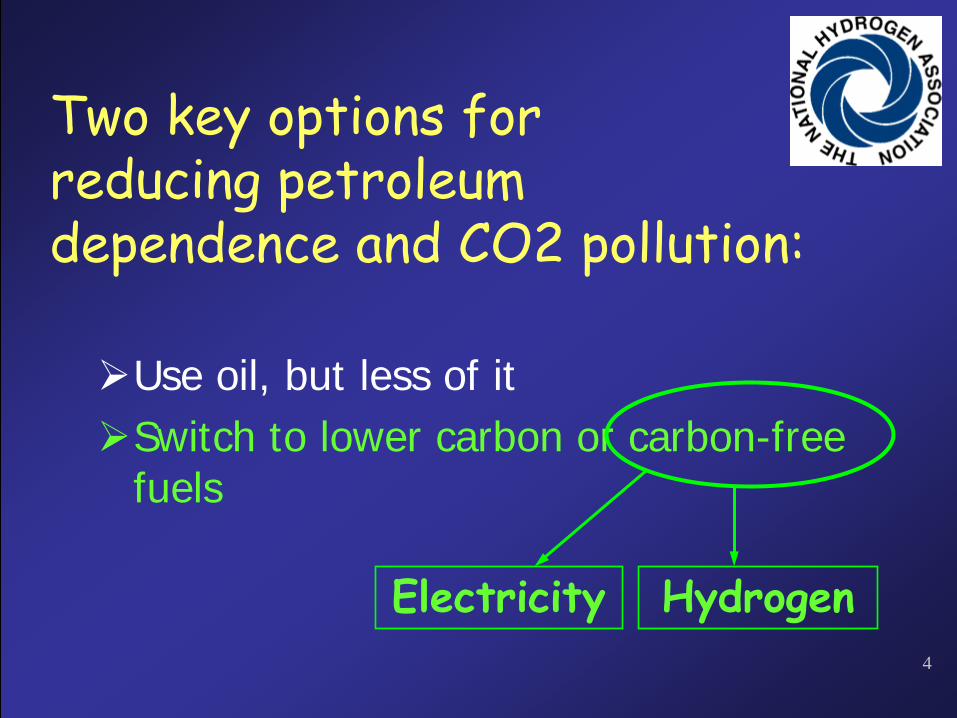
Two key options for reducing petroleum dependence and CO2 pollution:
Use oil, but less of itSwitch to lower carbon or carbon-free
fuels
Electricity Hydrogen
5
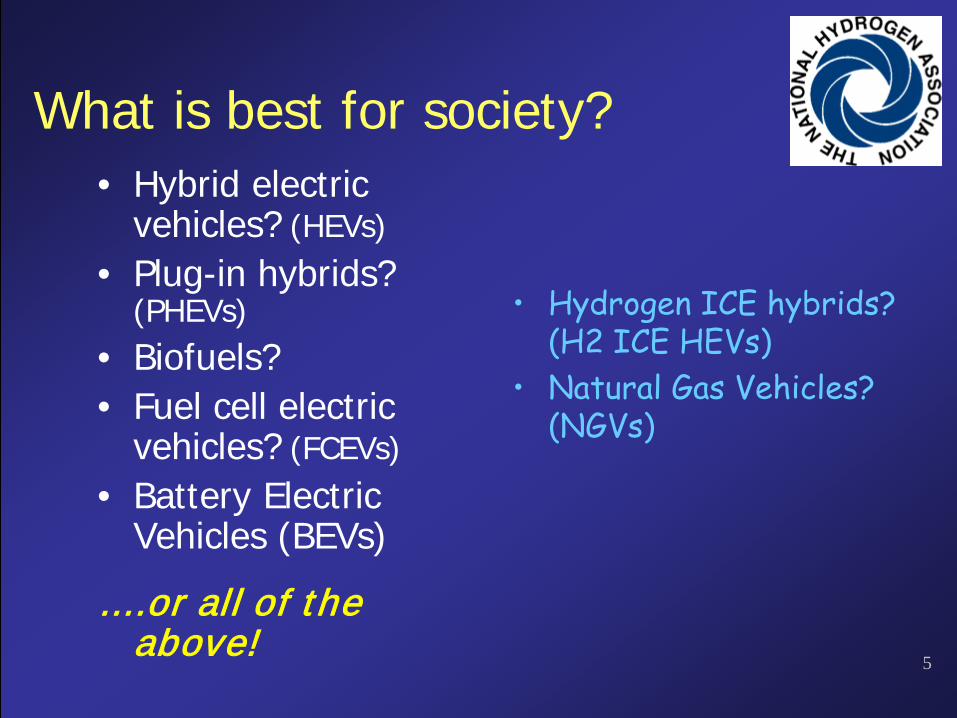
What is best for society?• Hybrid electric
vehicles? (HEVs)• Plug-in hybrids?
(PHEVs)• Biofuels?• Fuel cell electric
vehicles? (FCEVs)• Battery Electric
Vehicles (BEVs)
… .or all of the above!
• Hydrogen ICE hybrids? (H2 ICE HEVs)
• Natural Gas Vehicles? (NGVs)
6
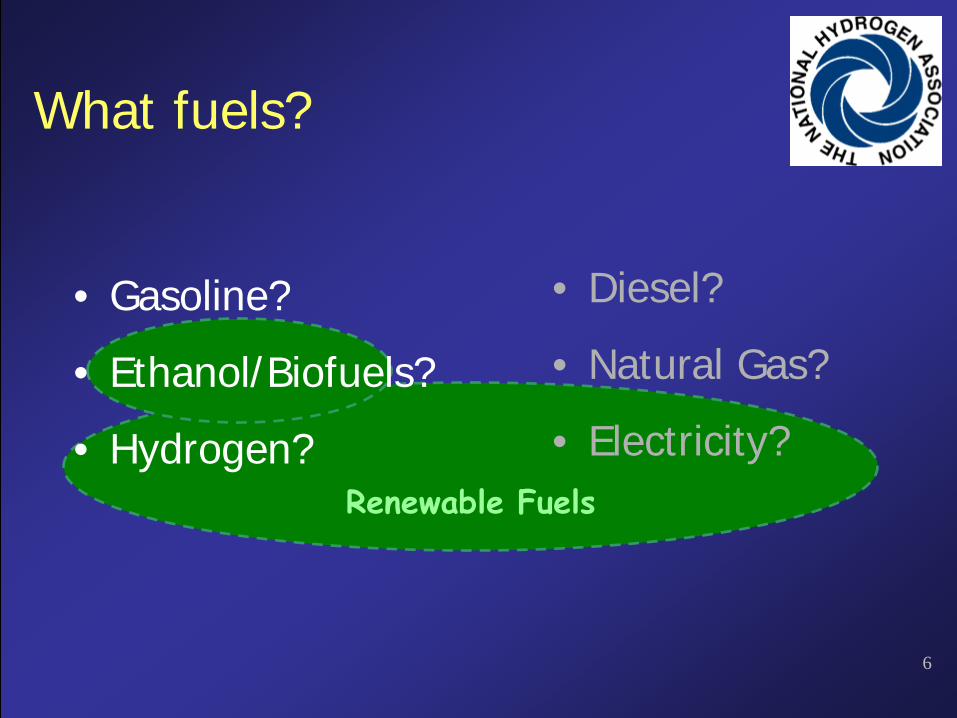
Renewable Fuels
What fuels?
• Gasoline?
• Ethanol/Biofuels?
• Hydrogen?
• Diesel?
• Natural Gas?
• Electricity?
7
How do we choose?
National Hydrogen Association Process:• Develop 100-year vehicle simulation
computer program• Use only peer-reviewed data• Compare all alternative vehicle/fuel
combinations over the century in terms of four societal attributes
8
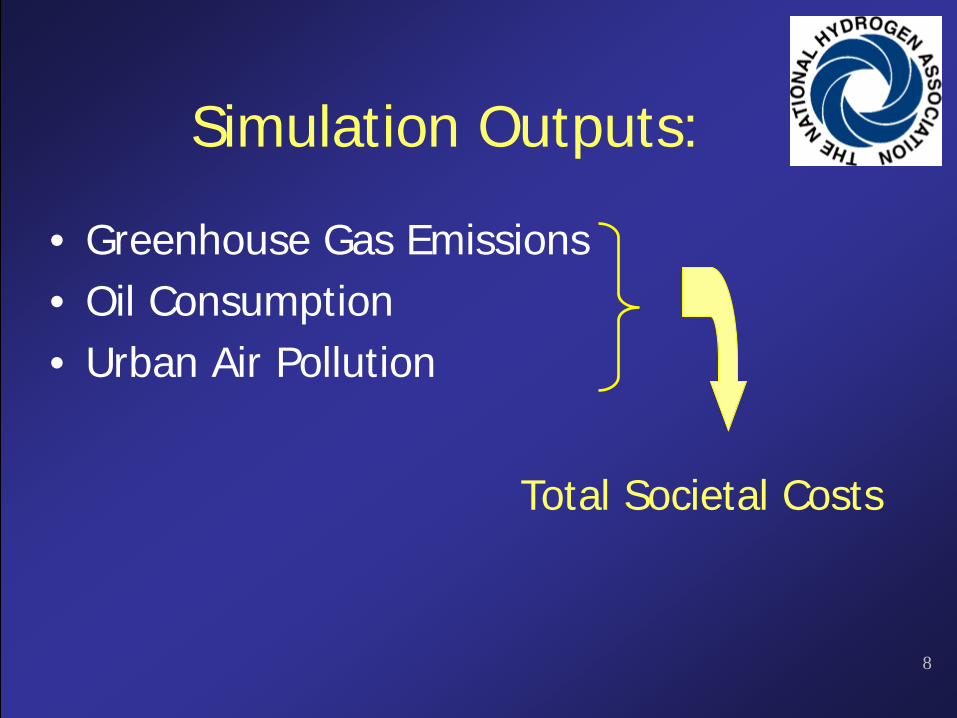
• Greenhouse Gas Emissions• Oil Consumption• Urban Air Pollution
Total Societal Costs
Simulation Outputs:
9
Key Assumptions
• Assume success for all options– Technical success– All Vehicles are affordable
• Assume stringent climate change constraints– Hydrogen production becomes green over time– Electricity production becomes green over time
10
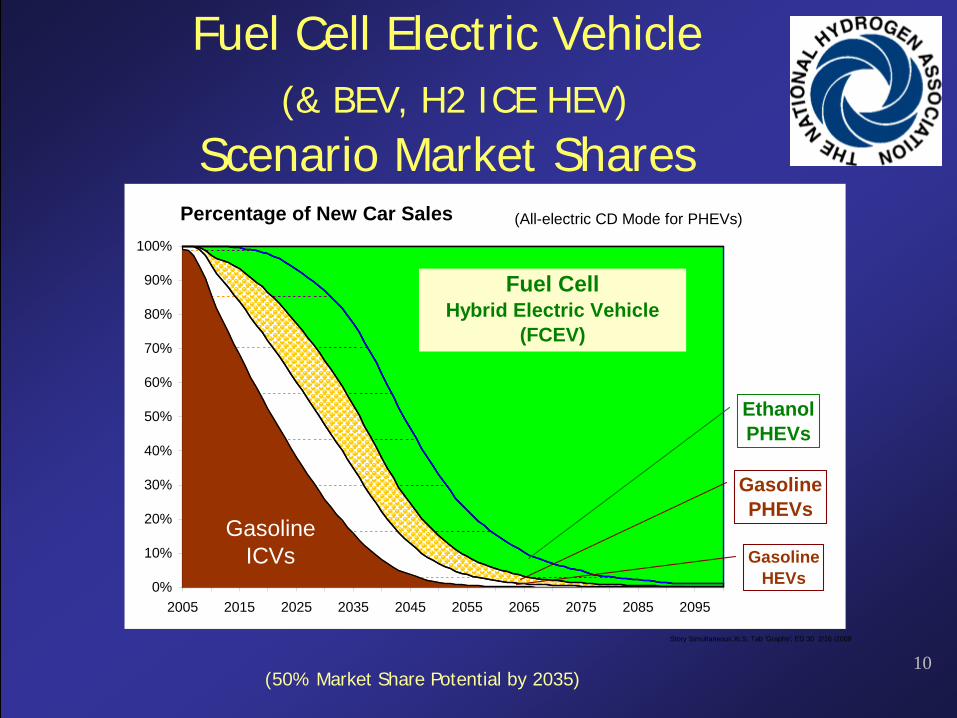
Fuel Cell Electric Vehicle(& BEV, H2 ICE HEV)
Scenario Market Shares
(50% Market Share Potential by 2035)
Story Simultaneous.XLS; Tab 'Graphs'; ED 30 2/16 /2009
Percentage of New Car Sales
0%
10%
20%
30%
40%
50%
60%
70%
80%
90%
100%
2005 2015 2025 2035 2045 2055 2065 2075 2085 2095
GasolineICVs
(All-electric CD Mode for PHEVs)
GasolineHEVs
Fuel Cell Hybrid Electric Vehicle
(FCEV)
GasolinePHEVs
EthanolPHEVs
11
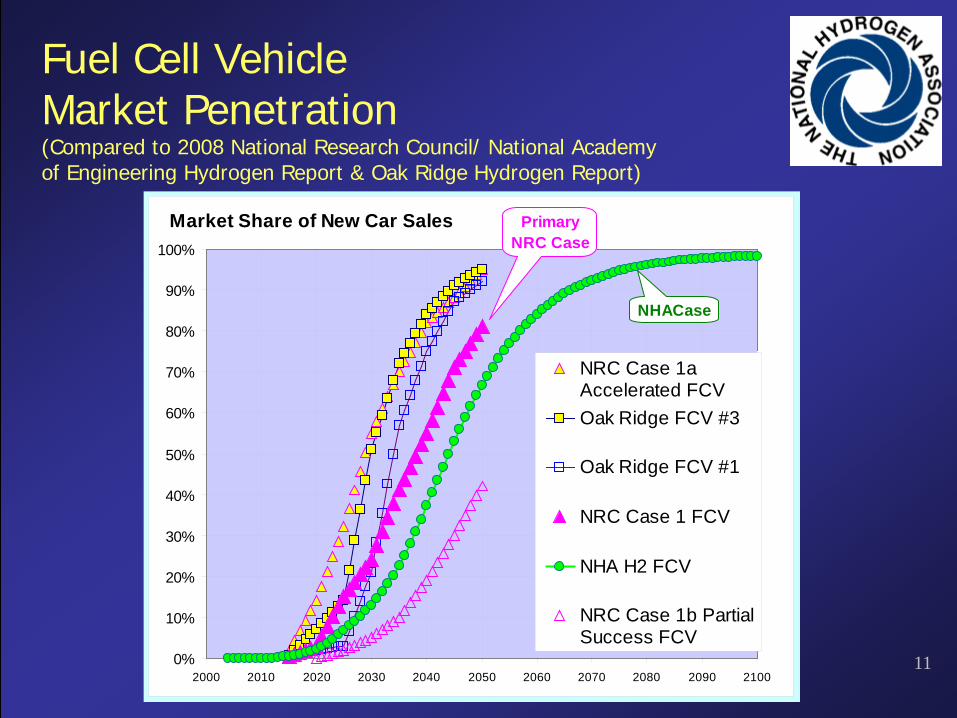
Fuel Cell Vehicle Market Penetration(Compared to 2008 National Research Council/ National Academy of Engineering Hydrogen Report & Oak Ridge Hydrogen Report)
0%
10%
20%
30%
40%
50%
60%
70%
80%
90%
100%
2000 2010 2020 2030 2040 2050 2060 2070 2080 2090 2100
NRC Case 1aAccelerated FCVOak Ridge FCV #3
Oak Ridge FCV #1
NRC Case 1 FCV
NHA H2 FCV
NRC Case 1b PartialSuccess FCV
Market Share of New Car Sales PrimaryNRC Case
NHACase
12
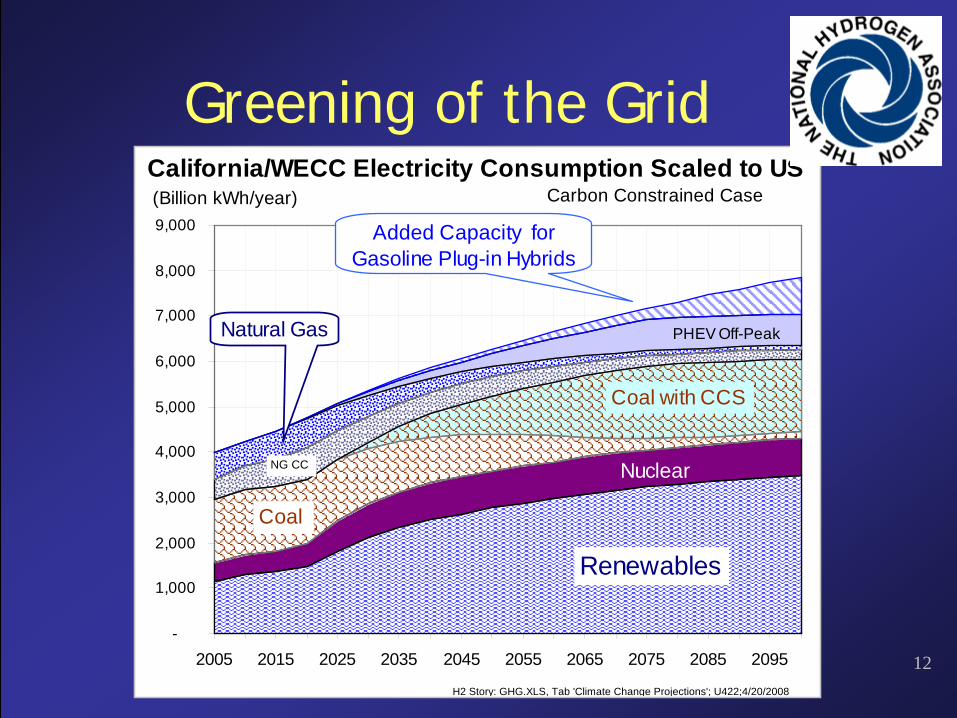
Greening of the Grid
-
1,000
2,000
3,000
4,000
5,000
6,000
7,000
8,000
9,000
2005 2015 2025 2035 2045 2055 2065 2075 2085 2095
California/WECC Electricity Consumption Scaled to US (Billion kWh/year)
Renewables
Nuclear
Coal
Coal with CCS
Natural Gas
H2 Story: GHG.XLS, Tab 'Climate Change Projections'; U422;4/20/2008
Carbon Constrained Case
NG CC
Added Capacity for Gasoline Plug-in Hybrids
PHEV Off-Peak
13
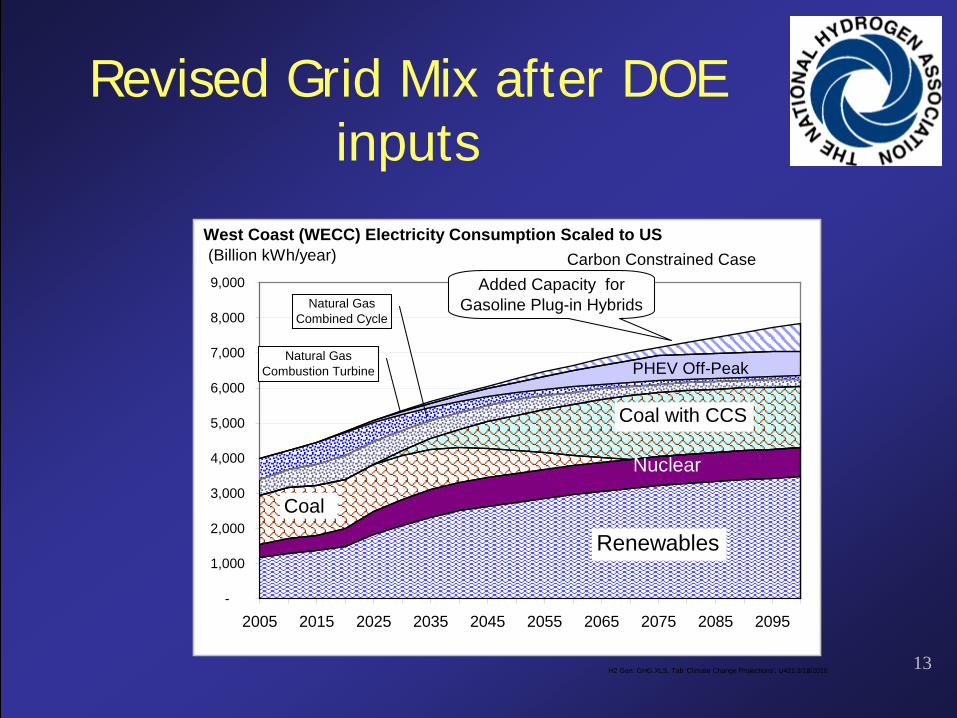
Revised Grid Mix after DOE inputs
H2 Gen: GHG.XLS, Tab 'Climate Change Projections'; U421;3/18/2010
-
1,000
2,000
3,000
4,000
5,000
6,000
7,000
8,000
9,000
2005 2015 2025 2035 2045 2055 2065 2075 2085 2095
West Coast (WECC) Electricity Consumption Scaled to US (Billion kWh/year)
Renewables
Nuclear
Coal
Coal with CCS
Carbon Constrained CaseAdded Capacity for
Gasoline Plug-in Hybrids
PHEV Off-Peak
Natural GasCombined Cycle
Natural GasCombustion Turbine
14
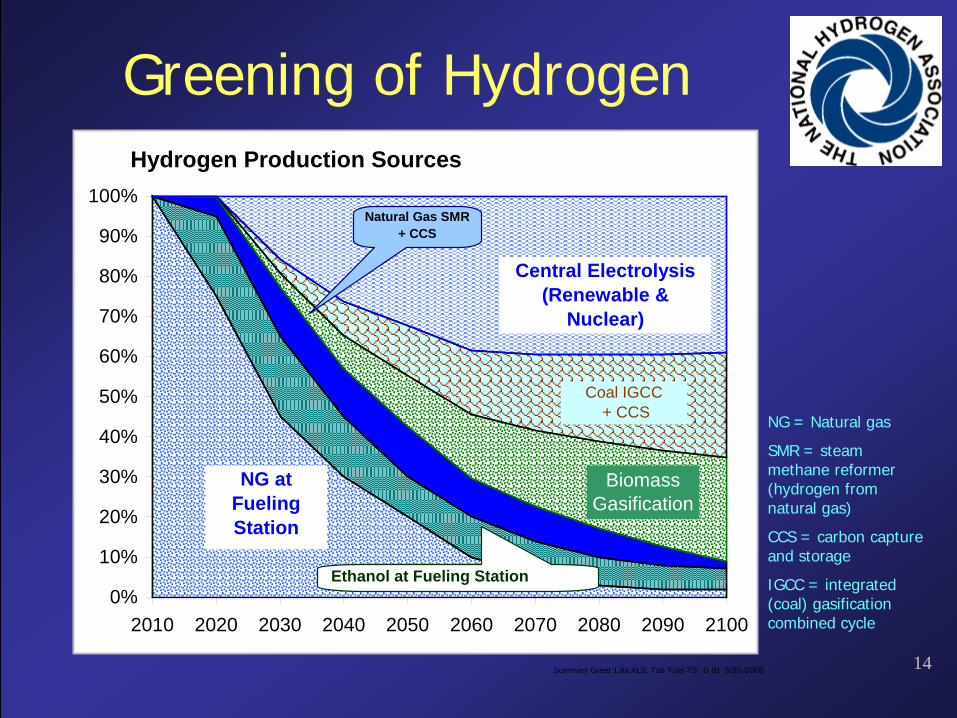
Greening of Hydrogen
NG = Natural gas
SMR = steam methane reformer (hydrogen from natural gas)
CCS = carbon capture and storage
IGCC = integrated (coal) gasification combined cycle
Summary Greet 1.8a.XLS; Tab 'Fuel TS'; G 81 5/30 /2008
Hydrogen Production Sources
0%
10%
20%
30%
40%
50%
60%
70%
80%
90%
100%
2010 2020 2030 2040 2050 2060 2070 2080 2090 2100
Central Electrolysis(Renewable &
Nuclear)
NG atFueling Station
Coal IGCC + CCS
Ethanol at Fueling Station
Natural Gas SMR + CCS
BiomassGasification
15
-
0.5
1.0
1.5
2.0
2.5
2000 2010 2020 2030 2040 2050 2060 2070 2080 2090 2100
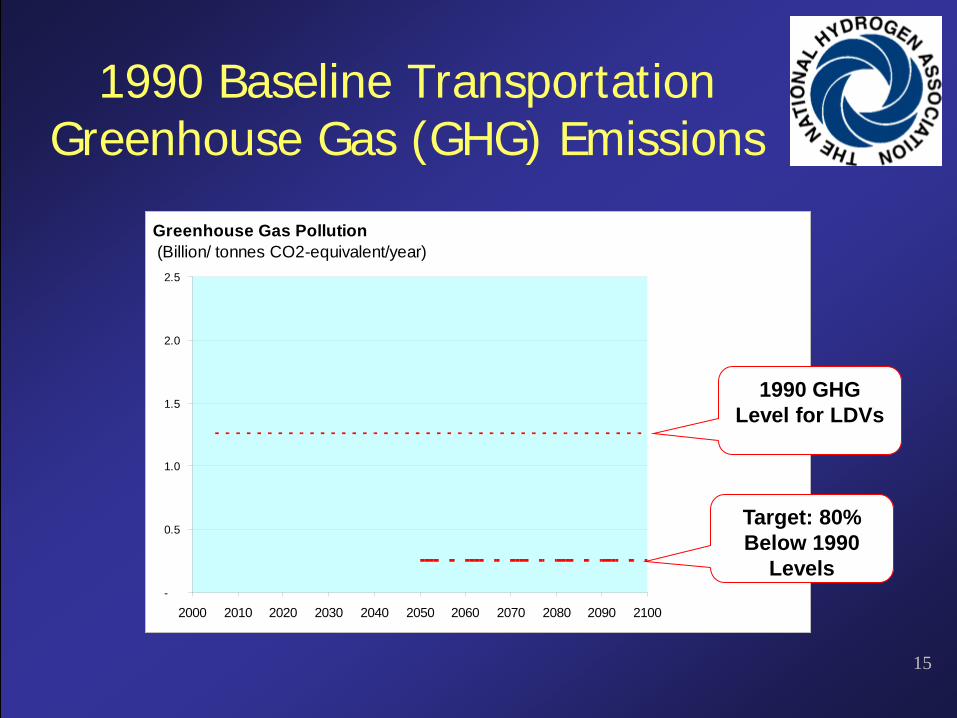
Greenhouse Gas Pollution (Billion/ tonnes CO2-equivalent/year)
1990 Baseline Transportation Greenhouse Gas (GHG) Emissions
Target: 80% Below 1990
Levels
1990 GHG Level for LDVs
16
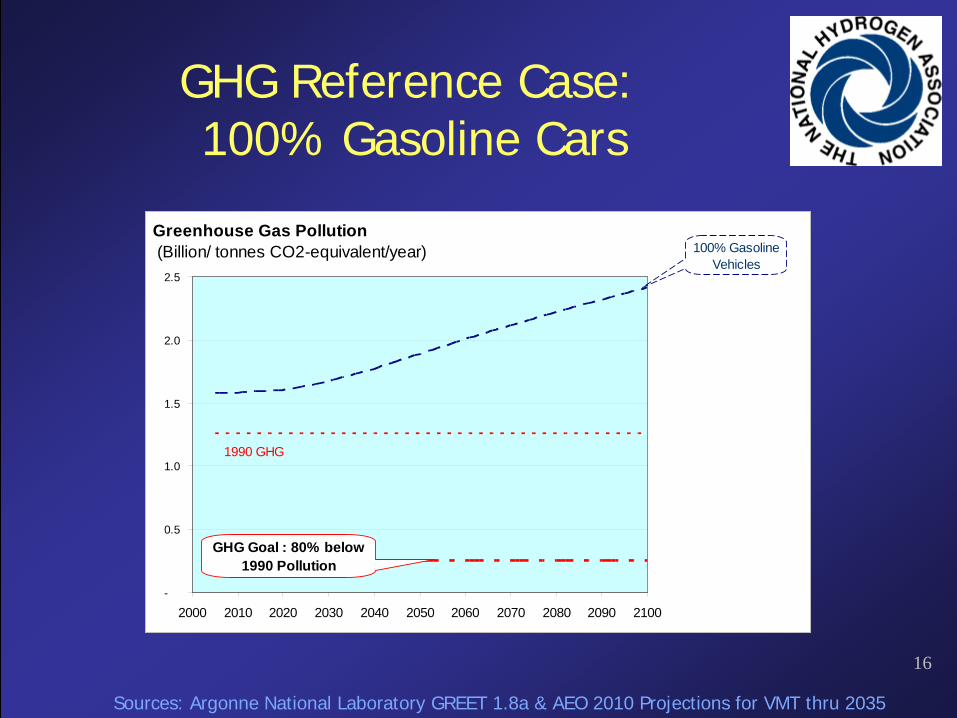
GHG Reference Case:100% Gasoline Cars
Sources: Argonne National Laboratory GREET 1.8a & AEO 2010 Projections for VMT thru 2035
-
0.5
1.0
1.5
2.0
2.5
2000 2010 2020 2030 2040 2050 2060 2070 2080 2090 2100
Greenhouse Gas Pollution (Billion/ tonnes CO2-equivalent/year)
1990 GHG
GHG Goal : 80% below 1990 Pollution
100% GasolineVehicles
17
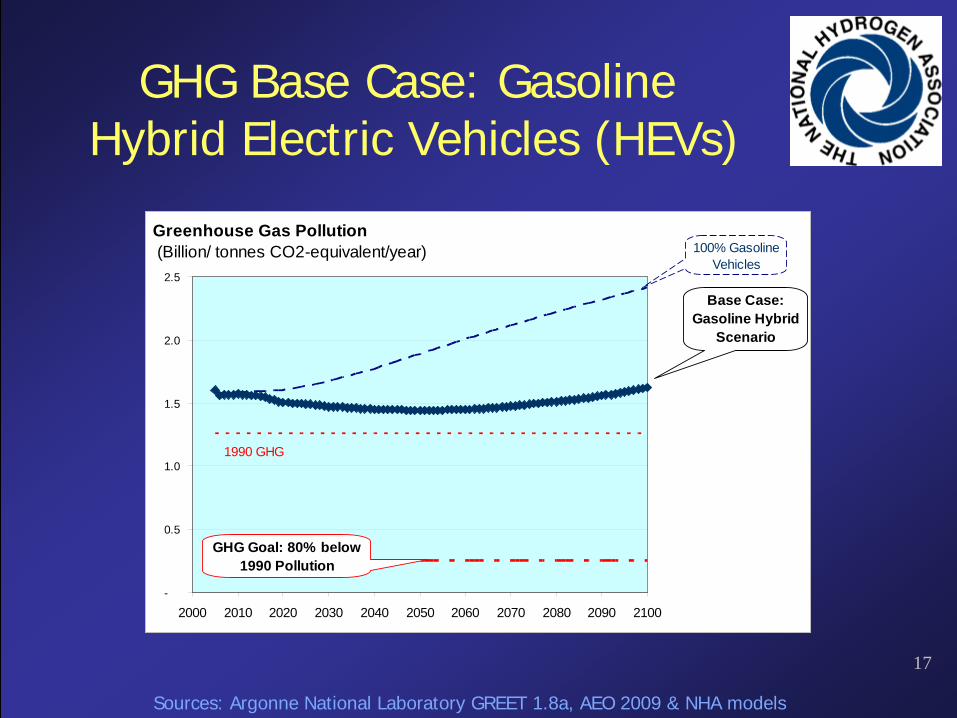
GHG Base Case: GasolineHybrid Electric Vehicles (HEVs)
Sources: Argonne National Laboratory GREET 1.8a, AEO 2009 & NHA models
-
0.5
1.0
1.5
2.0
2.5
2000 2010 2020 2030 2040 2050 2060 2070 2080 2090 2100
Greenhouse Gas Pollution (Billion/ tonnes CO2-equivalent/year)
1990 GHG
GHG Goal: 80% below 1990 Pollution
Base Case:Gasoline Hybrid
Scenario
100% GasolineVehicles
18
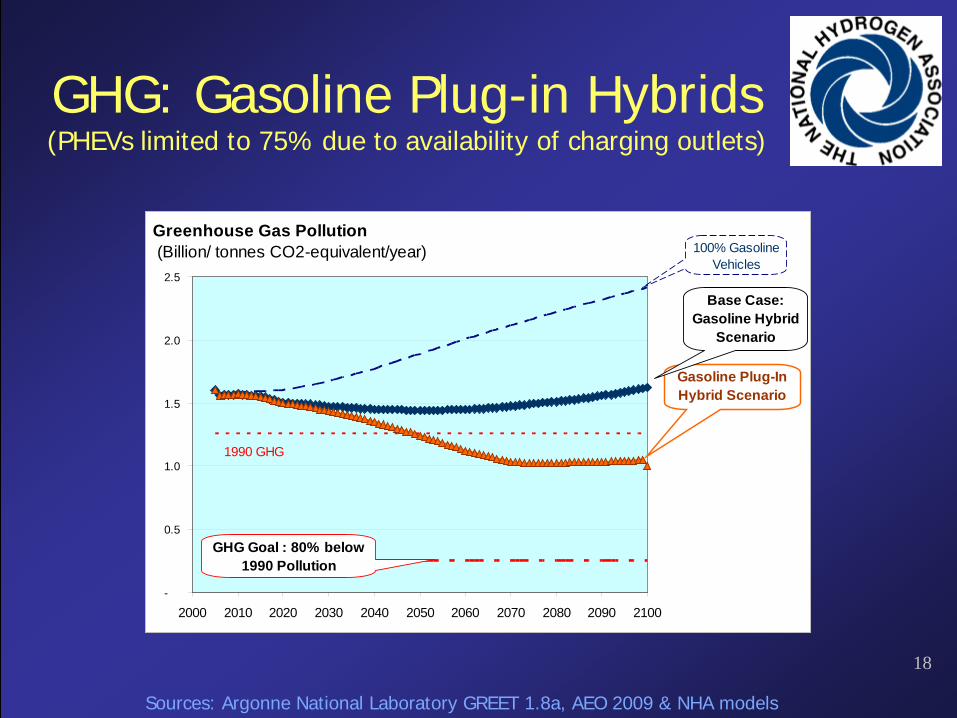
GHG: Gasoline Plug-in Hybrids(PHEVs limited to 75% due to availability of charging outlets)
Sources: Argonne National Laboratory GREET 1.8a, AEO 2009 & NHA models
-
0.5
1.0
1.5
2.0
2.5
2000 2010 2020 2030 2040 2050 2060 2070 2080 2090 2100
Greenhouse Gas Pollution (Billion/ tonnes CO2-equivalent/year)
1990 GHG
GHG Goal : 80% below 1990 Pollution
Gasoline Plug-In Hybrid Scenario
Base Case:Gasoline Hybrid
Scenario
100% GasolineVehicles
19
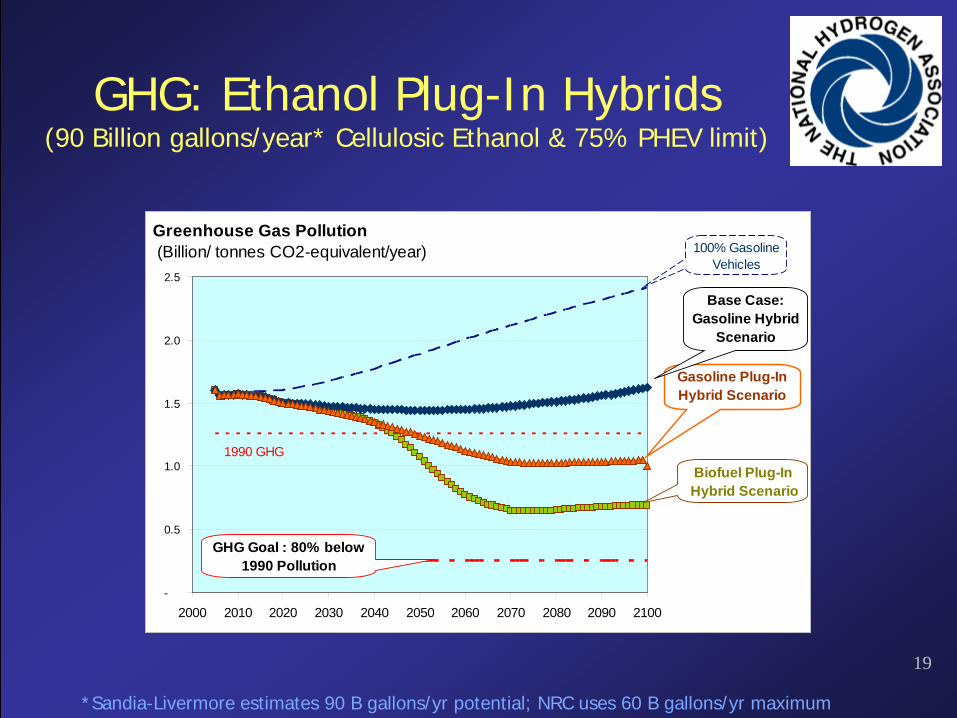
GHG: Ethanol Plug-In Hybrids(90 Billion gallons/year* Cellulosic Ethanol & 75% PHEV limit)
*Sandia-Livermore estimates 90 B gallons/yr potential; NRC uses 60 B gallons/yr maximum
-
0.5
1.0
1.5
2.0
2.5
2000 2010 2020 2030 2040 2050 2060 2070 2080 2090 2100
Greenhouse Gas Pollution (Billion/ tonnes CO2-equivalent/year)
1990 GHG
GHG Goal : 80% below 1990 Pollution
Biofuel Plug-In Hybrid Scenario
Gasoline Plug-In Hybrid Scenario
Base Case:Gasoline Hybrid
Scenario
100% GasolineVehicles
20
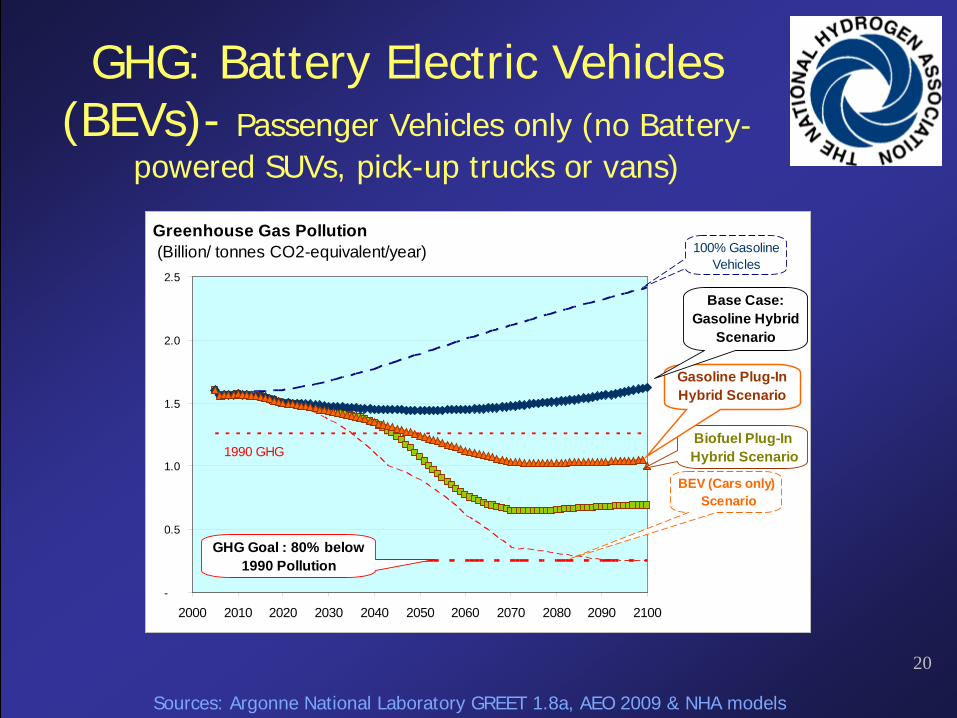
GHG: Battery Electric Vehicles(BEVs)- Passenger Vehicles only (no Battery-
powered SUVs, pick-up trucks or vans)
Sources: Argonne National Laboratory GREET 1.8a, AEO 2009 & NHA models
-
0.5
1.0
1.5
2.0
2.5
2000 2010 2020 2030 2040 2050 2060 2070 2080 2090 2100
Greenhouse Gas Pollution (Billion/ tonnes CO2-equivalent/year)
1990 GHG
GHG Goal : 80% below 1990 Pollution
Biofuel Plug-In Hybrid Scenario
Gasoline Plug-In Hybrid Scenario
Base Case:Gasoline Hybrid
Scenario
100% GasolineVehicles
BEV (Cars only) Scenario
21
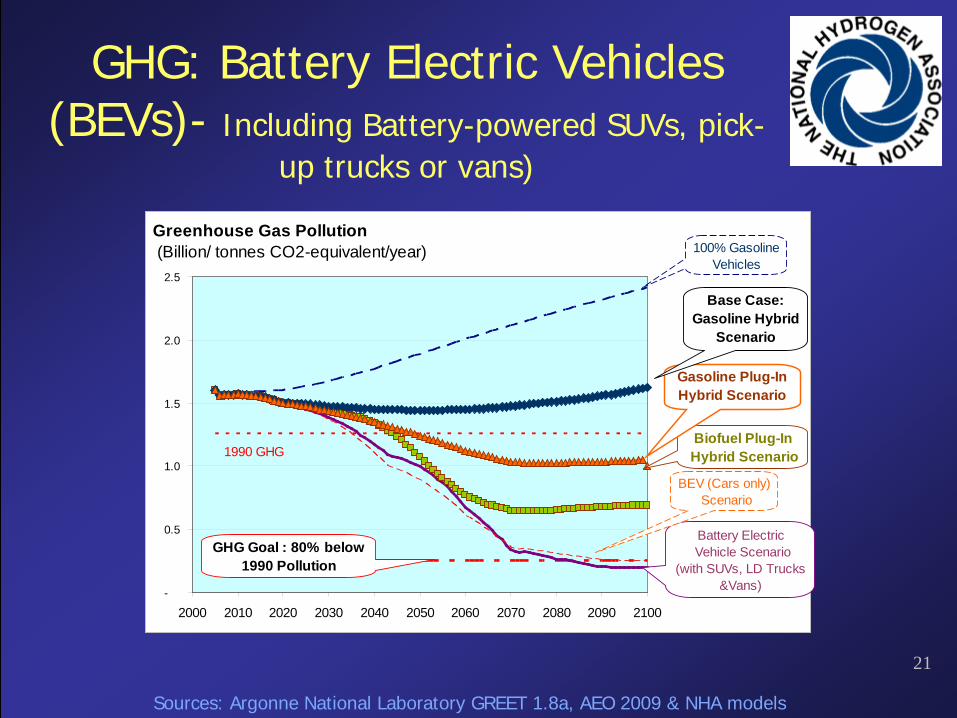
GHG: Battery Electric Vehicles(BEVs)- Including Battery-powered SUVs, pick-
up trucks or vans)
Sources: Argonne National Laboratory GREET 1.8a, AEO 2009 & NHA models
-
0.5
1.0
1.5
2.0
2.5
2000 2010 2020 2030 2040 2050 2060 2070 2080 2090 2100
Greenhouse Gas Pollution (Billion/ tonnes CO2-equivalent/year)
1990 GHG
GHG Goal : 80% below 1990 Pollution
Biofuel Plug-In Hybrid Scenario
Gasoline Plug-In Hybrid Scenario
Base Case:Gasoline Hybrid
Scenario
100% GasolineVehicles
Battery Electric Vehicle Scenario
(with SUVs, LD Trucks&Vans)
BEV (Cars only) Scenario
22
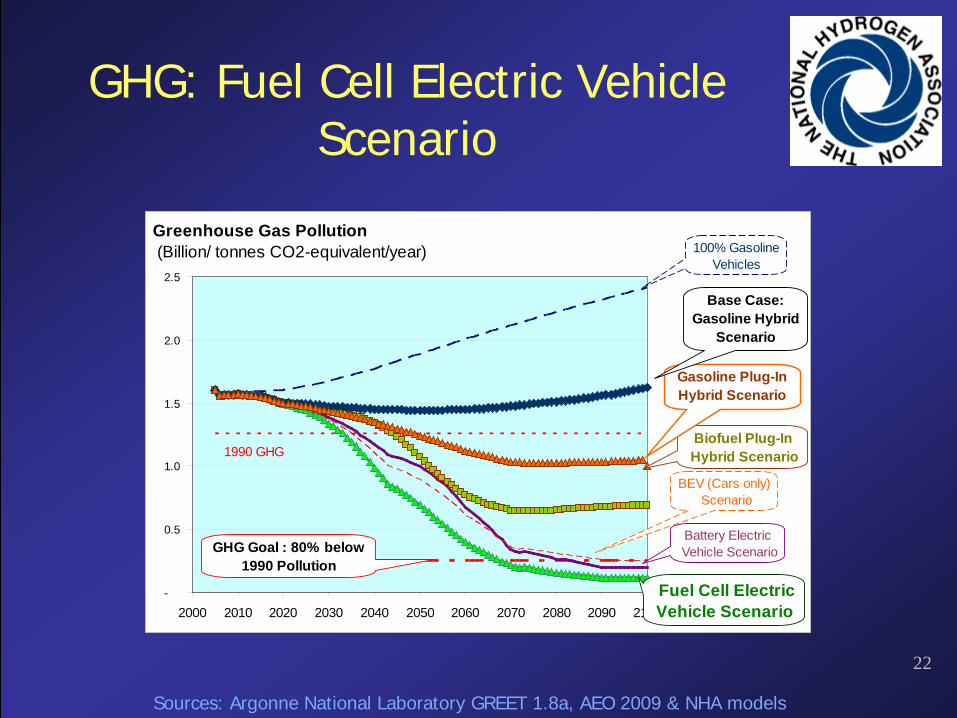
GHG: Fuel Cell Electric Vehicle Scenario
Sources: Argonne National Laboratory GREET 1.8a, AEO 2009 & NHA models
-
0.5
1.0
1.5
2.0
2.5
2000 2010 2020 2030 2040 2050 2060 2070 2080 2090 2100
Greenhouse Gas Pollution (Billion/ tonnes CO2-equivalent/year)
1990 GHG
GHG Goal : 80% below 1990 Pollution
Fuel Cell ElectricVehicle Scenario
Biofuel Plug-In Hybrid Scenario
Gasoline Plug-In Hybrid Scenario
Base Case:Gasoline Hybrid
Scenario
100% GasolineVehicles
Battery Electric Vehicle Scenario
BEV (Cars only) Scenario
23
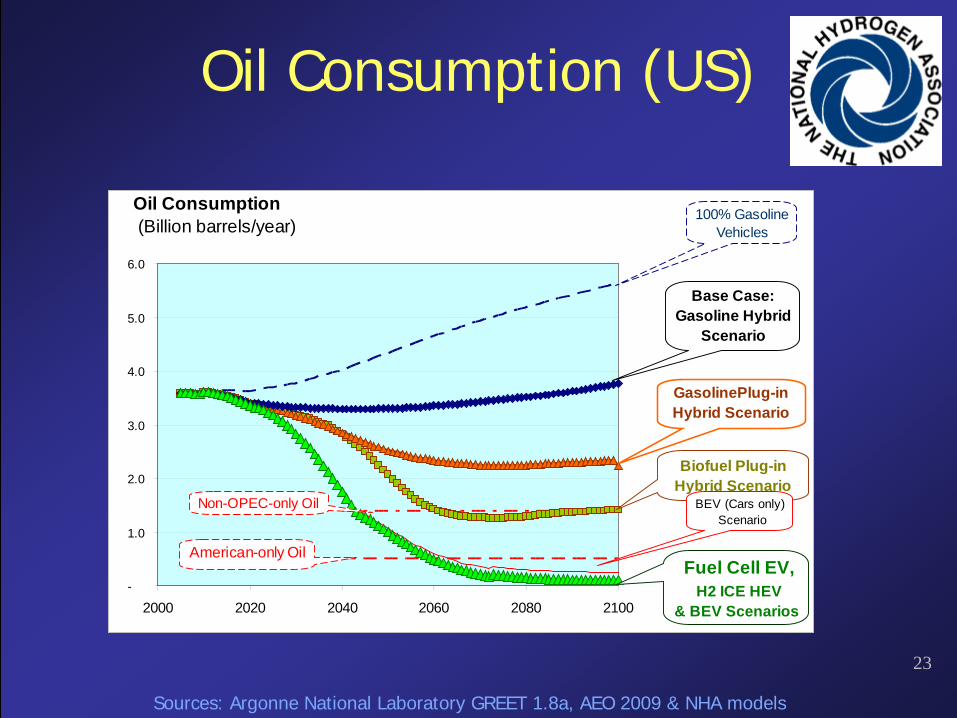
Oil Consumption (US)
Sources: Argonne National Laboratory GREET 1.8a, AEO 2009 & NHA models
-
1.0
2.0
3.0
4.0
5.0
6.0
2000 2020 2040 2060 2080 2100
Oil Consumption (Billion barrels/year)
Fuel Cell EV, H2 ICE HEV
& BEV Scenarios
GasolinePlug-in Hybrid Scenario
Biofuel Plug-in Hybrid Scenario
Base Case:Gasoline Hybrid
Scenario
100% GasolineVehicles
Non-OPEC-only Oil
American-only Oil
BEV (Cars only) Scenario
24
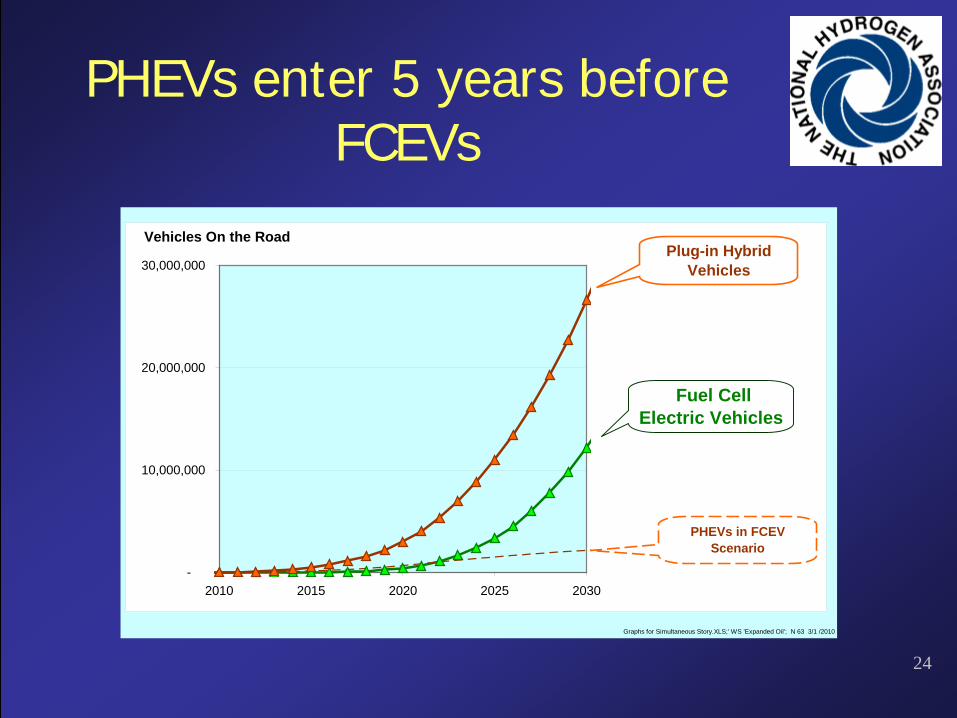
PHEVs enter 5 years before FCEVs
Graphs for Simultaneous Story.XLS;' WS 'Expanded Oil'; N 63 3/1 /2010
-
10,000,000
20,000,000
30,000,000
2010 2015 2020 2025 2030
Vehicles On the Road
Fuel Cell Electric Vehicles
Plug-in Hybrid Vehicles
PHEVs in FCEV Scenario
25
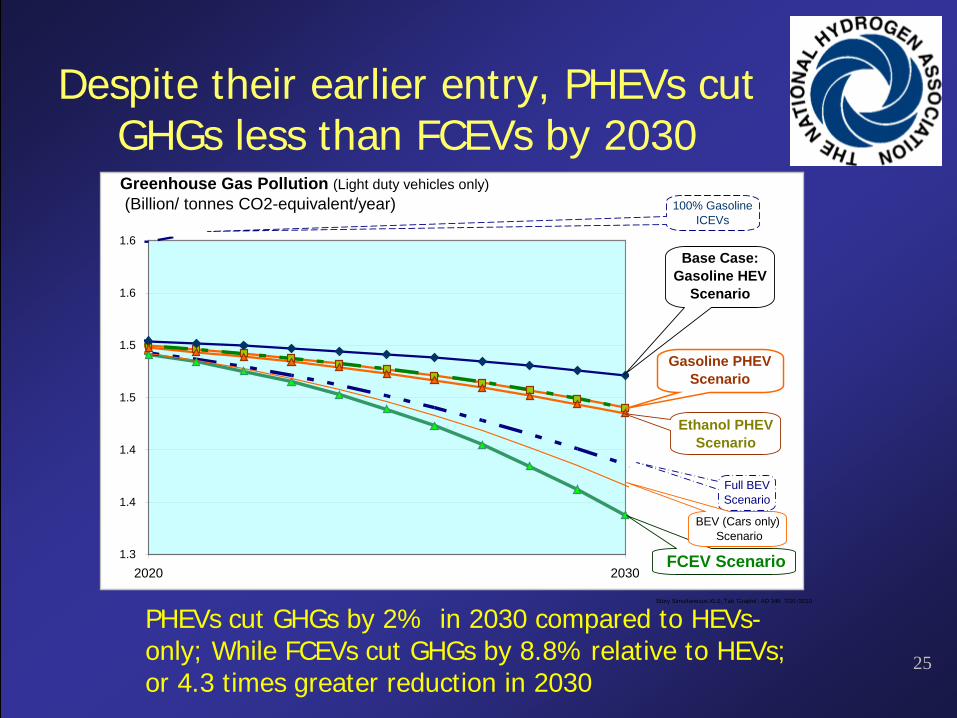
Despite their earlier entry, PHEVs cut GHGs less than FCEVs by 2030
PHEVs cut GHGs by 2% in 2030 compared to HEVs-only; While FCEVs cut GHGs by 8.8% relative to HEVs; or 4.3 times greater reduction in 2030
Story Simultaneous.XLS; Tab 'Graphs'; AD 346 7/20 /2010
1.3
1.4
1.4
1.5
1.5
1.6
1.6
2020 2030
100% GasolineICEVs
Greenhouse Gas Pollution (Light duty vehicles only) (Billion/ tonnes CO2-equivalent/year)
FCEV Scenario
Ethanol PHEVScenario
Base Case:Gasoline HEV
Scenario
Full BEVScenario
Gasoline PHEV Scenario
BEV (Cars only) Scenario
26
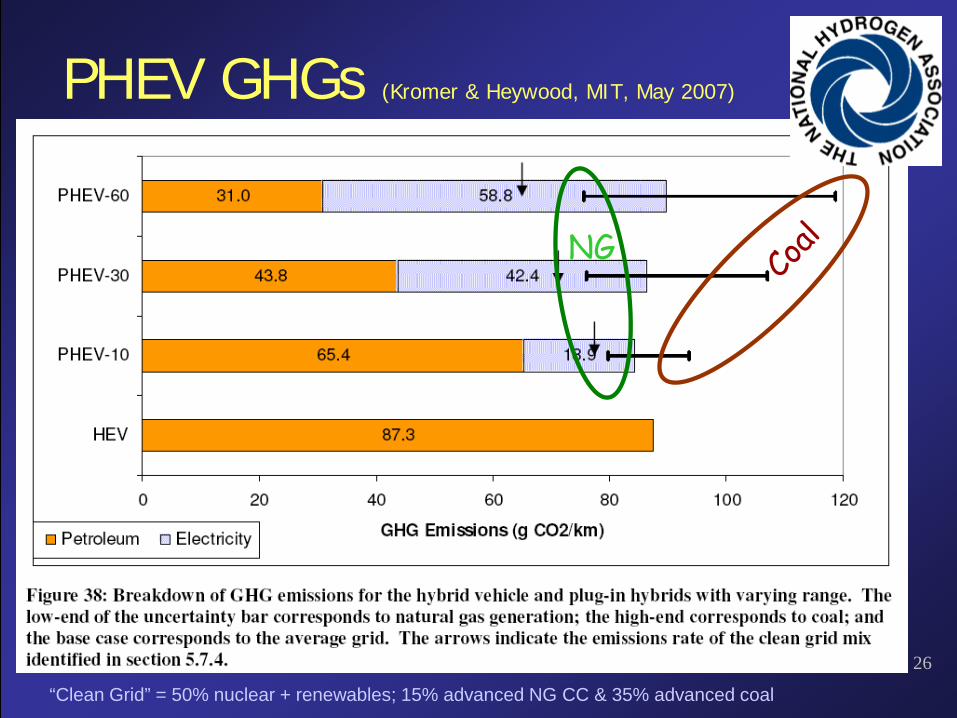
PHEV GHGs (Kromer & Heywood, MIT, May 2007)
NG
“Clean Grid” = 50% nuclear + renewables; 15% advanced NG CC & 35% advanced coal
27
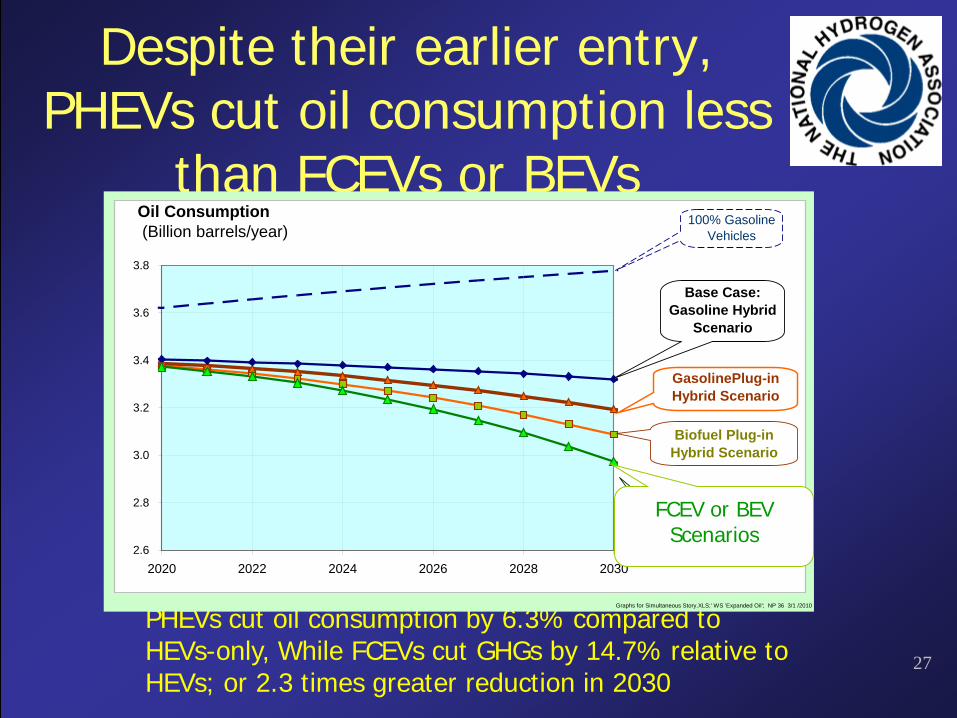
Despite their earlier entry, PHEVs cut oil consumption less
than FCEVs or BEVs
PHEVs cut oil consumption by 6.3% compared to HEVs-only, While FCEVs cut GHGs by 14.7% relative to HEVs; or 2.3 times greater reduction in 2030
Graphs for Simultaneous Story.XLS;' WS 'Expanded Oil'; NP 36 3/1 /2010
2.6
2.8
3.0
3.2
3.4
3.6
3.8
2020 2022 2024 2026 2028 2030
Oil Consumption (Billion barrels/year)
Fuel Cell Electric Vehicle
Scenario
GasolinePlug-in Hybrid Scenario
PHEVBiofuel Plug-in
Hybrid Scenario
Base Case:Gasoline Hybrid
Scenario
100% GasolineVehicles
FCEV or BEVScenarios
28
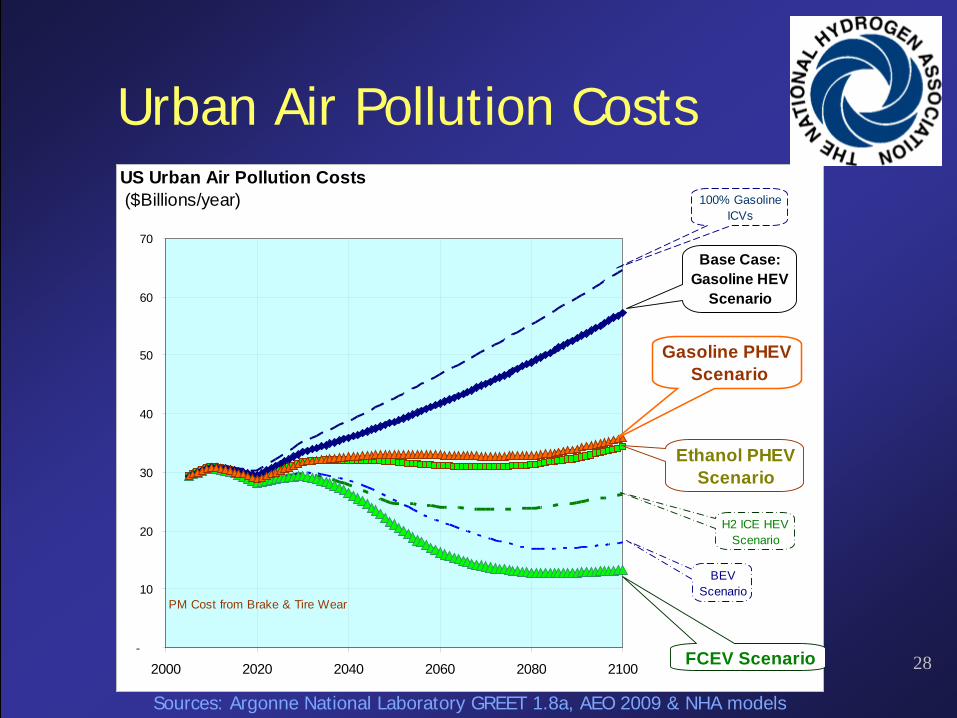
Urban Air Pollution Costs
-
10
20
30
40
50
60
70
2000 2020 2040 2060 2080 2100 FCEV Scenario
Ethanol PHEVScenario
Gasoline PHEV Scenario
Base Case:Gasoline HEV
Scenario
100% GasolineICVs
US Urban Air Pollution Costs ($Billions/year)
H2 ICE HEVScenario
BEVScenario
PM Cost from Brake & Tire Wear
Sources: Argonne National Laboratory GREET 1.8a, AEO 2009 & NHA models
29
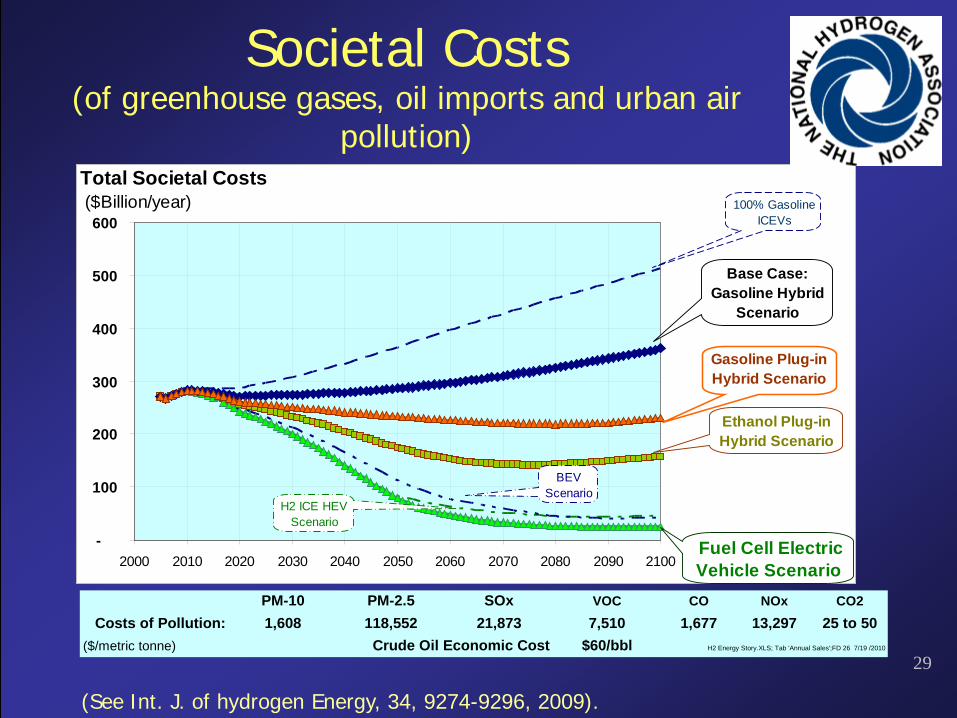
Societal Costs(of greenhouse gases, oil imports and urban air
pollution)
-
100
200
300
400
500
600
2000 2010 2020 2030 2040 2050 2060 2070 2080 2090 2100
Total Societal Costs ($Billion/year)
Fuel Cell ElectricVehicle Scenario
Ethanol Plug-in Hybrid Scenario
Gasoline Plug-in Hybrid Scenario
PHEV
Base Case:Gasoline Hybrid
Scenario
100% GasolineICEVs
H2 ICE HEVScenario
BEVScenario
PM-10 PM-2.5 SOx VOC CO NOx CO2 Costs of Pollution: 1,608 118,552 21,873 7,510 1,677 13,297 25 to 50
($/metric tonne) Crude Oil Economic Cost $60/bbl H2 Energy Story.XLS; Tab 'Annual Sales';FD 26 7/19 /2010
(See Int. J. of hydrogen Energy, 34, 9274-9296, 2009).
30
Summary Greet 1.8a.XLS; Tab 'Summary'; AG 200 3/14 /2009
-
2
4
6
8
10
12
14
16
18
20
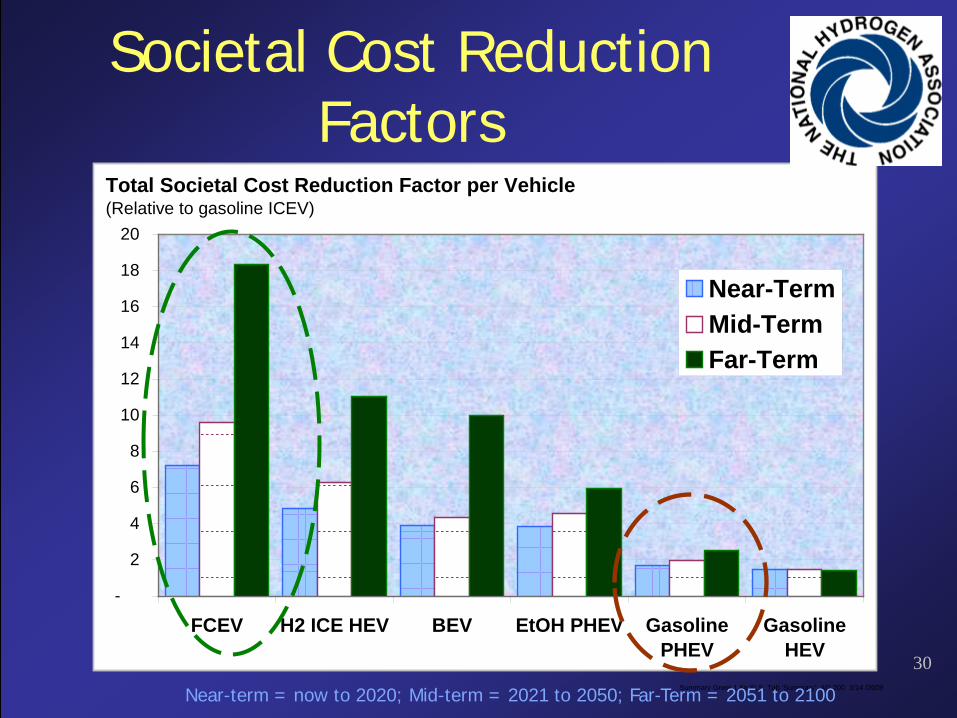
FCEV H2 ICE HEV BEV EtOH PHEV GasolinePHEV
GasolineHEV
Near-TermMid-TermFar-Term
Total Societal Cost Reduction Factor per Vehicle (Relative to gasoline ICEV)
Societal Cost Reduction Factors
Near-term = now to 2020; Mid-term = 2021 to 2050; Far-Term = 2051 to 2100
31
Primary Conclusion
• Achieving GHG and Oil reduction targets will require all-electric vehicles
• Three choices:– Battery EVs– Fuel Cell EVs
• Next slides will compare:– Weight– Volume– Greenhouse Gases– Cost
Batteries AND Fuel Cells
32
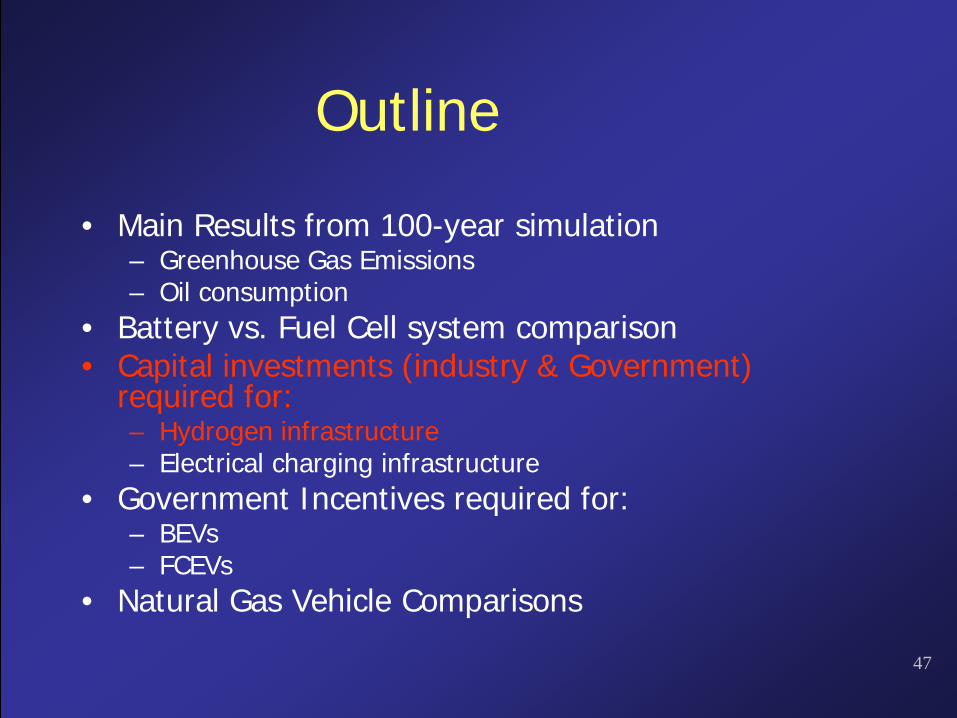
Outline
• Main Results from 100-year simulation– Greenhouse Gas Emissions– Oil consumption
• Battery vs. Fuel Cell system comparison• Capital investments (industry & Government)
required for:– Hydrogen infrastructure– Electrical charging infrastructure
• Government Incentives required for:– BEVs– FCEVs
• Natural Gas Vehicle Comparisons
33
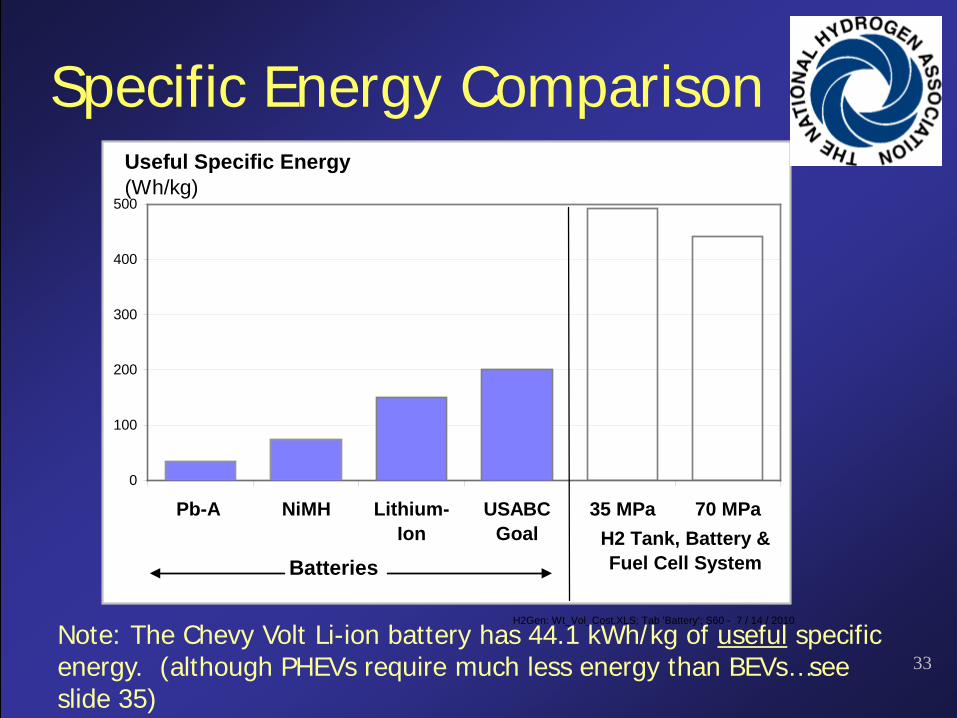
Specific Energy Comparison
H2Gen: Wt_Vol_Cost.XLS; Tab 'Battery'; S60 - 7 / 14 / 2010
0
100
200
300
400
500
Pb-A NiMH Lithium-Ion
USABCGoal
35 MPa 70 MPa
Useful Specific Energy(Wh/kg)
H2 Tank, Battery &Fuel Cell SystemBatteries
Note: The Chevy Volt Li-ion battery has 44.1 kWh/kg of useful specific energy. (although PHEVs require much less energy than BEVs…see slide 35)
34
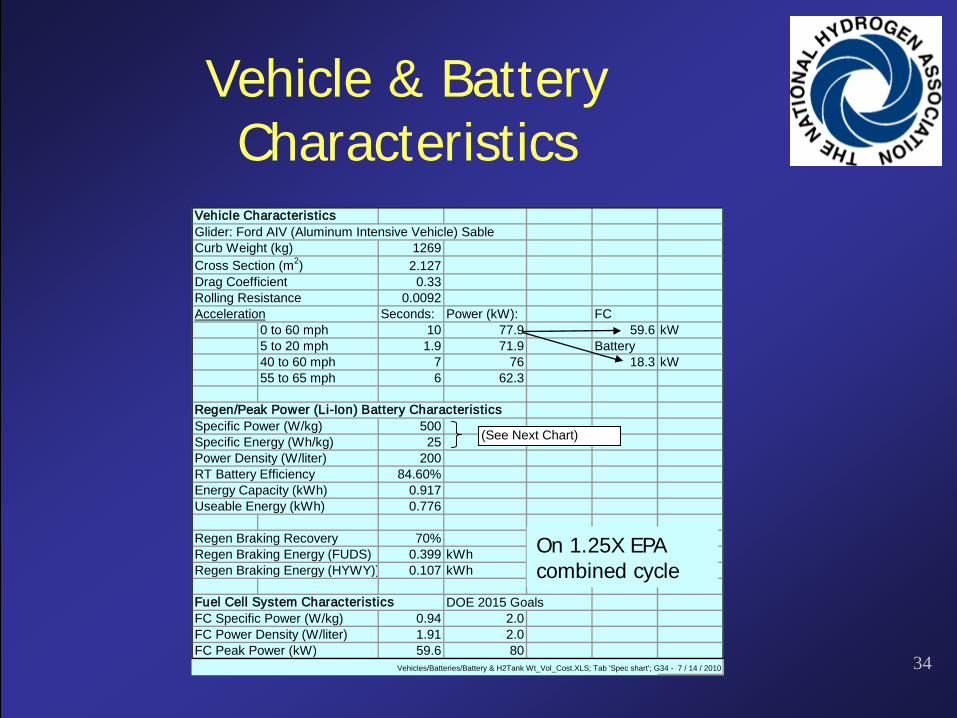
Vehicle CharacteristicsGlider: Ford AIV (Aluminum Intensive Vehicle) SableCurb Weight (kg) 1269Cross Section (m2) 2.127Drag Coefficient 0.33Rolling Resistance 0.0092Acceleration Seconds: Power (kW): FC
0 to 60 mph 10 77.9 59.6 kW5 to 20 mph 1.9 71.9 Battery40 to 60 mph 7 76 18.3 kW55 to 65 mph 6 62.3
Regen/Peak Power (Li-Ion) Battery CharacteristicsSpecific Power (W/kg) 500Specific Energy (Wh/kg) 25Power Density (W/liter) 200RT Battery Efficiency 84.60%Energy Capacity (kWh) 0.917Useable Energy (kWh) 0.776
Regen Braking Recovery 70%Regen Braking Energy (FUDS) 0.399 kWhRegen Braking Energy (HYWY)) 0.107 kWh
Fuel Cell System Characteristics DOE 2015 GoalsFC Specific Power (W/kg) 0.94 2.0FC Power Density (W/liter) 1.91 2.0FC Peak Power (kW) 59.6 80
Vehicles/Batteries/Battery & H2Tank Wt_Vol_Cost.XLS; Tab 'Spec shart'; G34 - 7 / 14 / 2010
(See Next Chart)
Vehicle & Battery Characteristics
On 1.25X EPA combined cycle
35
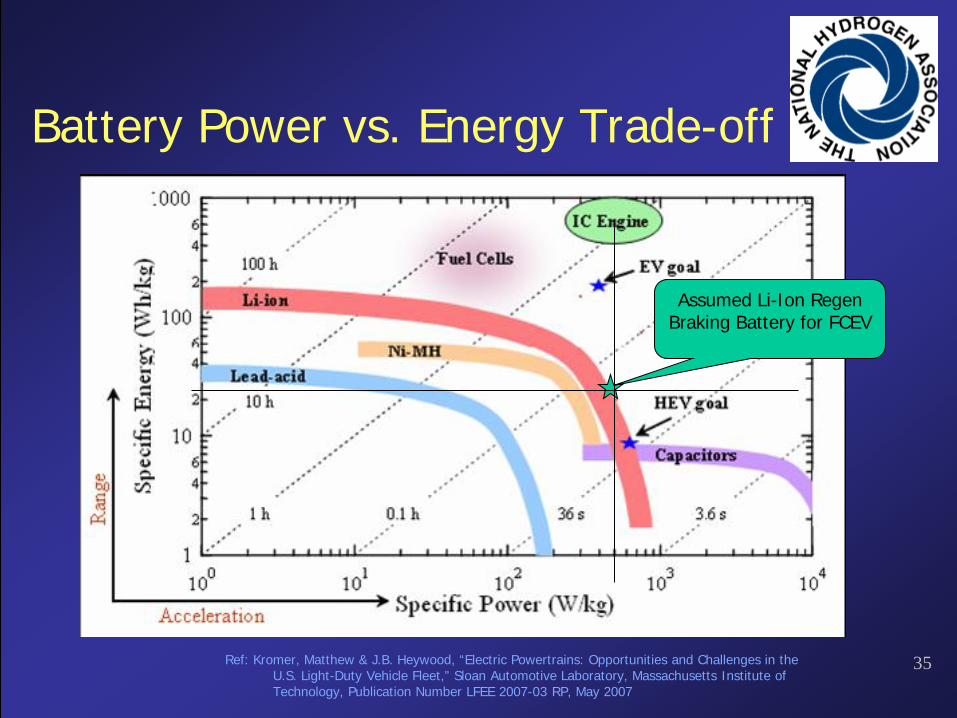
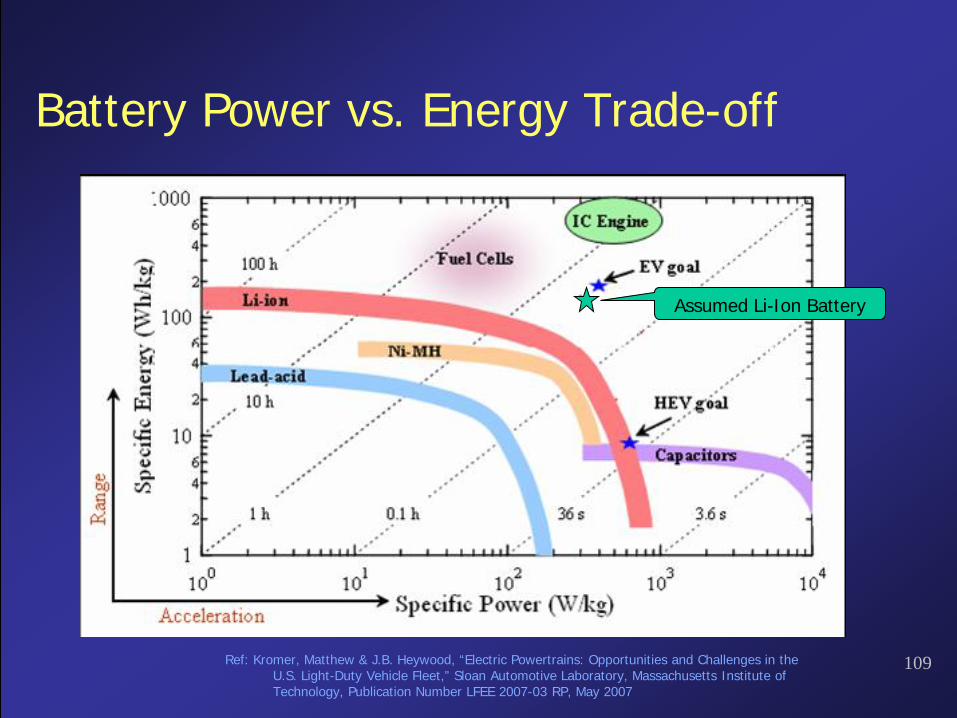
Battery Power vs. Energy Trade-off
Ref: Kromer, Matthew & J.B. Heywood, “Electric Powertrains: Opportunities and Challenges in the U.S. Light-Duty Vehicle Fleet,” Sloan Automotive Laboratory, Massachusetts Institute of Technology, Publication Number LFEE 2007-03 RP, May 2007
Assumed Li-Ion Regen Braking Battery for FCEV
36
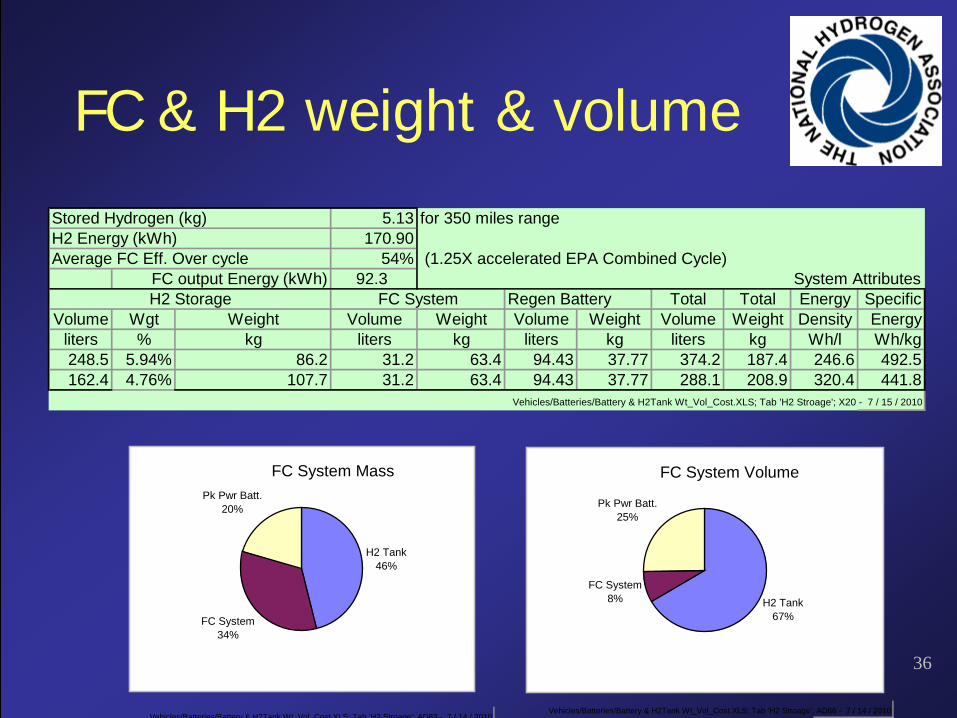
FC & H2 weight & volume
Vehicles/Batteries/Battery & H2Tank Wt_Vol_Cost.XLS; Tab 'H2 Stroage'; AD66 - 7 / 14 / 2010
H2 Tank67%
FC System8%
Pk Pwr Batt.25%
FC System Volume
Vehicles/Batteries/Battery & H2Tank Wt Vol Cost XLS; Tab 'H2 Stroage'; AD83 - 7 / 14 / 2010
H2 Tank46%
FC System34%
Pk Pwr Batt.20%
FC System Mass
Stored Hydrogen (kg) 5.13 for 350 miles rangeH2 Energy (kWh) 170.90Average FC Eff. Over cycle 54% (1.25X accelerated EPA Combined Cycle)
FC output Energy (kWh) 92.3 System AttributesRegen Battery Total Total Energy Specific
Volume Wgt Weight Volume Weight Volume Weight Volume Weight Density Energyliters % kg liters kg liters kg liters kg Wh/l Wh/kg248.5 5.94% 86.2 31.2 63.4 94.43 37.77 374.2 187.4 246.6 492.5162.4 4.76% 107.7 31.2 63.4 94.43 37.77 288.1 208.9 320.4 441.8
Vehicles/Batteries/Battery & H2Tank Wt_Vol_Cost.XLS; Tab 'H2 Stroage'; X20 - 7 / 15 / 2010
FC SystemH2 Storage
37
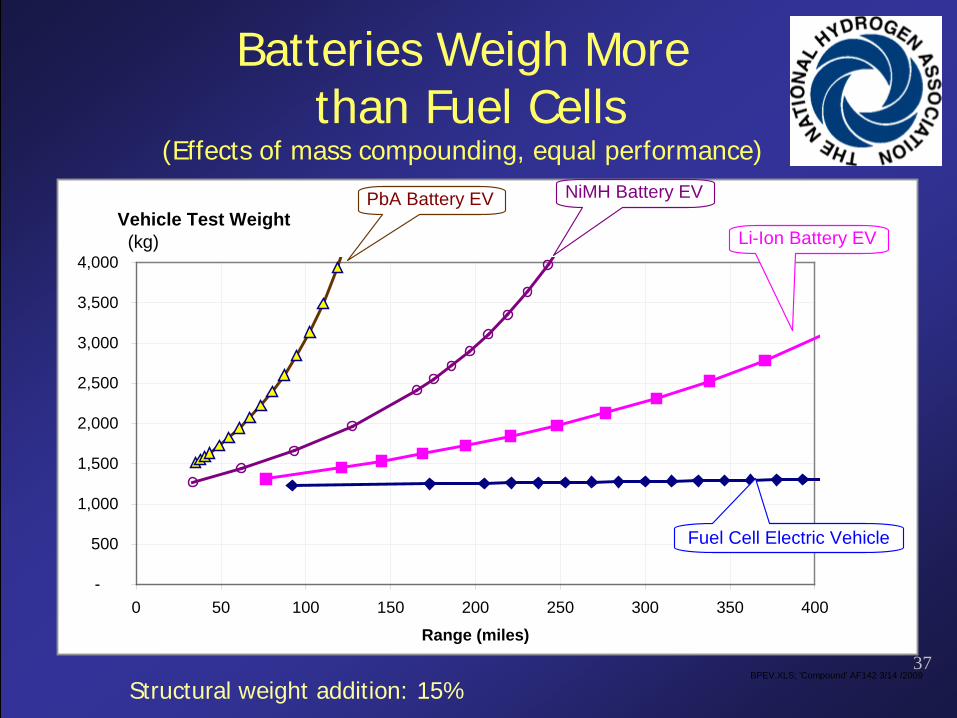
Batteries Weigh Morethan Fuel Cells
(Effects of mass compounding, equal performance)
BPEV.XLS; 'Compound' AF142 3/14 /2009
-
500
1,000
1,500
2,000
2,500
3,000
3,500
4,000
0 50 100 150 200 250 300 350 400
Range (miles)
Vehicle Test Weight (kg)
PbA Battery EV
Li-Ion Battery EV
NiMH Battery EV
Fuel Cell Electric Vehicle
Structural weight addition: 15%
38
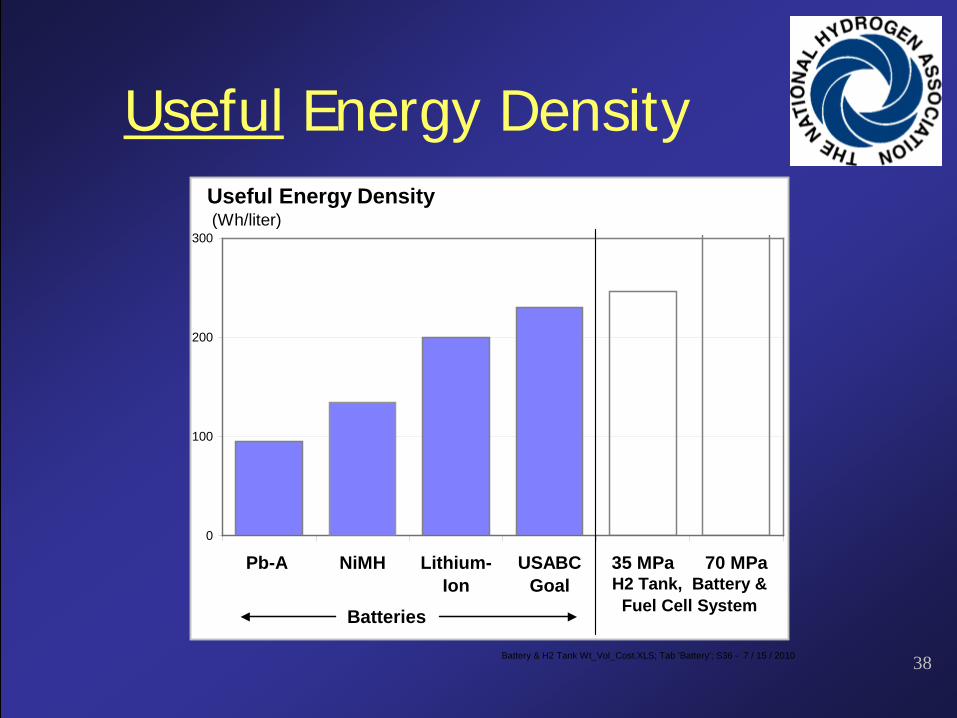
Useful Energy Density
Battery & H2 Tank Wt_Vol_Cost.XLS; Tab 'Battery'; S36 - 7 / 15 / 2010
0
100
200
300
Pb-A NiMH Lithium-Ion
USABCGoal
35 MPa 70 MPa
Useful Energy Density (Wh/liter)
H2 Tank, Battery & Fuel Cell SystemBatteries
39
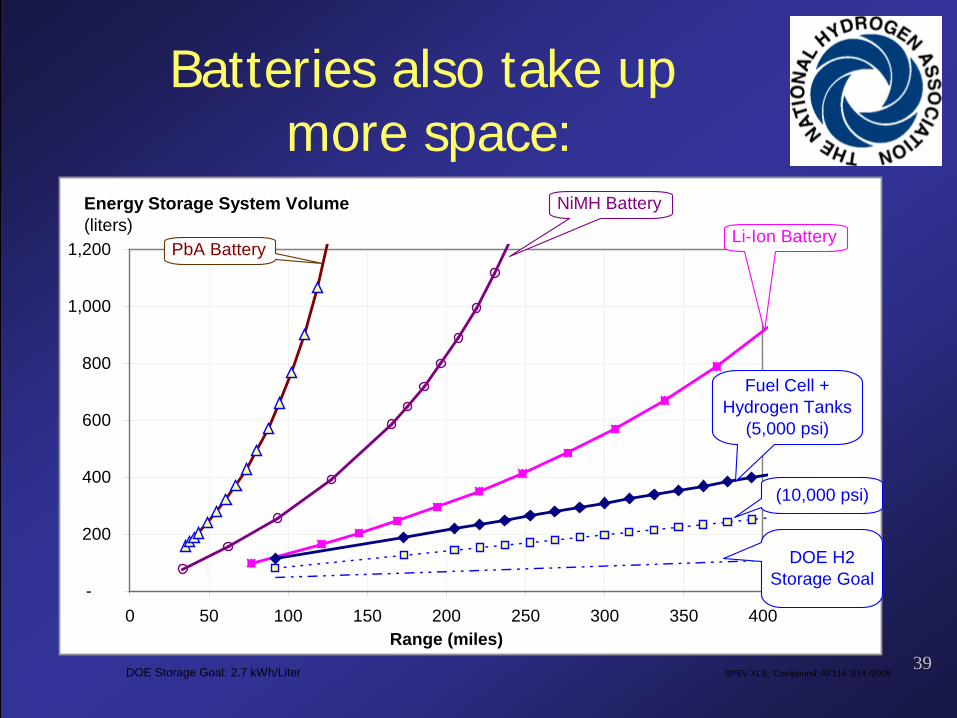
Batteries also take upmore space:
DOE Storage Goal: 2.7 kWh/Liter BPEV.XLS; 'Compound' AF114 3/14 /2009
-
200
400
600
800
1,000
1,200
0 50 100 150 200 250 300 350 400Range (miles)
Energy Storage System Volume(liters)
PbA Battery
NiMH Battery
Li-Ion Battery
Fuel Cell +Hydrogen Tanks
(5,000 psi)
(10,000 psi)
DOE H2 Storage Goal
40H2Gen: BPEV.XLS; WS 'Compound' AF169 3/14 /2009
-
200
400
600
800
1,000
0 50 100 150 200 250 300 350 400
Range (miles)
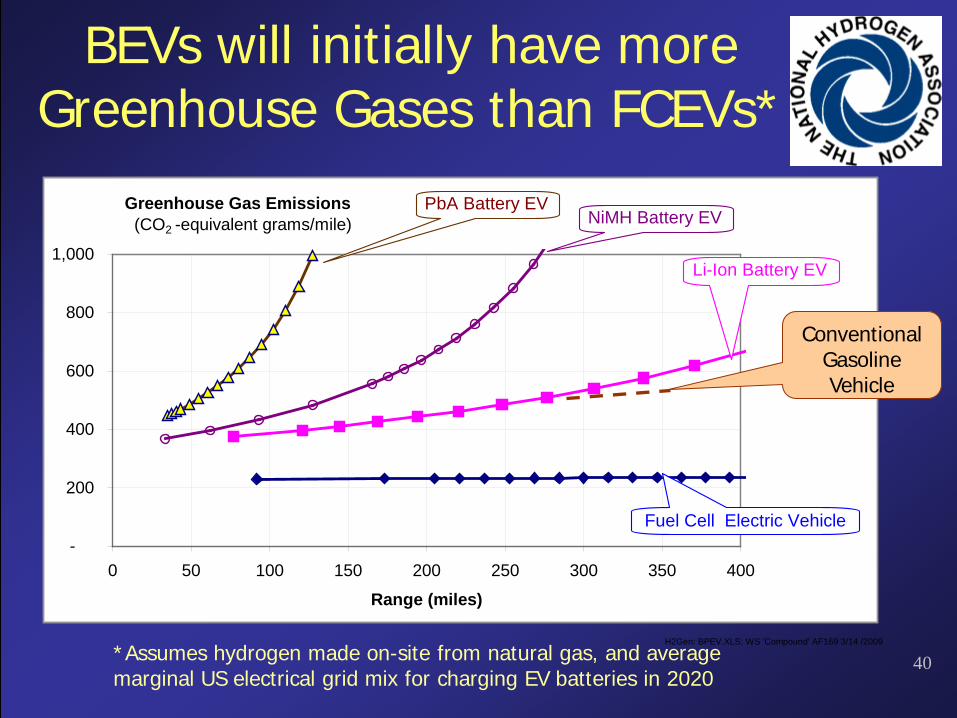
Greenhouse Gas Emissions (CO2 -equivalent grams/mile)
PbA Battery EV
Li-Ion Battery EV
NiMH Battery EV
Fuel Cell Electric Vehicle
BEVs will initially have more Greenhouse Gases than FCEVs*
*Assumes hydrogen made on-site from natural gas, and average marginal US electrical grid mix for charging EV batteries in 2020
Conventional Gasoline Vehicle
41Ref: Kromer & Heywood, "Electric Powertrains: Opportunities & Challenges in the U.S. Light-Duty Vehicle Fleet Report # LFEE 2007-03RP, MIT, May, 2007, Table 53 Story Simultaneous.XLS; Tab 'AFV Cost'; N 26 3/15 /2009
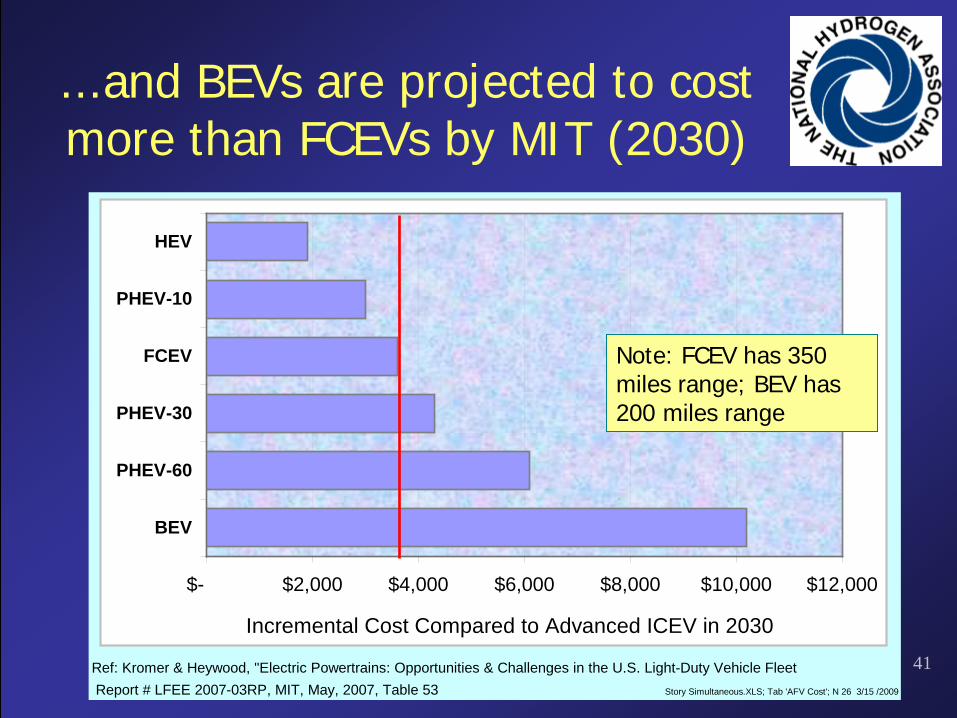
$- $2,000 $4,000 $6,000 $8,000 $10,000 $12,000
BEV
PHEV-60
PHEV-30
FCEV
PHEV-10
HEV
Incremental Cost Compared to Advanced ICEV in 2030
...and BEVs are projected to cost more than FCEVs by MIT (2030)
Note: FCEV has 350 miles range; BEV has 200 miles range
42
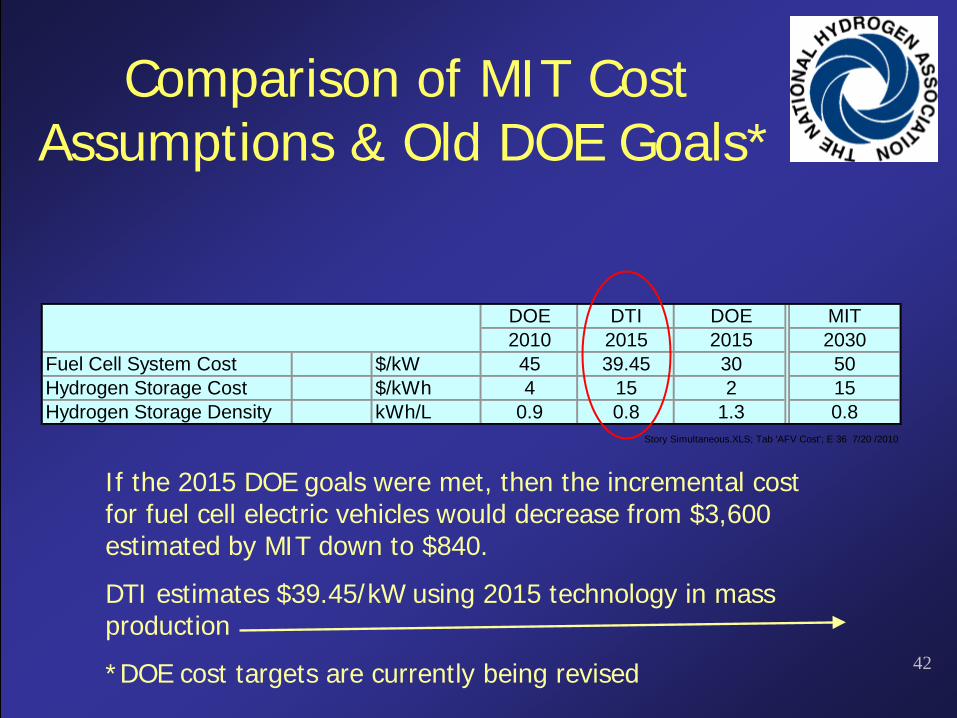
Comparison of MIT Cost Assumptions & Old DOE Goals*
If the 2015 DOE goals were met, then the incremental cost for fuel cell electric vehicles would decrease from $3,600 estimated by MIT down to $840.
DTI estimates $39.45/kW using 2015 technology in mass production
*DOE cost targets are currently being revised
DOE DTI DOE MIT2010 2015 2015 2030
Fuel Cell System Cost $/kW 45 39.45 30 50Hydrogen Storage Cost $/kWh 4 15 2 15Hydrogen Storage Density kWh/L 0.9 0.8 1.3 0.8
Story Simultaneous.XLS; Tab 'AFV Cost'; E 36 7/20 /2010
43
Ref: Kromer & Heywood, "Electric Powertrains: Opportunities & Challenges in the U.S. Light-Duty Vehicle Fleet Report # LFEE 2007-03RP, MIT, May, 2007, Table 53
Story Economics.XLS; Tab 'Vehicle Cost Deltas'; M 81 7/20 /2010
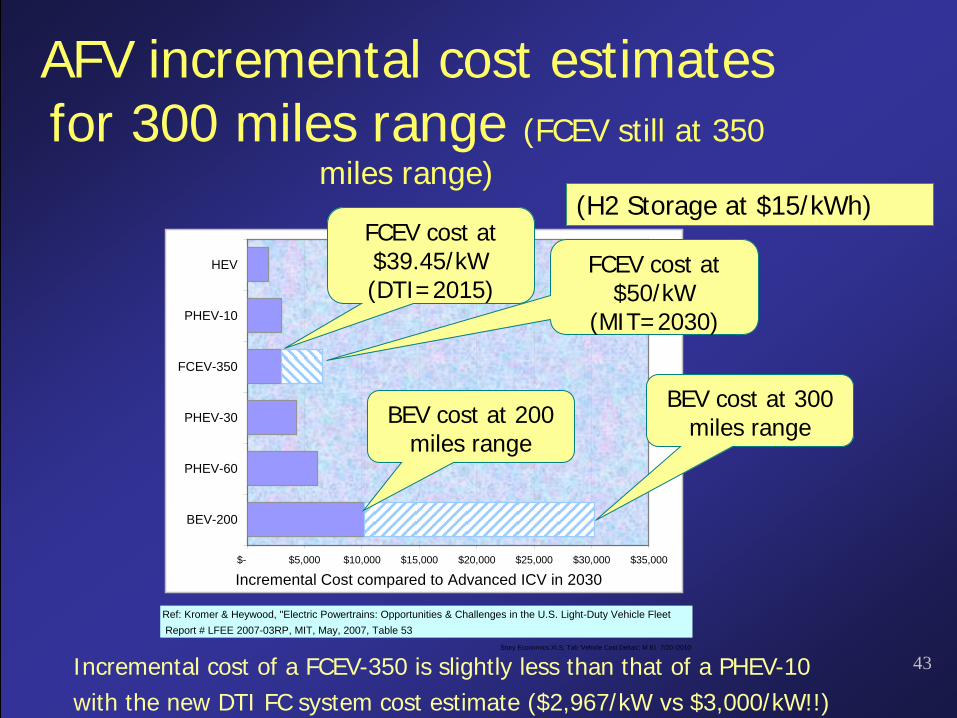
$- $5,000 $10,000 $15,000 $20,000 $25,000 $30,000 $35,000
BEV-200
PHEV-60
PHEV-30
FCEV-350
PHEV-10
HEV
Incremental Cost compared to Advanced ICV in 2030
AFV incremental cost estimates for 300 miles range (FCEV still at 350
miles range)
BEV cost at 200 miles range
BEV cost at 300 miles range
FCEV cost at $50/kW
(MIT=2030)
FCEV cost at $39.45/kW (DTI=2015)
(H2 Storage at $15/kWh)
Incremental cost of a FCEV-350 is slightly less than that of a PHEV-10 with the new DTI FC system cost estimate ($2,967/kW vs $3,000/kW!!)
44
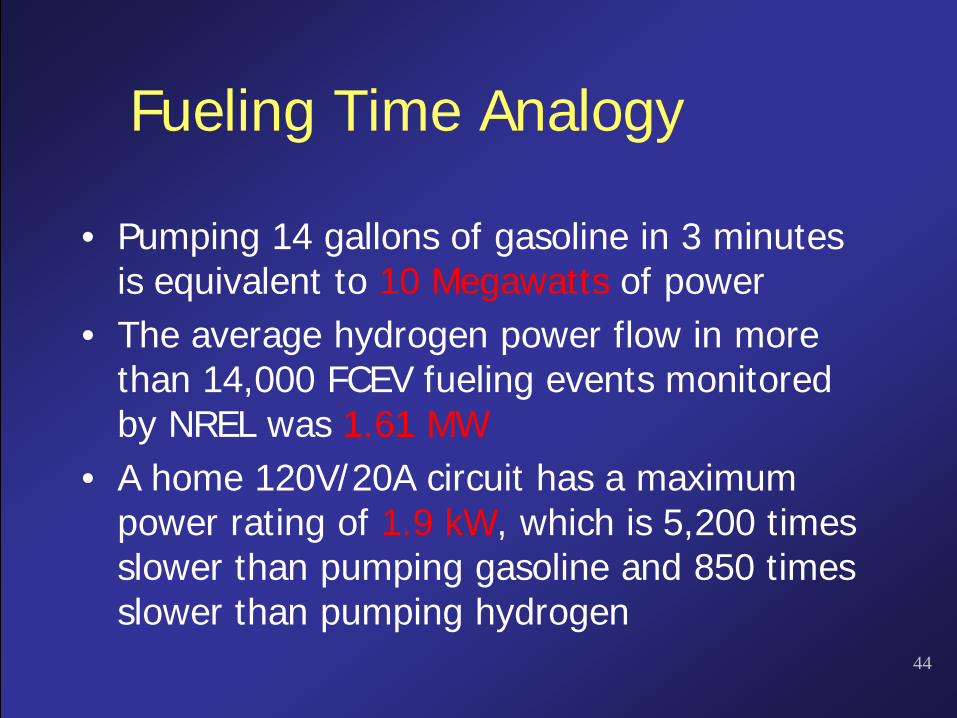
Fueling Time Analogy
• Pumping 14 gallons of gasoline in 3 minutes is equivalent to 10 Megawatts of power
• The average hydrogen power flow in more than 14,000 FCEV fueling events monitored by NREL was 1.61 MW
• A home 120V/20A circuit has a maximum power rating of 1.9 kW, which is 5,200 times slower than pumping gasoline and 850 times slower than pumping hydrogen
45
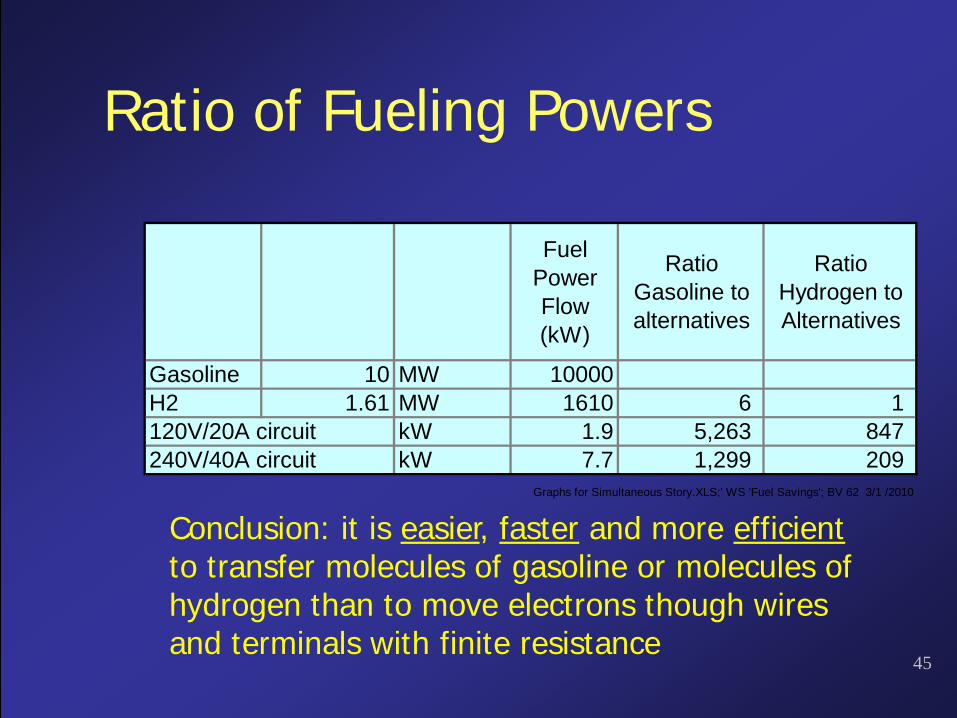
Ratio of Fueling Powers
Conclusion: it is easier, faster and more efficientto transfer molecules of gasoline or molecules of hydrogen than to move electrons though wires and terminals with finite resistance
Fuel Power Flow (kW)
Ratio Gasoline to alternatives
Ratio Hydrogen to Alternatives
Gasoline 10 MW 10000H2 1.61 MW 1610 6 1 120V/20A circuit kW 1.9 5,263 847 240V/40A circuit kW 7.7 1,299 209
Graphs for Simultaneous Story.XLS;' WS 'Fuel Savings'; BV 62 3/1 /2010
46
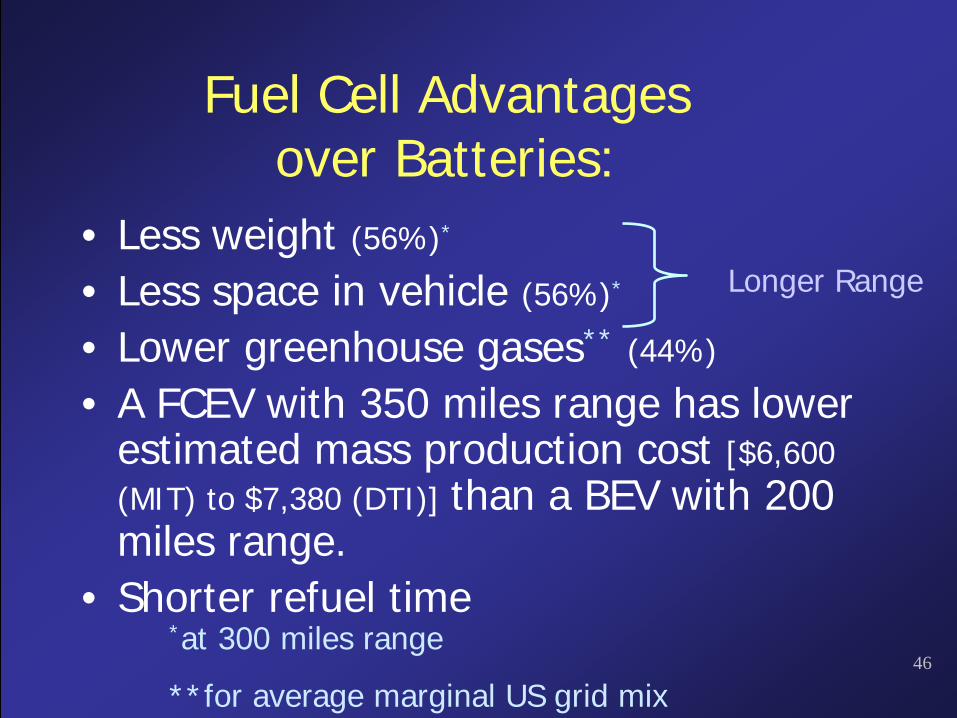
Fuel Cell Advantagesover Batteries:
• Less weight (56%)*
• Less space in vehicle (56%)*
• Lower greenhouse gases** (44%)
• A FCEV with 350 miles range has lower estimated mass production cost [$6,600 (MIT) to $7,380 (DTI)] than a BEV with 200 miles range.
• Shorter refuel time
Longer Range
*at 300 miles range
**for average marginal US grid mix
47
Outline
• Main Results from 100-year simulation– Greenhouse Gas Emissions– Oil consumption
• Battery vs. Fuel Cell system comparison• Capital investments (industry & Government)
required for:– Hydrogen infrastructure– Electrical charging infrastructure
• Government Incentives required for:– BEVs– FCEVs
• Natural Gas Vehicle Comparisons
48
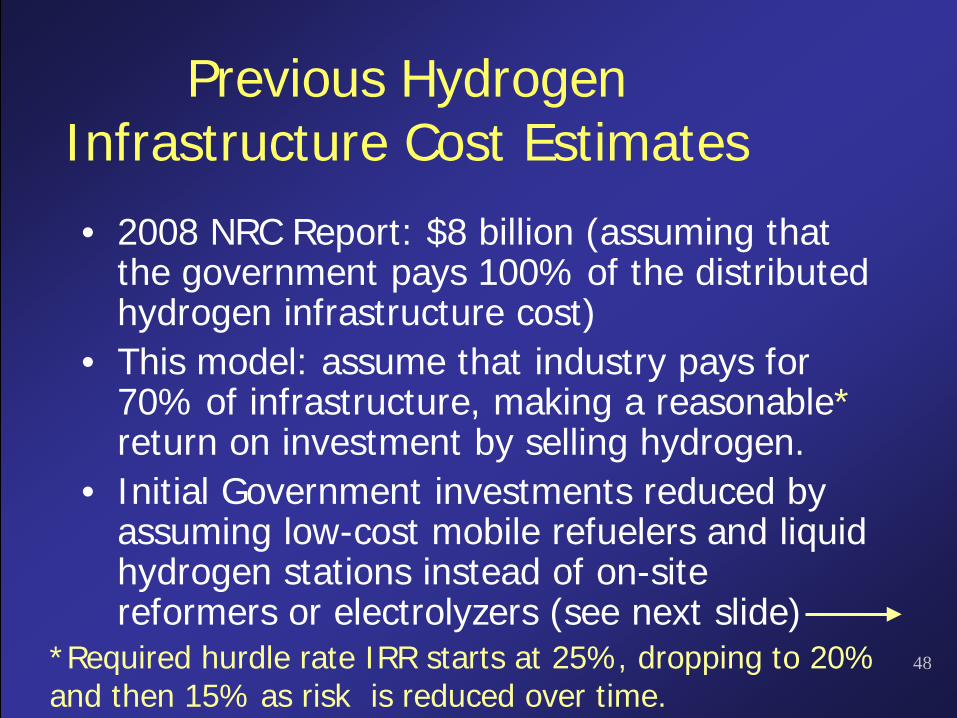
Previous Hydrogen Infrastructure Cost Estimates
• 2008 NRC Report: $8 billion (assuming that the government pays 100% of the distributed hydrogen infrastructure cost)
• This model: assume that industry pays for 70% of infrastructure, making a reasonable*return on investment by selling hydrogen.
• Initial Government investments reduced by assuming low-cost mobile refuelers and liquid hydrogen stations instead of on-site reformers or electrolyzers (see next slide)
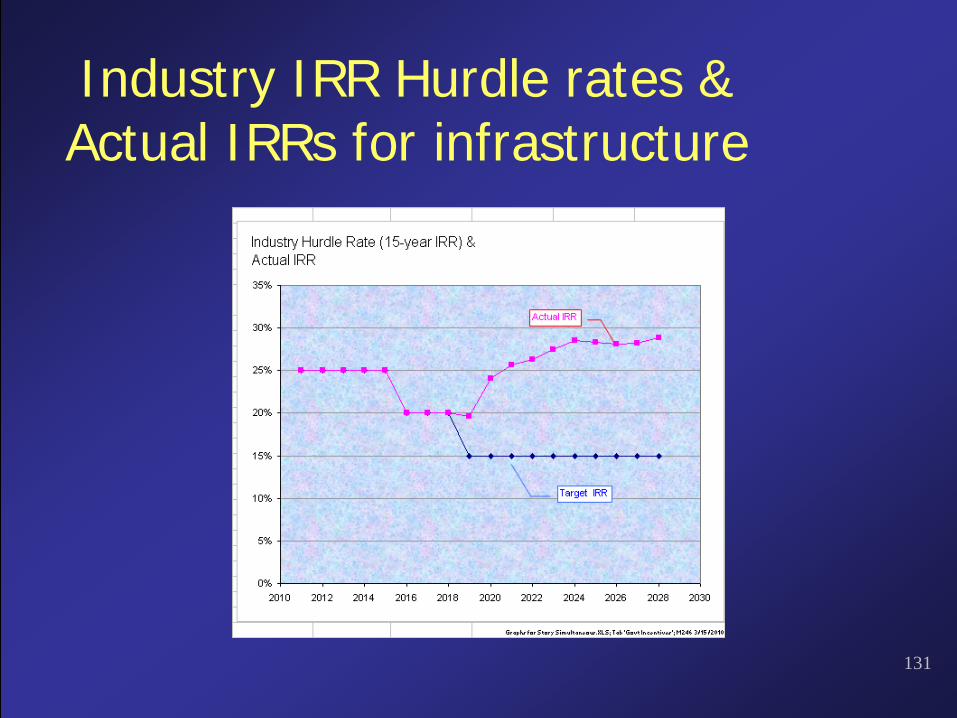
*Required hurdle rate IRR starts at 25%, dropping to 20% and then 15% as risk is reduced over time.
49
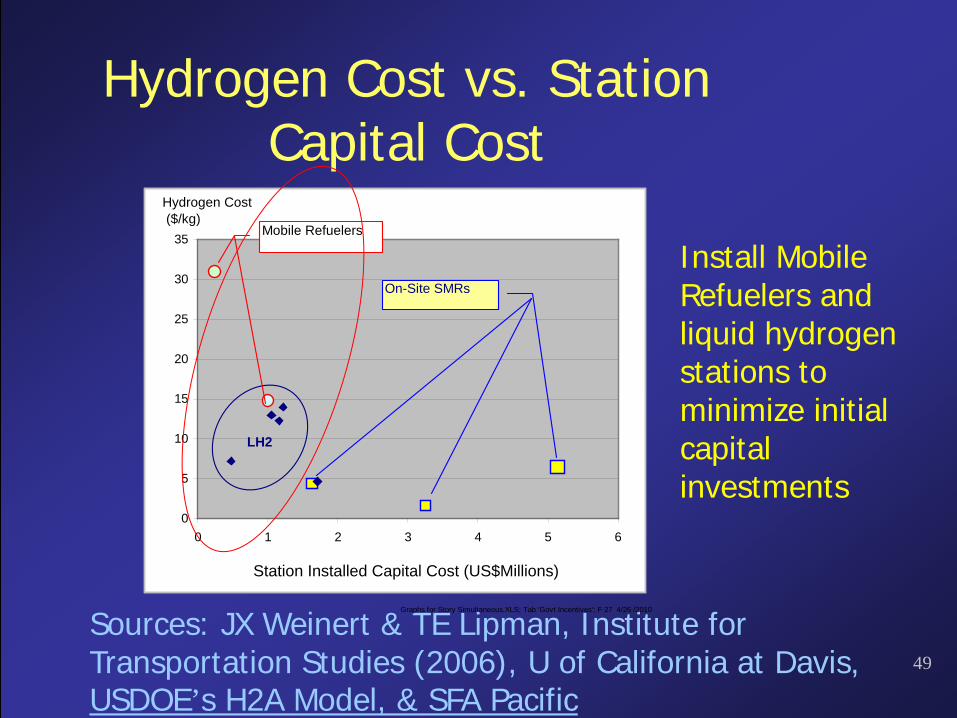
Hydrogen Cost vs. Station Capital Cost
Sources: JX Weinert & TE Lipman, Institute for Transportation Studies (2006), U of California at Davis, USDOE’s H2A Model, & SFA Pacific
Graphs for Story Simultaneous.XLS; Tab 'Govt Incentives'; F 27 4/26 /2010
0
5
10
15
20
25
30
35
0 1 2 3 4 5 6
Hydrogen Cost ($/kg)
Station Installed Capital Cost (US$Millions)
On-Site SMRs
LH2
Mobile Refuelers
Install Mobile Refuelers and liquid hydrogen stations to minimize initial capital investments
50
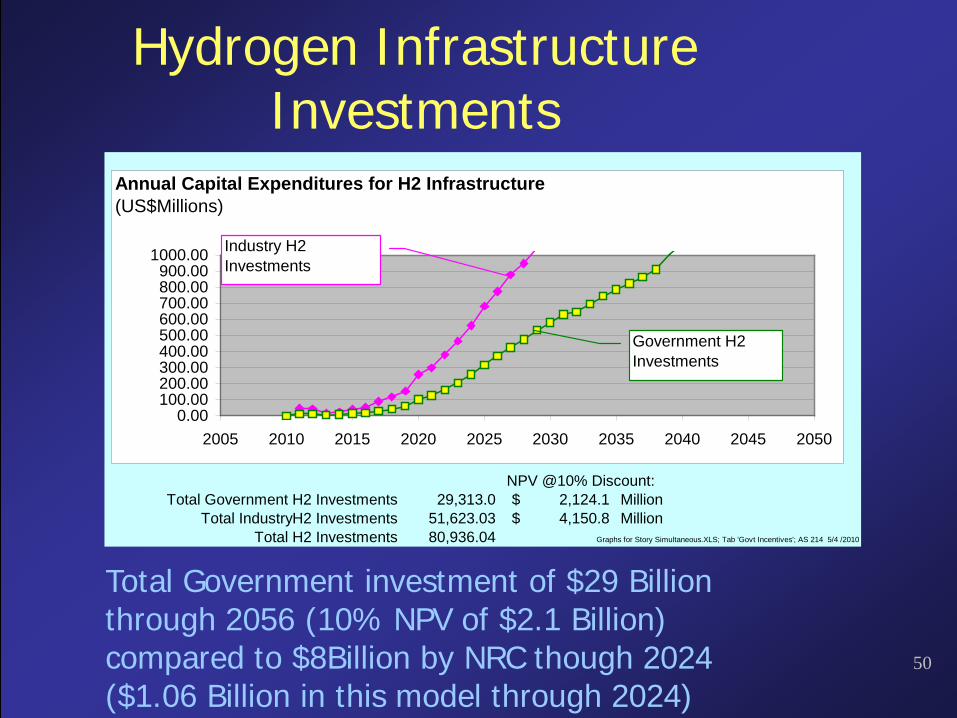
Hydrogen Infrastructure Investments
Total Government investment of $29 Billion through 2056 (10% NPV of $2.1 Billion) compared to $8Billion by NRC though 2024 ($1.06 Billion in this model through 2024)
NPV @10% Discount:Total Government H2 Investments 29,313.0 2,124.1$ Million
Total IndustryH2 Investments 51,623.03 4,150.8$ MillionTotal H2 Investments 80,936.04 Graphs for Story Simultaneous.XLS; Tab 'Govt Incentives'; AS 214 5/4 /2010
0.00100.00200.00300.00400.00500.00600.00700.00800.00900.00
1000.00
2005 2010 2015 2020 2025 2030 2035 2040 2045 2050
Industry H2 Investments
Government H2 Investments
Annual Capital Expenditures for H2 Infrastructure(US$Millions)
51
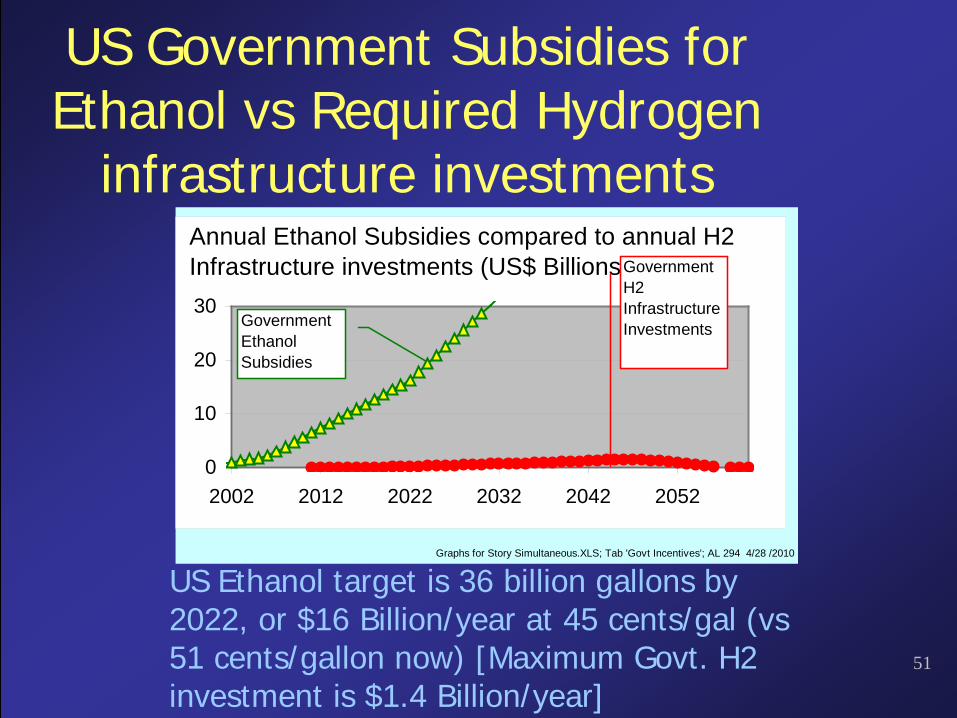
US Government Subsidies for Ethanol vs Required Hydrogen
infrastructure investments
US Ethanol target is 36 billion gallons by 2022, or $16 Billion/year at 45 cents/gal (vs 51 cents/gallon now) [Maximum Govt. H2 investment is $1.4 Billion/year]
Graphs for Story Simultaneous.XLS; Tab 'Govt Incentives'; AL 294 4/28 /2010
0
10
20
30
2002 2012 2022 2032 2042 2052
Annual Ethanol Subsidies compared to annual H2 Infrastructure investments (US$ Billions/year)
Government Ethanol Subsidies
Government H2 Infrastructure Investments
52
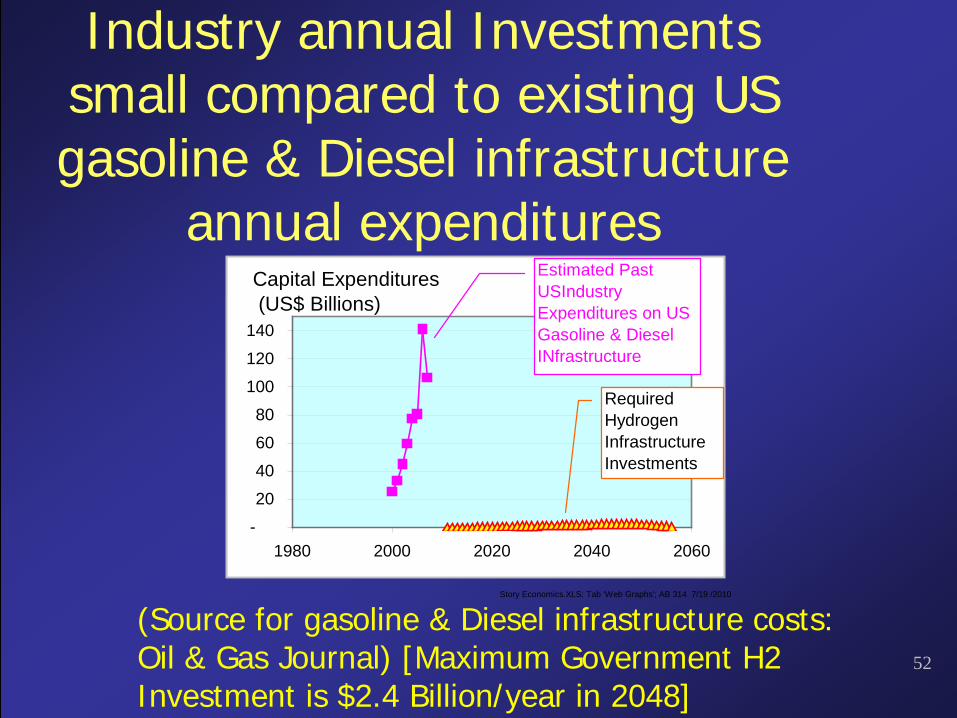
Industry annual Investments small compared to existing US gasoline & Diesel infrastructure
annual expenditures
(Source for gasoline & Diesel infrastructure costs: Oil & Gas Journal) [Maximum Government H2 Investment is $2.4 Billion/year in 2048]
Story Economics.XLS; Tab 'Web Graphs'; AB 314 7/19 /2010
-
20
40
60
80
100
120
140
1980 2000 2020 2040 2060
Estimated Past USIndustry Expenditures on US Gasoline & Diesel INfrastructure
Required Hydrogen Infrastructure Investments
Capital Expenditures (US$ Billions)
53
Outline
• Main Results from 100-year simulation– Greenhouse Gas Emissions– Oil consumption
• Battery vs. Fuel Cell system comparison• Capital investments (industry & Government)
required for:– Hydrogen infrastructure– Electrical charging infrastructure
• Government Incentives required for:– BEVs– FCEVs
• Natural Gas Vehicle Comparisons
54
Public Charging Infrastructure
• The Electrification Coalition recommends:– Two public outlets for each BEV initially– Decreasing to one public outlet for every
two BEVs over time.
Source: The Electrification Coalition Roadmap http://www.electrificationcoalition.org/
55
Members of the Electrification Coalition
• AeroVironment• GridPoint• NRG Energy• Coda Automotive• PG&E• Rockwood Holdings• Nissan• Kleiner Perkins Caufield Byers• Coulomb Technologies• Johnson Controls• Bright Automotive• FedEx• A123 Systems
Ref: The Electrification Coalition Roadmap http://www.electrificationcoalition.org/
56
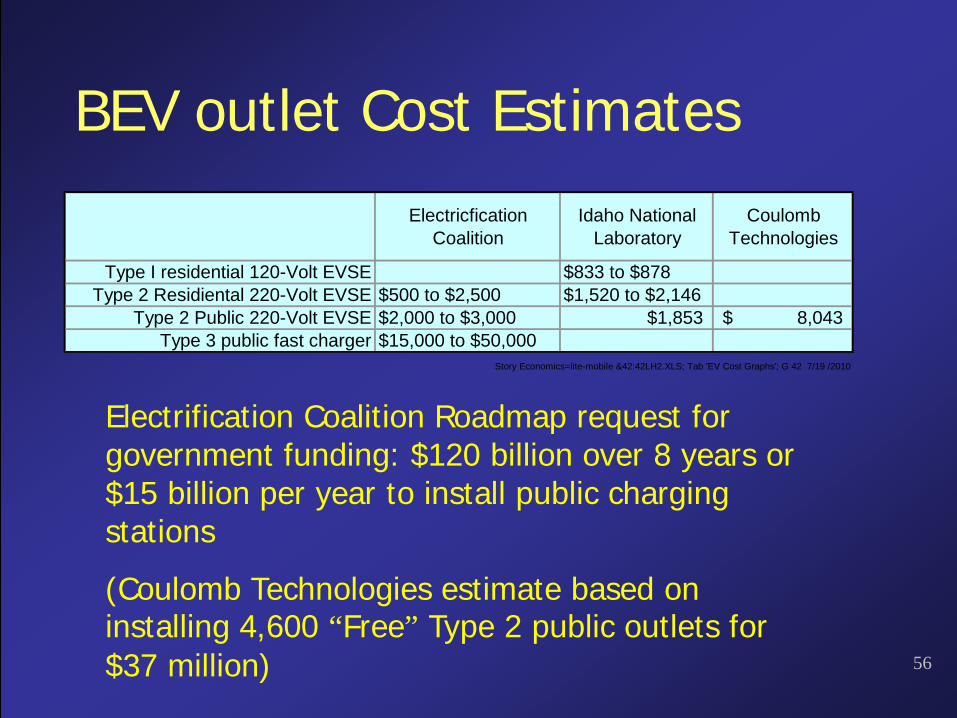
BEV outlet Cost Estimates
Electrification Coalition Roadmap request for government funding: $120 billion over 8 years or $15 billion per year to install public charging stations
(Coulomb Technologies estimate based on installing 4,600 “Free” Type 2 public outlets for $37 million)
Electricfication Coalition
Idaho National Laboratory
Coulomb Technologies
Type I residential 120-Volt EVSE $833 to $878Type 2 Residiental 220-Volt EVSE $500 to $2,500 $1,520 to $2,146
Type 2 Public 220-Volt EVSE $2,000 to $3,000 $1,853 8,043$ Type 3 public fast charger $15,000 to $50,000
Story Economics=lite-mobile &42:42LH2.XLS; Tab 'EV Cost Graphs'; G 42 7/19 /2010
57
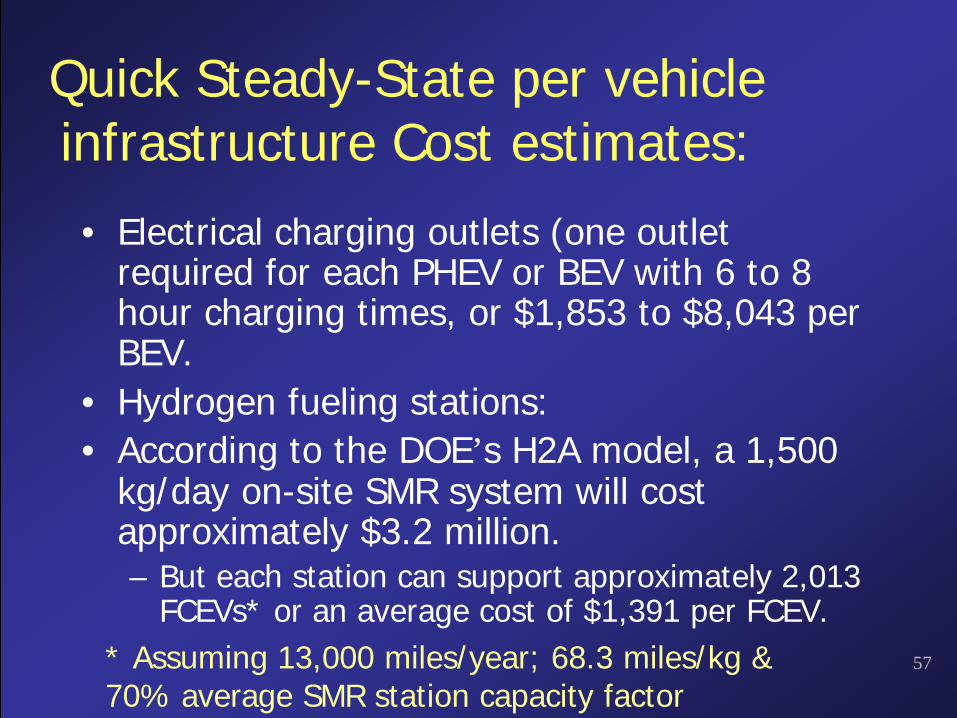
Quick Steady-State per vehicle infrastructure Cost estimates:
• Electrical charging outlets (one outlet required for each PHEV or BEV with 6 to 8 hour charging times, or $1,853 to $8,043 per BEV.
• Hydrogen fueling stations:• According to the DOE’s H2A model, a 1,500
kg/day on-site SMR system will cost approximately $3.2 million.– But each station can support approximately 2,013
FCEVs* or an average cost of $1,391 per FCEV.* Assuming 13,000 miles/year; 68.3 miles/kg & 70% average SMR station capacity factor
58
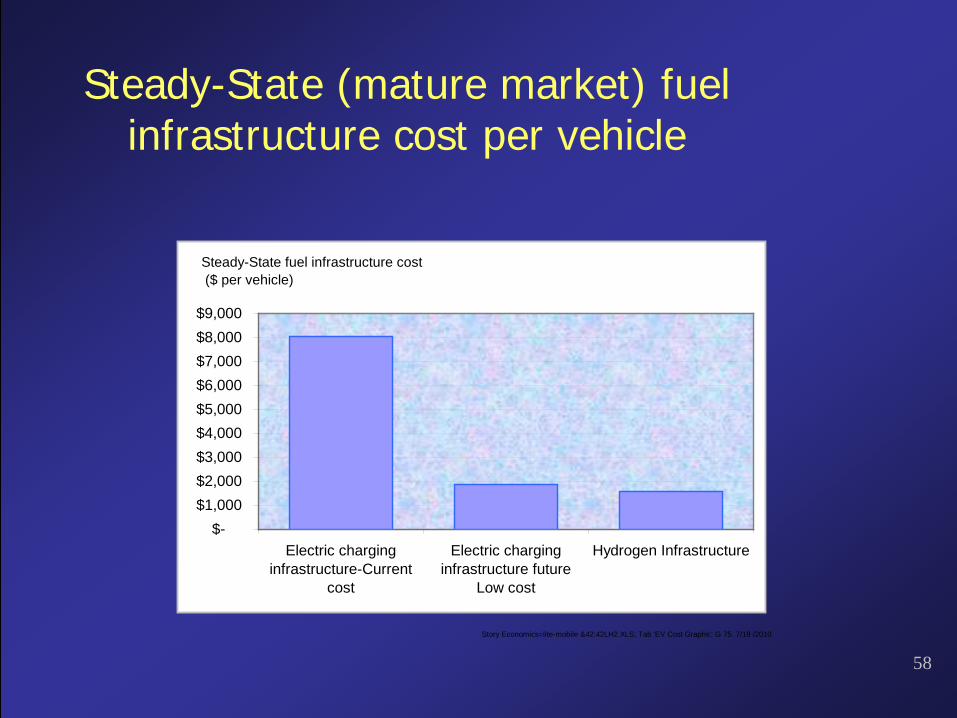
Steady-State (mature market) fuel infrastructure cost per vehicle
Story Economics=lite-mobile &42:42LH2.XLS; Tab 'EV Cost Graphs'; G 75 7/19 /2010
$-$1,000$2,000$3,000$4,000$5,000$6,000$7,000$8,000$9,000
Electric charginginfrastructure-Current
cost
Electric charginginfrastructure future
Low cost
Hydrogen Infrastructure
Steady-State fuel infrastructure cost ($ per vehicle)
59
Transition costs
• Eventual fuel infrastructure cost per vehicle favors on-site hydrogen production, but what about the transition?
• What are the investment costs to get from here to there?
60
Electric charging infrastructure• We assume that the same electrical
outlet financial characteristics as for the hydrogen infrastructure:– Governments pay 30% of the installation
costs– Industry pays 70% and borrows at 8%
interest and makes an adequate ROI selling electricity* to PHEV and BEV owners.*Technically private industry cannot “sell” electricity, so they would have to charge a fee to provide the charging infrastructure.
61
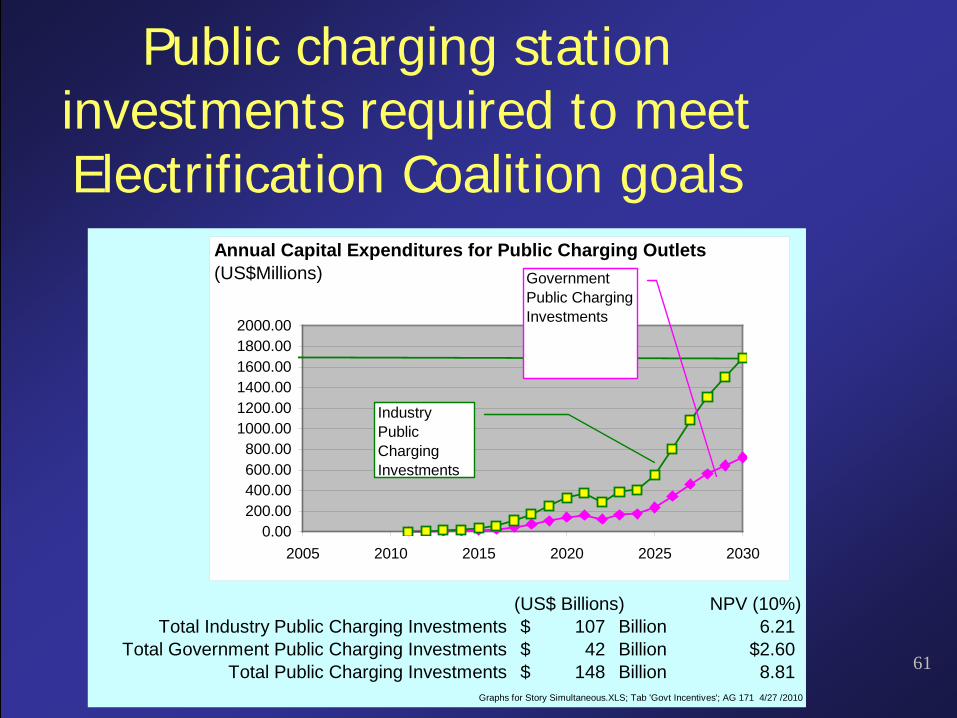
Public charging station investments required to meet Electrification Coalition goals
(US$ Billions) NPV (10%)Total Industry Public Charging Investments 107$ Billion 6.21
Total Government Public Charging Investments 42$ Billion $2.60Total Public Charging Investments 148$ Billion 8.81
Graphs for Story Simultaneous.XLS; Tab 'Govt Incentives'; AG 171 4/27 /2010
0.00200.00400.00600.00800.00
1000.001200.001400.001600.001800.002000.00
2005 2010 2015 2020 2025 2030
Government Public Charging Investments
Industry Public Charging Investments
Annual Capital Expenditures for Public Charging Outlets(US$Millions)
62
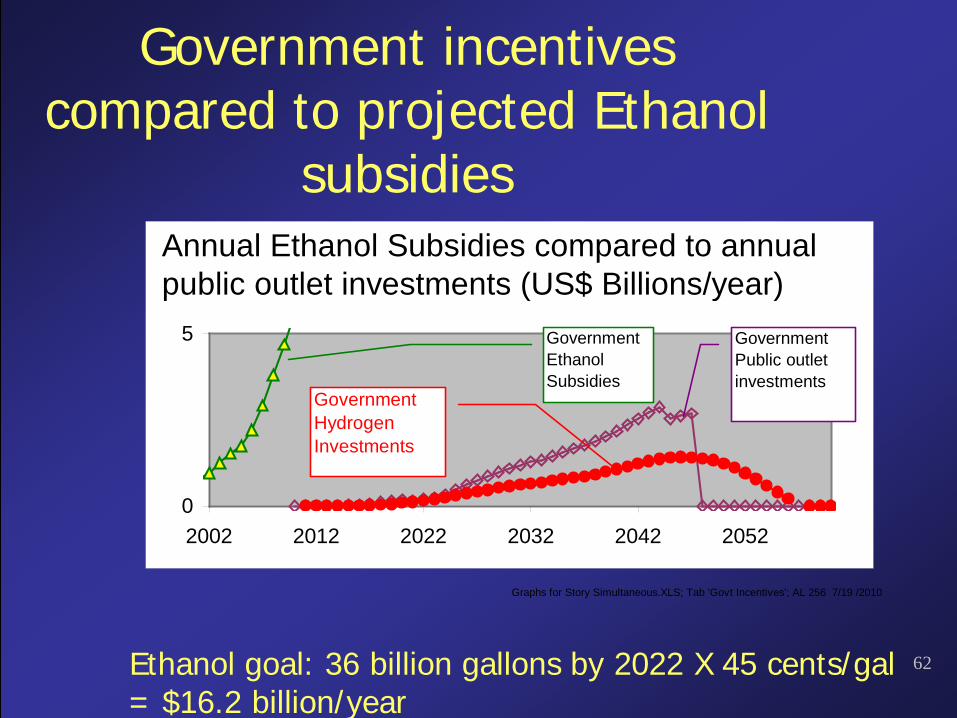
Government incentives compared to projected Ethanol
subsidies
Ethanol goal: 36 billion gallons by 2022 X 45 cents/gal = $16.2 billion/year
Graphs for Story Simultaneous.XLS; Tab 'Govt Incentives'; AL 256 7/19 /2010
0
5
2002 2012 2022 2032 2042 2052
Annual Ethanol Subsidies compared to annual public outlet investments (US$ Billions/year)
Government Ethanol Subsidies
Government Public outlet investments
Government Hydrogen Investments
63
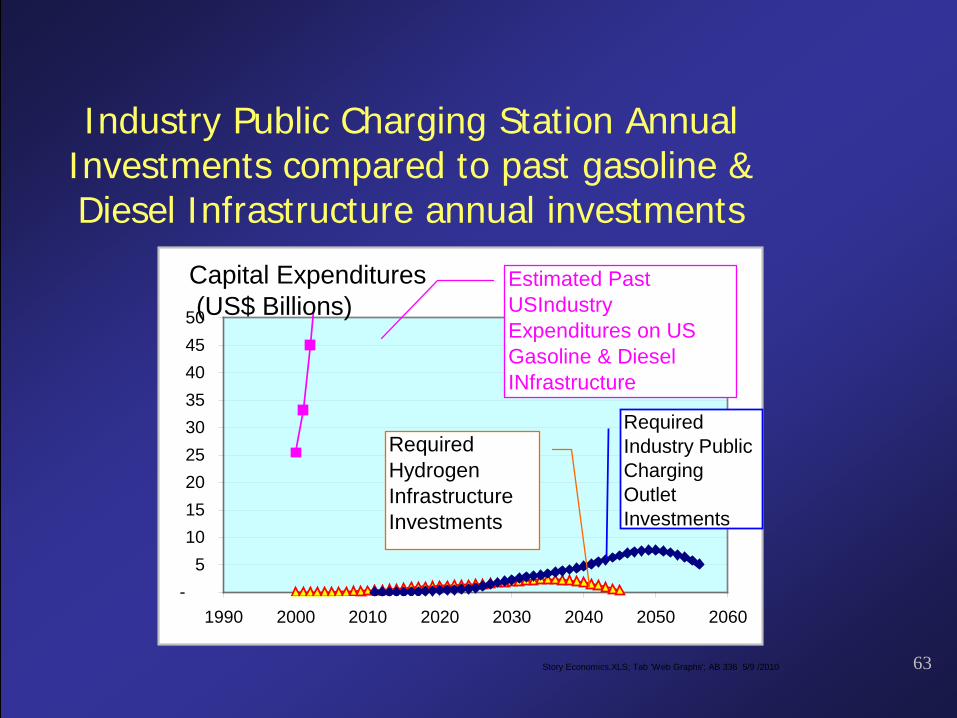
Industry Public Charging Station Annual Investments compared to past gasoline & Diesel Infrastructure annual investments
Story Economics.XLS; Tab 'Web Graphs'; AB 336 5/9 /2010
-5
101520253035404550
1990 2000 2010 2020 2030 2040 2050 2060
Estimated Past USIndustry Expenditures on US Gasoline & Diesel INfrastructure
Required Hydrogen Infrastructure Investments
Capital Expenditures (US$ Billions)
Required Industry Public Charging Outlet Investments
64
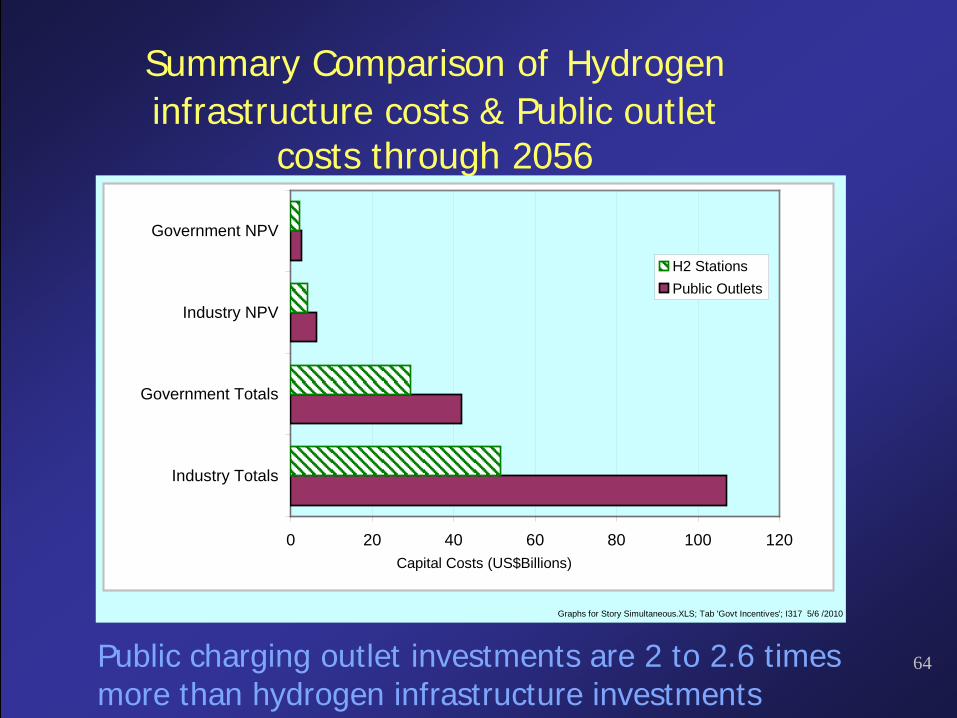
Summary Comparison of Hydrogen infrastructure costs & Public outlet
costs through 2056
Graphs for Story Simultaneous.XLS; Tab 'Govt Incentives'; I317 5/6 /2010
0 20 40 60 80 100 120
Industry Totals
Government Totals
Industry NPV
Government NPV
H2 StationsPublic Outlets
Capital Costs (US$Billions)
Public charging outlet investments are 2 to 2.6 times more than hydrogen infrastructure investments
65
Outline
• Main Results from 100-year simulation– Greenhouse Gas Emissions– Oil consumption
• Battery vs. Fuel Cell system comparison• Capital investments (industry & Government)
required for:– Hydrogen infrastructure– Electrical charging infrastructure
• Government Incentives required for:– BEVs– FCEVs
• Natural Gas Vehicle Comparisons
66
Alternative Vehicles
• Government Subsidies required for– FCEVs– BEVs
67
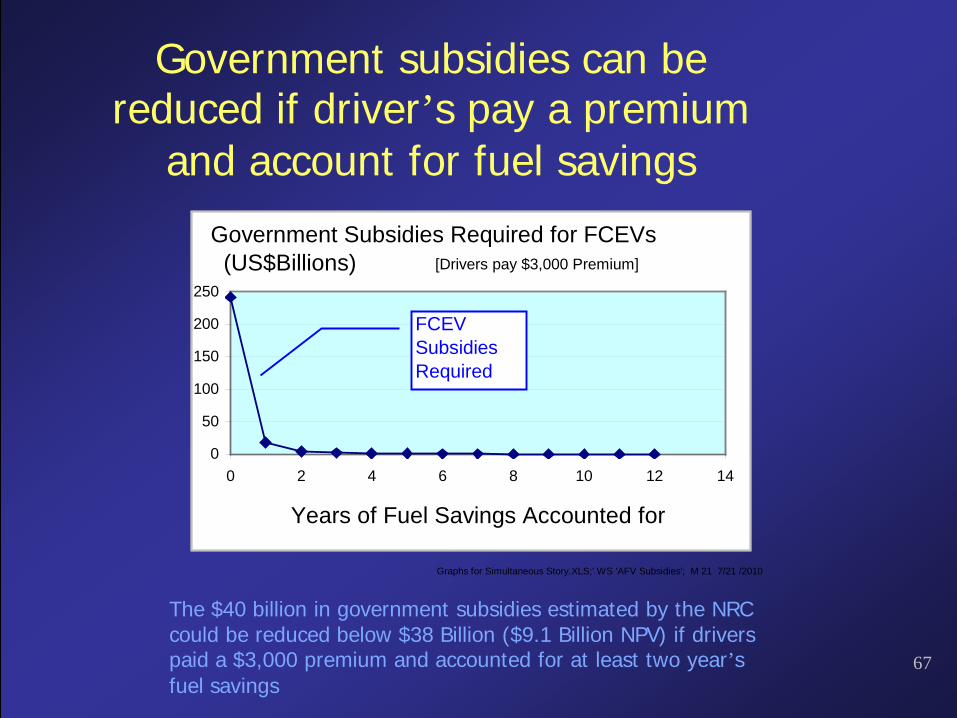
Government subsidies can be reduced if driver’s pay a premium
and account for fuel savings
The $40 billion in government subsidies estimated by the NRC could be reduced below $38 Billion ($9.1 Billion NPV) if drivers paid a $3,000 premium and accounted for at least two year’s fuel savings
Graphs for Simultaneous Story.XLS;' WS 'AFV Subsidies'; M 21 7/21 /2010
0
50
100
150
200
250
0 2 4 6 8 10 12 14
Years of Fuel Savings Accounted for
Government Subsidies Required for FCEVs (US$Billions) [Drivers pay $3,000 Premium]
FCEV Subsidies Required
68
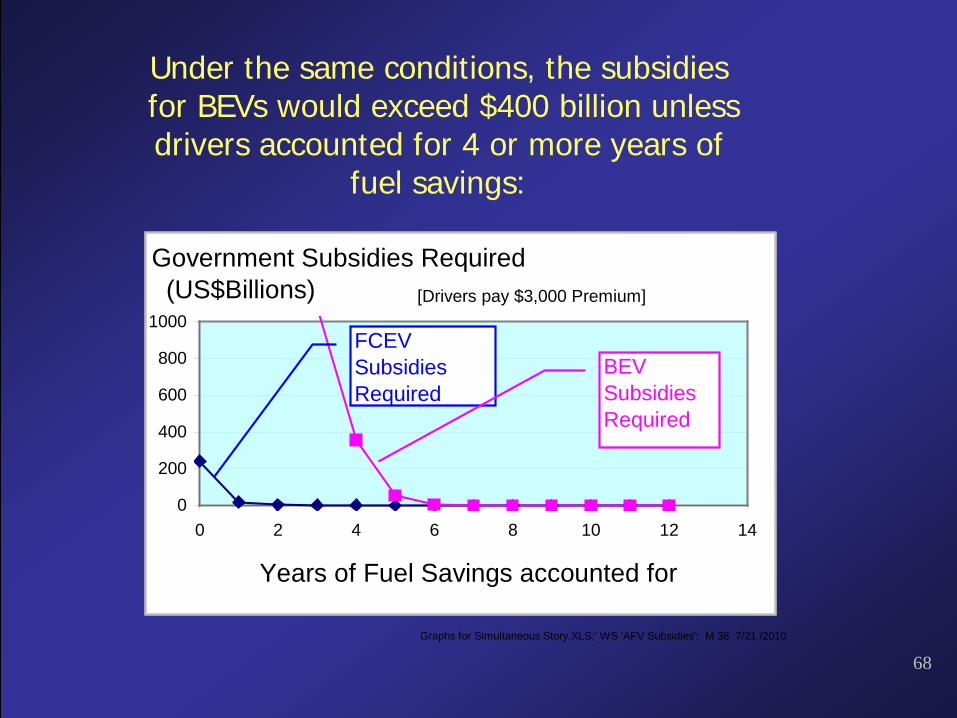
Under the same conditions, the subsidiesfor BEVs would exceed $400 billion unless drivers accounted for 4 or more years of
fuel savings:
Graphs for Simultaneous Story.XLS;' WS 'AFV Subsidies'; M 38 7/21 /2010
0
200
400
600
800
1000
0 2 4 6 8 10 12 14
Years of Fuel Savings accounted for
Government Subsidies Required (US$Billions)
FCEV Subsidies Required
BEV Subsidies Required
[Drivers pay $3,000 Premium]
69
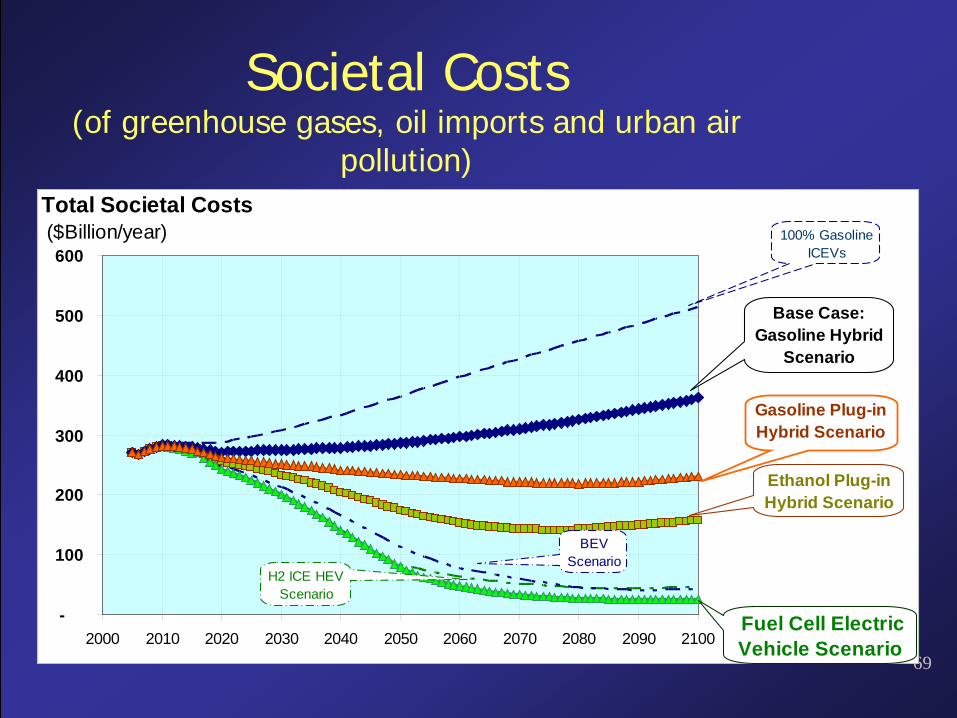
Societal Costs(of greenhouse gases, oil imports and urban air
pollution)
-
100
200
300
400
500
600
2000 2010 2020 2030 2040 2050 2060 2070 2080 2090 2100
Total Societal Costs ($Billion/year)
Fuel Cell ElectricVehicle Scenario
Ethanol Plug-in Hybrid Scenario
Gasoline Plug-in Hybrid Scenario
PHEV
Base Case:Gasoline Hybrid
Scenario
100% GasolineICEVs
H2 ICE HEVScenario
BEVScenario
70
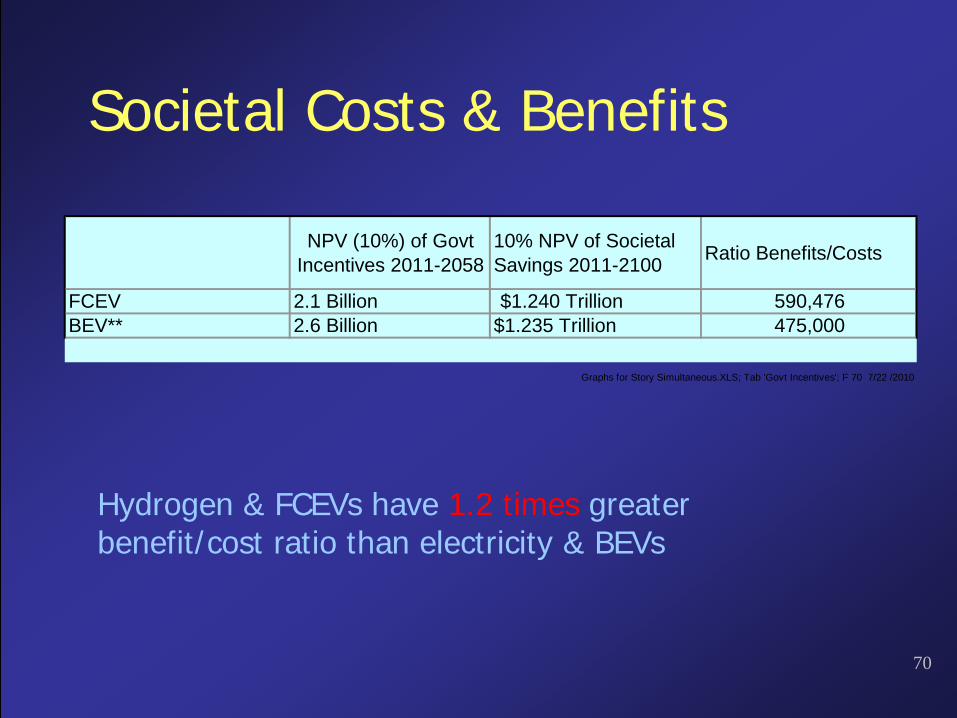
Societal Costs & Benefits
Hydrogen & FCEVs have 1.2 times greater benefit/cost ratio than electricity & BEVs
NPV (10%) of Govt Incentives 2011-2058
10% NPV of Societal Savings 2011-2100 Ratio Benefits/Costs
FCEV 2.1 Billion $1.240 Trillion 590,476BEV** 2.6 Billion $1.235 Trillion 475,000
Graphs for Story Simultaneous.XLS; Tab 'Govt Incentives'; F 70 7/22 /2010
71
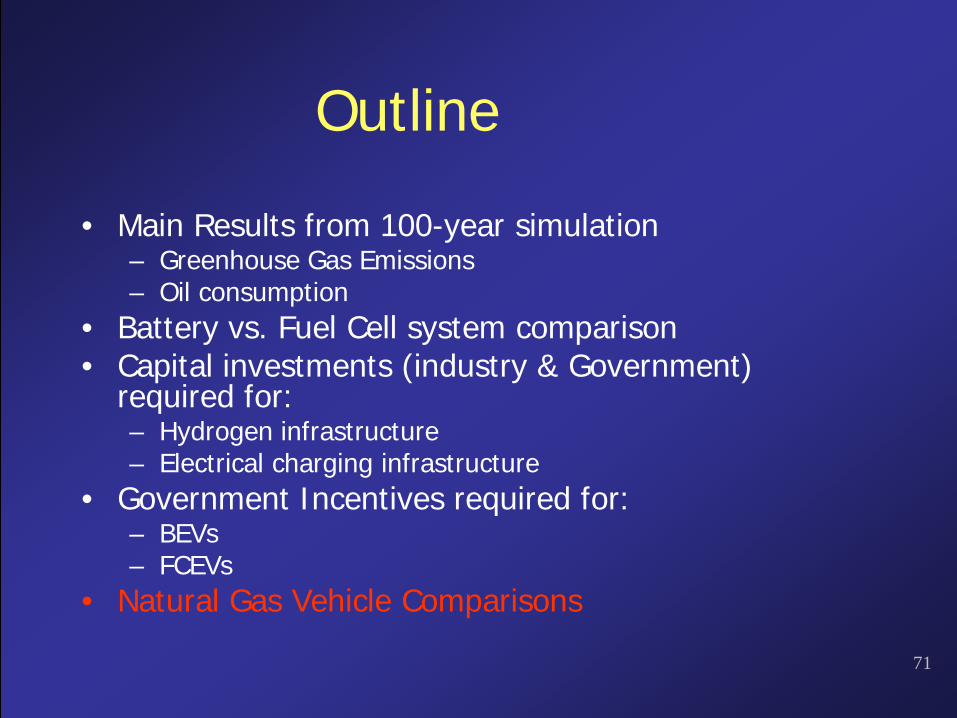
Outline
• Main Results from 100-year simulation– Greenhouse Gas Emissions– Oil consumption
• Battery vs. Fuel Cell system comparison• Capital investments (industry & Government)
required for:– Hydrogen infrastructure– Electrical charging infrastructure
• Government Incentives required for:– BEVs– FCEVs
• Natural Gas Vehicle Comparisons

72
Energy Efficiency
73
Natural Gas Utilization
• New natural gas reserves in shale formations are welcomed, but which is better?– To make hydrogen from natural gas for
FCEVs, or– To make electricity for BEVs?
74
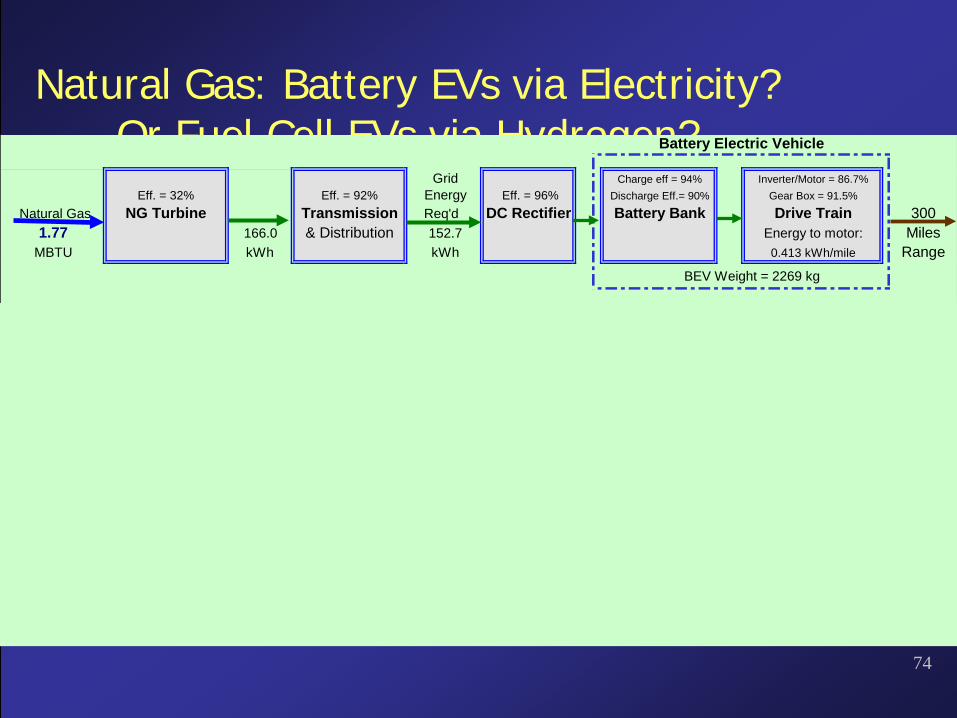
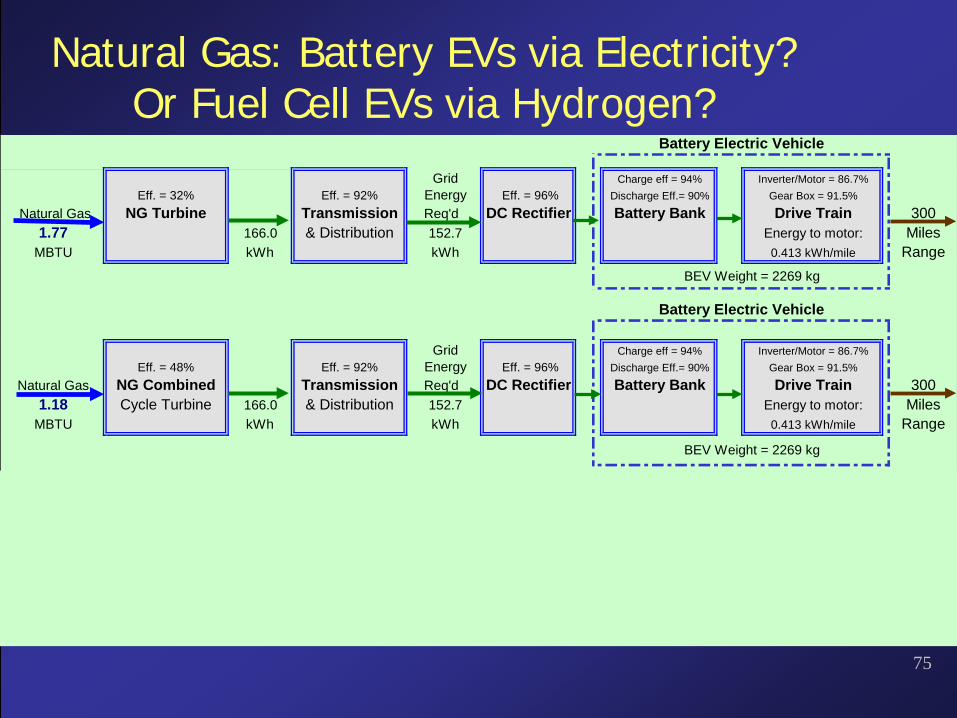
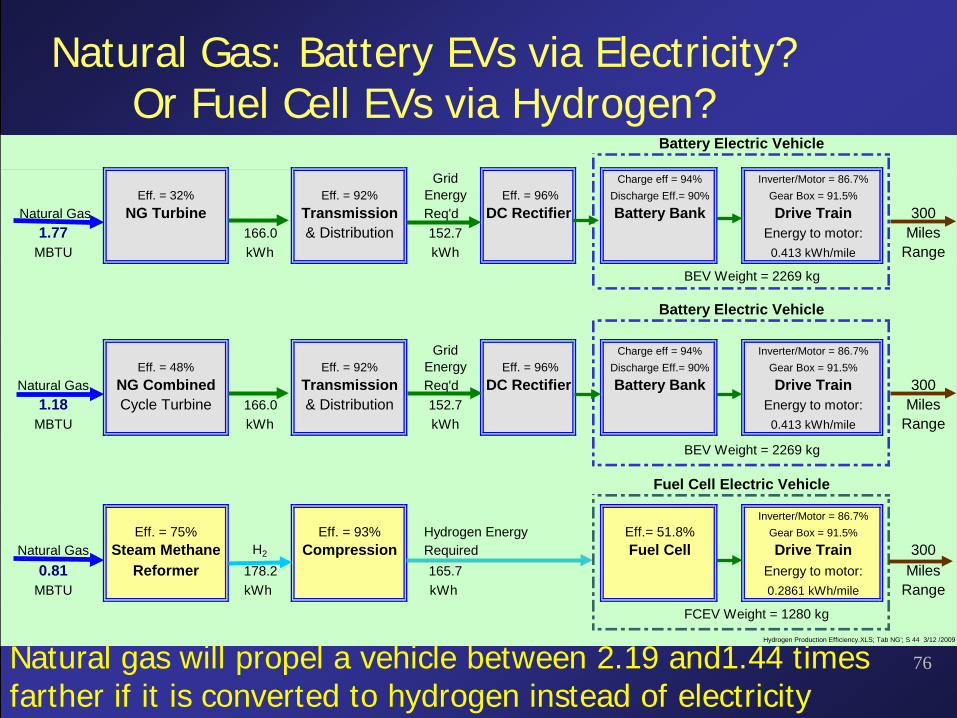
Natural Gas: Battery EVs via Electricity?Or Fuel Cell EVs via Hydrogen?
Grid Charge eff = 94% Inverter/Motor = 86.7%Eff. = 32% Eff. = 92% Energy Eff. = 96% Discharge Eff.= 90% Gear Box = 91.5%
Natural Gas NG Turbine Transmission Req'd DC Rectifier Battery Bank Drive Train 3001.77 166.0 & Distribution 152.7 Energy to motor: Miles
MBTU kWh kWh 0.413 kWh/mile RangeBEV Weight = 2269 kg
Grid Charge eff = 94% Inverter/Motor = 86.7%Eff. = 48% Eff. = 92% Energy Eff. = 96% Discharge Eff.= 90% Gear Box = 91.5%
Natural Gas NG Combined Transmission Req'd DC Rectifier Battery Bank Drive Train 3001.18 Cycle Turbine 166.0 & Distribution 152.7 Energy to motor: Miles
MBTU kWh kWh 0.413 kWh/mile Range
BEV Weight = 2269 kg
Inverter/Motor = 86.7%Eff. = 75% Eff. = 93% Hydrogen Energy Eff.= 51.8% Gear Box = 91.5%
Natural Gas Steam Methane H2 Compression Required Fuel Cell Drive Train 3000.81 Reformer 178.2 165.7 Energy to motor: Miles
MBTU kWh kWh 0.2861 kWh/mile RangeFCEV Weight = 1280 kg
Hydrogen Production Efficiency.XLS; Tab NG'; S 44 3/12 /2009
Battery Electric Vehicle
Battery Electric Vehicle
Fuel Cell Electric Vehicle
75
Natural Gas: Battery EVs via Electricity?Or Fuel Cell EVs via Hydrogen?
Grid Charge eff = 94% Inverter/Motor = 86.7%Eff. = 32% Eff. = 92% Energy Eff. = 96% Discharge Eff.= 90% Gear Box = 91.5%
Natural Gas NG Turbine Transmission Req'd DC Rectifier Battery Bank Drive Train 3001.77 166.0 & Distribution 152.7 Energy to motor: Miles
MBTU kWh kWh 0.413 kWh/mile RangeBEV Weight = 2269 kg
Grid Charge eff = 94% Inverter/Motor = 86.7%Eff. = 48% Eff. = 92% Energy Eff. = 96% Discharge Eff.= 90% Gear Box = 91.5%
Natural Gas NG Combined Transmission Req'd DC Rectifier Battery Bank Drive Train 3001.18 Cycle Turbine 166.0 & Distribution 152.7 Energy to motor: Miles
MBTU kWh kWh 0.413 kWh/mile Range
BEV Weight = 2269 kg
Inverter/Motor = 86.7%Eff. = 75% Eff. = 93% Hydrogen Energy Eff.= 51.8% Gear Box = 91.5%
Natural Gas Steam Methane H2 Compression Required Fuel Cell Drive Train 3000.81 Reformer 178.2 165.7 Energy to motor: Miles
MBTU kWh kWh 0.2861 kWh/mile RangeFCEV Weight = 1280 kg
Hydrogen Production Efficiency.XLS; Tab NG'; S 44 3/12 /2009
Battery Electric Vehicle
Battery Electric Vehicle
Fuel Cell Electric Vehicle
76
Natural Gas: Battery EVs via Electricity?Or Fuel Cell EVs via Hydrogen?
Grid Charge eff = 94% Inverter/Motor = 86.7%Eff. = 32% Eff. = 92% Energy Eff. = 96% Discharge Eff.= 90% Gear Box = 91.5%
Natural Gas NG Turbine Transmission Req'd DC Rectifier Battery Bank Drive Train 3001.77 166.0 & Distribution 152.7 Energy to motor: Miles
MBTU kWh kWh 0.413 kWh/mile RangeBEV Weight = 2269 kg
Grid Charge eff = 94% Inverter/Motor = 86.7%Eff. = 48% Eff. = 92% Energy Eff. = 96% Discharge Eff.= 90% Gear Box = 91.5%
Natural Gas NG Combined Transmission Req'd DC Rectifier Battery Bank Drive Train 3001.18 Cycle Turbine 166.0 & Distribution 152.7 Energy to motor: Miles
MBTU kWh kWh 0.413 kWh/mile Range
BEV Weight = 2269 kg
Inverter/Motor = 86.7%Eff. = 75% Eff. = 93% Hydrogen Energy Eff.= 51.8% Gear Box = 91.5%
Natural Gas Steam Methane H2 Compression Required Fuel Cell Drive Train 3000.81 Reformer 178.2 165.7 Energy to motor: Miles
MBTU kWh kWh 0.2861 kWh/mile RangeFCEV Weight = 1280 kg
Hydrogen Production Efficiency.XLS; Tab NG'; S 44 3/12 /2009
Battery Electric Vehicle
Battery Electric Vehicle
Fuel Cell Electric Vehicle
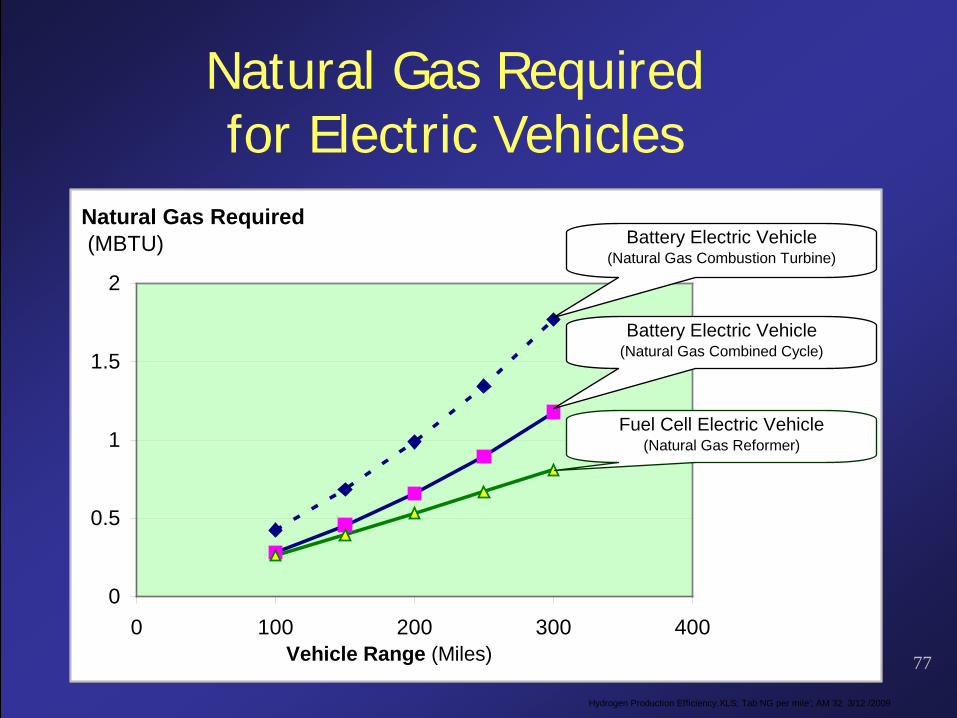
Natural gas will propel a vehicle between 2.19 and1.44 times farther if it is converted to hydrogen instead of electricity
77
Natural Gas Requiredfor Electric Vehicles
Hydrogen Production Efficiency.XLS; Tab NG per mile'; AM 32 3/12 /2009
0
0.5
1
1.5
2
0 100 200 300 400
Natural Gas Required (MBTU)
Vehicle Range (Miles)
Battery Electric Vehicle(Natural Gas Combustion Turbine)
Battery Electric Vehicle(Natural Gas Combined Cycle)
Fuel Cell Electric Vehicle(Natural Gas Reformer)
78
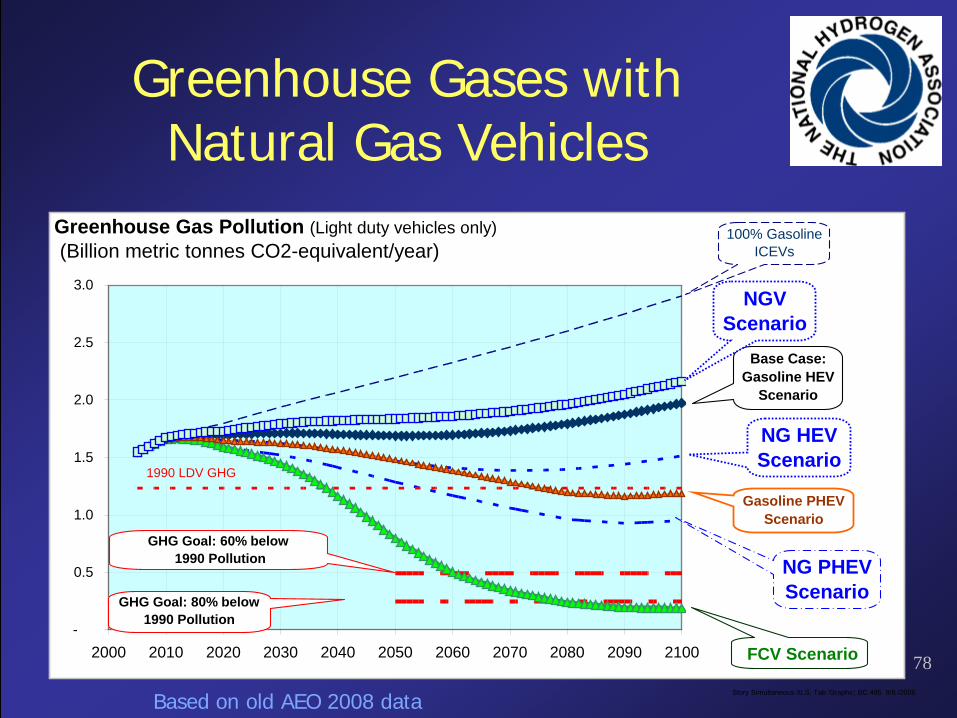
Greenhouse Gases with Natural Gas Vehicles
Story Simultaneous.XLS; Tab 'Graphs'; BC 495 9/8 /2008
-
0.5
1.0
1.5
2.0
2.5
3.0
2000 2010 2020 2030 2040 2050 2060 2070 2080 2090 2100
Greenhouse Gas Pollution (Light duty vehicles only) (Billion metric tonnes CO2-equivalent/year)
1990 LDV GHG
GHG Goal: 60% below 1990 Pollution
GHG Goal: 80% below 1990 Pollution
FCV Scenario
NG PHEVScenario
Gasoline PHEVScenario
Base Case:Gasoline HEV
Scenario
100% GasolineICEVs
NG HEVScenario
NGVScenario
Based on old AEO 2008 data
79
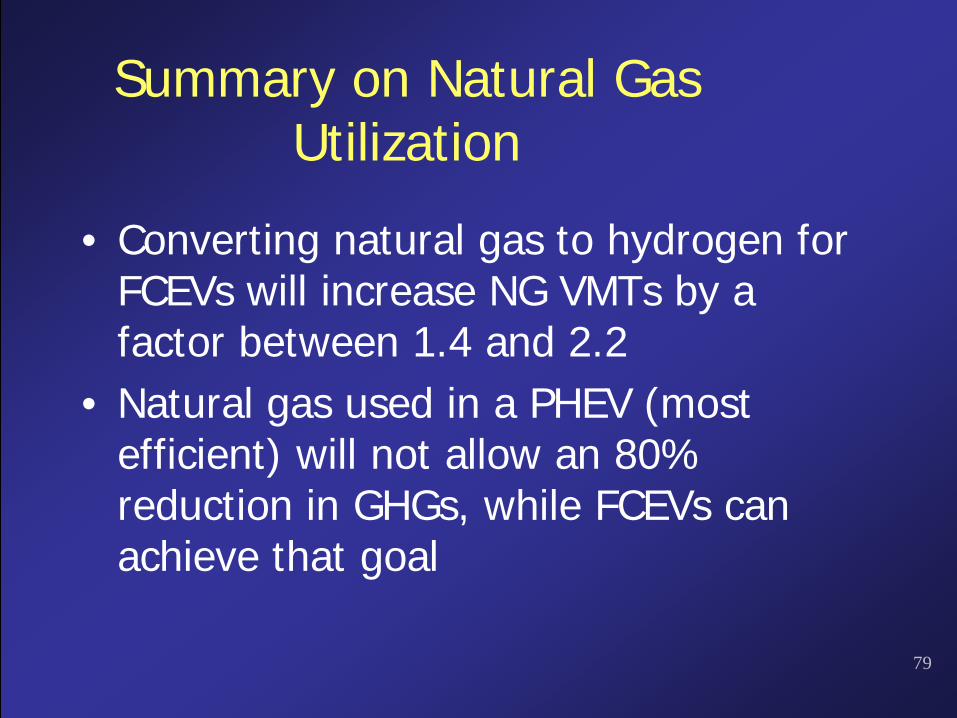
Summary on Natural Gas Utilization
• Converting natural gas to hydrogen for FCEVs will increase NG VMTs by a factor between 1.4 and 2.2
• Natural gas used in a PHEV (most efficient) will not allow an 80% reduction in GHGs, while FCEVs can achieve that goal
80
Next Steps
• Fund next phase of vehicle market transformationprojects, including more hydrogen fueling stations ($45 Million suggested vs. $11 million DOE request for vehicle & infrastructure deployment & $13 million this year), since several auto companies are now projecting commercial introduction of FCEVs in the 2015-2017 time period.
• Continue development of fuel cell electric vehicles and hydrogen technologies
• Continue development of PHEVs and BEVs (we need all of the above, as indicated by auto OEMs)
81
82
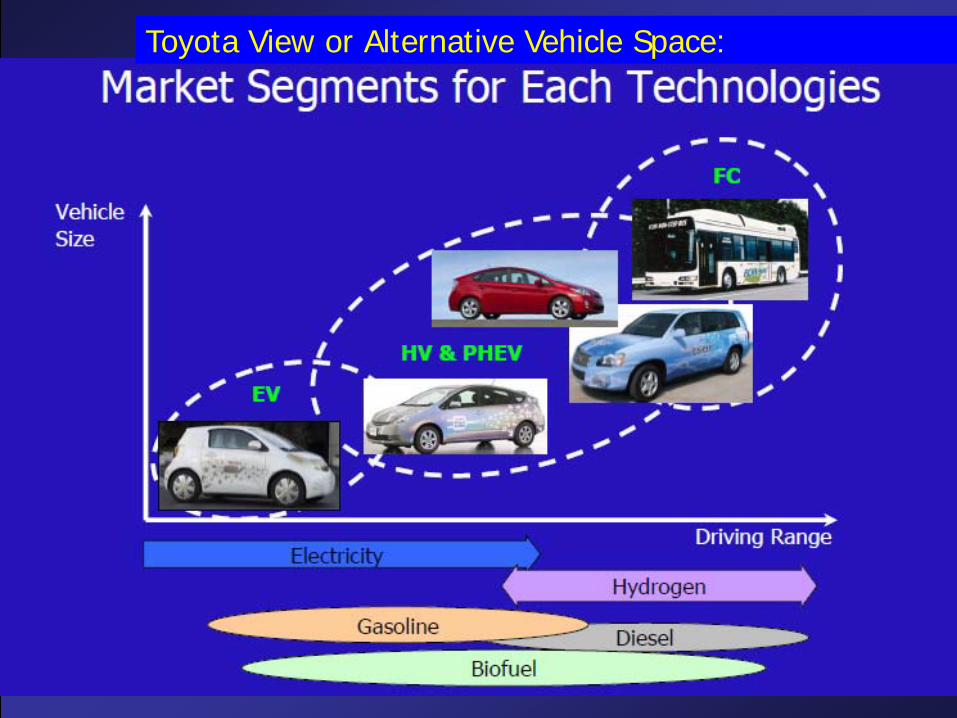
Toyota View or Alternative Vehicle Space:
83
84
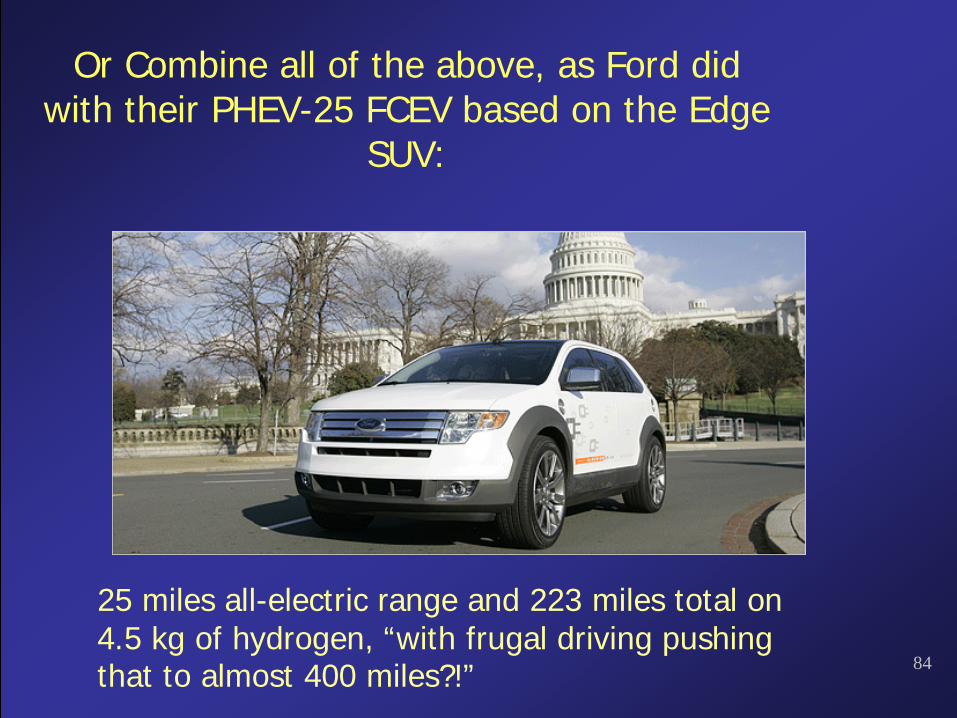
Or Combine all of the above, as Ford did with their PHEV-25 FCEV based on the Edge
SUV:
25 miles all-electric range and 223 miles total on 4.5 kg of hydrogen, “with frugal driving pushing that to almost 400 miles?!”
85
Thank You
• Contact Information:– Patrick Serfass, Vice President– National Hydrogen Association– 1211 Connecticut Avenue, NW, Suite 600– Washington, DC.– [email protected]
C.E. (Sandy) Thomas, ex-President (ret.)H2Gen Innovations, Inc.Alexandria, Virginia 22304703-507/[email protected]– NHA Energy Evolution web page:– http://www.hydrogenassociation.org/general/evolution.asp– Simulation details at: http://www.cleancaroptions.com

86
Backup Slides
87
How much electricity would be used with PHEVs?
88
Example PHEV-40
• Driver lives 5 miles from work• Work week travel by electricity: 50 miles• Weekend travel: 200 miles to Grandma’s
house or 250 miles total travel:– First 40 miles on electricity (90 miles total on the
grid)– 160 miles on gasoline
• Total on electricity: 90 miles out of 250 or 36% from grid and 64% from gasoline or 1.9 times further on gasoline than electricity
89
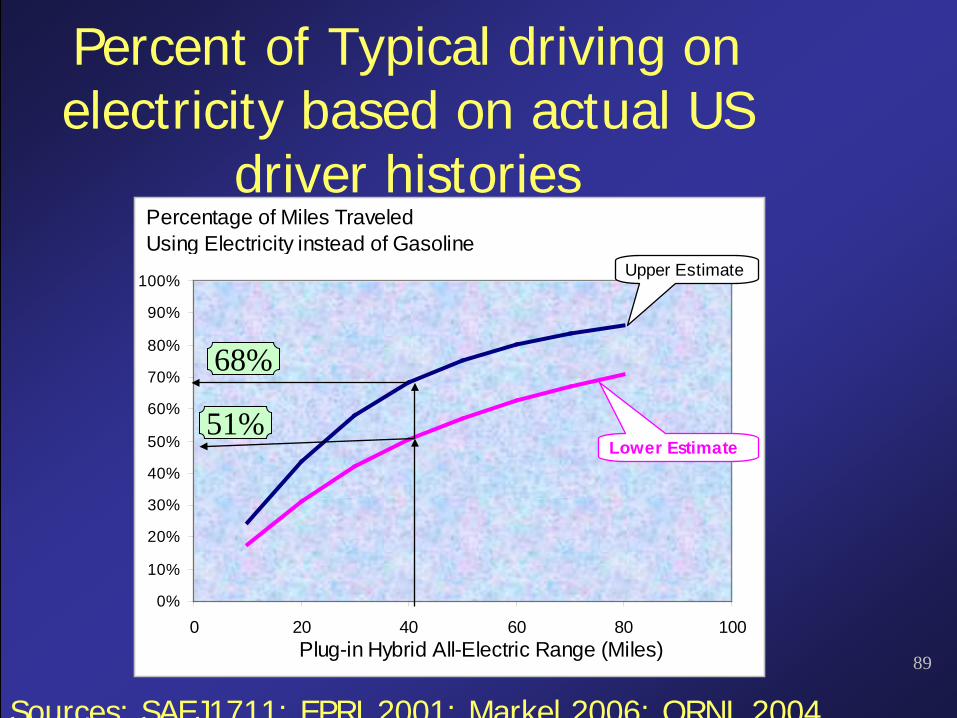
Percent of Typical driving on electricity based on actual US
driver histories
0%
10%
20%
30%
40%
50%
60%
70%
80%
90%
100%
0 20 40 60 80 100Plug-in Hybrid All-Electric Range (Miles)
Percentage of Miles Traveled Using Electricity instead of Gasoline
Upper Estimate
Lower Estimate51%
68%
Sources: SAEJ1711; EPRI 2001; Markel 2006; ORNL 2004
90
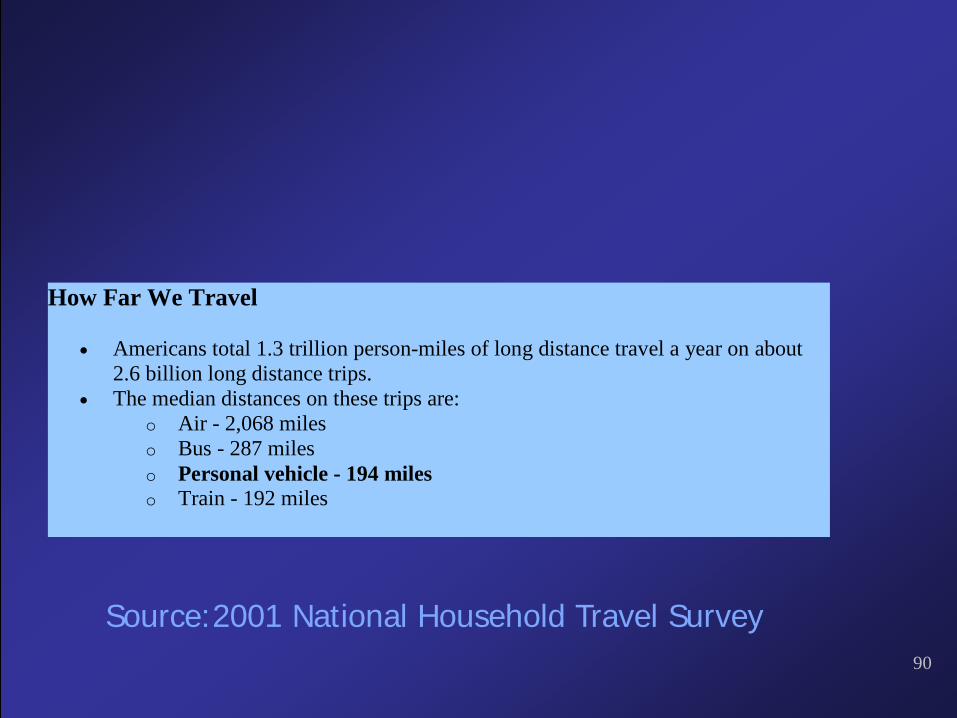
How Far We Travel
• Americans total 1.3 trillion person-miles of long distance travel a year on about 2.6 billion long distance trips.
• The median distances on these trips are: o Air - 2,068 miles o Bus - 287 miles o Personal vehicle - 194 miles o Train - 192 miles
Source:2001 National Household Travel Survey

91
Why We Travel
• 45 percent of daily trips are taken for shopping and errands • 27 percent of daily trips are social and recreational, such as visiting a friend • 15 percent of daily trips are taken for commuting
Source:2001 National Household Travel Survey
92
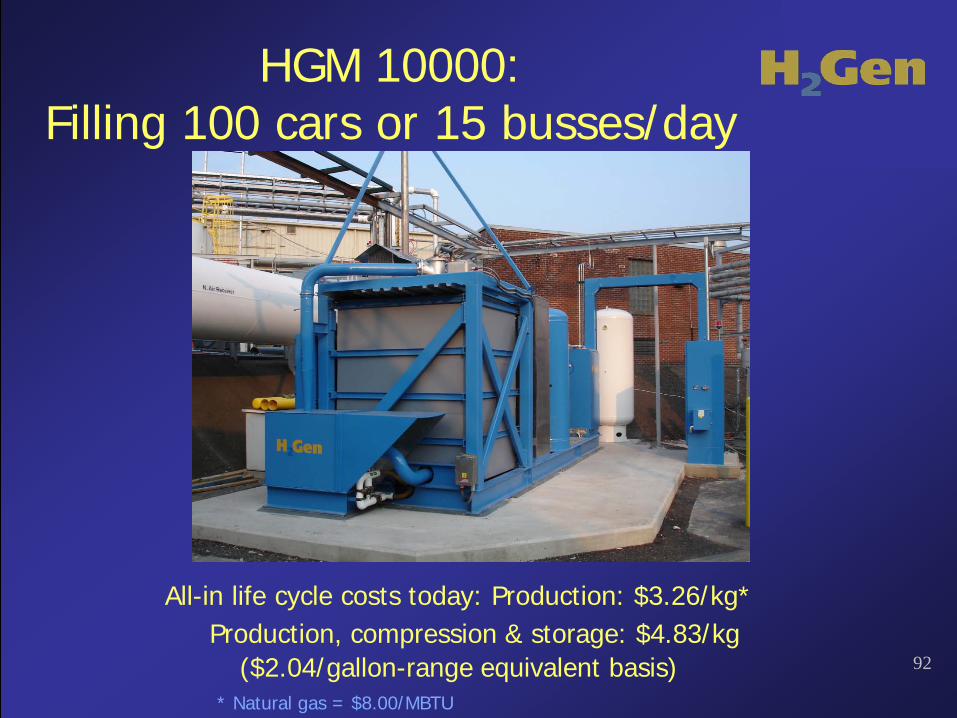
HGM 10000:Filling 100 cars or 15 busses/day
All-in life cycle costs today: Production: $3.26/kg*
* Natural gas = $8.00/MBTU
Production, compression & storage: $4.83/kg($2.04/gallon-range equivalent basis)
93
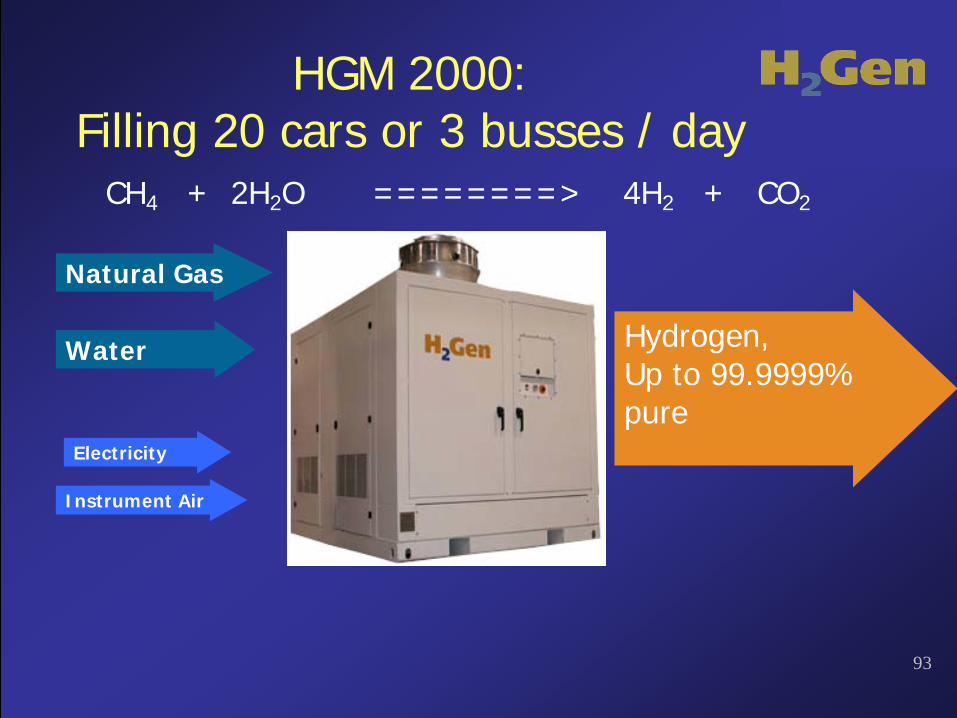
HGM 2000: Filling 20 cars or 3 busses / day
Natural Gas
Water
Instrument Air
Hydrogen,Up to 99.9999% pure
Electricity
CH4 + 2H2O ========> 4H2 + CO2
94
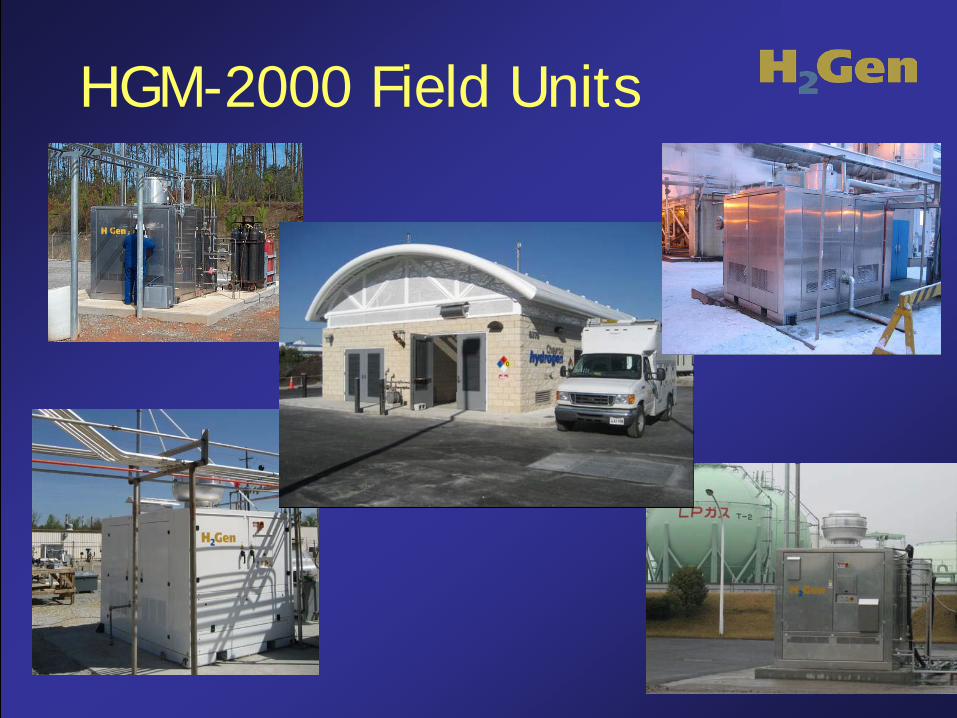
HGM-2000 Field Units
95
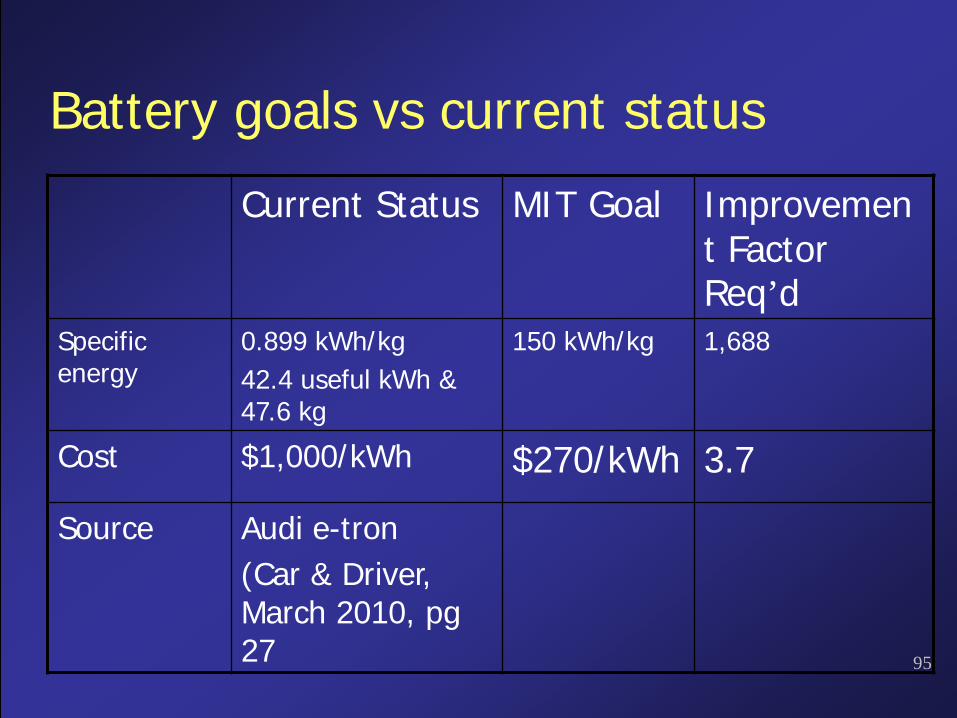
Battery goals vs current status
Current Status MIT Goal Improvement Factor Req’d
Specific energy
0.899 kWh/kg42.4 useful kWh & 47.6 kg
150 kWh/kg 1,688
Cost $1,000/kWh $270/kWh 3.7
Source Audi e-tron(Car & Driver, March 2010, pg 27
96
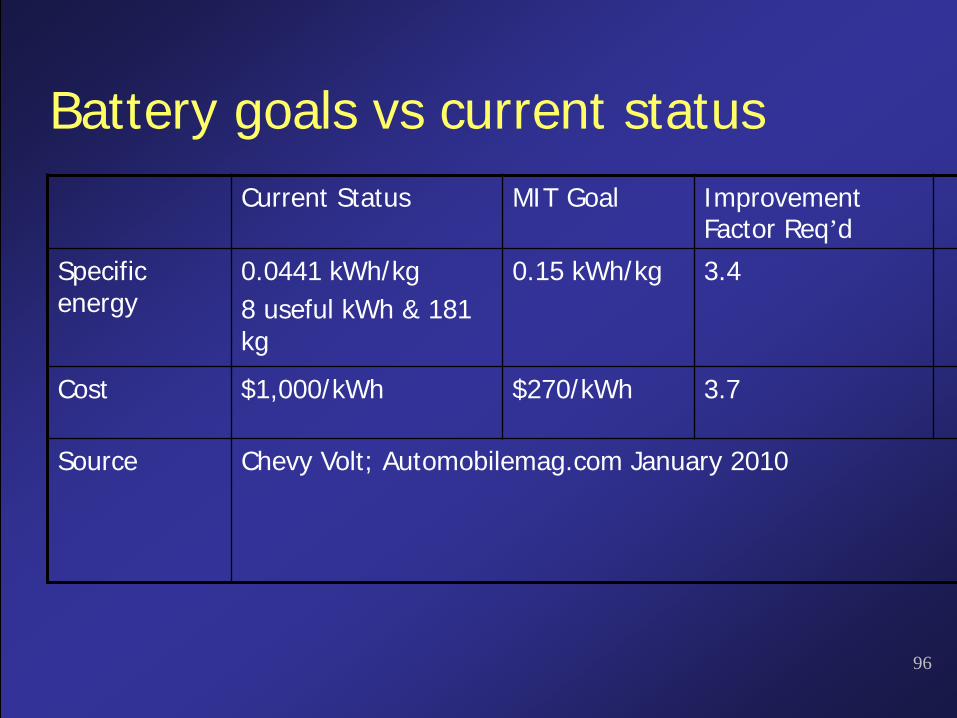
Battery goals vs current statusCurrent Status MIT Goal Improvement
Factor Req’dSpecific energy
0.0441 kWh/kg8 useful kWh & 181 kg
0.15 kWh/kg 3.4
Cost $1,000/kWh $270/kWh 3.7
Source Chevy Volt; Automobilemag.com January 2010
97
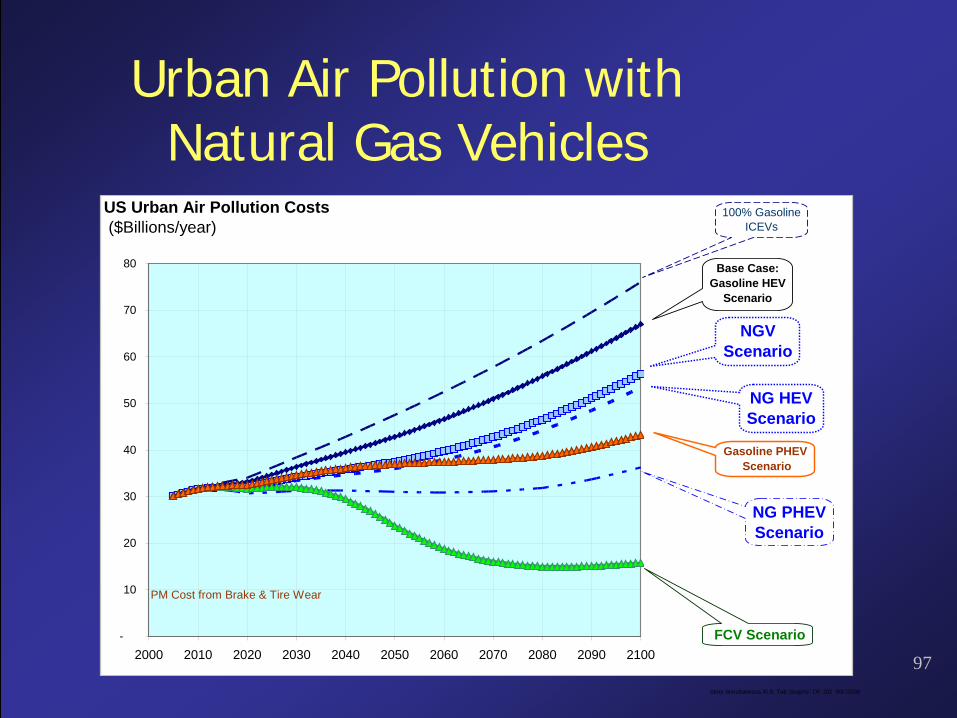
Urban Air Pollution withNatural Gas Vehicles
Story Simultaneous.XLS; Tab 'Graphs'; DF 102 9/8 /2008
-
10
20
30
40
50
60
70
80
2000 2010 2020 2030 2040 2050 2060 2070 2080 2090 2100 FCV Scenario
Gasoline PHEV Scenario
Base Case:Gasoline HEV
Scenario
100% GasolineICEVs
US Urban Air Pollution Costs ($Billions/year)
PM Cost from Brake & Tire Wear
NG PHEVScenario
NG HEVScenario
NGVScenario
98
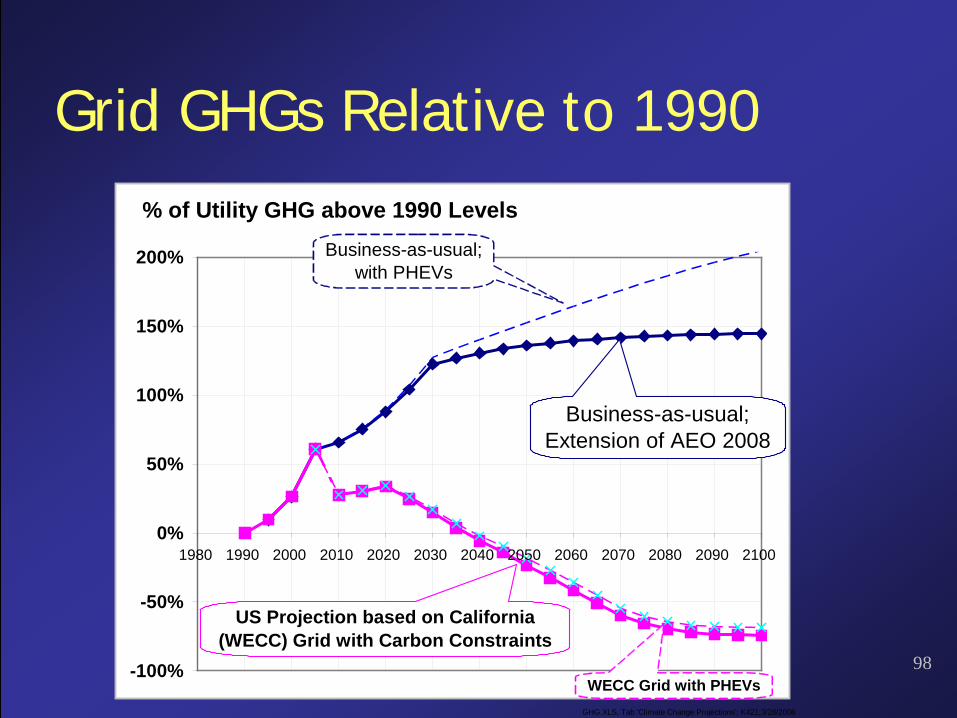
Grid GHGs Relative to 1990
GHG.XLS, Tab 'Climate Change Projections'; K421;3/28/2008
-100%
-50%
0%
50%
100%
150%
200%
1980 1990 2000 2010 2020 2030 2040 2050 2060 2070 2080 2090 2100
% of Utility GHG above 1990 Levels
Business-as-usual;Extension of AEO 2008
US Projection based on California (WECC) Grid with Carbon Constraints
Business-as-usual;with PHEVs
WECC Grid with PHEVs
99
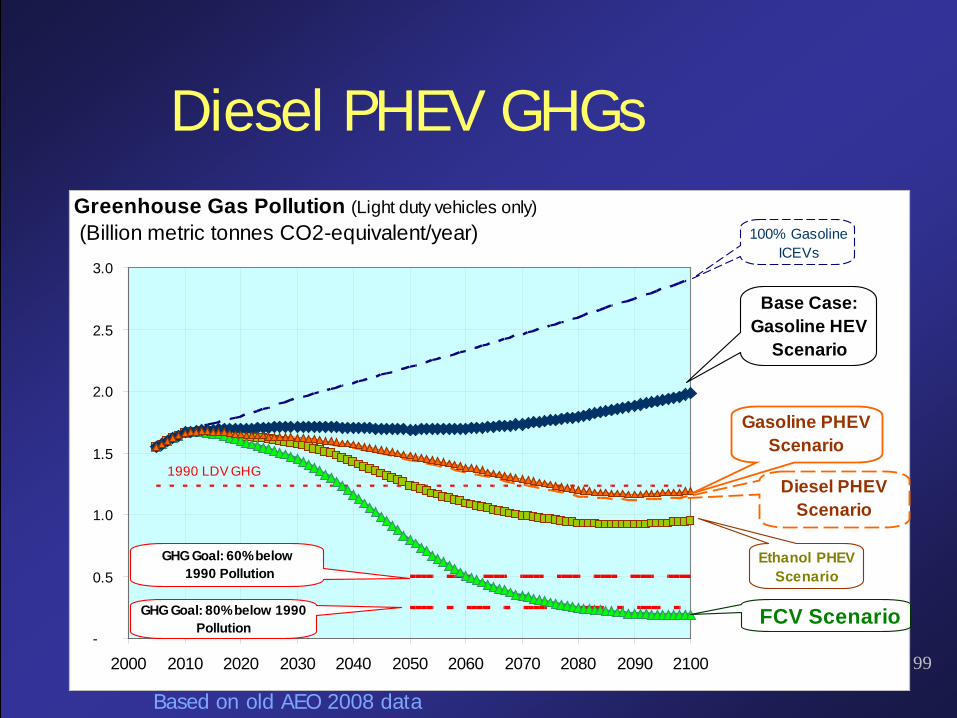
Diesel PHEV GHGs
-
0.5
1.0
1.5
2.0
2.5
3.0
2000 2010 2020 2030 2040 2050 2060 2070 2080 2090 2100
Greenhouse Gas Pollution (Light duty vehicles only) (Billion metric tonnes CO2-equivalent/year)
1990 LDV GHG
GHG Goal: 60% below 1990 Pollution
GHG Goal: 80% below 1990 Pollution FCV Scenario
Ethanol PHEVScenario
Gasoline PHEV Scenario
Base Case:Gasoline HEV
Scenario
100% GasolineICEVs
Diesel PHEV Scenario
Based on old AEO 2008 data
100
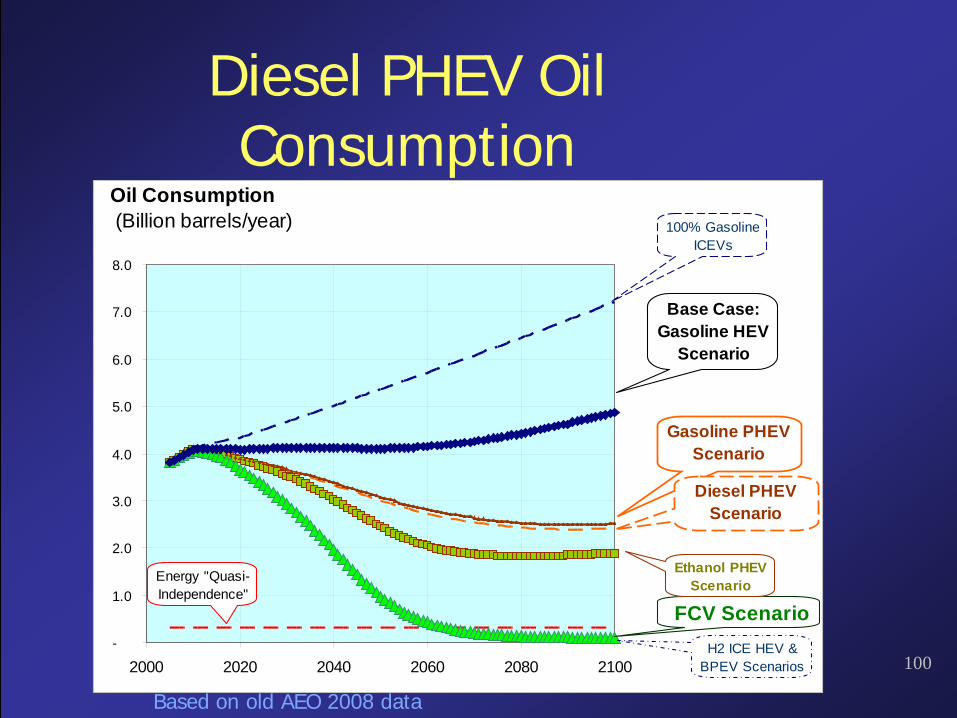
Diesel PHEV Oil Consumption
-
1.0
2.0
3.0
4.0
5.0
6.0
7.0
8.0
2000 2020 2040 2060 2080 2100
Oil Consumption (Billion barrels/year)
FCV Scenario
Gasoline PHEV Scenario
Ethanol PHEVScenario
Base Case:Gasoline HEV
Scenario
100% GasolineICEVs
Energy "Quasi-Independence"
H2 ICE HEV &BPEV Scenarios
Diesel PHEV Scenario
Based on old AEO 2008 data
101
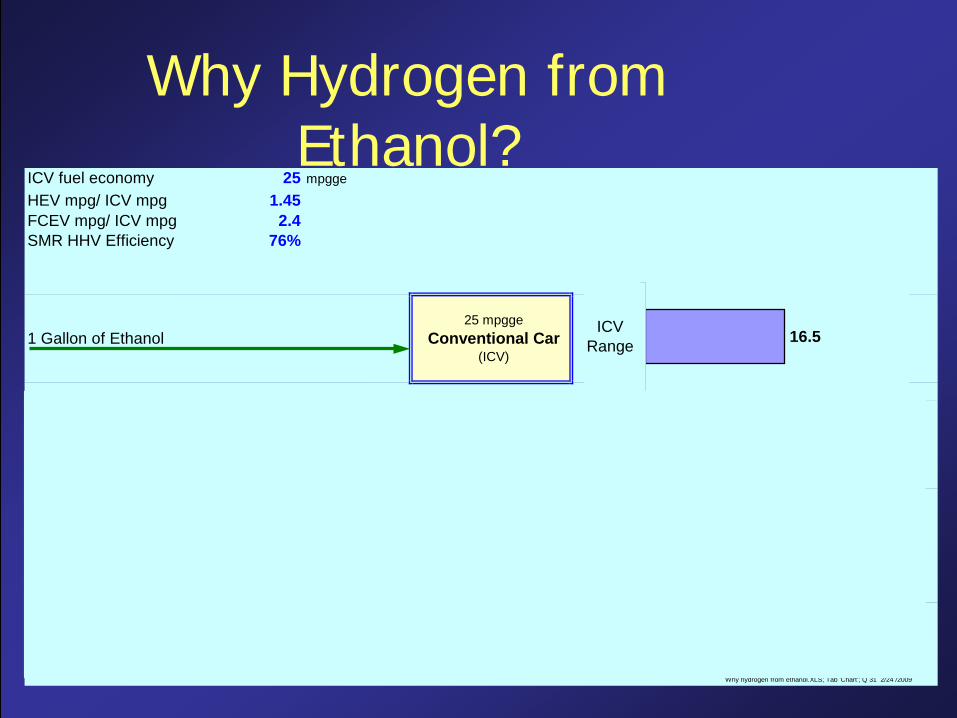
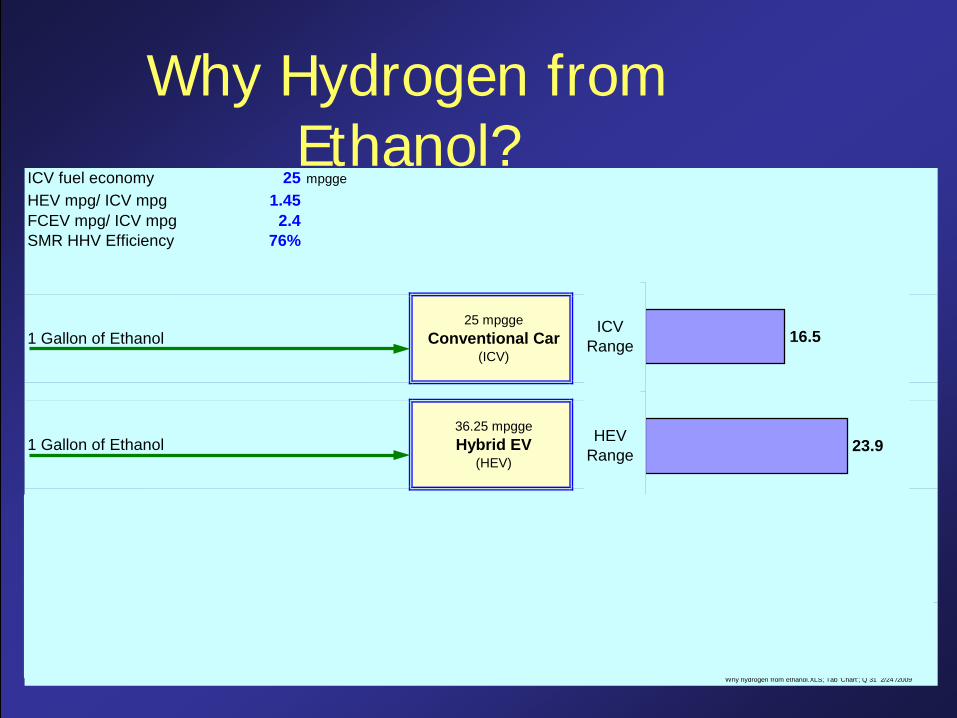
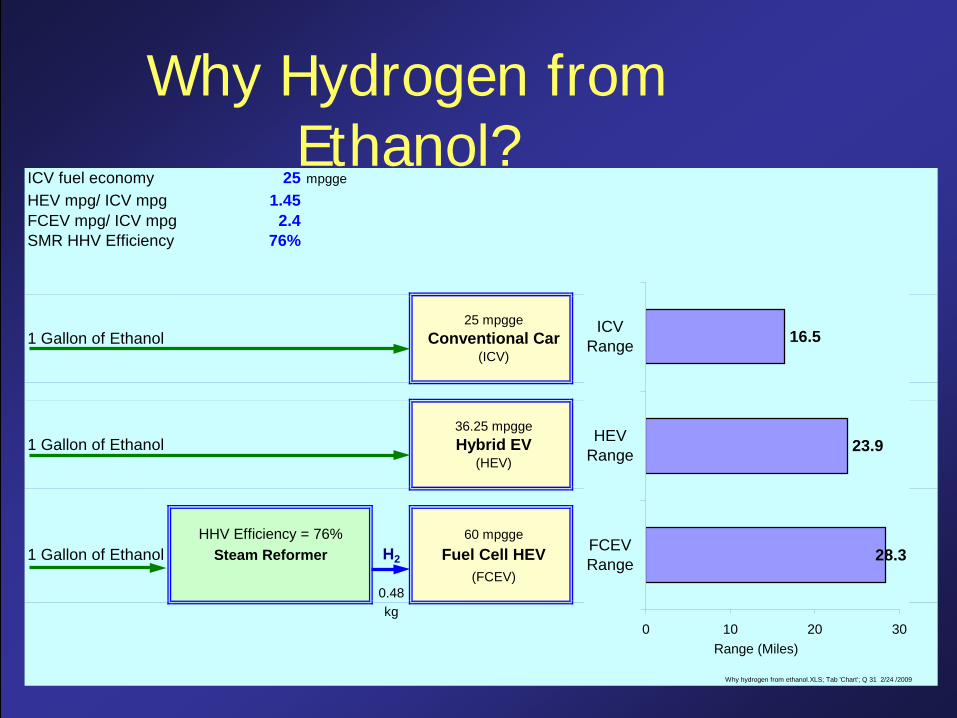
ICV fuel economy 25 mpgge
HEV mpg/ ICV mpg 1.45FCEV mpg/ ICV mpg 2.4 w/r to ICV: 1.72SMR HHV Efficiency 76% w/r to HEV 1.19
25 mpgge1 Gallon of Ethanol Conventional Car 25.0
(ICV)
36.25 mpgge1 Gallon of Ethanol Hybrid EV 36.25
(HEV)
HHV Efficiency = 76% 60 mpgge1 Gallon of Ethanol Steam Reformer H2 Fuel Cell HEV 45.6
(FCEV)0.48kg
Why hydrogen from ethanol.XLS; Tab 'Chart'; Q 31 2/24 /2009
FCEV GHG & Oil Reduction Factors
28.3
23.9
16.5
0 10 20 30
FCEVRange
HEVRange
ICVRange
Range (Miles)
Why Hydrogen from Ethanol?
102
ICV fuel economy 25 mpgge
HEV mpg/ ICV mpg 1.45FCEV mpg/ ICV mpg 2.4 w/r to ICV: 1.72SMR HHV Efficiency 76% w/r to HEV 1.19
25 mpgge1 Gallon of Ethanol Conventional Car 25.0
(ICV)
36.25 mpgge1 Gallon of Ethanol Hybrid EV 36.25
(HEV)
HHV Efficiency = 76% 60 mpgge1 Gallon of Ethanol Steam Reformer H2 Fuel Cell HEV 45.6
(FCEV)0.48kg
Why hydrogen from ethanol.XLS; Tab 'Chart'; Q 31 2/24 /2009
FCEV GHG & Oil Reduction Factors
28.3
23.9
16.5
0 10 20 30
FCEVRange
HEVRange
ICVRange
Range (Miles)
Why Hydrogen from Ethanol?
103
ICV fuel economy 25 mpgge
HEV mpg/ ICV mpg 1.45FCEV mpg/ ICV mpg 2.4 w/r to ICV: 1.72SMR HHV Efficiency 76% w/r to HEV 1.19
25 mpgge1 Gallon of Ethanol Conventional Car 25.0
(ICV)
36.25 mpgge1 Gallon of Ethanol Hybrid EV 36.25
(HEV)
HHV Efficiency = 76% 60 mpgge1 Gallon of Ethanol Steam Reformer H2 Fuel Cell HEV 45.6
(FCEV)0.48kg
Why hydrogen from ethanol.XLS; Tab 'Chart'; Q 31 2/24 /2009
FCEV GHG & Oil Reduction Factors
28.3
23.9
16.5
0 10 20 30
FCEVRange
HEVRange
ICVRange
Range (Miles)
Why Hydrogen from Ethanol?
104
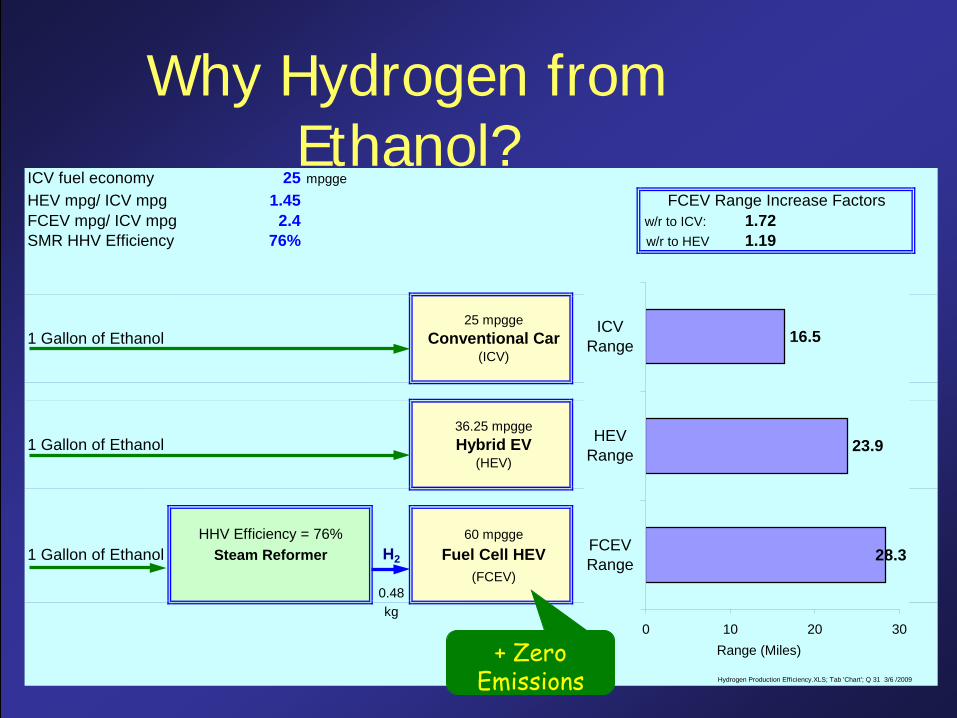
ICV fuel economy 25 mpgge
HEV mpg/ ICV mpg 1.45FCEV mpg/ ICV mpg 2.4 w/r to ICV: 1.72SMR HHV Efficiency 76% w/r to HEV 1.19
25 mpgge1 Gallon of Ethanol Conventional Car 25.0
(ICV)
36.25 mpgge1 Gallon of Ethanol Hybrid EV 36.25
(HEV)
HHV Efficiency = 76% 60 mpgge1 Gallon of Ethanol Steam Reformer H2 Fuel Cell HEV 45.6
(FCEV)0.48kg
Hydrogen Production Efficiency.XLS; Tab 'Chart'; Q 31 3/6 /2009
FCEV Range Increase Factors
28.3
23.9
16.5
0 10 20 30
FCEVRange
HEVRange
ICVRange
Range (Miles)
Why Hydrogen from Ethanol?
+ Zero Emissions
105
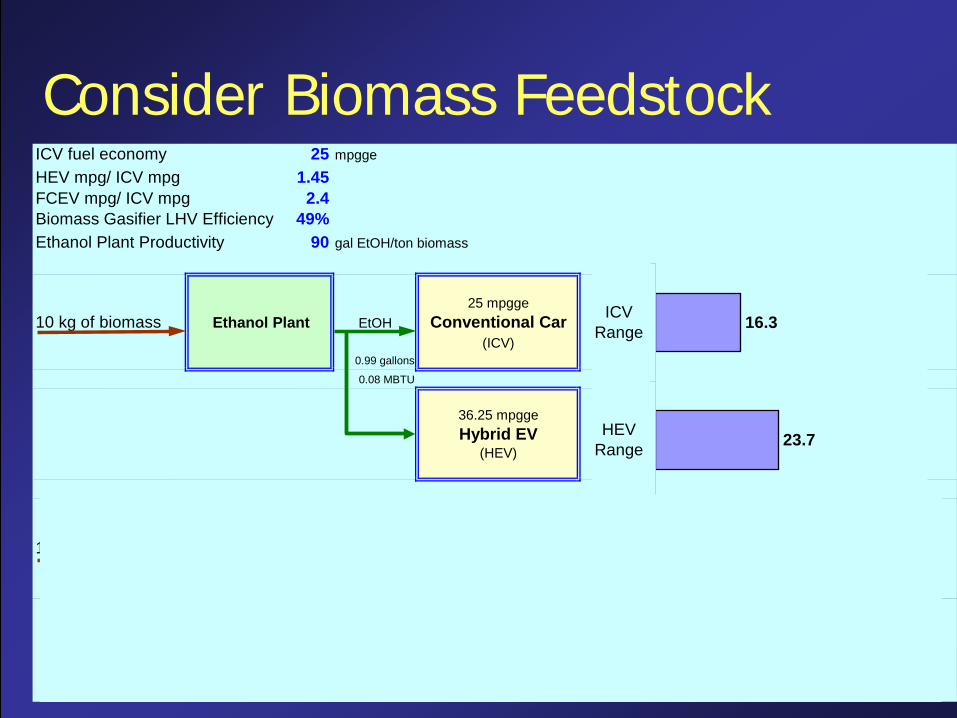
Consider Biomass FeedstockICV fuel economy 25 mpgge
HEV mpg/ ICV mpg 1.45FCEV mpg/ ICV mpg 2.4 w/r to ICV: 2.8Biomass Gasifier LHV Efficiency 49% w/r to HEV 1.9Ethanol Plant Productivity 90 gal EtOH/ton biomass
25 mpgge10 kg of biomass Ethanol Plant EtOH Conventional Car 25.0
(ICV)0.99 gallons
0.08 MBTU
36.25 mpggeHybrid EV 36.25
(HEV)
60 mpgge10 kg of biomass BCL* Indirect H2 Fuel Cell HEV #REF!
Gasifier (FCEV)0.77 kg
0.09 MBTU
BCL* = Battelle Columbus Laboratory Why hydrogen from ethanol.XLS; Tab 'Chart Biomass'; Q 32 2/24 /2009
FCEV GHG & Oil Reduction Factors
45.4
23.7
16.3
0 10 20 30 40 50
FCEVRange
HEVRange
ICVRange
Range (Miles)
106
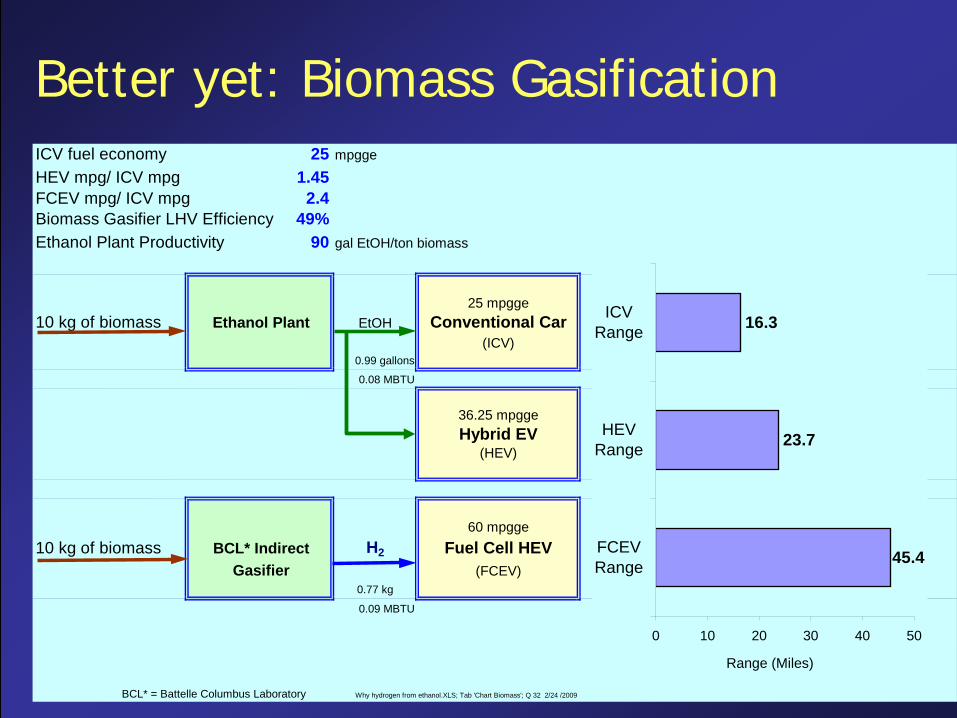
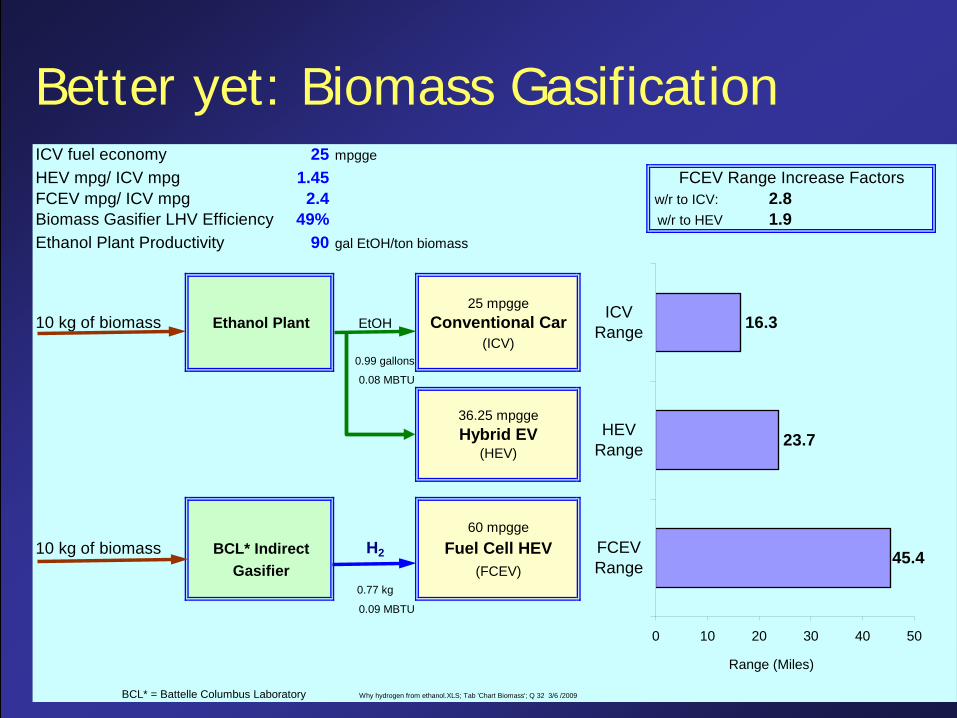
Better yet: Biomass GasificationICV fuel economy 25 mpgge
HEV mpg/ ICV mpg 1.45FCEV mpg/ ICV mpg 2.4 w/r to ICV: 2.8Biomass Gasifier LHV Efficiency 49% w/r to HEV 1.9Ethanol Plant Productivity 90 gal EtOH/ton biomass
25 mpgge10 kg of biomass Ethanol Plant EtOH Conventional Car 25.0
(ICV)0.99 gallons
0.08 MBTU
36.25 mpggeHybrid EV 36.25
(HEV)
60 mpgge10 kg of biomass BCL* Indirect H2 Fuel Cell HEV #REF!
Gasifier (FCEV)0.77 kg
0.09 MBTU
BCL* = Battelle Columbus Laboratory Why hydrogen from ethanol.XLS; Tab 'Chart Biomass'; Q 32 2/24 /2009
FCEV GHG & Oil Reduction Factors
45.4
23.7
16.3
0 10 20 30 40 50
FCEVRange
HEVRange
ICVRange
Range (Miles)
107
Better yet: Biomass GasificationICV fuel economy 25 mpgge
HEV mpg/ ICV mpg 1.45FCEV mpg/ ICV mpg 2.4 w/r to ICV: 2.8Biomass Gasifier LHV Efficiency 49% w/r to HEV 1.9Ethanol Plant Productivity 90 gal EtOH/ton biomass
25 mpgge10 kg of biomass Ethanol Plant EtOH Conventional Car 25.0
(ICV)0.99 gallons
0.08 MBTU
36.25 mpggeHybrid EV 36.25
(HEV)
60 mpgge10 kg of biomass BCL* Indirect H2 Fuel Cell HEV #REF!
Gasifier (FCEV)0.77 kg
0.09 MBTU
BCL* = Battelle Columbus Laboratory Why hydrogen from ethanol.XLS; Tab 'Chart Biomass'; Q 32 3/6 /2009
FCEV Range Increase Factors
45.4
23.7
16.3
0 10 20 30 40 50
FCEVRange
HEVRange
ICVRange
Range (Miles)
108
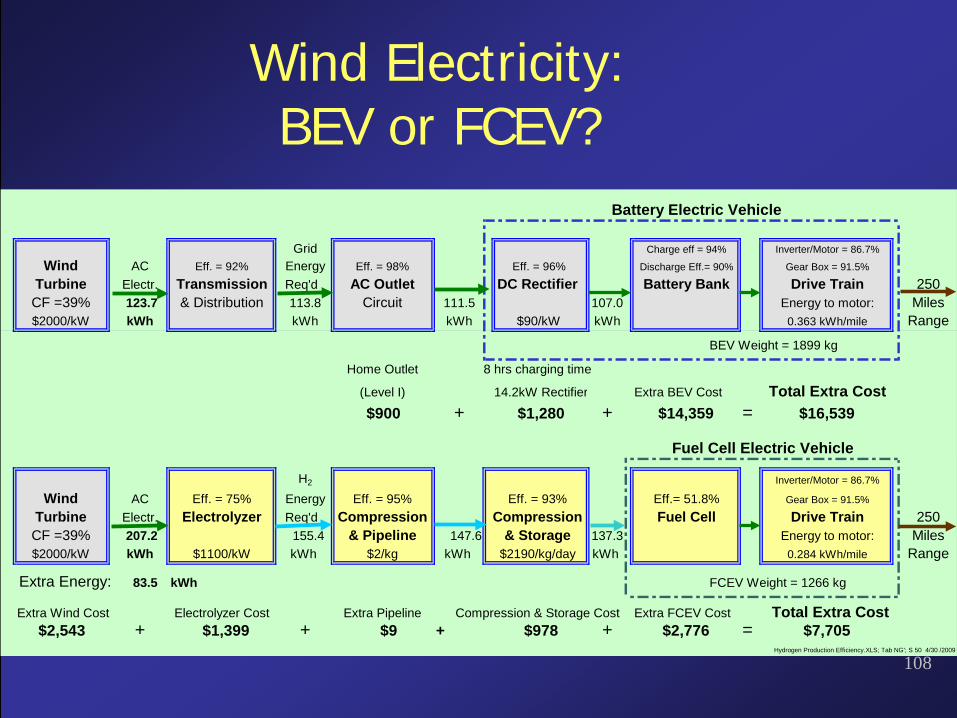
Wind Electricity:BEV or FCEV?
Grid Charge eff = 94% Inverter/Motor = 86.7%
Wind AC Eff. = 92% Energy Eff. = 98% Eff. = 96% Discharge Eff.= 90% Gear Box = 91.5%
Turbine Electr. Transmission Req'd AC Outlet DC Rectifier Battery Bank Drive Train 250CF =39% 123.7 & Distribution 113.8 Circuit 111.5 107.0 Energy to motor: Miles$2000/kW kWh kWh kWh $90/kW kWh 0.363 kWh/mile Range
BEV Weight = 1899 kg
Home Outlet 8 hrs charging time
(Level I) Extra BEV Cost Total Extra Cost+ + =
H2 Inverter/Motor = 86.7%
Wind AC Eff. = 75% Energy Eff. = 95% Eff. = 93% Eff.= 51.8% Gear Box = 91.5%
Turbine Electr. Electrolyzer Req'd Compression Compression Fuel Cell Drive Train 250CF =39% 207.2 155.4 & Pipeline 147.6 & Storage 137.3 Energy to motor: Miles$2000/kW kWh $1100/kW kWh $2/kg kWh $2190/kg/day kWh 0.284 kWh/mile Range
83.5 kWh FCEV Weight = 1266 kg
Extra Wind Cost Extra Pipeline Compression & Storage Cost Extra FCEV Cost+ + $9 + + =
Hydrogen Production Efficiency.XLS; Tab NG'; S 50 4/30 /2009
$14,359
$2,543Electrolyzer Cost
$1,399 $978 $2,776
Extra Energy:
$900
$7,705
Fuel Cell Electric Vehicle
$16,539
Total Extra Cost
Battery Electric Vehicle
14.2kW Rectifier
$1,280
109
Battery Power vs. Energy Trade-off
Ref: Kromer, Matthew & J.B. Heywood, “Electric Powertrains: Opportunities and Challenges in the U.S. Light-Duty Vehicle Fleet,” Sloan Automotive Laboratory, Massachusetts Institute of Technology, Publication Number LFEE 2007-03 RP, May 2007
Assumed Li-Ion Battery
110
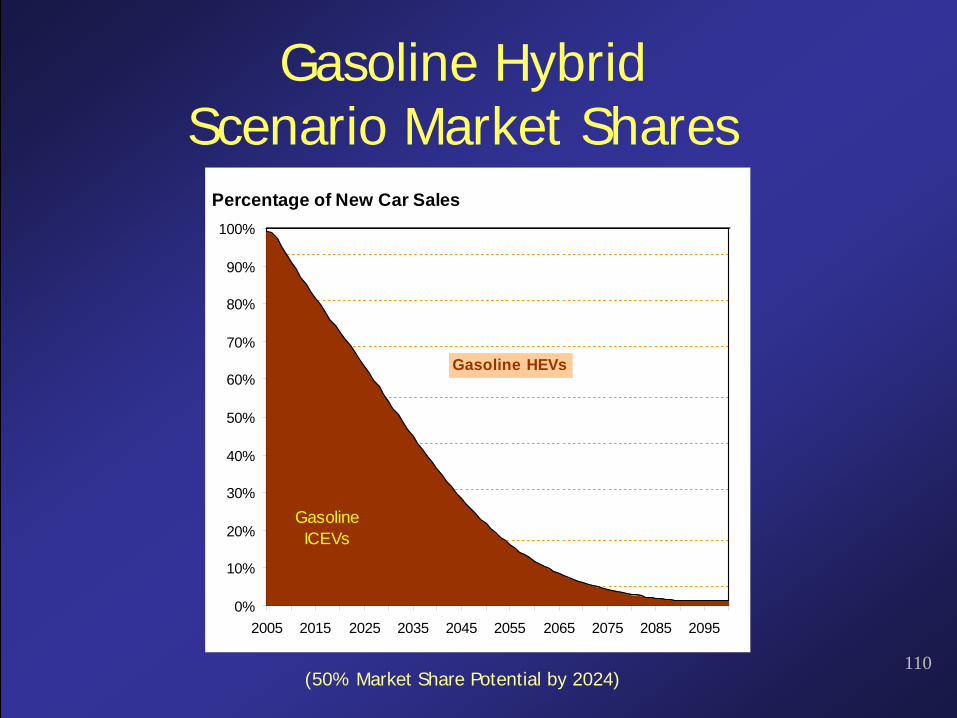
Gasoline Hybrid Scenario Market Shares
Percentage of New Car Sales
0%
10%
20%
30%
40%
50%
60%
70%
80%
90%
100%
2005 2015 2025 2035 2045 2055 2065 2075 2085 2095
GasolineICEVs
Gasoline HEVs
(50% Market Share Potential by 2024)
111
112
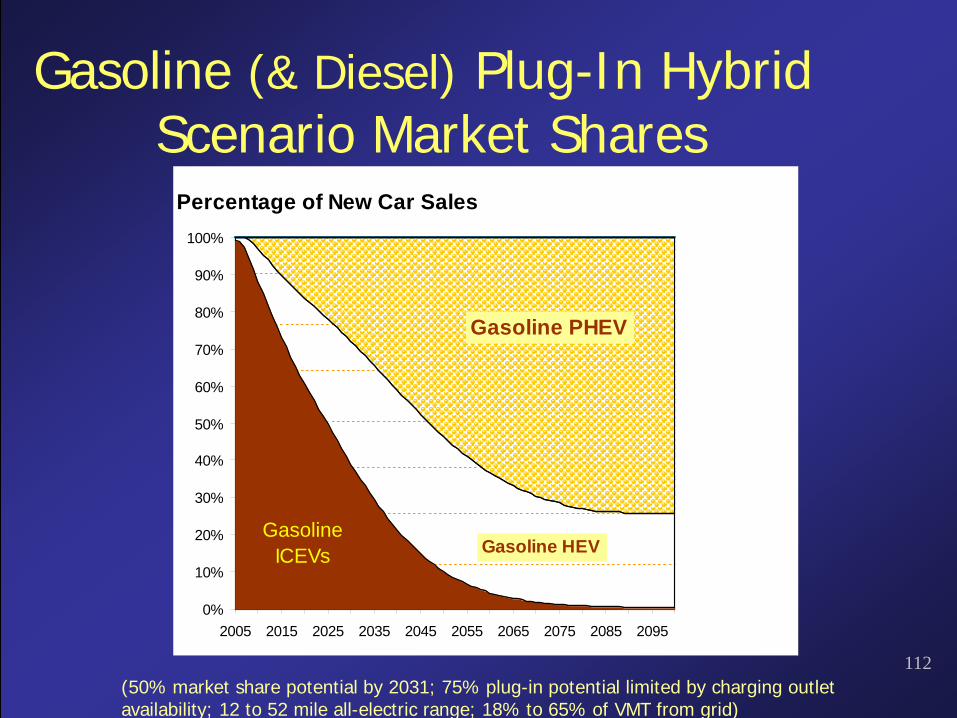
Gasoline (& Diesel) Plug-In HybridScenario Market Shares
Percentage of New Car Sales
0%
10%
20%
30%
40%
50%
60%
70%
80%
90%
100%
2005 2015 2025 2035 2045 2055 2065 2075 2085 2095
GasolineICEVs
Gasoline PHEV
Gasoline HEV
(50% market share potential by 2031; 75% plug-in potential limited by charging outlet availability; 12 to 52 mile all-electric range; 18% to 65% of VMT from grid)
113
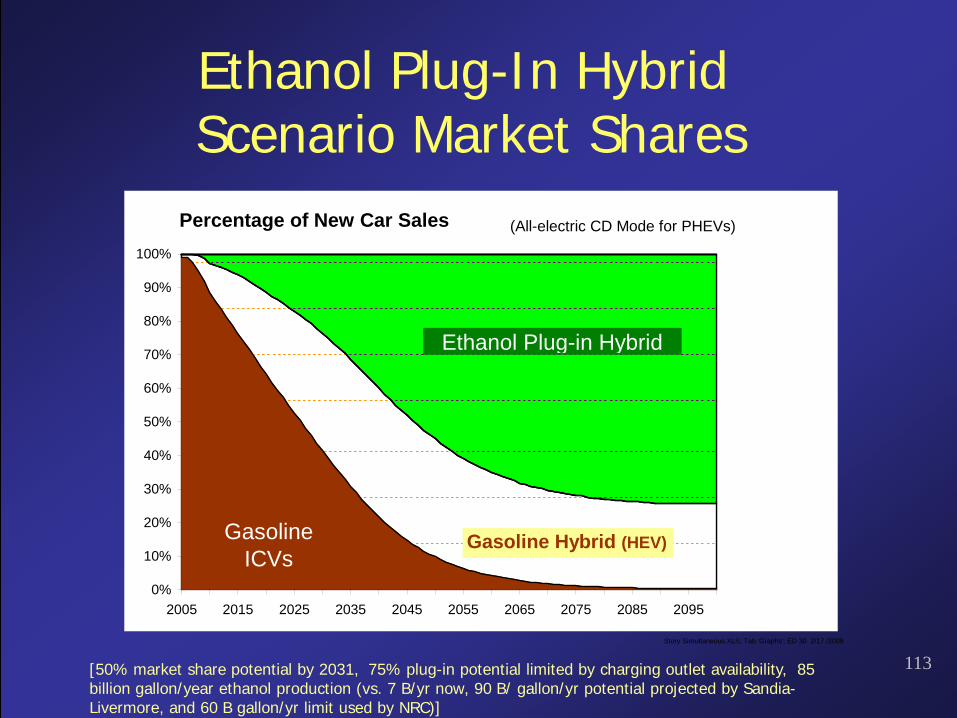
Ethanol Plug-In HybridScenario Market Shares
[50% market share potential by 2031, 75% plug-in potential limited by charging outlet availability, 85 billion gallon/year ethanol production (vs. 7 B/yr now, 90 B/ gallon/yr potential projected by Sandia-Livermore, and 60 B gallon/yr limit used by NRC)]
Story Simultaneous.XLS; Tab 'Graphs'; ED 30 2/17 /2009
Percentage of New Car Sales
0%
10%
20%
30%
40%
50%
60%
70%
80%
90%
100%
2005 2015 2025 2035 2045 2055 2065 2075 2085 2095
GasolineICVs
(All-electric CD Mode for PHEVs)
Ethanol Plug-in Hybrid
Gasoline Hybrid (HEV)
114Hydrogen Production Efficiency.XLS; Tab 'GREET'; J 53 3/6 /2009
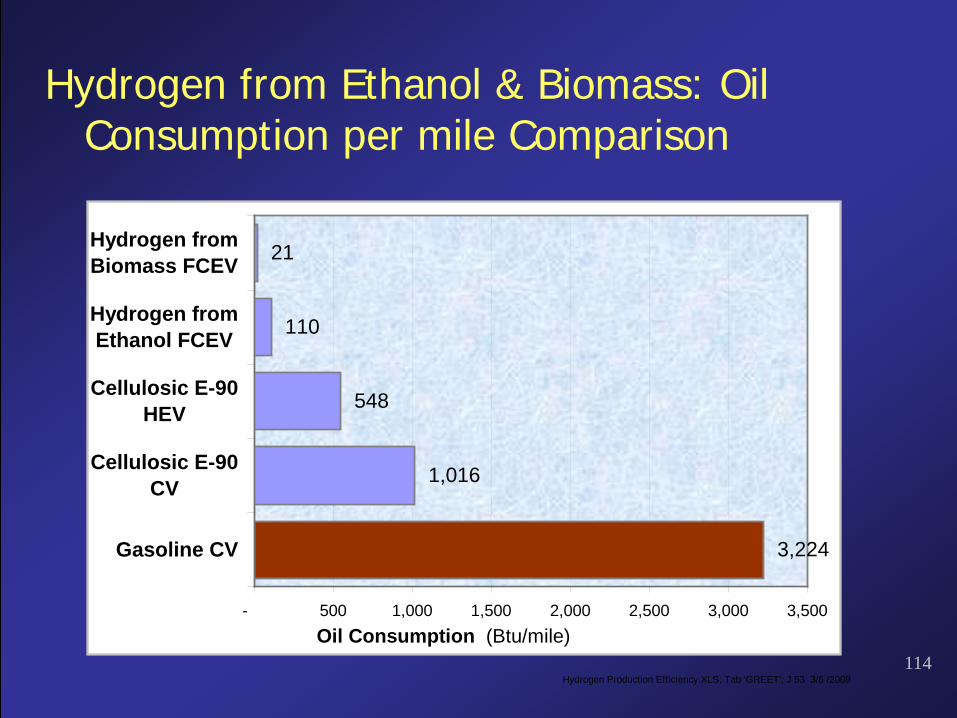
3,224
1,016
548
110
21
- 500 1,000 1,500 2,000 2,500 3,000 3,500
Gasoline CV
Cellulosic E-90CV
Cellulosic E-90HEV
Hydrogen fromEthanol FCEV
Hydrogen fromBiomass FCEV
Oil Consumption (Btu/mile)
Hydrogen from Ethanol & Biomass: Oil Consumption per mile Comparison
115
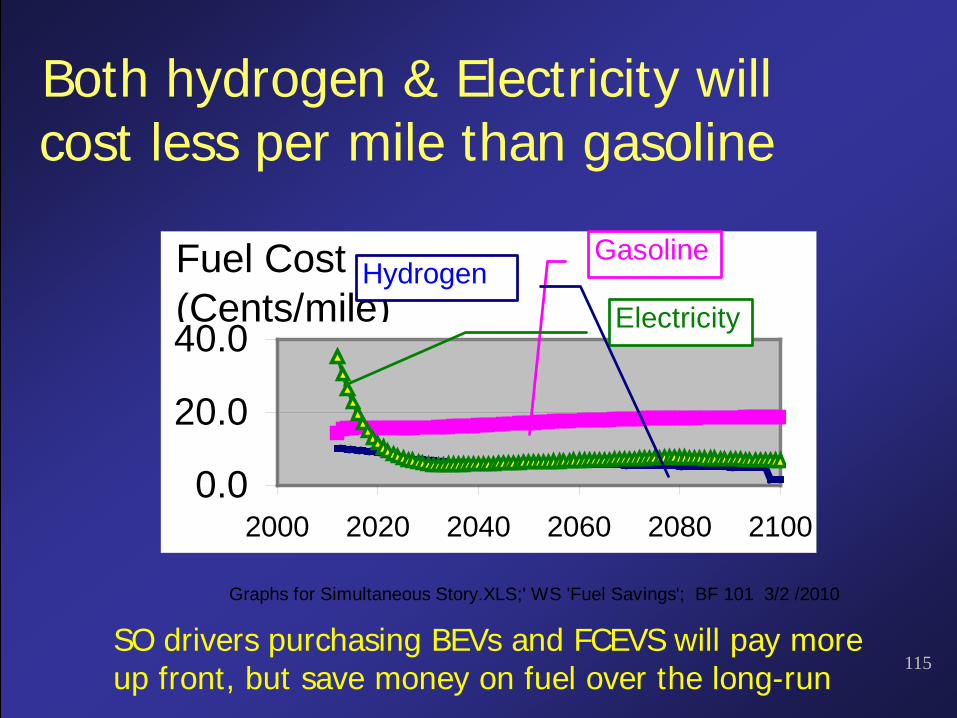
Both hydrogen & Electricity will cost less per mile than gasoline
Graphs for Simultaneous Story.XLS;' WS 'Fuel Savings'; BF 101 3/2 /2010
0.0
20.0
40.0
2000 2020 2040 2060 2080 2100
Fuel Cost(Cents/mile)
Gasoline
ElectricityHydrogen
SO drivers purchasing BEVs and FCEVS will pay more up front, but save money on fuel over the long-run
116
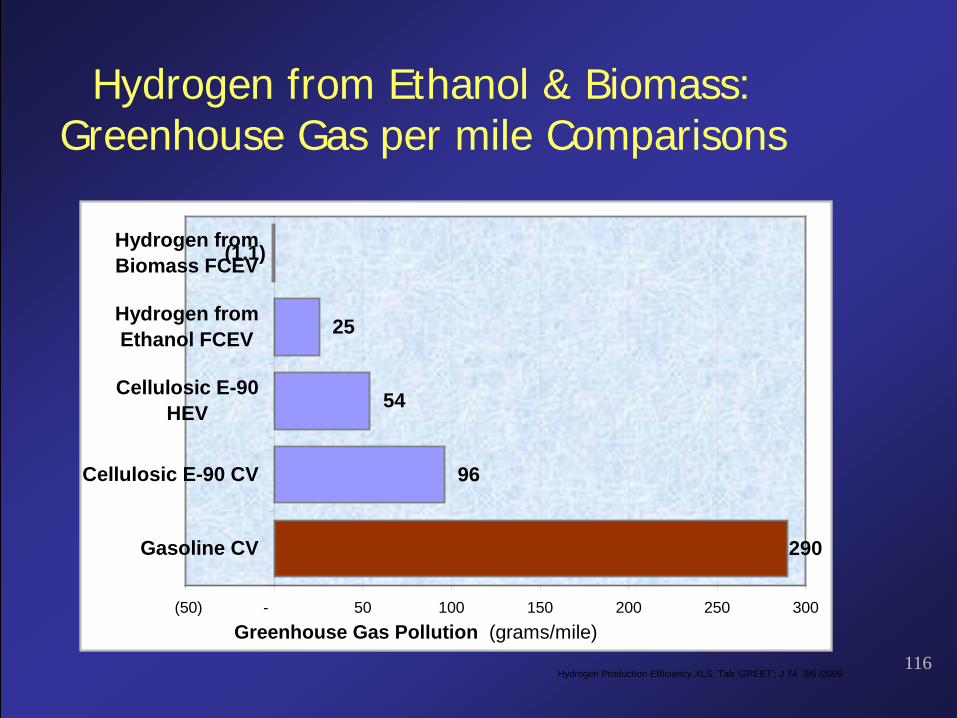
Hydrogen from Ethanol & Biomass: Greenhouse Gas per mile Comparisons
Hydrogen Production Efficiency.XLS; Tab 'GREET'; J 74 3/6 /2009
(1.1)
290
96
54
25
(50) - 50 100 150 200 250 300
Gasoline CV
Cellulosic E-90 CV
Cellulosic E-90HEV
Hydrogen fromEthanol FCEV
Hydrogen fromBiomass FCEV
Greenhouse Gas Pollution (grams/mile)
117
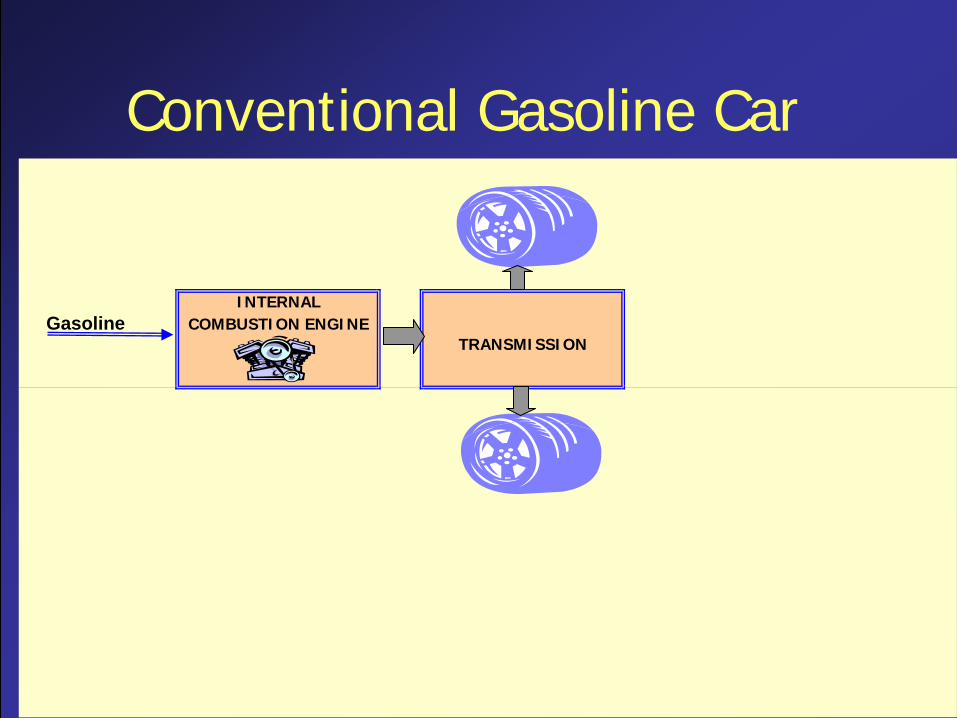
Conventional Gasoline Car
INTERNALGasoline COMBUSTION ENGINE
TRANSMISSION
118
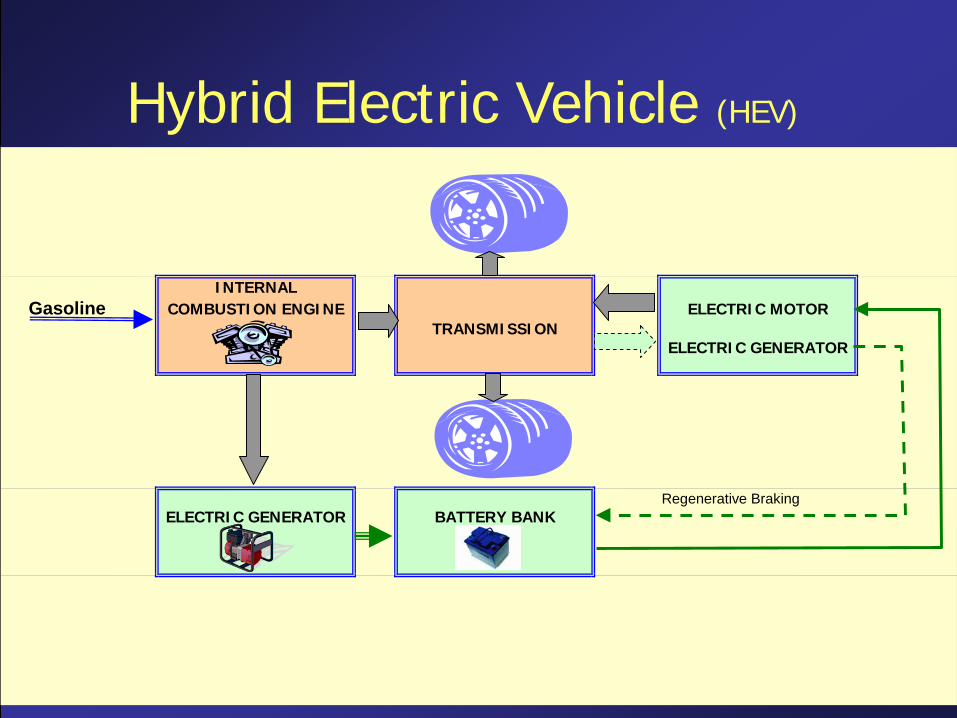
Hybrid Electric Vehicle (HEV)
INTERNALGasoline COMBUSTION ENGINE ELECTRIC MOTOR
TRANSMISSIONELECTRIC GENERATOR
Regenerative BrakingELECTRIC GENERATOR BATTERY BANK
119
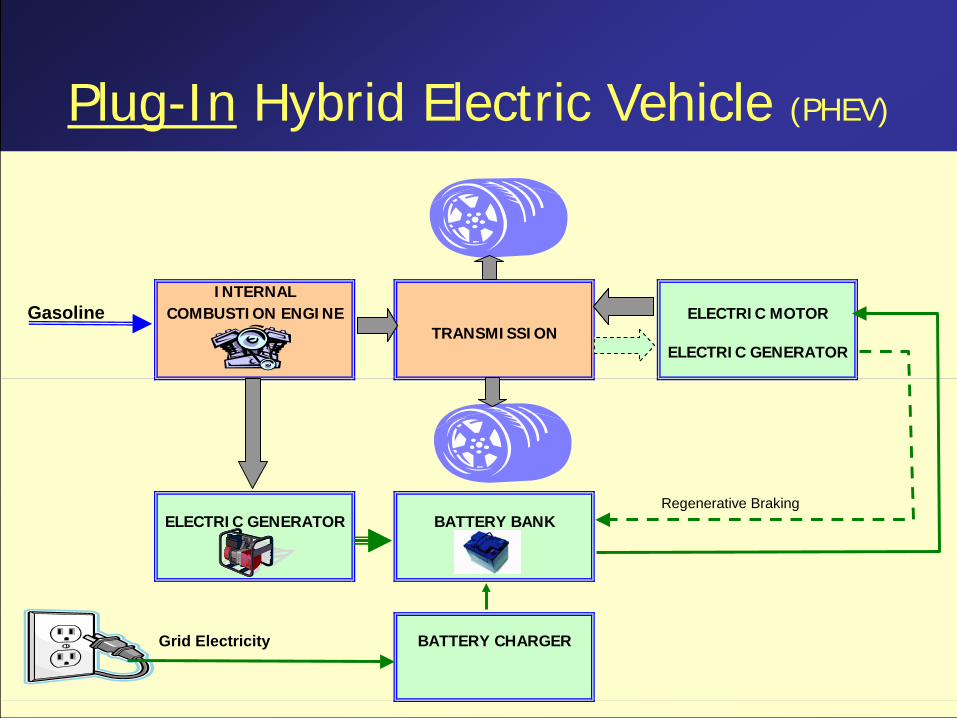
Plug-In Hybrid Electric Vehicle (PHEV)
INTERNALGasoline COMBUSTION ENGINE ELECTRIC MOTOR
TRANSMISSIONELECTRIC GENERATOR
Regenerative BrakingELECTRIC GENERATOR BATTERY BANK
Grid Electricity BATTERY CHARGER
120
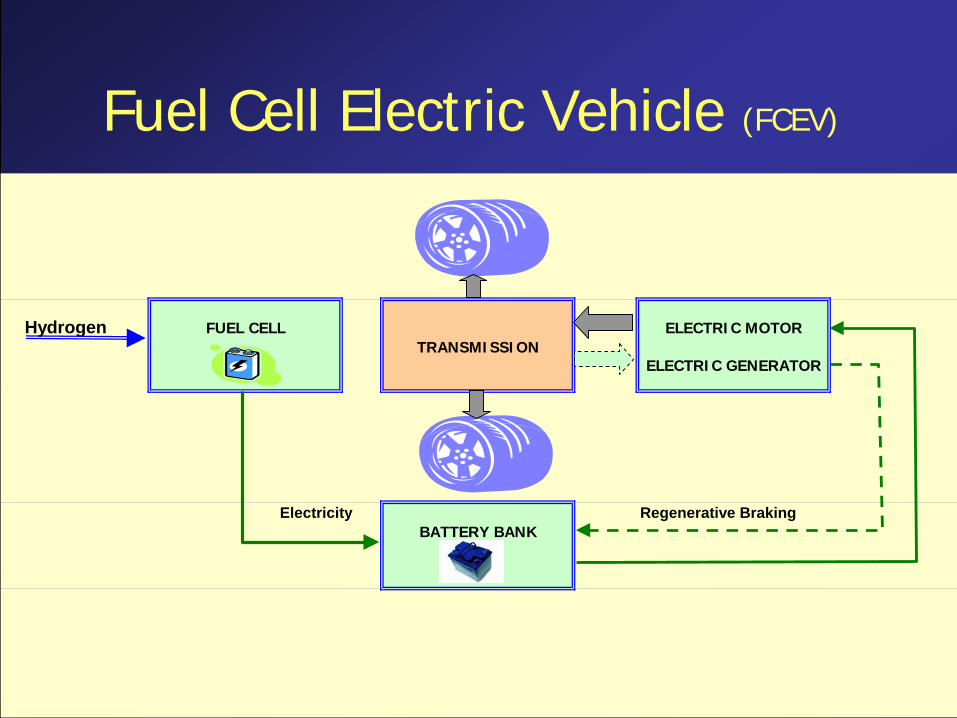
Fuel Cell Electric Vehicle (FCEV)
Hydrogen FUEL CELL ELECTRIC MOTORTRANSMISSION
ELECTRIC GENERATOR
Electricity Regenerative BrakingBATTERY BANK
121
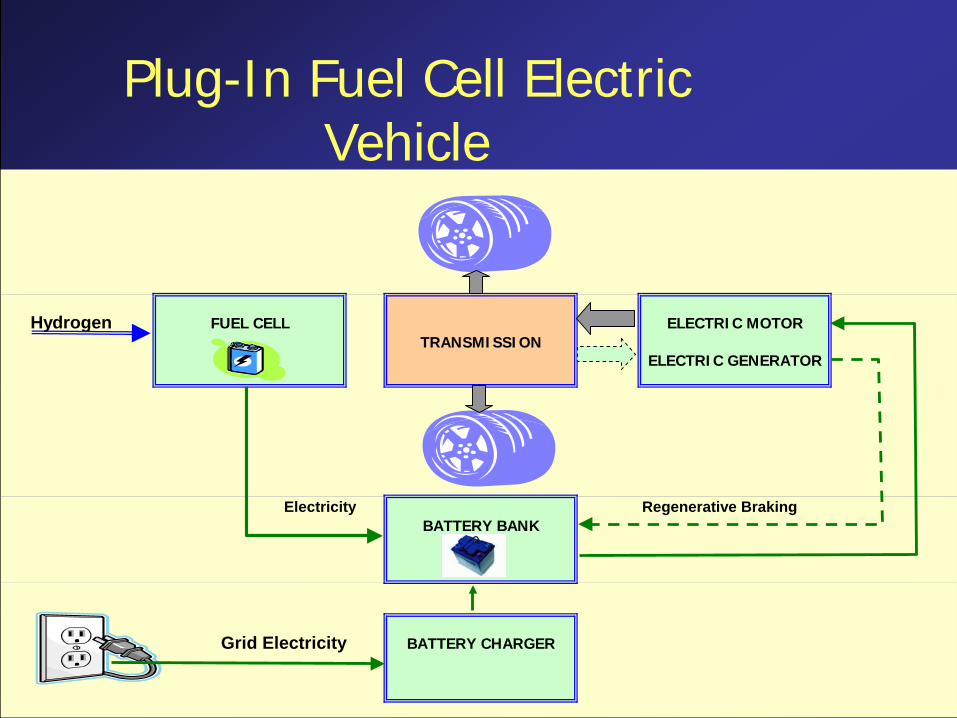
Plug-In Fuel Cell Electric Vehicle
Hydrogen FUEL CELL ELECTRIC MOTORTRANSMISSION
ELECTRIC GENERATOR
Electricity Regenerative BrakingBATTERY BANK
Grid Electricity BATTERY CHARGER
122
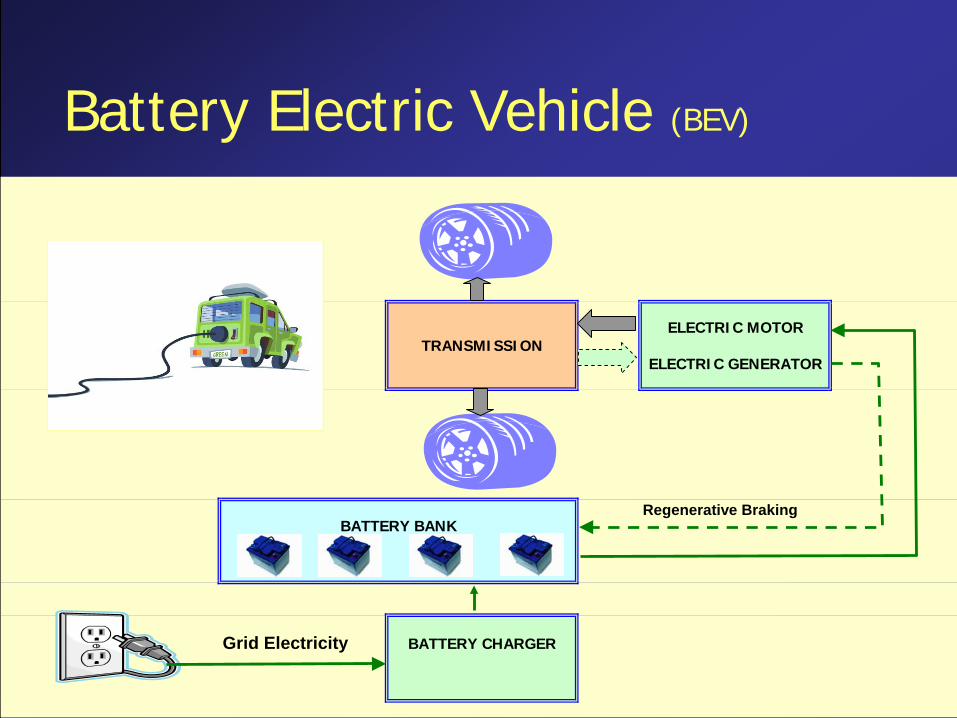
Battery Electric Vehicle (BEV)
ELECTRIC MOTORTRANSMISSION
ELECTRIC GENERATOR
Regenerative Braking
Grid Electricity BATTERY CHARGER
BATTERY BANK
123
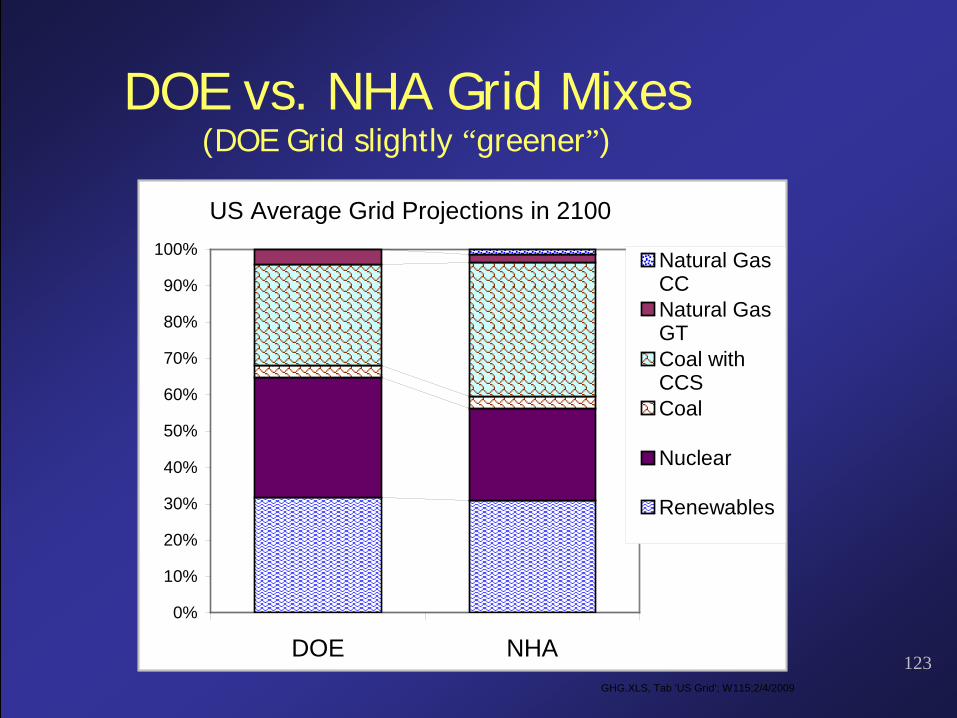
DOE vs. NHA Grid Mixes(DOE Grid slightly “greener”)
GHG.XLS, Tab 'US Grid'; W115;2/4/2009
0%
10%
20%
30%
40%
50%
60%
70%
80%
90%
100%
DOE NHA
Natural GasCCNatural GasGTCoal withCCSCoal
Nuclear
Renewables
US Average Grid Projections in 2100
124
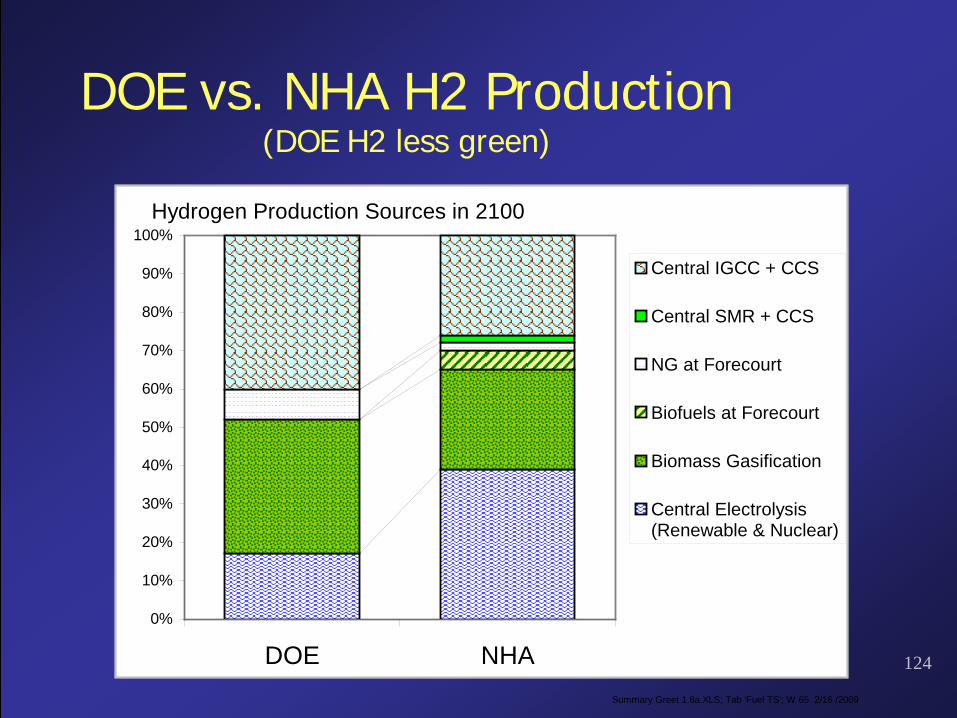
DOE vs. NHA H2 Production(DOE H2 less green)
Summary Greet 1.8a.XLS; Tab 'Fuel TS'; W 65 2/16 /2009
0%
10%
20%
30%
40%
50%
60%
70%
80%
90%
100%
DOE NHA
Central IGCC + CCS
Central SMR + CCS
NG at Forecourt
Biofuels at Forecourt
Biomass Gasification
Central Electrolysis(Renewable & Nuclear)
Hydrogen Production Sources in 2100
125
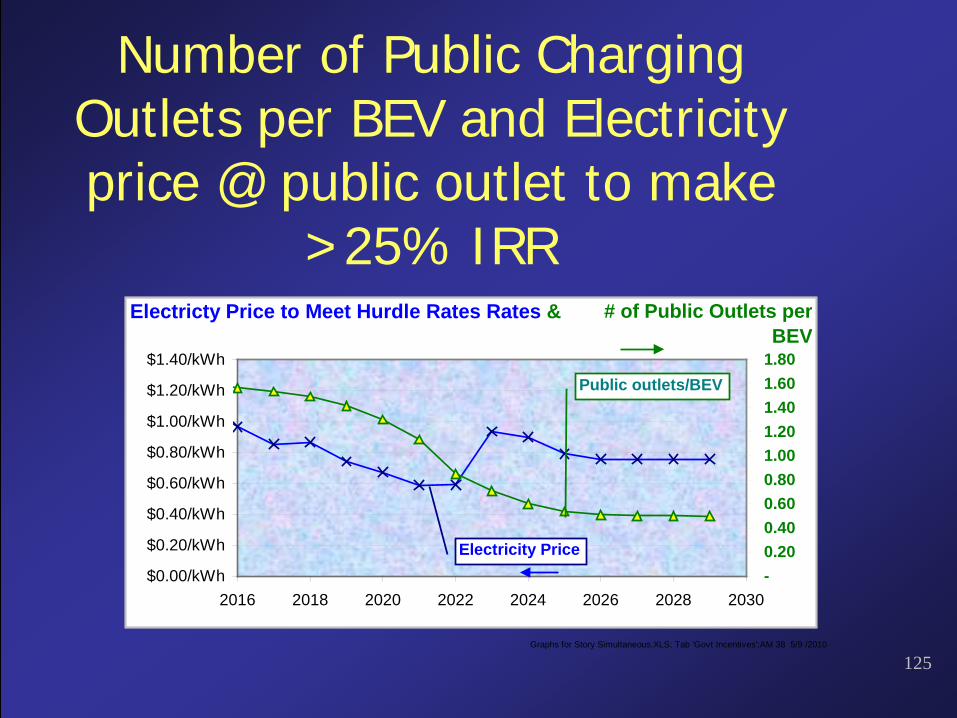
Number of Public Charging Outlets per BEV and Electricity price @ public outlet to make
>25% IRR
Graphs for Story Simultaneous.XLS; Tab 'Govt Incentives';AM 38 5/9 /2010
$0.00/kWh
$0.20/kWh
$0.40/kWh
$0.60/kWh
$0.80/kWh
$1.00/kWh
$1.20/kWh
$1.40/kWh
2016 2018 2020 2022 2024 2026 2028 2030-0.200.400.600.801.001.201.401.601.80
Electricty Price to Meet Hurdle Rates Rates & b f bli l BEV
# of Public Outlets per BEV
Public outlets/BEV
Electricity Price
126
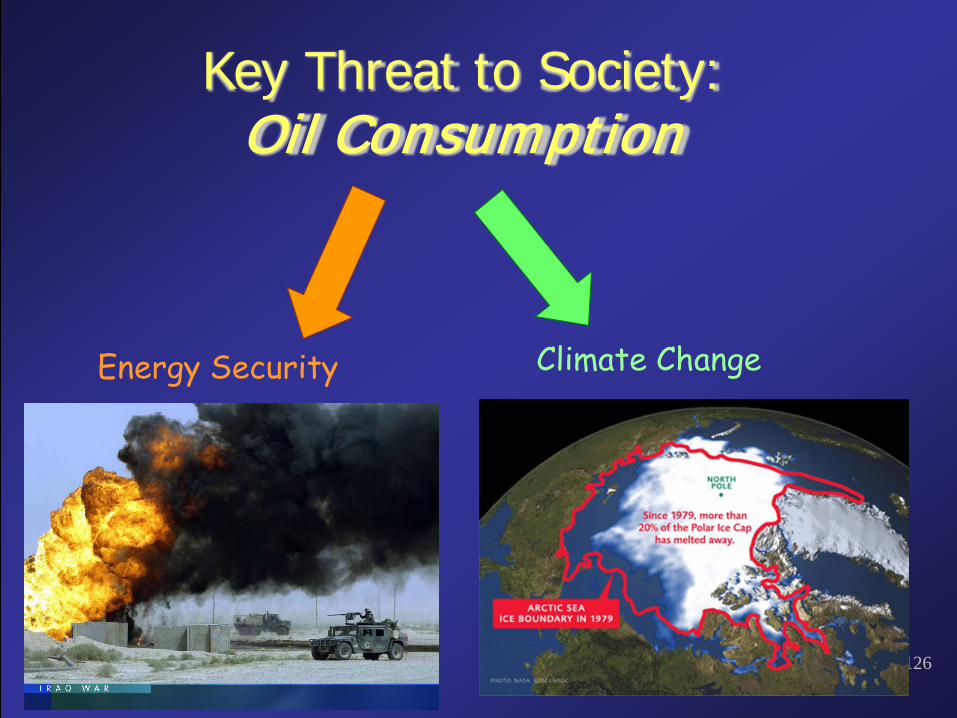
Key Threat to Society:Oil Consumption
Energy Security Climate Change
127
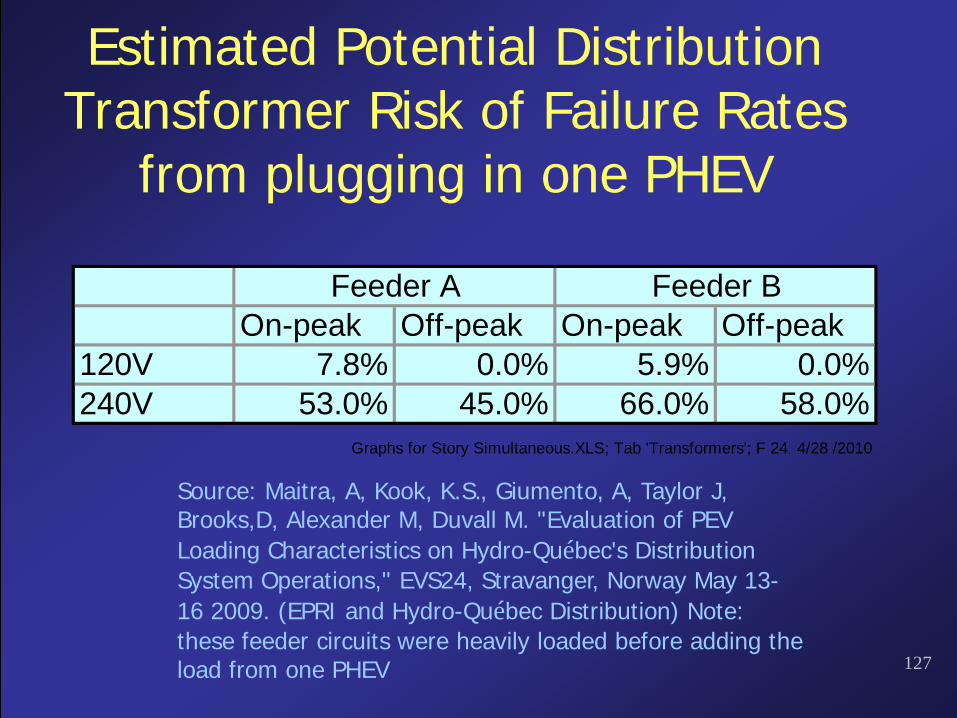
Estimated Potential Distribution Transformer Risk of Failure Rates
from plugging in one PHEV
On-peak Off-peak On-peak Off-peak120V 7.8% 0.0% 5.9% 0.0%240V 53.0% 45.0% 66.0% 58.0%
Graphs for Story Simultaneous.XLS; Tab 'Transformers'; F 24 4/28 /2010
Feeder A Feeder B
Source: Maitra, A, Kook, K.S., Giumento, A, Taylor J, Brooks,D, Alexander M, Duvall M. "Evaluation of PEV Loading Characteristics on Hydro-Québec's Distribution System Operations," EVS24, Stravanger, Norway May 13-16 2009. (EPRI and Hydro-Québec Distribution) Note: these feeder circuits were heavily loaded before adding the load from one PHEV
128
Investments do NOT include Local Distribution Transformers
• EPRI analyzed 53 residential Neighborhoods• They estimated that plugging in one PHEV
during the day would overload36 of the 53 distribution transformers (68%), and plugging in just one PHEV at night would overload 5 of 53(9%)neighborhood transformers. [Each transformer serves 5 to 15 homes.]
• At a cost of $5,000 per transformer, the cost per PHEV or BEV would increase substantially
Source: The Electrification Roadmap, page 102
129
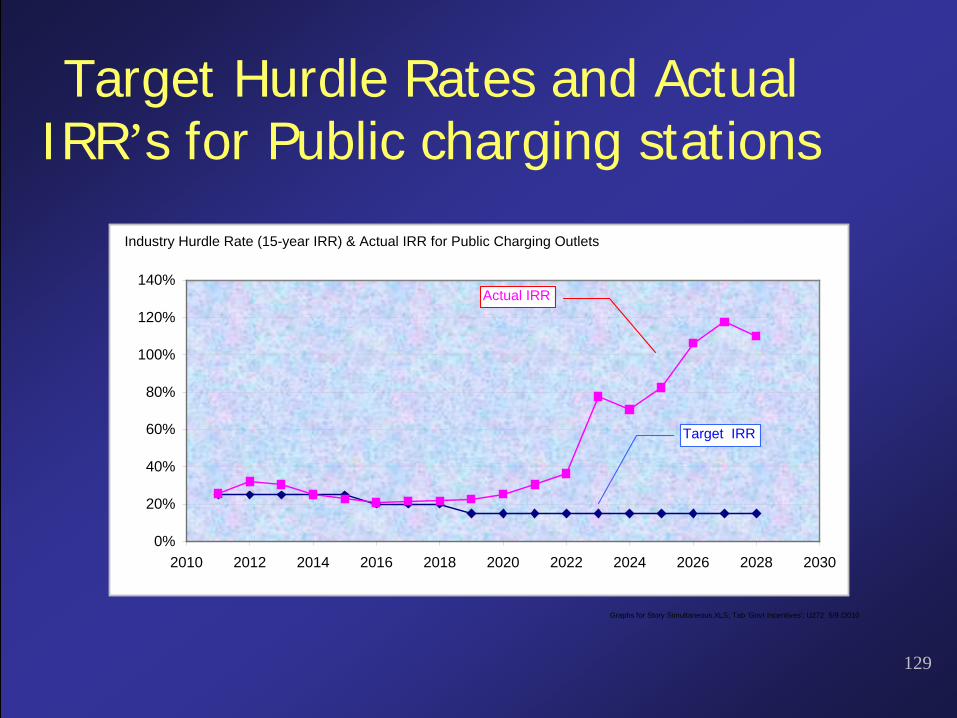
Target Hurdle Rates and Actual IRR’s for Public charging stations
Graphs for Story Simultaneous.XLS; Tab 'Govt Incentives'; U272 5/9 /2010
0%
20%
40%
60%
80%
100%
120%
140%
2010 2012 2014 2016 2018 2020 2022 2024 2026 2028 2030
Industry Hurdle Rate (15-year IRR) & Actual IRR for Public Charging Outlets
Actual IRR
Target IRR
130
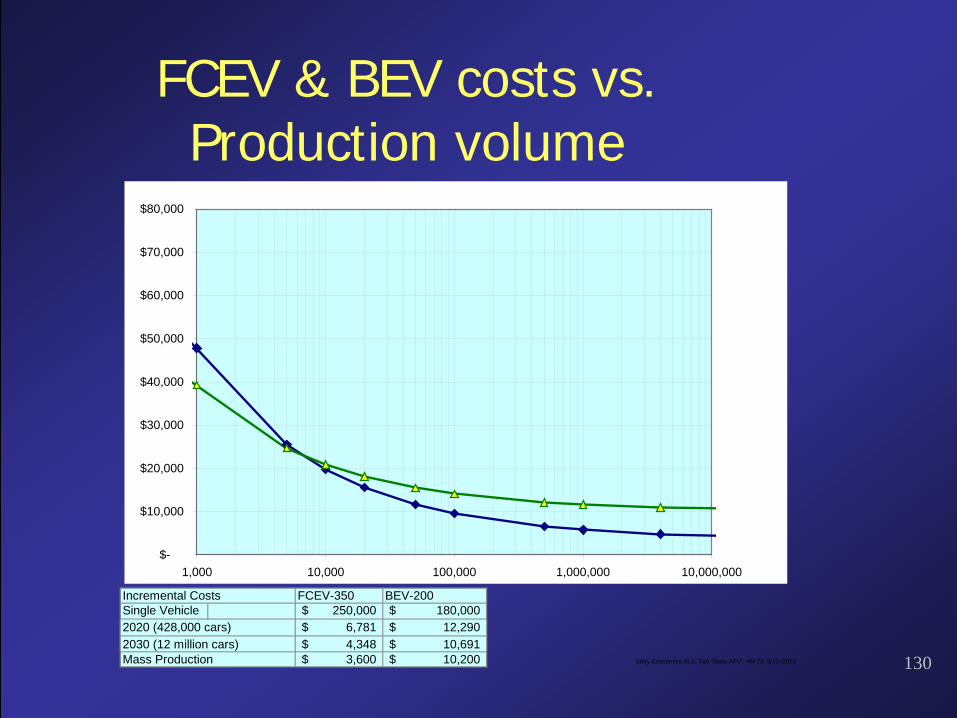
FCEV & BEV costs vs. Production volume
Incremental Costs FCEV-350 BEV-200Single Vehicle 250,000$ 180,000$ 2020 (428,000 cars) 6,781$ 12,290$ 2030 (12 million cars) 4,348$ 10,691$ Mass Production 3,600$ 10,200$ Story Economics.XLS; Tab 'Static AFV'; AM 73 5/10 /2010
$-
$10,000
$20,000
$30,000
$40,000
$50,000
$60,000
$70,000
$80,000
1,000 10,000 100,000 1,000,000 10,000,000
131
Industry IRR Hurdle rates & Actual IRRs for infrastructure
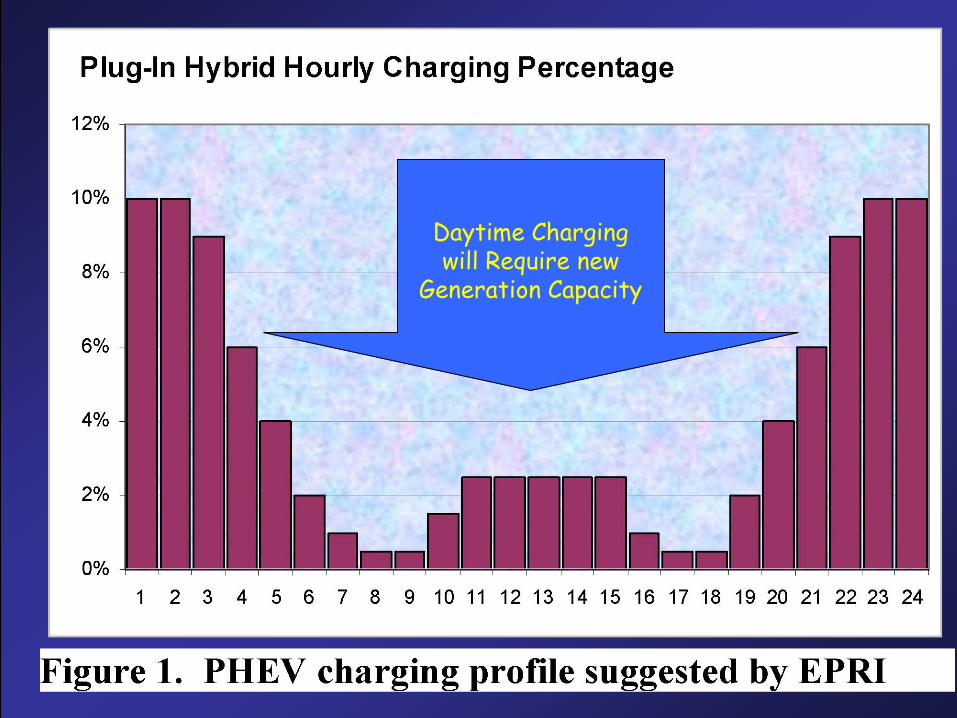
132
Daytime Chargingwill Require new
Generation Capacity
133
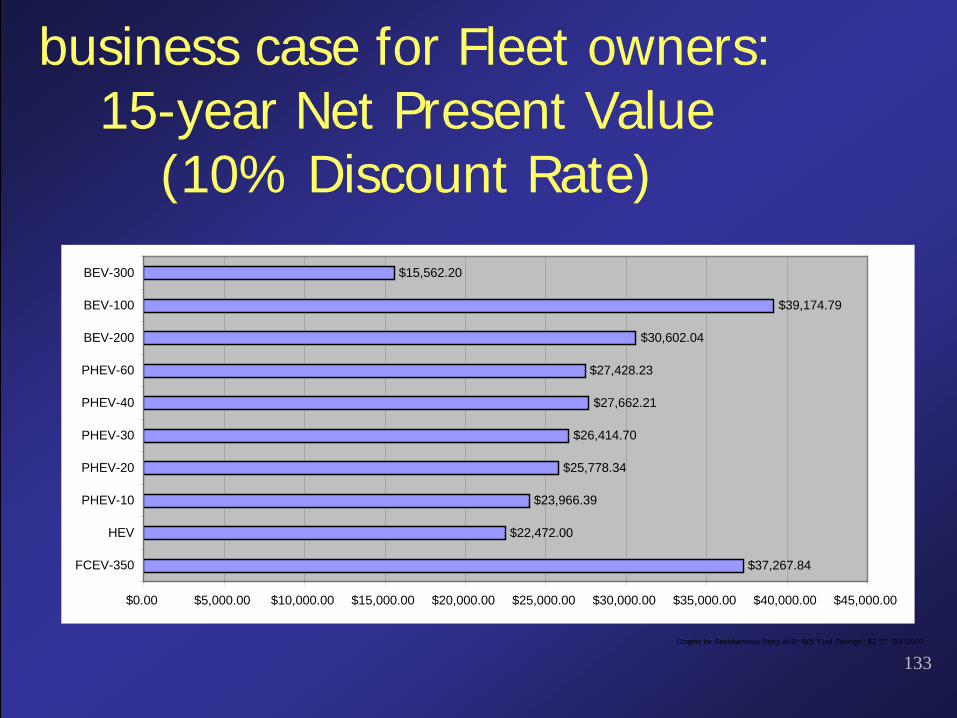
business case for Fleet owners: 15-year Net Present Value
(10% Discount Rate)
Graphs for Simultaneous Story.XLS;' WS 'Fuel Savings'; BZ 27 3/3 /2010
$37,267.84
$22,472.00
$23,966.39
$25,778.34
$26,414.70
$27,662.21
$27,428.23
$30,602.04
$39,174.79
$15,562.20
$0.00 $5,000.00 $10,000.00 $15,000.00 $20,000.00 $25,000.00 $30,000.00 $35,000.00 $40,000.00 $45,000.00
FCEV-350
HEV
PHEV-10
PHEV-20
PHEV-30
PHEV-40
PHEV-60
BEV-200
BEV-100
BEV-300
134
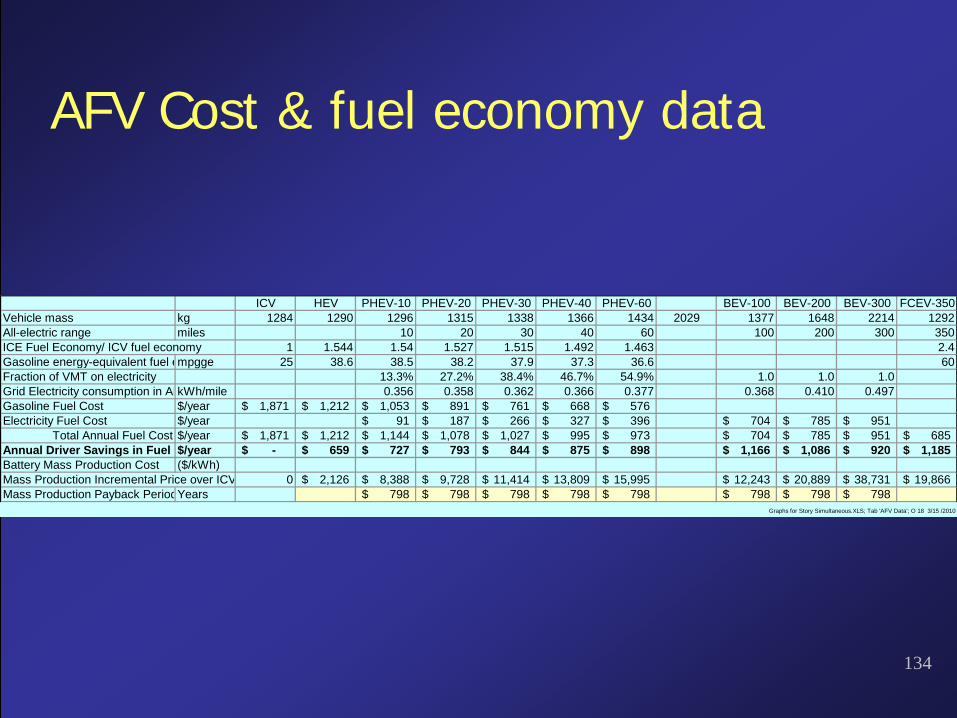
AFV Cost & fuel economy data
ICV HEV PHEV-10 PHEV-20 PHEV-30 PHEV-40 PHEV-60 BEV-100 BEV-200 BEV-300 FCEV-350Vehicle mass kg 1284 1290 1296 1315 1338 1366 1434 2029 1377 1648 2214 1292All-electric range miles 10 20 30 40 60 100 200 300 350ICE Fuel Economy/ ICV fuel economy 1 1.544 1.54 1.527 1.515 1.492 1.463 2.4Gasoline energy-equivalent fuel empgge 25 38.6 38.5 38.2 37.9 37.3 36.6 60Fraction of VMT on electricity 13.3% 27.2% 38.4% 46.7% 54.9% 1.0 1.0 1.0Grid Electricity consumption in Al kWh/mile 0.356 0.358 0.362 0.366 0.377 0.368 0.410 0.497Gasoline Fuel Cost $/year 1,871$ 1,212$ 1,053$ 891$ 761$ 668$ 576$ Electricity Fuel Cost $/year 91$ 187$ 266$ 327$ 396$ 704$ 785$ 951$
Total Annual Fuel Cost $/year 1,871$ 1,212$ 1,144$ 1,078$ 1,027$ 995$ 973$ 704$ 785$ 951$ 685$ Annual Driver Savings in Fuel C$/year -$ 659$ 727$ 793$ 844$ 875$ 898$ 1,166$ 1,086$ 920$ 1,185$ Battery Mass Production Cost ($/kWh)Mass Production Incremental Price over ICV 0 2,126$ 8,388$ 9,728$ 11,414$ 13,809$ 15,995$ 12,243$ 20,889$ 38,731$ 19,866$ Mass Production Payback PeriodYears 798$ 798$ 798$ 798$ 798$ 798$ 798$ 798$
Graphs for Story Simultaneous.XLS; Tab 'AFV Data'; O 18 3/15 /2010
135
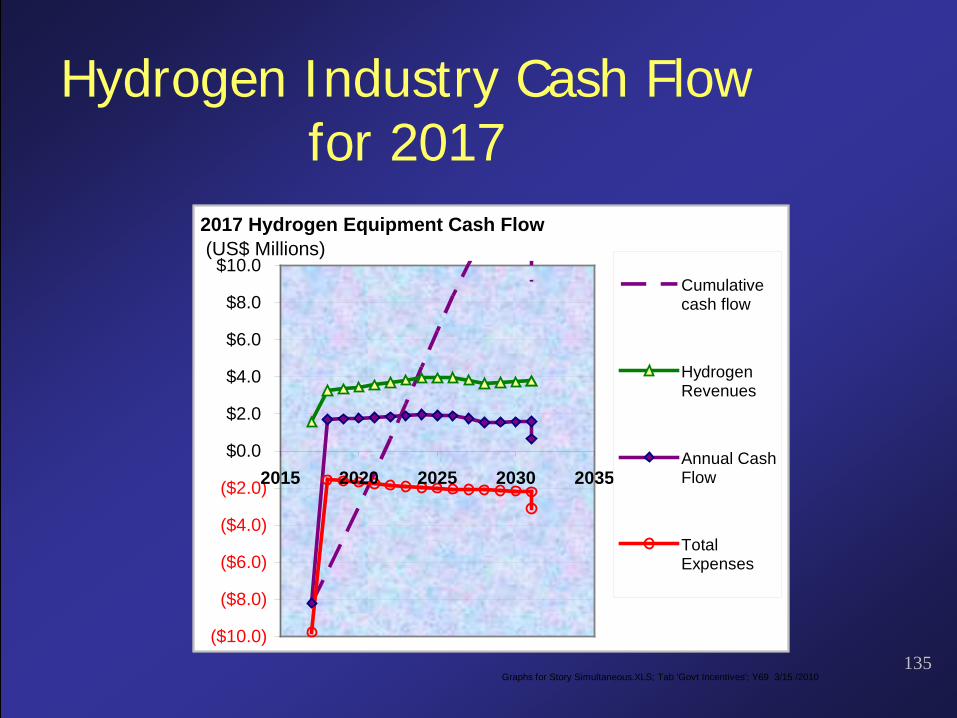
Hydrogen Industry Cash Flow for 2017
Graphs for Story Simultaneous.XLS; Tab 'Govt Incentives'; Y69 3/15 /2010
($10.0)
($8.0)
($6.0)
($4.0)
($2.0)
$0.0
$2.0
$4.0
$6.0
$8.0
$10.0
2015 2020 2025 2030 2035
Cumulativecash flow
HydrogenRevenues
Annual CashFlow
TotalExpenses
2017 Hydrogen Equipment Cash Flow (US$ Millions)
136
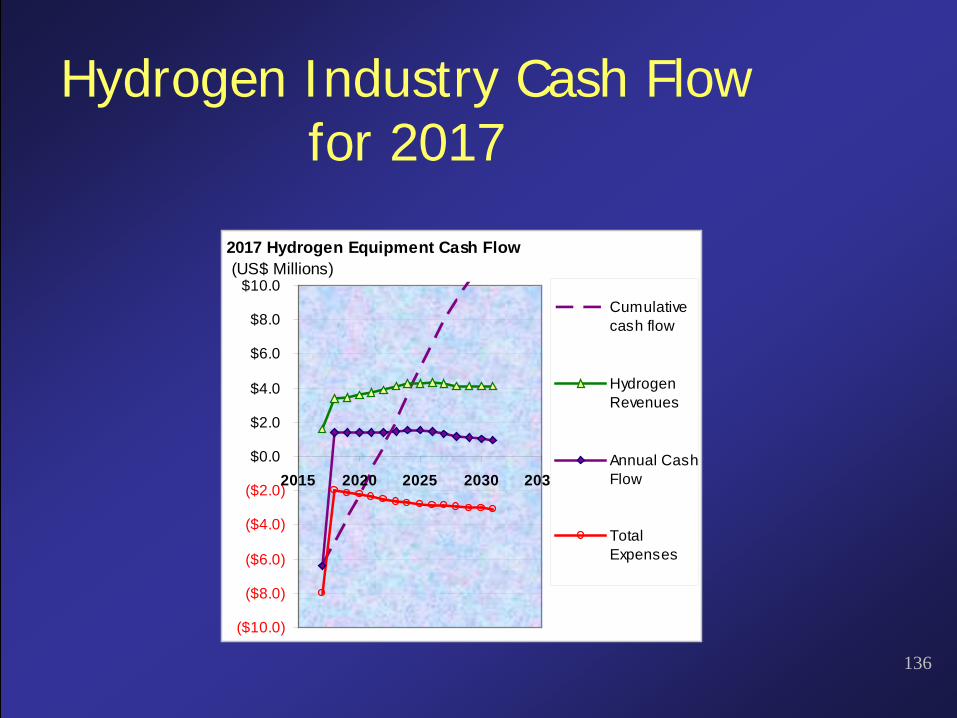
Hydrogen Industry Cash Flow for 2017
($10.0)
($8.0)
($6.0)
($4.0)
($2.0)
$0.0
$2.0
$4.0
$6.0
$8.0
$10.0
2015 2020 2025 2030 2035
Cumulativecash flow
HydrogenRevenues
Annual CashFlow
TotalExpenses
2017 Hydrogen Equipment Cash Flow (US$ Millions)
137
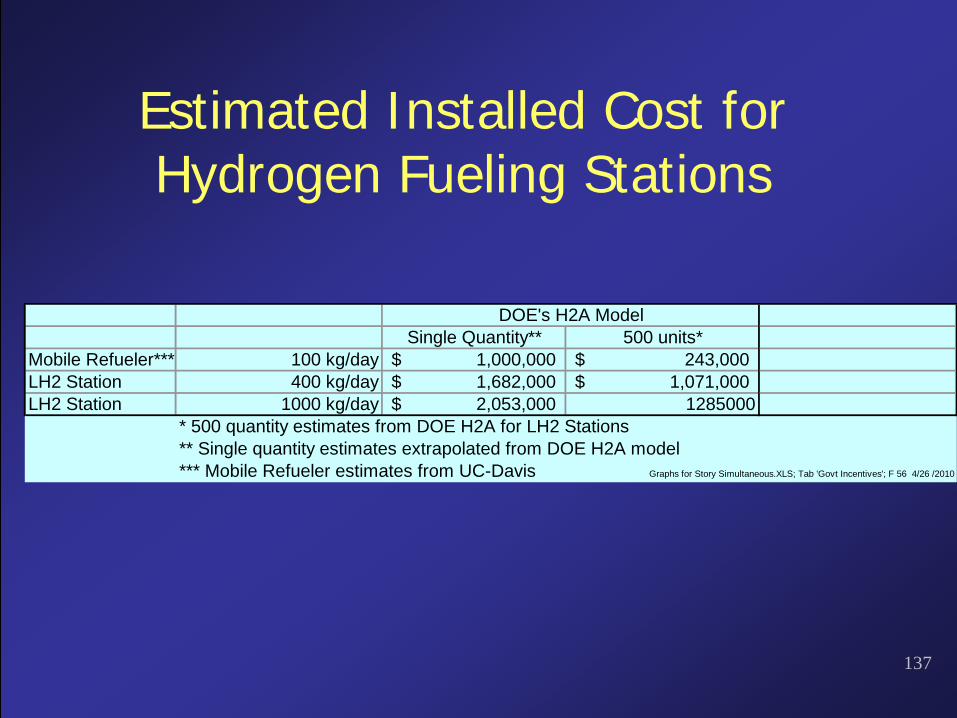
Estimated Installed Cost for Hydrogen Fueling Stations
Single Quantity** 500 units*Mobile Refueler*** 100 kg/day 1,000,000$ 243,000$ LH2 Station 400 kg/day 1,682,000$ 1,071,000$ LH2 Station 1000 kg/day 2,053,000$ 1285000
* 500 quantity estimates from DOE H2A for LH2 Stations** Single quantity estimates extrapolated from DOE H2A model*** Mobile Refueler estimates from UC-Davis Graphs for Story Simultaneous.XLS; Tab 'Govt Incentives'; F 56 4/26 /2010
DOE's H2A Model
138
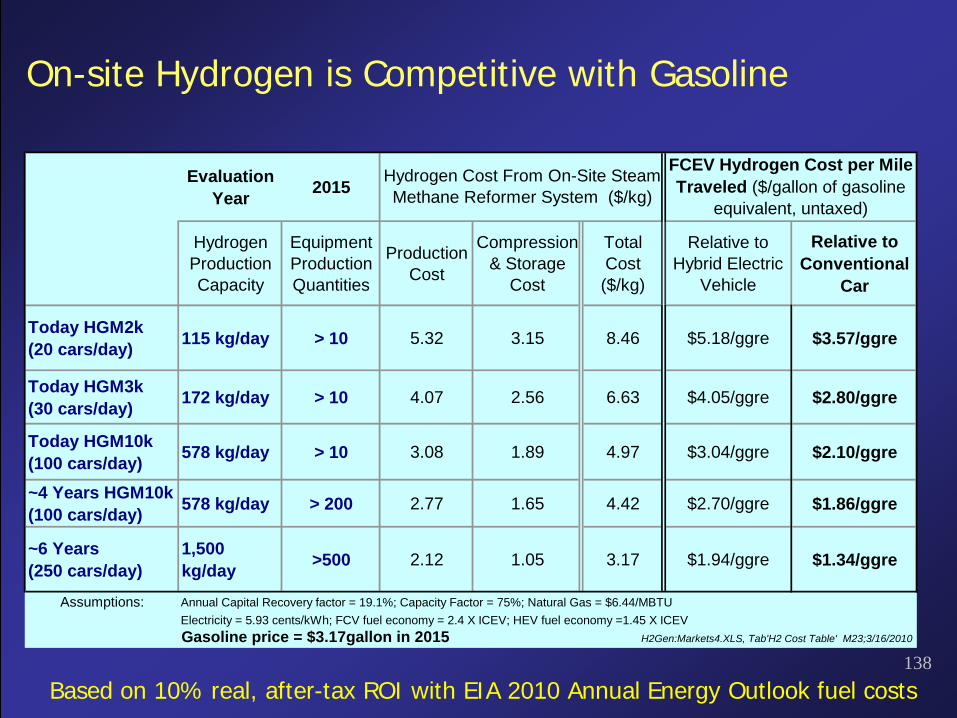
On-site Hydrogen is Competitive with Gasoline
Based on 10% real, after-tax ROI with EIA 2010 Annual Energy Outlook fuel costs
Evaluation Year 2015
Hydrogen Production Capacity
Equipment Production Quantities
Production Cost
Compression & Storage
Cost
Total Cost ($/kg)
Relative to Hybrid Electric
Vehicle
Relative to Conventional
Car
Today HGM2k (20 cars/day) 115 kg/day > 10 5.32 3.15 8.46 $5.18/ggre $3.57/ggre
Today HGM3k (30 cars/day) 172 kg/day > 10 4.07 2.56 6.63 $4.05/ggre $2.80/ggre
Today HGM10k (100 cars/day) 578 kg/day > 10 3.08 1.89 4.97 $3.04/ggre $2.10/ggre
~4 Years HGM10k (100 cars/day) 578 kg/day > 200 2.77 1.65 4.42 $2.70/ggre $1.86/ggre
~6 Years (250 cars/day)
1,500 kg/day >500 2.12 1.05 3.17 $1.94/ggre $1.34/ggre
Assumptions: Annual Capital Recovery factor = 19.1%; Capacity Factor = 75%; Natural Gas = $6.44/MBTUElectricity = 5.93 cents/kWh; FCV fuel economy = 2.4 X ICEV; HEV fuel economy =1.45 X ICEVGasoline price = $3.17gallon in 2015 H2Gen:Markets4.XLS, Tab'H2 Cost Table' M23;3/16/2010
Hydrogen Cost From On-Site Steam Methane Reformer System ($/kg)
FCEV Hydrogen Cost per Mile Traveled ($/gallon of gasoline
equivalent, untaxed)
139
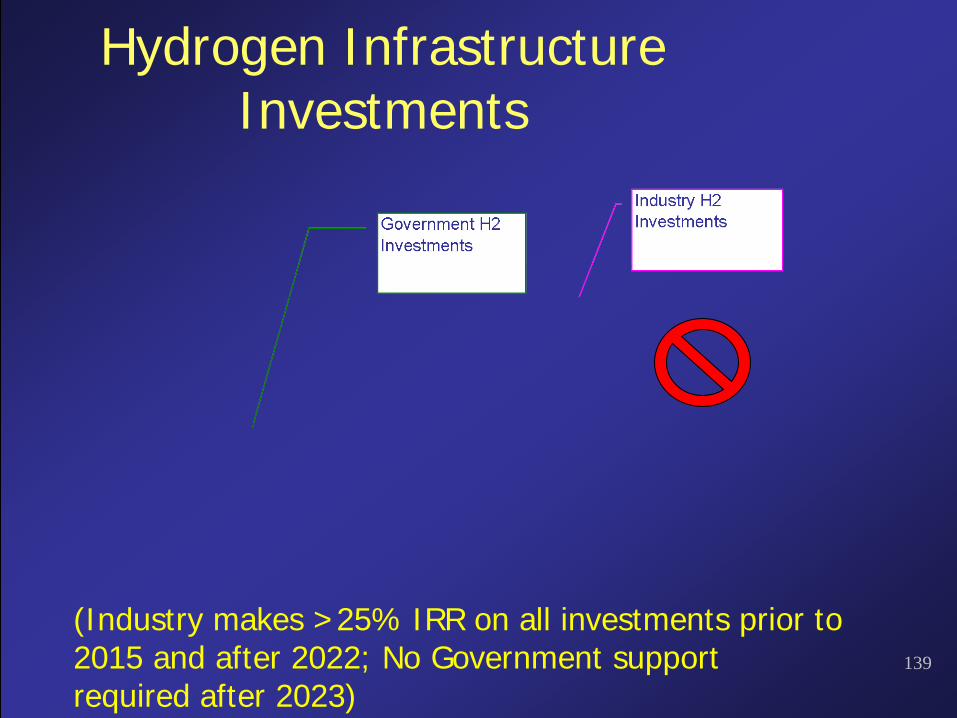
Hydrogen Infrastructure Investments
(Industry makes >25% IRR on all investments prior to 2015 and after 2022; No Government support required after 2023)
140
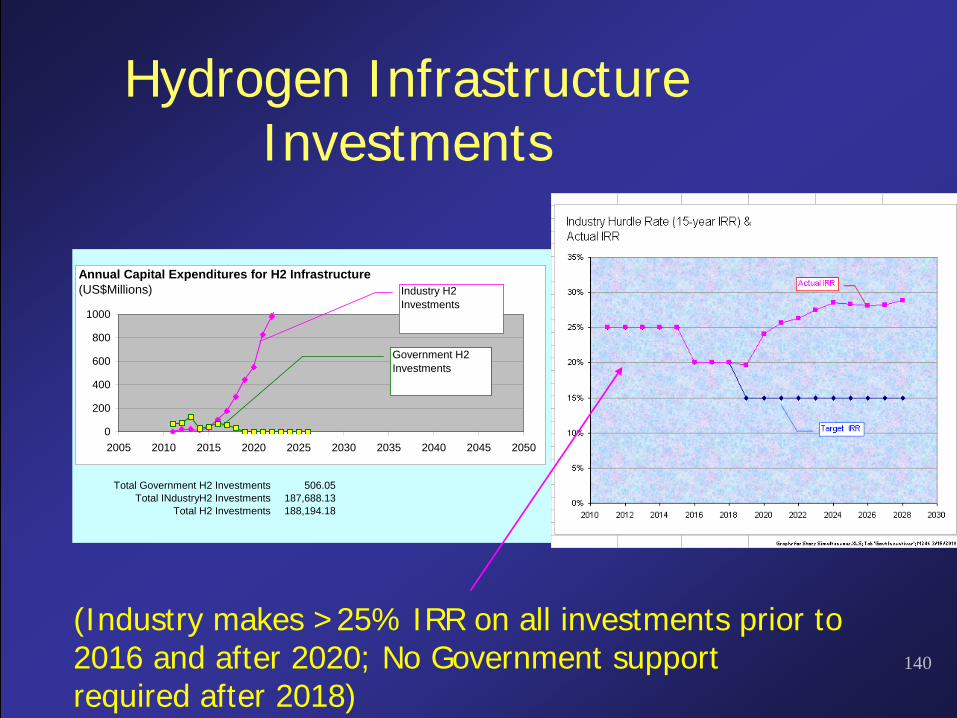
Hydrogen Infrastructure Investments
Total Government H2 Investments 506.05 Total INdustryH2 Investments 187,688.13
Total H2 Investments 188,194.18
0
200
400
600
800
1000
2005 2010 2015 2020 2025 2030 2035 2040 2045 2050
Industry H2 Investments
Government H2 Investments
Annual Capital Expenditures for H2 Infrastructure(US$Millions)
(Industry makes >25% IRR on all investments prior to 2016 and after 2020; No Government support required after 2018)
141
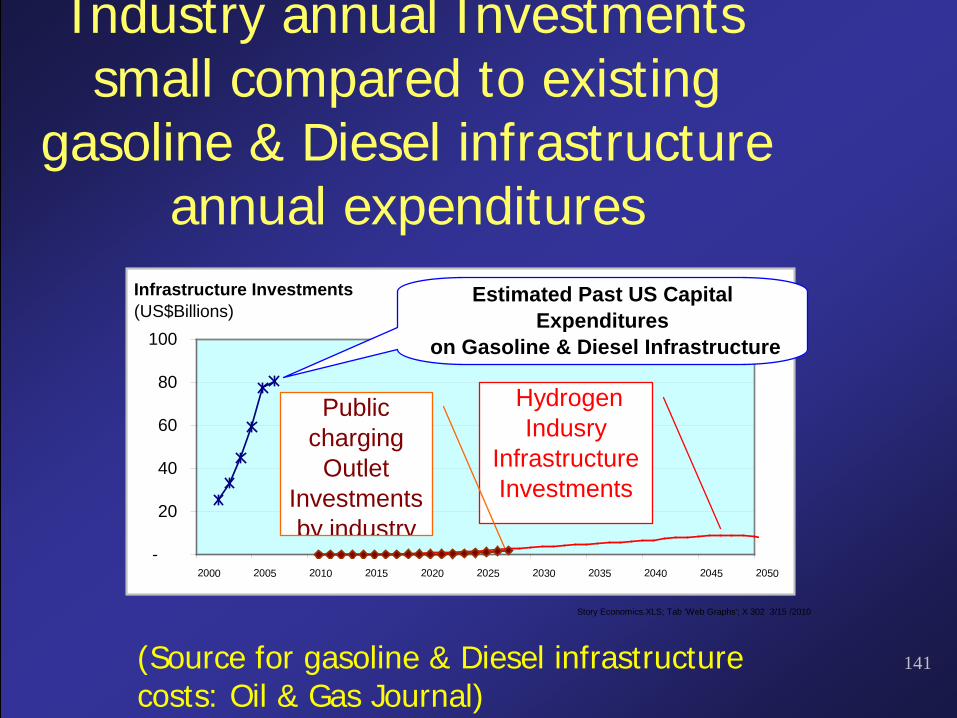
Industry annual Investments small compared to existing
gasoline & Diesel infrastructure annual expenditures
(Source for gasoline & Diesel infrastructure costs: Oil & Gas Journal)
Story Economics.XLS; Tab 'Web Graphs'; X 302 3/15 /2010
-
20
40
60
80
100
2000 2005 2010 2015 2020 2025 2030 2035 2040 2045 2050
Estimated Past US Capital Expenditures
on Gasoline & Diesel Infrastructure
Hydrogen Indusry
Infrastructure Investments
Public charging
Outlet Investments by industry
Infrastructure Investments(US$Billions)
142
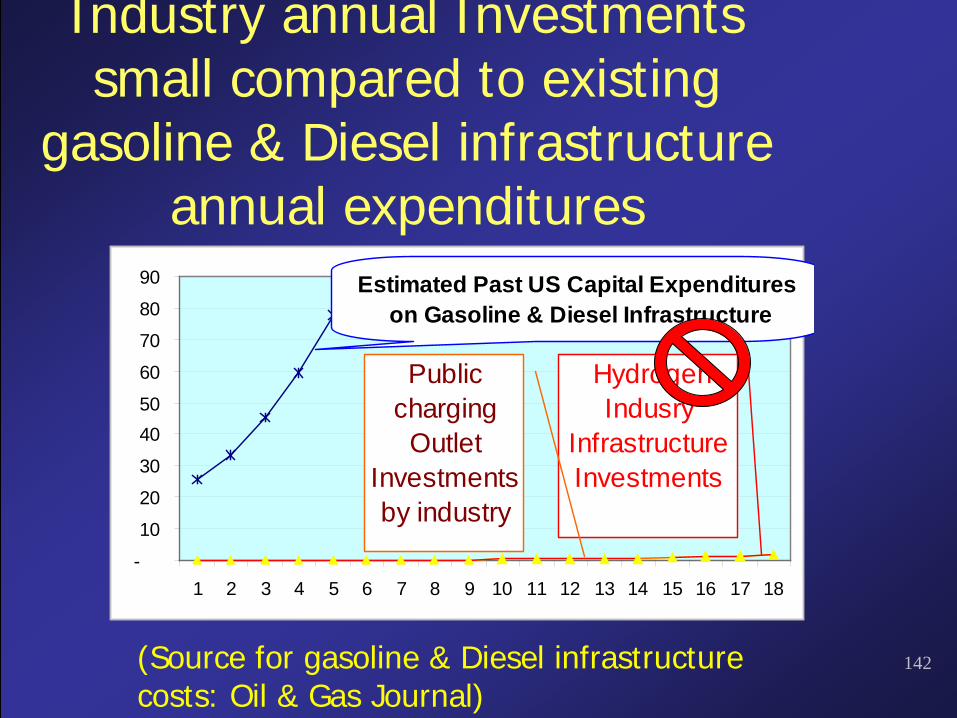
Industry annual Investments small compared to existing
gasoline & Diesel infrastructure annual expenditures
-
10
20
30
4050
60
70
80
90
1 2 3 4 5 6 7 8 9 10 11 12 13 14 15 16 17 18
Estimated Past US Capital Expenditures on Gasoline & Diesel Infrastructure
Hydrogen Indusry
Infrastructure Investments
Public charging
Outlet Investments by industry
(Source for gasoline & Diesel infrastructure costs: Oil & Gas Journal)
143
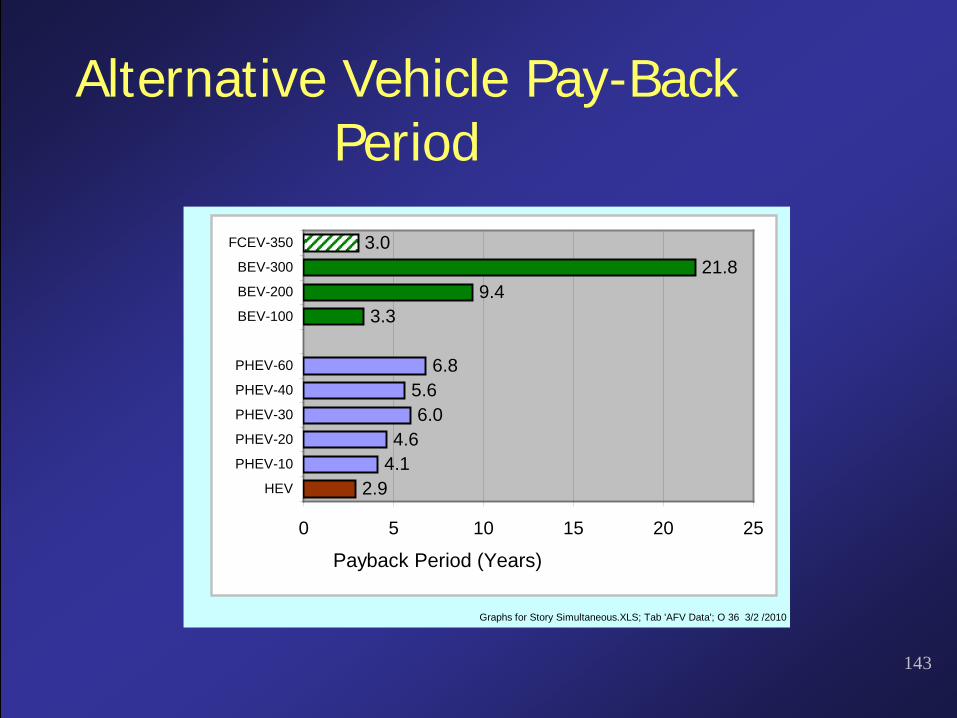
Alternative Vehicle Pay-Back Period
Graphs for Story Simultaneous.XLS; Tab 'AFV Data'; O 36 3/2 /2010
2.94.14.6
6.05.6
6.8
3.39.4
21.83.0
0 5 10 15 20 25
HEV
PHEV-10
PHEV-20
PHEV-30
PHEV-40
PHEV-60
BEV-100
BEV-200
BEV-300
FCEV-350
Payback Period (Years)
144
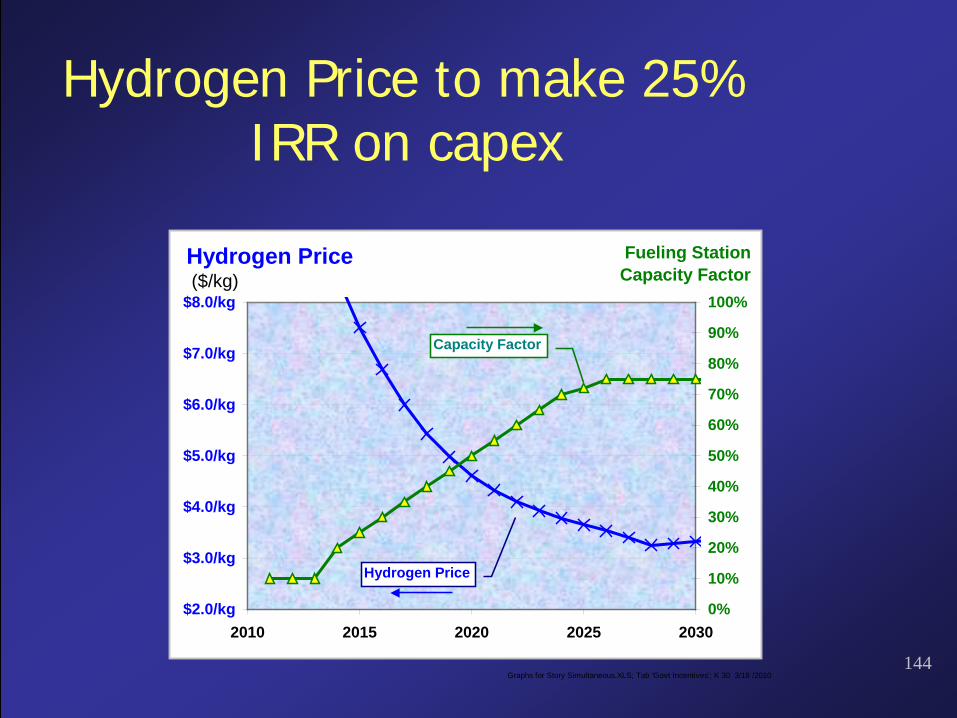
Hydrogen Price to make 25% IRR on capex
Graphs for Story Simultaneous.XLS; Tab 'Govt Incentives'; K 30 3/18 /2010
$2.0/kg
$3.0/kg
$4.0/kg
$5.0/kg
$6.0/kg
$7.0/kg
$8.0/kg
2010 2015 2020 2025 20300%
10%
20%
30%
40%
50%
60%
70%
80%
90%
100%
Hydrogen Price ($/kg)
Fueling StationCapacity Factor
Hydrogen Price
Capacity Factor
145
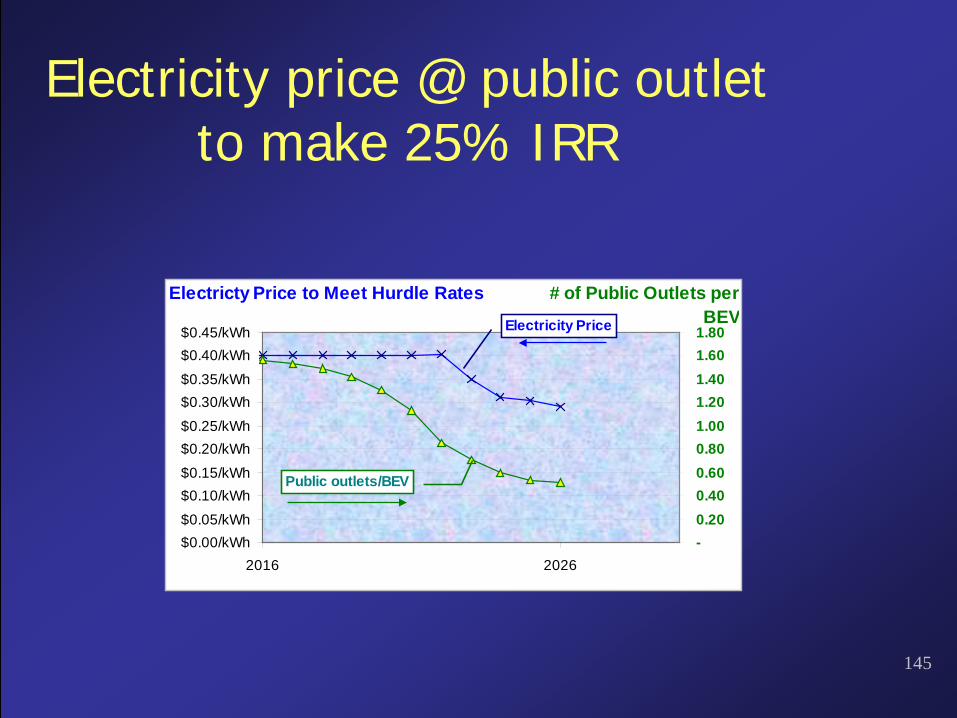
Electricity price @ public outlet to make 25% IRR
$0.00/kWh$0.05/kWh
$0.10/kWh$0.15/kWh
$0.20/kWh$0.25/kWh
$0.30/kWh$0.35/kWh
$0.40/kWh$0.45/kWh
2016 2026-0.200.400.600.801.001.201.401.601.80
Electricty Price to Meet Hurdle Rates # of Public Outlets per BEV
Public outlets/BEV
Electricity Price
146
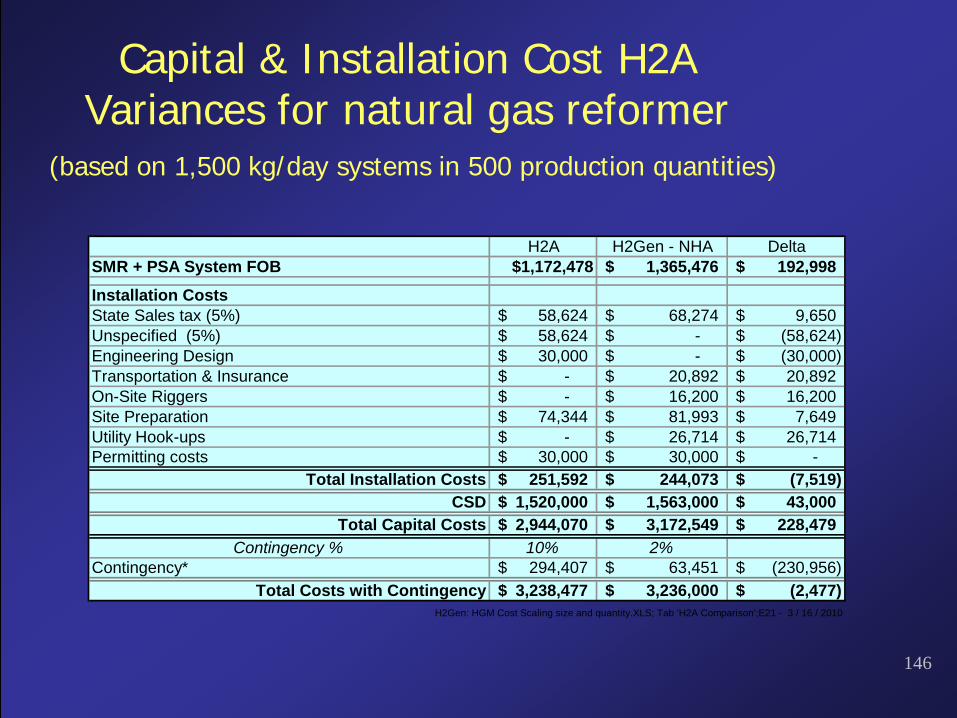
Capital & Installation Cost H2A Variances for natural gas reformer
(based on 1,500 kg/day systems in 500 production quantities)
H2A H2Gen - NHA DeltaSMR + PSA System FOB $1,172,478 1,365,476$ 192,998$
Installation CostsState Sales tax (5%) 58,624$ 68,274$ 9,650$ Unspecified (5%) 58,624$ -$ (58,624)$ Engineering Design 30,000$ -$ (30,000)$ Transportation & Insurance -$ 20,892$ 20,892$ On-Site Riggers -$ 16,200$ 16,200$ Site Preparation 74,344$ 81,993$ 7,649$ Utility Hook-ups -$ 26,714$ 26,714$ Permitting costs 30,000$ 30,000$ -$
Total Installation Costs 251,592$ 244,073$ (7,519)$ CSD 1,520,000$ 1,563,000$ 43,000$
Total Capital Costs 2,944,070$ 3,172,549$ 228,479$ Contingency % 10% 2%
Contingency* 294,407$ 63,451$ (230,956)$ Total Costs with Contingency 3,238,477$ 3,236,000$ (2,477)$
H2Gen: HGM Cost Scaling size and quantity.XLS; Tab 'H2A Comparison';E21 - 3 / 16 / 2010
147
Excerpt from Electrification Roadmap
• “Early battery GEVs (grid-enabled electric vehicles…PHEVs and BEVs) “will have limited range, take hours to charge and will add significantly to vehicle cost.”
148
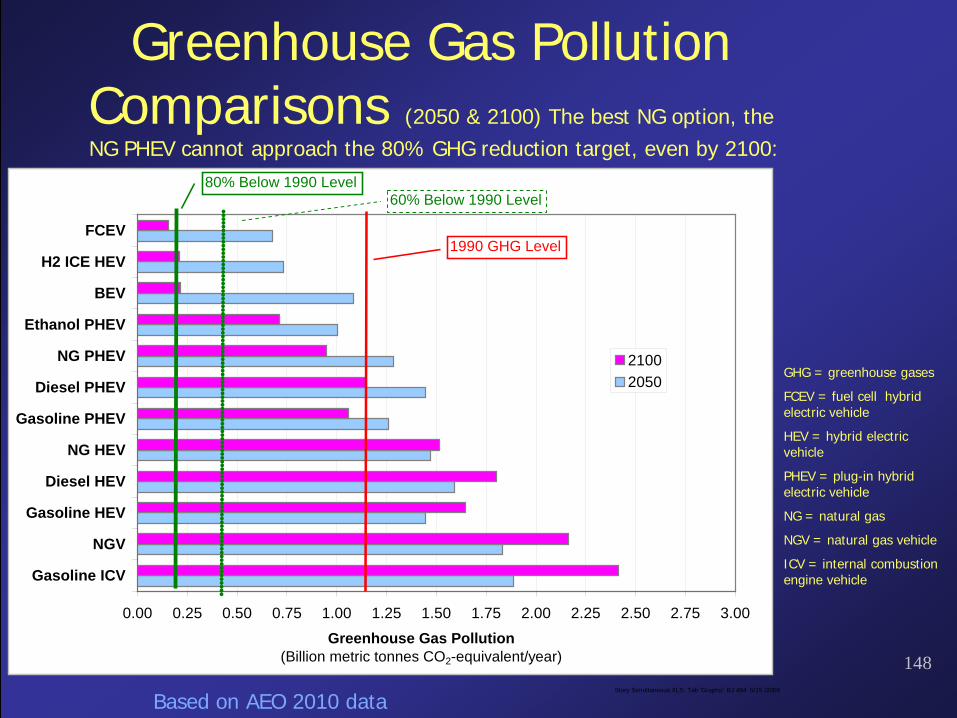
Greenhouse Gas Pollution Comparisons (2050 & 2100) The best NG option, theNG PHEV cannot approach the 80% GHG reduction target, even by 2100:
GHG = greenhouse gases
FCEV = fuel cell hybrid electric vehicle
HEV = hybrid electric vehicle
PHEV = plug-in hybrid electric vehicle
NG = natural gas
NGV = natural gas vehicle
ICV = internal combustion engine vehicle
Based on AEO 2010 dataStory Simultaneous.XLS; Tab 'Graphs'; BJ 464 5/15 /2009
0.00 0.25 0.50 0.75 1.00 1.25 1.50 1.75 2.00 2.25 2.50 2.75 3.00
Gasoline ICV
NGV
Gasoline HEV
Diesel HEV
NG HEV
Gasoline PHEV
Diesel PHEV
NG PHEV
Ethanol PHEV
BEV
H2 ICE HEV
FCEV
21002050
Greenhouse Gas Pollution (Billion metric tonnes CO2-equivalent/year)
60% Below 1990 Level80% Below 1990 Level
1990 GHG Level