Embed Size (px)
Citation preview
Cleveland State University Cleveland State University
EngagedScholarship@CSU EngagedScholarship@CSU
ETD Archive
2010
An Empirical Validation of Guskey's Professional Development An Empirical Validation of Guskey's Professional Development
Evaluation Model Using Six Years of Student and Teacher Level Evaluation Model Using Six Years of Student and Teacher Level
Reading Data Reading Data
David O. Newman Cleveland State University
Follow this and additional works at: https://engagedscholarship.csuohio.edu/etdarchive
Part of the Education Commons
How does access to this work benefit you? Let us know! How does access to this work benefit you? Let us know!
Recommended Citation Recommended Citation Newman, David O., "An Empirical Validation of Guskey's Professional Development Evaluation Model Using Six Years of Student and Teacher Level Reading Data" (2010). ETD Archive. 219. https://engagedscholarship.csuohio.edu/etdarchive/219
This Dissertation is brought to you for free and open access by EngagedScholarship@CSU. It has been accepted for inclusion in ETD Archive by an authorized administrator of EngagedScholarship@CSU. For more information, please contact [email protected].
AN EMPIRICAL VALIDATION OF GUSKEY’S PROFESSIONAL
DEVELOPMENT EVALUATION MODEL USING SIX YEARS OF STUDENT
AND TEACHER LEVEL READING DATA
DAVID NEWMAN
Bachelors of Science in Psychology
University of Akron
December, 1999
Masters of Science Exercise Physiology
University of Akron
August, 2001
Masters of Arts in Research Methodology
University of Akron
August, 2002
Submitted in partial fulfillment of requirements for the degree
DOCTOR OF PHILOSOPHY IN URBAN EDUCATION: POLICY STUDIES
at the CLEVELAND STATE UNIVERSITY
DECEMBER, 2010

© by David Newman, 2010
This dissertation has been approved for
the Office of Doctoral Studies,
College of Education and Human Services
and the College of Graduate Studies by
___________________________________________________________________
Judy Stahlman, co-Chairperson
Teacher Education
___________________________________________________________________
Joshua Bagakas, co-Chair and Methodologist
Curriculum and Foundations
___________________________________________________________________
E. Michael Loovis, Committee Member
Health, Physical Education, Recreation and Dance
___________________________________________________________________
Paul Williams, Committee Member
Counseling, Administration, Supervision and Adult Learning
___________________________________________________________________
James Salzman, Committee Member
Ohio University
iv
ACKNOWLEDGEMENTS
Without the understanding and assistance of many individuals, completing this
dissertation would have been impossible. While I cannot list the names of everyone who
has been instrumental in helping me complete my doctoral studies, I do want to express
my gratitude to many of them.
I am appreciative of the help provided by Dr. Judy Stahlman, Dr. Joshua Bagakas,
Dr. James Salzman, Dr. Micheal Loovis, and Dr. Paul William, members of my
committee who volunteered their time and guidance. Special thanks go out to my co-
Chairs Dr. Stahlman and Dr. Bagaka’s who were instrumental in the process and gave so
much of themselves. Additionally, without the help and opportunities afforded by Dr.
Salzman I would not have access to gather the data required for the research nor have the
theoretical framework in which it was completed.
I would be remiss not to thank my parents, Dr. Carole Newman and Dr. Isadore
Newman. Without their love, support and help this research would not have been
completed. Not only did my father provide me with the statistical background and
knowledge to conduct this and other studies, but the collegial relationship that both he
and my mother provided me while working on so many papers and publications showed
me how to be productive researcher. Thank you both for the lessons you have taught me
and all of your support.
Special thanks goes to Wanda Pruett-Butler in the Doctoral Studies office. Her
help with the formatting, and support facilitated the completion of this research. You are
the best.

v
Last, but certainly not least, I would like to thank Dr. Sharon Brown. The
partnership that we developed while working with Reading First Ohio and then on our
dissertations pushed me to finish especially during the periods that I would have stalled.
It was a pleasure to work together on our research and I so look forward to our continuing
friendship and future research projects.
Thank You All So Much.
vi
AN EMPIRICAL VALIDATION OF GUSKEY’S PROFESSIONAL
DEVELOPMENT EVALUATION MODEL USING SIX YEARS OF STUDENT
AND TEACHER LEVEL READING DATA
DAVID NEWMAN
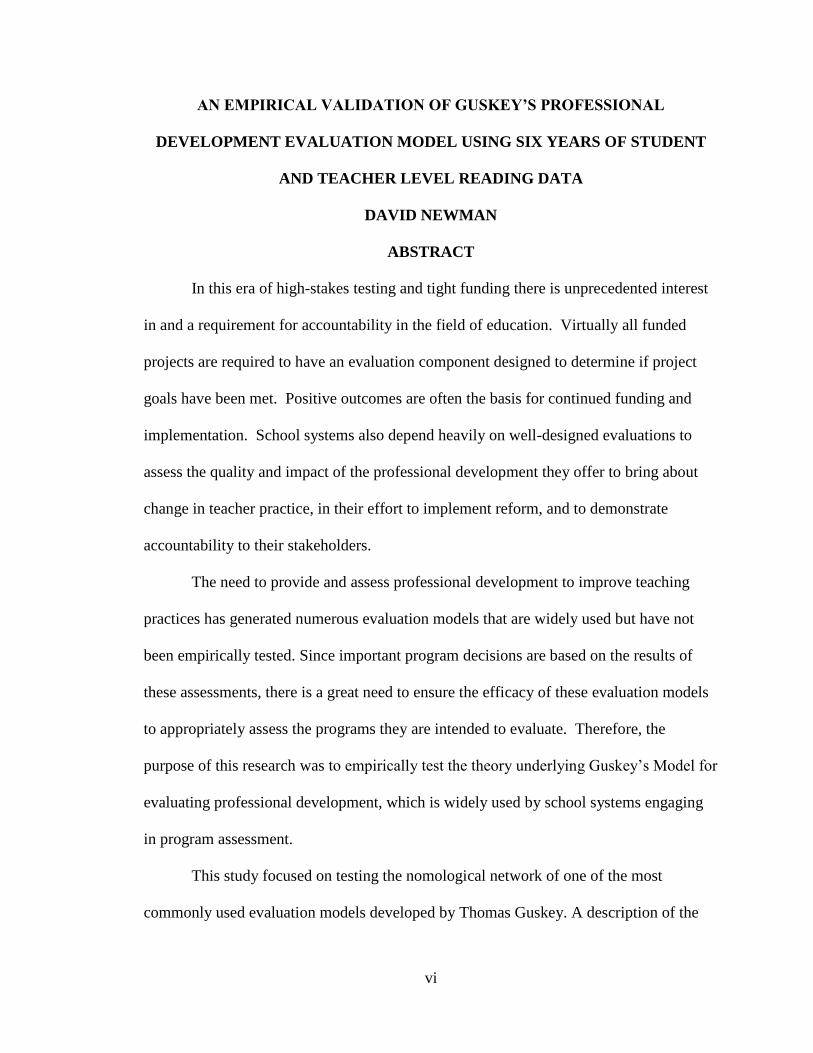
ABSTRACT
In this era of high-stakes testing and tight funding there is unprecedented interest
in and a requirement for accountability in the field of education. Virtually all funded
projects are required to have an evaluation component designed to determine if project
goals have been met. Positive outcomes are often the basis for continued funding and
implementation. School systems also depend heavily on well-designed evaluations to
assess the quality and impact of the professional development they offer to bring about
change in teacher practice, in their effort to implement reform, and to demonstrate
accountability to their stakeholders.
The need to provide and assess professional development to improve teaching
practices has generated numerous evaluation models that are widely used but have not
been empirically tested. Since important program decisions are based on the results of
these assessments, there is a great need to ensure the efficacy of these evaluation models
to appropriately assess the programs they are intended to evaluate. Therefore, the
purpose of this research was to empirically test the theory underlying Guskey’s Model for
evaluating professional development, which is widely used by school systems engaging
in program assessment.
This study focused on testing the nomological network of one of the most
commonly used evaluation models developed by Thomas Guskey. A description of the
vii
model is presented along with a discussion of the lack of empirical evidence that exists
regarding its effectiveness. By investigating the relationships among the five components
in Guskey’s Model (Teacher Satisfaction, Teacher Knowledge, Teacher Practices,
Administrative Support and Student Outcomes), it was possible to determine whether
these assumed relationships actually do exist and contribute to the accuracy of the
program evaluation.
Data collected from Reading First Ohio over the past 6 years was utilized to test
the nomological net of Guskey’s model. The finding indicated strong support for the
continued used of Guskey’s Professional Development Evaluation Model. It also
described some of the complex interactions between Teacher Satisfaction, Teacher
Knowledge and Teacher Practice.
viii
TABLE OF CONTENTS
ABSTRACT ....................................................................................................................... vi
LIST OF TABLES ............................................................................................................ xii
LIST OF FIGURES ......................................................................................................... xiii
CHAPTER
I. INTRODUCTION ...................................................................................................1
Theoretical Framework ..................................................................................... 4
Purpose of the Study ......................................................................................... 6
General Research Questions ............................................................................. 7
Significance of the Study .................................................................................. 8
Delimitations ..................................................................................................... 9
Operational Definitions ..................................................................................... 9
Summary ......................................................................................................... 11
II. LITERATURE REVIEW ......................................................................................13
Overall Need for Evaluation ........................................................................... 13
Traditional Evaluation Models ....................................................................... 17
Stake: Strictly Empirical Evaluation Models .......................................... 17
Scriven: Founded in Empirical Measurments ......................................... 19
Kirkpatrick: Stepping Away From Strictly Emperical Research ............ 21
Stufflebeam: A move Towards Constructivisim ..................................... 23
Guskey’s Model .............................................................................................. 29
The Model ............................................................................................... 29
ix
Research Using Guskey’s Professional Development Evaluations Model ..... 32
Summary ......................................................................................................... 39
III. METHOD ..............................................................................................................40
Restatement of the Problem ............................................................................ 40
Research Design.............................................................................................. 40
Selecting Guskey’s Professional Development Evaluation Model ................ 41
Problem ........................................................................................................... 42
Data Sources ................................................................................................... 42
Instruments .............................................................................................. 43
Dynamic Indicators for Basic English Literacy (DIBELS) ..................... 43
TerraNova (TN) ....................................................................................... 44
Ohio Achievement Test (OAT). .............................................................. 45
Survey of Enacted Curriculum (SEC) ..................................................... 45
Early Language and Literacy Classroom Observation (ELLCO) ........... 46
Westat. ..................................................................................................... 48
Data Collection Procedures ............................................................................. 48
Statistical Analysis .......................................................................................... 49
Principal Component Analysis. ............................................................... 50
Multiple Linear Regression ..................................................................... 50
Hierarchal Linear Modeling (HLM). ....................................................... 51
Binomial Index of Model Fit. .................................................................. 55
Power and Reliability Analysis. .............................................................. 56
Guskey’s Professional Development Evaluation Model. ........................ 57
x
Derivation of General Research Hypotheses and Specific
Research Hypotheses. ......................................................................57
General Research Hypotheses......................................................................... 58
Summary ......................................................................................................... 60
IV. RESULTS OF THE STUDY .................................................................................62
Data Preparation and Preliminary Analyses ................................................... 62
Data Merging and Databases Screening .................................................. 62
Databases Screening. ............................................................................... 63
Descriptive Statistics ............................................................................... 63
Phase 1: Factor Analysis ................................................................................. 71
Principal Component Analysis. ............................................................... 71
Phase 2: Analysis of Research Questions ....................................................... 73
General Hypothesis 1 (GH1). .................................................................. 73
General Hypothesis 2 (GH2) ................................................................... 74
General Hypothesis 3 (GH3) ................................................................... 74
General Hypothesis 4 (GH4) ................................................................... 76
General Hypothesis 5 (GH5) ................................................................... 77
General Hypothesis 6 (GH6) ................................................................... 78
General Hypothesis 7 (GH7) ................................................................... 79
Summary of Research ..................................................................................... 80
V. SUMMARY, DISCUSSION, CONCLUSIONS AND
RECOMMENDATIONS .......................................................................................83
Summary of the Study .................................................................................... 83
xi
Methodology ................................................................................................... 85
Research Design ...................................................................................... 85
Data Sources. ........................................................................................... 85
Statistical Analysis .................................................................................. 86
Guskey’s Professional Development Evaluation Model. ........................ 86
The Research Questions .................................................................................. 87
Conclusions and Discussion ........................................................................... 88
Research Question 1 ................................................................................ 89
Research Question 2 ................................................................................ 89
Research Question 3 ................................................................................ 90
Research Question 4 ................................................................................ 91
Research Question 5 ................................................................................ 92
Research Question 6 ................................................................................ 92
Research Question 7 ................................................................................ 93
Global Discussion of the Research Questions. ........................................ 93
Implications..................................................................................................... 95
Limitations ...................................................................................................... 98
Recommendations for Further Research ......................................................... 99
Summary ....................................................................................................... 101
REFERENCES ............................................................................................................... 102
xii
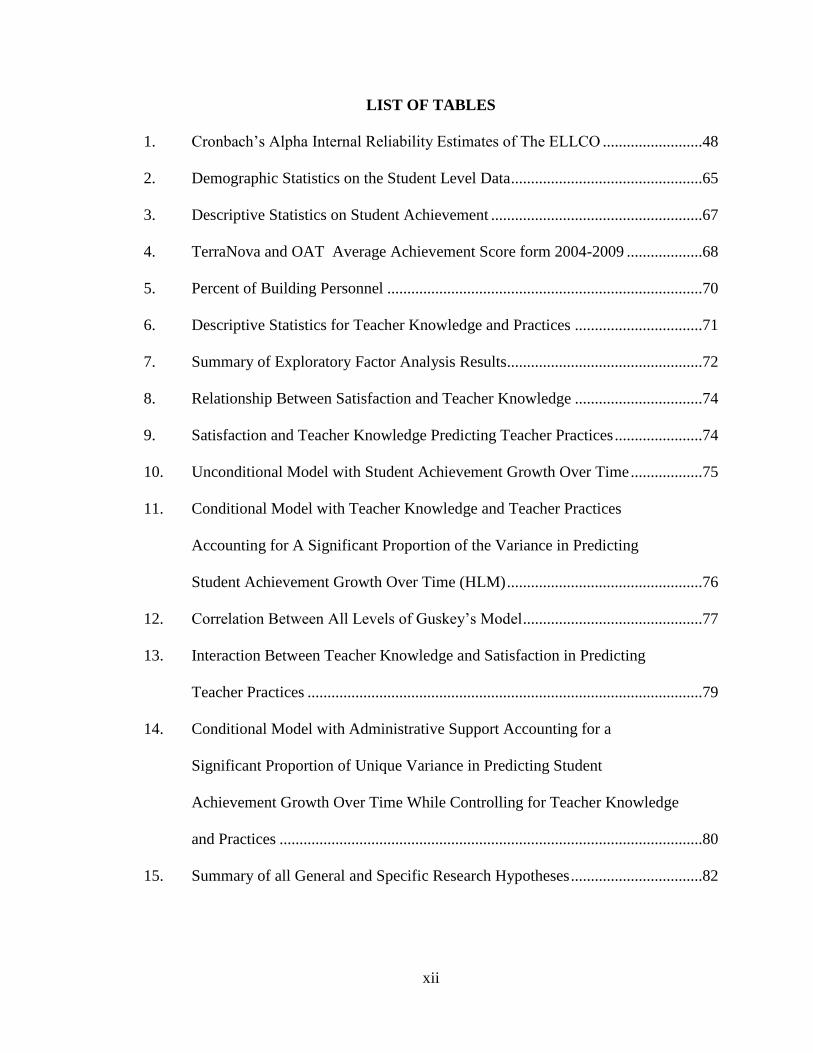
LIST OF TABLES
1. Cronbach’s Alpha Internal Reliability Estimates of The ELLCO .........................48
2. Demographic Statistics on the Student Level Data ................................................65
3. Descriptive Statistics on Student Achievement .....................................................67
4. TerraNova and OAT Average Achievement Score form 2004-2009 ...................68
5. Percent of Building Personnel ...............................................................................70
6. Descriptive Statistics for Teacher Knowledge and Practices ................................71
7. Summary of Exploratory Factor Analysis Results.................................................72
8. Relationship Between Satisfaction and Teacher Knowledge ................................74
9. Satisfaction and Teacher Knowledge Predicting Teacher Practices ......................74
10. Unconditional Model with Student Achievement Growth Over Time ..................75
11. Conditional Model with Teacher Knowledge and Teacher Practices
Accounting for A Significant Proportion of the Variance in Predicting
Student Achievement Growth Over Time (HLM) .................................................76
12. Correlation Between All Levels of Guskey’s Model .............................................77
13. Interaction Between Teacher Knowledge and Satisfaction in Predicting
Teacher Practices ...................................................................................................79
14. Conditional Model with Administrative Support Accounting for a
Significant Proportion of Unique Variance in Predicting Student
Achievement Growth Over Time While Controlling for Teacher Knowledge
and Practices ..........................................................................................................80
15. Summary of all General and Specific Research Hypotheses .................................82
xiii
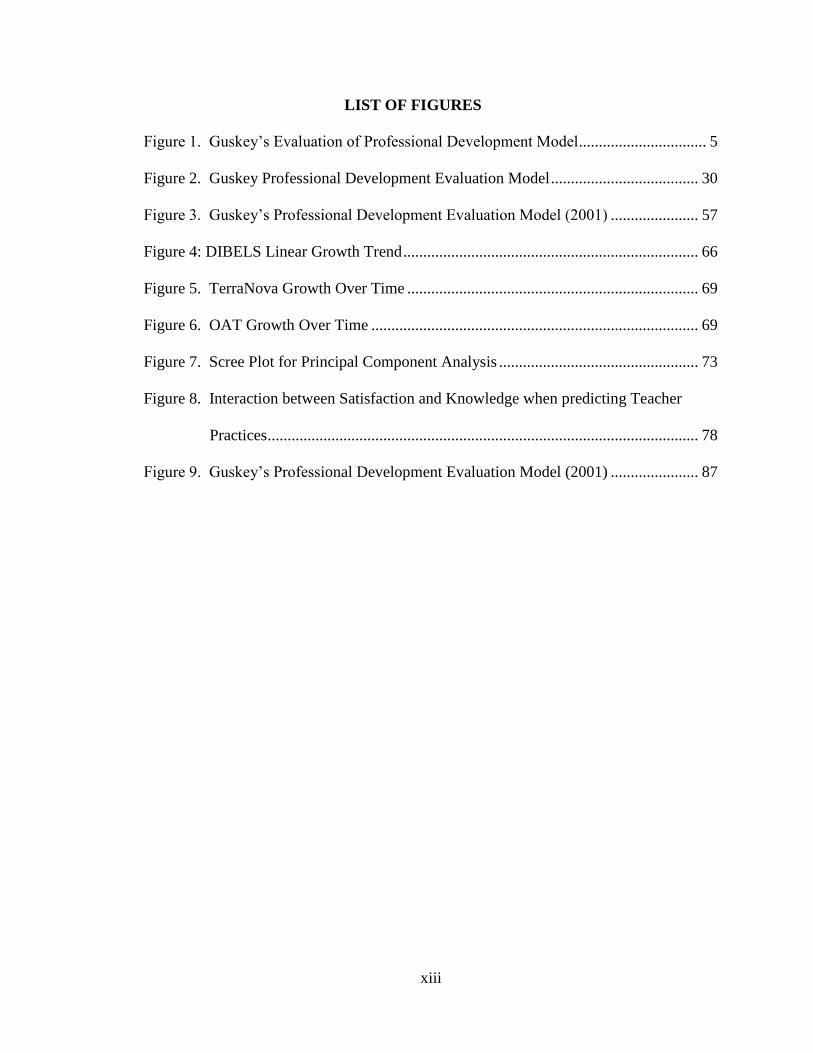
LIST OF FIGURES
Figure 1. Guskey’s Evaluation of Professional Development Model ................................ 5
Figure 2. Guskey Professional Development Evaluation Model ..................................... 30
Figure 3. Guskey’s Professional Development Evaluation Model (2001) ...................... 57
Figure 4: DIBELS Linear Growth Trend .......................................................................... 66
Figure 5. TerraNova Growth Over Time ......................................................................... 69
Figure 6. OAT Growth Over Time .................................................................................. 69
Figure 7. Scree Plot for Principal Component Analysis .................................................. 73
Figure 8. Interaction between Satisfaction and Knowledge when predicting Teacher
Practices ............................................................................................................ 78
Figure 9. Guskey’s Professional Development Evaluation Model (2001) ...................... 87
1
CHAPTER I
INTRODUCTION
There is no question that there is unprecedented interest in and a requirement for
accountability in the field of education (Desimone, 2009; Levine, 1974; Raudenbush,
2009). Virtually all externally funded projects are required to have an evaluation
component that is designed to determine if project goals have been met (Westat, 2003).
Positive outcomes are often the basis for continued funding and implementation. Local,
state and federal government agencies depend upon well-designed evaluations to make
effective policy decisions. School systems are also heavily dependent on well-designed
evaluations to assess the quality and impact of the professional development they offer to
bring about change in teacher practice, in their effort to implement reform, increase
student learning, and demonstrate accountability to their stakeholders (NCEE, 1983;
NCLB 2001; Raudenbush, 2009).
There are currently a number of comprehensive evaluation models that are being
used in the field of education to guide and assess program development, professional
development, and implementation success. Stuffelbeam (2000, 2007), Stake (2000),
Scriven (1994), Kirkpatrick (2006), Guskey (1991, 2000, 2002), and others have all
2
developed systematic evaluation models that are being widely used to bring about
educational reform. The assumption is that the model adopted by a school system is an
effective tool that will aid them in designing and evaluating their professional
development efforts. This assumption is seldom, if ever, supported by an empirical test
of the model, and is often based on common practice. Therefore, while schools may
invest heavily in designing and presenting professional development opportunities for
their teachers, they generally have little or no evidence to indicate if the criteria based
upon the model they have selected for their training are good indicators of effectiveness.
The concept of providing ongoing professional development is not unique to
education. Areas such as law, medicine, technical industries, etc., all require continual
professional development (Hashem, 2007) to refresh and keep practitioners current in
their fields. The assumption is that the professional development for both teachers and
administrative staff will lead to increased knowledge and skills that will in turn result in
improved practice and will ultimately increase student performance (Desimone, Smith,
Hayes, & Frisvold, 2005; Levine, 1974). Very often in the field of education, resources
are allocated through state and district budgets to provide professional development, but
virtually no resources are set aside to determine if the selected professional development
is effective in producing the desired change. The evaluation model or design that is
chosen often stops short of assessing if there is an overall change in student performance.
Most only assess satisfaction and a baseline of increases in practices, but they tend not to
adequately assess real changes in teacher practices. It is critical that the evaluation model
is appropriate to measure all key outcomes (Guskey, 2001).

3
This brings us to an important point. There are many types of evaluation. For the
purpose of this study evaluation is defined as the systematic investigation of the merit or
worth of a program (Joint Committee on Standards for Educational Evaluation, 1994.)
Systematic refers to the evaluation being thoughtful, intentional, and purposeful as it
pertains to the overall objectives. Guskey (1998) states that because professional
development models are in themselves systematically conceptualized with goals and
clearly defined objectives, they are also evaluation models. Investigation refers to
collecting and analyzing relevant information about the ongoing program. Lastly, merit
or worth refers to the value of the program. Are there benefits? Is it cost effective? And,
Is it better than competing programs? All of the questions are couched within an
evaluation conceptualization.
Models to evaluate professional development are based upon assumptions that are
embedded in philosophical positions and a particular world-view of what is considered to
be important. For example, in Thomas Guskey’s (2001) Professional Development
Evaluation Model the pieces that are considered to be important are satisfaction, changes
in teacher knowledge, changes in teacher practices, administrative support, and ultimately
improvement in student performance. The value of working from a model is that it helps
one to organize, define, communicate, and diagnose problems by looking at the
interrelated components. A model also has heuristic value and is useful both formatively
and summatively for writing reports. It can provide the framework that is used to discuss
each aspect of the program and helps the trainer and/or evaluator communicate progress
by describing which aspects of the model have been completed, are in process, or need to
be revisited. The components of the model can also serve as clear divisions for report
4
writing and communicating results. However, few studies are available that validate or
empirically test these different evaluation models. These models have basically been
“tested” philosophically or intuitively. The “test” involves selecting the model that
appears to be most in line with the philosophical position of the district or the individual
planning the professional development, or the one that seems intuitively to make the most
sense, fits their budget, or their knowledge of evaluation strategies. It is therefore,
important to investigate the efficacy of the evaluation models in an attempt to better
ensure that the model that is most appropriate, and has the best fit for a specific situation,
is selected. It is not sufficient to adopt a model based on face validity, ease of use and/or
because it has become common practice in a given field (Raudenbush, 2009). Today’s
limited resources of time, money and personnel, along with the increased attention to
accountability to stakeholders, necessitates that careful consideration be given to
selecting an evaluation model that will best serve the purpose for which it is intended.
Theoretical Framework
This study focuses on Guskey’s (2001) Professional Development Evaluation
Model. The Guskey model was selected because of its wide acceptance and use in
professional development and because it is the model selected and implemented for the
state-wide Reading First Ohio professional development. This model identified five
levels that have to be investigated when assessing the success of professional
development. Level 1 is the satisfaction of the participants with the professional
development they received. Level 2 is the changes in knowledge that the teachers show
an increase in their understanding of key concepts presented in the professional
development. Teacher practices is Level 3 and it reflects the changes in teaching that
5
reflect the better understanding of the key components covered in the professional
development. Level 4 is administrative support and measures level of support from the
principal and staff that support the changes in teacher practices prescribed by the
professional development. Lastly, Level 5 is student achievement and measures the
increased as a result of the changes brought about by the professional development.
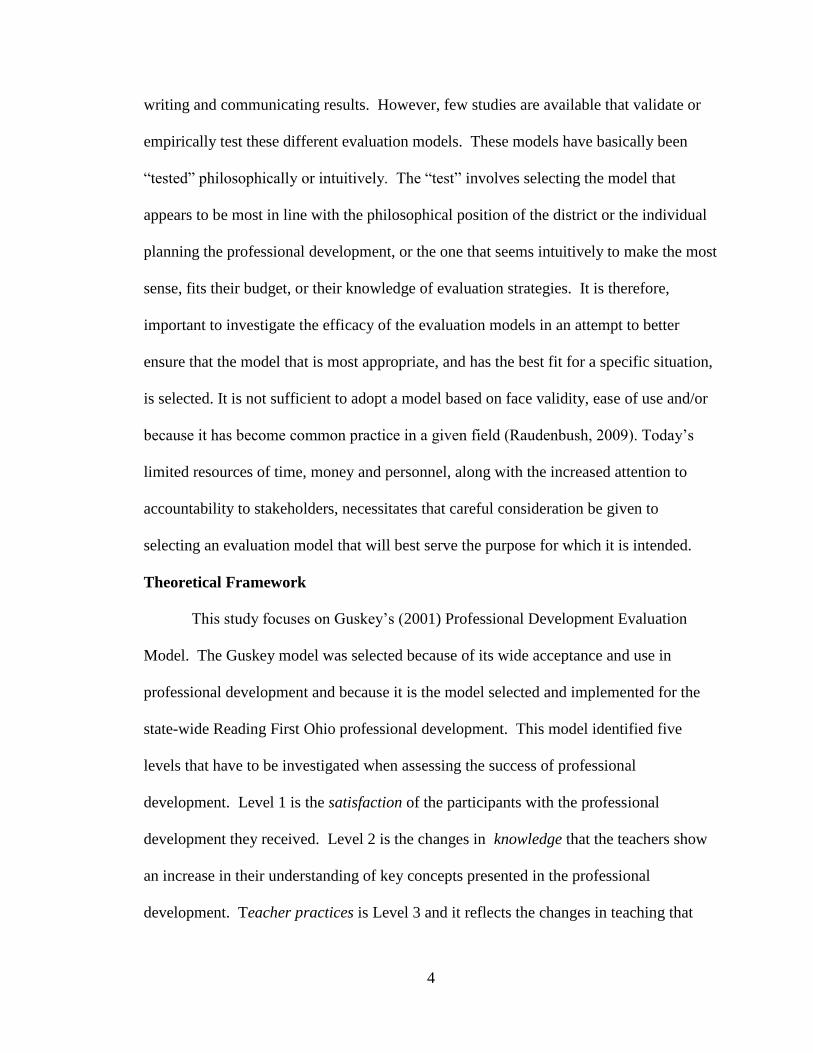
Guskey’s model is represented by these five levels/ components that make up a
nomological network (see Figure 1). This network suggests that there is a theoretical
relationship among and between these components. These relationships are the paths that
have to be measured to investigate the overall goodness-of-fit for this model. Figure 1
illustrates all of the theoretical paths.
Figure 1. Guskey’s Professional Development Evaluation Model
Nomological networks are subsets of theory that explain the number of
components that are supposed to be interrelated. Cronbach and Meehl (1955) defined a
nomological network as “the interlocking system of laws which constitute a theory” (p.
10). These laws are not concrete, unambiguous truths but are more closely related to
specific propositions. Cronbach and Meehl stated that some of these laws are observable
6
through quantitative measurements. Newman, Bliss, and Newman (2007) suggested that
this nomological network provides a framework for investigators to use both in the
collection of data and in conceptualizing the logic of the model as a way to confirm the
patterns of evidence that support the model.
The nomological network suggests sources of data as well as methods of data
collection and analyses. This network also suggests the relationships among the sources
of data. According to Cronbach and Meehl (1955), these relationships can be both
quantitative (deterministic) and qualitative (implicit and derived). Testing a nomological
network increases the power of the analyses, since the analyses are theory driven and are
not just testing one hypothesis but the relationship among a number of hypotheses.
Purpose of the Study
One of the most frequently used models to evaluate professional development in
education today has been developed by Thomas Guskey (1998). Guskey’s Professional
Development Evaluation Model has been widely used since it makes common sense and
it is logical. However, according to Gage (1999), it is not enough to just agree with the
common sense of a model because many times the logic is flawed. Therefore, even
though Guskey’s evaluation model makes logical sense, there is little empirical evidence
to confirm or dispute its effectiveness. By allowing researchers to test the logic of the
model and by helping decision-makers determine the effectiveness of their professional
development efforts, we can increase the probability that effective professional
development is sustained and that professional development that is not effective is either
modified so that it becomes so, or is discontinued. According to Kuhn, Popper, and
7
Kerlinger (1986), the philosophy of science is having a nomological net or theory that
needs to be tested empirically to advance science (Kerlinger, 1986; Kuhn, 1970).
The purpose of this study is twofold. First, it is to estimate the prediction validity
of Guskey’s Professional Development Evaluation Model. Secondly, it intends to clarify
the structural and ideological connections between important constructs and therefore
improve the overall organizational impact by refuting or confirming the claims of
Guskey’s (1999, 2000).
General Research Questions
To best test the nomological net supported by Guskey’s Professional
Development Evaluation Model and the underlying constructs defined by that model, this
study investigates the relationships between Satisfaction, Knowledge, Practices,
Administrative Support and Student Outcomes. The following research questions test
these relationships.
1. Does Satisfaction (Level 1) of Guskey’s Model predict Teacher
Knowledge (Level 2)?
2. Do Satisfaction (Level 1) and Knowledge (Level 2) of Guskey’s Model
predict Teacher Practices (Level-3)?
3. Do Teacher Knowledge and Teacher Practices (Level-2 & 3) predict
Growth in Student Achievement (Level 5)?
4. Do the operationally defined Student Gain variables, and the Teaching and
Administrative Support variables reflect the interrelationship of the levels,
as hypothesized by Guskey’s Model?
5. Is there an overall good Goodness of Fit for the components of Guskey’s
8
Professional Development Evaluation Model, as estimated by the
Binomial Goodness of Fit Index.
6. Is there a significant interaction between Knowledge and Satisfaction in
predicting Changes in Teacher Practice?
7. Does Administrative Support account for a significant proportion of
unique variance in predicting Student Achievement when controlling for
the mediating variables of Teacher Knowledge and Teacher Practices?
Significance of the Study
An improved model to evaluate the effectiveness of professional development
allows schools to better tailor their specific training to obtain their goals of interest. This
research is potentially useful in guiding teachers and administrators in how to utilize the
model to effectively measure changes in clinical practice such as teacher practices,
administrative support, and overall satisfaction with the professional development. This
research also attempts to impact specific methodological issues, such as understanding
complex phenomena by testing the nomological net. And since all of most evaluation
models, by their very nature, assume interaction between the components, this study
attempts to show the need for investigating these interactions to determine how some of
the components mediate other key components. This is important because very little, if
any, research on testing even mentions interactions. This research also evaluates the
interaction effects specific to Guskey’s Professional Development Evaluation Model and
it demonstrates a methodology that is capable of estimating the mediating effects. Lastly,
this research allows administrators to better inform constituencies, which is one of the
9
main purposes for conducting research, according to Newman, Ridenour, Newman, and
DeMarco (2003).
In our current climate of educational reform and accountability, it is important to
use the limited available resources to their best advantage. Just conducting professional
development without a sound basis of how it is being delivered is not sufficient.
Programs like Reading First Ohio, which rely heavily on effective professional
development to bring about the desired change in teacher practices and student learning,
are using Guskey’s Professional Development Evaluation Model to plan and gauge the
effectiveness of their professional development efforts. But little research has been done
to determine if this is an effective evaluation model to use. Therefore, there is a need to
empirically estimate the effectiveness of the criterion used (Guskey’s model) to assess the
efficacy of the ongoing professional development.
Delimitations
This study is delimited in two ways. First, it has been delimited to the Reading
First Ohio data available from years 2003-2009. Second, the levels of Guskey’s model
have been defined by using operational definitions that are specific to the Reading First
Ohio data set. Many of the data were self reported or obtained by observation in one
classroom for one day.
Operational Definitions
Assessment. Assessment measures the criterion based knowledge of children.
Evaluation. The systematic investigation of merit or worth.
Evaluation models. Evaluation models investigate the effectiveness of the
professional development.

10
District type. Derived from the ODE website 2005:
Rural: Agricultural, small student population, low to median income.
Urban: Large student population, median income, high poverty.
Major Urban: Large student population, very high poverty.
Guskey’s levels:
Level 1 (Satisfaction): A measure of overall approval of the training. This is
measured by satisfaction surveys from Westat (2008) and
the Reading First Ohio Center.
Level 2 (Knowledge): A measure of teachers’ gains in their own perception of
what they know. This is collected from the Westat surveys
and the Survey of Enacted Curriculum (SEC).
Level 3 (Teacher Practice): Changes in everyday teaching based on knowledge
gained through training and support provided by Data
Managers, Principals, and Literacy Specialist, and is
measured by changes in the SEC, ELLCO and Westat
surveys
Level 4 (Administrative Support): Perception of the overall support provided by
the Principals, Data Managers, Literacy Specialist and
Resource Coordinators to facilitate the best possible
teaching environment. This is measured by surveys
collected by Westat.
Level 5 (Student Achievement): Objective measures of student gains as measured
by the Dynamic Indicators of Basic Early Literacy Skills
11
(DIBELS) distance scores, the TerraNova and the Ohio
Achievement Test.
Nomological network. The relationships between the constructs of the
theoretically based models that are required in all models (Cronbach, 1984).
Professional development. Continuous, ongoing workshops to improve the
knowledge, and abilities of teachers, principals, literacy specialists, and data managers.
Reading First Ohio. Reading First is a federally funded program whose goal is to
have every child reading on or above grade level by the end of Grade 3. In Ohio this
program targeted the financially poorest districts that had the lowest achievement scores
in the state.
Student achievement. Defined by student scores on the DIBELS, TerraNova, and
the Ohio Achievement Tests (see Chapter III for more detail).
Summary
Program evaluation is a crucial component of many grant funded programs and
every federally funded grant program. Many of these federally funded programs are
intended to bring about change in education. While several evaluation models focus on
assessing change as a result of professional development, Thomas Guskey’s (2000)
Professional Development Evaluation Model is one of the most widely used of the
models that deal with educational reform.
In Chapter 1 the theoretical framework of the Guskey Professional Development
Model was described. This model stresses the importance of the interconnected
components. However, the lack of empirical evidence to support the efficacy of using this
model, along with the wide use of the Guskey model, strongly suggests that there is a

12
need to do this study. Additionally, Chapter 1 presented the problem, hypotheses,
delimitations, and definitions of the terms that are used in this research.
13
CHAPTER II
LITERATURE REVIEW
This chapter is organized into three sections that summarize the literature relevant
to this study. The first section examines why there is a need for evaluation of professional
development to improve teaching and learning. The second section reviews traditional
evaluation models. This section starts at one extreme of the continuum with the strictly
research driven models suggested by Stake and Scriven and moves to models that focus
on the needs of the organization suggested by Kirkpatrick. The third section focuses on
the reasons Guskey’s Professional Development Evaluation Model was selected as the
evaluation model to investigate and discusses the previous research on this model.
Overall Need for Evaluation
A number of research studies have indicated that a significant portion of the
professional development that occurs in education today is ineffective (Cooley, 1997;
Corcoran, 1995; Frechtling, Sharp, Carey & Baden-Kierman, 1995; Guskey, 1992, 1995,
2000). Guskey (2000) found that professional development for teachers has generally
been top-down and is too isolated, having very little overall effect on teacher practices.
He stated that these professional developments tend to be trendy with inadequate amounts
of scientific research. He also claimed that budgetary issues and lack of administrative

14
support further inhibit the potential effectiveness of these trainings and thus limit the
overall effect on teachers’ classroom practices.
Guskey (2000) suggested four reasons to place emphasis on professional
development (PD) evaluation:
1. Educators understand that PD must be ongoing, continuous, and job-
embedded. Newly acquired skills need to be practiced in an environment
that facilitates the polishing of these new techniques. Without evaluations,
teachers are incapable of assessing their own professional growth.
2. PD is supposed to be methodical and purposeful with the end result
focusing on systemic change. In order to assess whether these goals have
been fulfilled, a systematic collection and interpretation of the data is
required. This further supports the necessity of an evaluation.
3. More substantial support of the educational reform, occurring
continuously, would better inform and guide the reform.
4. Administrators, boards of education, government agencies, and parents
demanded increased accountability of districts to show educational
improvement and success. These improvements and expected outcomes
often focus on student growth.
Government agencies are placing increased accountability on school districts
through implementation of programs like the Comprehensive Continuous Improvement
Plan (CCIP), required by the Ohio Department of Education (ODE). ODE has drafted
Ohio’s Practical Handbook for Comprehensive Continuous Improvement Planning: Basic
Guidelines for Ohio School Districts (1998), which serves as a reference to show schools
15
how to conduct a continuous improvement plan for the betterment of educational
organizations. Districts are required to create CCIP’s that portray how they will increase
student achievement. “These plans must contain a district’s vision, an analysis of needs
and strengths, district goals, indicators of performance for student achievement, strategies
to improve results and processes within districts, and an action plan” (Ohio’s Practical
Handbook for Comprehensive Continuous Improvement Planning: Basic Guidelines for
Ohio School Districts, 1998, p. 48). Failure to submit a CCIP may result in a district
being sanctioned, having their funding suspended , and/or incurring other penalties.
Gathering evaluation data to indicate growth is a massive undertaking and
significant portion of the curriculum improvement process. All districts are required to
have data to document student learning improvement measured by overall achievement
and the educational process involved in enhanced student learning. The Ohio
Achievement Test (OAT) and the Ohio Graduation Test (OGT) provide critical indicators
of student and teacher accountability for Ohio school districts. This is especially true with
the implementation of the Value Added Models that have been adopted by ODE. These
Value Added Models assess student growth over time by comparing the student to his or
her own earlier test score. This allows each student’s growth to be assessed from his or
her own starting point. The final evaluation of each district’s success occurs at the end of
each school year in the State of Ohio School Districts’ Report Cards. These scores are
used by the state to determine whether a district should be placed on Academic Watch or
Academic Emergency. In the past eight years, the No Child Left Behind legislation has
given these designations increased weight. These classifications may result in schools
being reconstituted, which is a broad-scale replacement of staff that tends to feature the
16
removal of incumbent administrators and teachers for failing to show increases in student
test scores for six continuous years (NCLB, 2001).
There is little doubt that a need for effective professional development is
necessary to enhance student learning outcomes (Guskey, 2000). But, what does “being
effective” mean? According to the National Research Council (1999a), “No professional
development process is complete until the development committee has created a method
and schedule for periodic evaluation and improvement” (p. 42). Speck and Knipe (2001)
state that evaluations are needed to determine if professional development was effective.
They also explain the importance of districts analyzing their progress in terms of the
outcome of the professional development provided. Without this analysis, these two
researchers suggest that it would be impossible to tell if the professional development
yielded sufficient payoffs for the human and financial resources that were expended when
trying to improve teaching practices. During the implementation phase, when teachers in
the classroom use their new skills to expand the capacity of their students and impact
student outcomes, schools must reflect on the successes and failures of the professional
development to attain the desired results (Fitzpatrick, 1998; Guskey, 2000; McCaffrey,
Lockwood, Koretz & Hamilton, 2003; Zepeda, 2008).
Professional development is often designed to address a myriad of purposes. It is
the role of the evaluator to determine the success of the trainings based on the intended
purpose(s) and to what degree the goals were achieved. One potential problem is that the
determining factor for success of the professional development is often fixed to student
achievement. This is a narrow perspective of success and is not likely to lead districts to
reflect on the continuous improvement training (Loucks-Horsley, Hewson, Love, & Stiles

17
1998). Considering that “a broad range of indicators must be evaluated to conclude
whether or not the Professional Development has had any impact on teacher practices and
student learning within the district” (Louck-Horsley et al., 1998, p. 220), it can hardly be
perceived as satisfactory to focus all attention on a single component of the data
available. Louck-Horsley et al. suggested that the following questions be considered to
guide evaluations:
1. What are the goals and desired outcomes of the program or initiative?
2. How do you assess the accomplishment of the program’s outcomes?
3. How do you acknowledge and then evaluate how a professional
development initiative and its participants change over time?
4. How do you take advantage of evaluation as a learning experience in and
of itself? (pp. 221-222)
Traditional Evaluation Models
There are several evaluation models that have been used to determine if
professional development has led to systematic change. Some of the better known and
influential models were developed by Stake, Scriven, Kirkpatrick, Stufflebeam, and
Guskey. The following section briefly summarizes these models, but it primarily focuses
on Guskey’s Professional Development Evaluation Model.
Stake: Strictly Empirical Evaluation Models
Of the evaluation theorists described in this chapter, Stake is one of the most
grounded in an empirical research model (Alkin, 2004). He spent a majority of his time
on evaluating education and found that teaching ability and students’ ability to learn are
difficult to assess (Stake, 1998). There are many factors that influence student
18
performance and measurement of performance. Some of these factors include exposure to
language and words, sibling rivalry, genetic disposition, television, peer interactivity, and
schooling.
There are also many features that contribute to the evaluation process. Due to the
difficulty of measurement because of all of the possible variables, Stake makes the
following three points about formal evaluation: 1) No instrument should be used alone; 2)
a teacher should be evaluated on contributions to an entire program, not just a class; and
3) one can use existing research to improve teaching.
Stakes’ focus was on teacher and student evaluation and, particularly, on
standardized testing. He enriched the body of knowledge in this area through his
research. According to Stake (1998), standardized test evaluation is generally accurate,
relevant, and free from bias – but he questions if the scores indicate what they are
supposed to indicate. He states that in some states in the United States and in some
Canadian provinces adequate validation has seldom taken place and validation of
standardized testing as an indicator of teaching quality has not taken place (Stakes, 1998).
Moving from secondary education to post-secondary education, Migotsky and
Stake (2001) did a meta-analysis of a program that the Evaluation Center at Western
Michigan was chosen to evaluate. This program was for an Advanced Technical
Education program. The intention was to extend the skill of technicians in 20 advanced
technology fields. Annual status reports produced from the evaluation were
comprehensive. Results were significant because standards were met, the site visit teams
were appropriately staffed, and the evaluators were considerate of the centers. They
followed protocols such as collaboration with partners, professional development, etc.
19
One missing element in the design was that there was no comparison (control) group, but
it was determined that the evaluators met their obligations (Migotsky & Stake, 2001).
However, a major issue identified by Stake concerns the validity of the test. The
test has to adequately measure the standards that are being tested. Emphases need to be
placed on the fundamental difference between the psychometric and pedagogic
perceptions of teaching and learning. Do these tests measure attained ability or
experience? Additionally, supervisory evaluations are limited but programmatic changes
to the teacher’s pedagogy are not effective without some assessment. Stake said that,
unfortunately, the tools that are usually utilized in measuring supervisory evaluations
have been limited to scales and checklists and are not very insightful.
Therefore, the process presented by Stake (1998) contains three principals. Stake
said that no instrument should be used alone. He believed that the teacher evaluations
should not be done on one class but their whole contribution to the entire program. Stake
also suggests that we can use existing research to improve the teaching process and
communitarian teaching is vital.
Scriven: Founded in Empirical Measurements
Scriven, a researcher/evaluator theorist, agrees that there is difficulty in measuring
things for evaluative purposes. In 1998, he wrote an article entitled, “The New Science of
Evaluation,” in which he poses the question of whether clinical practice is an art or a
science. He suggests that evaluation is grounded in science but there is still an art to the
practice. Evaluation is a new discipline. Scriven noted that skeptics question the ability to
be aware of and maintain a balance between objectivity and bias (both of which are
crucial in evaluation). This article goes on to question whether one can be objective, or if

20
anything is really measurable. He suggests that objectivity is threatened when emotions
are involved. Every science uses evaluation. It is the primary methodology that
distinguishes good science from bad. Resistance comes from anxiety and fear. People are
afraid to be evaluated because the evaluation produces the data that increases the
likelihood they will be held accountable for their work.
Scriven argued that evaluation is difficult, and that science is only concerned
with, or should only be concerned with the world as it is. He suggests that good science
can be distinguished from bad science by the use of evaluation. Good science must be
evaluative, and should include the following characteristics:
1. Evaluation is the process of determining the worth. Therefore, it should
include one of the four basics of evaluation: grading, ranking, scoring and
opportunity.
2. Evaluation provides tools to other disciplines.
3. Evaluation develops its own models, themes, and procedures.
4. Evaluation is used everywhere within the change process.
5. Evaluation is a key process in all purposeful activities in everyday life.
(Screven, 1998),
The science of evaluation can often be framed as radical skepticism. Many times there is
a fine line between objectivity and bias (Scriven, 1998).
Scriven also discusses another huge dilemma of evaluation, the helper model
versus the scientific model. The helper model occurs when evaluators feel that they have
an active interest in the program’s success. This occurs when evaluators are involved in
both a summative and formative manner, but their ability to stay unbiased is
questionable. In the scientific model the evaluators are not actively involved with the
21
overall results of the project. Their role is solely to report on the facts. Their usefulness in
adding to the formative conversation is therefore limited.
In 1972, Scriven developed the Pathway Comparison Model, which has nine
steps. The first step is characterizing the program. Second is clarifying the conclusions
wanted. Third, he said that one has to check for cause and effect relationships. Fourth,
one needs to make a comprehensive check for consequences. Fifth, the process has to
assess costs. Sixth, one must identify and assess program goals. Seventh, the evaluation
must compare the program to critical competitors. Eighth, one must perform a needs
assessment as a basis for judging the importance of the program, and last is formulating
an overall judgment of the program. He found that this very timely and costly process
was necessary in a good evaluation. Some aspects of these steps are found in virtually all
evaluation models.
Kirkpatrick: Stepping Away From Strictly Empirical Research
Moving away from the strictly empirical research philosophy of evaluations
comes Kirkpatrick (1959a, 1959b). He suggested that nothing can be completely proven,
but one can show evidence of change. Kirkpatrick contended that it is possible to show
evidence of change if people are honest, if other factors that may influence change are
controlled for, and if pre-test/post-test evaluations are successfully administered.
Additionally, behavior can be assessed by simply asking (or as evidenced by) what a
person is doing differently. In this case observing behavioral or systematic changes is one
of the key factors in determining if there has indeed been a positive change as a result of
professional development.
22
In evaluating a training program, Kirkpatrick outlines a four-step approach or four
levels of evaluation (Kirkpatrick, 1959a, 1959b, 1960a, 1960b, 1996, 1998, 2005, 2006)
Level 1 is Reaction. This level measures how the participants feel about the program they
attended; a positive experience creates the greatest benefit. Level 2 is Learning: to what
extent did the trainees learn the information and skills presented in the program. Ideally,
in Level 2 there is increased knowledge of concepts, skills, and/or attitudes that will
improve job performance. Level 3 focuses on the extent the trainee’s job behavior has
changed as a result of the training. This level is titled Behavior, and it deals with whether
those having received the professional development did or did not use the skills they
learned on the job. Results are the final level and they can be identified through a number
of indicators such as: increased profits, quality and/or quantity of the program or change
at the job, turnover, grievances, reduced costs, improved production, or even student
achievement, etc.
Catalanello and Kirkpatrick (1968) did a study that examined the extent to which
Kirkpatrick’s four evaluation steps were used. One hundred fifty-four firms from a
variety of organizations throughout the U.S. and Canada made up the survey population.
The majority of these were industrial goods companies. Out of the 154 firms that the
Supervisory Inventories Human Relations (SIHR) questionnaire was sent to, only 47
returned the questionnaire, and only 35 used pretest and posttest measures. Forty of the
47 institutions measured trainee reactions, 21 measured behavior, while only 16 firms
attempted to measure the results.
These results indicated that very few firms used systematic and objective
measurements to examine professional development programs. Evaluations were largely
23
superficial and subjective with many evaluations assessing the reactions of their
participants. Few companies were attempting to statistically establish that their programs
were effective (Catalanello & Kirkpatrick, 1968).
Kirkpatrick’s model was not limited to evaluating training programs for
industries; it has also been adapted by schools. Naugle, Naugle, and Naugle (2000)
adopted this corporate training model and applied it to a secondary educational setting in
Lecanto High School in Kentucky. They argued that as the expectations of society have
increased and as society has begun to demand more from their schools, Kirkpatrick’s
Model should be utilized to evaluate improvements. In their opinion, this model is a
more effective tool to assess the accountability and quality of the professional
development offered in schools.
The Kirkpatrick model was adopted by a few schools in Kentucky and a variety of
industrial businesses that embraced the usefulness of having a simple model to provide a
vocabulary for evaluation criteria. However, there were several cautions about utilizing
Kirkpatrick’s model. These cautions suggest the assumptions of each stage are arranged
in ascending value that are causally linked, and that there are positive inter-correlations
within each stage that can lead to overgeneralizations of the findings, and a
misinterpretation of the program’s effectiveness (Personal Psychology, 1984).
Stufflebeam: A Move Towards Constructivism
Stufflebeam (2007) suggested that the two major reasons to do evaluation are for
accountability and to develop new knowledge that can and should be used to improve
practice. He makes more of a switch and starts to place more emphasis on the gains made
by the institution and less on the rigid experimental research design suggested by Stake.
24
During his work with evaluations Stufflebeam discussed both sociopolitical problems and
technical problems that have to be overcome to achieve the objectives of any evaluation
(Stufflebeam, 2000). He describes seven sociopolitical problems that have to be
addressed to enhance the evaluation process. The first issue, and a very important starting
point, is involvement. This focuses on getting the stakeholders involved in the process.
Stufflebeam recommends that an advisory panel be formed before presenting a plan and
that key players should participate in the design of the evaluation. This would give them
the opportunity to address any issues with the research questions or the evaluation design.
This could also be potentially helpful with the second issue, internal communication
problems. This requires the evaluator(s) to understand what to present and to try to ensure
that everyone involved understands his or her role. The third and fourth sociopolitical
problems deal with internal and external credibility. Internal credibility is the extent to
which personnel trust the evaluator(s). According to Stufflebeam, if the personnel do not
trust the evaluator(s), the data that is gathered will not accurately reflect what actually
occurred (that is it will not be internally valid). This is a different perspective than the
one held by Scriven who suggests that by gaining the trust and respect of the personnel,
the evaluators will bias themselves to the outcome. External credibility refers to the level
of trust the outside system has in the evaluators. Stufflebeam and Scriven would agree
that if there is poor external credibility, stakeholders are less likely to make the desired
adjustments to the programs that are suggested by the data. The next sociopolitical
problem mentioned is fidelity to the protocols. Lastly, public relations and the media,
need to be managed in such a way that would increased opportunities while decreasing
potential problems such as security of data (i.e., confidentiality, anonymity), protocol
25
(i.e., getting clearance), and public relations (i.e. keeping the public informed)
(Stufflebeam, 2000).
There are nine technical problems that Stufflebeam addressed in The Context,
Inputs, Process, and Products (CIPP) Model for Program Evaluation (2000). He stated
that the whole evaluation process starts by identifying objectives and variables. The hard
part of developing and deciding on objectives is to get personnel to define the objectives
in behavioral terms. Next, the evaluation team and advisory panel need to agree on an
investigative framework that would guide the evaluation. Stufflebeam also noted the
difficulty in finding assessment tools that are valid and reliable. He also said that it is
crucial to find the appropriate sample so that the findings of the evaluation can be
generalized.
The next few technical problems deal with data issues. Data gathering is
frequently reliant on others and outside factors such as what’s being gathered, where, and
by whom. One example might be a school counselor trying to study the smoking and
drinking habits of students in his or her school. If the students he/she is sampling are
under 18 then parent permission would be needed for student participation, and this can
be very difficult to obtain. Many problems also arise with data storage and retrieval. Data
should be checked for accuracy and coded and stored properly. The article also
recommends one check whether assumptions required for the data analysis will be met by
the data and assessing the provisions that have been made for performing the actual data
analysis.
All of this data analysis leads to reporting – among the last possible technical
issues. With reporting, several decisions have to be made regarding what will be reported,

26
how it will be organized, what tables to include, how long it should be, etc. (Stufflebeam,
1971). Summarizing the technical adequacy of the design should be a part of the final
steps. Some of the questions that need to be answered are: Have the variables been
identified? Has the framework been chosen? Is the framework appropriate? Have
sufficient provisions been made in collecting and storing data? Will the data yield
reliable results? and, Is it useable information?
Two other sets of potential problems that Stufflebeam identified are legal issues
and management issues. Legal problems may include how the client and evaluator roles
are identified, the specification of products, projection of a delivery schedule, authority
for editing evaluation reports, access to data, the release of evaluation reports,
responsibility and authority, and the source and schedule of payments for the evaluation
(Stufflebeam, 1971).
Possible management problems are:
1. The organizational mechanism - What organizational unit will be
responsible for the evaluation?
2. Organizational Location of the Evaluator – Will the evaluator(s) report
directly to the executive officer and/or directly to staff members?
3. Policies and Procedures – What is the correct protocol, if there is one?
4. Staffing Problems - Who is responsible for what?
5. Facilities – Is there office space?
6. Data Gathering Schedule – When are they to respond? What’s reasonable?
7. Reporting Schedule – When? How?
8. Training – One or more persons may need evaluation training.
27
9. Installation of Evaluation – Opportunity to install systematic evaluations
into the system, if capable.
10. Budget and Evaluation – Does it reflect the evaluation design? Is it
adequate?
Following the technical, sociopolitical, legal, and management issues are moral,
ethical, and utility considerations. In other words, what is the practical use of the reports?
Sometimes is necessary to take a philosophical stance. If it is necessary, which side will
be assumed – is it value free, value based and/or value plural? On the same issue of
values, will the evaluator(s)’ values conflict with the systems’ values? It can be difficult
to keep judgments out of evaluations; however, reports generally should not present
judgments, they should just report. Objectivity should remain constant and if one has lost
his or her independent perspective then he/she should consider revising and/or seeking
out evaluation help (Stufflebeam, 1971).
Evaluations should be done so that when completed there is some use for them. If
there are no prospects for utility upon completion, then one must consider whether or not
the evaluation is useful and if the potential payoff is worth all of the effort that would go
into the evaluation? “Payoff” can be defined in many different ways but the good should
outweigh the bad. These are very important questions that evaluators need to bear in
mind.
In 1974, Stufflebeam reviewed meta-evaluations. He previously defined meta-
evaluation as a procedure for describing an evaluation activity and judging it against a set
of ideas concerning what constitutes good evaluation (Stufflebeam 1971). Stufflebeam
stated that when conducting a meta-analysis, one needs to begin with an appropriate set
28
of criteria. A good place to start is by determining what is acceptable in research.
Researchers must identify what information is needed to provide sufficient evidence of
internal and external validity. In other words, is the research measuring what it purports
to measure and can it be generalized. Not only does the research have to be reliable, but it
also must be valid and useful to some audience. Other important characteristics of
acceptable research include: objectivity, relevance, importance, cost effectiveness,
timeliness, credibility and whether or not it answers important questions that the
researcher was intending to answer.
There are certain premises to a meta-evaluation. Evaluation is an assessment of
merit and serves as a decision making and/or accountability tool. Because of this,
evaluations should assess goals, designs, implementation, and results. They should also
serve all persons affected by the program being evaluated. It is a good idea to have the
evaluation carried out by both insiders of the program and outsiders. Once again, it
should also be technically adequate and cost effective.
Steps in a meta-evaluation process include delineating the information
requirements, obtaining the needed information, and applying the obtained information.
Objects of a meta-evaluation are the goals, or intentions of answering evaluation
questions, designs, processes, and results. Stufflebeam (1971) suggests several designs:
Design #1 for a pro-active assessment of evaluation goals – serves decision-
making in evaluation work.
Design #2 pro-active – efforts that identify and rank alternative evaluation
designs. It may be necessary to invent a new design, - including matters of
sampling, instrumentation, treatments, and data analysis.
29
Design #3 pro-active assessment of the implementation of a chosen evaluation
design – administrative and technical decisions to be made in operationalizing
the chosen design. Characteristics of the design need to be explicated and
potential problems in the design need to be projected.
Design #4 pro-active assessment of the quality and use of evaluation results.
Three things must be done: the objectives should be noted, the meta-
evaluation criteria of technical adequacy, utility, and cost/effectiveness should
be spelled out, and the intended users of the primary evaluation results should
be designated.
Design #5 retroactive assessment of evaluation studies – meta-evaluation of
goals, designs, implementation, and results usually are combined into a single
summative case study. Main step: determine the intents of the evaluator, what
audience did he/she intend to serve, what evaluation design was chosen to
achieve these goals? How did the evaluator intend to carry them out?
Guskey’s Model
The Model
Guskey’s Professional Development Evaluation Model consists of five primary
components. These components are: (Level 1) Satisfaction, (Level 2) Learning, (Level 3)
Change in Practices, (Level 4) Administrative Support, and (Level 5) Student
Performance (Guskey, 1998). As one can see, four of the five components are reflective
of Kirkpatrick’s model. The only addition is Guskey’s fourth component, Administrative
Support. That specific component was one of the major reasons why Guskey’s model was
chosen for this research. It seems to be vitally important, as described by Guskey,
30
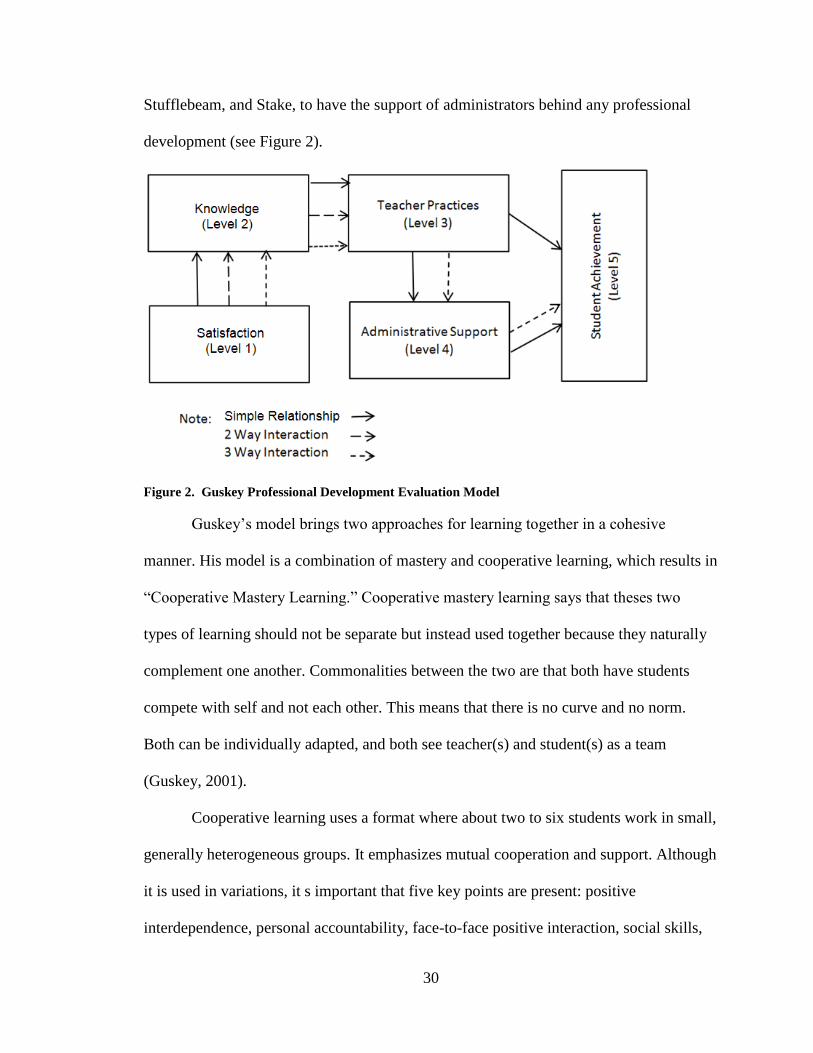
Stufflebeam, and Stake, to have the support of administrators behind any professional
development (see Figure 2).
Figure 2. Guskey Professional Development Evaluation Model
Guskey’s model brings two approaches for learning together in a cohesive
manner. His model is a combination of mastery and cooperative learning, which results in
“Cooperative Mastery Learning.” Cooperative mastery learning says that theses two
types of learning should not be separate but instead used together because they naturally
complement one another. Commonalities between the two are that both have students
compete with self and not each other. This means that there is no curve and no norm.
Both can be individually adapted, and both see teacher(s) and student(s) as a team
(Guskey, 2001).
Cooperative learning uses a format where about two to six students work in small,
generally heterogeneous groups. It emphasizes mutual cooperation and support. Although
it is used in variations, it s important that five key points are present: positive
interdependence, personal accountability, face-to-face positive interaction, social skills,
31
and group process (Guskey, 2002). Mastery learning is based on a one-on-one tutoring
process and has three key points: feedback, corrective enrichment, and congruence
among instructional components. With this type of learning there are clear expectations,
activities that engage students, feedback and evaluation. Some argue that with mastery
learning teachers spend more time with students but that nothing is really gained by this
method. Furthermore, the idea is that it is not quantity but quality (time students are
engaged) that makes a difference. However, over time the need for extra time diminishes
and mastery learning is not much more expensive, with its benefits outweighing its
negatives. Mastery learning is used in a variety of teaching settings such as school
improvement programs. Guskey attempts to pull out the good from mastery learning to
meld it with cooperative learning for a type of learning that is much more effective than
either one by itself (Guskey, 2002).
In an article published in 2001, Guskey gave readers a little insight into why he
developed his evaluation model. This article began with Guskey discussing his past
teachers and experiences and unfair testing or tests that were made to “trick” students. He
stated that he learned two things from those kinds of experiences: hard work does not pay
off and teachers cannot be trusted. Luckily, teaching has much improved today.
Guskey decided to write about professional development and teacher change
about a year after that journal article was published. The article presents a perspective on
the natural change in attitude, beliefs, and learning outcomes for children when teacher
professional development is successful. The article suggests that most programs fail
because they do not take into account what motivates teachers and the process by which
32
change in teachers typically occurs (Guskey, 2002). Similar to students, teachers
recognize the importance of development when they see results.
Like Kirkpatrick, Guskey believes that professional development should lead to
change in the teachers’ classroom practices that lead to change in student learning
outcomes, which then lead to change in beliefs and attitudes regarding improvement. The
model suggests that beliefs and attitudes only change after outcomes show a change.
Teachers’ attitudes did in fact improve after the results were positive (Guskey, 2002).
Reminders from this body of knowledge are that change is gradual and difficult, teachers
need feedback, and continued follow-up should be provided. These ideas are elaborated
on in the discussion of Guskey’s five practice principles and his five levels of evaluation.
Research Using Guskey’s Professional Development Evaluations Model
Three school districts (urban, rural and suburban included) with 120 teachers, 46
male and 74 female, participated in a study regarding teacher efficacy (Guskey, 2001).
All teachers participated in the same staff development program. The model focused on
the context variables hypothesized to affect teacher efficacy. This studies indicate that the
most powerful variable that accounted for the largest proportion of variance was teacher
perceptions. With mixed results, some studies show that student performance outcomes
influence teacher efficacy (Guskey, 2001.).
Results of Guskey’s research (2001) indicated that perceptions of efficacy differ
depending upon the nature of the student outcome. The group of highly experienced
teachers that were surveyed expressed significantly greater personal efficacy when the
performance outcome was positive. It was discovered that teachers do appear to
distinguish in their perceptions of efficacy between results with a single student and those

33
with a group of students. Further analysis revealed, however, that these perceptions differ
significantly only when the performance outcome is negative. When poor performance
was involved, teachers expressed less personal responsibility and efficacy for single
students who do poorly than for results from a group or an entire class of students. Poor
performance on the part of a single student was generally attributed to situational
experiences outside of the teacher’s control. In conclusion it was discovered that the
teachers’ affect, or feeling about teaching self-concept, were strongly related to their
perceptions of personal efficacy for group results.
Findings from research done by Guskey (2001) offered a different, more specific
reminder on how to evaluate one’s self as a teacher which may help both students and
teachers identify those positive results necessary for supported change. Teachers should
keep track of how many students miss certain questions on examinations. If more than
half of the class misses a question, then it is worded wrong or they did not learn the
material to begin with. Many teachers are shocked to know that they are not great judges
of what is working. Guskey (2001) added that critics may say that not enough
responsibility is on student. He agreed that some students do not put in the proper effort
and some responsibility needs to be put on them. His idea to ameliorate this is to
encourage more collaboration.
More collaboration between student and teacher leads to Guskey’s Five Practice
Principles. The first principle is to depict classroom assessments as learning tools so that
students feel that they are less like evaluations and more part of the instructional process.
(No “tricking” involved here.) Guskey’s second principle is to regularly review
assessment results because they can reveal instructional problems within the teaching.
34
Collaborating with other teachers is the third principle; shared strategies are good for
teacher practice improvement. The fourth principle is to develop partnerships with central
office personnel and outside experts who may be able to provide valuable information
and who may have access to different resources. Lastly, the fifth principle is to take note
of improvements. Recognizing success can generate more success (Guskey, 2001).
Guskey articulated these five principles and he also identified five levels of
evaluation (2002). He claimed that his evaluation process was a systematic estimate of
merit and worth and that each evaluation level builds on the other. The first evaluation
level is participants’ reactions which asks, “Did participants like the experience and did
the material make sense?” Participants’ reactions are usually measured at the end of a
process in the form of a questionnaire. The next level looked at participants’ learning,
which is defined as measurements of what is gained. This can be done through a paper-
pencil assessment, portfolios, orally, or in another written form. Level 3 is about
organizational support and change. These deals with the extent to which resources were
made available, problems were addressed, and other matters such as school records,
meeting minutes, etc. Level 4 is participants’ use of knowledge and skills. Basically, this
level asks, “Did participants apply what they learned?” This can be measured by
questionnaires, interview, and by video/audio means. The last level is then student
learning outcomes – the goal from the beginning. This level asks, “Are student scores
higher? Are they more confident?” Student records can be examined, interviews may be
conducted, and even parents may be asked to evaluate the last level.
Guskey (2002) suggested some tips for these levels of evaluation. An innovative
method for tackling an evaluation is to start backward by identifying what one wants at
35
the end. This “backwards design” was made popular by Wiggins and McTighe in their
workbook, Understanding by Design (1998).
In the above-mentioned levels, this “backwards design approach” would consider
student outcomes first. Also, gathering evidence using measures that are meaningful to
stakeholders involved in the evaluation process is of great importance. Bear in mind that
it is important to look for evidence not proof. Guskey also says it is important to know
that breakdowns can occur at any level of the evaluation process, but they can be
overcome.
In 2004, Guskey and Sparks wrote a paper on what to consider when evaluating
staff development. This model describes the relationship between staff development,
student outcomes, and external factors. It projected that content, plus quality, plus an
organizational climate/culture would result in improvement. Not all program content is
the same and not all of it is research-based, however, according to Guskey and Sparks,
studies suggest that many factors are necessary for lasting improvement. These factors
include a clear vision, goals, a multiyear process, and steady instructional leadership. In
their paper, Guskey and Sparks also refer to many of the principles of evaluation
mentioned previously.
Part of the evaluation guidelines that Guskey wrote about in 2001 and beyond
have roots in his supervisory guidelines that he developed in 1991. He described five
important guidelines. Guskey pointed out that change is an individual process so it is
important to look beyond policy structures and look at the micro-level. Change brings
anxiety and change is difficult, but also of importance is to think big, not small.
Successful programs approach change in increments. Thinking big means to be ambitious
36
but make it happen in steps. One way to diminish anxiety is to work in teams. Teams
encourage relationships and work to share tasks and responsibilities. Although teams are
usually better, it is still important for individuals to feel that they have a say in things.
Individual, professional feedback is crucial. Without any feedback regarding results, the
desired outcomes may be abandoned or goals forgotten. If changes are to be sustained,
feedback is very important. Lastly, it is important to have continued support and follow
up help to provide guidance and direction toward intended goals. This guidance can be
delivered in the form of coaching, technical feedback, or on the job assistance, to name a
few. The guidelines seem obvious and they can make a difference between a program
success or lack of success, but they are hardly ever put in place (Guskey,1991).
Guskey also decided to do a comprehensive review of 13 different lists of the
characteristics of professional development (2003). Most of the lists identified
themselves as “research based,” but most were not rigorous investigations. He found that
many of the characteristics were really ideas that were favored by the authors, or were
simply their personal opinions. The top ten characteristics were:
1. Enhances teacher content and pedagogic knowledge.
2. Provides sufficient time and resources.
3. Promotes collaboration.
4. Includes procedures for evaluations.
5. Aligns with other reform initiatives.
6. Models high instruction.
7. Is school or site-based.
8. Builds leadership capacity.
37
9. Based on teachers’ identified needs.
10. Driven by analysis of student learning data.
The most frequently cited characteristic of professional development was
enhancement of teachers’ content and pedagogical knowledge. Helping teachers to
understand more deeply the content they teach and the ways students learn that content
appears to be a vital dimension of effective professional development. However, so far,
most studies focus only on math and science, ignoring other content areas.
Another frequent characteristic was time. Most lists mention provision of having
sufficient time and other resources as essential. But research does not, so far, demonstrate
that time makes that big of a difference. Another is collaboration. Most stated this as an
important characteristic, but research also indicates that collaboration can block change
just as easily as it can promote it. The previous list suggests professional development
should happen on site but research also suggests that this does not make a difference.
People tended to use only programs close to what they were already doing (Guskey,
2003).
In conclusion, this examination of the characteristics of professional development,
suggests that there is no consensus on the effective characteristics of program
development. Guskey’s (2003) analysis of the 13 lists suggests that the research to
support characteristics for professional development is inconsistent and conflicting. He
also states that he found the lists to be more opinion then empirically based. Professional
development approaches may be too complicated to be in a “list.”
Desimone (2009) conducted further research into which components of evaluation
models are critical for improving professional development. She conducted a Meta
38
Analysis of the components that were most used in evaluation models of professional
development. Many of these components identified during her analysis are included in
Guskey’s Model. A few of the more prevalent components that Desimone found were
Teacher Knowledge, Teacher Practices and Student Achievement. An earlier study
conducted by Mullens, Murnane and Willett (1996), also found a significant relationship
between Teacher Knowledge and Teacher Practices for improving Student Achievement.
Additionally, O’Donnell & White’s (2007) added in principal leadership and
administrative support as critical components. Guskey’s Professional Development
Evaluation Model incorporated all of these components that were included in these
studies.
Even though many evaluations are being conducted using Guskey’s model and
others have found that some of the individual components were predictive of each other,
no studies have been done to investigate the validity of the entire model. No studies that
this researcher could find focused on the nomological net, the theoretical relationships
between his components. As Stake suggests, one has to make sure that the instruments
being used during the evaluation are reliable and valid. This should also hold true for any
of the theoretical models that are being used for evaluating the process. Without this clear
empirical proof that the model is valid and reliable, one has to be very careful when
interpreting findings. Therefore, this study delves into the question of the reliability and
validity of one of the more commonly used professional development evaluation model.
39
Summary
Chapter II, which is organized into three sections, describes why there is a need to
evaluate professional development to improve teaching and learning, and it briefly
describes evaluation models developed by Stake, Scriven, Kirkpatrick, and Stufflebeam.
The third section focuses on some of the components and research conducted by
Guskey’s Professional Development Evaluation Model. This section also indicated the
lack of empirical evidence and the need for validation of Guskey’s Model. That is
precisely why it was chosen as the evaluation model to investigate in this study. This
section explores the theoretical components of Guskey’s Model, and reviews previous
evaluations of this model.
40
CHAPTER III
METHOD
Restatement of the Problem
In most evaluations using Guskey’s Professional Development Model, the model
and its components are used as criterion variables. In this investigation the theoretical
relationships of the components of Guskey’s Model are the independent variables and the
dependent variable is the data from Reading First Ohio 2003 to 2007. Variables in this
data set have been a priori identified as representative of specific components of
Guskey’s Model. These variables were then used to determine if they are predictive of
the nomological net represented by the Guskey Model.
Research Design
This investigation utilized an ex post facto research design with hypotheses and
tests of alternative hypotheses (Newman, Newman, Brown, & McNeely, 2006; Pedhazur
& Schmelkin, 1991). The validity of this design is increased by stating relevant
alternative research hypotheses. According to Newman & Newman (1994), “ex post facto
research with hypotheses and tests for alternative hypotheses is considerably more
powerful in terms of internal validity than pre experimental, ex post facto designs with no
hypotheses, and ex post facto designs with hypotheses” (p. 112). This is especially true
41
when testing a nomological net. In addition, Newman et al (2006) indicate that this type
of research design has a potential of higher external validity when compared to quasi and
true experimental designs.
Kerlinger and Lee (2000) have identified three weaknesses of ex post facto
design. These weaknesses include the inability to manipulate the independent variable,
the lack of power to randomize, and the risk of improper interpretation. The researcher’s
lack of ability to control the independent variables due to ethical or convenience reasons
only allows the researcher to demonstrate relationships and not to infer causation
(Kazdin, 1992). However, when one is doing a validity study, such as testing the
nomological net, there is no independent variable to manipulate and ex-post facto
research design is one of the most efficient ways of conducting the investigation.
Selecting Guskey’s Professional Development Evaluation Model
There were several reasons why Guskey’s Professional Development Evaluation
Model was selected for this study. Guskey’s model incorporates many of the previously
mentioned concerns in evaluation that were addressed by Kirkpatrick, Scriven,
Stufflebeam and Stake but it is anchored in educational settings, whereas the models
developed by Scriven and Stufflebeam primarily focus on business and corporate
settings. Those models are often not suitable for the unique world of education (Guskey,
1998). There are differences between teacher professional development models,
specifically Guskey’s model, and those models oriented more toward businesses. The
atmospheres are too different for there to be enough congruence in the evaluation process
for businesses versus schools (Alliger & Janak, 1989; Holon, 1996). Additionally, this
model was selected because of its frequent use in education, because teachers are able to
42
easily understand it, and because it was selected by Reading First Ohio as the most
appropriate Professional Development (PD) evaluation model for the training of teachers,
Data Managers, Literacy Coaches, and other Reading First personnel.
Problem
In most evaluations using Guskey’s Professional Development Evaluation Model,
the model and its levels are used as the criterion variable (Guskey, 2001). In this
investigation, it is the levels of the model that are being investigated to determine if their
relationships are consistent with the nomological net represented by Guskey’s model.
The data from Reading First Ohio, years 2003 to 2009, were used as the data source to
test the hypothesized interrelationships represented by the nomological net. These
variables were operationally defined and identified a priori as being representative of the
specific levels that are present in the model.
Data Sources
The data for this research comes from the Ohio Department of Education and the
school districts that participated in Reading First Ohio (RFO) between 2003 and 2009. In
order for districts to be involved in Reading First they had to meet the requirements as
specified by the Ohio Department of Education. Every district that met the achievement
and financial requirements was invited to respond to the request for grant proposals sent
out by the Ohio Department of Education. Districts had three opportunities to respond to
the request.
The sample for this study included every student, teacher, principal, literacy
specialist, resource coordinator and data manager involved in Reading First Ohio from
2003 to 2009. This encompasses 31 districts and 124 schools. There were 64,411
43
students that participated in RFO during this period. Out of this population, 2,364 were
measured 12 times, 10,346 were measured at least 9 times, 25,399 were measured at least
6 times, and 52,323 were measured at least 3 times. These students ranged from
kindergarten through 3rd
grade. In addition, there were more than 1,000 teachers
involved. It is important to note that as stipulated by ODE requirements, these were the
lowest achieving and financial poorest districts in the state. The following instruments
were used to collect the data on all levels of Guskey’s model.
Instruments
The instruments chosen for this study were selected by Reading First Ohio or
created by the Reading First Ohio Center and Westat. The student achievement data was
collected from three different instruments: the Dynamic Indicators of Basic Early
Literacy Skills (DIBELS), the TerraNova (TN), and the Ohio Achievement Test (OAT)
which is only administered to the students involved at the third grade level. Data about
teachers, data managers, literacy specialist, and principals were collected from
evaluations after the literacy specialist training and from the Westat surveys. Changes in
classroom practices were collected using the Early Language and Literacy Classroom
Observation (ELLCO) and from the Survey of Enacted Curriculum (SEC).
Dynamic Indicators for Basic Early Literacy (DIBELS)
Dynamic Indicators of Basic Early Literacy Skills (DIBELS) was created by
Roland Good (2002). This test is used to assess the acquisition of early literacy skills
from kindergarten through sixth grade (Good & Kaminski, 2002). This is a short one-
minute fluency measure that monitors the development of the skills required to become
literate. The test was administered to each student individually three times per year, with
44
each administration occurring within a two-week testing window. There are four basic
developmental skills that this instrument assesses: Initial Sound Fluency (ISF), Phonemic
Sound Fluency (PSF), Nonsense Word Fluency (NWF), and Oral Reading Fluency
(ORF). The single probe reliability for the ISF ranged from a low of .61 to a high of .86
and was only used in Kindergarten. PSF had a reliability of .74 in kindergarten. In
kindergarten the PSF ranged from a low of .86 to a high of .94. In first grade, the NWF
was about the same with a reliability ranging from .83 to .94. Oral Reading Fluency
started in first grade and continued through third grade. The lowest reported reliability
was .92 with the highest equal to .97. Only on ORF is there test-retest reliability, which
resulted in an estimated reliability of .97. In addition, both predictive and concurrent
validity was estimated for the ORF. The estimate for predictive validity ranged from a
low of .62 to a high of .72. Concurrent validity estimates ranged from a low of .67 to a
high of .82, thus suggesting that this instrument is both valid and reliable (Betts, Good,
Cummings, Williams, Hintze, & Ysseldyke, 2007).
TerraNova (TN)
The TerraNova was developed to provide achievement scores that are valid for
most types of educational decision-making (CTB McaGraw-Hill, 2001). The test results
include measurements of achievement for individual students related to a current national
normative group. Progress can be tracked over years and across grades. The TerraNova
can also be used in a criterion-referenced manner to measure gains in student academic
strengths as well as to identify weaknesses in each of the content areas. This test can be
used administratively to make programmatic decisions and assess overall class progress.
Content validity was established by expert judges who compared the TerraNova content
45
with current classroom practices and with curricula that are used nationally. These expert
judges stated that the assessment accurately represents the important educational
objectives seen throughout the nation. The construct validity was approximated by
reviewing the correlations between the TerraNova, the CTBS complete battery, and the
TCS/2. The Reading Composite subscale and the other test correlations ranged from .56
to .80, with a total TCS/2 correlation of .72.
Ohio Achievement Test (OAT)
The Ohio Achievement Test (OAT) is a criterion referenced test that was created
by the Ohio Department of Education to assess mastery of state specific standards. This
test is first administered to students at the third grade level and therefore the only data
collected was from third graders in RFO schools. There is no actual reported estimate of
validity on this test, only that it was reported as valid by an expert judge committee
(Personal communication with Paula Mahaley and Chad Richardson Data Manager,
Office of Literacy Center for Curriculum and Assessment Ohio Department of Education,
2008). There is a yearly report on the reliability of the OAT produced by the Ohio
Department of Education. From the onset of the development of this instrument the
reliability has ranged from a .86 to a .92. The 2008 reliability was reported at a .90
(Office of Assessment, Ohio Department of Education).
Survey of Enacted Curriculum (SEC)
The Survey of Enacted Curriculum (SEC) was created by the Wisconsin Center
for Educational Research (WCER) in 1995. The SEC is a reliable data collection tool
that provides an objective method for analyzing the degree of alignment between
instruction and state content standards. This is a self-reported on-line survey where
46
teachers at the end of the school year have a three-week window to log on and reflect on
their teaching practices for that year (Blake, 2005). The reliability and validity for both
the English Language Arts and the Math/Science section of the SEC were not well
reported. There were several more studies that investigated the Math/Science section of
the SEC since it was this instrument’s original focus. The English Language Arts section
was not developed until 2002 and the standards were not mapped until 2003. There were
expert judges that worked with the WCER and the Ohio Department of Education on
aligning Ohio state standards to the SEC questions. There does not seem to be any
reported internal reliability, test-retest or predictive validity estimates available for this
instrument. This conclusion was achieved after contacting Chris Woolard, Director of the
SEC project for ODE, Learning Points Associates, and John Smithson, Director of the
SEConline, and the WCER. All reports indicate that there is high reliability and validity
but no numbers are reported.
Early Language and Literacy Classroom Observation (ELLCO)
The Early Language and Literacy Classroom Observation (ELLCO) was created
by the Educational Development Center, Inc. (2002). This observational field-test was
designed to assess the effectiveness of professional development and teacher practices.
Trained observers completed the three components of Literacy Environment Checklist,
Classroom Observation with Teacher Interviews and Literacy Activities Rating Scale.
This study utilized the Classroom Observations scoring as an indicator of classroom
implementation and best practices. Identified teachers from kindergarten through third
grade were observed in the fall and again in the spring. Scores were aggregated by grade
level or by building per practices agreed upon as part of the grant administration. The
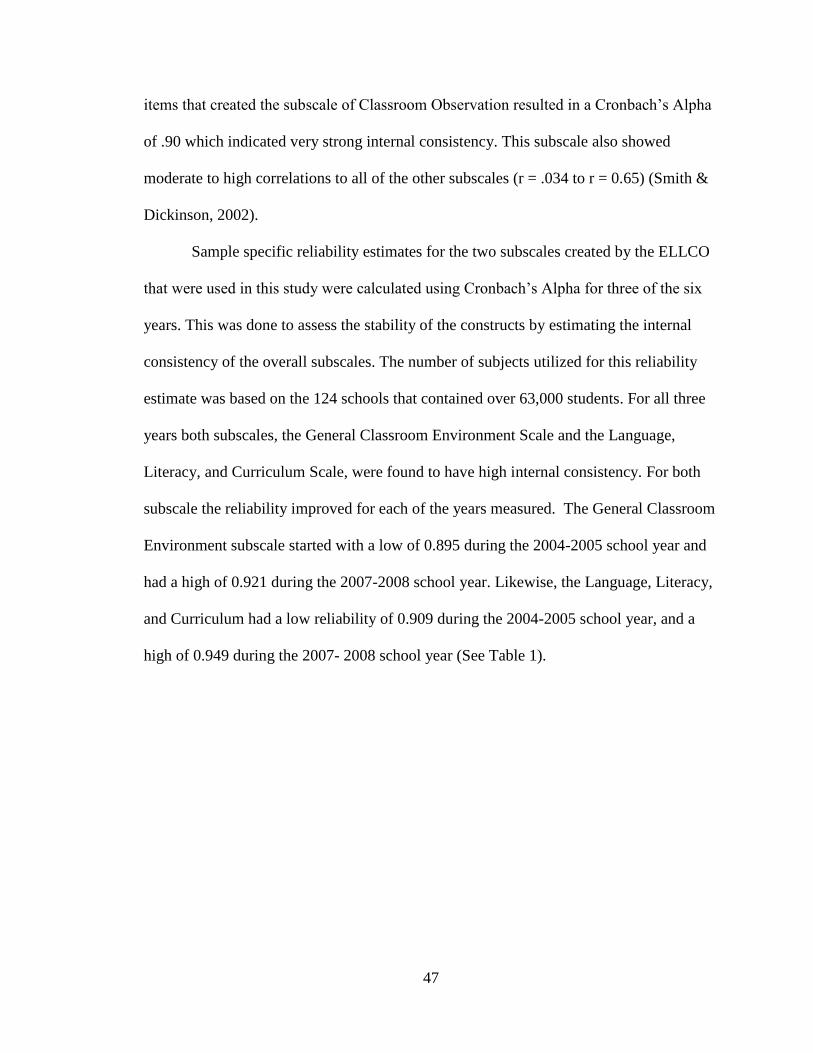
47
items that created the subscale of Classroom Observation resulted in a Cronbach’s Alpha
of .90 which indicated very strong internal consistency. This subscale also showed
moderate to high correlations to all of the other subscales (r = .034 to r = 0.65) (Smith &
Dickinson, 2002).
Sample specific reliability estimates for the two subscales created by the ELLCO
that were used in this study were calculated using Cronbach’s Alpha for three of the six
years. This was done to assess the stability of the constructs by estimating the internal
consistency of the overall subscales. The number of subjects utilized for this reliability
estimate was based on the 124 schools that contained over 63,000 students. For all three
years both subscales, the General Classroom Environment Scale and the Language,
Literacy, and Curriculum Scale, were found to have high internal consistency. For both
subscale the reliability improved for each of the years measured. The General Classroom
Environment subscale started with a low of 0.895 during the 2004-2005 school year and
had a high of 0.921 during the 2007-2008 school year. Likewise, the Language, Literacy,
and Curriculum had a low reliability of 0.909 during the 2004-2005 school year, and a
high of 0.949 during the 2007- 2008 school year (See Table 1).
48
Table 1
Cronbach’s Alpha Internal Reliability Estimates of The ELLCO
Factors Cronbach’s Alpha N of Items
General Classroom Environment (2004-2005) 0.895 6
Language, Literacy, and Curriculum (2004-2005) 0.909 8
General Classroom Environment (2005-2006) 0.911 6
Language, Literacy, and Curriculum (2005-2006) 0.948 8
General Classroom Environment (2007-2008) 0.921 6
Language, Literacy, and Curriculum (2007-2008) 0.949 8
Note: Only 3 years of ELLCO data were made available.
Westat.
Westat is the independent evaluation firm hired by the Ohio Department of
Education to serve as the external evaluators for Reading First Ohio. There were several
surveys and instruments developed by Westat to assess changes in Teacher Knowledge,
changes in Teacher Practices, teachers’ view on Administrative Support, and the overall
buy-in by administration and teachers. Data on reliability and validity on these
instruments were tested utilizing Rosh Modeling. These results indicated that the
instruments had high reliability.
Data Collection Procedures
This study used the Reading First Ohio (RFO) data that has been collected from
the various organizations involved in the implementation of RFO. The student
achievement, evaluations of professional development, changes in teacher knowledge and
practices were all collected through a joint effort between the Reading First Ohio Center
and the Ohio Department of Education. In addition, satisfaction surveys and classroom

49
and administrative support data were collected by the Reading First Ohio Center and
Westat, the external evaluation firm hired by the Ohio Department of Education to
evaluate the effectiveness of Reading First Ohio. Every student, teacher, literacy
specialist, data manager, and principal that attended or worked in a Reading First Ohio
school is included in this study. For schools to qualify for Reading First Ohio they had to
be in the bottom 60% of the state schools, both financially and academically. Every
participating district signed an agreement with the state to collect ongoing data about the
imbedded professional development. In addition, the schools were required to send the
Ohio Department of Education student test scores four times a year. One hundred
percent compliance with this process was required by ODE or the districts ran the risk of
losing their RFO funding. To protect the confidentiality of the students, the state student
identifier (SSID) was used in place of names. This SSID is a number that follows the
student anywhere within the state. In other words, if a student starts in one RFO district
and moves to another RFO district, the test scores from the new district are assigned to
that student. However, because there was no way to protect teacher confidentiality, all
teacher level data were aggregated by grade for each of the 124 RFO schools.
Statistical Analysis
Descriptive and inferential statistics were utilized in this study. The research
hypotheses were tested using correlations, multiple linear regression, and hierarchical
linear modeling. To test the overall fit of the model the Binomial Goodness of Fit Indices
was used to test the number of correct paths predicted by the model.
50
Principal Component Analysis
The first stage in testing the specific research hypotheses utilized Principal
Component Analysis (PCA) to create factor constructs that reflected the constructs
theorized in Guskey’s Professional Development Evaluation Model. These constructs
were then used to test specific hypotheses. In this study, Principal Component Analysis
was used to identify possible relationships among variables. It is important to note that
the production of a factor through PCA, in and of itself, is not necessarily meaningful
(Newman et al., 2006). A factor is only meaningful if it can be interpreted. Factor
rotation enhances interpretation (Kerlinger & Lee, 2000; Newman et al., 2006; Rummel,
1970; Stevens, 2002; Tabachnick & Fidell, 2007). The varimax method of orthogonal
rotation is a commonly used technique that was employed in this study. This method
attempts to produce either a high or near zero factor loading, making the factor easier to
interpret. That is, it rotates towards a simple structure.
Multiple Linear Regression
Multiple linear regression (MLR) was used in analyzing the variance when
predicting the criterion variable from the treatment variable, while controlling for
(covarying) variables to test the possible alternative explanations for the alternative
hypotheses. MLR is the most general case of the least squares solution, and it can be used
any time any special case of the least sums of squares is used. MLR was selected because
it is more flexible than traditional analysis of variance. With MLR one can write models
that reflect the specific research questions being asked. This makes every test of
significance a test of a specific hypothesis. In addition, Newman et al. (2006) and
Pedhazur (1982) pointed out that with MLR one can test relationships between
51
continuous variables, categorical variables, interaction between continuous and
categorical variables, as well as categorical – categorical interaction and continuous-
continuous interaction.
Hierarchal Linear Modeling (HLM)
One of the historical problems with analyzing program effectiveness, or factors
that predict achievement in schools, is the structure of the data. If one has student level
data, classroom level data and school level data, this is an organizational or nested
design. In this study, students are nested within classrooms which are then nested in
schools. There are several researchers that have discussed issues with nested designs.
But what is a nested design? According to Hayduk (1996) and Pedhazur and Schmelkin
(1991) a nested design is when one has a model where one or more of the variables are
constrained (having them equal 0). Hair, Black, Anderson, and Tatham (2006) state:
A model is nested within another model if it contains the same number of
constructs and can be formed from the other model by altering the relationships.
The most common form of nested models occurs when a single relationship is
added to or deleted from another model, thus, the model with fewer estimated
relationships is nested within the more general model. (p. 709)
In other words if one has two factors (A and B), and B is nested within A (B/A), then
every level of B does not appear with every level of factor A (Lomax, 1992; Timm,
2002). Raudenbush and Bryk (2002) stated that “many, if not most, social science data
have this nested or hierarchical structure” (p.xx).
To handle the specific task of managing the nested design data, Multilevel
Modeling (HLM) is considered to be the most effective statistical technique (Raudenbush
52
& Bryk, 2002). The organizational units in this study, such as student, class and school,
are represented in HLM by their own sub-models. “Each sub-model represents the
structural relationship occurring at that level and the residual variability at that level”
(Raudenbush, Bryk, Cheong, & Congdon, 2001). The representation of the residual
variability at the appropriate levels involves calculating the appropriate error term
whether it is fixed, mixed or random. This was the breakthrough that was a result of the
EM Algorithm. This allowed the computer to calculate error terms for not only fixed
effects, but also for random and mixed effects, which was previously not possible. In
addition, traditional models do not allow intercepts and slopes to differ across classes and
schools (Raudenbush & Bryk, 2002). By utilizing this technique, researchers do not
violate the assumption of independence of measurement since each level of the
interaction is accounted for. One also does not have to worry about aggregation errors
that might occur when grouping at the class or school level.
The HLM models were written to reflect relevant research questions pertaining to
predicting student achievement scores or growth over time. This is critical since the
students are nested within school level structures. HLM was used to test research
questions 3 and 7, both of which contain this nested structure. In addition to answering
the relevant research questions, the models presented below are in hierarchical order.
That is, the first model is an unconditional model in that it does not have any mediating
or moderating variables in it. This allows one to compare the proportion of variance
explained by the subsequent models that have mediating and moderating variables in
them to the original model that only controls for individual differences. The Level 1
model is the student level data, where the Level 2 model is the building level data.

53
This unconditional model contains only student level information while it controls
for different starting places for schools. The slopes for schools are fixed so that one
cannot test for student interaction across schools. The error terms that are not bolded
indicate that the slopes for different buildings are fixed. That is, the slopes are not
allowed to vary across schools.
Level 1
i jke)3-Factor-(Sπ)2-Factor-(Sπ)1-Factor-π1jk(SπtAchievemen i j k3 j ki j k2 j ki j ko j ki j k
Level 2
0jkook0jk rβπ
jkk r11ok βπ1j
jkk r22o2jk βπ
jkk r33o3jk βπ
The second model contains student level information and school level
information. This model is not only investigating the student level variables that predict
Achievement Scores, but it is also looking at how building intercepts and building level
variables interact with student level principal components. At this level there is a two-
way interaction between student level principal components and building level principal
components. This model still controls for school differences but does not test the
interaction of school effects with the teacher level principal components, nor the school
principal components with student level principal components. In other words, the
school slopes are invariant. The error terms at the school level that are not bolded
indicate that the slopes for different schools are fixed.
54
Level 1
i jke)3-Factor-(Sπ)2-Factor-(Sπ)1-Factor-π1jk(SπojkAchivement i j k3 jki j k2 jki j ki j k
Level 2
0jko2ko1kook0jk r2jK)-(T_Factor1jK)-(T_Factor βββπ
1jk12k11k1okk r2jK)-(T_Factor1jK)-(T_Factor βββπ1j
2jk22k21k2ok2jk rβββπ 2jK)-(T_Factor1jK)-(T_Factor
3jk32k31k3ok3jk rβββπ 2jK)-(T_Factor1jK)-(T_Factor
Level 1
Achievementijk is the score for student i in class j within school k
o j kπ is intercept for the student i in class j within school k.
1 j kπ is the standardized Beta Weight (slope) for person i on Student Principal
Component -1 in class j within school k
S-Factor-1ijk is the Student Principal Component 1 for person i in class j within
school k
2 j kπ is the standardized Beta Weight (slope) for person i on Student Principal
Component -2 in class j within school k
S-Factor -2ijk is the Student Principal Component 2 for person i in class j within
school k
3 j kπ is the standardized Beta Weight (slope) for person i on Student Principal
Component -3 in class j within school k
S-Factor -3ijk is the Student Principal Component 3 for person i in class j within
school k

55
i j ke is the error for person i in class j within school k
Level 2
ookβ is predicting the intercept for the Level 1 model ( o j kπ ) for student j in school k
1okβ to 3okβ is the intercept predicting 1 j kπ to 3jkπ for student j in school k
o1kβ to 31kβ is the Standardized Beta Weight for Knowledge Principal Component
1 for teacher j in school k.
o2kβ to 32kβ is the Standardized Beta Weight for Teacher Practices Principal
Component 2 for teacher j in school k.
0jkr to 3jkr is the for class/teacher j within school k
Binomial Index of Model Fit.
The Binomial Index of Model Fit is a binomial test which requires that the correct
paths be converted into categories. The significance of any given path in a model can be
classified as either being supported by the data or not. The classification of categories
can be created in three different ways. According to Fraas and Newman (1994), there are
three possible methods for classifying these categories. First, and the least powerful, is to
examine the direction of the relationship in a model. Second, is to test to see if the
relationship was statistically significant. Lastly, one can test to see if the relationship
reaches an a priori effect size. For the purpose of this study, a combination of the
directionality and statistical significance methods were used.
There are two major reasons why the Binomial Index of Model Fit was selected
over other possible methods of goodness-of-fit tests. The most popular goodness-of-fit
tests, like chi-square and the Bentler-Bonnett Normed Fit Index, can be affected by
sample size (Marsh, Balla, & McDonald, 1988). The other problem with these goodness-
56
of-fit measures is that they measure the overall goodness-of-fit to the model. In other
words, how well can one reproduce the overall correlation matrix. It is possible that one
or more of the paths indicated in the model might not be significant and the overall model
still has a good fit score. The Binomial Index Model of Fit is not affected by sample size
but instead depends on the number of paths being tested in any given model. In addition,
every path is tested to see if it is statistically significant in the stated direction. The
overall significance of the model is then tested by counting the number of correct paths
and comparing it to the total number of paths in the model. This technique was used to
test research Hypothesis 5 because it looked at the overall goodness of fit of the model
across different demographic variables.
Power and Reliability Analysis
A power analysis was calculated to determine if the sample size was sufficient to
detect relationships at small, medium and large effect sizes. The sample size in this
research varied greatly depending on whether the unit of analysis is at the student level or
school level. In this research, to detect a medium effect size (f2
= .15) (Cohen,1977;
McNeil, Newman, & Kelly, (1996), an N of approximately 75 was needed for an alpha
level of .05 and power of 80. However, the ability to replicate is even more important
than power. As suggested by Posavac (2002), and Newman, McNeil, and Fraas (2004),
significance levels and even effect size are less meaningful to practitioners and policy
makers than is replicability. Even though replicability can be estimated from the
statistical probability of a test, there is considerable difference in the interpretation. For
example a p-value of .05 will only replicate 50% of the time with degrees of freedom of
at least 8, and a p-value of .01 will replicate at the between 73% and 84% of the time
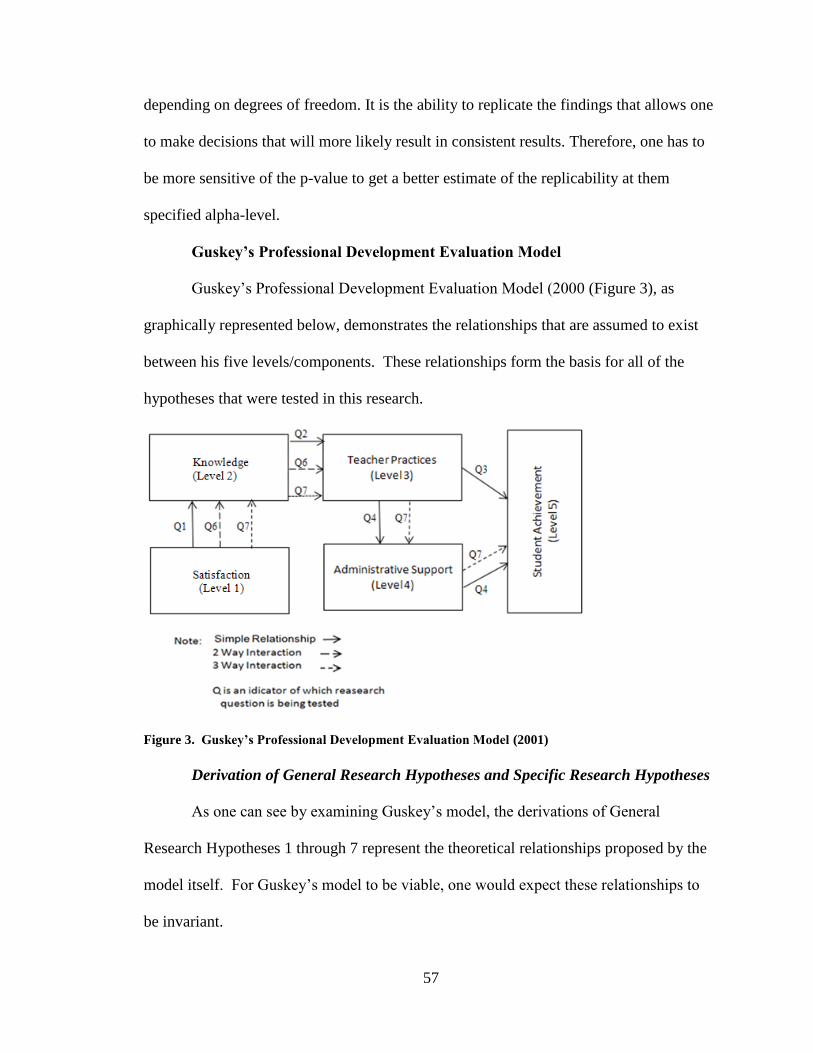
57
depending on degrees of freedom. It is the ability to replicate the findings that allows one
to make decisions that will more likely result in consistent results. Therefore, one has to
be more sensitive of the p-value to get a better estimate of the replicability at them
specified alpha-level.
Guskey’s Professional Development Evaluation Model
Guskey’s Professional Development Evaluation Model (2000 (Figure 3), as
graphically represented below, demonstrates the relationships that are assumed to exist
between his five levels/components. These relationships form the basis for all of the
hypotheses that were tested in this research.
Figure 3. Guskey’s Professional Development Evaluation Model (2001)
Derivation of General Research Hypotheses and Specific Research Hypotheses
As one can see by examining Guskey’s model, the derivations of General
Research Hypotheses 1 through 7 represent the theoretical relationships proposed by the
model itself. For Guskey’s model to be viable, one would expect these relationships to
be invariant.

58
General Research Hypotheses
1. Satisfaction (Level 1) of Guskey’s Model predicts Teacher Knowledge
(Level 2).
Full Model: eonSatisfactiKnowledge )(10
Restricted Model: eKnowledge 0
2. Satisfaction (Level 1) and Knowledge (Level 2) of Guskey’s Model
predict Teacher practices (Level-3).
Full Model: eKnowledgeonSatisfactiactices )()(Pr 210
Restricted Model: eactices 0Pr
3. Teacher Knowledge and Teacher Practices (Level-2 & 3) predict Growth
in Student Achievement (Level 5).
Level 1
i jke)π1jk(TimeπAchivement i j ko j ki j k
Level 2
0 jko2ki j ko1kook0 jk rβββπ (Practice))(Knowledge
4. The operationally defined Student Gain variables and the Teaching and
Administrative Support variables reflect the interrelationship of the levels,
as hypothesized by Guskey’s Model. (Simple Correlation)
5. There is a good overall Goodness-of-Fit estimate for the components of
Guskey’s Professional Development Evaluation Model, as estimated by
the Binomial Goodness of Fit Index.
6. There is a significant interaction between Knowledge and Satisfaction in
predicting Changes in Teacher Practice.
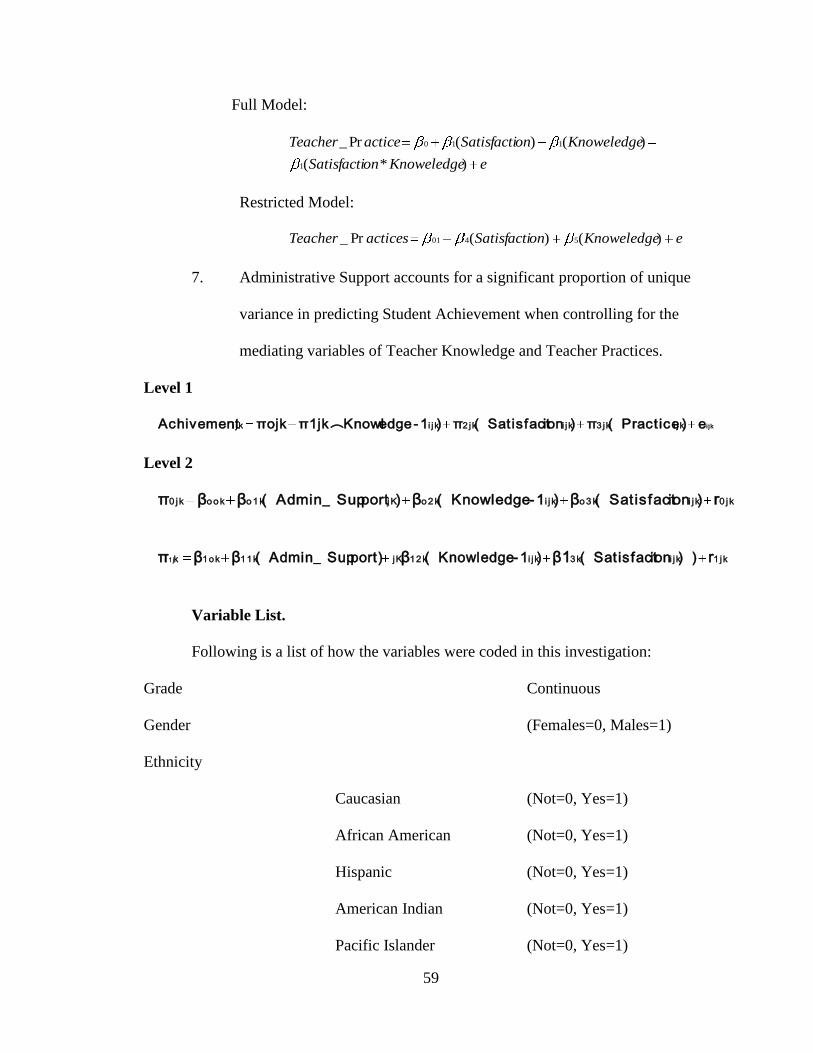
59
Full Model:
eKnoweledgeonSatisfacti
KnoweledgeonSatisfactiacticeTeacher
)*(
)()(Pr_
1
110
Restricted Model:
eKnoweledgeonSatisfactiacticesTeacher )()(Pr_ 5401
7. Administrative Support accounts for a significant proportion of unique
variance in predicting Student Achievement when controlling for the
mediating variables of Teacher Knowledge and Teacher Practices.
Level 1
i jke)(Practiceπ)ion(Satisfactπ)1-edgeπ1jk(KnowlπojkAchivement i j k3 jki j k2 jki j ki j k
Level 2
0 jki j ko3ki j ko2kjKo1kook0 jk rββββπ )ion(Satisfact)1-(Knowledge)port(Admin_Sup
1 jki j k3ki j k12kjK11k1okk rβ1βββπ ))ion(Satisfact)1-(Knowledgeport)(Admin_Sup1j
Variable List.
Following is a list of how the variables were coded in this investigation:
Grade Continuous
Gender (Females=0, Males=1)
Ethnicity
Caucasian (Not=0, Yes=1)
African American (Not=0, Yes=1)
Hispanic (Not=0, Yes=1)
American Indian (Not=0, Yes=1)
Pacific Islander (Not=0, Yes=1)
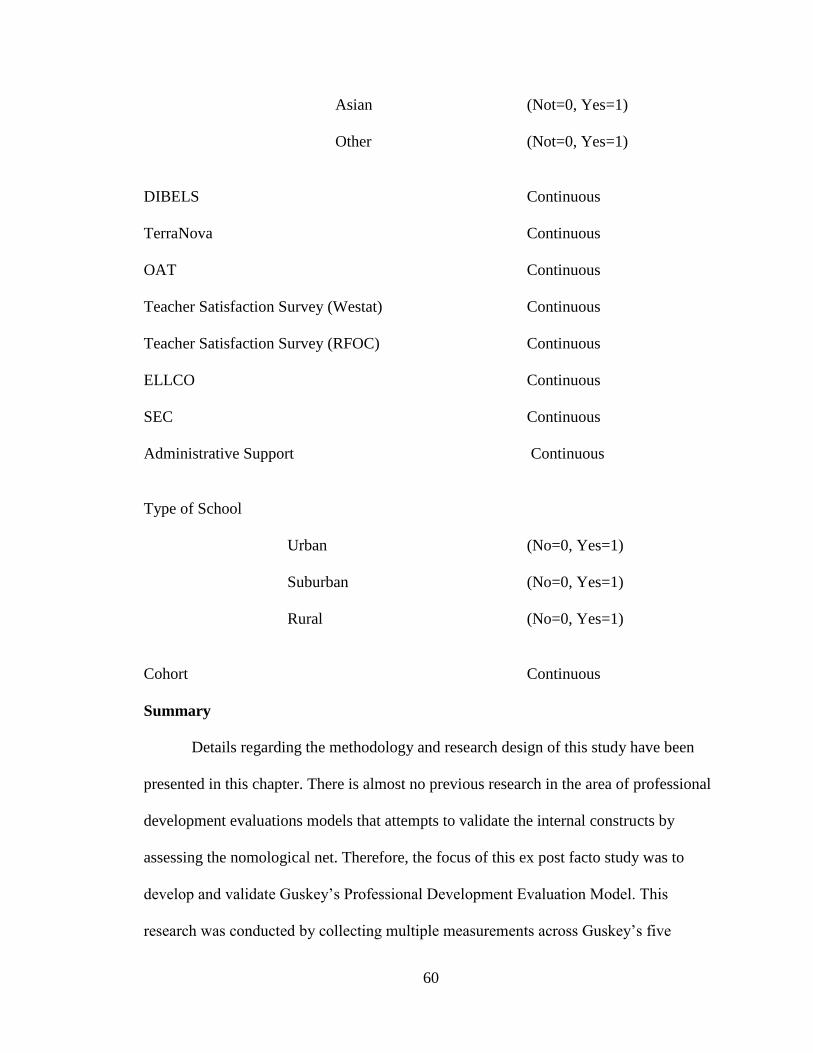
60
Asian (Not=0, Yes=1)
Other (Not=0, Yes=1)
DIBELS Continuous
TerraNova Continuous
OAT Continuous
Teacher Satisfaction Survey (Westat) Continuous
Teacher Satisfaction Survey (RFOC) Continuous
ELLCO Continuous
SEC Continuous
Administrative Support Continuous
Type of School
Urban (No=0, Yes=1)
Suburban (No=0, Yes=1)
Rural (No=0, Yes=1)
Cohort Continuous
Summary
Details regarding the methodology and research design of this study have been
presented in this chapter. There is almost no previous research in the area of professional
development evaluations models that attempts to validate the internal constructs by
assessing the nomological net. Therefore, the focus of this ex post facto study was to
develop and validate Guskey’s Professional Development Evaluation Model. This
research was conducted by collecting multiple measurements across Guskey’s five

61
constructs. Full and restricted multiple linear regression models, HLM and the Binomial
Goodness-of-Fit Index were used to test the seven research hypotheses and to determine
whether the continual use of Guskey’s Professional Development Evaluation Model is
prudent, or if it should be replaced by a model that has empirical evidence to support its
nomological network.
62
CHAPTER IV
RESULTS OF THE STUDY
Chapter IV, which is organized into four sections, presents the results of this
research. The first section contains the descriptive statistics, which includes the means,
standard deviations, and frequencies. In the second section, factor analysis describes the
factors that emerged for Administrative Support, Teacher Knowledge, and Teacher
Practices. The third section, Primary Analyses, answers the seven overarching research
questions posed in this study. This chapter concludes with a fourth section that presents a
summary of the research results.
Data Preparation and Preliminary Analyses
Data Merging and Databases Screening
Prior to any analyses data were collected from databases at the Ohio Department
of Education, Westat, and the Reading First Ohio Center. These archival databases were
then entered into SPSS version 18 (PASW 18) and merged. Since the unit of analysis in
this investigation varied depending on if the analysis were testing student outcomes or
school changes, several databases had to be created. An additional complication was that
at the student level, depending on the test, each student was measured either once a year
or three times a year. This added complexity because the
63
data had to be stacked in order to run the Hierarchical Linear Regression Growth Models.
This resulted in the four different databases that were created for these analyses.
The first database was called Student Stacked Time (SST) and included all of the
DIBELS measures that were given three times a year. The second database was Student
Stacked Year (SSY) and it included the OAT and TerraNova tests that were given to the
students one time per year. The next database was the school aggregates. This database
included the average ELLCO, Westat, SEC and Reading First Ohio Center data
aggregated for each of the 124 schools. Lastly, the District Level Database was
constructed for information that only resides at a district level. This mostly pertained to
stability of key district personnel, which is information that relates to Administrative
Support.
Databases Screening
During the six years of data collection, 63,441 participants were measured up to
12 times on the DIBELS at the student level. Any missing data was left blank and no
data imputations were conducted. There were no outliers and the residuals in the analyses
were normally distributed so no transformations were required.
Descriptive Statistics
The descriptive statistics for this research are reported in three stages. The first
stage reports the demographic statistics for the student level data. The second stage
reports the student achievement across the DIBELS, TerraNova and the Ohio
Achievement Test (OAT) for all six years of the study. The third and final section reports
the descriptive statistics on the building level data.
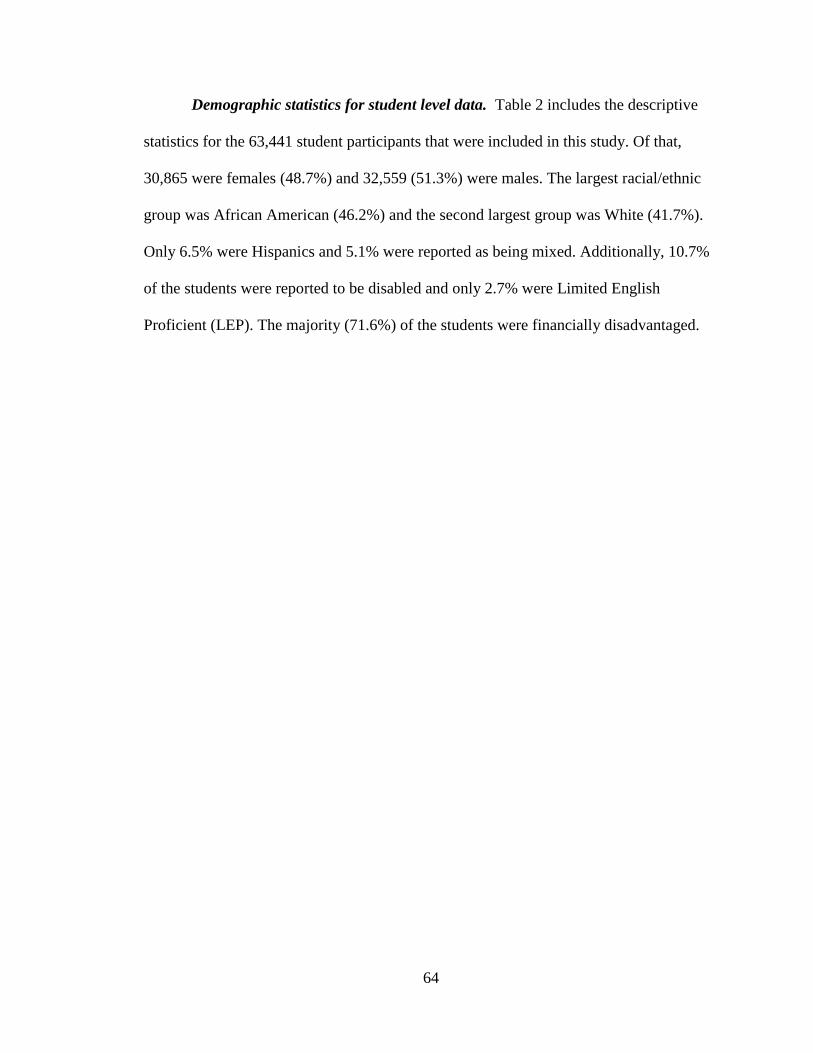
64
Demographic statistics for student level data. Table 2 includes the descriptive
statistics for the 63,441 student participants that were included in this study. Of that,
30,865 were females (48.7%) and 32,559 (51.3%) were males. The largest racial/ethnic
group was African American (46.2%) and the second largest group was White (41.7%).
Only 6.5% were Hispanics and 5.1% were reported as being mixed. Additionally, 10.7%
of the students were reported to be disabled and only 2.7% were Limited English
Proficient (LEP). The majority (71.6%) of the students were financially disadvantaged.
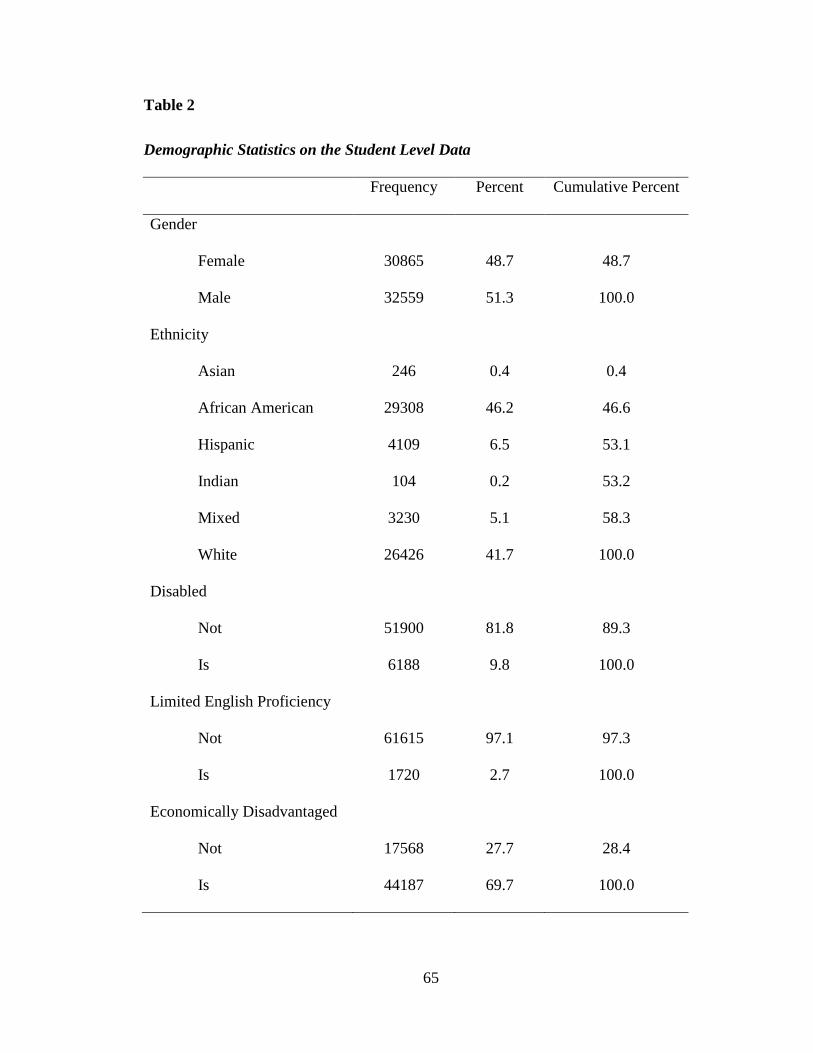
65
Table 2
Demographic Statistics on the Student Level Data
Frequency Percent Cumulative Percent
Gender
Female 30865 48.7 48.7
Male 32559 51.3 100.0
Ethnicity
Asian 246 0.4 0.4
African American 29308 46.2 46.6
Hispanic 4109 6.5 53.1
Indian 104 0.2 53.2
Mixed 3230 5.1 58.3
White 26426 41.7 100.0
Disabled
Not 51900 81.8 89.3
Is 6188 9.8 100.0
Limited English Proficiency
Not 61615 97.1 97.3
Is 1720 2.7 100.0
Economically Disadvantaged
Not 17568 27.7 28.4
Is 44187 69.7 100.0
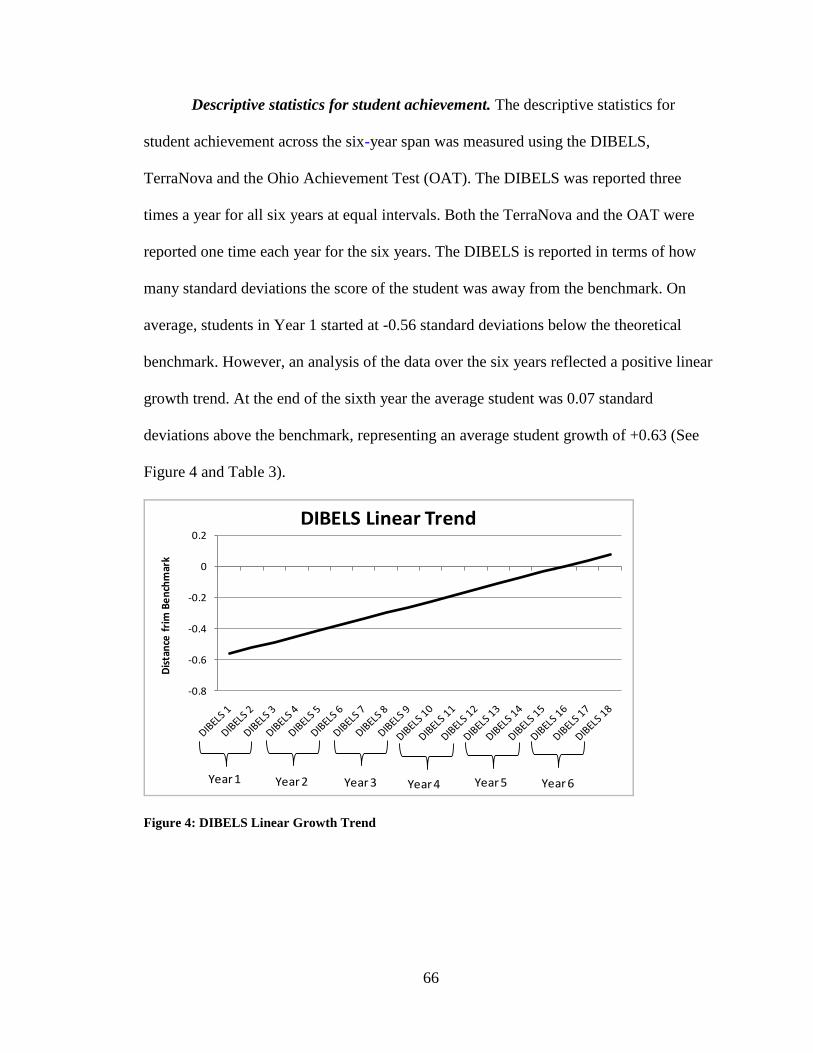
66
Descriptive statistics for student achievement. The descriptive statistics for
student achievement across the six-year span was measured using the DIBELS,
TerraNova and the Ohio Achievement Test (OAT). The DIBELS was reported three
times a year for all six years at equal intervals. Both the TerraNova and the OAT were
reported one time each year for the six years. The DIBELS is reported in terms of how
many standard deviations the score of the student was away from the benchmark. On
average, students in Year 1 started at -0.56 standard deviations below the theoretical
benchmark. However, an analysis of the data over the six years reflected a positive linear
growth trend. At the end of the sixth year the average student was 0.07 standard
deviations above the benchmark, representing an average student growth of +0.63 (See
Figure 4 and Table 3).
-0.8
-0.6
-0.4
-0.2
0
0.2
Dis
tan
ce f
rim
Be
nch
mar
k
DIBELS Linear Trend
Year 1 Year 6Year 5Year 4Year 3Year 2
Figure 4: DIBELS Linear Growth Trend
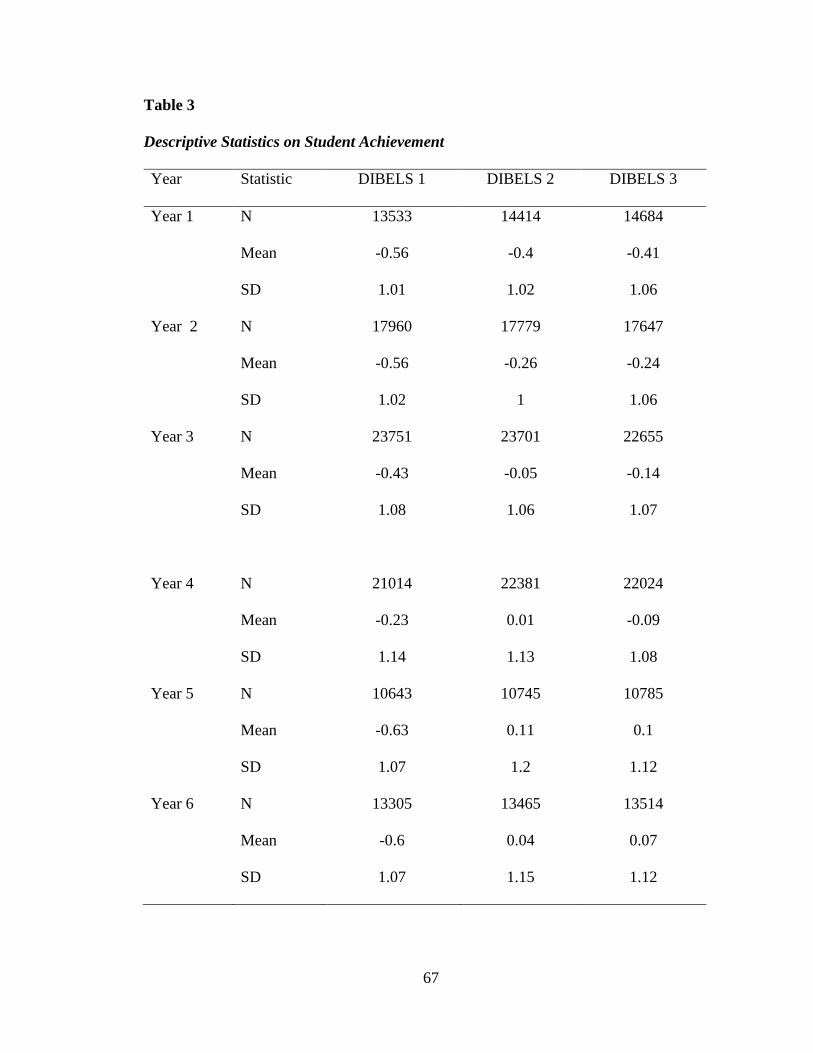
67
Table 3
Descriptive Statistics on Student Achievement
Year Statistic DIBELS 1 DIBELS 2 DIBELS 3
Year 1 N 13533 14414 14684
Mean -0.56 -0.4 -0.41
SD 1.01 1.02 1.06
Year 2 N 17960 17779 17647
Mean -0.56 -0.26 -0.24
SD 1.02 1 1.06
Year 3 N 23751 23701 22655
Mean -0.43 -0.05 -0.14
SD 1.08 1.06 1.07
Year 4 N 21014 22381 22024
Mean -0.23 0.01 -0.09
SD 1.14 1.13 1.08
Year 5 N 10643 10745 10785
Mean -0.63 0.11 0.1
SD 1.07 1.2 1.12
Year 6 N 13305 13465 13514
Mean -0.6 0.04 0.07
SD 1.07 1.15 1.12
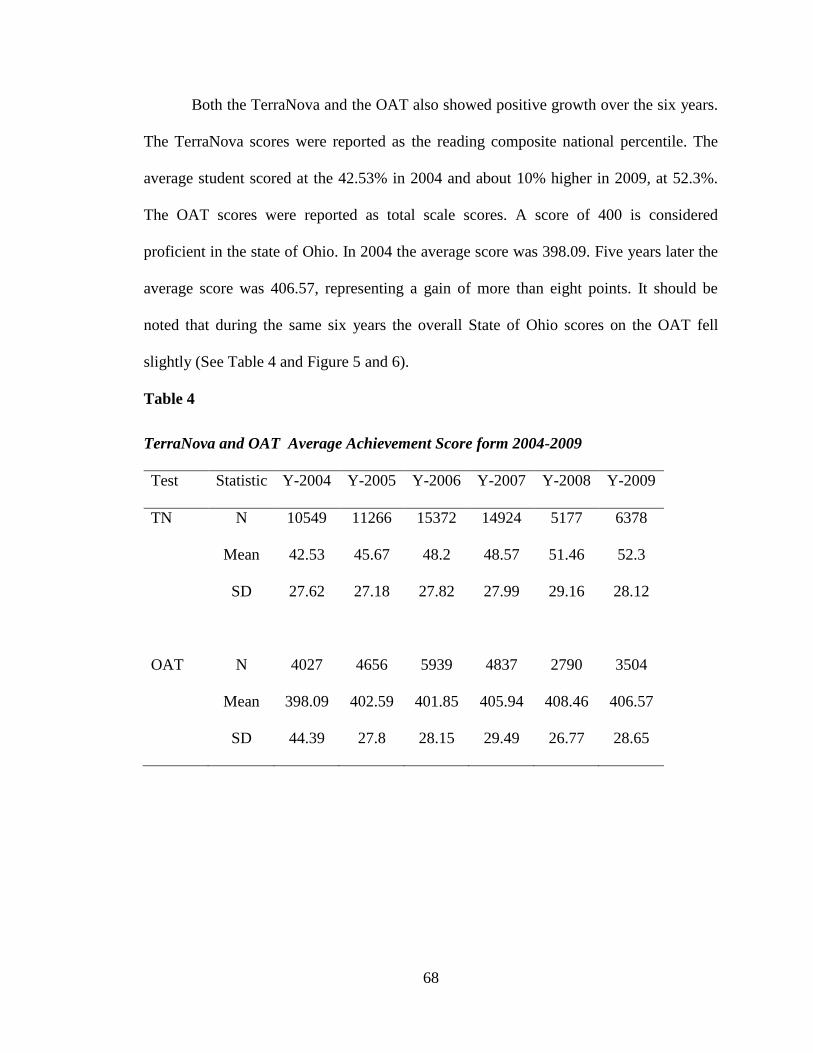
68
Both the TerraNova and the OAT also showed positive growth over the six years.
The TerraNova scores were reported as the reading composite national percentile. The
average student scored at the 42.53% in 2004 and about 10% higher in 2009, at 52.3%.
The OAT scores were reported as total scale scores. A score of 400 is considered
proficient in the state of Ohio. In 2004 the average score was 398.09. Five years later the
average score was 406.57, representing a gain of more than eight points. It should be
noted that during the same six years the overall State of Ohio scores on the OAT fell
slightly (See Table 4 and Figure 5 and 6).
Table 4
TerraNova and OAT Average Achievement Score form 2004-2009
Test Statistic Y-2004 Y-2005 Y-2006 Y-2007 Y-2008 Y-2009
TN N 10549 11266 15372 14924 5177 6378
Mean 42.53 45.67 48.2 48.57 51.46 52.3
SD 27.62 27.18 27.82 27.99 29.16 28.12
OAT N 4027 4656 5939 4837 2790 3504
Mean 398.09 402.59 401.85 405.94 408.46 406.57
SD 44.39 27.8 28.15 29.49 26.77 28.65
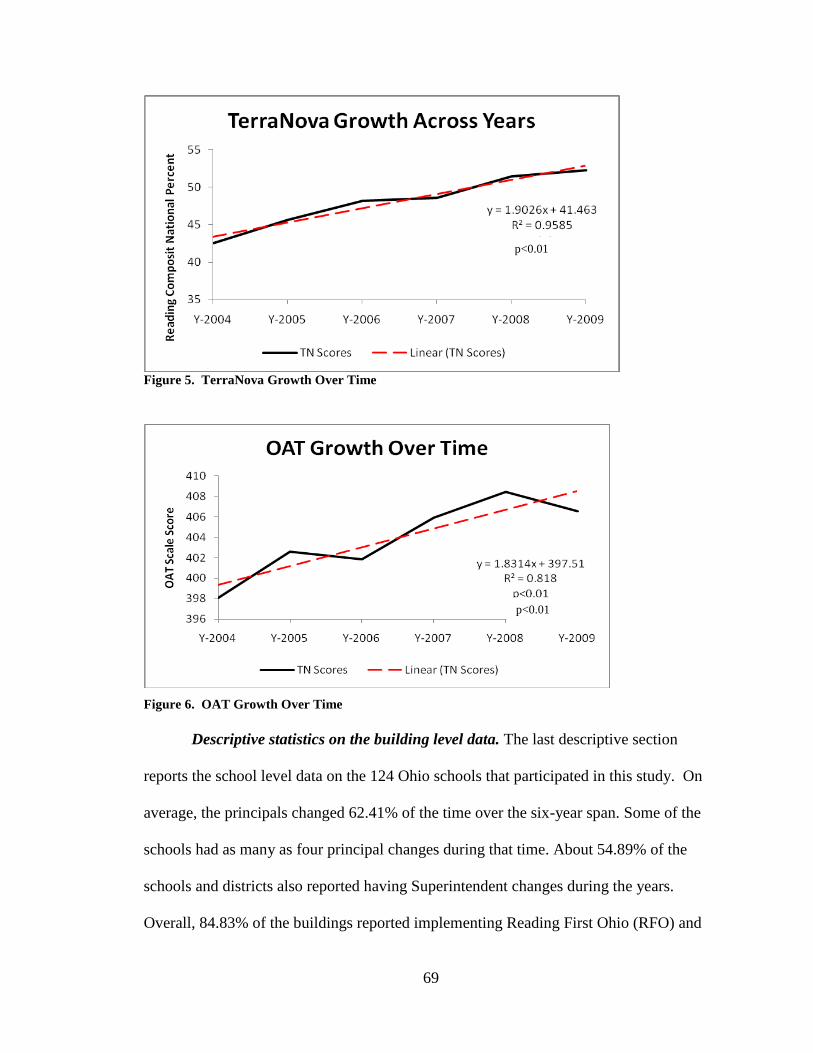
69
Figure 5. TerraNova Growth Over Time
Figure 6. OAT Growth Over Time
Descriptive statistics on the building level data. The last descriptive section
reports the school level data on the 124 Ohio schools that participated in this study. On
average, the principals changed 62.41% of the time over the six-year span. Some of the
schools had as many as four principal changes during that time. About 54.89% of the
schools and districts also reported having Superintendent changes during the years.
Overall, 84.83% of the buildings reported implementing Reading First Ohio (RFO) and
p<0.01
p<0.01
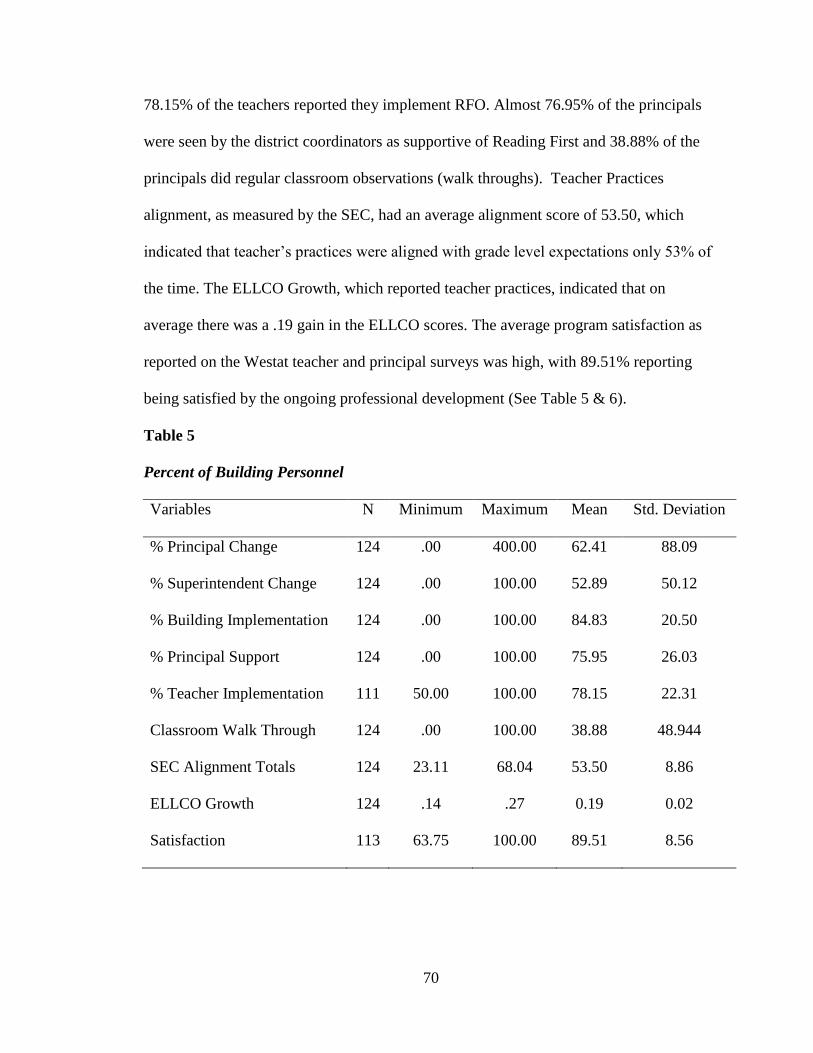
70
78.15% of the teachers reported they implement RFO. Almost 76.95% of the principals
were seen by the district coordinators as supportive of Reading First and 38.88% of the
principals did regular classroom observations (walk throughs). Teacher Practices
alignment, as measured by the SEC, had an average alignment score of 53.50, which
indicated that teacher’s practices were aligned with grade level expectations only 53% of
the time. The ELLCO Growth, which reported teacher practices, indicated that on
average there was a .19 gain in the ELLCO scores. The average program satisfaction as
reported on the Westat teacher and principal surveys was high, with 89.51% reporting
being satisfied by the ongoing professional development (See Table 5 & 6).
Table 5
Percent of Building Personnel
Variables N Minimum Maximum Mean Std. Deviation
% Principal Change 124 .00 400.00 62.41 88.09
% Superintendent Change 124 .00 100.00 52.89 50.12
% Building Implementation 124 .00 100.00 84.83 20.50
% Principal Support 124 .00 100.00 75.95 26.03
% Teacher Implementation 111 50.00 100.00 78.15 22.31
Classroom Walk Through 124 .00 100.00 38.88 48.944
SEC Alignment Totals 124 23.11 68.04 53.50 8.86
ELLCO Growth 124 .14 .27 0.19 0.02
Satisfaction 113 63.75 100.00 89.51 8.56
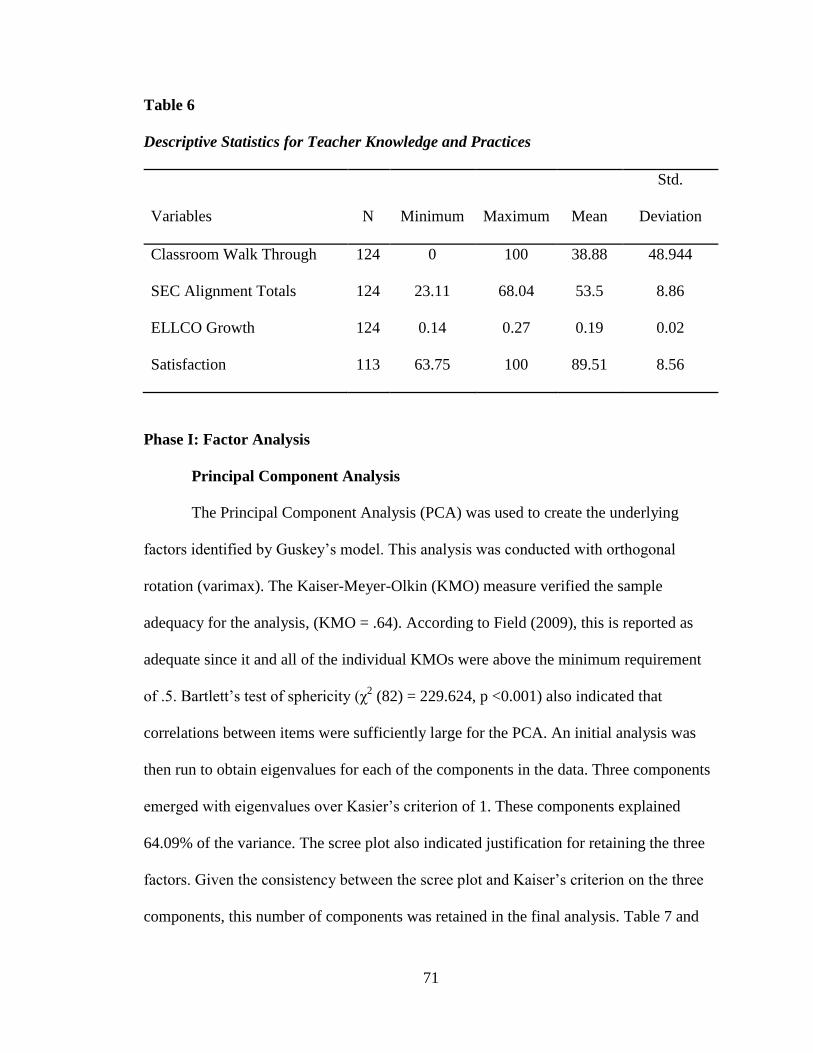
71
Table 6
Descriptive Statistics for Teacher Knowledge and Practices
Variables N Minimum Maximum Mean
Std.
Deviation
Classroom Walk Through 124 0 100 38.88 48.944
SEC Alignment Totals 124 23.11 68.04 53.5 8.86
ELLCO Growth 124 0.14 0.27 0.19 0.02
Satisfaction 113 63.75 100 89.51 8.56
Phase I: Factor Analysis
Principal Component Analysis
The Principal Component Analysis (PCA) was used to create the underlying
factors identified by Guskey’s model. This analysis was conducted with orthogonal
rotation (varimax). The Kaiser-Meyer-Olkin (KMO) measure verified the sample
adequacy for the analysis, (KMO = .64). According to Field (2009), this is reported as
adequate since it and all of the individual KMOs were above the minimum requirement
of .5. Bartlett’s test of sphericity (χ2 (82) = 229.624, p <0.001) also indicated that
correlations between items were sufficiently large for the PCA. An initial analysis was
then run to obtain eigenvalues for each of the components in the data. Three components
emerged with eigenvalues over Kasier’s criterion of 1. These components explained
64.09% of the variance. The scree plot also indicated justification for retaining the three
factors. Given the consistency between the scree plot and Kaiser’s criterion on the three
components, this number of components was retained in the final analysis. Table 7 and
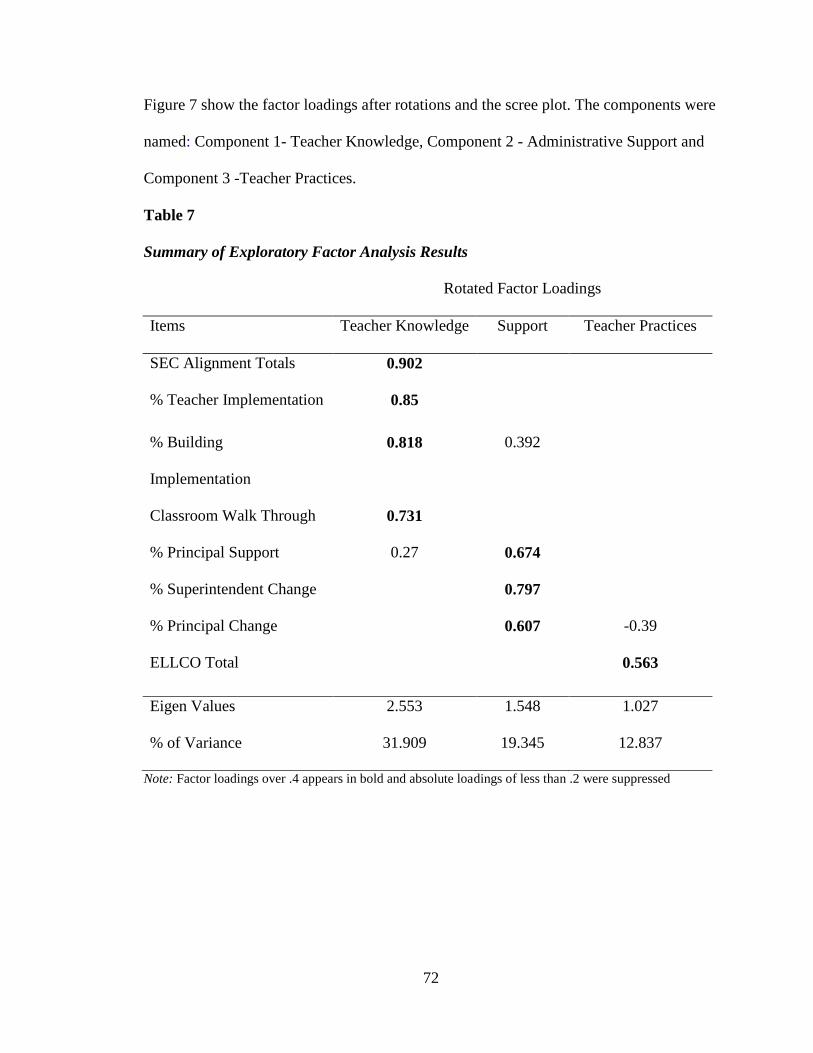
72
Figure 7 show the factor loadings after rotations and the scree plot. The components were
named: Component 1- Teacher Knowledge, Component 2 - Administrative Support and
Component 3 -Teacher Practices.
Table 7
Summary of Exploratory Factor Analysis Results
Rotated Factor Loadings
Items Teacher Knowledge Support Teacher Practices
SEC Alignment Totals 0.902
% Teacher Implementation 0.85
% Building
Implementation
0.818 0.392
Classroom Walk Through 0.731
% Principal Support 0.27 0.674
% Superintendent Change 0.797
% Principal Change 0.607 -0.39
ELLCO Total 0.563
Eigen Values 2.553 1.548 1.027
% of Variance 31.909 19.345 12.837
Note: Factor loadings over .4 appears in bold and absolute loadings of less than .2 were suppressed
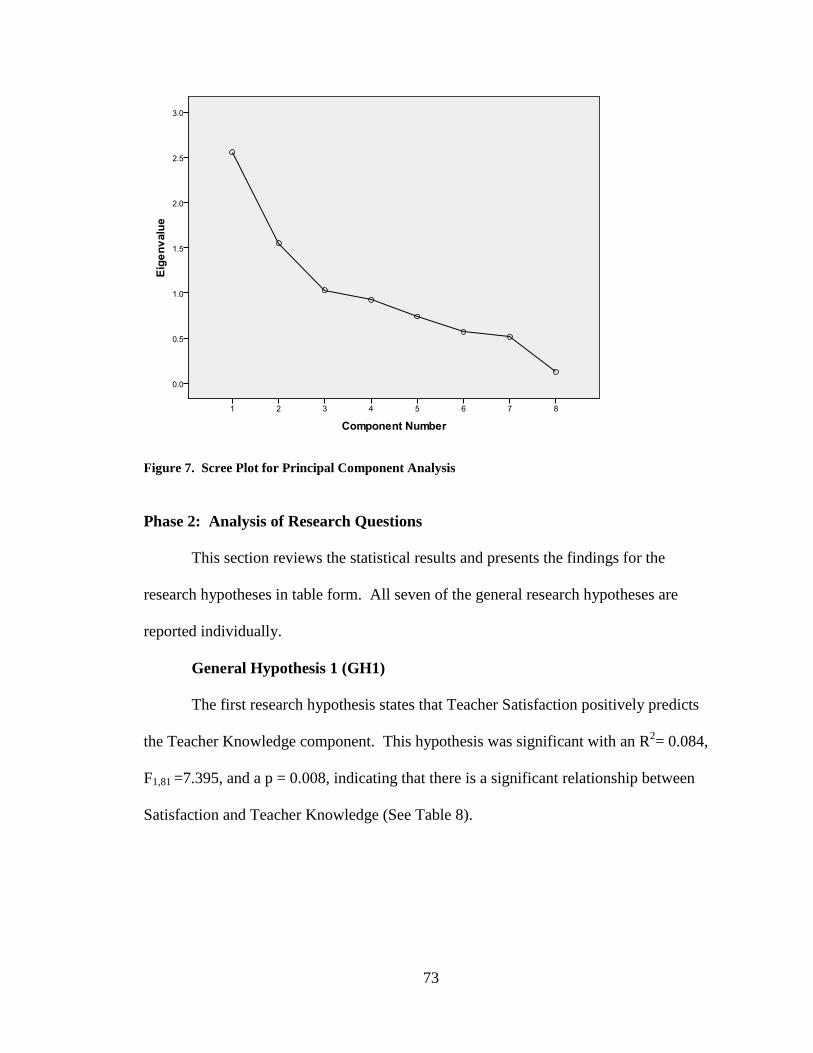
73
Figure 7. Scree Plot for Principal Component Analysis
Phase 2: Analysis of Research Questions
This section reviews the statistical results and presents the findings for the
research hypotheses in table form. All seven of the general research hypotheses are
reported individually.
General Hypothesis 1 (GH1)
The first research hypothesis states that Teacher Satisfaction positively predicts
the Teacher Knowledge component. This hypothesis was significant with an R2= 0.084,
F1,81 =7.395, and a p = 0.008, indicating that there is a significant relationship between
Satisfaction and Teacher Knowledge (See Table 8).
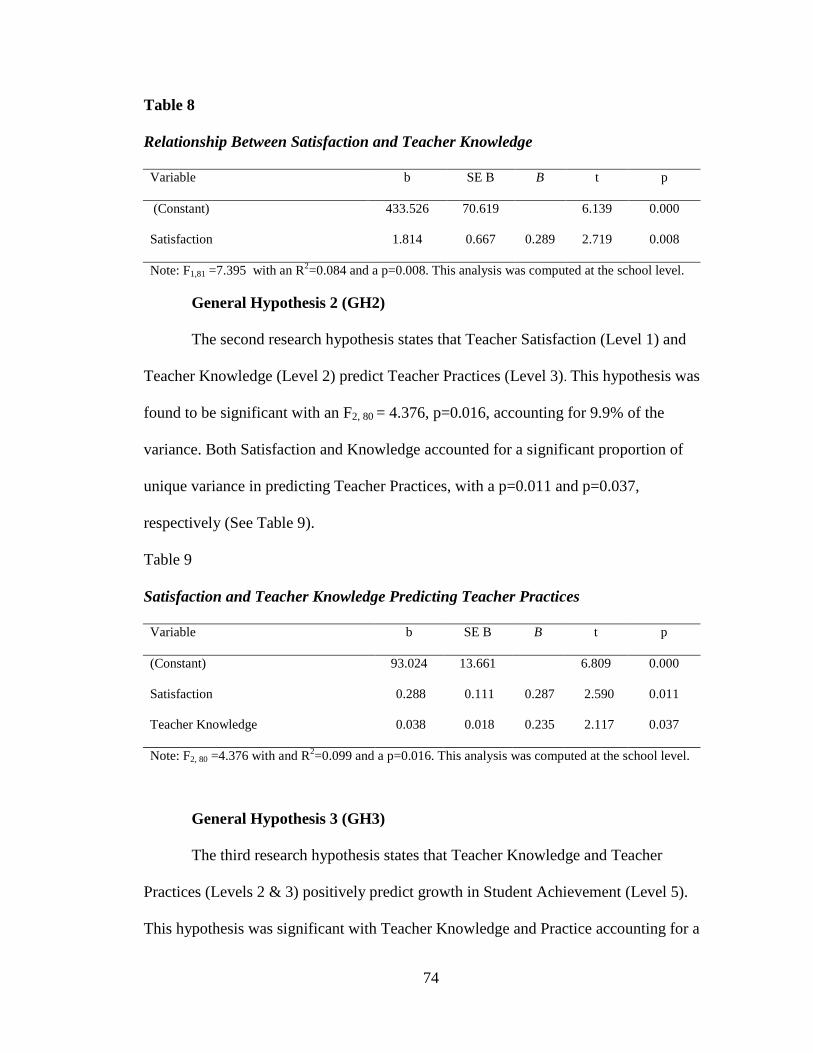
74
Table 8
Relationship Between Satisfaction and Teacher Knowledge
Variable b SE B B t p
(Constant) 433.526 70.619 6.139 0.000
Satisfaction 1.814 0.667 0.289 2.719 0.008
Note: F1,81 =7.395 with an R2=0.084 and a p=0.008. This analysis was computed at the school level.
General Hypothesis 2 (GH2)
The second research hypothesis states that Teacher Satisfaction (Level 1) and
Teacher Knowledge (Level 2) predict Teacher Practices (Level 3). This hypothesis was
found to be significant with an F2, 80 = 4.376, p=0.016, accounting for 9.9% of the
variance. Both Satisfaction and Knowledge accounted for a significant proportion of
unique variance in predicting Teacher Practices, with a p=0.011 and p=0.037,
respectively (See Table 9).
Table 9
Satisfaction and Teacher Knowledge Predicting Teacher Practices
Variable b SE B B t p
(Constant) 93.024 13.661 6.809 0.000
Satisfaction 0.288 0.111 0.287 2.590 0.011
Teacher Knowledge 0.038 0.018 0.235 2.117 0.037
Note: F2, 80 =4.376 with and R2=0.099 and a p=0.016. This analysis was computed at the school level.
General Hypothesis 3 (GH3)
The third research hypothesis states that Teacher Knowledge and Teacher
Practices (Levels 2 & 3) positively predict growth in Student Achievement (Level 5).
This hypothesis was significant with Teacher Knowledge and Practice accounting for a
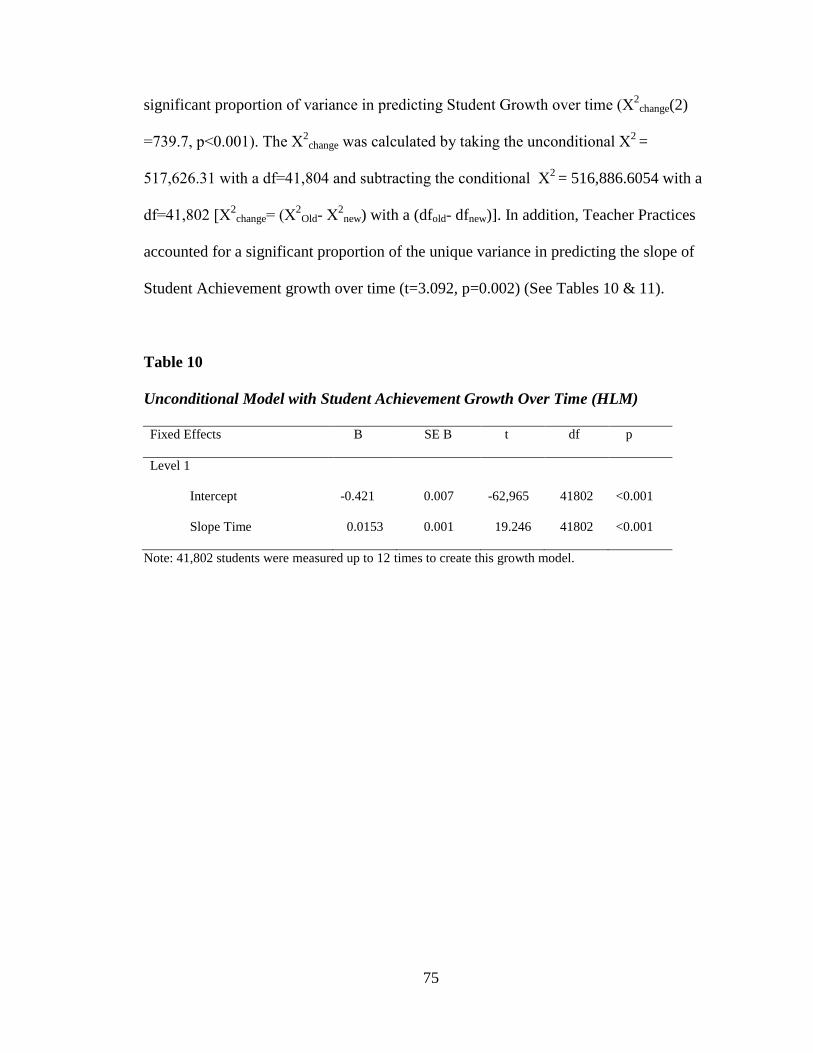
75
significant proportion of variance in predicting Student Growth over time (Χ2
change(2)
=739.7, p<0.001). The Χ2
change was calculated by taking the unconditional Χ2
=
517,626.31 with a df=41,804 and subtracting the conditional Χ2
= 516,886.6054 with a
df=41,802 [Χ2
change= (Χ2
Old- Χ2
new) with a (dfold- dfnew)]. In addition, Teacher Practices
accounted for a significant proportion of the unique variance in predicting the slope of
Student Achievement growth over time (t=3.092, p=0.002) (See Tables 10 & 11).
Table 10
Unconditional Model with Student Achievement Growth Over Time (HLM)
Fixed Effects B SE B t df p
Level 1
Intercept -0.421 0.007 -62,965 41802 <0.001
Slope Time 0.0153 0.001 19.246 41802 <0.001
Note: 41,802 students were measured up to 12 times to create this growth model.
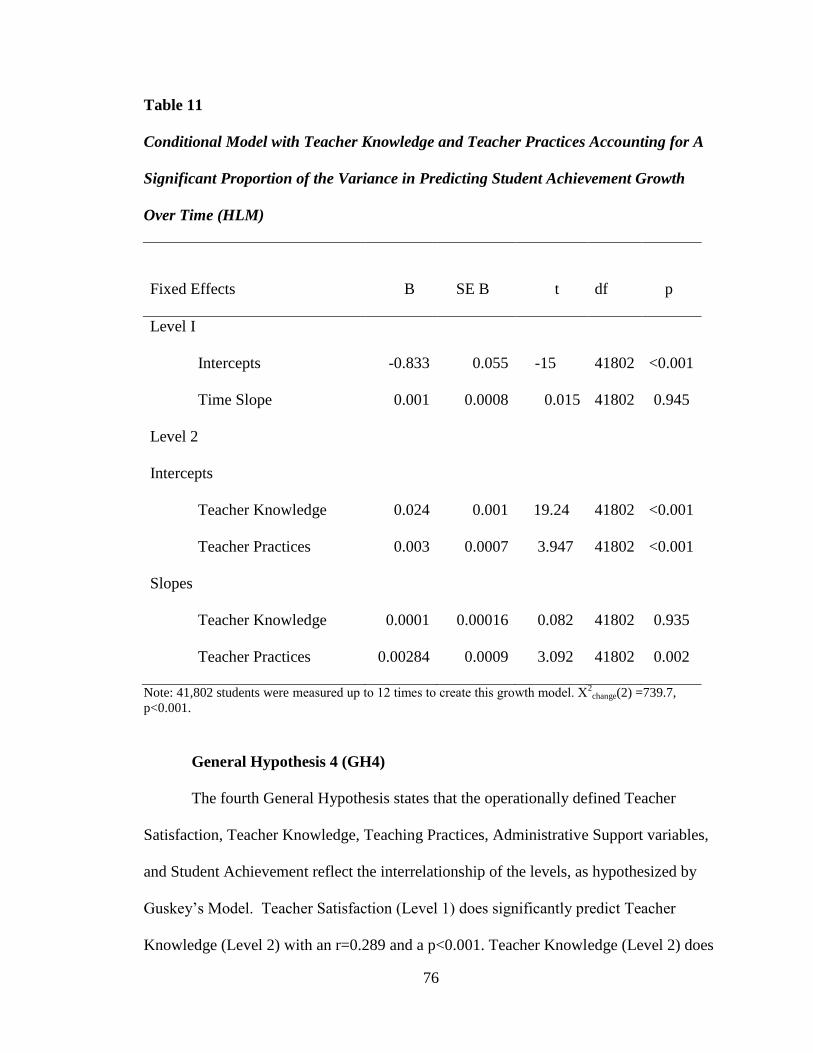
76
Table 11
Conditional Model with Teacher Knowledge and Teacher Practices Accounting for A
Significant Proportion of the Variance in Predicting Student Achievement Growth
Over Time (HLM)
Fixed Effects B SE B t
df p
Level I
Intercepts -0.833 0.055 -15 41802 <0.001
Time Slope 0.001 0.0008 0.015 41802 0.945
Level 2
Intercepts
Teacher Knowledge 0.024 0.001 19.24 41802 <0.001
Teacher Practices 0.003 0.0007 3.947 41802 <0.001
Slopes
Teacher Knowledge 0.0001 0.00016 0.082 41802 0.935
Teacher Practices 0.00284 0.0009 3.092 41802 0.002
Note: 41,802 students were measured up to 12 times to create this growth model. Χ2change(2) =739.7,
p<0.001.
General Hypothesis 4 (GH4)
The fourth General Hypothesis states that the operationally defined Teacher
Satisfaction, Teacher Knowledge, Teaching Practices, Administrative Support variables,
and Student Achievement reflect the interrelationship of the levels, as hypothesized by
Guskey’s Model. Teacher Satisfaction (Level 1) does significantly predict Teacher
Knowledge (Level 2) with an r=0.289 and a p<0.001. Teacher Knowledge (Level 2) does
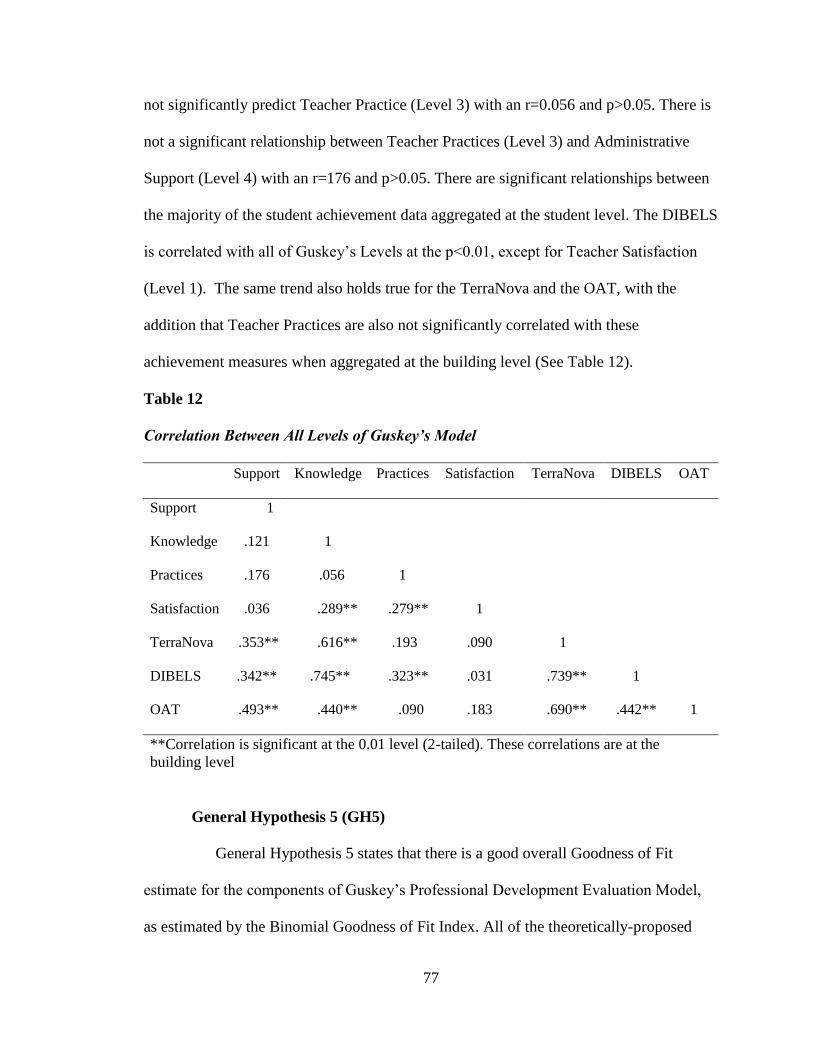
77
not significantly predict Teacher Practice (Level 3) with an r=0.056 and p>0.05. There is
not a significant relationship between Teacher Practices (Level 3) and Administrative
Support (Level 4) with an r=176 and p>0.05. There are significant relationships between
the majority of the student achievement data aggregated at the student level. The DIBELS
is correlated with all of Guskey’s Levels at the p<0.01, except for Teacher Satisfaction
(Level 1). The same trend also holds true for the TerraNova and the OAT, with the
addition that Teacher Practices are also not significantly correlated with these
achievement measures when aggregated at the building level (See Table 12).
Table 12
Correlation Between All Levels of Guskey’s Model
Support Knowledge Practices Satisfaction TerraNova DIBELS OAT
Support 1
Knowledge .121 1
Practices .176 .056 1
Satisfaction .036 .289** .279** 1
TerraNova .353** .616** .193 .090 1
DIBELS .342** .745** .323** .031 .739** 1
OAT .493** .440** .090 .183 .690** .442** 1
**Correlation is significant at the 0.01 level (2-tailed). These correlations are at the
building level
General Hypothesis 5 (GH5)
General Hypothesis 5 states that there is a good overall Goodness of Fit
estimate for the components of Guskey’s Professional Development Evaluation Model,
as estimated by the Binomial Goodness of Fit Index. All of the theoretically-proposed
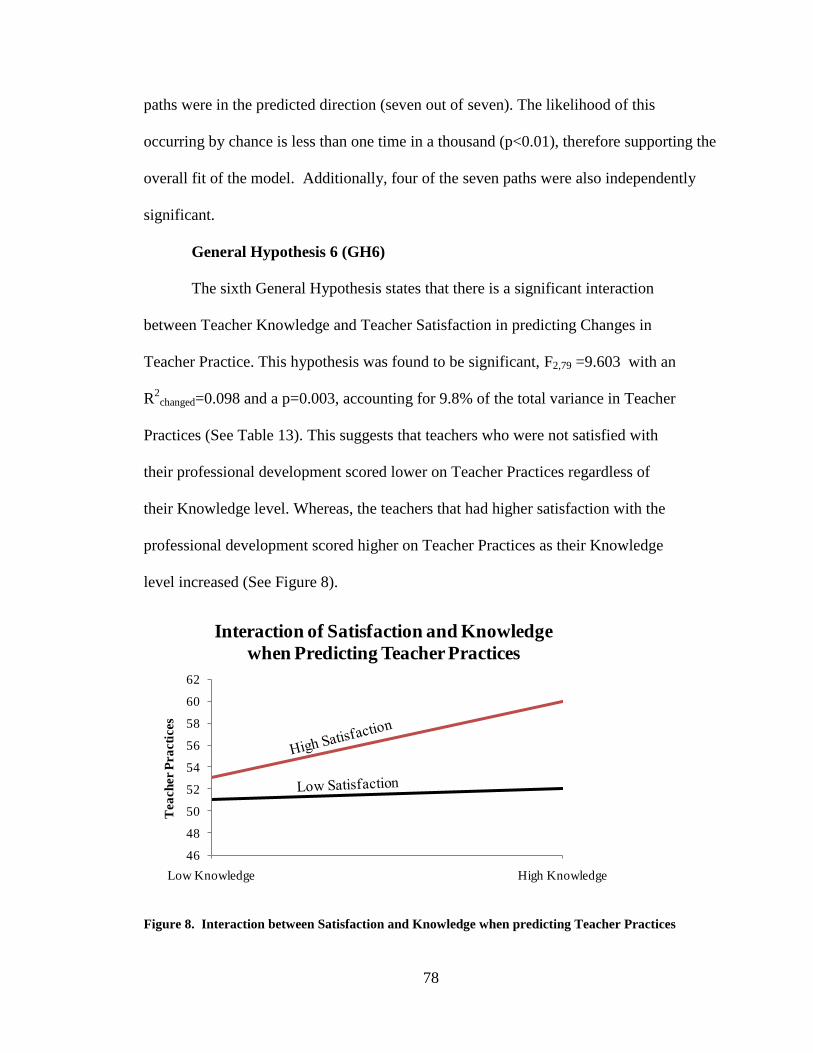
78
paths were in the predicted direction (seven out of seven). The likelihood of this
occurring by chance is less than one time in a thousand (p<0.01), therefore supporting the
overall fit of the model. Additionally, four of the seven paths were also independently
significant.
General Hypothesis 6 (GH6)
The sixth General Hypothesis states that there is a significant interaction
between Teacher Knowledge and Teacher Satisfaction in predicting Changes in
Teacher Practice. This hypothesis was found to be significant, F2,79 =9.603 with an
R2
changed=0.098 and a p=0.003, accounting for 9.8% of the total variance in Teacher
Practices (See Table 13). This suggests that teachers who were not satisfied with
their professional development scored lower on Teacher Practices regardless of
their Knowledge level. Whereas, the teachers that had higher satisfaction with the
professional development scored higher on Teacher Practices as their Knowledge
level increased (See Figure 8).
46
48
50
52
54
56
58
60
62
Low Knowledge High Knowledge
Tea
ch
er P
ra
cti
ces
Interaction of Satisfaction and Knowledge
when Predicting Teacher Practices
Figure 8. Interaction between Satisfaction and Knowledge when predicting Teacher Practices
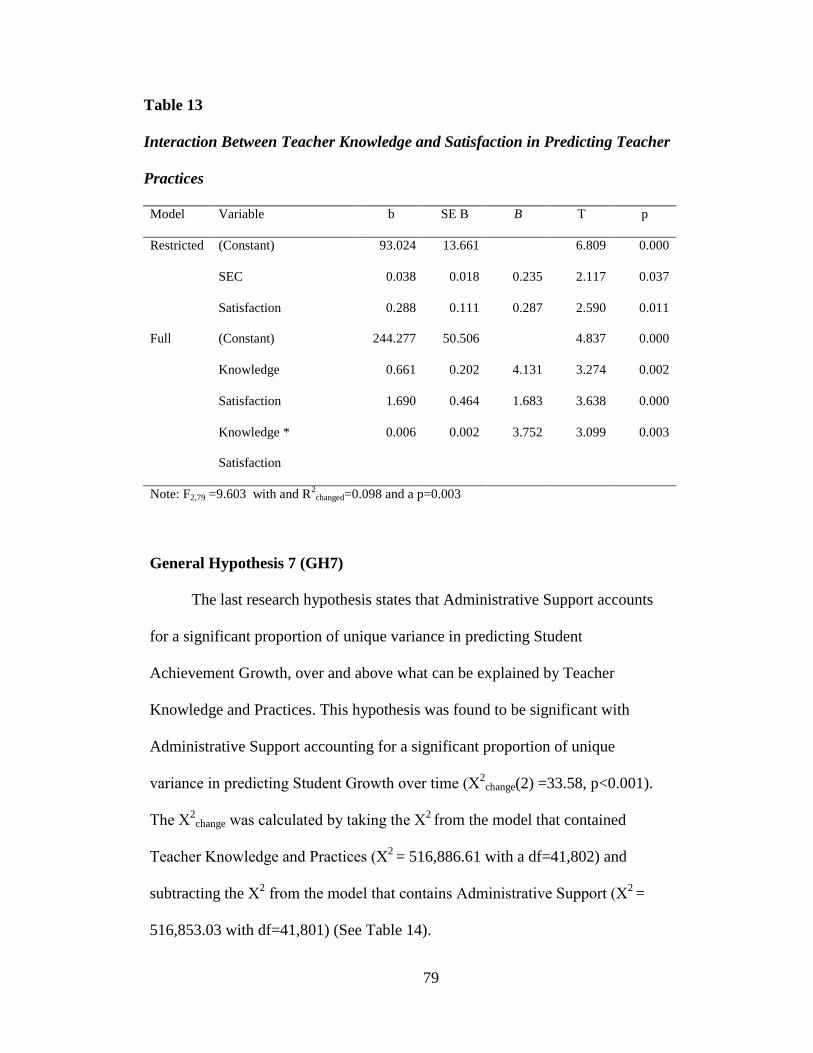
79
Table 13
Interaction Between Teacher Knowledge and Satisfaction in Predicting Teacher
Practices
Model Variable b SE B B T p
Restricted (Constant) 93.024 13.661 6.809 0.000
SEC 0.038 0.018 0.235 2.117 0.037
Satisfaction 0.288 0.111 0.287 2.590 0.011
Full (Constant) 244.277 50.506 4.837 0.000
Knowledge 0.661 0.202 4.131 3.274 0.002
Satisfaction 1.690 0.464 1.683 3.638 0.000
Knowledge *
Satisfaction
0.006 0.002 3.752 3.099 0.003
Note: F2,79 =9.603 with and R2changed=0.098 and a p=0.003
General Hypothesis 7 (GH7)
The last research hypothesis states that Administrative Support accounts
for a significant proportion of unique variance in predicting Student
Achievement Growth, over and above what can be explained by Teacher
Knowledge and Practices. This hypothesis was found to be significant with
Administrative Support accounting for a significant proportion of unique
variance in predicting Student Growth over time (Χ2
change(2) =33.58, p<0.001).
The Χ2
change was calculated by taking the Χ2
from the model that contained
Teacher Knowledge and Practices (Χ2
= 516,886.61 with a df=41,802) and
subtracting the Χ2 from the model that contains Administrative Support (Χ
2 =
516,853.03 with df=41,801) (See Table 14).
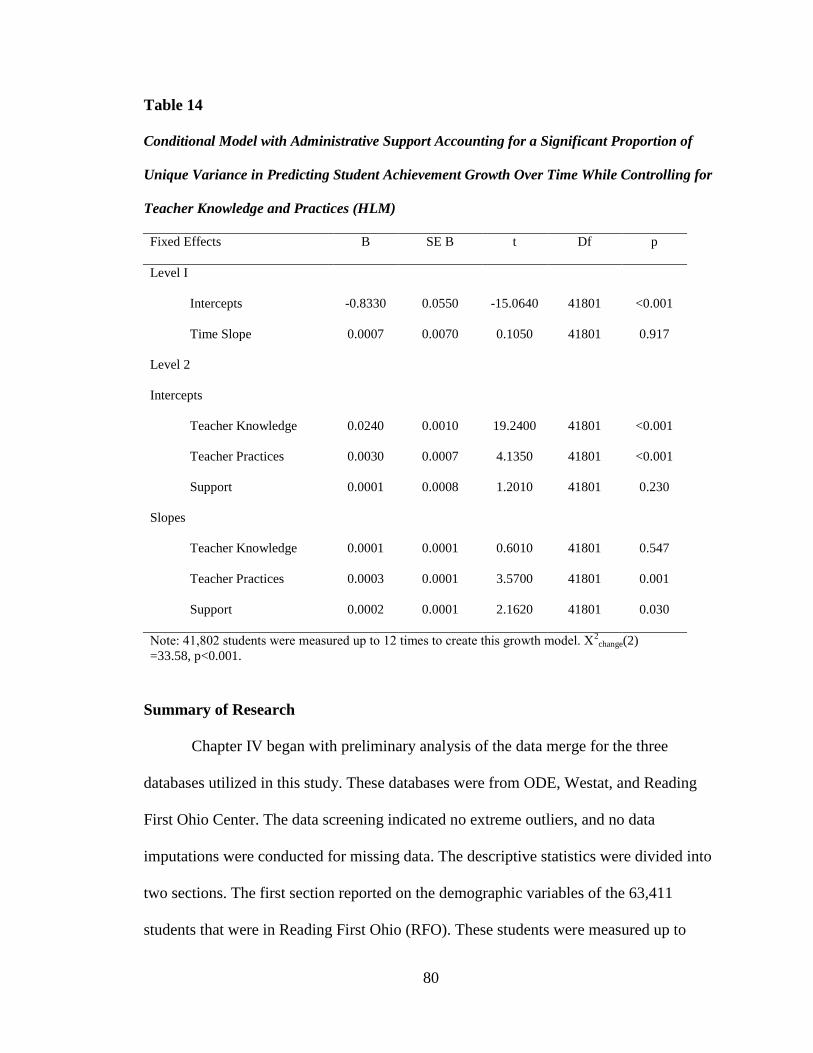
80
Table 14
Conditional Model with Administrative Support Accounting for a Significant Proportion of
Unique Variance in Predicting Student Achievement Growth Over Time While Controlling for
Teacher Knowledge and Practices (HLM)
Fixed Effects B SE B t Df p
Level I
Intercepts -0.8330 0.0550 -15.0640 41801 <0.001
Time Slope 0.0007 0.0070 0.1050 41801 0.917
Level 2
Intercepts
Teacher Knowledge 0.0240 0.0010 19.2400 41801 <0.001
Teacher Practices 0.0030 0.0007 4.1350 41801 <0.001
Support 0.0001 0.0008 1.2010 41801 0.230
Slopes
Teacher Knowledge 0.0001 0.0001 0.6010 41801 0.547
Teacher Practices 0.0003 0.0001 3.5700 41801 0.001
Support 0.0002 0.0001 2.1620 41801 0.030
Note: 41,802 students were measured up to 12 times to create this growth model. Χ2
change(2)
=33.58, p<0.001.
Summary of Research
Chapter IV began with preliminary analysis of the data merge for the three
databases utilized in this study. These databases were from ODE, Westat, and Reading
First Ohio Center. The data screening indicated no extreme outliers, and no data
imputations were conducted for missing data. The descriptive statistics were divided into
two sections. The first section reported on the demographic variables of the 63,411
students that were in Reading First Ohio (RFO). These students were measured up to
81
three times a year on the DIBELS, and one time a year on the TerraNova and the OAT,
across the six years of the RFO program. This section also included the descriptive
statistics and the average linear growth trends of the Student Achievement data on the
DIBELS, TerraNova and the OAT.
The second section reported information on the average school level variables that
were utilized in the creation of the factor constructs that represented Guskey’s
Professional Development Evaluation Model. The reliability of the ELLCO was next
reported with all of the reliability coefficients being high, ranging from a low of 0.895 to
a high of 0.949. The factor analysis was the last piece done in Chapter IV before the
primary analysis.
The factor analysis was computed utilizing Principal Component Analysis with a
varimax rotation solution. This resulted in a three-factor solution that accounted for
64.09% of the total variance. The resulting three factors were Teacher Knowledge,
Administrative Support and Teacher Practices. Table 15 presents all of the specific
research hypotheses, their p-values and indicates if the hypotheses are significant. As one
can see, all of the research hypotheses are significant at p<0.01, except for Hypothesis 2
where p=.016. These significances and the fact that the relationships are in the predicted
theoretical direction of Guskey’s Professional Development Evaluation Model, supports
the underlying nomological net upon which this model was based.
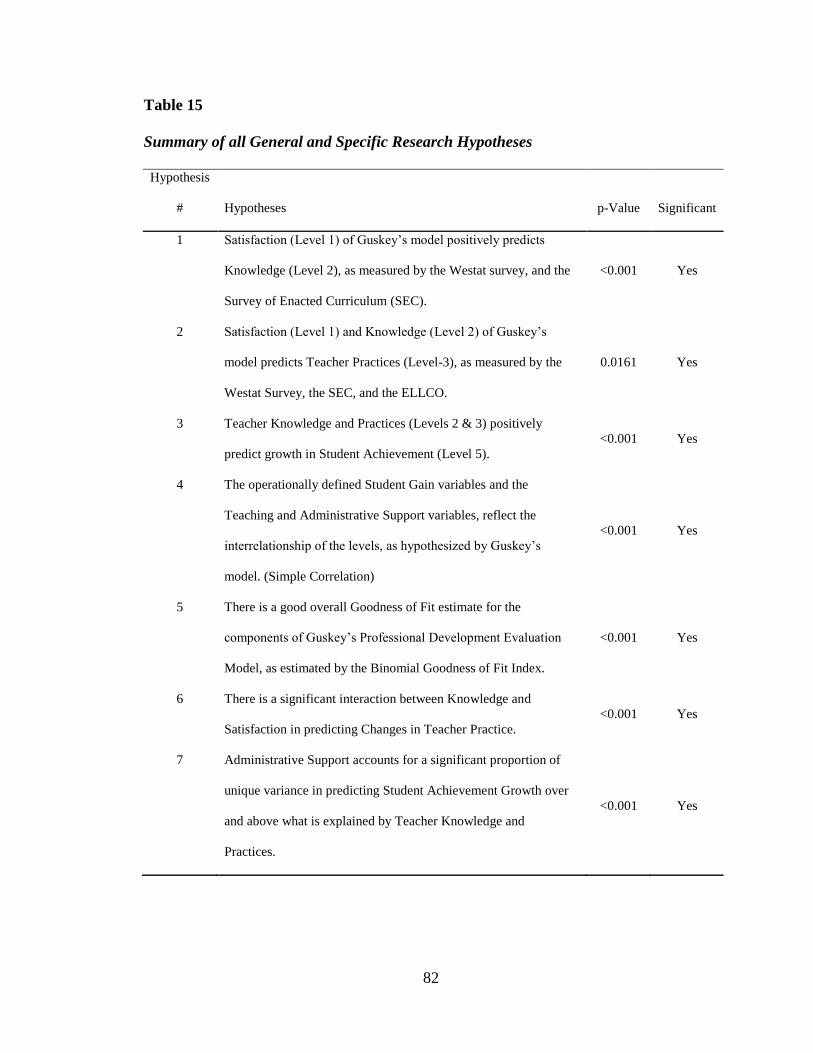
82
Table 15
Summary of all General and Specific Research Hypotheses
Hypothesis
# Hypotheses p-Value Significant
1 Satisfaction (Level 1) of Guskey’s model positively predicts
Knowledge (Level 2), as measured by the Westat survey, and the
Survey of Enacted Curriculum (SEC).
<0.001 Yes
2 Satisfaction (Level 1) and Knowledge (Level 2) of Guskey’s
model predicts Teacher Practices (Level-3), as measured by the
Westat Survey, the SEC, and the ELLCO.
0.0161 Yes
3 Teacher Knowledge and Practices (Levels 2 & 3) positively
predict growth in Student Achievement (Level 5).
<0.001 Yes
4 The operationally defined Student Gain variables and the
Teaching and Administrative Support variables, reflect the
interrelationship of the levels, as hypothesized by Guskey’s
model. (Simple Correlation)
<0.001 Yes
5 There is a good overall Goodness of Fit estimate for the
components of Guskey’s Professional Development Evaluation
Model, as estimated by the Binomial Goodness of Fit Index.
<0.001 Yes
6 There is a significant interaction between Knowledge and
Satisfaction in predicting Changes in Teacher Practice.
<0.001 Yes
7 Administrative Support accounts for a significant proportion of
unique variance in predicting Student Achievement Growth over
and above what is explained by Teacher Knowledge and
Practices.
<0.001 Yes
83
CHAPTER V
SUMMARY, DISCUSSION, CONCLUSIONS AND RECOMMENDATIONS
This chapter provides a brief summary restating the problem and purpose of the
study, an overview of the methodology and hypotheses, conclusions and discussion of the
findings of the seven research questions followed by implications, limitations and
concludes with recommendations for further research.
Summary of the Study
An increased demand for accountability has resulted in the requirement that most
externally funded projects have some type of comprehensive evaluation component.
There is no question that there is unprecedented interest in and a requirement for
accountability in the field of education (Desimone, 2009; Levine, 1974; Raudenbush,
2009). Well-designed evaluations are essential to make effective policy decisions.
Therefore, schools and districts depend on evaluations to assess the quality and impact of
their professional development that is designed to improve teacher practices and increase
student achievement (NCEE, 1983; NCLB 2001; Raudenbush, 2009).
Comprehensive evaluation models are used in the field of education to guide and
assess program development, professional development, and implementation success
(Guskey, 2002; Kirkpatrick, 2006; Stuffelbeam 2000, 2007). These models have
84
developed methods for assessing educational reform. The assumption is that the model
adopted by a school system is an effective tool that will aid them in designing and
evaluating their professional development efforts. However, this assumption is seldom, if
ever, supported by an empirical test of the model and is often based on common practice.
Consequently, while schools may invest heavily in designing and presenting professional
development opportunities for their teachers, they generally have little or no evidence to
indicate if the criterion based upon the model they have selected for their training is a
good indicator of effectiveness.
Professional development evaluation models are based upon assumptions that are
embedded in philosophic position and particular world views. This philosophical position
dictates what aspects or constructs are seen as valuable. In Guskey’s Professional
Development Evaluation Model, Guskey identifies the important constructs as
professional development satisfaction, changes in teacher knowledge, changes in teacher
practices, administrative support and ultimately growth in student achievement. The
advantage of working from a model is that it helps one to organize, defend, communicate,
and diagnose problems by looking at the interrelated components. However, as stated
earlier, few studies are available that validate or empirically test these different
evaluation models. Raudenbush (2009) and Gage (1999) stated that it is not sufficient to
adopt a model based on face validity, ease of use and/or because it has become common
practice in a given field. All models need to be empirically tested.
Therefore, the purpose of this study was to estimate the prediction validity of
Guskey’s Professional Development Evaluation Model. Secondly, it will clarify the
structural and ideological connections between important constructs and therefore
85
improve the overall organizational impact by refuting or confirming the claims. In this
research, the levels of the Guskey’s model were investigated to determine if their
relationships were consistent with the nomological net represented by the model. The
data from Reading First Ohio, years 2003 to 2009, were used as the data source to test the
hypothesized interrelationships represented by the nomological net.
Methodology
Research Design
This investigation utilized an ex post facto research design with hypotheses and
tests of alternative hypotheses (Newman, et al, 2006; Pedhazur & Schmelkin, 1991). An
ex post facto design is the most appropriate research design to use when testing a
nomological net for an already existing dataset. In addition, Newman, et al (2006)
indicates that this type of research design has the potential of higher external validity
when compared to quasi and true experimental designs.
Data Sources
The data for this research comes from databases that were developed by the Ohio
Department of Education, The Reading First Ohio Center, and Westat (the external
evaluation firm contracted by ODE) to evaluate Reading First Ohio (RFO) between 2003
and 2009. The sample for this study included every student, teacher, principal, literacy
specialist, resource coordinator and data manager involved in Reading First Ohio from
2003 to 2009. This encompasses 36 districts and 124 schools. In addition there were
63,411 students measured up to twelve times that participated in RFO during this period.
86
Statistical Analyses
Descriptive and inferential statistics were utilized in this study. The research
hypotheses were tested using correlations, multiple linear regression, and hierarchical
linear modeling when dealing with the naturally nested structure of the data or when
required for a repeated measure design. To assess the overall fit of the model the
Binomial Goodness of Fit Indices was used to test the number of paths predicted by the
model that were in the correct direction. This technique was utilized instead of structural
equation modeling (SEM) because of the number and complexity of the theoretical
interactions that Guskey’s Professional Development Model contains. SEM does not
adequately reconstruct the covariance structure of models that have interactions between
components.
Guskey’s Professional Development Evaluation Model
Guskey’s Professional Development Evaluation Model (2000) (Figure 9), as
graphically represented below, demonstrates the relationships that are assumed to exist
between his five levels/components. These relationships form the basis for all of the
hypotheses that are being tested in this research.
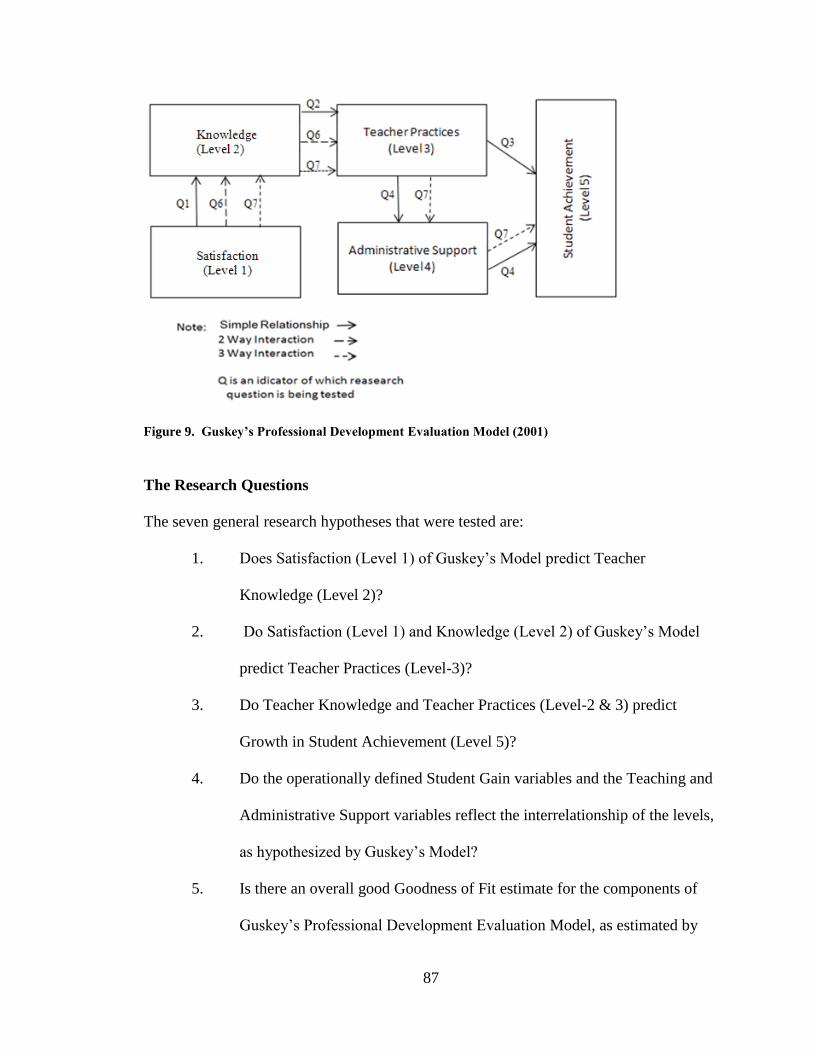
87
Figure 9. Guskey’s Professional Development Evaluation Model (2001)
The Research Questions
The seven general research hypotheses that were tested are:
1. Does Satisfaction (Level 1) of Guskey’s Model predict Teacher
Knowledge (Level 2)?
2. Do Satisfaction (Level 1) and Knowledge (Level 2) of Guskey’s Model
predict Teacher Practices (Level-3)?
3. Do Teacher Knowledge and Teacher Practices (Level-2 & 3) predict
Growth in Student Achievement (Level 5)?
4. Do the operationally defined Student Gain variables and the Teaching and
Administrative Support variables reflect the interrelationship of the levels,
as hypothesized by Guskey’s Model?
5. Is there an overall good Goodness of Fit estimate for the components of
Guskey’s Professional Development Evaluation Model, as estimated by

88
the Binomial Goodness of Fit Index.
6. Is there a significant interaction between Knowledge and Satisfaction in
predicting Changes in Teacher Practice?
7. Does Administrative Support account for a significant proportion of
unique variance in predicting Student Achievement when controlling for
the mediating variables of Teacher Knowledge and Teacher Practices?
Conclusions and Discussion
This section is organized by general research questions. Each research question is
broken out uniquely and conclusions and discussion are given for each one. An overall
global discussion will conclude this section where the research questions will be
discussed by appropriate groups.
In the first step a Principal Component Analysis (PCA) was utilized to derive the
underlying components of Guskey’s Model for Teacher Knowledge, Administrative
Support and Teacher Practices. The three components solution was selected since both
the eigenvalues and the scree plot resolved into these three components and they
accounted for 64.09% of the total variance. The first component, Teacher Knowledge
was comprised of: Percent of Building Implementation, Percent of Teacher
Implementation, Classroom Walk Through and SEC Alignment Totals, which accounted
for 31.090% of the total variance. Administrative Support, the second component, was
comprised of: Percent of Principal Change, Percent of Superintendent Change, and
Percent of Principal Support. Administrative Support accounted for 19.345% of the total
variance. Lastly, Teacher Practices had only one variable that loaded on it. This variable
was the ELLCO Total and it accounted for 12.837% of the total variance. Typically a one
89
variable component is not as strong or stable in prediction equations. However, in this
case it was empirically derived from a total scale score that had good reliability and is not
based on an individual item. This construct also made logical sense.
Research Question 1
The first research question investigated the relationship of Teacher Satisfaction
(Level 1) of Guskey’s Model to predict Teacher Knowledge (Level 2). The hypothesis
generated by this question was found to be statistically significant and in the predicted
direction (F1,81 =7.395, p = 0.008), with 8.4% of the variance in Teacher Knowledge
accounted for by Teacher Satisfaction. This supports the underlying conceptualization of
Guskey’s Professional Development Evaluation Model by supporting the theorized
relationship predicted in the first level of his Evaluation Model. Further support of this
finding was provided by Desimone (2009). In her study, Improving Impact Studies of
Teacher’s Professional Development: Toward Better Conceptualization and Measures,
Desimone found that one of the important links in an effective evaluation model is the
link between Teacher Satisfaction and Teacher Knowledge. Without this initial
relationship it is unlikely that the evaluation will discover any significant and lasting
benefit for either teachers or students.
Research Question 2
The second research question investigated if the level of Teacher Satisfaction
(Level 1) and Teacher Knowledge (Level 2) of Guskey’s Model to predict Teacher
Practices (Level-3). The hypothesis generated by this question was found to be
significant (F2, 80 = 4.376, p=0.016), with 9.9% of the variance in Teacher Practices
accounted for by Satisfaction and Teacher Knowledge. This research question further
90
supports Guskey’s model and the conceptual framework discussed in Desimone’s (2009)
study where she also found that teacher satisfaction and knowledge predicted changes in
teacher practices. Fishman, Marx, Best, and Tal, (2003) also suggested that the
relationship between Satisfaction, Teacher Knowledge and Teacher Practices has to be
assessed to help to improve professional development. Without a strong connection
between these components professional development will not produce the desired
changes in student achievement
Research Question 3
The third research question investigated the theoretical relationships suggested by
the next level of Guskey’s Professional Development Evaluation Model. The implied
relationship is that Teacher Knowledge and Teacher Practices (Levels-2 & 3) predict
Growth in Student Achievement (Level 5). This is the first of two of the nested data
analyses that were conducted. Since students were nested within the schools, Hierarchical
Linear Models were utilized. This research question generated the hypotheses that tested
the variance accounted for by the unconditional student growth model against the
conditional growth model with Teacher Knowledge and Practices. This is done in much
the same way one tests a full model against a restricted model (McNeil et al, 1996). This
procedure allows one to ascertain the proportion of unique variance accounted for by
adding the second level in the conditional model. The hypothesis was found to be
significant with a Χ2
change(2) =739.7 and p<0.001, indicating that there is a significant and
positive relationship between school level Teacher Knowledge and Practice and the rate
in which Student Achievement increases as measured by the number of standard
deviations they are away from the grade appropriate benchmark. In other words,
91
increases in Teacher Knowledge and Teacher Practices seem to predict improvement in
students’ achievement scores. Desimone’s 2009 study on assessing which components of
evaluation models are critical for improving professional development, also found that
evaluation models with relationships between Teacher Knowledge, Teacher Practices and
Student Achievement were critical in having an effective professional development
program. This current research was also supported by Mullens, Murnane and Willett
(1996), who used HLM to test students nested within classrooms. These researchers also
found a significant relationship between Teacher Knowledge and Teacher Practices for
improving Student Achievement.
Research Question 4
The fourth research question investigated all of the simple relationships purposed
by Guskey’s model. The first relationship tested to see if Satisfaction (Level 1)
significantly predicted Teacher Knowledge (Level 2). This level was found to be
significant (r=0.289, p<0.001). The second level, Teacher Knowledge (Level 2), did not
significantly predict Teacher Practice (Level 3) with an r=0.056 and p>0.05. One
possible explanation of why this theoretical relationship was not significant could be that
there appears to be an interaction between Teacher Satisfaction and Teacher Knowledge
in predicting Teacher Practices (Research Question 6). This may also be why there was
not a significant relationship between Teacher Practices (Level 3) and Administrative
Support (Level 4) with an r=0.176 and p>0.05. Further discussion about this is provided
later in the limitation section.
There are significant relationships between the majority of the student
achievement data aggregated at the student level. The DIBELS is correlated with all of
92
Guskey’s Levels at the p<0.01, except for Teacher Satisfaction (Level 1). The same
trend also holds true for the TerraNova and the OAT. Even though Teacher Practices are
not significantly correlated with these achievement measures when aggregated at the
building level, as predicted in Guskey’s model, the majority of the relationships tested
support Guskey’s conceptualization. This indicates strong support for the use of this
evaluation model when planning and assessing professional development.
Research Question 5
The fifth research hypothesis investigated the overall Goodness of Fit estimate for
the components of Guskey’s Professional Development Evaluation Model. This estimate
was calculated by using the Binomial Goodness of Fit Index. All of the theoretically-
proposed paths were found to be in the predicted direction (seven out of seven). The
likelihood of this occurring by chance is less than one time in a thousand (p<0.01),
therefore supporting the overall fit of the model. Additionally, four of the seven paths
were independently significant. This also supports the use of Guskey’s model as an
effective method for assessing the quality and potential benefits of teacher and building
level professional development.
Research Question 6
The sixth research question investigated interaction between Knowledge and
Satisfaction in predicting Changes in Teacher Practice. This question generated the
hypothesis that was found to be statistically significant, F2,79 =9.603, with an
R2
changed=0.098, and a p=0.003, accounting for 9.8% of the total variance in Teacher
Practices (See Table 10). This suggests that teachers who were not satisfied with their
professional development scored lower on Teacher Practices regardless of their
93
Knowledge level. Whereas, the teachers that had higher satisfaction with the professional
development scored higher on Teacher Practices as their Knowledge level increased. As
David Berliner (2002) once described, “Education research is the hardest where the
ubiquity of interactions easily can confound efforts of scholars to determine which
variable can predict both teacher retention and student achievement” (p. 18). This appears
to be the case in this study when Teacher Practices are being investigated. This
interaction is critical to understand and potentially mediate problems in improving
teacher practices. By early identification of teachers with low satisfaction with their
professional development trainers can provide other interventions or additional trainings
and hopefully improve these teachers’ practices.
Research Question 7
The seventh and final research question investigated whether Administrative
Support accounts for a significant proportion of unique variance in predicting Student
Achievement Growth, over and above what can be explained by Teacher Knowledge and
Practices. The hypothesis generated from this research question was found to be
statistically significant with Administrative Support accounting for a significant
proportion of unique variance in predicting Student Growth over time (Χ2
change(2) =33.58,
p<0.001). The Χ2
change was calculated by taking the Χ2
from the model that contained
Teacher Knowledge and Practices (Χ2
= 516,886.61 with a df=41,802) and subtracting
that Χ2 from the model that contains Administrative Support (Χ
2 = 516,853.03 with
df=41,801). In O’Donnell & White’s (2007) research, “Principals' Influence on Academic
Achievement: The Student Perspective,” they found that the principal as an instructional
leader is crucial in understanding the complex components required to improve student
94
achievement. Desimone (2009) and Guskey’s theoretical model also support the need for
ongoing administrative support as a crucial factor in assessing the effect of professional
development. Desimone found that without administrative support it is very unlikely that
any potential change from professional development will be neither sustained over any
prolonged period of time nor be systematically employed throughout the school or
district.
Global Discussion of the Research Questions
The seven research questions in this study were derived to investigate the
construct validity of the theoretically-proposed relationships assumed to exist in
Guskey’s Professional Development Evaluation Model. The results supported the model
in that the relationship between Teacher Satisfaction, Teacher Knowledge, Teacher
Practices, Administrative Support and Student Achievement were found to exist as
predicted by the model, with one exception. The only hypothesized relationship that was
not fully supported was relationship between Teacher Knowledge and Teacher Practice.
This result which seems suppressing at first glance can be explained by the interaction
that was found to exist between Teacher Satisfaction and Teacher Knowledge when
predicting Teacher Practice. This investigation found that the gains in Teacher
Knowledge only increase Teacher Practices if there is high satisfaction with the
professional development. If teachers were not satisfied with the professional
development regardless of their gains in knowledge, there would be almost no change in
Teacher Practice. This interaction is consistent with the results reported by Desimone
(2009) and Mullens, et al (1996) and even alluded to by Berliner (2002) who found it
difficult if not impossible to study teacher practices without understanding the complex
95
interactions between variables like satisfaction and knowledge gained from professional
development. Lastly, the findings that Administrative Support accounted for a significant
proportion of unique variance in predicting gains in Student Achievement even when
controlling for gains in Teacher Knowledge and Teacher Practice further supported the
construct validity of this model. This finding is consistent with earlier research
conducted by Desimone (2009) and O’Donnell, et al (2007) who found that
administrative support is critical in creating longer systematic changes in districts. As
these finding have indicated there is strong overall support of the nomological net suggest
by Guskey’s Professional Development Evaluation Model.
Implications
This research is critically important because there are very few studies that
investigate the nomological net of the models being used to assess professional
development in teacher education. Districts typically invest large portions of their budget
in providing professional development that is delivered and/or assessed through models
that they assume to be effective. This may or may not be the case. Without investigating
if the models actually are effective, districts may be wasting resources and may not be
achieving the desired student academic outcomes. This research was done with Guskey’s
Model and there was overwhelming support for the use of this Model by school districts
to assess their ongoing professional development.
It became apparent throughout this research that by investigating the components
of Guskey’s model, and the relationships between components, one can identify the
strengths and weaknesses of both the data that are being collected and the components of
96
the model that is being used to evaluate professional development. This information is
critical in improving the effectiveness of professional development to improve Teacher
Practices and Student Achievement. Evaluators in the field need to constantly identify
any weaknesses that may exist to make midcourse adjustments and modifications. This
same methodology could also yield valuable information about other models currently
employed in the field of education.
In the current study there were three reasons why it was not surprising that a
significant relationship did not exist between Teacher Knowledge and Teacher Practices.
First, the high mobility of teacher may have made it increasingly difficult for teachers to
implement new practices with fidelity. Due to the lack of continuity in their teaching
placement, teachers may well have needed more time to become acclimated to their new
schools and to get to know their new population of students before they were willing to
“experiment” with new practices in the classroom. Therefore, when one is evaluating
teacher practices in the field they need to account for teacher mobility. The second
reason, as reveled in hypothesis six, is that there is an interaction between Satisfaction
and Teacher Knowledge when predicting Teacher Practices. In other words, Teacher
Knowledge differentially predicts Teacher Practices as the level of Satisfaction varies. By
identifying teachers who have lower satisfaction, school districts can create or implement
additional training to increase Teacher Satisfaction Scores and thus improving Teacher
Practices. The last reason Teacher Knowledge might not have been found to predict
Teacher Practices could have been a measurement issue. Because the construct of
Teacher Practice only has one variable, that construct may potentially lack stability and
possibly may not have sufficient validity. It is vitally important for practitioners who are
97
using instruments to evaluate their ongoing professional development to understand the
reliability and validity of the constructs measured by these instruments. If the constructs
appear not be reliable or valid, it is the practitioners responsibility to make the needed
adjustments by either using supplemental instruments to measure that construct or if not
possible to be critical in making any suggestions based on the finding.
The data also indicated that there was not a significant relationship between
Administrative Support and Teacher Practices. It is possible that the large Administrator
turnover, for both principals and superintendents, may have impacted on Teacher
Practice. Without consistent leadership that commits to a direction of change, it may
have been difficult to implement change in school environments that lacked leadership
stability. This is an area that needs further examination. However, when evaluating
professional development one also has to assess the stability of the administrative staff.
This research has also made it apparent that no matter how skillfully an evaluation
is planned, it is not possible to identify all data issues prior to initiating the evaluation.
Therefore, it is highly recommended that a pilot study be conducted prior to the initiation
of full scale evaluations.
As mentioned earlier and is worth mentioning again, this study found strong
empirical evidence that supports the overall underlying constructs of Guskey’s
Professional Development Evaluation Model. However, the research also identified
which components of the model predicted as expected and which did not. School
districts can use this information diagnostically with their current professional
development to suggest what supplemental programs might be needed to achieve the
intended outcomes. By identifying the components that seem to be critical, districts can
98
ameliorate existing shortcomings to improve the effectiveness of their professional
development.
Limitations
These research results were positive and supportive of Guskey’s Model; however,
there were several limitations to this study. As with any research project of this size and
scope, involving multiple school districts across an entire state, organizing the data
sources for multiple agencies is a complicated process. One inherent problem when
working with already existing databases is that the data are limited to what has already
been collected by outside organizations. In the current study, the data were collected by
the Ohio Department of Education, The Reading First Ohio Center, and Westat, and this
researcher was unable to modify the data collection protocols. Under these
circumstances, the researcher also could not control the fidelity of the data collection
process. Therefore, any potential holes in the data, such as missing data or consistency in
data collection procedures, are potentially problematic.
A delimitation of this study was that the components of Guskey’s model were
operationally defined by the data collected by the outside agencies named above.
Therefore, this limits the generalizability of the findings to Guskey’s components as
operationally defined.
Additionally, it is more appropriate to only generalized to districts with similar
characteristics to those in this study, such as high poverty and low academic achievement
sores (see the demographic description of this sample in chapter 3). These districts have
99
specific contextual differences that could potential change the dynamic relationships
between the theoretically-proposed paths of Guskey’s model.
Another limitation is that in this research, multiple instruments were used by
different organizations to collect the data. This could present a problem because the
different instruments were potentially measuring different underlying constructs.
Although a Principal Component Analysis was used to alleviate this problem, one of the
three constructs that was consistently used across all schools, Teacher Practices, was
made up of only one total score. Even though this does not appear to be a problem in this
research since the construct was a total score, this can potentially effect the stability of
the component as well as its reliability and validity. Therefore, it is possible that some of
the results pertaining to Teacher Practices were a result of poor construct integrity.
The high occurrence of principal and superintendent turnover was another
limitation. Not only was there high administrative turnover, there was also high teacher
mobility. This was especially true in the urban school districts. This did not seem to
effect teacher knowledge as much as it did the implementation of that knowledge as
reflected by teacher practices.
Recommendations for Further Research
This data presents several opportunities for extended research. Some of the
suggested options for further study are:
The relationship between Administrative Support and Teacher practices
can be compared in schools where there was no administrative turnover to

100
those that had turnover. This can be investigated for both superintendent
and principal turnover.
Analyses of identified subgroups (rural, urban, suburban) can be done to
see if the same relationships between model components exist.
Because of the interaction between Satisfaction and Teacher Knowledge
in predicting Teacher Practices, one needs to further investigate Teacher
Practices to see if any other variables interact with Teacher Practices using
a multidimensional such as any of the Administrative Support variables.
It may be informative to take a sub-sample to see if the relationships found
in this model hold up when teachers are experienced, in comparison to
teachers who are not experienced.
The data can be cross-validated to determine the stability of the results.
(This may be less important because the N in this study is so large.)
It would be interesting to see if the relationships found in this study are
unique to these operational definitions or if there are other definitions that
may be more tenable, and therefore should be used
One can also look at the stability of the component structures across
different samples such as social economic groups.
One also can investigate the component of dosage (amount of professional
development) as a potential critical construct or as it pertains to Teacher
Practices or Administrative Support. Many studies have suggested that
there needs to be 90 minutes of professional development per month.
101
While these suggestions are not totally comprehensive, they do provide several
paths for building on the current research. Any additional information that could shed
light on the efficacy of the evaluation models being used in education would be of benefit
to school districts and may help them to be more effective in providing professional
development that improves student learning.
Summary
This research investigated the nomonlogical net that supports the constructs of
Guskey’s Professional Development Evaluation Model. The data that was utilized in this
study was compiled from the Ohio Department of Education, the Reading First Ohio
Center and Westat. This included student data collected on 63,411 students who were
measured up to 12 times, as well as data on 124 schools. Principal Component Analysis
was then utilized to create the components of Administrative Support, Teacher
Knowledge, and Teacher Practice. All of the hypotheses were found to be significant in
support of the underlying theory of Guskey’s model. However, the one component of the
model that was found to be not statistically significant pertained to Teacher Practices.
This lack of significance can possibly be the result of the interaction between Teacher
Knowledge and Satisfaction in predicting Teacher Practices, the large turnover of
administrators and teachers, or reliability issues that result from a one variable solution in
the PCA. These results supported Guskey’s model and lead one to consider the possible
implication of implementing the model, not only for evaluating professional
development, but also for diagnostic purposes in identifying components that need extra
attention.
102
REFERENCES
Alliger, G.M. & Janak, E.A. (1989) Kirkpatrick’s levels of training criteria: Thirty years
later. Personnel Psychology, 42(2), 331-342.
Alkin, M.C. (2004). Evaluation Roots: Tracing Theorists' Views and Influences.
Thousand Oaks, CA: Sage Publications
Betts, J., Good, R.H., III, Cummings, K.D., Williams, K.T., Hintze, J.M., & Ysseldyke,
J.E. (2007, March). Psychometric adequacy of measures of early literacy skills.
Symposium presented at the National Association of School Psychologists
Annual Convention, New York.
Blake, R. (2005). Survey of Enacted Curriculum: Data tools for curriculum alignment to
enable high school achievement. Retrieved 1/22/10
http://seconline.wceruw.org/Reference/SECBrochure05.pdf
Berliner, D. (2002). Educational research: The hardest science of all. Educational
Researcher, 31(8), 18-20.
Catalanello, R.F. & Kirkpatrick, D.L. (1968). Evaluating Training Programs - The State
of the Art,. Training and Development Journal. 22 (5), 2-9.
Cohen, J. (1977). Statistical power analysis for the behavioral sciences (2nd
ed.) New
York, N.Y. : Academic Press.
Cooley, W.W. & Lohnes. (1976). Evaluation research in education: Theory, principles
and practice. New York: Irvington Publishers
Corcoran, T. C. (1995). Transforming professional development for teachers: A guide for
state policymakers. Washington, DC: National Governors' Association. D384600
Cronbach, L.J. (1984). Essentials of psychological testing. New York: Harper & Row.
103
Cronbach, L.J. & Meehl, P.E.(1955) Construct validity in psychological tests.
Psychological Bulletin, 52, 281-302.
CTB/McGraw-Hill. (2001). TerraNova Technical Report , CA: Author.Form
Desimone,L., Smith, T., Hayes, S., Frisvold, D. (2005). Beyond accountability and
average mathematics scores: Relating state education policy attributes to
cognitive achievement domains. Educational Measurement Issues and Practice.
24(4), 5-18.
Desimone,L.(2009). Improving impact studies of teachers’ professional development :
Towards better conceptualizations and measures. Educational Researcher. 38(3),
181-199.
Educational Development Center, Inc. (2002). Early Language and Literacy Classroom
Observation (ELLCO).
Fishman, B. J., Marx, R. W., Best, S., & Tal, R. T. (2003). Linking teacher and student
learning to improve professional development in systemic reform. Teaching &
Teacher Education, 19(6), 643-658.
Fitzpatrick, (1998). Dialogue with Marsha Mueller. American Journal of Evaluation. 19,
87-99.
Fraas, J. W., & Newman, I. (1994). A binomial test of model fit. Structural Equation
Modeling: A Multidisciplinary Journal, 1(2), 1994, 268-273.
Frechtling, J. A., Sharp, L., Carey, N., & Baden-Kierman, N. (1995). Teacher
enhancement programs: A perspective on the last four decades. Washington,
DC: National Science Foundation Directorate for Education and Human
Resources.
104
Gage, N.L. (1999). Theory, norms, and intentionality in process–product research on
teaching. In R. J. Stevens (Ed.), Teaching in American schools (pp. 57–80). Upper
Saddle River, NJ: Merrill.
Good, R. H. & Kaminski, R. A. (2002). DIBELS oral reading fluency passages for first
through third grades (Technical Report No. 10). Eugene, OR: University of
Oregon.
Guskey, T.R. (1991). Enhancing the effectiveness of professional development
programs, Journal of Educational and Psychological Consultation, 2(3), 239-247.
Guskey, T. (1992). Successfully implementing outcome-based education. Texas Study of
secondary Education, 11(1), 6-8.
Guskey, T.R. (1995). Professional development in education: In search of the optimal
mix. In T.R. Guskey & M. Huberman (Eds.) Professional development in
education: new paradigms and practices (pp. 114-131). New York: Teachers
College Press.
Guskey, T.R. (1998) The age of our accountability: Evaluation must become an integral
Part of staff development. Journal of Staff Development, 19(4), 33-44.
Guskey, T.R. (1999). Moving from means to ends. Journal of Staff Development, 20(2),
48.
Guskey, T.R. (2000). Grading policies that work against standards…and how to fix them.
NASSP Bulletin, 84(620), 20-29.
Guskey, T.R. (2001). Mastery learning. In N.J. Smelser & P.B. Baltes (Eds.),
International encyclopedia of social and behavioral sciences (pp. 9372-9377).
Oxford, England: Elsevier Science Ltd,
105
Guskey, T.R. (2002). Professional development and teacher change. Teachers and
Teaching: Theory and Practice. 8(3/4), 389-391.
Guskey, T. R. (2003). What makes professional development effective. Phi Delta
Kappan, 84(10), 748-750.
Guskey, T.R. & Sparks, D. (2004). Linking professional development to improvements in
student learning. In E.M. Guyton & J.R. Dangel (Eds.), Teacher Education
Yearbook XII: Research Linking Teacher Preparation and Student Performance,
Dubuque, IA: Kendall/Hunt.
Hair, J.F., Black, BW.C., Anderson, R.E. & Tatham, R.L. (2006). Multivariate data
analysis (6th
ed.) New Jersey: Prentice Hall.
Hashem, M. (2007) Becoming an independent field: Societal pressures, state, and
professions. Higher Education 54:2, 181-205
Hayduk, L. A. (1996). LISREL issues, debates, and strategies. Baltimore: Johns Hopkins
University Press.
Holon, E.F. (1996). The flaws four-level evaluation model. Human Resources
Development Quarterly, 7(1), 5-21.
Joint Committee of Standards for Educational Evaluation. (1994). The program
evaluation standards (2nd
ed.). Thousand Oaks, CA: Sage.
Kazdin, A.E. (1992). Research Design in Clinical Psychology. Boston, MA: Allyn &
Bacon.
Kerlinger, F.N. (1986). Foundations of behavioral research. Fort Worth, TX: Harcourt
Brace & Jovanovich.
106
Kerlinger & Lee, H.B. (2000). Foundations of behavioral research (4th ed.). Toronto,
Ontario, Canada: Wadsworth Thomson.
Kirkpatrick, D. L. (1959a). Techniques for evaluating training programs: Reaction.
American Society for Training and Development Journal, 18, 3-9.
Kirkpatrick, D. L. (1959b). Techniques for evaluating training programs: Learning.
American Society for Training and Development Journal, 18, 21-26.
Kirkpatrick, D. L. (1960a). Techniques for evaluating training programs: Behavior.
American Society for Training and Development Journal, 19, 13-18.
Kirkpatrick, D. L. (1960b). Techniques for evaluating training programs: Learning.
American Society for Training and Development Journal, 18, 28-32.
Kirkpatrick, D. L. (1996, January). Great ideas revisited: Revisiting Kirkpatrick’s four-
level model. Training & Development, 50(1), 54-57.
Kirkpatrick, D. L. (1998). Evaluating training programs: The four levels (2nd
ed.). San
Francisco, CA: Berrett-Koehler Publishers.
Kirkpatrick, D. L., & Kirkpatrick, J. D. (2005). Transferring learning to behavior: Using
the four levels to improve performance. San Francisco, CA: Berrett-Koehler
Publishers.
Kirkpatrick, D. L., & Kirkpatrick, J. D. (2006). Evaluating training programs: The four
levels. San Francisco, CA: Berrett-Koehler Publishers.
Kuhn, T. S. (1970). The structure of scientific revolutions. Chicago: Univ. of Chicago
Press.
Levine, H. (1974). A conceptual framework for accountability in education. School
Review, 82, 363-391.
107
Lomax, R. G. (1992). Statistical concepts: A second course for education and the
behavioral sciences. White Plains, NY: Longman.
Loucks-Horsley, S., Hewson, P. W., Love, N., & Stiles, K. E. (1998). Designing
professional development for teachers of science and mathematics. Thousand
Oaks, CA: Corwin Press.
Marsh, H. W., Balla, J. R. & McDonald, R. P. (1988). Goodness-of-fit indices in
confirmatory factor analysis: The effect of sample size. Psychological
Bulletin, 102, 391-410.
McCaffrey, D. F., Lockwood, J. R., Koretz, D. M., and Hamilton, L. S. (2003).
Evaluating value-added models for teacher accountability. Santa Monica:
RAND, MG-158-EDU.
McNeil, K., Newman, I., & Kelly, F.J. (1996). Testing research hypotheses with the
general linear model. Carbondale, IL: Southern Illinois University Press.
McNeil, K. Newman, I., & Steinhauser , J. (2005). How to be program evaluation:
What every administrator needs to know. Lanham, MD: Scarecrow Education.
Migotsky, C., & Stake, R. (2001). An evaluation of an evaluation: CIRCE's
metaevaluation of the ATE program evaluation. Urbana-Champaign, IL:
University of Illinois at Urbana-Champaign.
Mullens, J., Murnane, R., & Willett, J. (1996). The contribution of training and subject
matter knowledge to teaching effectiveness: A multilevel analysis of longitudinal
evidence from Belize. Comparative Education Review, 40(2), 139-157.
National Research Council. (1999). Improving student learning: A strategic plan for
educational research and its utilization. Committee on a Feasibility Study for a
108
Strategic Education Research Program. Washington, DC: National Academy
Press.
Naugle, K. Naugle, L. B. & Naugle, R. J. (2000). Kirkpatrick’s evaluation model as a
means of evaluating performance. Education, 121(1), 135-145.
National Commission on Excellence in Education. (1983). A nation at risk: The
imperative for educational reform. Washington, D.C.
No Child Left Behind Act of 2001, Pub. L. No. 107–110
Newman, I., Bliss, K., & Newman, C. (2007). Testing nomological network. Paper
presented at the Doctoral Research Seminar at Andrews University, Berrien
Springs.
Newman, I., McNeil, K., & Fraas, J. (2004). Two methods of estimating a study’s
replicability. Mid-Western Educational Researcher, 12(2), 36-40.
Newman, I., & Newman, C. (1994). Conceptual statistics for beginners (2nd Ed.).
Lanham, MD: University Press of America, Inc.
Newman, I., Newman, C., Brown, R. & McNeeley, S. (2006). Conceptual statistics for
beginners (3rd Ed.). Lanham, MD: University Press of America, Inc.
Newman, I., Ridenour, C., Newman, C., & DeMarco, Jr. G. (2003). A typology of
research purposes and its relationship to mixed methods. In A. Tashakkori & C.
Teddie (Eds.), Handbook of mixed methods in social and behavioral research.
Sage Publications.
Newman, I., Ridenour, C., Newman, C., & Smith, S. (2007). Detecting low incident
effects: The value of mixed methods design as they apply to suicide and
109
depression among middle school students. Paper presented at the American
Educational Research Association Annual Conference, Chicago IL.
O’Donnell, R. J., White, G. P. (2007, Sept.). Principals' influence on academic
achievement: The student perspective. NASSP Bulletin, 91, 219-236
Office of Literacy Center for Curriculum and Assessment Ohio Department of Education.
(2008). Personal communication with Paula Mahaley and Chad Richardson Data
Managers.
Ohio Department of Education, (1998). Ohio’s Practical Handbook for Comprehensive
Continuous Improvement Planning: Basic Guidelines for Ohio School Districts
Pedhazur, E.J. (1982). Multiple regression in behavioral research: Explanation and
prediction. New York: Holt, Rinehart, & Winston.
Pedhazur & Schmelkin,L.P. (1991). Measurement, design, and analysis: an integrated
approach. Hillside, N.J. Lawrence Erlbaum Associates.
Popper, K.R. (1968). The Logic of Scientific Discovery. New York, N.Y.: Hutchinson.
Posavac, E.J. (2002). Using p values to estimate the probability of statistically significant
replication. In Understanding Statistics, 1(2), 101-112.
Raudenbush, S. 2009. The Brown legacy and the O’Connor challenge: Transforming
schools in the image of children’s potential. Educational Researcher 38(3), 169-
180.
Raudenbush, S.W. and Bryk, A.S. (2002). Hierarchical linear models: Application and
data analysis methods (2nd
ed). Thousand, Oaks, CA: Sage Publications.
110
Raudenbush, S. W., Bryk, A. S., Cheong, Y. F., and Congdon, R. (2001). HLM5:
Hierarchical Linear and Nonlinear Modeling (2nd Ed.), Scientific Software
International, Chicago.
Reading First Ohio (data 2003-209)
Scriven, M. (1967). The methodology of evaluation. In R.E. Stake (Ed). Curriculum
evaluation. American Educational Research Association Monograph Series on
Evaluation, No. 1. Chicago, Randy McNally.
Scriven , M. (1972). The pathway comparison model. Berkeley: University of
California.
Scriven, M. (1994). Evaluation as a discipline. Studies in Educational Evaluation,
20 (1), 147-166.
Scriven ,M. (1998). The new science of evaluation. International of social welfare, 7(2),
S.79-86.
Smith, M. W., & Dickinson, D. K. (2002). User’s guide to the early language and
literacy classroom observation toolkit. Baltimore, MD: Brookes.
Speck, M. & Knipe, C. (2001). Why Can't We Get It Right? Professional development in
our schools. Thousand Oaks, CA: Corwin Press.
Stake, R.E. (2000). Program evaluation, particularly responsive evaluation. In D.
Stufflebeam, G. Madaus, & T. Kellaghan, Evaluation models: Viewpoints on
educational and human service evaluation (pp. 344- 362). Boston: Kluwer-
Nijhoff.
Stake, R.E. (2000). Case studies. In Norman K. Denzin & Yvonne S. Lincoln (Eds.),
Handbook of qualitative research (2nd edition) (pp.435-454). London: Sage.
111
Stake, R.E. (1998). Some comments on assessment in U.S. education. Education Policy
Analysis Archieves, 6(14). ISSN 1068-2341.
Stufflebeam, D.L. (1971). The relevance of the CIPP evaluation model for educational
accountability. Journal of Research and Development in Education. 5(1), 19-25.
Stufflebeam, D. L. (1974). Metaevaluation. Occasional Paper Series #3. Kalamazoo MI:
Western Michigan University Evaluation Center.
Stuffelbeam, D.L. (2000). The context, inputs, eprocess, and products (CIPP) model
for program evaluation. In D. L., Stufflebeam, G. F. Madaus, and T. Kellaghan
(Eds), Evaluation Models: Viewpoints on Educational and human services
evaluation. Boston, MA: Kluwer.
Stufflebeam, D.L. and Shinkfield, A.J. (2007). Evaluation theory, models, and
applications. San Francisco, CA: Jossey-Bass.
Timm, N. (2002). Applied Multivariate Analysis. New York, N.Y.: Springer.
Westat (2003) Technical Report for Reading First Ohio pg 1 & pg 47
Westat (2008). Technical Report for Reading First Ohio. Pg 9-10
Wiggins, G. & McTighe, J. (1998). Understanding by Design. Alexandria, VA: ASCD.
Wisconsin Center for Educational Research (WCER). (1995) Survey of Enacted
Curriculum (SEC) University of Wisconsin.
Zepeda, S.J. (2008). Professional development: What works. Larchmont, N.Y.: Eye on
Education, Inc.


![[J] Modeling TCP Reno Performance - A Simple Model and Its Empirical Validation](https://img.pdfslide.us/doc/110x75/577c86611a28abe054c0ea4e/j-modeling-tcp-reno-performance-a-simple-model-and-its-empirical-validation.jpg)