Embed Size (px)
Citation preview

Federal Reserve Bank of Minneapolis
Research Department
An Empirical Study of TradeDynamics in the Fed Funds Market∗
Gara Afonso and Ricardo Lagos
Working Paper 708
March 2014
ABSTRACT
We use minute-by-minute daily transaction-level payments data to document the cross-sectional
and time-series behavior of the estimated prices and quantities negotiated by commercial banks in
the fed funds market. We study the frequency and volume of trade, the size distribution of loans,
the distribution of bilateral fed funds rates, and the intraday dynamics of the reserve balances held
by commercial banks. We find evidence of the importance of the liquidity provision achieved by
commercial banks that act as de facto intermediaries of fed funds.
Keywords: Monetary policy; Federal funds market; Federal funds rates
JEL classification: E42, E44, G21
∗Afonso: Federal Reserve Bank of New York. Lagos: New York University and Federal Reserve Bank of
Minneapolis. We thank Andrew Howland and David Lou for excellent research assistance. Part of this
research was conducted while Lagos was a visitor at the Federal Reserve Bank of Minneapolis. The views
expressed herein are those of the authors and not necessarily those of the Federal Reserve Bank of New York,
the Federal Reserve Bank of Minneapolis, or the Federal Reserve System.

1 Introduction
In the United States, financial institutions keep reserve balances at the Federal Reserve Banks
to meet requirements, earn interest, or clear financial transactions. The market for federal funds
is an interbank over-the-counter market for unsecured, mostly overnight loans of dollar reserves
held at Federal Reserve Banks. The fed funds rate is an average measure of the market interest
rate on these loans.
The fed funds market is primarily a mechanism that reallocates reserves among banks: it
allows institutions with excess reserve balances to lend reserves to institutions with reserve
deficiencies, and therefore helps participants manage reserves and offset liquidity or payment
shocks. The fed funds market is also the epicenter of monetary policy implementation, since
the Federal Open Market Committee (FOMC) periodically chooses a fed funds rate target and
implements monetary policy by instructing the trading desk at the Federal Reserve Bank of
New York to create conditions in reserve markets that will encourage fed funds to trade at
the target level. In this paper, we pry into the micro mechanics of trade in the market for
federal funds in order to understand the process of reallocation of liquidity among banks and
the determination of the market price for this liquidity provision—the fed funds rate.
We use minute-by-minute daily transaction-level payments data to provide a quantitative
analysis of the cross-sectional and time-series behavior of the estimated prices (fed funds rates)
and quantities (frequency and volume of trade, size distribution of loans) negotiated by commer-
cial banks in the fed funds market. Specifically, we study trade volume, the intraday dynamics
of the reserve balances held by commercial banks, the importance of the role of commercial
banks in the intermediation of funds, and the resulting fed funds rates.
The rest of the paper is organized as follows. Section 2 provides the necessary institutional
background. Section 3 describes the data. Section 4 focuses on the dynamics of the reserve
balances held by commercial banks. We find that the distribution of commercial banks’ reserve
balances follows a clear pattern of daily convergence during the last 2.5 hours of a typical
trading day during 2005-2008. We interpret this as evidence that commercial banks actively
trade fed funds in a way that achieves a reallocation of funds from institutions with excess
balances toward those in need of funds. This pattern of intraday dynamic convergence in
reserve balances is absent in 2009 and 2010.
Section 5 analyzes trade volume. Along the time-series dimension, we document that during
2

2005-2008, the annual dollar volume of funds traded in the last 2.5 hours of a typical fed funds
trading day was on the order of magnitude of two times annual U.S. GDP and that this volume
decreased by roughly half during 2009-2010. The extensive margin of trade volume measured by
the daily number of transactions between 16:00 and 18:30 exhibits a similar pattern: the high
average number of trades per bank was oscillating around 870 during 2005-2007 and dropped
to about 200 by the end of 2008. The average loan size was about $100 million during 2005-
2007 and increased to about $200 million during 2009-2010, indicating that the drop in overall
trade volume since 2008 was driven by a reduction in the frequency of trade. Along the cross-
sectional dimension, we find that trading activity across banks is very skewed: a few banks
trade most loans, while most banks participate in few trades. For example, the mean number
of transactions per bank during the last 2.5 hours of the trading day is typically above the
75th percentile throughout the sample. We document that other measures of the distribution
of trading activity across banks, such as the number of counterparties that a bank trades with,
the number of counterparties that a bank lends to, and the number of counterparties that a
bank borrows from, exhibit similar skewness. The size distribution of loans across banks is
also very skewed (albeit less so than the extensive margins). As for the intraday dynamics of
trading activity, the frequency of trade (measured by the number of transactions) and overall
dollar trade volume tend to decline over the last 90 minutes of the trading session. The pattern
for average transaction sizes is similar but milder, and the decline occurs during the last 60
minutes of the trading day.
Section 6 documents that some commercial banks, by purchasing funds earlier in the day
and reselling them later, play a critical role as de facto intermediaries in the fed funds market.
Funds intermediated by commercial banks accounted for about 40 percent of the dollar volume
traded between 16:00 and 18:30 during an average day during 2005, 2006, 2007, and 2010
(the figure is about 30 percent for 2009). Our estimates seem to confirm a striking aspect of
intermediation in this market, namely, that a significant number of loans are made by lenders
who, based on their balances at the time of the loan, appear to be in need of funds themselves.
We also find that, conversely, banks that appear to be looking to lend in fact borrow significant
amounts of reserves. The distribution of intermediation activity across banks is highly skewed,
with most banks not intermediating very much.1
1According to our estimates, the mean of the daily distribution of excess funds reallocation is typically wellabove the 90th percentile on most days, with 90 percent of commercial banks churning less than 14 percent ofthe funds they traded in the last 2.5 hours of the trading day, on average, during 2005-2008.
3

Section 7 focuses on the time-series and cross-sectional behavior of the distribution of fed
funds rates negotiated between pairs of fed funds participants. We find that the value-weighted
fed funds rate calculated from Fedwire payments data (see Section 2 for details) was very
close to the FOMC target during 2005-2006. The deviations from target appear larger and
more frequent during the financial turmoil of 2007-2008. Dispersion in the daily distribution
of fed funds rates increased significantly during the second half of 2007 and remained high by
historical standards through 2008. During 2005-2008, the dispersion in fed funds rates was
increasing during the last 2.5 hours of the trading session, but this pattern appears to have
been reversed during 2009-2010.
In Section 8 we document that throughout 2009-2010, the value-weighted fed funds rate
computed from Fedwire data has been consistently below 25 basis points and, moreover, that
a large proportion of all loans (typically more than 90 percent) often traded below 25 basis
points. These observations are puzzling because since late 2008, commercial banks can earn 25
risk-free basis points from the Federal Reserve simply by holding reserves overnight.2 Section
9 concludes.
Our paper contributes to the empirical literature that analyzes various aspects of trade
in the fed funds market, which includes Stigum (1990), Hamilton (1996), Meulendyke (1998),
Furfine (1999, 2000), Hamilton and Jorda (2002), Ashcraft and Duffie (2007), Bech and Atalay
(2008), Ashcraft et al. (2009), Bartolini et al. (2010), and Afonso et al. (2011), among others.
Although purely empirical, the data analysis in this paper is guided by theory: at each step we
have let our background model of the fed funds trade (Afonso and Lagos, 2014) dictate which
empirical relationships are critical to understanding trade dynamics in the fed funds market.
2 Institutional considerations
The market for federal funds is a market for unsecured loans of reserve balances at the Federal
Reserve Banks. These loans, commonly referred to as federal funds (or fed funds), are delivered
on the same day, and their duration is typically overnight.3 The interest rate on these loans is
2A similar observation, but for the effective fed funds rate published daily by the Federal Reserve Bank ofNew York, has been discussed by Hamilton (2008) and studied by Bech and Klee (2011).
3There is a term federal funds market where maturities range from a few days to more than a year, with mostloans having a maturity of no more than six months. The amount of term federal funds outstanding has beenestimated to be on the order of one-tenth to one-half of the amount of overnight loans traded on a given day(see Meulendyke, 1998, and Kuo et al., 2010).
4

known as the fed funds rate. Participants in the fed funds market include commercial banks,
thrift institutions, agencies and branches of foreign banks in the United States, government
securities dealers, government agencies such as federal or state governments, and government
sponsored enterprises (GSEs, e.g., Freddie Mac, Fannie Mae, and Federal Home Loan Banks).
The market for fed funds is a textbook example of an over-the-counter market: in order to trade,
a financial institution must first find a willing counterparty and then bilaterally negotiate the
size of the loan and the interest rate.
In practice, there are two ways of trading federal funds. Participants can contact each other
directly, or they can be matched by a fed funds broker. Nonbrokered transactions represent the
bulk of the volume of fed funds loans.4 Most fed funds loans are settled through Fedwire Funds
Services (Fedwire), a large-value real-time gross settlement system operated by the Federal
Reserve Banks. More than 7,000 Fedwire participants can borrow and lend (or buy and sell,
according to traditional terminology) in the fed funds market.
Fedwire operates 21.5 hours each business day, from 21:00 eastern standard time on the
preceding calendar day until 18:30. On a typical day, institutions receive the repayments
corresponding to the fed funds sold on the previous day before they send out the new loans. In
2006, the average value-weighted time of repayment was 15:09 ± 9 minutes, while the average
time of delivery was 16:30 ± 7 minutes. The average duration of a loan was 22 hours and 39
minutes.5
Fed funds activity is concentrated in the last two hours of the operating day. For a typical
bank until midafternoon, Fedwire transactions reflect its primary business activities. Later in
the day, the trading and payment activity is orchestrated by the fed funds trading desk and
aimed at achieving a target reserve balance. In 2008, more than 75 percent of the value of fed
funds traded among banks was traded after 16:00.6
The motives for trading federal funds vary across participants and their specific circum-
stances on any given day, but there are two main reasons in general. First, some institutions
such as commercial banks use the fed funds market to offset the effects on their reserve bal-
4Ashcraft and Duffie (2007) report that nonbrokered transactions represented 73 percent of the volume offederal funds traded in 2005. Fed funds brokers do not take positions themselves; they act only as matchmakers,bringing buyers and sellers together.
5This is documented in Bech and Atalay (2008).6In line with this observation, Bartolini et al. (2010) report very high fed funds loan activity during the latter
part of the trading session. See also the illustrations of intraday loan networks for each half hour in a tradingday in Figure 6 of Bech and Atalay (2008).
5

ances of transactions (initiated either by their clients or by profit centers within the banks
themselves) that would otherwise leave them with a reserve position that does not meet Fed-
eral Reserve regulations.7 Also, some participants regard fed funds as an investment vehicle,
an interest-yielding asset that can be used to “deposit” large balances overnight.
3 Data
Data for this study are constructed from a proprietary transactions-level data set that contains
all transfers made through Fedwire. A Fedwire transaction is executed with an electronic
request made by a financial institution (sent to the Federal Reserve Banks via Fedwire) to
debit its reserve account by a stipulated amount in favor of the account of another institution.
Such a transaction may occur for many reasons (e.g., to settle an asset purchase), so not all
Fedwire transactions are associated with fed funds loans. In order to identify the likely fed funds
transactions from the universe of Fedwire transactions, we use an algorithm supplied by the
Money and Payments Studies Function at the Federal Reserve Bank of New York, similar to the
algorithm proposed by Furfine (1999).8 The algorithm can be summarized as follows. First,
Fedwire transactions involving settlement institutions are screened out.9 Second, overnight
loans are identified as those transactions between a pair of counterparties i and j that involve
a Fedwire send from i to j in denominations equal to or greater than $1 million and ending
in five zeros, which can be matched to a send from j to i on the following business day for an
amount that is higher than the original send by an amount that could represent plausible fed
funds interest. The difference between the two payments is interpreted as the interest rate on
the loan.10 Third, the set of potential fed funds loans is refined further by limiting the range
of “plausible” fed funds rates: only those transactions with implied rates no lower than the
lowest brokered fed funds rate minus 50 basis points, and no larger than the highest brokered
7Fed funds borrowings are exempt from reserve requirements.8Fed funds transactions cannot be observed directly because the field that specifies the reason for the Fedwire
payment is coded voluntarily by the sender and typically left unspecified. For this reason, Afonso et al. (2011),Ashcraft and Bleakley (2006), Ashcraft and Duffie (2007), Bech and Atalay (2008), Bartolini et al. (2010), andFurfine (2001, 2002), among others, all use essentially the same algorithm to identify fed funds transactions fromFedwire data. A detailed description of the algorithm can be found in Furfine (1999) or Afonso et al. (2011).
9Examples of such settlement institutions are the Depository Trust Company (a securities settlement system)or the Clearing House Interbank Payments System (a private large-value U.S. dollar payment system).
10For example, consider a $100 million loan sent from bank i to bank j on Tuesday, matched to a $100.02 millionsend from bank j to bank i on the following Wednesday. Since 100.02/100 = 1 + 0.072/360, this transaction isinterpreted as a $100 million overnight loan from i to j with a 7.2 percent (annualized) interest rate.
6

fed funds rate plus 50 basis points, are kept as plausible fed funds transactions.11 Fourth, if
multiple repayments could match one outgoing payment, the median rate is identified as the
rate on the loan. Finally, candidate eurodollar loans are identified and eliminated.12
In this paper, whenever we refer to any aspect of fed funds transactions, we are actually
referring to the subset of Fedwire transactions that were identified as fed funds loans by the
algorithm described above. Despite its widespread use and general appeal, the algorithm may
keep transactions that are not fed funds trades or may discard transactions that are fed funds
trades. Transactions identified as overnight fed funds loans by the algorithm may include other
kinds of overnight loans settled over Fedwire, such as eurodollar, tri-party repos, correspondent
lending, and term fed funds, among others. Fed funds loans with unusually high or low rates
relative to the daily effective brokered rates and loans not settled through Fedwire may be
missed by the algorithm. The algorithm will miss loans between correspondent banks and their
client banks. It may also misidentify counterparties. For example, an overnight loan made by
some firm A who is a client of bank i, to a firm B who is a client of bank j, could be misclassified
as a fed funds loan from bank i to bank j. Identifying which loans are brokered is not possible
with Fedwire data.13
Subject to these caveats, the data set we study includes information on the amount of the
loan, implicit interest rate, date, time of delivery and time of return, as well as the identity of
the borrower and lender for every transaction executed over Fedwire. The borrower and lender
are identified at the lead American Banking Association level, which corresponds to a unique
identifier assigned to institutions by the Federal Reserve. The fed funds data are aggregated
at the bank holding company level, dropping transactions between entities of the same bank
holding company. Unless otherwise specified, we restrict our sample to transactions in which
at least one of the institutions is a commercial bank and specialize the analysis to transactions
11The brokered data are from a daily survey of the four largest fed funds brokers published by the MarketsGroup of the Federal Reserve Bank of New York.
12Eurodollar loans are identified by using as a proxy the customer code that a sending bank enters on thepayment message indicating that the payment is made on behalf of a customer. McAndrews (2009) tests thepredictive power of the costumer code as a proxy for a Eurodollar loan by matching brokered trades provided byBGC Brokers with Fedwire settlement data. By using the absence of a customer code as a proxy for fed funds,the probability of correctly identifying fed funds loans is 89 percent, with an 11 percent chance of countingeurodollars as fed funds (Type I error) and a 4 percent chance of incorrectly excluding fed funds (Type II error).
13The Federal Reserve Bank of New York is currently concerned about the accuracy of the Furfine estimates;efforts to assess the size of the Type I and Type II errors resulting from the application of this algorithm arecurrently under way.
7

that occur in the last 2.5 hours of the Fedwire business day, between 16:00 and 18:30.14
In addition to Fedwire data, we use an independent data set available to the Federal Reserve
Bank of New York, which documents the reserve balance of each account at the end of every
minute during every daily Fedwire trading session in our sample. These balances are aggregated
across all accounts for each institution to construct each institution’s real-time account balance
for each of the last 150 minutes of every business day in our sample.
Our sample covers the period 2005-2010, so we are able to document the salient features of
the fed funds market during “normal times” (roughly 2005-2007), as well as during 2008-2010,
when the performance of the market reflects the effects of the Federal Reserve responses to
the financial crisis. Of particular importance is the Emergency Economic Stabilization Act of
2008, which allowed the Treasury to establish the Troubled Asset Relief Program (TARP) and
authorized the Federal Reserve to begin paying interest on reserve balances held by or on behalf
of depository institutions.15
4 Reserve balances
Let ahsty denote the reserve balance held by bank h ∈ H at time s ∈ S on trading day t ∈ Ty of
year y, where H is the set of banks in the sample, Ty = {1, ..., Ty} the set of trading days in year
y, and S = {16:00,16:05,16:10,...,18:30} is a set of times of day. Let fhty denote the total amount
of reserves recorded as sent over Fedwire by bank h on trading day t of year y. Let fhy be the
average for year y of the total daily amount of reserves sent by bank h, i.e., fhy = 1
Ty
∑Ty
t=1fhty,
where Ty is the number of trading days in year y.16 Define the normalized (reserve) balance of
bank h at time s, on trading day t of year y, as
ahsty =ahstyfhy
.
14Fed funds activity is concentrated in the last two hours of the operating day, e.g., in 2008 more than 75percent of the value of fed funds traded among banks was traded after 4:00 p.m. For this reason, it is standard tofocus on the last segment of the trading session. Ashcraft and Duffie (2007), for example, restrict their empiricalanalysis to the last 1.5 hours of the business day.
15With this authority, the Federal Reserve Board approved a rule to amend its Regulation D (Reserve Require-ments of Depository Institutions) to direct the Federal Reserve Banks to pay interest both on required reservebalances and on excess reserve balances. The Financial Services Regulatory Relief Act of 2006 had originallyauthorized the Federal Reserve to begin paying interest on reserves held by or on behalf of depository institutionsbeginning October 1, 2011. The Emergency Economic Stabilization Act of 2008 accelerated the effective date toOctober 1, 2008. The Federal Reserve began paying interest on reserves on October 9, 2008.
16By “total daily amount of reserves sent,” we mean over the whole trading day, not just the last 2.5 hours.Also, notice that fh
th includes all Fedwire sends, not just fed funds.
8

−.5
0
.5
1
16:00 16:30 17:00 17:30 18:00 18:30
10th/90th Percentiles 25th/75th Percentiles
Median Mean
Normalized Balances, 2007
Figure 1: Intraday dynamics of the distribution of normalized reserve balances among commer-cial banks during 2007
This normalization controls for bank size.17
The fed funds market is primarily a mechanism that reallocates dollar funds (in the form
of reserve balances at Federal Reserve Banks) among financial institutions. Figure 1 illustrates
this view succinctly. Figure 1 shows 31 box plots (each corresponding to a given time of day)
of the normalized balances, ahsty, at five-minute intervals from 16:00 until 18:30, throughout
the year 2007. Specifically, each box plot shows, for a given time of day s ∈ S and year y,
the distribution of observations, {ahsty}h∈H,t∈Ty . By pooling all trading days in the year, Figure
1 provides a picture of the intraday dynamics of the distribution of reserve balances among
commercial banks. From this figure emerges a clear pattern of daily convergence of normalized
balances during the last 2.5 hours of the trading session.18 Relatively early in the trading
session (e.g., from 16:00 until about 17:30), only about 75 percent of banks are holding positive
balances, while 90 percent or more are holding positive balances after 17:30. The 90th and the
10th percentiles of the distribution of normalized balances decrease and increase, respectively,
throughout the last 2.5 hours of the trading session. Figure 1 illustrates the fed funds market
17This is the same normalization used by Ashcraft and Duffie (2007) and Ashcraft et al. (2009).18This dynamic intraday pattern is consistent with the findings reported by Ashcraft and Duffie (2007) who
construct a similar plot for the 100 largest commercial banks (ranked monthly by the total dollar volume sentover Fedwire) during 2005.
9
at work: commercial banks actively trade fed funds in a way that achieves a reallocation of
funds from institutions with excess balances toward those in need of funds.
Figure 17 shows the intraday dynamics of the distribution of normalized balances for each
year in our sample period 2005-2010. The pattern of daily convergence of normalized balances
during the last 2.5 hours of the trading session is evident in the panels corresponding to 2005-
2008. Interestingly, this distinctive pattern of intraday dynamic convergence in reserve balances
changes drastically in 2009 and 2010. At least 90 percent of all banks hold positive balances
throughout the last 2.5 hours of the trading session during 2009-2010. Moreover, the distribution
of normalized balances is essentially constant throughout the session (notice that the mean and
the 90th, 75th, 50th, and 10th percentiles barely move). This is the micro-level manifestation
of the large levels of excess reserves held by the banking sector since the third quarter of 2008.19
Each panel in Figure 17 illustrates the evolution of the distribution of reserve balances for
a “synthetic day” corresponding to each of the six years in our sample. To get a sense of how
representative these synthetic days are, we generated the intraday box plots for actual trading
days drawn at random from each year in our sample and typically found the same patterns
that we emphasized when discussing Figure 17. Figure 18 shows six of these random days:
3/29/2005, 10/4/2006, 4/26/2007, 8/7/2008, 9/2/2009, 2/10/2010.
Because the box plots in Figure 17 pool together different trading days in a year, the pure
time-series dimension is somewhat muddled in Figure 17. To provide a clearer time-series
perspective, we turn to Figure 2. The left panel displays the 90th percentile of the distribution
of normalized balances across banks at two times of day, 16:15 and 18:15, for every trading day
in 2005-2010. The right panel plots the 10th percentile at 16:15 and 18:15. During 2005-2008,
it is clear that the 90th percentile at 16:15 is larger than at 18:15, while the 10th percentile at
16:15 is smaller than at 18:15. Hence, the 90-10 measure of dispersion of the cross-sectional
distribution of normalized balances was larger at 16:15 than at 18:15 in every trading session
during 2005-2008. This regularity disappears during 2008. Note how the 10th percentile was
consistently negative through 2008, but tends to remain nonnegative during 2010 and part of
2009. All this is consistent with the picture that emerged from Figure 17.
To conclude the analysis of the intraday dynamics of the distribution of balances, Figure 3
19Recall that two important policy actions were taken during that period: the Federal Reserve began payinginterest on reserve balances held by depository institutions and introduced new liquidity facilities (e.g., the TermAuction Facility, Primary Dealer Credit Facility, Term Securities Lending Facility) and asset purchase programs(e.g., the Troubled Asset Relief Program) that injected large amounts of reserves into the banking system.
10

0
5
10
15
2005 2006 2007 2008 2009 2010
90th Percentile, 16:15 90th Percentile, 18:15
Intraday 90th Percentile of Normalized Balances (over time)
−.6
−.4
−.2
0
.2
2005 2006 2007 2008 2009 2010
10th Percentile, 16:15 10th Percentile, 18:15
Intraday 10th Percentile of Normalized Balances (over time)
Figure 2: Daily time series of summary statistics of the distribution of normalized balancesacross banks (at 16:15 and at 18:15)
displays the standard deviation of the distribution of normalized balances across banks at three
times of day, 16:15, 17:15, and 18:15, for every trading session in 2005-2010. As is clear from
the first part of the sample (2005 through the third quarter of 2008), the standard deviation of
normalized balances is larger at 16:15 than at 17:15 and larger at 17:15 than at 18:15 virtually
every day. This clear ordering is no longer discernible in the last part of the sample. Again, this
figure confirms the conclusions drawn from Figure 17: for the period 2005-2008, on a typical
day, the dispersion in the distribution of normalized balances shrinks during the last 2.5 hours
as the trading session progresses, while for the period 2009-2010, there is not much variation
in this dispersion over the last 2.5 hours of the typical trading session. To conclude, it is worth
pointing out that the magnitude of the standard deviation of normalized balances at a given
time of day is dramatically larger during 2009-20010 than during 2005-2008. That is, even
though most institutions tend to hold large positive normalized balances during 2009-2010, the
dispersion in these balances is roughly more than seven times what it was in the 2005-2008
period. (Notice the size of the vertical scale in the first two panels of Figure 17 compared with
the last two panels.)
5 Trade volume
In this section we document the time-series and cross-sectional behavior of the volume of trade
in the fed funds market. Figure 4 shows the daily volume of trade in our sample during 2005-
11

0
2
4
6
8
10
2005 2006 2007 2008 2009 2010
Standard deviation at 16:15 Standard deviation at 17:15Standard deviation at 18:15
Standard Deviation of Normalized Balances
Figure 3: Daily time series of the standard deviation of normalized balances (at 16:15, 17:15,and 18:15)
2010, i.e., the dollar amount of all fed funds traded by commercial banks daily, between 16:00
and 18:30. (The horizontal lines indicate the yearly means.) The volume traded by commercial
banks in the last 2.5 hours of the trading session on a typical day was hovering around 89
billion in 2005, 100 billion in 2006, and 117 billion in 2007. Trade volume in the fed funds
market is large: even restricting the sample as we do, to transactions involving only commercial
banks between 16:00 and 18:30, the annual volume of funds traded during normal times (e.g.,
2005-2007) is on the order of magnitude of two times annual GDP in the United States. Figure
4 shows that daily trade volume in our sample begins to drop in 2008 and was around 53 billion
in 2009, and 40 billion in 2010. The reduction in trade volume begins roughly at the time the
Federal Reserve began paying interest on reserves and coincides with the onset of the buildup
of excess reserves in the commercial banking sector.
5.1 Extensive margin
Figure 5 shows the time-series behavior of the extensive margin of trade volume, i.e., the daily
number of transactions that took place between 16:00 and 18:30 for the period 2005-2010 and
for which either the borrower or the lender was a commercial bank. (The horizontal lines
indicate the yearly means.) The overall pattern is similar to that of Figure 4: trading activity
12

0
50
100
150
200
Bill
ions
of D
olla
rs
2005 2006 2007 2008 2009 2010
Daily Amount of Federal Funds Loans
Figure 4: Daily trade volume
is high during 2005-2007, with an average number of trades oscillating above 860, and drops by
the end of 2008 to about 240 during 2009.20
To get a sense of how the total number of transactions plotted in Figure 5 is distributed
across banks, Figure 6 plots the mean, and the 75th, 50th, and 25th percentiles of the daily
(between 16:00 and 18:30) distribution of transactions across banks. On average, a bank traded
5.01 loans in 2009, 5.72 loans in 2010, and slightly more than 6 loans during 2005-2008 (6.16
in 2005, 6.29 in 2006, 6.55 in 2007, and 6.35 in 2008). The median number of loans has been
quite stable and roughly equal to 2 throughout. The fact that the mean is typically above the
75th percentile indicates that the distribution of transactions is very skewed on any given day:
a few banks trade (make or receive) most loans, while most banks participate in few trades.
Figure 19 conveys information similar to Figure 6. The difference is that Figure 19 measures
the extensive margin of trading activity in terms of the number of counterparties (instead of the
number of transactions used in Figure 6). The left panel plots the mean, and the 75th, 50th,
and 25th percentiles of the daily (between 16:00 and 18:30) distribution of counterparties per
bank. On average, a bank traded with about 4.5 counterparties during 2005-2008 and a bit more
20The mean daily number of transactions between 16:00 and 18:30 was 862.67 in 2005, 878.37 in 2006, 905.14in 2007, 739.79 in 2008, 244.72 in 2009, and 196.95 in 2010.
13

0
500
1,000
Num
ber
of L
oans
2005 2006 2007 2008 2009 2010
Daily Number of Federal Funds Loans
Figure 5: Daily number of loans
than 3 in 2009-2010.21 The median number of counterparties has been quite stable and roughly
equal to 2 throughout. The fact that the mean tends to be very close to the 75th percentile
indicates that the distribution of counterparties is very skewed on any given day: a few banks
have many counterparties, while most banks have only a few. A comparison of Figure 6 with
the left panel of Figure 19 reveals that some banks trade with the same counterparty multiple
times in the same day. For example, during a typical day in 2007, the average bank traded 6.55
times but had an average number of 4.59 counterparties. The middle panel plots the mean,
and the 75th, 50th, and 25th percentiles of the daily (between 16:00 and 18:30) distribution
of the number of counterparties that a bank lends to. A bank lent to an average of about 3
banks during 2005-2008 and about 2.5 during 2009-2010.22 This distribution is considerably
skewed, with a few banks lending to many institutions and most banks lending to a few. The
right panel plots the mean, and the 75th, 50th, and 25th percentiles of the daily (between 16:00
and 18:30) distribution of the number of counterparties that a bank borrows from. A bank
borrowed from an average of about 7 banks during 2005-2008 and about 4 during 2009-2010.23
21The exact average numbers of counterparties for each year 2005-2010, are 4.24, 4.39, 4.59, 4.34, 3.24, and3.11, respectively.
22The exact average numbers of counterparties that a bank lends to, for each year 2005-2010, are 2.8, 2.91,3.03, 3.11, 2.61, and 2.31, respectively.
23The exact average numbers of counterparties that a bank borrows from, for each year 2005-2010, are 6.57,
14

0
2
4
6
8
Dai
ly N
umbe
r of
Loa
ns
2005 2006 2007 2008 2009 2010
25th Percentile Median75th Percentile Mean
Distribution of Daily Number of Loans
Figure 6: Summary statistics of the daily distribution of transactions across banks
This distribution is also considerably skewed: a few banks borrow from many institutions and
most banks borrow from a few institutions. The mean in the right panel is higher than in the
middle panel, indicating that on average, the typical bank tends to borrow from more banks
than it lends to.24
5.2 Intensive margin
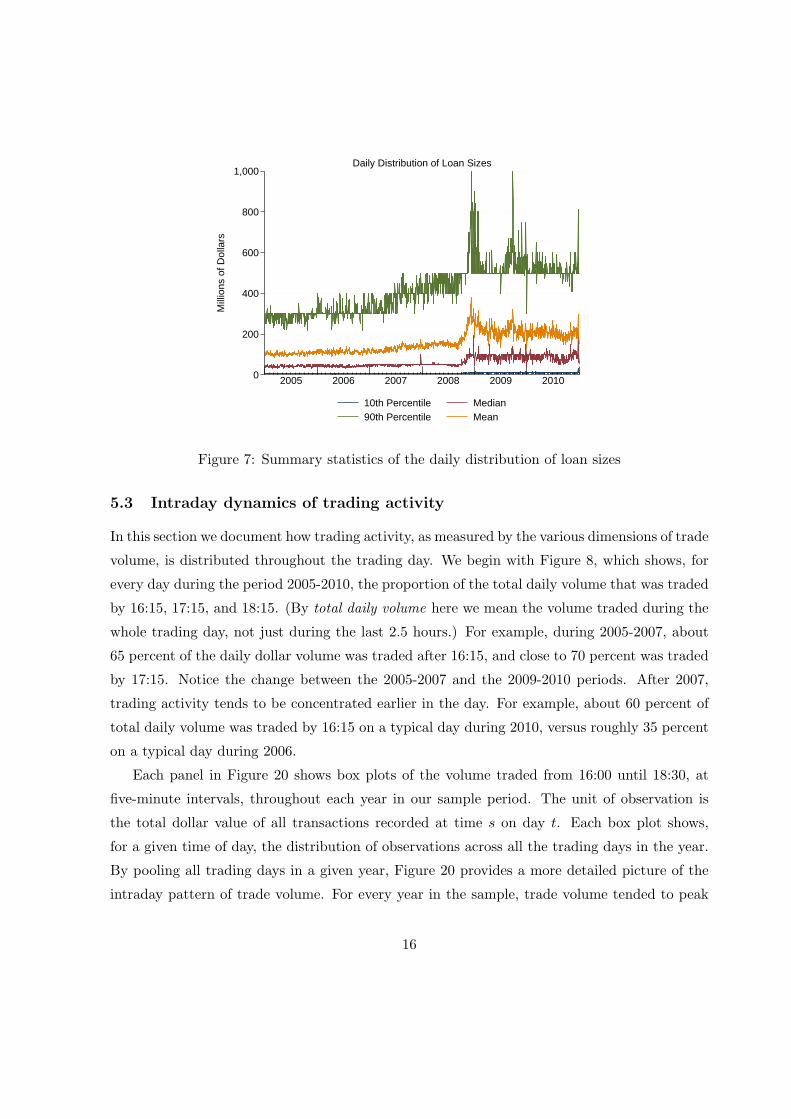
Figure 7 shows the time-series behavior of the mean, and the 75th, 50th, and 25th percentiles
of the daily (between 16:00 and 18:30) distribution of loan sizes. The average loan size was
about 100 million during 2005-2007 and increased to about 200 million during 2009-2010.25
The size distribution of loans is skewed (albeit less so than those of the extensive margins),
and the dispersion in trade sizes, e.g., as measured by the 90-10 percentile ratio, is very large.
Taken together, Figure 5 and Figure 7 reveal that the reduction in trade volume documented
in Figure 4 was driven mainly by a reduction in the frequency of trade, rather than in trade
sizes (in fact, trade sizes tended to be larger during 2009-2010 than during 2005-2008).
6.65, 7.02, 5.59, 3.54, and 3.74, respectively.24This observation is consistent with the conventional wisdom that many small banks mostly sell fed funds to
a few big banks; see e.g., Stigum (1990).25The exact figures for 2005-2010 are 104, 113, 130, 171, 218, and 203 million, respectively.
15
0
200
400
600
800
1,000
Mill
ions
of D
olla
rs
2005 2006 2007 2008 2009 2010
10th Percentile Median90th Percentile Mean
Daily Distribution of Loan Sizes
Figure 7: Summary statistics of the daily distribution of loan sizes
5.3 Intraday dynamics of trading activity
In this section we document how trading activity, as measured by the various dimensions of trade
volume, is distributed throughout the trading day. We begin with Figure 8, which shows, for
every day during the period 2005-2010, the proportion of the total daily volume that was traded
by 16:15, 17:15, and 18:15. (By total daily volume here we mean the volume traded during the
whole trading day, not just during the last 2.5 hours.) For example, during 2005-2007, about
65 percent of the daily dollar volume was traded after 16:15, and close to 70 percent was traded
by 17:15. Notice the change between the 2005-2007 and the 2009-2010 periods. After 2007,
trading activity tends to be concentrated earlier in the day. For example, about 60 percent of
total daily volume was traded by 16:15 on a typical day during 2010, versus roughly 35 percent
on a typical day during 2006.
Each panel in Figure 20 shows box plots of the volume traded from 16:00 until 18:30, at
five-minute intervals, throughout each year in our sample period. The unit of observation is
the total dollar value of all transactions recorded at time s on day t. Each box plot shows,
for a given time of day, the distribution of observations across all the trading days in the year.
By pooling all trading days in a given year, Figure 20 provides a more detailed picture of the
intraday pattern of trade volume. For every year in the sample, trade volume tended to peak
16

0
.2
.4
.6
.8
1
2005 2006 2007 2008 2009 2010
Loans by 16:15 Loans by 17:15Loans by 18:15
Proportion of Total Daily Amount of Loans by Time−of−Day
Figure 8: Intraday cumulative trade volume
between 17:00 and 17:30.
Next, we document the intraday pattern of the extensive (trade frequency) and intensive
margin (trade sizes) of trade volume. We begin with the extensive margin. Figure 9 displays the
proportion of the total daily number of loans traded by all commercial banks by 16:15, 17:15,
and 18:15.26 During 2005-2007, a bit more than 60 percent of the total daily number of loans
was traded after 16:15, and about 75 percent was traded by 17:15. The change in the intraday
trading pattern observed between the 2005-2007 and 2009-2010 periods is similar to the one
displayed in Figure 8. In the period 2009-2010, trading activity tends to be concentrated earlier
in the day. For example, about 60 percent of all daily trades were recorded by 16:15 on a typical
day during 2010, versus roughly 35 percent on a typical day during 2006. A comparison with
Figure 8 also reveals that throughout the whole sample, there tends to be a concentration of
larger loans toward the end of the day. For example, in 2007 about 75 percent of all daily loans
were traded by 17:15, but these loans accounted for only about 60 percent of the total dollar
volume traded during the day.27
26As in Figure 8, here the total daily number of loans is based on all trades throughout the whole trading day,not just during the last 2.5 hours.
27This pattern is consistent with the general pattern of the timing of Fedwire payments documented in Ar-mantier et al. (2008).
17

0
.2
.4
.6
.8
1
2005 2006 2007 2008 2009 2010
Loans by 16:15 Loans by 17:15Loans by 18:15
Proportion of Total Number of Loans by Time−of−Day
Figure 9: Intraday cumulative number of loans
Figure 21 provides year-by-year information about how trading activity (as measured by the
number of loans) tends to be distributed over the last 2.5 hours of the trading day (this figure
is the extensive-margin analogue of Figure 20). Each panel in Figure 21 shows box plots of the
total number of loans traded daily from 16:00 until 18:30, at five-minute intervals, throughout
each year in our sample period. The unit of observation is the total number of transactions
recorded on day t at time of day s. Each box plot shows, for a given time of day, the distribution
of observations across all the trading days in the year. Except possibly for 2010, for every year
in the sample the number of trades tended to peak roughly between 17:00 and 17:30, as was
the case for trade volume in dollars (Figure 20).
Each panel in Figure 22 displays 31 one box plots, one every five minutes from 16:00 until
18:30, of the recorded trade sizes at a given time of day throughout each year in our sample
period. The unit of observation is the individual size of each loan at time s on day t. Each box
plot shows the distribution of observations across all days of the year for a given time. In other
words, each box plot shows the size distribution of all trades that took place throughout the
year at a given time of day s. During 2008-2010, the average transaction size declines mildly
over the last hour of the trading day and also peaks between 17:00 and 17:30. This pattern is
less evident during 2005-2007 (the decline in average transaction size occurs only after 18:00,
18

and when it exists, the peak between 17:00 and 17:30 is less pronounced).
6 Intermediation
The fed funds market reallocates reserves among financial institutions. How is this reallocation
actually achieved? In practice, it can occur in two ways. A pair of participants can contact
each other directly, or they can be matched by a fed funds broker. Nonbrokered transactions
represent the bulk of the volume of fed funds loans.28 In this section we investigate the extent
to which commercial banks, by purchasing funds earlier in the day and reselling later, act as
de facto intermediaries in the fed funds market.
Let Opit denote the cumulative dollar amount of fed funds purchases by bank i on trading day
t, between 16:00 and 18:30. Similarly, let Osit denote the cumulative dollar amount of fed funds
sold by bank i on day t (also between 16:00 and 18:30). Then define Xit = Opit+Os
it−|Opit−Os
it|andXt =
∑iXit. This is the measure of excess funds reallocation proposed in Afonso and Lagos
(2014). It quantifies the daily amount of funds traded in excess of what would be required to
accommodate each commercial bank’s net change in balance between 16:00 and 18:30. The
left panel of Figure 10 shows the daily time series of marketwide excess funds reallocation, i.e.,
{Xt}. The dollar volume of funds churned by commercial banks during the last 2.5 hours of
the trading session was 54 billion in 2005, 57 billion in 2006, even larger in 2007 and 2008 (78
and 68 billion, respectively), and dropped to 24 billion in 2009 and 21 billion in 2010.
The right panel of Figure 10 shows the proportion of intermediated funds in the aggregate
daily volume of traded funds, i.e., it plots the daily time series {ιt}, where ιt = Xt/∑
i(Opit+Os
it).
The proportion of funds intermediated by commercial banks in the last 2.5 hours of the trading
session has been relatively stable at about 40 percent throughout 2005-2010 (there was a slight
increase to 45 percent in 2007 and a slight reduction to about 32 percent in 2009).29
Figure 10 documents the prevalence of intermediation activities of the consolidated com-
mercial banking sector in the market for fed funds. To get a sense of how this intermediation
activity is distributed across institutions, in Figure 11 we plot the daily time series of some
key summary statistics of the distribution of intermediation activity across commercial banks.
The left panel of Figure 11 plots the mean, the median, and the 10th and 90th percentiles of
28Ashcraft and Duffie (2007), for instance, report that nonbrokered transactions represented 73 percent of thevolume of fed funds traded in 2005.
29The exact figures for 2005-2010 are 0.41, 0.40, 0.45, 0.39, 0.32, and 0.40, respectively.
19

0
50
100
150
Bill
ions
of D
olla
rs
2005 2006 2007 2008 2009 2010
Excess Funds Reallocation
0
.1
.2
.3
.4
.5
.6
2005 2006 2007 2008 2009 2010
Proportion of Intermediated Funds
Figure 10: Measures of intermediation (daily)
the daily distribution of excess funds reallocation across banks. The distribution is extremely
skewed (the mean is well above the 90th percentile). The right panel plots the mean, the
median, and the 10th and 90th percentiles of the daily distribution of the proportion of inter-
mediated funds across banks. This distribution is also very skewed. The median is 0 and the
mean is about 0.05, i.e., the average commercial bank churns about 5 percent of the fed funds
it trades between 16:00 and 18:30. The 90th percentile of this distribution varies quite a bit
from day to day. On average, during 2005-2008, 90 percent of commercial banks churned less
than 15 percent of the funds they traded in the last 2.5 hours of the trading day.30
In the remainder of this section, we document a striking aspect of intermediation in this
market, namely, that a significant number of loans are made by lenders who, based on their
balances at the time of the loan, appear to be themselves, in need of funds.31 In addition, we
find that banks that appear to be looking to lend (based on their balances at the time of the
transaction) in fact sometimes borrow significant amounts of reserves. To this end, as in Section
4, let ahsty denote the reserve balance held by bank h at time s on trading day t of year y. Also
30The 90th percentile of the distribution of the proportion of intermediated funds during 2005-2010 was 0.14,0.11, 0.09, 0.14, 0.18, and 0.48, respectively.
31This fact was also pointed out by Ashcraft and Duffie (2007), who report: “A significant number of loansin our data are made by lenders in the lower deciles by relative balances. Many of these lenders are presumablythemselves in relative need of funds but agree to lend at a sufficiently high rate, planning to borrow later inthe day at a lower rate. In any OTC market, the borrower does not generally know the most attractive ratesavailable from other counterparties, or which counterparties are offering them, and may have an incentive toaccept the rate offered by such a lender.” See Afonso and Lagos (2014) for a theory of trade in the fed fundsmarket in which these types of loans arise naturally in equilibrium.
20

0
200
400
600
800
Mill
ions
of D
olla
rs
2005 2006 2007 2008 2009 2010
10th Percentile Median90th Percentile Mean
Daily Distribution of Excess Funds Reallocation
0
.2
.4
.6
.8
2005 2006 2007 2008 2009 2010
10th Percentile Median90th Percentile Mean
Daily Distribution of Proportion of Intermediated Funds
Figure 11: Daily time series of summary statistics of the distribution of intermediation activityacross banks
let fhty denote the amount of reserves recorded as sent over Fedwire by bank h on trading day
t of year y, and let fhy be the average for year y of the total daily amount of reserves sent by
bank h, i.e., fhy = 1
Ty
∑Ty
t=1fhty, where Ty is the number of trading days in year y.32 For given
h, s, and y, let ahsy denote the median of{ahsty
}Ty
t=1, i.e., the median daily reserve balance held
by bank h at time of day s during year y. Define the adjusted (reserve) balance of bank h at
time s on trading day t of year y, as
ahsty =ahsty − ahsy
fhy
.
We follow Ashcraft and Duffie (2007) and interpret a bank h with ahsty < 0 as being short of
funds, in the sense that bank h’s reserve balance at time s on day t of year y is lower than it
normally is at that time. Similarly, we interpret a bank with ahsty > 0 as being long of funds.
For a given year y, consider the sample of adjusted balances,{ahsty
}h∈H,s∈S,t∈Ty
, where His the set of banks in the sample, Ty = {1, ..., Ty} is the set of trading days in year y, and
S = {16:00,16:05,16:10,...,18:30} is a set of times of day we will consider. For each time of day
s ∈ S, we have a subsample{ahsty
}h∈H,t∈Ty
. Create a subsample{ahsty
}h∈H−
s ,t∈Ty, where H−
s
denotes the subset of banks whose adjusted balances at time s are negative. Let H−s10 denote
the 10 percent of banks in H−s whose adjusted balances are most negative, and construct the
32By “total daily amount of reserves sent” we mean over the whole trading day, not just the last 2.5 hours ofthe trading session. Also, notice that fh
th includes all Fedwire sends, not just fed funds.
21

subsample{ahsty
}h∈H−
s10,t∈Ty. Let H−
s10 denote the subset of banks in H−s10 who lend at time
s, and construct the subsample{ahsty
}h∈H−
s10,t∈Ty. For each year in our sample, each panel in
Figure 23 shows 31 box plots (each corresponding to a given time of day in S) of the dollar
value of the fed funds sales by banks in H−s10. Specifically, let lhsty denote the size of the loan
extended by bank h at time s on day t of year y. Then each box plot shows, for a given time s
and year y, the distribution of observations, lhsty, for all (h, t) ∈ H−s10 ×Ty. The striking finding
is that during normal times (e.g., 2005-2007), even those banks that are most short of funds
routinely sell funds.
Similarly, let H+s be the subset of banks h whose adjusted balances at time s are nonnegative,
let H+s90 denote the 10 percent of banks in H+
s whose adjusted balances are largest, and let H+s90
be the subset of banks in H+s90 that borrow at time s. For each year in our sample period, each
panel in Figure 24 shows 31 box plots (each corresponding to a given time of day in S) of thedollar value of the fed funds sales by banks in H+
s90. Let bhsty denote the amount of reserves
borrowed by bank h at time s on day t of year y. Then each box plot in Figure 24 shows, for
a given time s and year y, the distribution of observations, bhsty, for all (h, t) ∈ H+s90 × Ty. The
striking finding is that during normal times (e.g., 2005-2007), even those banks that are most
long of funds routinely buy funds.
7 Fed funds rates
There is no such thing as the fed funds rate. Rather, in any small interval of time during a fed
funds trading session, there is a distribution of fed funds rates being agreed upon in bilateral
transactions between borrowers and lenders. In this section we document both the time-series
and the cross sectional behavior of these bilateral rates.
The left panel of Figure 12 plots the daily average value-weighted fed funds rate calculated
from Fedwire data, and the FOMC target for 2005-2010.33 The value-weighted fed funds rate
was very close to the FOMC target during 2005-2006. The deviations from target appear
larger and more common during the financial turmoil of 2007-2008. In order to illustrate the
heterogeneity of rates within a trading day, the right panel of Figure 12 plots the 90th and
10th percentiles of the daily distribution of fed funds rates for 2005-2010, also against the
background of the FOMC target. Even in normal times there tends to be significant dispersion
33The fed funds rates used in this section were constructed using all fed funds loans, i.e., for transactionsexecuted at any time of day, and between any pair of institutions, even if neither is a commercial bank.
22

0
2
4
6
Per
cent
2005 2006 2007 2008 2009 2010
FOMC Target Fed Funds Rate
Daily Fed Funds Rate and FOMC Target
0
2
4
6
Per
cent
2005 2006 2007 2008 2009 2010
FOMC Target 90th Percentile of Fed Funds Rate10th Percentile of Fed Funds Rate
Daily Dispersion of Fed Funds Rate
Figure 12: FOMC target and summary statistics of the daily distribution of fed funds rates (onall loans)
in the distribution of rates agreed upon on a given day. This dispersion increased significantly
during the second half of 2007 through 2008.
To offer another view on the volatility of the fed funds rate, let ρt denote the value-weighted
fed funds rate (average for day t). Let ρmaxt be the upper bound for the FOMC policy target
band for day t, and let ρmint be the lower bound of the band. Define the deviation from target
on day t, denoted Dt, as
Dt =
ρt − ρmax
t if ρmaxt < ρt
0 if ρmint ≤ ρt ≤ ρmax
t
ρt − ρmint if ρt < ρmin
t .
The left panel of Figure 13 plots the daily value of Dt, i.e., the deviations between the value-
weighted daily fed funds rate and the FOMC target, for 2005-2010. This panel suggests that
hitting the policy target may have become more challenging during the period of financial
turmoil that began in 2007. The value-weighted average measure of the fed funds rate reported
in the left panel is obtained from our transactions data. In order to give a sense of how the value-
weighted fed funds rate we constructed compares with the actual policy target (the effective
fed funds rate published by the Federal Reserve Bank of New York), the daily spread between
these two rates for 2005-2010 is reported in the right panel of Figure 13.34 Both rates tend to
34The effective federal funds rate is a volume-weighted average of rates on trades arranged by major brokers.The Federal Reserve Bank of New York receives summary reports from the brokers and every morning publishesthe effective federal funds rate for the previous day.
23

−1
−.5
0
.5
1
Per
cent
2005 2006 2007 2008 2009 2010
Deviations between Fed Funds Rate and FOMC Target
−.2
0
.2
.4
.6
Per
cent
2005 2006 2007 2008 2009 2010
Daily Spread between Fed Funds and Effective Rate
Figure 13: Daily spreads of the FOMC target and the effective fed funds rate, to the value-weighted fed funds rate
be quite close; the largest disparities occurred during the 2007-2008 turmoil, and even then this
spread was typically less than one-tenth of 1 percent.
7.1 Intraday dynamics of the distribution of fed fund rates
Let ρisty be the rate on loan i extended at time s on day t of year y. Define ρsty =∑Isty
i=1 ωistyρ
isty,
where Isty is the number of transactions at time s on day t of year y, and ωisty is the ratio of the
value of loan i to the total value of all loans traded at time s during day t of year y. Intuitively,
ρsty is the average value-weighted fed funds rate at time s of day t in year y. For each year in
our sample period, each panel in Figure 25 shows 31 box plots (each corresponding to a given
time of day) of the spread, σisty ≡ ρisty − ρsty, at five-minute intervals from 16:00 until 18:30,
throughout the year. Specifically, each box plot shows, for a given time of day s and year y,
the distribution of observations, {σisty}, for all (i, t) pairs, i.e., for all loans and trading days in
the year. By pooling all trading days in a given year, Figure 25 provides a clear picture of the
intraday dynamics of the distribution of fed funds spreads. The dispersion in spreads increases
toward the end of the trading session in 2005-2008, but decreases toward the end of the trading
session in 2009-2010.
Since the box plots pool together different trading days in a year, the pure time-series
dimension of the intraday distribution of spreads may not be so evident in Figure 25. To
provide a clearer time-series perspective, Figure 14 displays the 90th and the 10th percentiles
24

−4
−2
0
2
4
6
Per
cent
2005 2006 2007 2008 2009 2010
10th Percentile, 16:15 90th Percentile, 16:1510th Percentile, 18:15 90th Percentile, 18:15
Intraday Distribution of Fed Funds Spreads (over time)
Figure 14: Daily time series of summary statistics of the distribution of fed fund spreads acrossloans (at 16:15 and 18:15)
of the daily distribution of fed funds spreads, at two times of day (16:15, and 18:15), for every
trading day in 2005-2010. Figure 14 confirms the picture painted by Figure 25: during 2005-
2008, the 10th percentile at 18:15 tends to be below the 10th percentile at 16:15, and the 90th
percentile at 18:15 above the 90th percentile at 16:15, indicating that the dispersion in spreads
is widening as the trading session progresses. Notice that this pattern is reversed during 2009-
2010. It is also interesting to notice the widening in daily spreads both at 16:15 and at 18:15
during the end of 2007 and most of 2008. This observation is in line with the increase in the
distance between the 90th percentile and the 10th percentile of the distribution of all daily rates
illustrated in the right panel of Figure 12.
8 Interest on reserves
The Emergency Economic Stabilization Act of 2008 authorized the Federal Reserve to begin
paying interest on reserve balances held by or on behalf of depository institutions beginning on
October 1, 2008. The interest on reserves has been at 25 basis points since December 18, 2008.
Figure 15 shows the effective fed funds rate.35 Strikingly, the effective fed funds rate has been
35These data are available at http://www.newyorkfed.org/markets/omo/dmm/fedfundsdata.cfm.
25

.05
.1
.15
.2
.25
Per
cent
2009 2010
IOR Effective Fed Funds Rate
Daily Effective Fed Funds Rate and IOR
Figure 15: Daily effective fed funds rate during the IOR regime
consistently lower than the 25 basis points that the Federal Reserve pays on reserves held by
commercial banks.36 The left panel of Figure 16 shows the average value-weighted fed funds rate
from Fedwire data for each day during 2009-2010. The value-weighted fed funds rate from our
transactions is very close to the effective fed funds rates, and therefore is also consistently below
25 basis points throughout 2009-2010. The right panel shows the 10th and 90th percentiles of
the daily distribution of fed funds rates calculated from Fedwire data, again against the interest
on reserves (IOR). This panel shows that for extended periods of time during 2009 and 2010,
not only was the average value-weighted fed funds rate below 25 basis points, but moreover,
a large proportion of all loans traded below 25 basis points. These observations are puzzling:
given that commercial banks can earn 25 risk-free basis points from the Fed overnight, why do
some commercial banks lend reserves at rates lower than 25 basis points?
36Some large lenders in the federal funds market that are non-depository institutions, such as the GSEs, donot receive interest on their reserve balances. It has been argued (see Bech and Klee, 2011) that such institutionsmay have an incentive to lend at rates below the rate that banks receive on reserve balances, which might havecontributed to the effective federal funds rate being lower than the rate of interest banks earn on reserve balances.
26

.1
.15
.2
.25
Per
cent
2009 2010
IOR Fed Funds Rate
Daily Fed Funds Rate and IOR
0
.1
.2
.3
.4
.5
Per
cent
2009 2010
10th Percentile of Fed Funds Rate IOR90th Percentile of Fed Funds Rate
Daily Dispersion of Fed Funds Rate and IOR
Figure 16: Daily fed funds rate during the IOR regime
9 Concluding remarks
In the previous sections we used Fedwire transactions data filtered by a standard Furfine al-
gorithm to document some key stylized facts of the interbank overnight loan market in the
United States. Our empirical analysis has been guided by theory in that the variables we have
chosen to study are the ones that the model developed in Afonso and Lagos (2014) identifies as
being important in understanding the functioning of this market. We summarize our findings
as follows.
First, trade volume is large (a value of about two times annual GDP is traded over the
course of a year in the last 90 minutes of the typical day), and the distribution of trading
activity across commercial banks is very skewed. Second, we have documented dispersion in
fed funds rates during normal times. This dispersion increased significantly during the second
half of 2007 and remained high by historical standards through 2008. Third, the distribution of
commercial banks’ reserve balances follows a clear pattern of daily convergence during the last
2.5 hours of a typical trading day during normal times (e.g., 2005-2008), and guided by theory,
we interpret this finding as evidence that commercial banks actively trade fed funds in a way
that achieves a reallocation of funds from institutions with excess balances toward those in need
of funds. Fourth, we have found that commercial banks, by purchasing funds earlier in the day
and reselling them later in the day, play a critical role as de facto intermediaries in the fed funds
market: this intermediation accounts for about 40 percent of the dollar volume traded between
27

16:00 and 18:30 during an average trading day. Fifth, our analysis is consistent with a striking
aspect of intermediation in this market: a significant number of loans are made by lenders who,
based on their balances at the time of the loan, appear to be in need of funds themselves, and
conversely, some banks that appear to be looking to lend in fact borrow significant amounts of
reserves.
The theoretical framework that economists use to frame and organize policy discussions
about the fed funds market is the static competitive model of Poole (1968). Recent empirical
studies (e.g., Ashcraft and Duffie, 2007) have suggested, however, that a dynamic search-based
theory may be a more useful framework in which to interpret the wealth of available price and
quantity estimates of fed funds transactions.37 Our findings lend support to this view. The
prevalence of price dispersion, the pervasiveness of intermediation among commercial banks,
and the daily pattern of gradual convergence of reserve balances are hallmarks of a trading
process mediated by search. We interpret these findings as prima facie evidence in favor of the
usefulness of a search-based theory of the fed funds market.
37Ashcraft and Duffie (2007) focus on two variables: transaction pairing likelihood, and the fed funds rate ne-gotiated between two commercial banks. They analyze the determinants of the likelihood of a loan by institutioni to institution j in minute t of the trading day. They find a strong relationship between counterparty balancesand the probability of a fed funds loan, specifically, that a high balance (relative to normal for that minute)increases the probability of being a lender, while a low balance increases the probability of being a borrower. Asfor the fed funds rates, they study the determinants of the cross-sectional spread (at a given minute s) of therate negotiated by a particular lender i and borrower j, net of the current minute, dollar-weighted average ratenegotiated elsewhere in the market. Let this spread be denoted by σij
s . As explanatory variables they consider:(a) the cross-sectional deciles dbi and dbj of the lender’s and the borrower’s normalized balance (measures similar
to the aisty and aj
sty that we introduced in Section 6), and (b) the cross-sectional deciles dvi and dvj of the lender’sand the borrower’s transaction volume (measured by the total dollar amount of fed funds sent by the institutionover the last 90 minutes of the trading session in the current month), and find that, on average, σij
s decreaseswith dbi + dbj and increases with dvi − dvj . These effects are stronger during the last 60 minutes of the tradingsession and apply after controlling for prior lending relationships between i and j. The search-based model of thefed funds market developed in Afonso and Lagos (2014) can account for these findings and provides a theoreticalframework in which to interpret them.
28
References
[1] Afonso, Gara, Anna Kovner, and Antoinette Schoar. 2011. “Stressed, Not Frozen: The
Federal Funds Market in the Financial Crisis.” Journal of Finance 66(4) (August): 1109–
1139.
[2] Afonso, Gara, and Ricardo Lagos. 2014. “Trade Dynamics in the Market for Federal
Funds.” Manuscript.
[3] Armantier, Olivier, Jeffrey Arnold, and James McAndrews. 2008. “Changes in the Timing
Distribution of Fedwire Funds Transfers.” Federal Reserve Bank of New York Economic
Policy Review 14(2) (September): 83–112.
[4] Ashcraft, Adam B., and Hoyt Bleakley. 2006. “On the Market Discipline of Informationally-
Opaque Firms: Evidence from Bank Borrowers in the Federal Funds Market.” FDIC Center
for Financial Research Working Paper No. 2006-09.
[5] Ashcraft, Adam B., and Darrell Duffie. 2007. “Systemic Illiquidity in the Federal Funds
Market.” American Economic Review 97(2) (May): 221–225.
[6] Ashcraft, Adam B., James McAndrews, and David Skeie. 2009. “Precautionary Reserves
and the Interbank Market.” Federal Reserve Bank of New York Staff Report 370.
[7] Bartolini, Leonardo, Spence Hilton, and James J. McAndrews. 2010. “Settlement Delays
in the Money Market.” Journal of Banking and Finance 34(5) (May): 934–945.
[8] Bech, Morten L., and Enghin Atalay. 2008. “The Topology of the Federal Funds Market.”
Federal Reserve Bank of New York Staff Report 354.
[9] Bech, Morten L., and Elizabeth Klee. 2011. “The Mechanics of a Graceful Exit: Interest on
Reserves and Segmentation in the Federal Funds Market.” Journal of Monetary Economics
58(5) (July): 415–431.
[10] Furfine, Craig H. 1999. “The Microstructure of the Federal Funds Market.” Financial
Markets, Institutions and Instruments 8(5) (December): 24–44.
[11] Furfine, Craig H. 2000. “Interbank Payments and the Daily Federal Funds Rate.” Journal
of Monetary Economics 46(2) (October): 535–553.
29

[12] Furfine, Craig H. 2001. “Banks Monitoring Banks: Evidence from the Overnight Federal
Funds Market.” Journal of Business 74(1) (January): 33–57.
[13] Furfine, Craig H. 2002. “The Interbank Market during a Crisis.” European Economic Re-
view 46(4-5) (May): 809–820.
[14] Hamilton, James D. 1996. “The Daily Market for Federal Funds.” Journal of Political
Economy 104(1) (February): 26–56.
[15] Hamilton, James D. 2008. “The Anomalous Fed Funds Market.”
http://www.econbrowser.com/archives/2008/11/the anomalous f.html.
[16] Hamilton, James D., and Oscar Jorda. 2002. “A Model of the Federal Funds Rate Target.”
Journal of Political Economy 110(5) (October): 1135–1167.
[17] Kuo, Dennis, David Skeie, and James Vickery. 2010. “How Well Did Libor Measure Bank
Wholesale Funding Rates During the Crisis?” Manuscript.
[18] McAndrews, James J. 2009. “Segmentation in the U.S. Dollar Money Markets During the
Financial Crisis.” Manuscript.
[19] Meulendyke, Anne-Marie. 1998. U.S. Monetary Policy and Financial Markets. New York:
Federal Reserve Bank of New York.
[20] Poole, William. 1968. “Commercial Bank Reserve Management in a Stochastic Model:
Implications for Monetary Policy.” Journal of Finance 23(5) (December): 769–791.
[21] Stigum, Marcia. 1990. The Money Market. New York: McGraw-Hill.
30

−.50.51 16
:00
16:3
017
:00
17:3
018
:00
18:3
0
10th
/90t
h P
erce
ntile
s25
th/7
5th
Per
cent
iles
Med
ian
Mea
n
Nor
mal
ized
Bal
ance
s, 2
005
−.50.51 16
:00
16:3
017
:00
17:3
018
:00
18:3
0
10th
/90t
h P
erce
ntile
s25
th/7
5th
Per
cent
iles
Med
ian
Mea
n
Nor
mal
ized
Bal
ance
s, 2
006
−.50.51 16
:00
16:3
017
:00
17:3
018
:00
18:3
0
10th
/90t
h P
erce
ntile
s25
th/7
5th
Per
cent
iles
Med
ian
Mea
n
Nor
mal
ized
Bal
ance
s, 2
007
−.50.51
1.5 16
:00
16:3
017
:00
17:3
018
:00
18:3
0
10th
/90t
h P
erce
ntile
s25
th/7
5th
Per
cent
iles
Med
ian
Mea
n
Nor
mal
ized
Bal
ance
s, 2
008
0246810
16:0
016
:30
17:0
017
:30
18:0
018
:30
10th
/90t
h P
erce
ntile
s25
th/7
5th
Per
cent
iles
Med
ian
Mea
n
Nor
mal
ized
Bal
ance
s, 2
009
051015
16:0
016
:30
17:0
017
:30
18:0
018
:30
10th
/90t
h P
erce
ntile
s25
th/7
5th
Per
cent
iles
Med
ian
Mea
n
Nor
mal
ized
Bal
ance
s, 2
010
Figure
17:Intrad
aydynam
icsofthedistributionofnorm
alizedreservebalancesamongcommercialbanks
31

0.51 16:0
016
:30
17:0
017
:30
18:0
018
:30
10th
/90t
h P
erce
ntile
s25
th/7
5th
Per
cent
iles
Med
ian
Mea
n
Nor
mal
ized
Bal
ance
s, 3
/29/
2005
0.51 16:0
016
:30
17:0
017
:30
18:0
018
:30
10th
/90t
h P
erce
ntile
s25
th/7
5th
Per
cent
iles
Med
ian
Mea
n
Nor
mal
ized
Bal
ance
s, 1
0/4/
2006
−.50.51 16
:00
16:3
017
:00
17:3
018
:00
18:3
0
10th
/90t
h P
erce
ntile
s25
th/7
5th
Per
cent
iles
Med
ian
Mea
n
Nor
mal
ized
Bal
ance
s, 4
/23/
2007
−.50.51 16
:00
16:3
017
:00
17:3
018
:00
18:3
0
10th
/90t
h P
erce
ntile
s25
th/7
5th
Per
cent
iles
Med
ian
Mea
n
Nor
mal
ized
Bal
ance
s, 8
/7/2
008
0246810
16:0
016
:30
17:0
017
:30
18:0
018
:30
10th
/90t
h P
erce
ntile
s25
th/7
5th
Per
cent
iles
Med
ian
Mea
n
Nor
mal
ized
Bal
ance
s, 9
/2/2
009
0246810
16:0
016
:30
17:0
017
:30
18:0
018
:30
10th
/90t
h P
erce
ntile
s25
th/7
5th
Per
cent
iles
Med
ian
Mea
n
Nor
mal
ized
Bal
ance
s, 2
/10/
2010
Figure
18:Intrad
aydynam
icsofthedistributionofreservebalancesamongcommercialbanks(random
day
s)
32

03691215
Daily Number of Counterparties
2005
2006
2007
2008
2009
2010
25th
Per
cent
ileM
edia
n75
th P
erce
ntile
Mea
n
Dis
trib
utio
n of
Dai
ly N
umbe
r of
Cou
nter
part
ies
03691215
Daily Number of Borrowers per Bank
2005
2006
2007
2008
2009
2010
25th
Per
cent
ileM
edia
n75
th P
erce
ntile
Mea
n
Dis
trib
utio
n of
Dai
ly N
umbe
r of
Cou
nter
part
ies
Ban
ks L
end
to
03691215
Daily Number of Lenders per Bank
2005
2006
2007
2008
2009
2010
25th
Per
cent
ileM
edia
n75
th P
erce
ntile
Mea
n
Dis
trib
utio
n of
Dai
ly N
umbe
r of
Cou
nter
part
ies
Ban
ks B
orro
w fr
om
Figure
19:Summarystatisticsofthedailydistributionofcounterpartiesacross
banks
33

0
1,00
0
2,00
0
3,00
0
Millions of Dollars
16:0
016
:30
17:0
017
:30
18:0
018
:30
10th
/90t
h P
erce
ntile
s25
th/7
5th
Per
cent
iles
Med
ian
Mea
n
Intr
aday
Tot
al A
mou
nt o
f Loa
ns, 2
005
0
500
1,00
0
1,50
0
2,00
0
2,50
0
Millions of Dollars
16:0
016
:30
17:0
017
:30
18:0
018
:30
10th
/90t
h P
erce
ntile
s25
th/7
5th
Per
cent
iles
Med
ian
Mea
n
Intr
aday
Tot
al A
mou
nt o
f Loa
ns, 2
006
0
1,00
0
2,00
0
3,00
0
Millions of Dollars
16:0
016
:30
17:0
017
:30
18:0
018
:30
10th
/90t
h P
erce
ntile
s25
th/7
5th
Per
cent
iles
Med
ian
Mea
n
Intr
aday
Tot
al A
mou
nt o
f Loa
ns, 2
007
0
1,00
0
2,00
0
3,00
0
Millions of Dollars
16:0
016
:30
17:0
017
:30
18:0
018
:30
10th
/90t
h P
erce
ntile
s25
th/7
5th
Per
cent
iles
Med
ian
Mea
n
Intr
aday
Tot
al A
mou
nt o
f Loa
ns, 2
008
0
500
1,00
0
1,50
0
2,00
0
2,50
0
Millions of Dollars
16:0
016
:30
17:0
017
:30
18:0
018
:30
10th
/90t
h P
erce
ntile
s25
th/7
5th
Per
cent
iles
Med
ian
Mea
n
Intr
aday
Tot
al A
mou
nt o
f Loa
ns, 2
009
0
500
1,00
0
1,50
0
2,00
0
Millions of Dollars
16:0
016
:30
17:0
017
:30
18:0
018
:30
10th
/90t
h P
erce
ntile
s25
th/7
5th
Per
cent
iles
Med
ian
Mea
n
Intr
aday
Tot
al A
mou
nt o
f Loa
ns, 2
010
Figure
20:Distributionoftradevolumebytimeofday
throughouttheyear
34

051015
Number of Loans
16:0
016
:30
17:0
017
:30
18:0
018
:30
10th
/90t
h P
erce
ntile
s25
th/7
5th
Per
cent
iles
Med
ian
Mea
n
Intr
aday
Num
ber
of L
oans
, by
Ban
k, 2
005
051015
Number of Loans
16:0
016
:30
17:0
017
:30
18:0
018
:30
10th
/90t
h P
erce
ntile
s25
th/7
5th
Per
cent
iles
Med
ian
Mea
n
Intr
aday
Num
ber
of L
oans
, by
Ban
k, 2
006
051015
Number of Loans
16:0
016
:30
17:0
017
:30
18:0
018
:30
10th
/90t
h P
erce
ntile
s25
th/7
5th
Per
cent
iles
Med
ian
Mea
n
Intr
aday
Num
ber
of L
oans
, by
Ban
k, 2
007
051015
Number of Loans
16:0
016
:30
17:0
017
:30
18:0
018
:30
10th
/90t
h P
erce
ntile
s25
th/7
5th
Per
cent
iles
Med
ian
Mea
n
Intr
aday
Num
ber
of L
oans
, by
Ban
k, 2
008
02468
Number of Loans
16:0
016
:30
17:0
017
:30
18:0
018
:30
10th
/90t
h P
erce
ntile
s25
th/7
5th
Per
cent
iles
Med
ian
Mea
n
Intr
aday
Num
ber
of L
oans
, by
Ban
k, 2
009
0246810
Number of Loans
16:0
016
:30
17:0
017
:30
18:0
018
:30
10th
/90t
h P
erce
ntile
s25
th/7
5th
Per
cent
iles
Med
ian
Mea
n
Intr
aday
Num
ber
of L
oans
, by
Ban
k, 2
010
Figure
21:Distributionofthenumber
ofloansbytimeofday
throughouttheyear
35

0
100
200
300
400
Millions of Dollars
16:0
016
:30
17:0
017
:30
18:0
018
:30
10th
/90t
h P
erce
ntile
s25
th/7
5th
Per
cent
iles
Med
ian
Mea
n
Intr
aday
Dis
trib
utio
n of
Loa
n S
izes
, 200
5
0
100
200
300
400
500
Millions of Dollars
16:0
016
:30
17:0
017
:30
18:0
018
:30
10th
/90t
h P
erce
ntile
s25
th/7
5th
Per
cent
iles
Med
ian
Mea
n
Intr
aday
Dis
trib
utio
n of
Loa
n S
izes
, 200
6
0
100
200
300
400
500
Millions of Dollars
16:0
016
:30
17:0
017
:30
18:0
018
:30
10th
/90t
h P
erce
ntile
s25
th/7
5th
Per
cent
iles
Med
ian
Mea
n
Intr
aday
Dis
trib
utio
n of
Loa
n S
izes
, 200
7
0
100
200
300
400
500
Millions of Dollars
16:0
016
:30
17:0
017
:30
18:0
018
:30
10th
/90t
h P
erce
ntile
s25
th/7
5th
Per
cent
iles
Med
ian
Mea
n
Intr
aday
Dis
trib
utio
n of
Loa
n S
izes
, 200
8
0
500
1,00
0
1,50
0
Millions of Dollars
16:0
016
:30
17:0
017
:30
18:0
018
:30
10th
/90t
h P
erce
ntile
s25
th/7
5th
Per
cent
iles
Med
ian
Mea
n
Intr
aday
Dis
trib
utio
n of
Loa
n S
izes
, 200
9
0
200
400
600
800
Millions of Dollars
16:0
016
:30
17:0
017
:30
18:0
018
:30
10th
/90t
h P
erce
ntile
s25
th/7
5th
Per
cent
iles
Med
ian
Mea
n
Intr
aday
Dis
trib
utio
n of
Loa
n S
izes
, 201
0
Figure
22:Distributionofloansizesbytimeofday
throughouttheyear
36

0
200
400
600
800
1,00
0
Millions of Dollars
16:0
016
:30
17:0
017
:30
18:0
018
:30
10th
/90t
h P
erce
ntile
s25
th/7
5th
Per
cent
iles
Med
ian
Mea
n
Sal
es b
y B
anks
with
Neg
ativ
e A
djus
ted
Bal
ance
s, 2
005
0
100
200
300
400
500
Millions of Dollars
16:0
016
:30
17:0
017
:30
18:0
018
:30
10th
/90t
h P
erce
ntile
s25
th/7
5th
Per
cent
iles
Med
ian
Mea
n
Sal
es b
y B
anks
with
Neg
ativ
e A
djus
ted
Bal
ance
s, 2
006
0
100
200
300
400
500
Millions of Dollars
16:0
016
:30
17:0
017
:30
18:0
018
:30
10th
/90t
h P
erce
ntile
s25
th/7
5th
Per
cent
iles
Med
ian
Mea
n
Sal
es b
y B
anks
with
Neg
ativ
e A
djus
ted
Bal
ance
s, 2
007
0
400
800
1,20
0
1,60
0
2,00
0
Millions of Dollars
16:0
016
:30
17:0
017
:30
18:0
018
:30
10th
/90t
h P
erce
ntile
s25
th/7
5th
Per
cent
iles
Med
ian
Mea
n
Sal
es b
y B
anks
with
Neg
ativ
e A
djus
ted
Bal
ance
s, 2
008
0
100
200
300
400
500
Millions of Dollars
16:0
016
:30
17:0
017
:30
18:0
018
:30
10th
/90t
h P
erce
ntile
s25
th/7
5th
Per
cent
iles
Med
ian
Mea
n
Sal
es b
y B
anks
with
Neg
ativ
e A
djus
ted
Bal
ance
s, 2
010
0
100
200
300
400
500
Millions of Dollars
16:0
016
:30
17:0
017
:30
18:0
018
:30
10th
/90t
h P
erce
ntile
s25
th/7
5th
Per
cent
iles
Med
ian
Mea
n
Sal
es b
y B
anks
with
Neg
ativ
e A
djus
ted
Bal
ance
s, 2
009
Figure
23:Intrad
ayfedfundssalesbycommercialbankswithverylow
reservebalances
37

0
200
400
600
800
1,00
0
Millions of Dollars
16:0
016
:30
17:0
017
:30
18:0
018
:30
10th
/90t
h P
erce
ntile
s25
th/7
5th
Per
cent
iles
Med
ian
Mea
n
Pur
chas
es b
y B
anks
with
Non
nega
tive
Adj
uste
d B
alan
ces,
200
5
0
500
1,00
0
1,50
0
Millions of Dollars
16:0
016
:30
17:0
017
:30
18:0
018
:30
10th
/90t
h P
erce
ntile
s25
th/7
5th
Per
cent
iles
Med
ian
Mea
n
Pur
chas
es b
y B
anks
with
Non
nega
tive
Adj
uste
d B
alan
ces,
200
6
0
1,00
0
2,00
0
3,00
0
Millions of Dollars
16:0
016
:30
17:0
017
:30
18:0
018
:30
10th
/90t
h P
erce
ntile
s25
th/7
5th
Per
cent
iles
Med
ian
Mea
n
Pur
chas
es b
y B
anks
with
Non
nega
tive
Adj
uste
d B
alan
ces,
200
7
0
2,00
0
4,00
0
6,00
0
Millions of Dollars
16:0
016
:30
17:0
017
:30
18:0
018
:30
10th
/90t
h P
erce
ntile
s25
th/7
5th
Per
cent
iles
Med
ian
Mea
n
Pur
chas
es b
y B
anks
with
Non
nega
tive
Adj
uste
d B
alan
ces,
200
8
0
100
200
300
400
500
Millions of Dollars
16:0
016
:30
17:0
017
:30
18:0
018
:30
10th
/90t
h P
erce
ntile
s25
th/7
5th
Per
cent
iles
Med
ian
Mea
n
Pur
chas
es b
y B
anks
with
Non
nega
tive
Adj
uste
d B
alan
ces,
200
9
0
100
200
300
400
500
Millions of Dollars
16:0
016
:30
17:0
017
:30
18:0
018
:30
10th
/90t
h P
erce
ntile
s25
th/7
5th
Per
cent
iles
Med
ian
Mea
n
Pur
chas
es b
y B
anks
with
Non
nega
tive
Adj
uste
d B
alan
ces,
201
0
Figure
24:Intrad
ayfedfundspurchasesbycommercialbankswithveryhighreservebalances
38

−.1
5
−.1
−.0
50
.05.1
Percent
16:0
016
:30
17:0
017
:30
18:0
018
:30
10th
/90t
h P
erce
ntile
s25
th/7
5th
Per
cent
iles
Med
ian
Mea
n
Intr
aday
Dis
trib
utio
n of
Fed
Fun
ds S
prea
ds, 2
005
−.2
−.10.1.2
Percent
16:0
016
:30
17:0
017
:30
18:0
018
:30
10th
/90t
h P
erce
ntile
s25
th/7
5th
Per
cent
iles
Med
ian
Mea
n
Intr
aday
Dis
trib
utio
n of
Fed
Fun
ds S
prea
ds, 2
006
−.3
−.2
−.10.1.2
Percent
16:0
016
:30
17:0
017
:30
18:0
018
:30
10th
/90t
h P
erce
ntile
s25
th/7
5th
Per
cent
iles
Med
ian
Mea
n
Intr
aday
Dis
trib
utio
n of
Fed
Fun
ds S
prea
ds, 2
007
−.4
−.20.2.4.6
Percent
16:0
016
:30
17:0
017
:30
18:0
018
:30
10th
/90t
h P
erce
ntile
s25
th/7
5th
Per
cent
iles
Med
ian
Mea
n
Intr
aday
Dis
trib
utio
n of
Fed
Fun
ds S
prea
ds, 2
008
−.1
−.0
50
.05.1.15
Percent
16:0
016
:30
17:0
017
:30
18:0
018
:30
10th
/90t
h P
erce
ntile
s25
th/7
5th
Per
cent
iles
Med
ian
Mea
n
Intr
aday
Dis
trib
utio
n of
Fed
Fun
ds S
prea
ds, 2
009
−.0
50
.05.1
Percent
16:0
016
:30
17:0
017
:30
18:0
018
:30
10th
/90t
h P
erce
ntile
s25
th/7
5th
Per
cent
iles
Med
ian
Mea
n
Intr
aday
Dis
trib
utio
n of
Fed
Fun
ds S
prea
ds, 2
010
Figure
25:Distributionfedfundsspreadsbytimeofday
throughouttheyear
39