Embed Size (px)
Citation preview

1
An Empirical Investigation of Criteria-Referenced Formative Assessment in the Arts
Abstract
The purpose of this study was to examine the effect of criterion-referenced formative assessment
on achievement in the arts. Forty-eight schools, including 5,640 elementary, middle, and high
school students, were randomly assigned to treatment and control conditions. The treatment
involved 24 music, art, theater, and dance teachers in professional development focused on
formative assessment practices, particularly peer and self-assessment. Standardized,
performance-based pre- and post-measures were used to evaluate learning. Propensity score
analysis was used to examine group differences in performance on the post-assessment.
Although the average treatment effect was not statistically significant, interactions between
multiple covariates and group suggest that the criterion-referenced formative assessment reduced
the range of treatment students’ scores and significantly increased a subgroup of average
students’ scores.
2
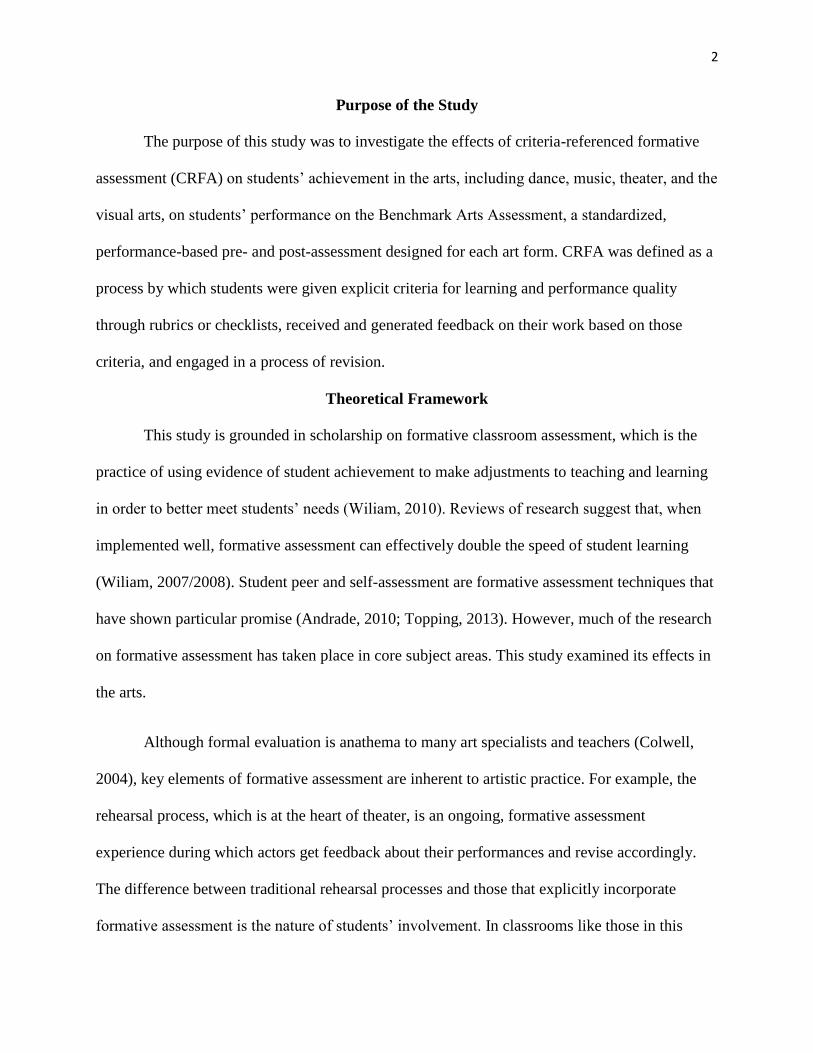
Purpose of the Study
The purpose of this study was to investigate the effects of criteria-referenced formative
assessment (CRFA) on students’ achievement in the arts, including dance, music, theater, and the
visual arts, on students’ performance on the Benchmark Arts Assessment, a standardized,
performance-based pre- and post-assessment designed for each art form. CRFA was defined as a
process by which students were given explicit criteria for learning and performance quality
through rubrics or checklists, received and generated feedback on their work based on those
criteria, and engaged in a process of revision.
Theoretical Framework
This study is grounded in scholarship on formative classroom assessment, which is the
practice of using evidence of student achievement to make adjustments to teaching and learning
in order to better meet students’ needs (Wiliam, 2010). Reviews of research suggest that, when
implemented well, formative assessment can effectively double the speed of student learning
(Wiliam, 2007/2008). Student peer and self-assessment are formative assessment techniques that
have shown particular promise (Andrade, 2010; Topping, 2013). However, much of the research
on formative assessment has taken place in core subject areas. This study examined its effects in
the arts.
Although formal evaluation is anathema to many art specialists and teachers (Colwell,
2004), key elements of formative assessment are inherent to artistic practice. For example, the
rehearsal process, which is at the heart of theater, is an ongoing, formative assessment
experience during which actors get feedback about their performances and revise accordingly.
The difference between traditional rehearsal processes and those that explicitly incorporate
formative assessment is the nature of students’ involvement. In classrooms like those in this

3
study, where a variety of formative assessment strategies were used, students are aware of the
learning goals, actively participate in giving and receiving feedback intended to move
themselves and each other toward those goals, and meaningfully engaged in rethinking and
revising performances in the service of the goals.
Research Question and Hypothesis
Our research question asked if there is a difference in achievement between students
whose teachers engaged them in CRFA and those who did not. Our hypothesis was that students
who engaged in CRFA would attain higher achievement in the arts.
Methods
Participants
Forty-eight schools at the fifth, eighth and high school levels were randomly assigned to
treatment and control conditions. These schools spanned all five boroughs and 36 districts within
New York City. In total, there were 5,640 dance, music, theater, and visual arts students
(control=2,445; treatment=3,195). Students were not randomly assigned within schools. Our
analysis included 4,407 students (control=2,445; treatment=1,962), comprised of students whose
teacher implemented CRFA with high fidelity. Teachers who indicated that they shared criteria
with students using rubrics, checklists, or other strategies, and engaged students in peer and/or
self-assessment followed by opportunities for revision were coded as having implemented CRFA
with high fidelity. The remaining treatment teachers were coded as having received CRFA
training but without high fidelity of implementation; data from students of these teachers were
not included in this study. Students in the control group received business as usual (BAU)
instruction. Descriptive statistics for the control and treatment groups, and for the overall sample
size, are presented in Tables 1 and 2.

4
Instruments
Benchmark Arts Assessment. Standardized pre- and post-assessments were developed
for each of the four art forms. The assessments contained a mixture of multiple choice, short
response, fill in the blank, and performance tasks. The Benchmark Arts Assessments were
developed by Curriculum and Assessment Development Teams, which consisted of NYC
Department of Education leadership, and art specialists from each art form. The teams also
designed scoring rubrics to measure performance on each task. Following field trials and
revisions, the assessment was finalized and evidence of validity and reliability was established.
The pre-assessment was administered to all students in Fall 2011 and the post-assessment in
Spring 2012.
Implementation Logs. Fidelity of treatment was determined by examining treatment
teachers’ implementation logs, which required regular documentation of the implementation of
criteria-referenced formative assessment practices. The teachers and their coaches, or project
facilitators, qualitatively reported how teacher feedback, student-to-student peer feedback,
student self-assessment, and other formative assessment practices were used in the classroom.
Research Design and Procedure
A pre-post experimental design was used for this study. The treatment condition involved
an intervention funded by a U.S. Department of Education Investing in Innovation (i3) grant
called Arts Achieve, a five-year project. The data for this study were from the first year, during
which teachers received professional development and technical assistance emphasizing
formative assessment practices, particularly criteria-referenced self- and peer assessment.
Through professional development, teachers learned about the formative assessment process and

5
engaged in action research focused on its use in their instruction. Teachers documented and
reflected on their formative assessment practices using the implementation logs.
Students in treatment and control conditions were administered the Benchmark Arts
Assessment at the beginning and end of the school year. Students in the treatment condition
received instruction from teachers trained in CRFA. Students in the control group received BAU
instruction, i.e., instruction from teachers who did not receive formative assessment training.
Archival demographic data from the New York City Department of Education were collected
and used for matching purposes.
Analysis
Qualitative data from the implementation logs were analyzed to determine fidelity of
treatment. R (R Core Team, 2013) was used to conduct propensity score analysis (PSA). The
outcome variable was students’ performance on the 2012 post-assessment in the arts. The binary
treatment variable was group, where students were either in the control or treatment group.
Based on significant empirical evidence, eight covariates were selected as key covariates that
might distinguish between the two groups: scores on the NYS tests of English Language Arts
and mathematics, average daily attendance, socio-economic status as measured by the free and
reduced lunch indicator, gender, performance on the 2011 pre-assessment in the arts, special
education, and English Language Learner.
Results
Propensity Score Analysis
PSA was conducted in two phases. Phase One involved an estimation of the propensity
scores and checks for covariate balance after propensity score modeling. Phase Two involved the
comparison of performance on the 2012 post-assessment between control and treatment students

6
with similar propensity scores. The PSAgraphics package (Helmreich & Pruzek, 2009) was used
to create visual representations of our results.
Phase One. A logistic regression with the chosen eight covariates was used to model the
probability of students being assigned to the treatment group. Using the propensity score model,
observations from the two conditions were matched one-to-one with replacement using the
default specification of Match function [Matching] in R (Diamond & Sekhon, 2005). With this
specification, 1,020 pairs of observations were obtained after matching. Comparisons between
the effect size of each covariate before (stES_unadj; red line) and after (stES_adj; blue line)
adjustment using propensity scores indicated that the effect size of more than .05 for most
covariates decreased to .00 to .05 following propensity score adjustment (Figure 1). Since the
adjusted absolute effect sizes for the covariates were less than 0.1, sufficient balance was
achieved through the matching procedure (Harder, Stuart, & Anthony, 2010).
Boxplots and bar graphs, shown in Appendix A, were generated for the four continuous
covariates and four categorical covariates included in the current propensity score model.
Generally, the boxplots and bar graphs showed that all eight covariates were well balanced
between the two groups for all strata, and that the distributions were roughly equal across all
strata.
Phase Two. A loess regression plot was generated to illustrate differences between
control and treatment students’ performance on the 2012 post-assessment after propensity score
adjustment (Figure 2). Accompanying Figure 2 is Table 3, with counts, means, and confidence
intervals for the two groups sub-sectioned into eight strata. The average treatment effect was
0.66 (weighted SE = 0.63), but a confidence interval of -0.60 to 1.91 suggested that this effect
was not statistically significant.

7
Confidence intervals for each of the eight strata were generated to examine treatment
effects in more detail. As shown on the loess regression plot and Table 3, the treatment group
generally did better than the control group on the 2012 post-assessment, except for the third and
sixth strata. The overlaps with the confidence intervals of both groups indicate that these mean
differences were not statistically significant, except for stratum five, which resulted in a mean
difference of 2.95 (treatment=62.54; control=59.59). This suggests that the treatment tended to
work best for the students who were average in terms of the covariates used. Furthermore, since
the fifth stratum is one of the center strata, it is unlikely that this statistical significance of mean
difference is due to outliers.
Central tendencies and distributions of students’ performance on the 2012 post-
assessment in Table 3 revealed larger standard deviations for the control group than treatment
group for all eight strata. Furthermore, wider confidence intervals for the control group than the
treatment group suggest more confidence about where the true mean lies for the treatment than
control groups.
Discussion
PSA enabled us to minimize biases from non-random assignment of students within
schools by taking covariates into consideration. A statistically significant difference was not
found between the treatment and control groups with the use of propensity score analysis;
however, several trends emerged that are worthy of note. CRFA has credited in the literature
with having two effects on achievement: 1) increasing mean scores, and 2) decreasing the range
of scores by making students more similar in performance (Black & Wiliam, 1998). Scores being
more spread out for the control group than the treatment group on all strata is evidence of the
latter. Furthermore, non-overlapping confidence intervals between groups in stratum five with a

8
mean difference of 2.95 suggested that CRFA instruction appears to have the greatest benefit for
average performing students as defined by the covariates. Therefore, although the average
treatment effect was not found to be statistically significant, the results suggest that CRFA
affected student performance by reducing the range of treatment students’ scores, and
significantly increasing the scores of a subgroup of average students.
Directions for further research include examining data from years two through five of this
project, when presumably more teachers will be included in the high fidelity group, and
examining interactions between group and the four art forms (dance, music, theater, and visual
arts). From a developmental perspective, effects by grade level should also be examined.
Scholarly Significance
In their seminal review of research on formative assessment, Black and Wiliam (1998)
observed that formative assessment appeared to help low achievers more than other students and
thereby reduce the range of achievement. The implication that formative assessment can help
close the achievement gap is appealing but research conducted since 1998 on whether a
differential effect exists for high and low achieving students has been inconclusive, with some
studies showing a more pronounced effect for high achieving students (e.g., Meisels, Atkins-
Burnett, Xue, Nicholson, Bickel, & Son, 2003). This study adds a new wrinkle to the research
base by suggesting that it is the average students—neither high nor low achieving—that
benefitted the most from formative assessment in their arts classes. Given the rigor of the
experimental design and analytical methods used, this finding has some weight.

9
References
Andrade, H. (2010). Students as the definitive source of formative assessment: Academic self-
assessment and the self-regulation of learning. In H. Andrade & G. Cizek (Eds.),
Handbook of formative assessment. New York: Routledge.
Black, P. & Wiliam, D. (1998). Inside the black box: Raising standards through classroom
assessment. Phi Delta Kappan, 80(2), 139-148.
Colwell, R. (2004). Evaluation in the arts is sheer madness. ARTSPRAXIS, 1, 1 -12. Retrieved
from http://steinhardt.nyu.edu/music/artspraxis
Diamond, A., & Sekhon, J. S. (2005). Genetic matching for estimating causal effects: A general
multivariate matching method for achieving balance in observational studies. Review of
Economics and Statistics. Retrieved from http://escholarship.org/uc/item/8gx4v5qt#page-
1
Helmreich, J. & Pruzek, R. (2009). Psa graphics: An R package to support propensity score
analysis. Journal of Statistical Software, 29(6), 1-23.
Meisels, S., Atkins-Burnett, S., Xue, Y., & Bickel, D. D., & Son, S. (2003). Creating a system of
accountability: The impact of instructional assessment on elementary children’s
achievement scores. Educational Policy Analysis Archives, 11(9), Retrieved from
http://epaa.asu.edu/epaa/v11n9/
R Core Team (2013). R: A language and environment for statistical computing. R Foundation for
Statistical Computing, Vienna, Austria. URL http://www.R-project.org/.
Topping, K. (2013). Peer assessment as a form of formative assessment. In J. H. McMillan (Ed.),
Handbook of research on classroom assessment. New York. SAGE.
10
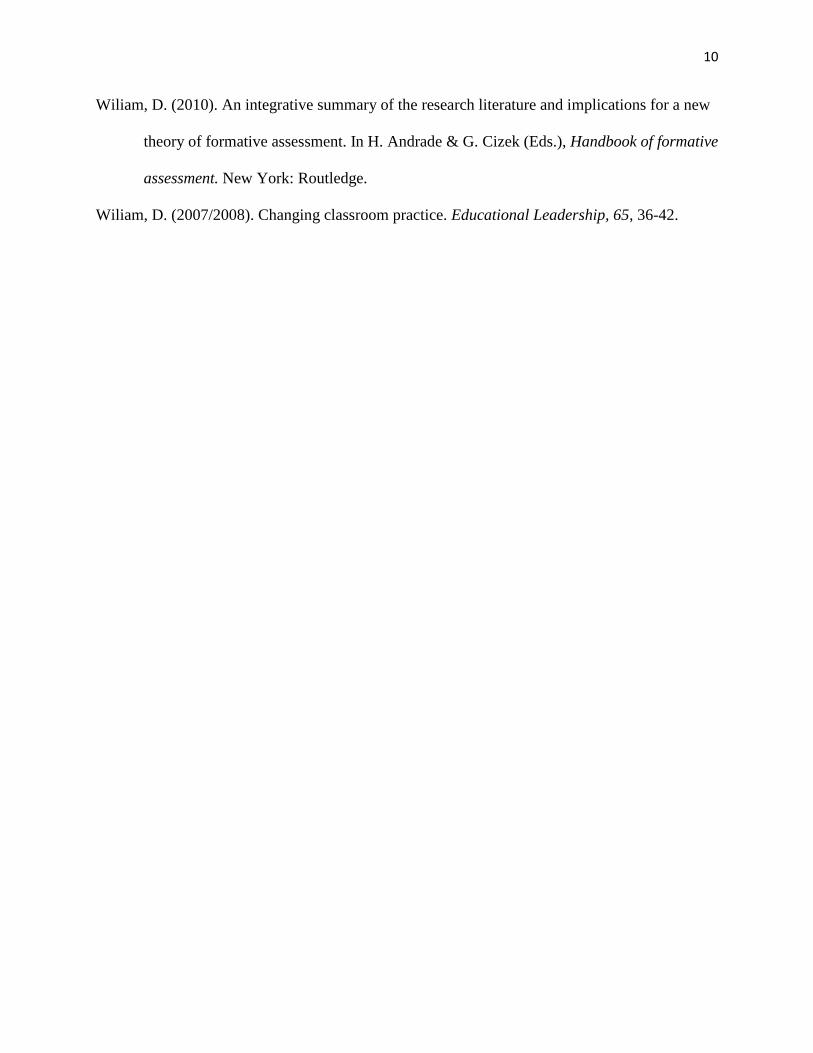
Wiliam, D. (2010). An integrative summary of the research literature and implications for a new
theory of formative assessment. In H. Andrade & G. Cizek (Eds.), Handbook of formative
assessment. New York: Routledge.
Wiliam, D. (2007/2008). Changing classroom practice. Educational Leadership, 65, 36-42.

11
Table 1
Student Demographic Information
Overall
(n=4407)
Control
(n=2445)
Treatment
(n=1962)
N
% of
Total N
% of
Total N
% of
Total
Gender
Male 1910 43.4 1027 42.0 883 45.0
Female 2325 52.8 1317 53.9 1008 51.4
Missing 172 3.9 101 4.1 71 3.6
Free/Reduced Lunch
No 817 18.5 526 21.5 291 14.8
Yes 3471 78.8 1849 75.6 1622 82.7
Missing 119 2.7 70 2.9 49 2.5
Ethnicity
American Indian or Alaskan Native 21 .5 4 .2 17 .9
Asian or Pacific Islander 706 16.0 391 16.0 315 16.1
Hispanic 1483 33.7 851 34.8 632 32.2
Black, not of Hispanic Origin 1348 30.6 748 30.6 600 30.6
White, not of Hispanic Origin 663 15.0 341 13.6 322 16.4
Multiracial 7 .2 5 .2 2 .1
Parents refuse to declare 1 .0 1 .0 0 0
Missing 178 4.0 104 4.3 74 3.8
English Language Learner (ELL)
Not ELL 1503 34.1 692 28.3 811 41.3
ELL 507 11.5 209 8.5 298 15.2
Missing 2397 54.5 1544 63.1 853 43.5
Special Education
Not Special Ed 1430 32.4 652 26.7 778 39.7
Special Ed 535 12.1 269 11.0 266 13.6
Missing 2442 55.4 1524 62.3 918 46.8
Discipline
Dance 974 22.1 607 24.8 367 18.7
Music 1127 25.6 806 33.0 321 16.4
Theater 866 19.7 434 17.8 432 22.0
Visual Arts 1440 32.7 598 24.5 842 42.9

12
Table 2
Means and Standard Deviations for Student Performance and Attendance
Overall Control Treatment
Average Daily
Attendance
n
M
SD
4122
92.78
9.48
2285
92.83
9.64
1837
92.70
9.29
ELA Achievement
n
M
SD
3029
666.70
25.06
1626
669.05
24.21
1403
663.97
25.74
Math Achievement
n
M
SD
3070
686.78
30.74
1641
689.36
30.88
1429
683.81
30.31
2011 Pre-assessment
n
M
SD
3385
52.93
16.90
1872
53.37
16.95
1513
52.39
16.83
2012 Post-assessment
n
M
SD
3200
60.28
16.98
1766
60.41
17.90
1434
60.12
15.76

13
Table 3
Count and Mean Summaries Based on Loess Regression, Using Eight Strata
Treatment Group Control Group
Count Mean
(SD)
Confidence
Interval Count
Mean
(SD)
Confidence
Interval
Mean
Difference
1 187 69.41
(12.51) 68.08 70.73 89
69.05 (14.12)
68.01 70.08 0.36
2 157 68.60
(13.12) 67.40 69.80 119
68.44 (14.98)
67.25 69.64 0.16
3 167 65.23
(13.17) 63.97 66.49 109
66.61 (14.94)
65.45 67.76 -1.37
4 143 64.45
(14.07) 63.23 65.67 133
63.07 (14.92)
61.82 64.32 1.38
5 134 62.54
(11.85) 61.54 63.53 142
59.59 (17.24)
58.10 61.08 2.95
6 139 58.65
(14.71) 57.39 59.91 137
59.45 (15.66)
58.12 60.78 -0.80
7 138 55.99
(13.50) 54.84 57.14 138
55.40 (16.98)
53.95 56.84 0.59
8 123 52.49
(13.13) 51.43 70.73 153
50.81 (16.54)
49.32 52.31 1.68

14
Figure 1. Standardized covariate effect sizes with and without propensity score adjustment
Note: Covariates in the propensity score model included (top to bottom): 1) elascaleSY11 (ELA achievement scores); 2) ADASY11(average daily
attendance); mathscaleSY11 (mathematics achievement scores; 4) frlFLAGSY11 (socio-economic status as measured by the free and reduced lunch
indicator); 5) gender; 6) achievescore (performance on the 2011 pre-assessment in the arts); 7) SPECEDFLAGSY11 (special education indicator);
and 8) ELLFLAGSY11 (English Language Learner indicator)

15
Figure 2. Loess Regression of 2012 post-assessment on Propensity Score for Control and Treatment
Note: Average Treatment Effect = 0.66; CI = -0.60 to 1.91

16
Appendix A: PSAgraphics Boxplots Comparing Distributions and Central Tendencies of Covariates between Control and Treatment
Figure C1. Boxplots for average daily attendance distributions by
propensity score strata
Figure C2. Boxplots for 2011 pre-assessment in the arts distributions by
propensity score strata

17
Figure C3. Boxplots for 2011 ELA achievement scores distributions by
propensity score strata
Figure C4. Boxplots for 2011 math achievement scores distributions by
propensity score strata

18
Figure C5. Boxplots for ELL distributions by propensity score strata
Figure C6. Boxplots for free-reduced lunch distributions by propensity
score strata

19
Figure C7. Boxplots for gender distributions by propensity score strata
Figure C8. Boxplots for SpecEd distributions by propensity score strata