Embed Size (px)
Citation preview

International Review of Research in Emerging Markets and the Global Economy (IRREM)
An Online International Research Journal (ISSN: 2311-3200)
2015 Vol: 1 Issue 2
323
www.globalbizresearch.org
An Empirical Examination of the Efficiency of Commodity Markets
in India
N. R. Parasuraman,
Director & Professor – Finance,
Shri Dharmasthala Manjunatheshwara Institute for Management Development (SDMIMD),
Mysore, India.
Email: [email protected]
Ullas Rao,
Associate Professor – Finance,
Shri Dharmasthala Manjunatheshwara Institute for Management Development (SDMIMD),
Mysore, India.
Email: [email protected]
_____________________________________________________________________
Abstract
India’s growing economic clout within the emerging market club has resulted in a steady
proliferation of innovative financial products entering the capital markets. With an expansive
economy presenting enormous opportunities for businesses to earn superior rates of return on
capital outlays, the inherent risks arising out of a volatile global economic climate driven by
a slew of geo-political factors exert enormous pressure on the management of corporations to
devise strategies that are effective in mitigating some of these risks. In recent years, India has
been a witness to heightened interest being evinced by financial managers towards skilfully
deploying financial instruments like Futures and Options in order to overcome the
uncertainty arising out of fluctuations occurring in the prices of underlying assets1. In this
context, the role of commodity markets assumes considerable significance. Emergence of
organized and sophisticated commodity markets like NCDEX (National Commodities and
Derivatives Exchange) and MCX (Multi-commodity Exchange) has enabled the participants
of this specialized market to strategically hedge their positions in the backdrop of volatilities
witnessed in prices of underlying commodities. An implied postulate necessary for the
successful performance of the hedging function is the operation of market efficiency that
serves as a necessary condition for organized functioning of the market, which becomes the
basis for an efficient price-discovery mechanism. In this paper, we endeavour to examine the
efficiency of commodity markets in India by resorting to a rigorous econometric model. By
underscoring the need to establish a relationship between the Futures and Spot markets
(given that they depict a time-series behaviour), the model is better poised to examine the
empirical validation of market efficiency in comparison to alternative models (variance-ratio
test, jarque-bera test, and runs test etc.) that have traditionally relied upon the observed
behaviour of Spot prices alone to validate the enshrined objectives. A conspicuous absence of
studies involving employment of statistically robust models like cointegration regression in
respect of examination of efficiency of commodity markets in emerging economies like India
presents a compelling reason to undertake the present study. We employ the popular cost-of-
carry model to empirically examine the hypothesis involving efficiency of commodities market
in India2. We reject the cost-of-carry model using both single-hypothesis and joint-hypothesis
tests depicting a weak evidence of market efficiency.
___________________________________________________________________________
Key words: - Commodity Markets; Market Efficiency; Cointegration Regression
JEL Codes: - C58; G02; G14
1 In this paper, we examine the utility of derivatives products primarily from the standpoint of investors
employing it as a hedging tool. 2 We perform the cointegration regression using the popularly employed E-Views 7 software program.

International Review of Research in Emerging Markets and the Global Economy (IRREM)
An Online International Research Journal (ISSN: 2311-3200)
2015 Vol: 1 Issue 2
324
www.globalbizresearch.org
1. Introduction
Since the time commodities’ trading was introduced in the Indian financial markets, the
pace of growth has been phenomenal. From the year 2004 through 2013, the total traded
contracts have witnessed a CAGR of 66.99% highlighting the tremendous growth potential
existing in commodities markets (see Exhibit I). Until recently, commodities were
predominantly restricted to physical trading with the buyers and sellers exchanging assets at a
price discovered using an ‘arms-length’ transaction. While the dominance of physical markets
continues catering to buyers comprising of both wholesale and retail segments, the enormous
opportunities that have been opened up subsequent to the launch of commodities futures
market have led to trading in commodities a preferred investment vehicle for savvy investors,
portfolio managers, and sophisticated institutional investors led by banks and financial
institutions to earn superior rates of return by taking advantage of the price anomalies
exhibited by the futures and spot markets. Notwithstanding the enormous potential that is
available for futures traders to earn abnormal returns using speculative bets, the underlying
risks arising out of an adverse price movement could be equally deterring with the possibility
of a complete erosion of net worth. In keeping with the enormous risk exposition undertaken
by investors in trading commodities without an adequate hedging cover, the recently
promulgated banking licences policy places enormous restrictions on new licence holder
banking units from investing in commodities for treasury purposes (DNA, 2012).
Another peculiarity surrounding the commodities’ market is that unlike other futures
markets (say, equity or forex) that are characterized by cash settlement, contracts either
follow ‘both option’, ‘seller option’ or ‘compulsory delivery’ model with the physical
delivery entailing additional transaction costs that are incurred towards maintenance of
inventory and warehouses3. This peculiarity has often led policy makers to view trading in
commodities futures with considerable suspicion with the ramification that trading in specific
category of commodities (particularly in agriculture) has been suspended in the past on fears
that speculative considerations might lead to an ‘artificial supply crunch’ with the
consequence of jacking up prices of the commodities in spot markets. In recent times, even
trading in gold futures has attracted lot of attention to assess its ramifications on demand-
supply equilibrium.
3Commodities like Arecanut, Black Pepper, Cardamom, Chana, and Coffee (Robusta) are covered
under compulsory delivery model. For a complete discussion on commodity delivery models see MCX
India (2002).

International Review of Research in Emerging Markets and the Global Economy (IRREM)
An Online International Research Journal (ISSN: 2311-3200)
2015 Vol: 1 Issue 2
325
www.globalbizresearch.org
While certainly there is merit in understanding the exact nuances for the above delineated
phenomenon, certain sections of the scholarly community has not been prevented from
making an assertion on the plausibility of futures dictating spot prices4.
Even a cursory glance at the above points should prompt researchers to pose a
fundamental question – are commodity markets in India really efficient? A satisfactory
response would certainly aid a wide spectrum of audience comprising of policy makers,
commodity traders, and the academic community in general to develop strategies and
frameworks that will facilitate a meaningful expansion of commodities market with the
intended benefit of serving the legitimate needs of all interested parties.
More specifically, our collective understanding of the factors contributing to price-
disequilibrium in commodities market should get enriched empowering the decision makers
to formulate effective responses to challenges posed by markets operating below the optimum
level of efficiency5.
The recent episodes of excesses of speculation compounded with complete breakdown of
market fundamentals at the disgraced National Spot Exchange should sensitize all the
participants about the consequences of participating in markets that do not exhibit even the
basic traits of efficiency (Frontline, 2013).
In the present study, we therefore seek to evaluate the efficiency of commodity markets in
India by resorting to an empirical validation derived from a rigorous model with an objective
to significantly enrich the growing expanse of academic studies carried towards examining
the market efficiency of commodity markets in India.
2. Review of Significant Literature
Plethora of studies have been undertaken to examine the efficiency of commodities
market, which have predominantly been undertaken in the context of developed markets.
With the establishment and expansion of specialized commodity bourses in India, the scope
of research has significantly expanded. However, given the evolving scope of the subject in
India, there is certainly a merit in expanding the literature by presenting a compelling case in
the light of heightened interest evinced by participants of financial markets in commodities.
It is also noteworthy to observe that, traditionally, studies on market efficiency have been
undertaken by observing the behaviour of commodities’ prices in the spot markets alone.
Given that the futures markets have become virtually indispensable in the orderly
4 This is understandable because of the inextricable link existing between prices of commodities and
inflation. 5 Here, one might argue that an existence of inefficiency would lead the arbitrageurs to exploit the
inefficiencies by selling futures and buying spot and vice-versa depending on the price-trend exhibited
by spot and futures prices with the intended consequence of ultimately leading to an equilibrium level.
However, persistent episodes of inefficiency, while giving the arbitrageur an upper hand would
discourage the genuine traders from benefitting fully from an organized functioning of the market.
International Review of Research in Emerging Markets and the Global Economy (IRREM)
An Online International Research Journal (ISSN: 2311-3200)
2015 Vol: 1 Issue 2
326
www.globalbizresearch.org
development of capital markets in India, we opine that studies pertaining to examination of
market efficiency are incomplete without tracing the underlying relationship between futures
and spot prices of assets. Consequently, in this study, we employ a robust econometric tool
represented by Cointegration Regression model to derive inferences on market efficiency
(Crowder & Phengpis, 2005).
In the following section, we present a chronological summary of significant studies
undertaken in respect of examination of efficiency of commodity markets aimed at mapping
the findings of similar studies carried out in India and elsewhere.
Serletis & Scowcroft (1991) use a combination of six commodities comprising of Wheat,
Corn, Oats, Soybean, Soybean oil, and Soybean meal to derive inferences on market
efficiency. The study employs the cointegration approach with the results finding strong
evidence of cointegration between daily spot and one-month futures commodity prices. With
the study concluding that the observed results are consistent with market efficiency seems to
contradict, to an extent, on the inferences derived by studies subsequently that have
highlighted the plausibility of market inefficiency.
Beck (1994) uses a combination of six commodities comprising of Cattle, Orange Juice,
Hogs, Corn, Copper, Cocoa, and Soybeans to test the market efficiency. Here again, the study
employs the contested approach of using futures market to predict spot prices to derive
inferences on market efficiency. The study does not seem to present a strong case of either
accepting or rejecting the condition of market efficiency with the results pointing out that the
commodity markets were not always inefficient but only sometimes inefficient.
Using a combination of commodities comprising of Brent crude, Gasoil, Soybeans, Live-
hogs, Live-cattle, and Dm/$, Kellard, et al., (1999) examine market efficiency by employing
the Cointegration approach. While the results point to presence of a long-run efficiency,
however, in the short-run market efficiency does not seem to hold good. The study employs a
contested methodology of testing the ability of futures market to predict subsequent spot
prices, which is seen as an unbiased predictor of market efficiency. The primary limitation
associated with using futures as an unbiased predictor of future spot prices arises from the fact
that results on market efficiency remain inconclusive with some finding evidence of
efficiency while others finding inefficiency (Heaney, 2002). The apparent dichotomy also
arises partly from the different time periods and methods chosen for testing.
Four commodities comprising of Live cattle, Hogs, Corn, and Soybean meal are used by
McKenzie & Holt (2002) to examine the market efficiency of commodities. This study also
employs the contested approach of using futures markets to predict spot prices, which is
believed to be an unbiased indicator of market efficiency. The results point to existence of
long-range cointegration while exhibiting short-run inefficiencies and pricing biases.

International Review of Research in Emerging Markets and the Global Economy (IRREM)
An Online International Research Journal (ISSN: 2311-3200)
2015 Vol: 1 Issue 2
327
www.globalbizresearch.org
Yaganti & Kamaiah (2012) use a combination of commodities comprising of spices and
base metals to examine the hedging efficiency of commodity futures markets in India. While
the study does not appear to directly confront the issue of market efficiency, it does however
seek to address the issue indirectly as it is generally understood that a weak form of hedging
efficiency posits market inefficiency. The results interestingly point out that futures price is
considered as a reference point for spot market players like farmers, traders, and other
participants in the commodity markets. Clearly, such an observation is inconsistent with
market efficiency as it enables the participants to profit from the underlying spot transactions
due to the existence of pricing bias. The study employs the contested approach of building a
cointegration regression involving futures markets as a predictor of spot prices to derive
inferences. Moreover, the fact that results surrounding unit-root tests involving ADF have
been accepted at a reduced statistical power with a significance of 10% does not augur well.
As opposed to the studies reflected above which invariably employ testing the
unbiasedness hypothesis, also referred to as simple efficiency (Hansen & Hodrick, 1980), we
employ the more plausible cost-of-carry model to investigate the hypothesis surrounding
efficiency of commodity markets.
The cost-of-carry model is considered as the best-known model for pricing futures, which
expresses futures price as a function of the spot price compounded continuously over a given
rate of interest (usually risk-free rate) and time (Hemler & Longstaff, 1991).
3. The Empirical Model
Mathematically, under the cost-of-carry model6, futures price is expressed as a function of
the underlying spot price as given below.
)tT(r
tT,tteSF
Eq. 1
where
F = futures price
S = spot price of the underlying asset
r = risk-free rate of interest
T = time to maturity
t = time at the start of the contract
Given the time-series nature of the variables represented in the equation above, we would
expect the variables to have unit-roots, i.e. non-stationary or I(1). In such a scenario,
application of conventional regression would be rendered spurious lending the results
unreliable (Gujarati, et al., 2009)
6 For an excellent discussion on cost-of-carry model see, Hull (2014)

International Review of Research in Emerging Markets and the Global Economy (IRREM)
An Online International Research Journal (ISSN: 2311-3200)
2015 Vol: 1 Issue 2
328
www.globalbizresearch.org
We therefore express the above relationship as a cointegration regression equation by
transforming the variables into a logarithmic function.
Taking the natural logarithms, Eq. 1 may be expressed as given below.
ttt )tT(rsf (Joyeux & Milunovich, 2010) Eq. 2
where
ft ≡ log Ft
st ≡ log St
and, µt is a white noise error term with mean 0 and variance σ2 determined by market
imperfections.
The term in the brackets of the above equation represents a reverse time trend that starts
at T time duration to contract maturity, and ends at zero as t approaches T.
Empirically, the above equation may be re-specified as follows7.
ttt tTrsf Eq. 3
Provided that µt is stationary, we perform the following single and joint-hypothesis tests:
1) H0: α = 1
2) H0: β = 1
3) H0: α = β = 1
The above are the restrictions applied by the cost-of-carry model.
4. Sample for the Study
In keeping with the objective to empirically examine the hypothesis surrounding
efficiency of commodity markets in India, we use the daily values of futures and spot
variables comprising of Metal and Energy indices over a continuous 90-day (equivalent of a
3-month contract) trading period ending on October 23, 2014. The futures and spot data were
retrieved from http://www.mcxindia.com.
There are two points that merit explanation. Firstly, as against studying the behaviour of
individual commodities, we choose a broader representation by selecting a specific Index,
which captures the weighted average performance of all the commodities represented
thereunder. Secondly, out of an available set of four different indices represented by
COMDEX, AGRI, METAL, and ENERGY, we choose to study only the last two as the
underlying relationship between the values of futures and spot is better reflected evidenced by
statistically significant regression parameters (R2, standard error, F-statistic), (See Appendix
I). The rationale behind depiction of poor statistical relationship between futures and spot
7 The above equation is reflected in the form of a Classical Liner Regression Model (CLRM), with an
implied assumption on normality of data. Provided that the sample size is sufficient together with the
application of Central Limit Theorem (CLT) means that even where the error are not normally
distributed, the coefficient estimates would still follow a normal distribution (Brooks, 2014)
International Review of Research in Emerging Markets and the Global Economy (IRREM)
An Online International Research Journal (ISSN: 2311-3200)
2015 Vol: 1 Issue 2
329
www.globalbizresearch.org
values in other indices is beyond the scope of this study and is thus reserved for discussion
elsewhere.
As ultimately, a semi-strong EMH postulates an instantaneous adjustment to all the
publicly available information by security prices, a marginal investor must not be endowed
with the opportunity of earning superior rates of return by engaging in investing activity over
a shorter-horizon. Selection of a sample comprising of 90-days to test the market efficiency
hypothesis therefore look justified. In order to establish the veracity of the results, we
compare the findings with equity stock markets represented by Sensex futures and Sensex
(underlying) over a three-month futures contract expiring on October 30, 20148.
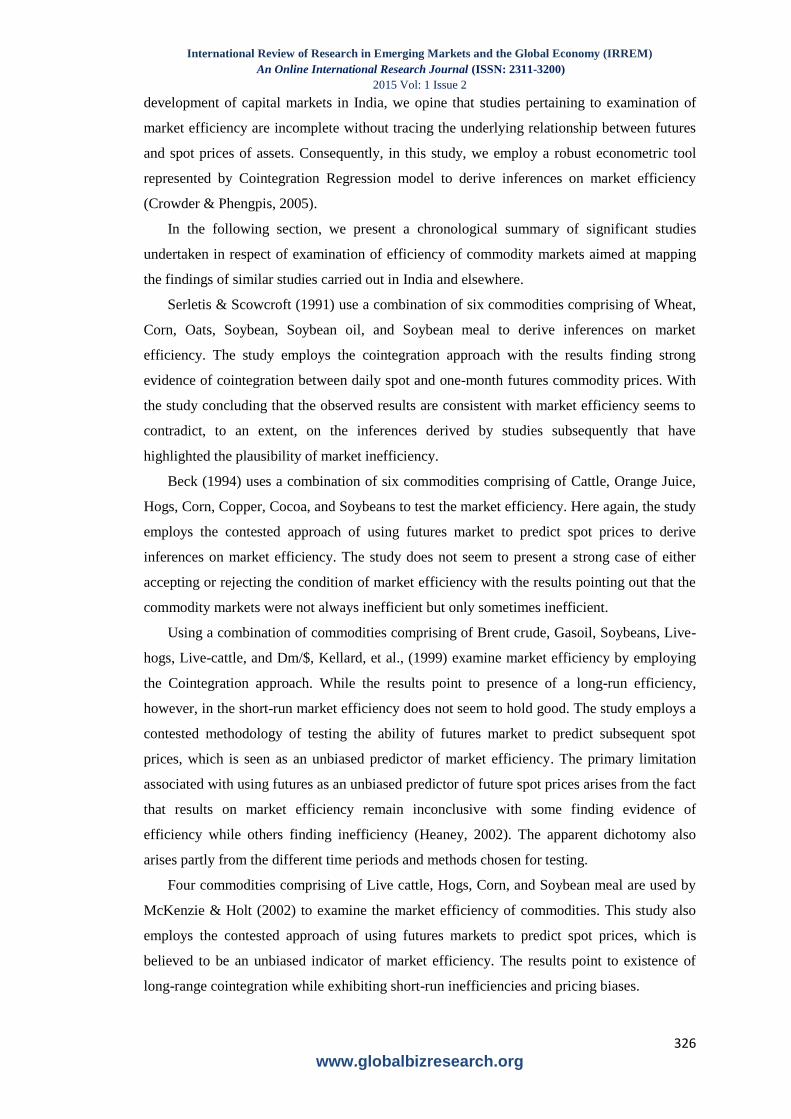
5. Analysis of data and interpretation
Having hypothesized that the variables represented in Eq. 2 are I(1), we perform the unit
root tests for which the results are indicated below in the tables numbering from I to III.
Table 1: Unit root test for variables underlying Metal Index
H0: Variables have unit roots
Variable t-statistic values modular test critical values at 5% p-values
L(Futures) 0.6916 2.8943 0.8428
L(Spot) 0.3845 2.8943 0.9063
Interest Rate 2.4670 2.8943 0.1270 (Source: eviews analysis)
Table 2: Unit root test for variables underlying Energy Index
H0: Variables have unit roots
Variable t-statistic values modular test critical values at 5% p-values
L(Futures) 0.3758 2.8943 0.9809
L(Spot) 0.0743 2.8943 0.9482
Interest Rate 2.4670 2.8943 0.1270 (Source: eviews analysis)
Table 3: Unit root test for variables underlying Sensex
H0: Variables have unit roots
Variable modular t-stat values modular critical values at 5% p-values
L(Futures) 1.8732 2.9199 0.3420
L(Spot) 1.7809 2.9199 0.3856
Interest Rate 1.4956 2.9199 0.9999 (Source: eviews analysis)
From the above table, it is clear that we are unable to reject the null involving presence of unit
roots implying that the variables represented by futures, spot and interest rate have unit roots
and are therefore non-stationery, i.e., I(1).
Whilst we know that,
t1tt YY Eq. 4
is non-stationery and therefore I(1). However, when the same equation is expressed as;
8 The data for equity stock markets was retrieved from http://www.bseindia.com

International Review of Research in Emerging Markets and the Global Economy (IRREM)
An Online International Research Journal (ISSN: 2311-3200)
2015 Vol: 1 Issue 2
330
www.globalbizresearch.org
t1ttt YYY Eq. 5
the series becomes stationary and therefore I(0). Hence, we convert the variables into first-
differences and test for the presence of unit roots. The results are depicted in tables IV to VI
below.
Table 4: Unit root test for differenced variables underlying Metal Index
H0: Differenced variables have unit roots
Variable modular t-stat values modular critical values at 5% p-values
L(Futures) 10.9673 2.8947 0.0000
L(Spot) 9.1124 2.8947 0.0000
Interest Rate9 10.5686 2.8952 0.0000
(Source: eviews analysis)
Table 5: Unit root test for differenced variables underlying Energy Index
H0: Differenced variables have unit roots
Variable modular t-stat values modular critical values at 5% p-values
L(Futures) 8.9951 2.8947 0.0000
L(Spot) 10.8234 2.8947 0.0000
Interest Rate 10.5686 2.8952 0.0000 (Source: eviews analysis)
Table 6: Unit root test for differenced variables underlying Sensex
H0: Differenced variables have unit roots
Variable modular t-stat values modular critical values at 5% p-values
L(Futures) 6.5453 2.9212 0.0000
L(Spot) 6.6293 2.9212 0.0000
Interest Rate10
13.60031 2.9225 0.0000
(Source: eviews analysis)
As it is evident, we are conveniently able to reject the null hypothesizing presence of unit
roots and conclude that the transformed first-differenced variables exhibit stationarity i.e. I(0).
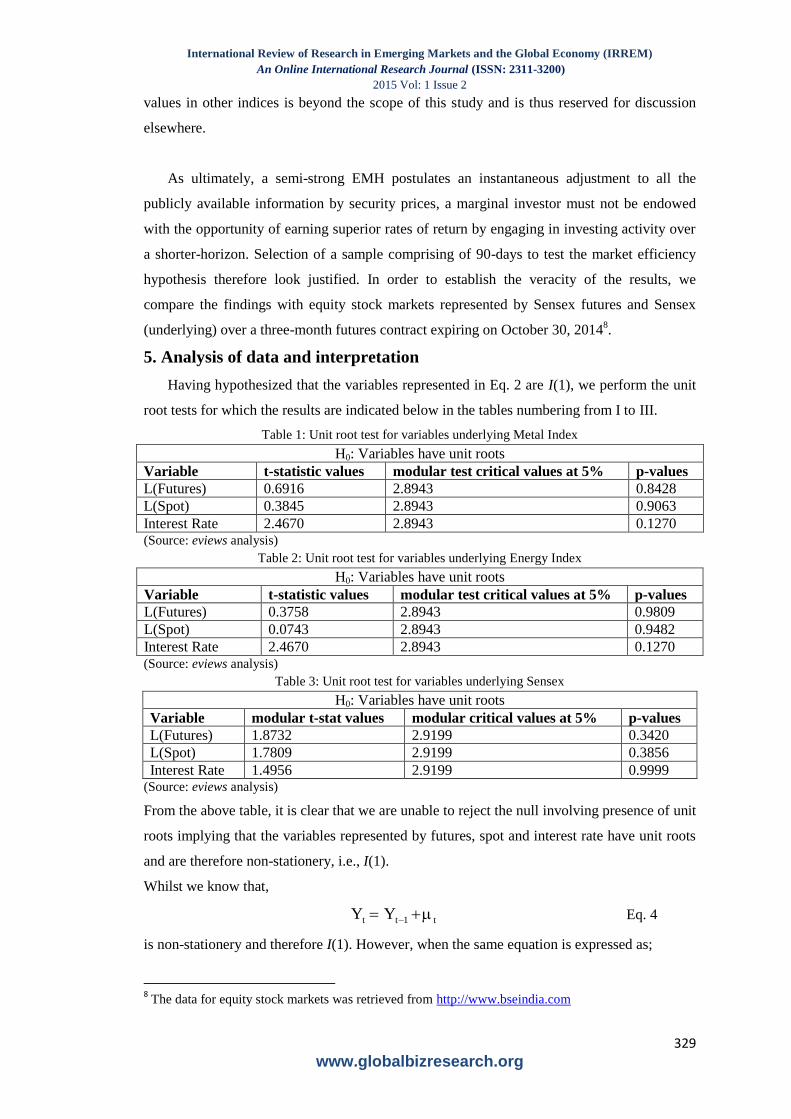
We now proceed with the Johansen cointegration test with the underlying null hypothesis
that there are none or zero cointegrating vectors (Johansen, 1991). The results underlying by
the two commodities indices – Metal and Energy and equity index – Sensex are delineated
below in tables VI to VIII. Clearly, the results indicate that we are able to reject the null
underlying no-cointegration at a significance level of 1%. Further we find the evidence that in
all the three indices led by Metal, Energy, and Sensex, there at most two cointegrating vectors
at 5% level of significance.
We therefore conclude that futures, spot, and interest rate are cointegrated.
9The first-differenced values were also observed to be significant under the ERS (Elliott-Rothenberg-
Stock) Point-Optimal unit root test (Elliott, et al., 1996). The reported P-Statistic value was observed to
be 4622.378 with the critical value at 5% being 2.9728, thereby rejecting the null of unit-roots. The
first-differenced series is therefore stationary, i.e., I(0).
10
The first-differenced values were also observed to be significant under the ERS (Elliott-Rothenberg-
Stock) Point-Optimal unit root test (Elliott, et al., 1996). The reported P-Statistic value was observed to
be 19.7696 with the critical value at 5% being 3.0792, thereby rejecting the null of unit-roots. The first-
differenced series is therefore stationary, i.e., I(0).
International Review of Research in Emerging Markets and the Global Economy (IRREM)
An Online International Research Journal (ISSN: 2311-3200)
2015 Vol: 1 Issue 2
331
www.globalbizresearch.org
Table 6: Metal Index: Johansen Cointegration Test
Hypothesized number of
cointegrating vectors
modular trace
statistic
modular critical values
at 5%
p-values
0 107.8731 29.7971 0.0000
At most 1 19.0884 15.4947 0.0137
At most 2 0.0086 3.8415 0.9225 (Source: eviews analysis)
Table 7: Energy Index: Johansen Cointegration Test
Hypothesized number of
cointegrating vectors
modular trace
statistic
modular critical values
at 5%
p-values
0 66.1480 29.7971 0.0000
At most 1 4.6902 15.4947 0.8408
At most 2 0.6027 3.8415 0.4375 (Source: eviews analysis)
Table 8: Sensex: Johansen Cointegration Test
Hypothesized number of
cointegrating vectors
modular trace
statistic
modular critical values
at 5%
p-values
0 38.4195 29.7971 0.0040
At most 1 5.9269 15.4947 0.7042
At most 2 0.3175 3.8415 0.5731 (Source: eviews analysis)
Having established that in all the indices the series represented by futures, spot and
interest rate are cointegrated, we present the cointegration regression statistic depicting the
coefficient values of the variables along with their respective p-values in tables IX to XI.
Table 9: Metal Index: Cointegration Regression Statistic
Variable Coefficient Modular t-statistic p-value
L(Spot) 1.0388 35.8638 0.0000
Rate -0.0043 3.012 0.0034 (Source: eviews analysis)
Table 10: Energy Index: Cointegration Regression Statistic
Variable Coefficient Modular t-statistic p-value
L(Spot) 0.9097 15.5094 0.0000
Rate 0.0083 1.3086 0.1942 (Source: eviews analysis)
Table 11: Sensex: Cointegration Regression Statistic
Variable Coefficient Modular t-statistic p-value
L(Spot) 0.9841 46.6941 0.0000
Rate 0.0166 14.6601 0.0000
(Source: eviews analysis)
We observe from the above tables that across all the three indices, the coefficient values
of L(Spot) are close to unity and statistically significant at 1%. However, the coefficient
values of rate appear to be close to zero and statistically significant in all scenarios with the
exception of energy index.
In order to test the single and joint hypotheses surrounding the cost-of-carry model, we
perform the Wald statistic (asymptomatically distributed as 2 i.e. Chi-square) of coefficient
restrictions. The Wald statistic is computed using the following equation.

International Review of Research in Emerging Markets and the Global Economy (IRREM)
An Online International Research Journal (ISSN: 2311-3200)
2015 Vol: 1 Issue 2
332
www.globalbizresearch.org
Wald Statistic (W) = 2
URSS
URSSRRSSn
k Eq. 6
where
n = number of observations
k = number of regressors in the unrestricted regression
RRSS = restricted residual sum of squares
URSS = unrestricted residual sum of squares
It is useful to note that in scenarios where a regression function involves finite samples
with the testable hypotheses being linear (as in H0: β1=1), the F-statistic and Chi-square yield
exactly similar values11
. By imposing a coefficient constraint in an unrestricted regression, we
seek to observe if the residual sum of squares would increase considerably. If indeed this is
the case, it would be concluded that the restrictions were not supported by the data leading to
rejection of the null hypothesis (Brooks, 2014). The W results are depicted in tables XII to
XIV.
Table 12: Metal Index: Wald test for Coefficient Restriction
Restriction Chi-square value p-values
C(α) = 1 1.7914 0.1808
C(β) = 1 495842.7 0.0000
C(α) = 1, C(β) = 1 1406496 0.0000 (Source: eviews analysis)
Table 13: Energy Index: Wald test for Coefficient Restriction
Restriction Chi-square value p-values
C(α) = 1 2.3673 0.1239
C(β) = 1 24517.70 0.0000
C(α) = 1, C(β) = 1 189810.6 0.0000 (Source: eviews analysis)
Table 14: Sensex: Wald test for Coefficient Restriction
Restriction Chi-square value p-values
C(α) = 1 0.5722 0.4494
C(β) = 1 754045.6 0.0000
C(α) = 1, C(β) = 1 842789.0 0.0000 (Source: eviews analysis)
From the above tables, we observe that while in all the cases the null hypothesis
surrounding α = 1 cannot be rejected, we are able to reject β = 1 in all the cases at a
significance level of 1%. . Accordingly, under the single hypothesis tests, we are able to reject
the cost-of-carry model. The joint hypothesis underlying α = β = 1 is rejected in all the three
cases at a significance level of 1%. We therefore reject the cost-of-carry model for all three
markets inferring that the commodities market represented by Metals and Energy fail to
exhibit the characteristics of efficiency and at the same time the equity capital markets
11
For linear regression models, with or without normal errors, there is of course no need to look at LM,
W and LR at all, sine no information is gained from doing so over and above what is already contained
in F (Davidson & MacKinnon, 1993)

International Review of Research in Emerging Markets and the Global Economy (IRREM)
An Online International Research Journal (ISSN: 2311-3200)
2015 Vol: 1 Issue 2
333
www.globalbizresearch.org
represented by Sensex also fails to conform to the market efficiency postulate. The results are
consistent with those observed by Joyeux & Milunovich (2010).
The above results reinforce the results derived from the many empirical studies that fail to
convincingly defend the existence of market efficiency across different categories of markets.
As evidence, it is often observed that participants in the financial markets often exploit the
advantage of price differential observed over the futures and spot securities. In the absence of
market efficiency, we would fail to encounter a scenario where arbitrage is perfect with the
consequence that the trader would invariably end up either earning abnormal profits or incur
abnormal losses.
6. Summary, Conclusions, and Scope for further research
In this paper, we investigate the postulate surrounding market efficiency surrounding
commodity markets using an empirical model represented by the cost-of-carry. In order to
support the veracity of the phenomena, we also apply the cost-of-carry model to the equity
markets. Both single hypothesis and joint hypothesis tests reject the cost-of-carry model
implying that in the absence of market efficiency, arbitrageurs should be in a position to
exploit the price differentials existing across futures and spot prices in both commodity as
well as equity markets in order to earn abnormal returns.
While arbitrageurs dealing in equities would be required to strictly operate within the
rules enshrined by the capital markets regulator (SEBI), the scope of scrutiny is by-far
restricted to a greater degree in commodities. Even while the commodity markets like MCX
are governed by Forward Markets Commission (FMC), in the absence of enactment of long
pending Forward Contract Regulation Act (FCRA) Amendment Bill, the regulator lacks the
requisite powers to exercise effective supervision over the operations surrounding commodity
markets12
.
In the wake of the recently unfolded scam in National Spot Exchange, regulators;
particularly in the commodity markets, should be mindful to a greater degree of scrutiny on
trading practices and put robust control systems in place in order to prevent occurrence of
market excesses in the future.
In this study, our inferences have been derived based on a shorter sample horizon. An
interesting extension would be to observe the feasibility of market efficiency over a longer-
horizon. Further, we have employed the cost-of-carry model to empirically examine the
market efficiency hypothesis. It would be meaningful to observe the impact of other popular
empirical models on results of market efficiency.
References
12
In recent times, policy makers within the Finance Ministry, Gov. of India have been evaluating the
proposal involving either according greater power to FMC through FCRA or alternatively scrap the
FCRA and seek merger of FMC with SEBI (Sinha, 2014).
International Review of Research in Emerging Markets and the Global Economy (IRREM)
An Online International Research Journal (ISSN: 2311-3200)
2015 Vol: 1 Issue 2
334
www.globalbizresearch.org
Beck, S. E., 1994. Cointegration and market efficiency in commodities futures market.
Applied Economics, Volume 26.
Brooks, C., 2014. A brief overview of classical linear regression. In: Introductory
Econometrics for Finance. Cambridge: Cambridge University Press, pp. 75-127.
Brooks, C., 2014. Introductory Econometrics for Finance. 3rd ed. Cambridge: Cambridge
University Press.
Crowder, W. J. & Phengpis, C., 2005. Stability of the S&P 500 futures market efficiency
conditions. Applied Financial Economics, Volume 15, pp. 855-866.
Davidson, R. & MacKinnon, J. G., 1993. Estimation and Inference in Econometrics. New
York: Oxford University Press.
DNA, 2012. Lok Sabha clears banking bill after govt drops futures trading clause. DNA
Money, December.
Elliott, G., Rothenberg, T. & Stock, J., 1996. Efficient-Test for for an Autoregressive Unit
Root. Econometrica, Volume 64, pp. 813-836.
Frontline, 2013. On the Spot Scam. Frontline, September.
Gujarati, D. N., Porter, D. C. & Gunasekar, S., 2009. Time Series Econometrics: Some Basic
Concepts. 5th ed. New York: McGraw Hill.
Hansen, L. P. & Hodrick, R. J., 1980. Forward Exchange Rates as Optimal Predictors of
Future Spot Rates: An Econometric Analysis. Journal of Political Economy, Volume 88, pp.
829-853.
Heaney, R., 2002. Does knowledge of the cost of carry model improve commodity futures
price forecasting ability?. International Journal of Forecasting, 18(1).
Hemler, M. L. & Longstaff, F. A., 1991. General Equilibrium Stock Index Futures Prices:
Thoery and Empirical Evidence. Jounral of Financial and Quantitative Analysis, 26(3).
Hull, J. C., 2014. Options, Futures, and Other Derivatives. 9th ed. s.l.:Prentice Hall.
Johansen, S. J., 1991. Estimation and hypothesis testing of cointegration vectors in Gaussian
vector autoregressive models. Econometrica, Volume 59, pp. 1551-1580.
Joyeux, R. & Milunovich, G., 2010. Testing market efficiency in the EU carbon futures
market. Applied Financial Economics, Volume 20, pp. 803-809.
Kellard, N., Newbold, P., Rayner, T. & Ennew, C., 1999. The Relative Efficiency of
Commodity Futures Markets. The Journal of Futures Markets, 19(4).
McKenzie, A. M. & Holt, M. T., 2002. Market efficiency in agricultural fuures markets.
Applied Economics, Volume 34.
MCX India, 2002. Physical Delivery Guide, Mumbai: MCX India.

International Review of Research in Emerging Markets and the Global Economy (IRREM)
An Online International Research Journal (ISSN: 2311-3200)
2015 Vol: 1 Issue 2
335
www.globalbizresearch.org
Serletis, A. & Scowcroft, D., 1991. Informational efficiency of commodity futures prices.
Applied Financial Economics, Volume 1.
Sinha, S., 2014. Bill to merge FMC, SEBI likely in Winter session of Parliament. Business
Line, September.
Yaganti, C. H. & Kamaiah, B., 2012. Hedging Efficiency of Commodity Futures Market in
India. The IUP Journal of Financial Risk Management, 9(2).
Exhibit 1: Volume of growth in all commodities
(Source: http://www.mcxindia.com)
Appendix I: Regression parameters observed over Metal, Energy, and Sensex indices
Regression Statistics underlying Metal Index Futures & Metal Index Spot
Regression Statistics
Dependent variable: Metal Index Futures
Adjusted R2
value 0.9653
Standard error 23.7486
F-statistic 2474.3021*
(0.00000)
*Significant at 1%
Regression Statistics underlying Energy Index Futures & Energy Index Spot
Regression Statistics
Dependent variable: Energy Index Futures
Adjusted R2
value 0.9724
Standard error 40.9061
F-statistic 3138.5033*
(0.00000)
*Significant at 1%
Regression Statistics underlying Sensex Futures & Sensex Spot
Regression Statistics
Dependent variable: Sensex Futures
Adjusted R2
value 0.8939
Standard error 143.3937
F-statistic 431.0239*
(0.00000)
*Significant at 1%
0
100000000
200000000
300000000
400000000
500000000
20
04
20
05
20
06
20
07
20
08
20
09
20
10
20
11
20
12
20
13
Traded Contracts
(in Lots)
Year
Traded Contracts in all Commodities
Traded Contracts (in Lots)