Embed Size (px)
Citation preview

An Empirical Approach to Economic Intelligence in World War IIAuthor(s): Richard Ruggles and Henry BrodieSource: Journal of the American Statistical Association, Vol. 42, No. 237 (Mar., 1947), pp. 72-91Published by: American Statistical AssociationStable URL: http://www.jstor.org/stable/2280189Accessed: 05/12/2009 15:38
Your use of the JSTOR archive indicates your acceptance of JSTOR's Terms and Conditions of Use, available athttp://www.jstor.org/page/info/about/policies/terms.jsp. JSTOR's Terms and Conditions of Use provides, in part, that unlessyou have obtained prior permission, you may not download an entire issue of a journal or multiple copies of articles, and youmay use content in the JSTOR archive only for your personal, non-commercial use.
Please contact the publisher regarding any further use of this work. Publisher contact information may be obtained athttp://www.jstor.org/action/showPublisher?publisherCode=astata.
Each copy of any part of a JSTOR transmission must contain the same copyright notice that appears on the screen or printedpage of such transmission.
JSTOR is a not-for-profit service that helps scholars, researchers, and students discover, use, and build upon a wide range ofcontent in a trusted digital archive. We use information technology and tools to increase productivity and facilitate new formsof scholarship. For more information about JSTOR, please contact [email protected].
American Statistical Association is collaborating with JSTOR to digitize, preserve and extend access to Journalof the American Statistical Association.
http://www.jstor.org

AN EMPIRICAL APPROACH TO ECONOMIC INTELLIGENCE IN WORLD WAR II
RICHARD RUGGLES Harvard University
AND
HENRY BRODIB, Department of State
In early 1943 the Economic Warfare Division of the Ameri- can Embassy in London started to analyze marklngs and serial numbers obtained from captured German equipment in order to obtain estimates of German war production and strength. This report is the story of the development of this technique in terms of the problems which arose and the ways in which they were solved.
Various kinds of captured enemy equipment were studied by this technique. The first product to be so analyzed was tires, and after this tanks, trucks, guns, flying bombs, and rockets were studied. Aircraft markings were not studied by the Eco- nomic Warfare Division, since, by previous agreement, the British Air Ministry bore the responsibility for all estimates on aircraft production. The uses of the intelligence derived from the markings were varied. At times it helped decide the target systems of the air forces; on other occasions it gave indications of German strength in weapons such as tanks and rockets.
After the war official statistics on German war production became available, so that it is now possible to evaluate the accuracy of the estimates which were made. Part II presents a summary scatter diagram of the estimates and official data along with a more detailed treatment of certain estimates.
E CONOMIC intelligence in World War II played an important and varied role during the conflict with Germany. Information as to
Germany's war potential was the frame of reference which shaped the pattern of allied mobilization and strategy. Knowledge of the quanti- ties and types of war materiel possessed by the enemy was needed to fix the timing of the invasions and to plan the kind of warfare which was to be waged. In addition, both aggregative data about German industry and highly detailed facts about individual plants and products were very necessary to carry out the allied strategic bombing program as conceived at the Casablanca Conference. Behind each attack of the Eighth Air Force over Europe lay extensive research, involving such considerations as the essentiality of various German war products;
72

ECONOMIC INTELLIGENCE IN WORLD WAR II 73
the exact location, relative importance, and output rates of various producers; the length of time elapsing between the separate production processes and consumption of the finished article by the army; substi- tutability of various products; the availability of alternative production facilities; and finally recuperation rates of industries suffering from direct bomb damage.
During the early phases of the war, Allied economic intelligence proved inadequate for the many needs it had to serve. Aggregative es- timates of German production were based either on prewar data ex- trapolated according to British or American experience, or else on standard tables of equipment requirements derived from German order of battle estimates. Neither method proved reliable, because the models which were developed permitted numerous degrees of freedom which could only be restricted by using highly unrealistic or rigid assump- tions. Consequently even the order of magnitude of many aggregative estimates proved to be in serious error. Data on specific plants within an industry were no better. Secret sources and interrogations yielded large masses of contradictory reports. Some of these reports undoubtedly were accurate, but it was impossible for the analyst to discover these in the flood of rumors and false statements that crossed his desk. For any plant, intelligence data could be found that would support any given output rate of a product. As a result the analyst always perforce fell back to estimating what seemed to be reasonable, so that here again intelligence was bent to the preconceptions in our own minds, rather than to objective facts.
Part I of this article describes the historical development and prob- lems of a technique of economic intelligence which sought to overcome the basic inadequacies of other types of intelligence. This technique involved analyzing the markings found on enemy equipment in order to obtain useful information about German armaments production. In Part II, the reliability of the estimates achieved by this analysis have been assessed on the basis of official German production records which have since become available.
I
Each piece of enemy equipment, whether main assemblies or com- ponent parts, was liberally labelled with markings inscribed either on the equipment itself or on attached nameplates. Such markings varied as to completeness and included all or some portion of the following in- formation: (a) the name and location of the marker, (b) the date of manufacture, (c) a production serial number, and (d) miscellaneous

74 AMERICAN STATISTICAL ASSOCIATION
markings such as trade marks, mold numbers, casting numbers, etc. The purpose of these markings was twofold. First, they furnished inf or- mation necessary to maintain an effective check on production standards. Faulty performance of equipment in the field due to defects of manufacture could readily be traced back to the original source and corrected. Second, some of the markings were essential for proper spare parts control. However, these same markings, if subjected to proper analysis, offered Allied intelligence officers a wealth of information about Germany industry.
ESTIMATION OF GERMAN TIRE PRODUCTION
Tire Markings. The technique of analyzing these equipment mark- ings as a source of information on German industry developed inf or- mally out of the liaison between Economic Warfare Division of the American Embassy' and the British Ministry of Economic Warfare. British experts working on the German rubber industry had accumu- lated a sample of markings from about 2000 enemy tires. These had been taken from German aircraft shot down over Britain and from supply dumps of aero and motor vehicle tires captured in North Africa. In the main, the markings had been used by the British to identify German tire manufacturers, since the maker's name was always in- scribed clearly on each tire. In addition to the maker's name, however, every tire bore a serial number and a two letter code for the date of manufacture. An array of the data for each manufacturer indicated that the tires were numbered systematically. However, it was still a matter for conjecture whether or not reliable production data could be obtained by solving the date codes and relating them to the systems of numbering. The British had attempted some investigations in this direction, but shortage of manpower forced them to concentrate their energies on more immediately pressing questions. By agreement with them, a small number of American analysts were allowed to work with this sample of data.
Manufacturing dates on tires. The first step in analyzing tire markings involved breaking the two letter date codes. These codes were not used by the Germans as a wartime security measure; their purpose was to indicate to the manufacturer and dealer the date when a tire was made without revealing it to the purchaser. Since there were two letters, it was assumed that one represented the month and the other the year
1 The Economic Warfare Division of the American Embassy (EWD) was a centralized intelligence agency in direct contact with British agencies. Its personnel consisted of analysts loaned by the Office of Strategic Services, the Foreign Economic Administration and the State department.

ECONOMIC INTELLIGENCE IN WORLD WAR II 75
of manufacture. The further assumption that there should be 12 letter variations for the month code and probably three to six for the year code also seemed reasonable if simple substitution codes were used. On this basis, the month code was distinguished from the year code by reason of its greater variation (12 variations if the sample were large enough). The fact that the tires were numbered serially helped break some of the month codes. Where the tires were numbered in a continu- ous increasing series, a simple array of the cases by number would reveal the order of month letters with any given year letter. If suf- ficient cases existed the code would be solved. Where the sample of a particular make of tire was too small for that purpose, other code solu- tions suggested themselves. Thus, it was apparent that some manufac- turers based their month codes on words or simple arrangments of letters. Examples of this are given below:
Jan Feb Mar Apr May Jun Jul Aug Sep Oct Nov Dec
Dunlop T I E B R A P 0 L N U D Fulda F U L D A M U N S T E R Phoenix F 0 N I X H A M B U R G Semperit A B C D E F G H I J K L
Month dates on tires. The Dunlop code was Dunlop Arbeit spelled backwards, and Fulda and Phoenix used the letters of the firm name and the location of the central office. Semperit employed a simple continu- ous alphabetical series. The largest tire company, Continental, pre- sented a more difficult case. The letters in the month date code were sufficient to spell Braunschweig, a city where the central officers were located. However, if the sample were arrayed serially, the month code became merely an anagram of Braunschweig. This possibility appeared unrealistic at the time since the date codes were probably not intended to be so obscure as to require the use of a code book. However, if it was assumed that the cases were dated according to Braunschweig spelled either forward or backward, then production appeared to be numbered in scattered individual monthly bands rather than in one continuous increasing series. This dilemma of the Con- tinental date code was solved only at a later date when sufficient cases were obtained to prove that the standard deviation of the gaps between monthly bands was of no greater magnitude than the standard devia- tion of the gaps existing between the cases within monthly bands. On this basis, it was concluded that no gap existed between monthly bands, and all tires were numbered in a single continuous series. Thus, the Braunschweig anagram as indicated by serial arrangement of the

76 AMERICAN STATISTICAL ASSOCIATION
cases was found to be correct. Year dates on tires. The solutionof year codesvaried fordifferentmanu-
facturers. Some tire sizes (especially for aircraft) were known to be new types, and so could be dated. Other tires appeared to be part of the original equipment which itself was dated. For some companies, the year 1939 could be identified by the sharp drop in tire production conse- quent upon conversion to the production of military types. Once relia- ble dates were established for one manufacturer, the distribution of cases in the sample for other manufacturers often revealed their year codes.
Results of the analysis of tire markings. After the individual tires were dated and the numbering system solved, then production figures could be obtained. It was found that five manufacturers produced over 70% of the total German tire output. With a sample of about 1400 cases for these five producers, individual monthly output figures were obtained for each in all but a few months over a period from 1939 to mid-1943. The output of two additional manufacturers producing 10% of the total could be estimated for scattered months in 1941 and 1942. Production of the four manufacturers contributing the remaining 20% was estimated in round figures solely on the basis of their relative im- portance in the sample. An indication that the sample was sufficiently representative for this purpose had already been given by the fact that each major producer was represented in the sample in direct proportion to the serial number estimate of his production.2
After this methodology had been established by the foregoing sample of 2000 cases and a report had been issued in October 1943, systematic collection of tire markings was undertaken. By July 1944, more than 11,000 cases had been obtained. These were sufficient to raise monthly serial number analysis to a 98% coverage of the industry, and on this basis a very comprehensive report was issued. After July 1944, as new
2 Before this fact could be determined, aircraft tires had to be separated from truck tires in the sample. Aircraft tire production as revealed by serial number analysis was 15%, but in the sample almost 50% of the markings were from aircraft tires. In other words, tires from aircraft shot down over England bulked large in the sample. Fortunately, only three German producers made aircraft tires. By separating aircraft and truck tire markings, the two samples thus appeared to represent all the German tire manufacturers in their due proportions. The first strong indication of this was the fact pointed out above that the representation of the major producers in the sample was proportional to their serial number estimates. Secondly, tire markings in the sample indicated that all known tire plants in Germany were represented. Almost all tire production was in a few standard sizes of aircraft and truck tires, so that specialized types were only a small proportion of the total output and of the sample. Factories did not specialize in certain types of tires (except as noted in aircraft tires) so this eliminated this possibility of bias. From the general representativeness of the sample it was deduced that the location of plants was not important in the distribution of tires to the various fronts. One ele- ment that would have lessened the possibility of bias from this factor was the fact that many Germain units went to Africa from Russia and took their equipment with them.

ECONOMIC INTELLIGENCE IN WORLD WAR II 77
cases were received, periodic reports were issued bringing production estimates of individual manufacturers up to date. However, no addi- tional studies were made covering the industry in general since enough information already had been distilled from the data to meet most of the intelligence requirements. Further overall studies would have yielded mere academic refinements without altering the basic picture materially.
Mold number analysis. Besides yielding output data, markings on German tires provided other useful economic intelligence. A special study of mold numbers on tires made it possible to estimate the manu- facturing capacity by type of tire for each German producer. Manufac- turers numbered the tire molds in simple continuous series usually starting with the number 1 and using a separate series for each tire size. These numbers are indentations on the inside of the mold and therefore appear as raised numerals on the carcass of the tire. With the large tire sample at hand it was possible to calculate the number of molds for each tire size which individual German producers had used. Then, using British manufacturers' experience on the daily tire ca- pacity of a single mold, it was a simple matter to estimate the produc- tion capacity of each German producer.
The fairly accurate figures of German tire production by sizes yielded by the serial number and mold number studies also made it possible to obtain information on the rate of the enemy's rubber con- sumption. From markings on tires which indicated the percentage of natural rubber used, it was possible to obtain a picture of how Ger- many was utilizing her crude rubber stocks. Finally, the estimates of aero tire production by types provided a valuable check for analysts calculating German aircraft output.
Use of tire estimates. The chief significance of the tire markings analy- sis was that it afforded for the first time a reasonably accurate picture of German tire production by individual makers. This information pro- vided a firm basis for assessing the importance of the German tire in- dustry as an air target system. Although the initial tire study was based on a sample representing only about 3/10 of one per cent of the universe, a number of factors supported the accuracy of the findings. First, representation of individual producers in the total sample was proportionate to their production as estimated by serial number analysis. Second, the deviations in monthly output for individual pro- ducers were of reasonable relative magnitudes. They showed the period of conversion, the way in which production fell off sharply, and then built up to a level considerably below the peacetime peak. This was to

78 AMERICAN STATSTICAL ASSOCIATON
be expected since military tires are larger and more difficult to make than civilian tires. Third, production estimates for any one month well represented in the sample showed a high degree of stability even when based on only a fraction of the cases for that month selected at random.
In addition to bringing about a major revision in the aggregative tire output estimates, serial number analysis also furnished intelligence officers working on enemy target systems with a great deal of relevant material. The location and importance of each producer was now known, as well as the length of time elapsing between the manufacture of tires and their use by the army. While the first tire report was in preparation one plant was bombed. The study showed the monthly output figures for this plant before and after the attack, and thus furnished a valuable check on the results of the bomb damage.
ESTIMATION OF GERMAN TANK PRODUCTION
The significant results yielded by analysis of markings on tires indi- cated that the same technique might be employed for other types of enemy military equipment. The American analysts, therefore, directed their attention to markings on German tanks. Tank markings were available from a number of sources. Documents captured in North Africa included German tank log books. These books contained the chassis and engine serial numbers of the tanks to which they belonged, along with the date of manufacture and the name or code of the as- sembler. Papers captured at divisional headquarters sometimes in- cluded lists of the tank holdings of specific armored units, enumerating types and chassis serial numbers of individual tanks. Captured records of German tank repair depots reported the chassis and engine serial numbers of every tank repaired. Also, spare parts order books and other technical publications issued by the Wehrmacht listed tank chassis serial number bands to indicate exactly the various models of spare parts required for different tanks. Finally, some tank markings had been recorded in North Africa by technical intelligence field personnel inspecting captured equipment, and a few German tanks were available for more detailed examination in both England and United States. From all of these sources, about 1200 tank chassis serial numbers were obtained along with more detailed markings for a small number of vehicles.
Tank serial number bands. Unlike tires, tanks were not numbered in separate series for each manufacturer. Rather a different series was used for each type of tank without regard to the maker. Thus all Mark I tanks fell in the series 0 to 20,000, all Mark IIs in the series

ECONOMIC INTELLIGENCE IN WORLD WAR II 79
20,000 to 30,000, and so on. When the cases in any particular series were arranged in an array, it became evident that some central author- ity had allotted the various producers one or more bands of numbers within the series. However, further analysis revealed that the bands allotted to individual producers were not necessarily fully used. When the bands were broken down by round blocks of 100 numbers, it was observed that different models of the same type tank never appeared within the same 100 block. From the point of view of facilitating spare parts control, this was logical, since tank models then could be re- ferred to in spare parts catalogues by range of chassis numbers given in terms of round figures. It meant, however, that gaps existed between the last tank chassis number of a particular model or design and the beginning of the next hundred block. Since the Germans were continu- ally shifting their designs and models, this fact was of considerable con- sequence in estimating production. The only apparent solution to this problem lay in the analysis of the distribution of the cases within each 100 block. If the non-utilization of higher numbers in the 100 blocks was significant, then a sample of serial numbers should show concentra- tion of cases in the lower parts of 100 blocks rather than a scattered even distribution. The following table indicates that this proved to be true.
RELATIVE FREQUENCY OF TERMINAL DIGITS
Mark I Mark II Mark III Mark IV
%,q of cases in sample ending in digits 00-25 37 42 30 29 % of cases in sample ending in digits 26-50 28 33 27 30 % of cases in sample ending in digits 51-75 17 15 23 30 % of cases in sample ending in digits 76-100 18 10 20 11
Total 100 100 100 100
With the above table it was relatively simple to compute the degree to which the 100 blocks were utilized for the numbering of each type of tank and from this to estimate actual production. It is apparent that the sample was fairly representative of the universe of the data since although a lower quartile might be equalled it was never significantly exceeded by a higher quartile. An independent check on the accuracy of the tank production figures calculated as described above was pro- vided by estimates of tank engine production based on engine serial numbers.
Tank manufacturers' codes. Identification of individual producers was complicated by the fact that after 1940, for purposes of security, arbi- trary three letter codes were substituted for the name or trade mark of

80 AMERICAN STATISTICAL ASSOCIATION
the assembler on the tank. Fortunately, the tanks made earlier bore the assemblers' name in the clear, and thus provided a basis whereby the codes could be solved. It was observed that each assembler used a distinctive nameplate. Some firms used copper name plates whereas others used plastic, steel or zinc. The style of printing on these plates was also quite individual. Most assemblers failed to change these dis- tinguishing characteristics of their plates when they were required to use a code instead of their name or trademark. Krupp at Magdeburg was careless enough merely to file the company name and trademark off the old nameplate and then stamp on instead the new code "bqo". Some assemblers careful enough to change the style of, their plates revealed themselves by continuing to use previously identified serial bands to number their tanks. Others were identified on the basis of the Wehrmacht acceptance system. Every tank had to be tested by a Wehrmacht inspector before it was accepted. One or more inspectors were located at each tank assembly plant. These signified their accept- ance of a vehicle by stamping their individual inspector's number on it. When the tank assembler's names were coded these acceptance stamp numbers were not changed, and thus provided a basis for identi- fication of the codes. Finally, one or two assemblers were identified by the Germans themselves. The assembler's name instead of the code was written in some tank log books; even where this document had been separated from the tank, the serial number indicated the band which was used by that manufacturer, and reference to other tank chassis numbers in the same band broke the code.
Results of the analysis of tank markings. The first tank report yielded less detailed information than the tire report, but it was no less com- prehensive. Annual tank production by type was obtained for the years 1939-42. The number and relative importance of the various as- semblers also was determined. Analysis of tank engine markings indi- cated that two manufacturers were responsible for 100% of Germany's engine production. The significance of this early tank study, just as in the case of the tire report, lay in the fact that its findings differed ra- dically from accepted intelligence. At this time the accepted estimate of cumulative total German tank production was about 40,000; serial number analysis revealed that this was a gross overestimation; not more than 14,000 tanks had been produced. The 1942 production rate, originally accepted as being about 18,000, was estimated by the serial number technique as being only 3,400. In other words, Allied intelli- gence still suffered from the myth of German invincibility created by Nazi propagandists out of the successful blitzkrieg tactics in Poland and

ECONOMIC INTELLIGENCE IN WORLD WAR II 81
France, and it had grossly overestimated the enemy's position; the serial number technique revealed this fact and introduced realism in our picture of the strength of the German war machine. Furthermore the number and importance of the various producers, hitherto un- known, was now revealed.
Utilization of other tank markings. Following the first tank report, intensive examination of captured tanks revealed other markings be- sides chassis and engine serial numbers which proved very useful guides to estimating production. Gearbox markings were a case in point. Analysis of a sample of markings indicated that each type.of tank used gear boxes numbered in either one or two simple increasing and un- broken series. This presented a very different situation from chassis serial numbers where the production series for each tank type were broken up into a large number of discontinuous bands. Accordingly relatively few cases were needed to determine gearbox production ac- curately since the problem of measuring the gaps in the series was ob- viated. Once gearbox production had been calculated, the production of tanks could be estimated, by taking gearbox replacements into ac- count. Besides checking and improving on the accuracy of the estimates of tank output derived from chassis serial numbers, gearbox markings also provided a means of obtaining accurate tank output information on the basis of as few as one or two tanks. In short, the gearbox mark- ings of one relatively new German tank offered the same possibilities of bringing the production estimates up to date as a large sample of chassis serial numbers from new tanks. Using gearbox markings, the November 1944 production of the Mark V tanks was known by Janu- ary 1945.
Other markings on tank guns, radiators, turret motors, bogie wheels, etc., provided additional series which both increased the accuracy and reliability of the estimates and at the same time reduced the size of the sample of tanks required. Tank chassis markings showed only the year of assembly and even this date was dropped for some tanks produced during the later stages of the war. This complicated the accurate esti- mation of rates of production. However, component parts markings yielded a variety of month and year dates which enabled closer esti- mates of tank assembly dates to be made. For example, if a tank was captured at the front in December 1944 and the inspection dates on parts and components ranged from June 1944 to October 1944, then assembly probably took place in November 1944, assuming that none of the dated parts were replacements. By careful analysis it was possible to estimate the tank industry pipe line-the time elapsing between the
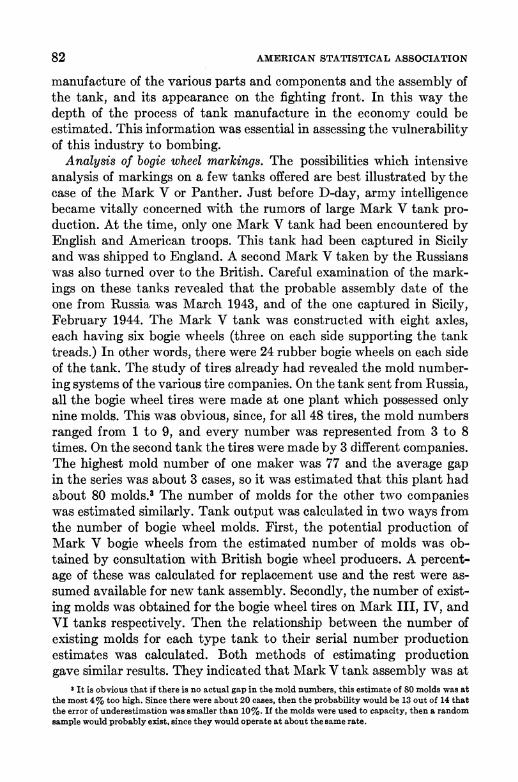
82 AMERICAN STATISTICAL ASSOCIATION
manufacture of the various parts and components and the assembly of the tank, and its appearance on the fighting front. In this way the depth of the process of tank manufacture in the economy could be estimated. This information was essential in assessing the vulnerability of this industry to bombing.
Analysis of bogie wheel markings. The possibilities which intensive analysis of markings on a few tanks offered are best illustrated by the case of the Mark V or Panther. Just before D-day, army intelligence became vitally concerned with the rumors of large Mark V tank pro- duction. At the time, only one Mark V tank had been encountered by English and American troops. This tank had been captured in Sicily and was shipped to England. A second Mark V taken by the Russians was also turned over to the British. Careful examination of the mark- ings on these tanks revealed that the probable assembly date of the one from Russia was March 1943, and of the one captured in Sicily, February 1944. The Mark V tank was constructed with eight axles, each having six bogie wheels (three on each side supporting the tank treads.) In other words, there were 24 rubber bogie wheels on each side of the tank. The study of tires already had revealed the mold number- ing systems of the various tire companies. On the tank sent from Russia, all the bogie wheel tires were made at one plant which possessed only nine molds. This was obvious, since, for all 48 tires, the mold numbers ranged from 1 to 9, and every number was represented from 3 to 8 times. On the second tank the tires were made by 3 different companies. The highest mold number of one maker was 77 and the average gap in the series was about 3 cases, so it was estimated that this plant had about 80 molds.3 The number of molds for the other two companies was estimated similarly. Tank output was calculated in two ways from the number of bogie wheel molds. First, the potential production of Mark V bogie wheels from the estimated number of molds was ob- tained by consultation with British bogie wheel producers. A percent- age of these was calculated for replacement use and the rest were as- sumed available for new tank assembly. Secondly, the number of exist- ing molds was obtained for the bogie wheel tires on Mark III, IV, and VI tanks respectively. Then the relationship between the number of existing molds for each type tank to their serial number production estimates was calculated. Both methods of estimating production gave similar results. They indicated that Mark V tank assembly was at
8 It is obvious that if there is no actual gap in the mold numbers, this estimate of 80 molds was at the most 4% too high. Since there were about 20 cases, then the probability would be 13 out of 14 that the error of underestimation was smaller than 10%. If the molds were used to capacity, then a random sample would probably exist, since they would operate at about the same rate.

ECONOMIC INTELLIGENCE IN WORLD WAR II 83
a rate of 270 per month by February 1944 if tank assembly was oc- curring at the capacity of bogie wheel production. After the war it was found that actual production in this month was 276. On the basis of the bogie wheel analysis, probable Mark V strength was calculated, and thus the Western Allies were forewarned that they would encounter this tank in larger quantities than originally anticipated.
After the first tank report was issued, continued analysis along the lines indicated above and the accumulation of larger and more recent samples of markings yielded a steady flow of new information on Ger- man tank production. The upward trend of tank production was ac- curately reflected by the estimates based on markings.
OTHER ANALYSIS OF MARKINGS ON GERMAN EQUIPMENT
Refinement in the collection and analysis of markings. The work done on tank markings greatly furthered the theory of serial number analysis in general, and brought about important revisions in both the methods of collection and the analysis of data. Originally, markings had been gathered more or less indiscriminately Without too much regard for their significance for purposes of analysis. Consequently, valuable markings frequently were overlooked while much time was spent re- cording useless information. Accordingly, steps were taken to overcome these obvious deficiencies of collection procedure. After some study of enemy equipment and analysis of their markings, forms were made up with places for forty to fifty important groups of markings on each type of equipment. Manuals with examples and photographs of each type of marking accompanied these forms so that uniformity might be achieved by the field teams. A system of filing these cards was designed in Lon- don to facilitate analysis. Charting the markings as they came in pro- vided a method whereby any contradiction or extension of previous estimates would be immediately revealed.
Analysis of motor vehicle markings. After the experience gained on tires and tanks, the work of serial number analysis was extended to motor vehicles, guns, ammunition, special components, and finally to flying bombs and rockets. A report on German motor vehicle produc- tion, including half-tracked vehicles, based on about 4000 cases, was released in April 1944.4 As in the first sample of tank serial numbers, the majority of these cases (75%) came from captured documents. The motor vehicle industry was more complex than either the tire or tank industries. It comprised almost 50 producers who turned out over 70
4 This sample contained a little over 1% of total production for the time period (1942) which was most fully covered.

84 AMERICAN STATISTICAL ASSOCIATION
different models of vehicles. The estimates covered the entire industry giving annual output figures by maker for each model of vehicle for the years 1940, 1941 and 1942. The data were not sufficient to yield a full coverage of the industry for 1943. Additional cases received later ex- tended many of the estimates, but since the salient facts about the motor vehicle industry had been revealed, there was no real need for further comprehensive studies along this line, in view of the limited strategic significance of the industry.
Analysis of gun markings. Serial number analysis of guns was not undertaken on the same broad scale as tires, tanks and motor vehicles. The German ordnance industry never was seriously regarded as a target system and the main interest in guns, aside from technical con- siderations, centered about production of a few special types.5
Analysis of ammunition markings. Analysis of markings on ammuni- tion followed the same general lines as that on guns. Investigations were undertaken with a view to answering specific questions raised by the military rather than to providing over-all coverage of the in- dustry. Thus at one stage of the war ground intelligence reports and prisoner of war interrogations suggested that the Germans might be suffering from a shortage of ammunition. If this were the case, some phase of the industry might offer a good target system. Determi- nation of the length of time elapsing between the manufacture of ammunition and its consumption by the army offered a concrete meth- od of checking on the reliability of the rumored shortages. If this time period was short, it would indicate production was used for immediate consumption and stockpiles were low. Each piece of ammunition was marked with the exact day of assembly, so the analysis of captured ammunition stocks in the various theatres shed considerable light on this question. It was found that except for a few types of ammunition the German "pipe-line" was more than adequate. The so-called general shortages, it was later determined, were caused by transporta- tion difficulties in specific areas rather than insufficient production per se. In any case, the "pipe-line" analysis was instrumental in causing the ammunition industry to be rejected as a target system. Other informa- tion yielded by analysis of ammunition markings included the number and importance of assemblers and fuse makers.
Analysis of flying bomb (V-i) markings. Analysis of markings on flying bombs (V-1) was undertaken as soon as these weapons were launched against London. A special form and manual of instructions
5 Guns had as many as six components, all of which were marked serially. This made analysis possible on quite small samples. However, the use of codes prevented the identification of some gun producers.

ECONOMIC INTELLIGENCE IN WORLD WAR II 85
were prepared which provided for the recording of over 100 markings from various identifiable remains of flying bombs. It was found that the system used to number the final assemblies was too complicated relative to the size of the sample to yield reliable production estimates. Basically, therefore, the analysis depended on the numbering of main components, such as air grids and the fuel controls. Production figures so derived were consistent with each other and showed a sharply rising trend. This result, however, was inconsistent with the known rate of launchings, and, during the war, satisfactory explanation for this di- vergence was lacking. Later it was discovered that although the produc- tion of components occurred as was indicated by serial number analy- sis, the assembly of flying bombs did not take place at the same rate. Shortage of sheet metal was a bottleneck which prevented the rate of assembly from equalling component production. Analysis of V-1 mark- ings revealed that the industry had no target potentialities. Production was found to be dispersed among some 50 component makers.
Analysis of rocket (V-2) markings. Estimates of rocket production (V-2) presented fewer difficulties than the V-1 despite the limited num- ber of cases available for examination.6 Production was numbered in a simple continuous series and the final assembly number was stencilled or stamped on several components. Since no assembly dates were indi- cated the time of manufacture was placed between the latest date on the component parts and the date the rocket fell. The earliest rocket analysis was;based on only seven cases, the most complete study on 25 cases, yet the resultant production estimates later proved to be com- pletely reliable. Estimates of rocket output were made with a time lag of only about two weeks between the issue of the study and the produc- tion period covered. While there appeared to be only one assembler of the rocket it could not be identified. As with the V-I, component parts manufacture was found to be unduly dispersed.
I The first German V-2 rocket was examined by EWD staff long in advance of the rocket launch- ings against England. A rocket fell in Sweden and the parts were flown to England for examination. Over 200 sets of markings were found on these pieces and each of these was studied in order to aid in later identification of relevant series to be collected. Manufacturers' identifications were conspicuously lacking on this experimental rocket. However, a very small inspector's stamp indicated that inspector 109 inspected the venturi (the opening for the jet). Files on other types of equip'ment (filed by inspection numbers) revealed that this same die 109 had been used on certain types of heavy shells. Fortunately the manufacturer had inscribed his code 'aux" on these shells. Another file (equipment filed by manu- facturer) revealed that "aux" had made a large number of various kinds of ammunition with several other inspection marks. The inspection mark files were again consulted and several of these inspection marks were found Lo be associated with the symbol 'P*" in the periodbefore the coding system came into effect. This symbol "P*" was looked up in the second file again and a group of items were found, some of which were made as early as 1938. At this time this firm was the sole maker of special types of ammuni- tion (they introduced a 2 cm anti-aircraft shell of a special type) and thus was easily identified as Polte in Magdeburg. Thus it was decided that the large venturi of this rocket was produced in this factory. After the war it was verified that they had done this work.

86 AMERICAN STATISTICAL ASSOCIATION
II
In Chart I, the estimates of production of German equipment based on serial number analysis and the comparable official output data ob-
CHART I. A SCATTER DIAGRAM OF THE ACCURACY OF INDIVIDUAL ESTIMATES, BY TYPE AND MODEL AND BY YEAR
FOR SEVEN TYPES OF MILITARY EQUIPMENT
tooI,,..,III/
90
0
80
OVERESTIMATED AREA 70 +
o 60
50
=QX~~~~~~~~~~~~ v c 0 x v *
W 40 _o
U x j l)UNDERESTIMATED AREA 30
x +
x x
U + 20
0 10
ox 0
o 10 20 30 40 50 60 70 80 90 l00
* One unit-20 rockets ACTUAL PRODUCTION o One unit-25000 tires * One unit-50 tanks + One unit-100 half tracks x One unit-200 motor vehicles v One unit-50 guns o One unit-50 self-propelled guns
tained from the Speer Ministry are given. The estimates and the cor- responding data are plotted in a scatter diagram. Correct estimates lie on the 450 line. Only those estimates which are individual and unrelated

ECONOMIC INTELLIGENCE IN WORLD WAR II 87
to each other have been plotted. Thus yearly estimates by type or model of equipment have been used instead of aggregate figures. This shows the estimates in their most critical light since errors tend to balance out if cumulative aggregates covering long periods of time are used. It will be observed that all estimates in which there were large errors were too low. For more than 90 per cent of the estimates, however, the errors were not sufficiently large to impair the validity of the analysis.
The summary character of Chart I does not fully portray the ac- curacy of the results achieved by serial number analysis. It is not pro- posed here to review the accuracy of the estimates in complete detail, but for purposes of clarification some aspects of the estimates are ampli- fied below.
1. Tires. The study issued in July, 1944, covered German monthly production of truck, passenger car, and aero tires through the first quarter of 1943. The following table compares the accuracy of these first quarter estimates with Speer Ministry statistics of average monthly production for all of 1943.
Estimated Average Actual Average Percentage Type of Tire Monthly Production, Monthly Produc- Error
Jan.-Mar. 1943 tion, 19431
Truck and Passenger car 147,000 159,700 8%- Aero 28,500 26,400 8%+
Total 175,500 186,100 6%-
1 It is quite possible that production of trucks for the first quarter was different than the average for the year. However it is known that production was quite steady throughout 1943, so these official figures serve as an approximation for the first quarter.
The accuracy of the serial number estimates can be better appreci- ated from the fact that Allied intelligence agencies, by other methods, had placed production at between 900,000 and 1,200,000 tires a month. The significance of the wide disparity in these estimates for purposes of target selection and determination of Germany's overall rubber requirements is obvious. Estimated output of individual pro- ducers did not achieve quite the same degree of accuracy as the figures of total production. However, they clearly established the order of im- portance of individual makers. Individual plant estimates tended to be slightly high. This was probably due to the fact that the serial number

88 AMERICAN STATSTICAL ASSOCIATON
bands of these makers included motor cycle as well as truck, passenger and aero tires.
2. Motor Vehicles. The most comprehensive study of German motor vehicle production was issued in April 1944. It included estimates of output by type and maker of trucks and half-tracks from 1940 through 1942. Coverage of half-track production was extended through 1944 in a subsequent report.
(a) Trucks. Complete data on German production of all types of trucks were not available for comparison with serial number estimates. Speer Ministry figures were obtained, however, for 1942 output, and these are compared with the estimated figures for the same year in the following table:
Type of Truck Eistimated Produc- Speer Ministry Percentage tion for 1942 Statistics Error
Light truck 16,600 14,436 15%+ Medium truck 62,300 53,439 17% + Heavy truck 18,500 11,952 35%+
Total 97,300 79,827 22%+
From the above table, trucks appear to be an exception to the general rule that serial number analysis tended to underestimate German production. However, a consistent tendency to overestimate produc- tion is not revealed by comparison of a number of individual plant estimates with the production figures shown in individual plant records. In almost all these cases the estimates did not exceed actual production. This suggests the possibility that the Speer figures include only truck production for direct military use. Regardless of whether or not this is the case, however, the estimates for truck production provided at least a good approximation of German output. The previously held opinion of intelligence agencies placed truck production in the neighborhood of 200,000 vehicles per annum. On an individual plant level the estimates, to the extent that they could be checked, showed extreme accuracy in assessing the relative importance of firms and listing the types they made.
(b) Half-tracks. A report issued in March 1945 covered German half-track production by type and company from 1941 through 1944. The estimates were quite accurate, as is shown by the following com- parison of estimated with actual annual production for the 4 year period:

ECONOMIC INTELLIGENCE IN WORLD WAR II 89
Estimated Speer Ministry Percentage Year Production Statistics Error
1941 7,850 8,436 7%- 1942 9,500 10,150 6%- 1943 17,000 16,971 2%+ 1944 14,500 17,134 15%-
Total 48,900 52,691 7%-
Production estimates by maker and type of vehicle showed almost the same degree of accuracy as the annual totals.
3. Tanks. The record of tank serial number estimates is extremely good in comparison with other estimates of tank production made by Allied intelligence agencies. In the table below, estimated average monthly production for 1940-42 based on serial numbers is compared with estimates taken from Munitions Record No. 24, 10 August 1942, and with corresponding figures from the Speer Ministry. The figures given in Munitions Record No. 24 represented the combined views of American and British intelligence agencies at that time.
Estimated Monthly Production Monthly Production
Date Serial Number Munitions Record Speer Estimate 10 Aug. 42 Ministry
June, 1940 169 1000 122 June, 1941 244 1550 271 August, 1942 327 1550 342
Some indication of the accuracy with which the relative importance of individual makers was assessed is indicated in the following compari- son of estimated distribution of Mark V (Panther) production during 1944 compared with actual distribution:
Maker Estimated Actual
Maschinenfabrik Augsburg-Nilrnberg A.G. 40% 35% Daimler-Benz A.G. 29% 31% Maschinenfabrik Niedersachsen-Hanover A.G. 28% 31% Other 3% 3%
Only in the case of assault guns mounted on tank chassis were serial number estimates wide of the mark. Estimates of 1940 and 1941 assault gun production (Sturmgeschutz) erred by -18%. However, the 1942 and 1943 estimates underestimated production by 71% and 62% re-

90 AMERICAN STATISTICAL ASSOCIATION
spectively. These errors were largely due to the fact that collection of markings on this kind of equipment was neglected in the field,7 so that no cases existed for many types of Sturmgeschutz. This situation was never corrected, and greater emphasis continued to be given to tanks.
4. Guns. As already pointed out, production estimates were made for only a few types of German guns, and complete official output figures were not available to check on the accuracy of all of these estimates. Estimates of three types of 7.5 cm guns were checked against Speer Ministry statistics. The comparison is as follows:
Estimated Actual Percentage Type Year Production Production Error
7.5 cm. Pak 40 1942 2200 2112 4%+ 7.5 cm. Kwk 40 1944 3300 3360 2%- 7.5 cm. Kwk 42 1944 3350 4210 20%-
The above figures were sufficient to indicate that the serial number technique was applicable to guns.
5. Flying Bombs and Rockets. The Speer Ministry statistics on flying bomb (V-1) production were found to be radically inconsistent with even partial reports from the individual assembly plants. As a result no accurate aggregative statistics exist for V-1 production. Documents and interviews, however, revealed that there had been about 12,000 bombs produced by the time the first one was launched against Eng- land. The serial number estimate was fairly accurate for this period, since it indicated that 13,000 flying bombs had been produced. The Germans had planned for a peak production of 6000 weapons a month, but it is believed that the rate of completions never exceeded 3000 a month due to lack of sheet metal for final assembly. In other words, actual production in June and July 1944 was probably not in excess of 6000, whereas the serial number estimate for these two months was 18,000. The large error resulted from the fact that there was little correlation between component parts production, on which the estimate was based, and the rate of final assembly. Apparently the original component part:s program was in full swing before the sheet metal bottleneck developed. Presumably, after a time, component
7 In fact, one of the collectors had a reputation for being "Panther-happy." The doubtfulness of the Sturmgeschutz estimates was known, and these estimates were in direct contradiction to gun estimates made concurrently. The gun estimates reflected the true level of Sturmgeschutz production, but these fig- ures were not adopted.

ECONOMIC INTELLIGENCE IN WORLD WAR II 91
parts production would have been curtailed and the error in the es- timates detected. However, the flying bomb production was too short- lived after this bottleneck developed (about 3 months) for this adjust- ment to work itself out.
Rocket (V-2) production estimates proved to be more accurate. The following is a comparison of estimated and actual production.
Estimated Actual Percentage Production Production Error
Up to 15 Sep. 1944 670 (minimum) 1900 65% - 15 Sep. -29 Oct. 1944 1030 900 14%+ 29 Oct. -24 Nov. 1944 700 600 17% + 24 Nov.-15 Jan. 1945 1100 1100 0 15 Jan. -15 Feb. 1945 700 700 0
The first rocket report underestimated total production by 1230. This error was due to the fact that a large number of early experimental rockets were used up in tests, and were never fired on England or Bel- gium. These experimental models were numbered in a different series from those fired on England and Belgium. That the method of serial number analysis of rockets was correct is apparent from the fact that the estimates for subsequent periods had a maximum error of 17% and twice were completely accurate.
The relative accuracy of the serial number estimates indicates that this method of analysis was a valid and valuable source of economic intelligence. Within the limits of its capabilities, the technique of an- alyzing markings on enemy equipment was superior to the more ab- stract methods of intelligence such as reconciling widely divergent prisoner of war reports, basing production estimates on pre-war cap- abilities or projecting production trends based on estimates of the degree of utilization of resources in the enemy country.