Embed Size (px)
Citation preview
An Empirical Application of the Austrian School’s “Stages of Production”
Cameron M. Weber
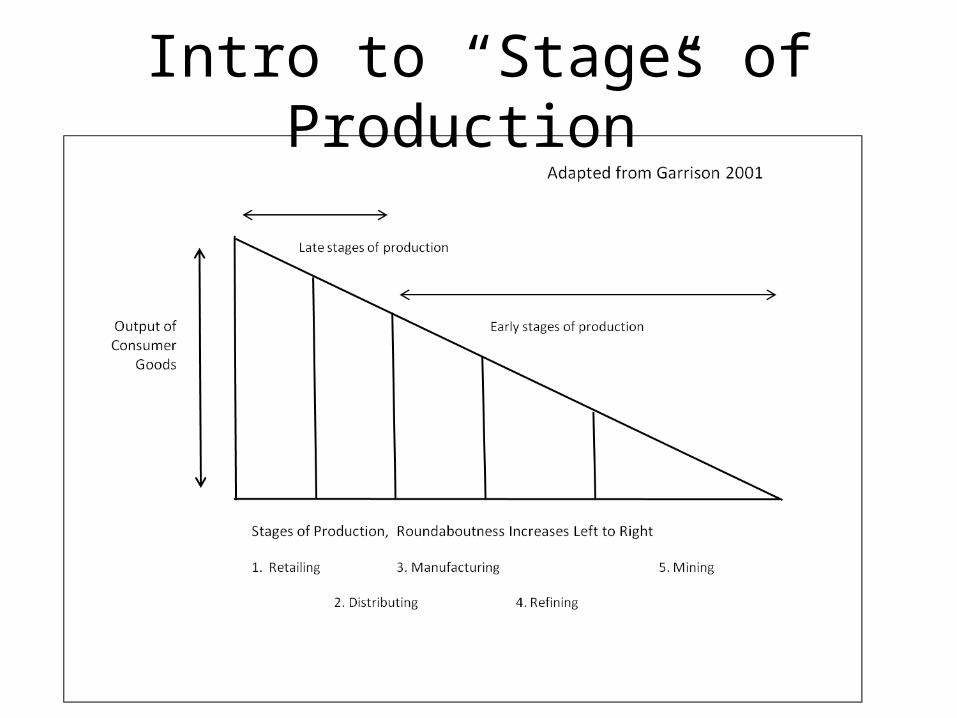
Intro to “Stages of Production”
It scarcely, perhaps, requires to be proved that the capitalist production of consumption goods, although carried out in roundabout ways and by many stages, does not, on that account, cease to exhibit an intimately connected and united work of production.
– Eugen v. Bohn-Bawerk (1888)
An Empirical Application of the Austrian School’s “Stages of Production”
• Intro to Stages of Production• Calculating an ‘Average Period’• Stylized Facts• Empirical Analysis• What Went Wrong?• Simplified Two-Stage Analysis• Findings
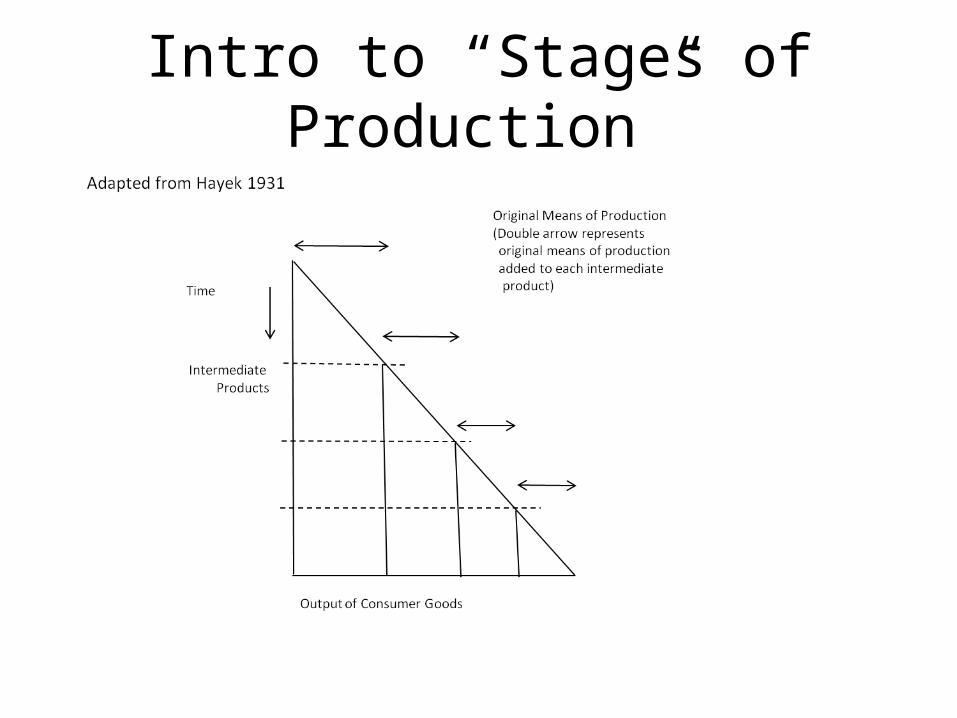
Intro to “Stages of Production”
Intro to “Stages of Production”
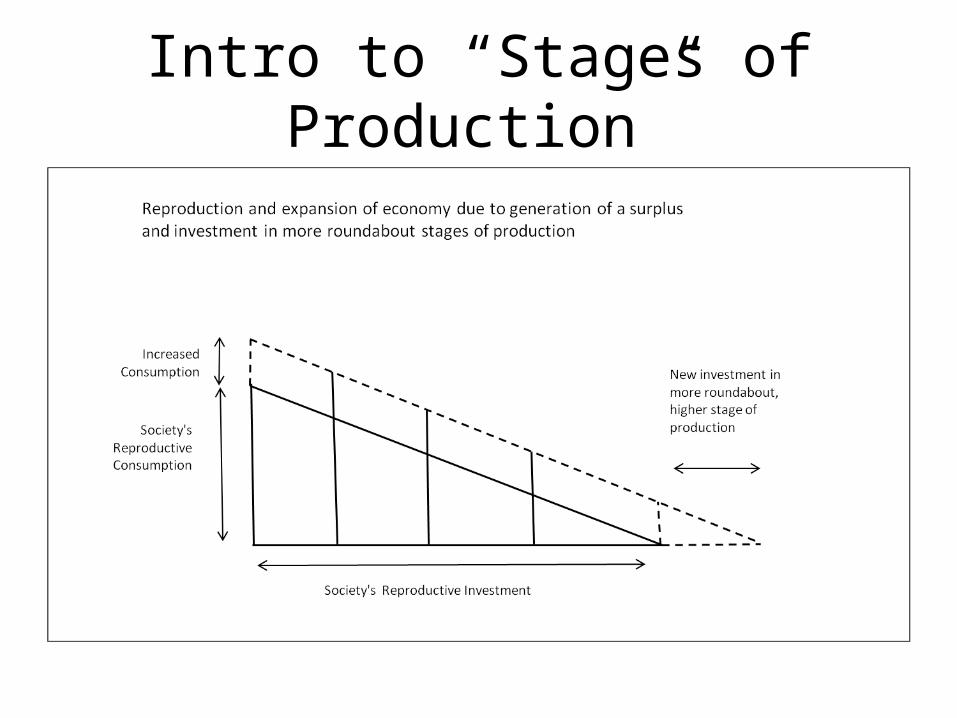
Intro to “Stages of Production”
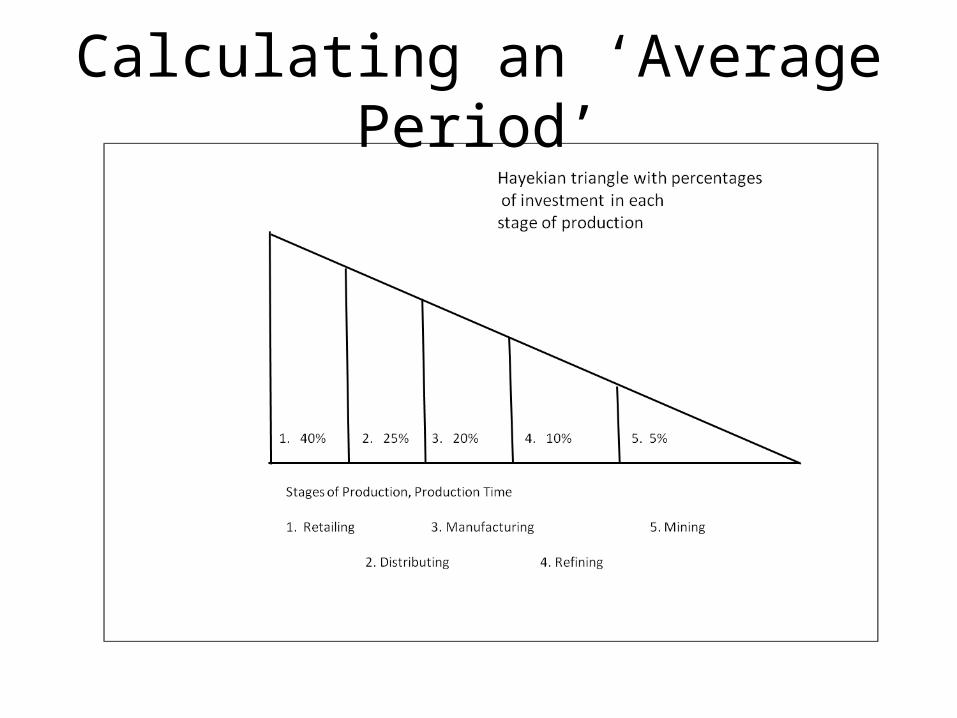
Calculating an ‘Average Period’
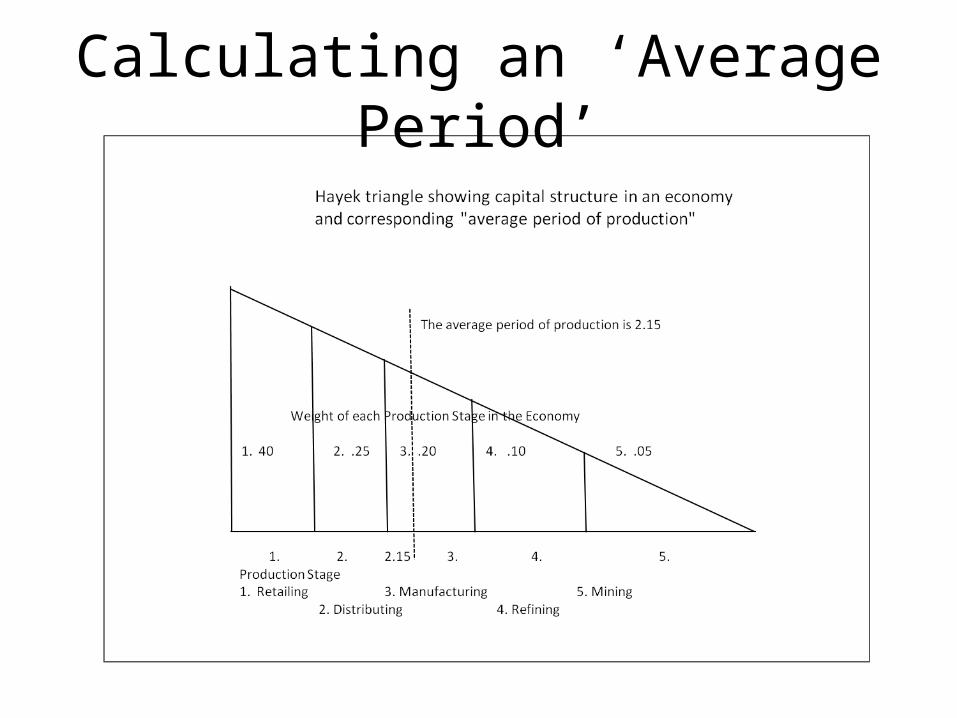
Calculating an ‘Average Period’

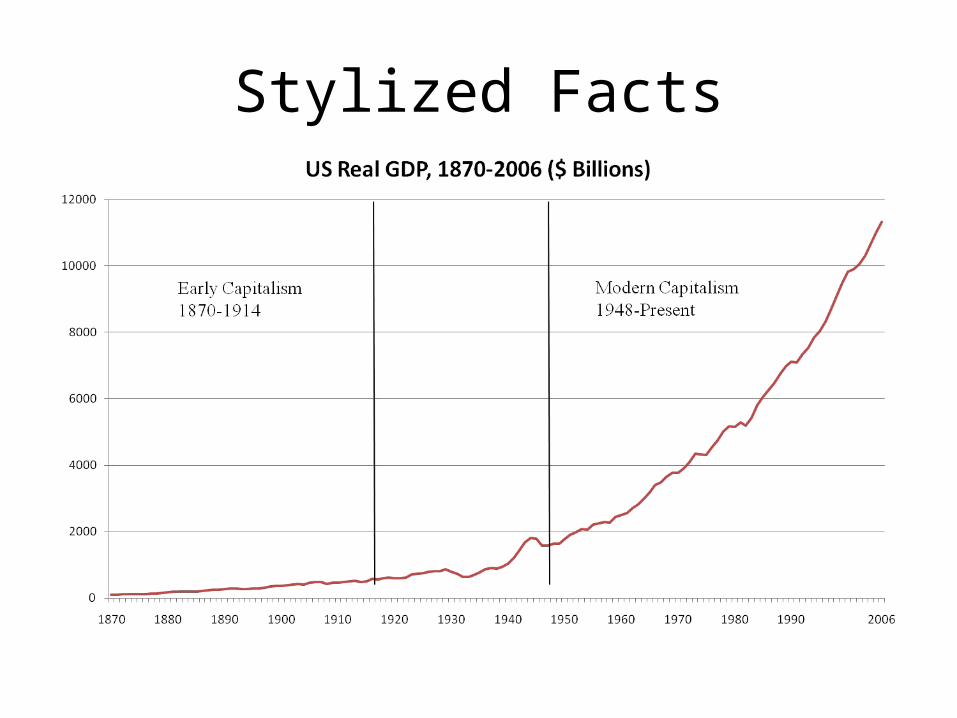
Stylized Facts
• In “early capitalism” government was around 4% of the economy, in “modern capitalism” government is greater than 30% of the economy
• “Modern capitalism” has shown a rise in the FIRE sectors (finance, insurance and real estate) compared to “early capitalism”.
Stylized facts from Edward Nell
Stylized Facts
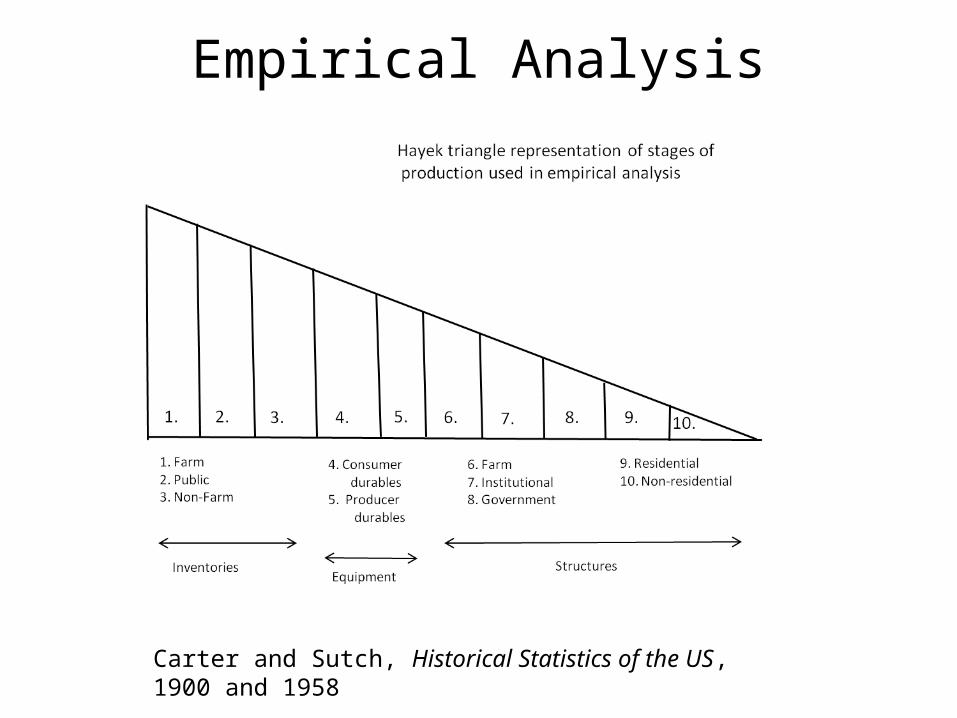
Empirical Analysis
Carter and Sutch, Historical Statistics of the US, 1900 and 1958
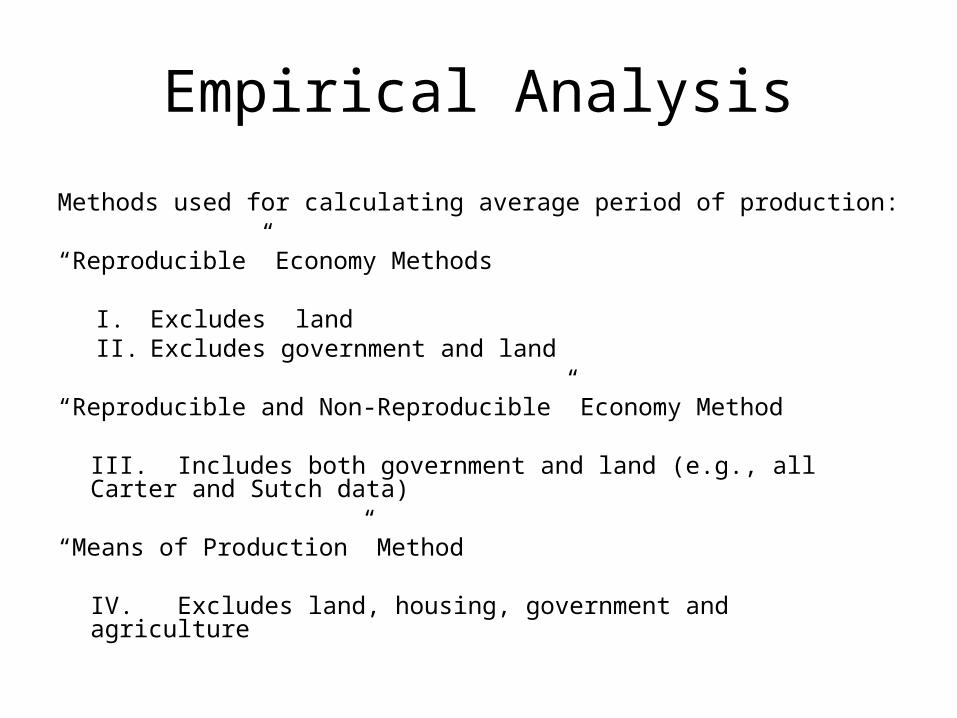
Empirical Analysis
Methods used for calculating average period of production: “Reproducible” Economy Methods
I. Excludes landII. Excludes government and land
“Reproducible and Non-Reproducible” Economy Method
III. Includes both government and land (e.g., all Carter and Sutch data)
“Means of Production” Method
IV. Excludes land, housing, government and agriculture
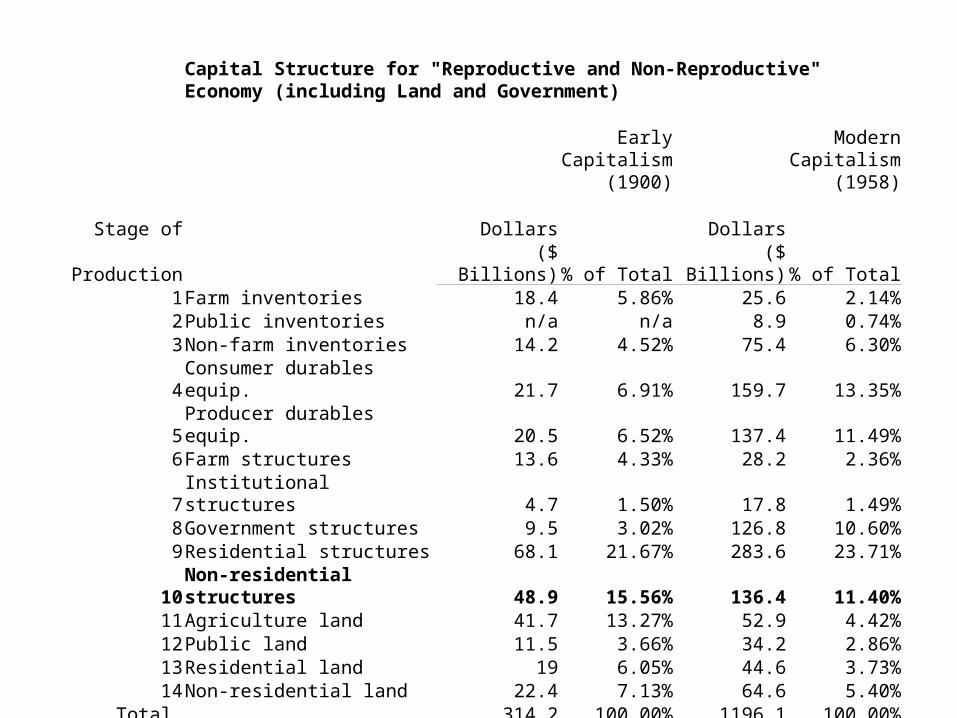
Capital Structure for "Reproductive and Non-Reproductive" Economy (including Land and Government)
Early Capitalism
(1900)
Modern Capitalism
(1958)
Stage of Dollars DollarsProduction ($ Billions) % of Total ($ Billions) % of Total
1Farm inventories 18.4 5.86% 25.6 2.14%2Public inventories n/a n/a 8.9 0.74%3Non-farm inventories 14.2 4.52% 75.4 6.30%4Consumer durables equip. 21.7 6.91% 159.7 13.35%5Producer durables equip. 20.5 6.52% 137.4 11.49%6Farm structures 13.6 4.33% 28.2 2.36%7Institutional structures 4.7 1.50% 17.8 1.49%8Government structures 9.5 3.02% 126.8 10.60%9Residential structures 68.1 21.67% 283.6 23.71%
10Non-residential structures 48.9 15.56% 136.4 11.40%11Agriculture land 41.7 13.27% 52.9 4.42%12Public land 11.5 3.66% 34.2 2.86%13Residential land 19 6.05% 44.6 3.73%14Non-residential land 22.4 7.13% 64.6 5.40%
Total 314.2 100.00% 1196.1 100.00%
Average period of production 8.35 7.57
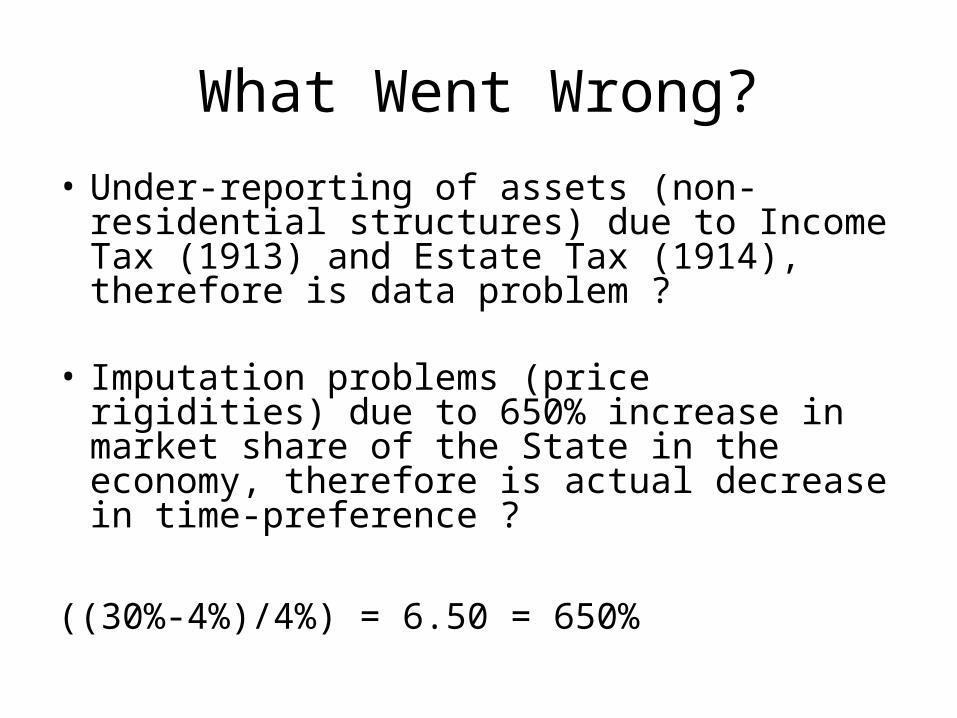
What Went Wrong?• Under-reporting of assets (non-residential
structures) due to Income Tax (1913) and Estate Tax (1914), therefore is data problem ?
• Imputation problems (price rigidities) due to 650% increase in market share of the State in the economy, therefore is actual decrease in time-preference ?
((30%-4%)/4%) = 6.50 = 650%
What Went Wrong?
We must look at the price system as such a mechanism for communicating information if we want to understand its real function—a function which, of course, it fulfils less perfectly as prices grow more rigid.
Hayek (1945), “Use of Knowledge in Society”
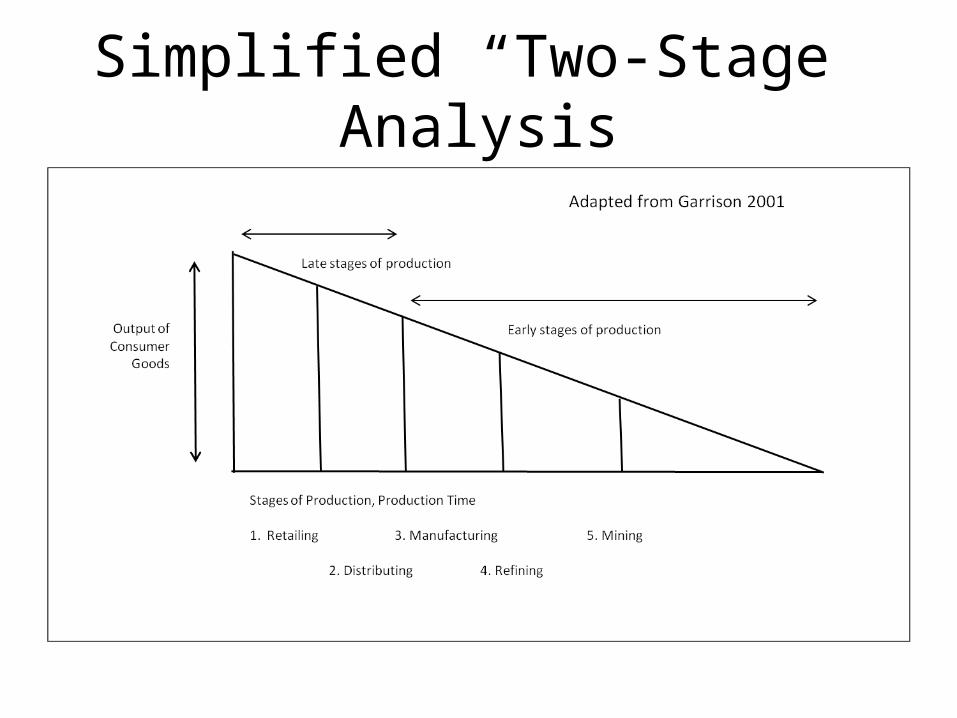
Simplified “Two-Stage” Analysis
Simplified “Two-Stage” Analysis
Removes counter-incentives for asset reporting under welfare state tax scheme because there is incentive to over-report Cost of Goods Sold and under-report Long-Term Assets.
Removes imputation problems because longer-stages require more price flexibility.
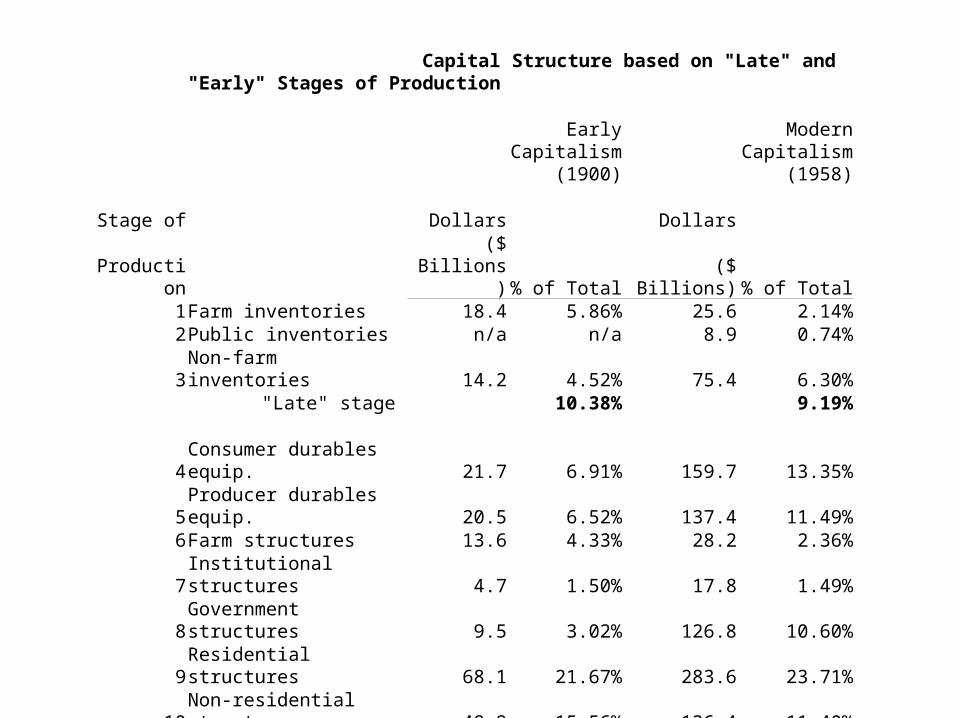
Capital Structure based on "Late" and "Early" Stages of Production
Early Capitalism
(1900)
Modern Capitalism
(1958)
Stage of Dollars DollarsProduction ($ Billions) % of Total ($ Billions) % of Total
1Farm inventories 18.4 5.86% 25.6 2.14%2Public inventories n/a n/a 8.9 0.74%3Non-farm inventories 14.2 4.52% 75.4 6.30%
"Late" stage 10.38% 9.19%
4Consumer durables equip. 21.7 6.91% 159.7 13.35%5Producer durables equip. 20.5 6.52% 137.4 11.49%6Farm structures 13.6 4.33% 28.2 2.36%7Institutional structures 4.7 1.50% 17.8 1.49%8Government structures 9.5 3.02% 126.8 10.60%9Residential structures 68.1 21.67% 283.6 23.71%
10Non-residential structures 48.9 15.56% 136.4 11.40%11Agriculture land 41.7 13.27% 52.9 4.42%12Public land 11.5 3.66% 34.2 2.86%13Residential land 19 6.05% 44.6 3.73%14Non-residential land 22.4 7.13% 64.6 5.40%
"Early" stage 89.62% 90.81%
Total 314.2 100.00% 1196.1 100.00%
Findings
Increase in “late stage” of production from 89.62% of capital stock in 1900 to 90.81% in 1958 is not significant enough to refute possibility that time-preference has increased in modern welfare state.
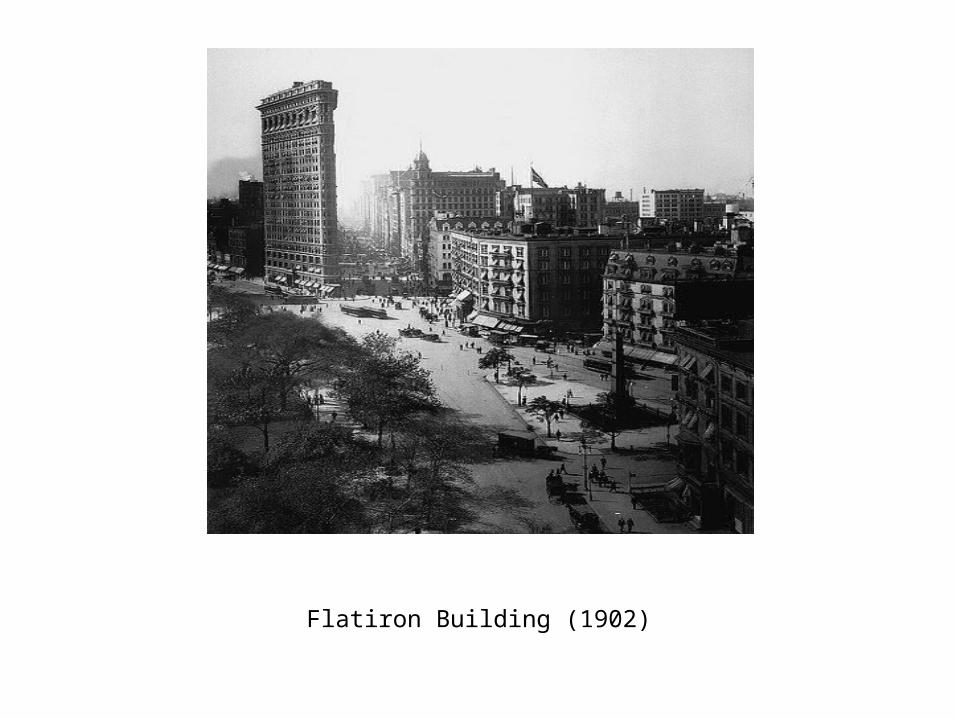
Flatiron Building (1902)
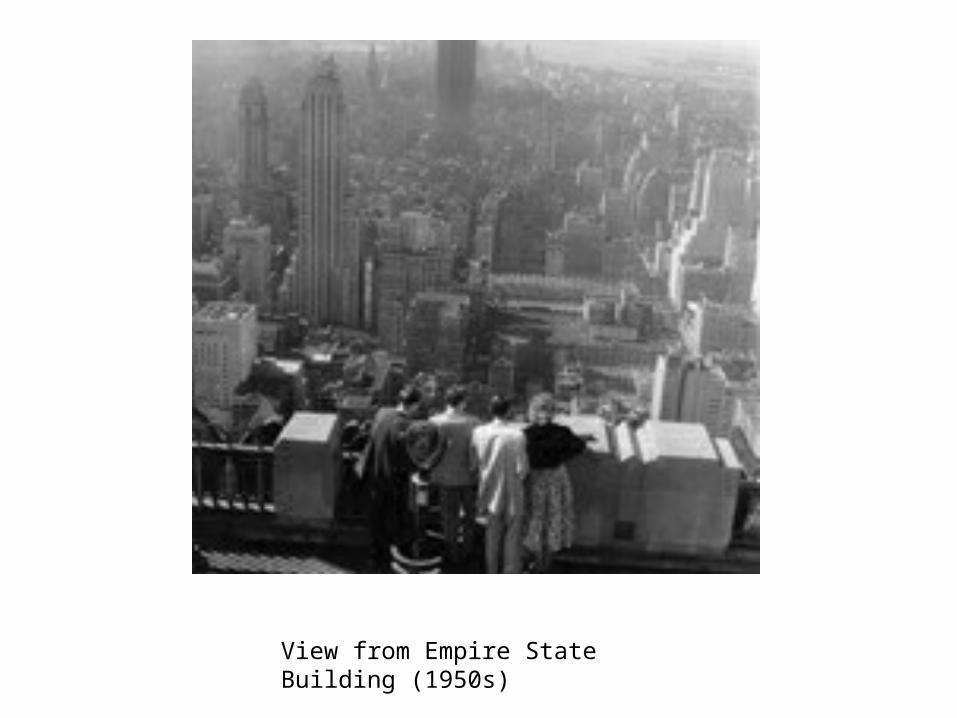
View from Empire State Building (1950s)
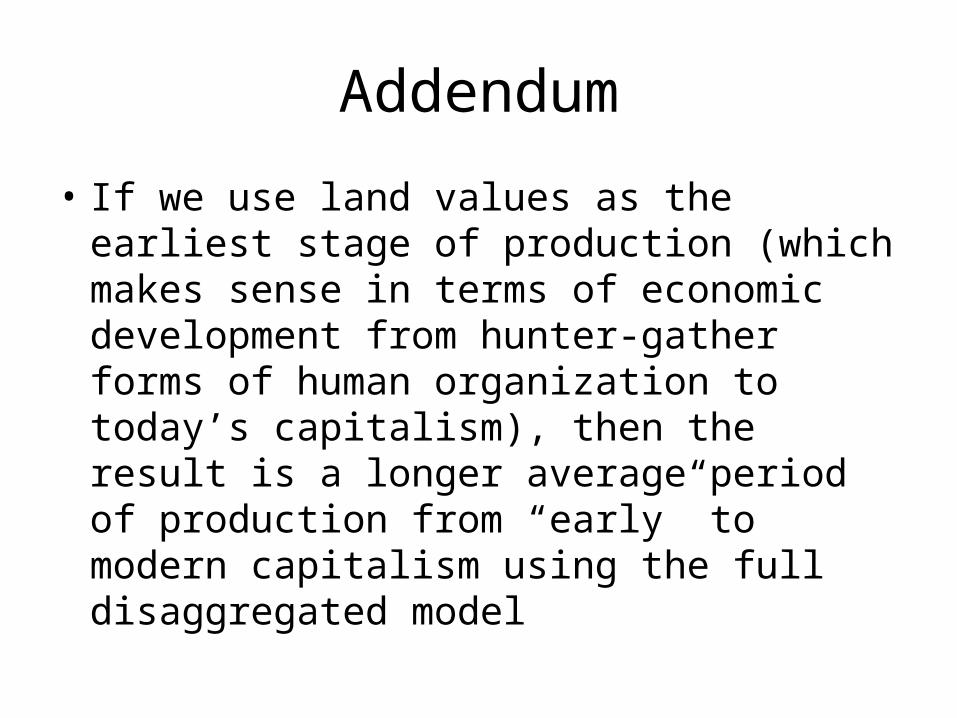
Addendum
• If we use land values as the earliest stage of production (which makes sense in terms of economic development from hunter-gather forms of human organization to today’s capitalism), then the result is a longer average period of production from “early” to modern capitalism using the full disaggregated model
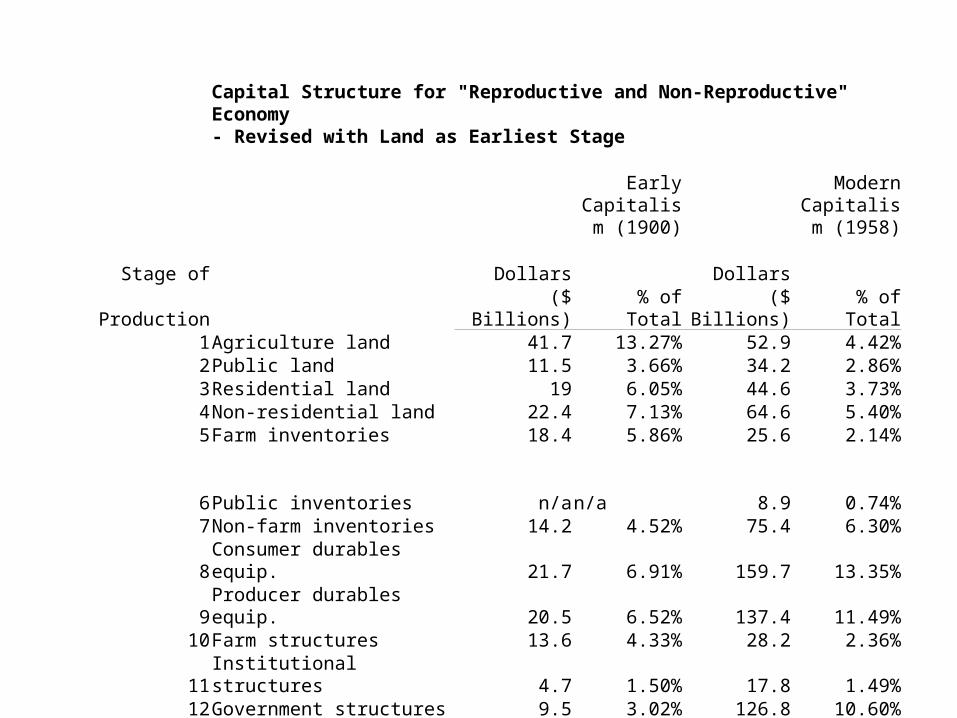
Capital Structure for "Reproductive and Non-Reproductive" Economy - Revised with Land as Earliest Stage
Early Capitalism
(1900)
Modern Capitalism
(1958)
Stage of Dollars DollarsProduction ($ Billions) % of Total ($ Billions) % of Total
1Agriculture land 41.7 13.27% 52.9 4.42%2Public land 11.5 3.66% 34.2 2.86%3Residential land 19 6.05% 44.6 3.73%4Non-residential land 22.4 7.13% 64.6 5.40%5Farm inventories 18.4 5.86% 25.6 2.14%6Public inventories n/a n/a 8.9 0.74%7Non-farm inventories 14.2 4.52% 75.4 6.30%8Consumer durables equip. 21.7 6.91% 159.7 13.35%9Producer durables equip. 20.5 6.52% 137.4 11.49%
10Farm structures 13.6 4.33% 28.2 2.36%11Institutional structures 4.7 1.50% 17.8 1.49%12Government structures 9.5 3.02% 126.8 10.60%13Residential structures 68.1 21.67% 283.6 23.71%14Non-residential structures 48.9 15.56% 136.4 11.40%
Total 314.2 100.00% 1196.1 100.00%
Average period of production 8.38 9.47