Embed Size (px)
Citation preview
7/18/2019 An Empirical Analysis of the PLM Implementation Effects in the Aerospace Industry
http://slidepdf.com/reader/full/an-empirical-analysis-of-the-plm-implementation-effects-in-the-aerospace-industry 1/9

7/18/2019 An Empirical Analysis of the PLM Implementation Effects in the Aerospace Industry
http://slidepdf.com/reader/full/an-empirical-analysis-of-the-plm-implementation-effects-in-the-aerospace-industry 2/9
automatically lead to their effective deployment at the organiza-
tional level, because of the effects related to network externalities
[7,8] and learning-by-using among adopters [9].
At a strategic level, there can be a negative impact if
management misjudges the effort required. Moreover, the success
of any PLM implementation (and consequently its strategic
outcomes) depends on organizational characteristics. These are
markedly different across firms, and this can significantly alter the
implementation strategy and its outcomes.
The research question faced in the paper is to analyze PLM
implementation effects at different levels. In particular, the paper
theorizes and empirically validates the existence of three distinct
dimensions (operational, organizational, and strategic) in the
implementation and their interactions. Besides these elements
that are more deeply considered in the paper, the entire research
regarded, also other factors affecting PLM assimilation such as
learning-by-using effects, end users’ acceptance of the technology,
etc. The underlying idea is that, through this analysis, it is possible
to make the relations among the elements which can lead to
effective PLM implementations emerge.
The first part of the paper is based on literature review, with the
objective of identifying the diverse dimensions of the problem and
the focal points of the analysis. The second step is represented by
the construction of a theoretical model that summarizes thedifferent perspectives coming from literature. Starting from the
main PLM system functionalities declared in literature, the paper
proposes three incidence matrices for analyzing effects interac-
tions, and then investigates the impact of PLM on individual work,
on organizational processes and at a strategic level. Finally, the
three dimensions of PLM effects are investigated by an explorative
study in a large enterprise operating in the aerospace industry. The
last section deals with conclusions and managerial implications.
2. Literature review
Many contributions in academic literature and among practi-
tioners give different definitions of PLM and propose a number of
viewpoints, which can be summarized in Table 1. The table doesnot refer to specific areas of PLM implementation, but to diverse
investigation perspectives. The main aspects which are objects of
investigation in literature are the implementation industrial
scenario [1], approaches [2], operative modalities [3] and
implementation effects [4].
At the same time, two main perspectives are present, depending
on whether contributors focus on adopters (i.e., a ‘‘demand-side’’
perspective) or on systems and their vendors (i.e., a ‘‘supply-side’’
perspective). Considering the industrial scenario [1], the demand-
side perspective focuses on drivers that lead firms to adopt PLM
systems (e.g. [10]) or integrated managerial approaches to NPD
process (e.g. [11]). Conversely, a supply-side perspective, quite
often found in practitioner-oriented papers (e.g. [12]), focuses on
enabling technologies. In this context it is possible to recognize
two technological trajectories, one that views PLM as a progressive
broadening of the scope of CAD systems (e.g. the one proposed by
Dassault/IBM, Siemens/UGS, Enovia, think3, etc.), the other as a
specific module of enterprise systems (e.g. SAP PLM; Oracle PLM,
etc.).
Concerning implementation approaches [2], a first stream
concerns a top-down perspective on the NPD process and
considers PLM a holistic and strategic activity addressing many
components such as products, organizational structure, working
methods, processes, people and information systems [4]. The
second stream is related to a bottom-up perspective, leading from
tools to problems. It considers that knowledge of available tools
can allow finding appropriate solutions for company-specific
problems. This perspective identifies PLM as a set of tools for
gathering, managing, spreading and using information and
knowledge on products. It focuses on specific technological
solutions, and is stressed by consultants and business analysts
(for a survey, see [13]).
Some authors [14,15] claim that PLM should be approached
through these two perspectives together. The implementation of tools without the comprehension of strategy and business
processes cannot be useful, just like the application of business-
level PLM fundamentals without an adequate knowledge of the
supporting technologies.
This dichotomy is present also when dealing with implemen-
tation operative modalities [3]. According to the first perspective,
the key focus should be on understanding and eventually re-
engineering the business processes in which products are
developed [14,15]. According to the other perspective, implemen-
tation decisions should be guided by the features and functionali-
ties of IT applications (e.g. product data management systems, data
exchange and collaboration technologies). In this sense, firms must
look for the specific applications they need, and not all possible
tools will be adopted.At last, a somewhat limited amount of research contributions
has been dedicated to investigate the effects, in term of benefits
and problems, of PLM implementation [4].
One way is to assess the impact of PLM in improving
effectiveness, efficiency and control of the NPD process. It regards
the reduction of design mistakes [16], the improved possibility of
design alternative comparisons [13,14,16], a better understanding
of product architecture and components features [13], the
achievement of design parameter optimization [17], the reuse of
past design information (e.g. [14,16,18]), the anomaly detection in
Table 1
Investigation perspectives on PLM in literature.
Implementation industrial scenario [1] Implementation approaches [2] Implementation
modalities [3]
Implementation effects [4]
Demand side Basic drivers
- Saaksvuori and Immonen [16];
- Dutta and Ameri [41];
- Sharma [21].
- Rangan et al. [10]
Integrated approaches to NPD
- Hage et al. [11];
- Nobelius and Sundgren [42];
- Von Corswant and Tunfilv [43].
Comprehensive approach to NPD
and product information management
- Stark [4]);
- Rangan et al. [10]
Focus on processes
- Grieves [15];
- Schuh et al. [14].
Impact given by the adoption
of a PLM strategy
- Schuh et al. [14];
- Stark [4]
Supply side Existent supporting technologies
- Garetti, et al. [12]
- Dassault/IBM UGS, Enovia,
Think3, SAP PLM; Oracle PLM, etc.
Tool- driven approach in order to
provide a specific support to specific
processes [13]
Focus on technological
choices
- Garetti, et al. [12];
- Sudarsan et al. [44]
Benefits given by specific
solutions
M. Cantamessa et al. / Computers in Industry 63 (2012) 243–251244
7/18/2019 An Empirical Analysis of the PLM Implementation Effects in the Aerospace Industry
http://slidepdf.com/reader/full/an-empirical-analysis-of-the-plm-implementation-effects-in-the-aerospace-industry 3/9
the first phases of NPD and the management of design changes
[16,19]. This impact can be considered as an enabler of the
development of more innovative products [14]. Moreover, data
integration, reduction of data redundancy, real-time updating
[16,20] and, more in general, integrated information and
knowledge management (e.g. [4,14]), as provided by PLM systems,enhances cross-functional collaboration among employees [21–
23]. This leads to a decrease of transaction costs in the NPD process
[38], more effective project coordination and control on product
engineering [13,14,24,25], besides a greater rigor in the manage-
ment of NPD, especially for product planning [4,14].
Finally, it is also possible to attempt an evaluation of the
revenue increase or the cost reduction that PLM can lead to. These
‘‘bottom line’’ results stem from an improved management of
design alternatives, a greater design diversification [14,16], a
deeper comprehension of product architecture and components
features [14], a lower impact of product changes on process
[16,26], the possibility of re-using past design information
[14,16,18], a higher quality of design and a lower number of
design mistakes [16], an improved management of complex tasks[27], the reduction of time needed for information research [14,16]
and for low added-value activities [16], the anomaly detection in
the first phases of NPD and the management of design changes
[16,19], an effective support for teamwork and cross-functional
collaboration [21–23].
3. Theoretical model developed and focal points of the analysis
None of the previously mentioned contributions examines the
elements of the firm on which PLM impacts by considering
different implementation levels.
Stark [4] considers three levels of PLM implementation in the
pursuit of opportunities and benefits, but does not consider the
associated
organizational
issues.
This
is
an
important
limitation,since PLM systems require the reengineering of relevant business
processes [28,29], with a dramatic impact on the firm’s organisa-
tion [30].
This paper attempts to take into account the organizational
effects of PLM implementation by considering workers in the NPD
process as the unit of analysis. In so doing, the paper distinguishes
between three different dimensions of PLM impact, individual
operational effects, organizational process effects, and strategic
effects. The first dimension analyzes the impact of PLM on users’
individual work and operational procedures. The second dimen-
sion reflects the benefits that users may have perceived in the
entire NPD process, in terms of impacts on coordination routines,
idea exchanges and workflows. The third dimension reflects how
employees
perceived
how
PLM
affected
firm
performance
from
a
strategic point of view. The basic idea is that, through the
identification of the effects of PLM at different levels, the dealings
among the elements which lead to effective PLM implementations
can result.
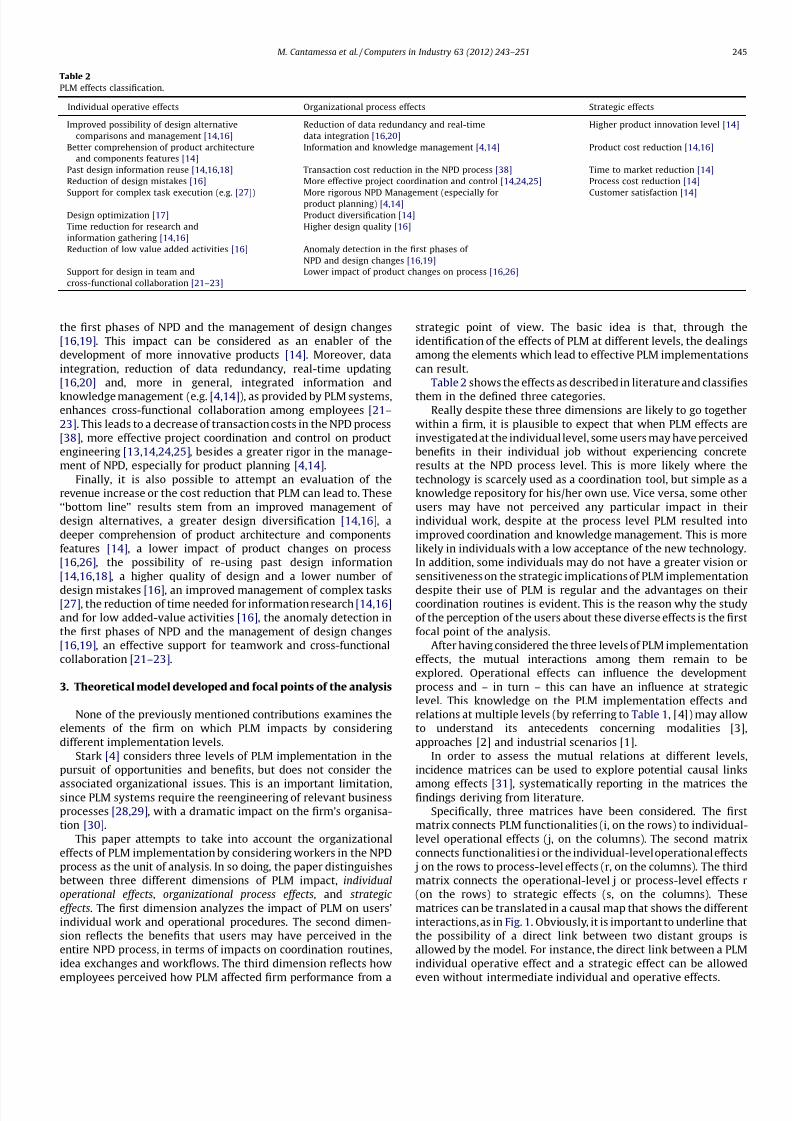
Table 2 shows the effects as described in literature and classifies
them in the defined three categories.Really despite these three dimensions are likely to go together
within a firm, it is plausible to expect that when PLM effects are
investigated at the individual level, some users may have perceived
benefits in their individual job without experiencing concrete
results at the NPD process level. This is more likely where the
technology is scarcely used as a coordination tool, but simple as a
knowledge repository for his/her own use. Vice versa, some other
users may have not perceived any particular impact in their
individual work, despite at the process level PLM resulted into
improved coordination and knowledge management. This is more
likely in individuals with a low acceptance of the new technology.
In addition, some individuals may do not have a greater vision or
sensitiveness on the strategic implications of PLM implementation
despite their use of PLM is regular and the advantages on theircoordination routines is evident. This is the reason why the study
of the perception of the users about these diverse effects is the first
focal point of the analysis.
After having considered the three levels of PLM implementation
effects, the mutual interactions among them remain to be
explored. Operational effects can influence the development
process and – in turn – this can have an influence at strategic
level. This knowledge on the PLM implementation effects and
relations at multiple levels (by referring to Table 1, [4]) may allow
to understand its antecedents concerning modalities [3],
approaches [2] and industrial scenarios [1].
In order to assess the mutual relations at different levels,
incidence matrices can be used to explore potential causal links
among
effects
[31], systematically
reporting
in
the
matrices
thefindings deriving from literature.
Specifically, three matrices have been considered. The first
matrix connects PLM functionalities (i, on the rows) to individual-
level operational effects (j, on the columns). The second matrix
connects functionalities i or the individual-level operational effects
j on the rows to process-level effects (r, on the columns). The third
matrix connects the operational-level j or process-level effects r
(on the rows) to strategic effects (s, on the columns). These
matrices can be translated in a causal map that shows the different
interactions, as in Fig. 1. Obviously, it is important to underline that
the possibility of a direct link between two distant groups is
allowed by the model. For instance, the direct link between a PLM
individual operative effect and a strategic effect can be allowed
even
without
intermediate
individual
and
operative
effects.
Table 2
PLM effects classification.
Individual operative effects Organizational process effects Strategic effects
Improved possibility of design alternative
comparisons and management [14,16]
Reduction of data redundancy and real-time
data integration [16,20]
Higher product innovation level [14]
Better comprehension of product architecture
and components features [14]
Information and knowledge management [4,14] Product cost reduction [14,16]
Past design information reuse [14,16,18] Transaction cost reduction in the NPD process [38] Time to market reduction [14]
Reduction of design mistakes [16] More effective project coordination and control [14,24,25] Process cost reduction [14]
Support
for
complex
task
execution
(e.g.
[27])
More
rigorous
NPD
Management
(especially
forproduct planning) [4,14] Customer
satisfaction
[14]
Design optimization [17] Product diversification [14]
Time reduction for research and
information gathering [14,16]
Higher design quality [16]
Reduction of low value added activities [16] Anomaly detection in the first phases of
NPD and design changes [16,19]
Support for design in team and
cross-functional collaboration [21–23]
Lower impact of product changes on process [16,26]
M. Cantamessa et al. / Computers in Industry 63 (2012) 243–251 245

7/18/2019 An Empirical Analysis of the PLM Implementation Effects in the Aerospace Industry
http://slidepdf.com/reader/full/an-empirical-analysis-of-the-plm-implementation-effects-in-the-aerospace-industry 4/9
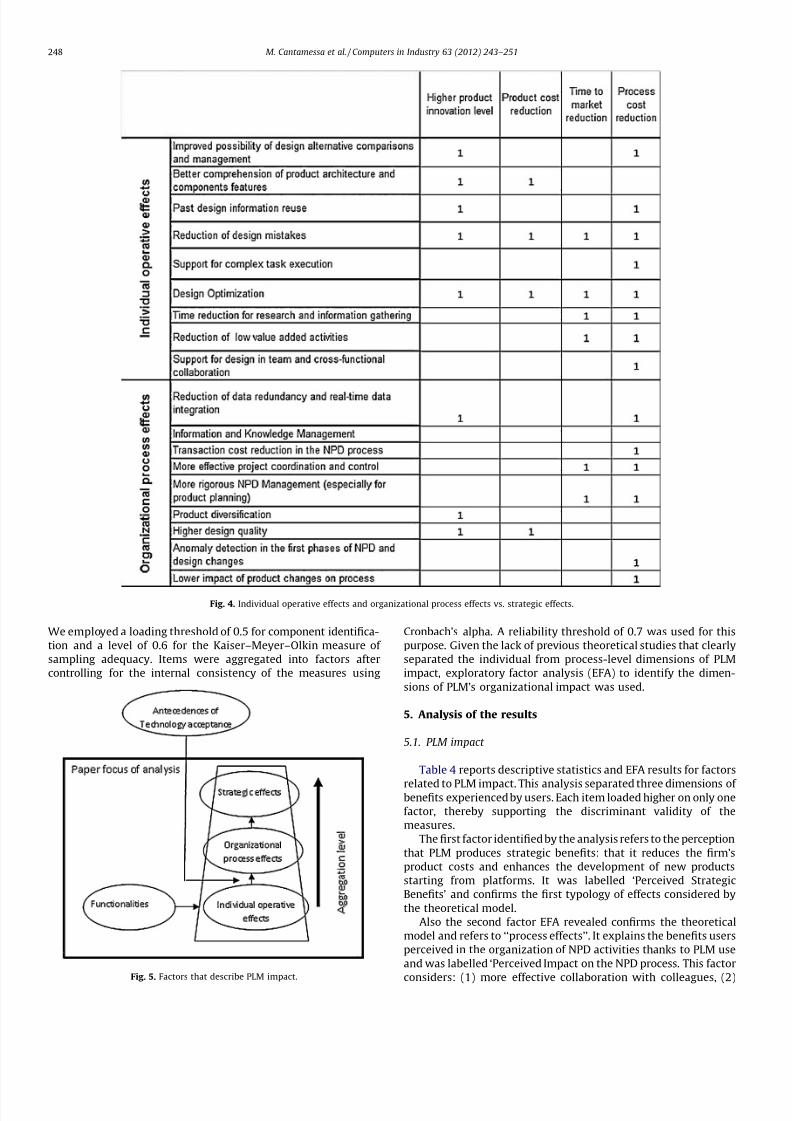
Matrix X, as shown in Fig. 2 and whose description below
explains the logic used for its construction, considers the relations
between PLM functionalities (as listed in the introduction and
described in [4]) on the rows and the main individual operative
effects, which are claimed by literature on PLM systems (as shown
in Table 2),on the column. Matrix Y and Z are similarly constructed
and shown in Figs. 3 and 4.This theoretical model has then been validated by a panel of
industry experts, however must also be validated on a broader
empirical base. Moreover, especially in the evaluation of user
perception, moderator effects due to individual traits of PLM users
(e.g. age, gender, type of tasks performed) and to the organizational
context (e.g. the functional department and its involvement in the
NPD process, the facilitating conditions set the and middle
managers for encouraging and supporting the PLM use) may be
relevant and may affect the interdependencies among the PLM
effects described by the matrices.
The first point is completely treated in the paper. Results
described here are obtained by using a scale that has been
validated statistically through a Principal Components Analysis, of
the three identified dimensions and their relations.
The second point is mainly related to the nature of PLM as a
complex technology that can be accepted to a different extent by
individuals depending on the individual traits and their organiza-
tional context. The Technology Acceptance issue does not only affect
individuals but, due to network externalities in the organizationalprocesses, can also affect the benefits of the technology at
organizational and business process level. This issue was part of
the study and guided the construction of questionnaires but it is only
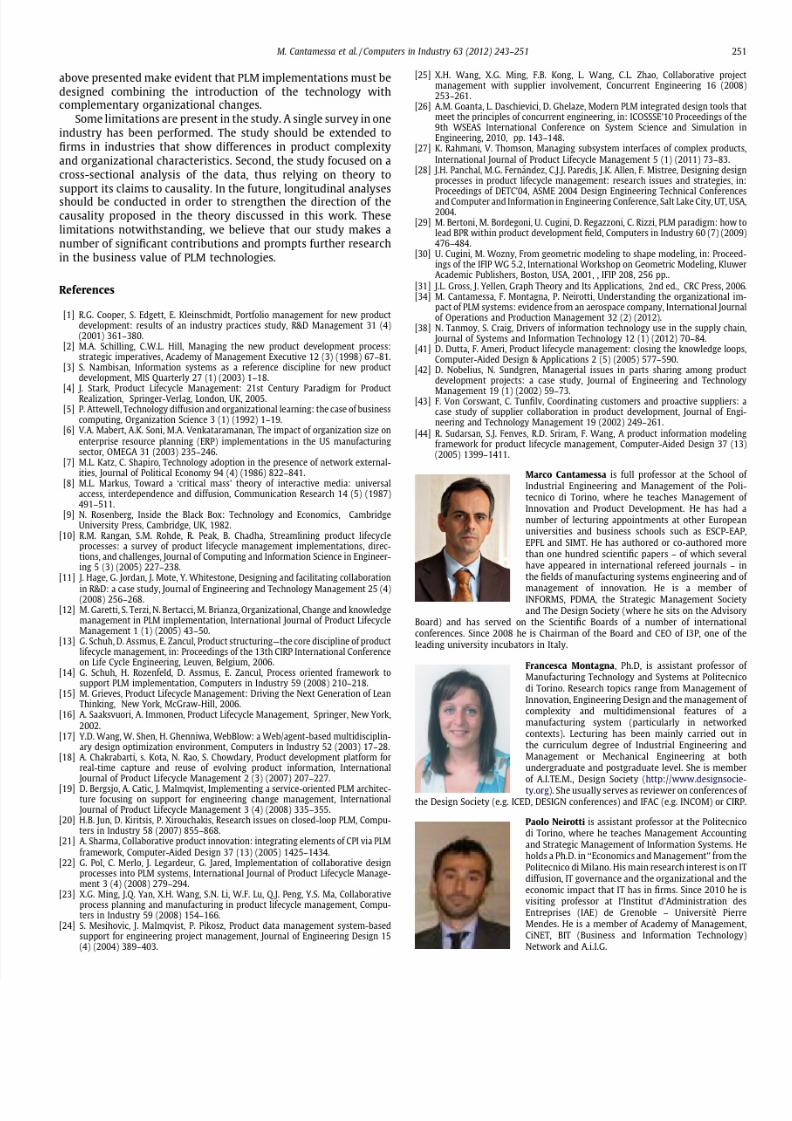
briefly mentioned in the paper. This because as Fig. 5 shows, the
focus of the analysis in this paper is on the operational,
organizational and strategic effects and their linkages of PLM
implementation; readers are referred to [34] for further details.
4. The survey
Two business units of an Italian industrial group, which
operates in the aerospace industry, were the setting for the
Fig. 1. Causal relation matrices.
Fig. 2. Matrix X-PLM functionalities vs individual operative effects.
M. Cantamessa et al. / Computers in Industry 63 (2012) 243–251246

7/18/2019 An Empirical Analysis of the PLM Implementation Effects in the Aerospace Industry
http://slidepdf.com/reader/full/an-empirical-analysis-of-the-plm-implementation-effects-in-the-aerospace-industry 5/9
empirical analysis. In both cases, PLM implementations were
driven by the willingness to enforce stronger relationships in the
firm’s network of customers, suppliers, and partners, together with
the need for a better management of concurrent engineering
activities. The business units introduced different PLM functional-
ities, with product data and configuration management, process
planning and resources management being the most important.
The study was based on a quantitative analysis conducted
through a structured questionnaire addressed to all adopters of
PLM systems in the two units. A representative sample made by
300 respondents in the two units was involved into the study: this
sample reflected the distribution of the population of PLM end-
users regarding age, educational level and type of organizational
function.
133
usable
responses
were
obtained
(63
from
firstBusiness Unit and 74 from the second one), which correspond to
about a 20% response rate in each of the two organizations. To
check for non-response bias, the respondents were compared with
the non-respondents through contingency tables, Kruskall–Wallis
non-parametric tests and a logit analysis.
In the surveyed sample 110 respondents were part of a cross-
functional product development team and 72 were affiliated with
the product design department. On average, 61% of PLM users’
working time was spent performing tasks associated with product
development projects. With respect to age, the sample was well
balanced (49.6% of the surveyed workers were under the age of 40).
Age was found to highly correlate with seniority (Pearson
correlation was 0.788 with a 0.1% p-value), thereby highlighting
the
low
turnover
rates
of
the
surveyed
users.
Data were collected following a three stage process. A
preliminary round of interviews was made with senior managers
accountable for the PLM implementation project and with some
program managers, in order to analyze the organizational impact
of PLM and the type of implementation. A structured questionnaire
was then sent to all the end users of PLM system. Findings obtained
from the survey were at last discussed and validated with the top
management.
Outcomes emerging from this survey can be generalized at the
industry level, as firms in the aerospace industry exhibit similar
business processes, with a high degree of standardization and
limited room for idiosyncratic operations, routines and human
capital. Standardization occurs because players in this industry
often
work
together
in
R&D
alliances
and
tend
to
follow
similarpractices both to ensure operating compatibility with partners and
to imitate partners’ good practices. Thus, when generalized, results
reflect how PLM is accepted and assimilated in the operational
routines and processes of large aerospace firms one year after its
implementation.
4.1. The questionnaires and measures
Based on previous PLM-specific literature, the questionnaire
included the measures presented in Table 3. Each item was
expressed on a 5-level Likert scale, wherein the value ‘00
corresponds to a neutral position between a strong disagreement
(‘20) and a strong agreement (‘+20). In order to identify higher-
level
factors,
item
responses
were
analyzed
using
factor
analysis.
Fig. 3. Functionalities and Individual operative effects vs. organizational process effects.
M. Cantamessa et al. / Computers in Industry 63 (2012) 243–251 247
7/18/2019 An Empirical Analysis of the PLM Implementation Effects in the Aerospace Industry
http://slidepdf.com/reader/full/an-empirical-analysis-of-the-plm-implementation-effects-in-the-aerospace-industry 6/9
We employed a loading threshold of 0.5 for component identifica-
tion and a level of 0.6 for the Kaiser–Meyer–Olkin measure of
sampling adequacy. Items were aggregated into factors after
controlling for the internal consistency of the measures using
Cronbach’s alpha. A reliability threshold of 0.7 was used for this
purpose. Given the lack of previous theoretical studies that clearly
separated the individual from process-level dimensions of PLM
impact, exploratory factor analysis (EFA) to identify the dimen-
sions of PLM’s organizational impact was used.
5. Analysis of the results
5.1. PLM impact
Table 4 reports descriptive statistics and EFA results for factors
related
to
PLM
impact.
This
analysis
separated
three
dimensions
of benefits experienced by users. Each item loaded higher on only one
factor, thereby supporting the discriminant validity of the
measures.
The first factor identified by the analysis refers to the perception
that PLM produces strategic benefits: that it reduces the firm’s
product costs and enhances the development of new products
starting from platforms. It was labelled ‘Perceived Strategic
Benefits’ and confirms the first typology of effects considered by
the theoretical model.
Also the second factor EFA revealed confirms the theoretical
model and refers to ‘‘process effects’’. It explains the benefits users
perceived in the organization of NPD activities thanks to PLM use
and was labelled ‘Perceived Impact on the NPD process. This factor
considers:
(1)
more
effective
collaboration
with
colleagues,
(2)
Fig. 4. Individual operative effects and organizational process effects vs. strategic effects.
Fig. 5. Factors that describe PLM impact.
M. Cantamessa et al. / Computers in Industry 63 (2012) 243–251248

7/18/2019 An Empirical Analysis of the PLM Implementation Effects in the Aerospace Industry
http://slidepdf.com/reader/full/an-empirical-analysis-of-the-plm-implementation-effects-in-the-aerospace-industry 7/9
better cross-functional coordination and idea exchange, (3) more
structured ways to manage workflows, and (4) more frequent use
of
component
carryover.
Among
these
items,
there
was
diffusedagreement among users that PLM facilitated a more structured
way of managing workflows (item 2.3). Conversely, the perception
that PLM supports the coordination and exchange of ideas (item
2.4) exhibited a limited diffusion among the surveyed users.
The third factor too confirms the developed theoretical model
and refers to the impact of PLM on individual work and operational
procedures. This was labelled ‘Perceived Impact on Individual
Work’ and encompasses: (1) easier product data retrieval, (2) a
reduction in time wasted due to either ‘re-inventing the wheel’ or
to doing useless work because data is inaccurate or not updated;
(3) an increase in time devoted to individual technical work and (4)
individual productivity increase (i.e., less time needed to perform a
job). Among these factors, the items that describe the impact of
PLM
on
overall
individual
productivity
(item
3.1)
and
the
reduced
waste of time (item 3.2) show the lowest means and the highest
standard deviations. Conversely, diffused agreement was on the
greater
ease
of
retrieving
product
data.
These
results
are
consistentwith descriptive statistics of how users view the impact of PLM on
the allocation of their working time (see Table 5). On average, PLM
Table 3
Measures in the questionnaire.
PLM perceived benefits Item Main references
Impact on individual work 1. Increased ease of retrieving product data See Table 2 column 1
2. Increased individual productivity
3. Increased time available for individual technical work
Reduction in the time spent ‘re-inventing the wheel’ or re-doing
the same activity due to a prior use of wrong/non-updated product data
Impact on the NPD process 1. Enhanced cross-functional coordination See Table 2 column 2
2. Enhanced data integration and improved collaboration tools
3. Enhanced product knowledge re-use
More effective process management tools in NPD (i.e., workflow management)
Strategic effects 1. Product and process cost reductions See Table 2 column 3
2. Time-to-market reductions and more innovative product platforms
Table 4
Factors that describe PLM impact.
Type of effects Meana S.D. Median Factor loadings
F1 F2 F3
F1. Perceived strategic effects 1.1 – PLM generated a reduction in product
development costs***0.23 0.79 0 0.76 0.39 0.25
1. 2 – PLM favoured the development of
product platforms***0.28 0.68 0 0.60 0.26 0.29
F2. perceived impact on
the NPD process
2.1 – PLM has favoured a more effective
collaboration among employees***0.27 0.75 0 0.21 0.59 0.34
2.2 – PLM supported more idea exchange
and more cross-functional coordination
0.02 0.77 0 0.12 0.64 0.49
2.3 – PLM encouraged employees to work in a
more structured way, following
workflows rules for validating/authorising
changes to product data***
0.64 0.80 1 0.23 0.67 0.34
2.4 – PLM favoured product carry-over*** 0.31 0.75 0 0.37 0.64 0.32
F3. Perceived impact on
individual work
3.1 – PLM contributed to reducing the time
required to do many tasks of my job
0.04 1.07 0 0.34 0.32 0.79
3.2 – Thanks to PLM, I do not have to spend
time ‘re-inventing the wheel’ or re-doing the
same task due to product data inconsistencies
0.12 0.92 0 0.08 0.39 0.80
3.3 – Thanks to PLM, I can more easily develop
new and effective solutions since I can spend
more time on technical aspects
0.05 0.76 0 0.45 0.39 0.76
3.4 – Once PLM has been implemented,
product data are more easily available
and more rapidly retrievable***
0.69 0.89 1 0.47 0.44 0.87
Initial eigenvalue 3.646 1.266 1.016
Proportion of variance explained [%] 36.4 12.6 10.2
Cumulative variance explained [%] 36.4 49.1 59.2
Cronbach’s Alpha 0.60 0.70 0.73
Kaiser–Meyer–Olkin measure of sampling 0.80
a +2 = strongly agree; 2 = strongly disagree.*** p-Value < 0.1% (Student’s t -test for assessing whether a variable’s mean significantly differs from 0).
Table 5
Estimated changes in the allocation of working time for PLM users after PLM
implementation.
Increased estimated percentage
of time spent doing
No. obs Mean Standard deviation
Individual technical work*** 97 5.14% 12.84%
Internal meeting 97 0.67% 4.87%
Reporting 96 0.52% 6.80%
Data retrieval*** 98 5.55% 8.00%
*** p-Value < 0.1% (Student’s t -test for assessing whether a variable’s mean
significantly
differs
from
0).
M. Cantamessa et al. / Computers in Industry 63 (2012) 243–251 249

7/18/2019 An Empirical Analysis of the PLM Implementation Effects in the Aerospace Industry
http://slidepdf.com/reader/full/an-empirical-analysis-of-the-plm-implementation-effects-in-the-aerospace-industry 8/9
favoured a reduction in time spent retrieving information, as well
as an increase in time spent on individual technical work. The
average magnitude of this substitution effect was approximately
5% of users’ working time (a t -test underscored that these changes
were significantly different from zero at a 0.1% p-value).
5.2. PLM use as a coordination tool
The item 2.4 of Table 4 shows a limited agreement among the
surveyed users about the perception of PLM as a support to thecoordination. This result induced the idea of analyzing the role of
PLM in the NPD specifically in term of coordination. Obviously,
because the data collected, this has been made only considering
the collaborative technologies that were present in the company,
even is authors know that more collaboration oriented tools exist.
Two dimensions were considered (Table 6): the frequency of use
(F ) and its significance (I ) to employees in allowing them to get
information they need. Mann–Whitney non-parametric tests
highlighted different coordination patterns associated to users’
functional departments, but not to age. Users estimated that and
formal meetings are the most important coordination modes for
getting information relevant to their own tasks. In the product
design department – although PLM is more frequently used for
coordination than in the other departments, it is both less used andless important than direct verbal communication or exchanges
(paired samples t -test revealed significant differences at a 1% p-
value). Thus, the role of PLM in supporting knowledge exchange
does not go through explicit communication but, rather, in
allowing easier access to product data and embedded tacit
knowledge.
5.3. Implication of outcomes
Some considerations can bemade on theseresults. Thefirstone
is related to the PLM role in individual activities. The most
important benefit perceived from an individual point of view is
thatPLMhelpsa reduction in time spent retrieving information, as
well
as
an
increasein
time
spent on
individual technicalwork.
Thisoutcome is coherent with literature [14,16] and emerges very
clearly by thesurvey. An explanation could be that these benefits
are short term perceivable in an explicit way. On the contrary,
understand that the own competence in developing design
solutions is improved surely requires more experiential time
besides a bigger effort of internalization.
Another important result is related to the PLM role in
coordination. In literature, PLM is described as a facilitating
system for coordination [13,14,21,24,25] but users do not perceive
it in the same way. Table 4 shows that PLM is not commonly
perceived as a support to the coordination and Table 6 shows that
and formal meetings are considered more important than PLM for
coordination. This should be due to the fact that and formal
meetings
are
proved
procedures.
The importance attributed to PLM does not fit to frequency in
use and in fact what is really interesting is analyzing the
frequencies. The dichotomy between and informal communica-
tions on one side, in respect to PLM and formal meetings on the
other side is evident. It seems that PLM, obliging somehow to
formalize procedures, becomes de facto assimilated in its use to
formal meetings. This induced formalism in the procedures
actually persuades users to prefer for coordination informal
mechanisms, such as emails and direct contacts.
This is significant, more than even before, if one considers theproduct design department. Although here PLM is more frequently
used for coordination than in the other departments, it is both less
used and less important than direct verbal communication or
exchanges. The reason therefore may be, on the one hand, that PLM
would not provide the right technological solutions for coordina-
tion and hence users prefer other tools, on the other hand, the
studied implementations may be immature so that users have not
completely assimilated PLM potentialities.
These results anyway stimulate specific managerial implica-
tions. They make evident that in order to take advantage of all the
possible benefits that PLM can provide, technology, changes in
business processes and organization must be combined consis-
tently. It is important take into account cultural issues that easily
recognize in the PLM systems the data gathering facilities, butimpose resistance for an effective use of knowledge sharing tools.
Rather than, it is important keep in mind the user inertia in the
process reshaping and standardization; considering that users
easily agree to a better workflow management but slowly,
familiarize with new coordination procedures.
6. Conclusive remarks
At the moment, there is debate in literature on how obtain
successful PLM implementations. The paper presents an investi-
gation on PLM implementation effects at different levels. In
particular, the paper has theorized and empirically validated the
existence of three distinct dimensions (operational, organizational,
and
strategic).The outcomes generally confirm what is stated by literature.
The real contribution of the paper consists in the way they are
obtained. In order to evaluate benefits and effects of a PLM
implementation, besides anecdotal evidence on the impact of IT on
NPD processes at the macro-level, as usually made in literature, the
paper proposes a micro-level analysis on the impact of the
technology on individuals’ job that allows to analyze the linkages
between the individual use, the impact on the NPD process and the
strategic implications. This analysis, by using statistical methods,
allowed a deeper knowledge of the individual and organizational
phenomena linked to PLM implementations.
Two types of contribution for managers arise from these results.
First, the paper provides managers with a framework to measure
the
benefits
produced
by
PLM
technologies.
Second,
the
results
Table 6
Frequency and importance of different coordination modes.
Exchanges Formal meetings Informal direct verbal
communication
PLM
F I F I F I F I
Product design department 1.77 1.67 0.97 1.53 1.39 1.32 0.91 1.22
Other departments 1.57 1.48 0.98 1.31 1.36 1.26 0.67 1.39
Entire sample 1.68 1.59 0.98 1.43 1.38 1.29 0.81 1.29
p-Value (ANOVA) 5.7% 5.5% 92.5% 5.0% 75.2% 66.6% 9.1% 25.9%
p-Value (Mann–Whitney test) 9.4% 6.6% 92.7% 3.8% 96.2% 79.6% 9.2% 23.4%
F = frequency of use; I = importance for getting key information to accomplish own job (1 = low; 3 = high).
M. Cantamessa et al. / Computers in Industry 63 (2012) 243–251250
7/18/2019 An Empirical Analysis of the PLM Implementation Effects in the Aerospace Industry
http://slidepdf.com/reader/full/an-empirical-analysis-of-the-plm-implementation-effects-in-the-aerospace-industry 9/9