Embed Size (px)
Citation preview
An Empirical Analysis of Mobile Apps’ Popularity Metrics in Mobile Software Ecosystems
Ludymila L. A. Gomes1, Awdren L. Fontão1, Allan J. S. Bezerra1, Arilo C. Dias-Neto1
1Instituto de Computação – Universidade Federal do Amazonas (UFAM) Caixa Postal 69077-000 – Manaus – AM – Brazil
{llag,awdren,allan.bezerra,arilo}@icomp.ufam.edu.br
Abstract. The growing of mobile platforms in the last years has changed the software development scenario and challenged developers around the world in building successful mobile applications (apps). Users are the core of a mobile software ecosystem (MSECO). Thus, the quality of an app would be related to the user satisfaction, which could be measured by its popularity in App Store. In this paper, we describe the results of a mapping study that identified and analyzed how metrics on apps’ popularity have been addressed in the technical literature. 18 metrics were identified as related to apps’ popularity (users rating and downloads the most cited). After that, we conducted a survey with 47 developers acting within the main MSECOs (Android, iOS and Windows) in order to evaluate these 18 metrics regarding their usefulness to characterize app's popularity. As results, we observed developers understand the importance of metrics to indicate popularity of apps in a different way when compared to the current research.
1. Introduction With the rapid evolution of mobile platform, the number of mobile applications (or just Mobile Apps) available has exploded over the past few years. For example, in July 2015 there were more than 1.6 and 1.5 million Apps, respectively, at Google Play (2016) and Apple Store (2016). The set of elements around the software development is defined as Software Ecosystem (SECO) that consists of a cooperative evolution system, similar to biological ecosystems (Jansen and Cusumano, 2012). In the context of Mobile Platform, it is called Mobile Software Ecosystem (MSECO) and it comprises various elements, such as: Mobile Apps, Mobile App Store (App Store), Users, Keystones (companies responsible for the mobile platforms, such as Google, Microsoft, Apple, Nokia, Samsung) and External Developers (Lim and Bentley, 2012). The involvement of developers in a MSECO is related to the number of users than they can reach by their mobile apps. On the other hand, the involvement of users in a MSECO would be related to the attractiveness the available mobile apps developed by these developers, what could be measured by the level of popularity of mobile apps in app stores, representing a cyclic relationship. Thus, the goal of keystone is to keep the MSECO platform more attractive for their users and, thus, in evidence in the new market of mobile devices (Fontão et al., 2015). In a previous case study around the characteristics of such an ecosystem, quality assurance was identified as one of the most important factors that turns the ecosystem platform more attractive. However, according to Manikas and Hansen (2013), there
XV Simpósio Brasileiro de Qualidade de Software / XV Brazilian Symposium on Software QualityArtigos Técnicos / Research Papers
21
appears to be a general lack of knowledge about the relation between quality assurance and software ecosystems. The growing number of mobile apps has challenged the big keystones and developers in understanding what are the “hidden” forces that contribute to the success of failure of a mobile app in this competitive market. Jansen and van Capelleveen (2013) have studied methods for review and approval of software extensions in platform based software ecosystems. Their focus is on how the keystone or platform coordinators can ensure that submitted extensions from niche players have a sufficient quality. They give particular attention to how review methods scale in very large ecosystems. A cited method is community feedback that can be based on downloads, ratings and reviews by end users. This method can be applied to assess the quality of extensions. To facilitate the adoption of community feedback, many app stores provide the periodical (such as daily) chart rankings and allow users to post ratings and reviews for their mobile apps. This information can be useful, for instance, to prevent decrease of interest by the platform or to predict new successful mobile apps according to trends observed in the app store. However, can other information also be used to suggest popularity of mobile apps? Moreover, for which purpose can popularity of mobile apps be used in a MSECO? Based on this context, this paper investigates which information also be used to measure/suggest popularity of mobile apps and for which purpose can mobile apps’ popularity metrics be used in a MSECO. Thus, we performed two empirical studies to support this analysis. Firstly, we conducted a systematic mapping study (SMS) to analyze works describing metrics, techniques, strategies and information regarding popularity of mobile apps and their application and impact on MSECO. 23 papers were related to this research topic and they cite 18 different metrics contextualized to mobile app’s popularity. After this SMS, we conducted a survey with 47 mobile apps developers with different expertise levels acting in different MSECOs (e.g.: Android, iOS, and Windows) in order to understand and evaluate which these metrics they consider as useful to contextualize mobile app’s popularity (and how useful) in the development of these applications. After that, we performed a Pearson Correlation analysis between the order obtained from the SMS using the number of citations of each metric with the order obtained from the developers using the calculated rating.
This paper is structured as follows. Section 2 discusses the two main concepts involved in this work: Mobile Software Ecosystem and Popularity of Mobile Apps. In Section 3, we describe the results of a systematic mapping study. Section 4 describes a survey with mobile apps developers. Section 5 compares the results obtained in both studies from the perspective of researchers and developers, describing a correlation analysis between the results obtained in both studies. Finally, conclusions and future works are presented in the Section 6.
2. Background
2.1. Mobile Software Ecosystem (MSECO) A Software Ecosystem (SECO) consists in a software platform, set of external and internal developers, and a community of experts supporting the community of users, building solutions aiming to attend the users’ needs (Bosch, 2009). Lim and Bentley (2012) define a SECO related to mobile apps as Mobile Software Ecosystem (MSECO), in which the app store is the environment used to keep and access the mobile apps.
XV Simpósio Brasileiro de Qualidade de Software / XV Brazilian Symposium on Software QualityArtigos Técnicos / Research Papers
22
Thus, MSECO consists in a cooperative evolution system of mobile apps, developers and users composing complex relationships that provide niches, competing and cooperating as can be observed in biological ecosystems (Lin and Ye, 2009). In a MSECO, the development process in an app store requires the utilization of a user-centered and user experience methodology by the developers. According to (Kim et al., 2012), this can contribute to improve the quality of mobile apps and the mood of user and developer’s community. The mechanism to monitor the involvement and satisfaction of developers, acceptance of user, the development process, to simulate behaviors and trends, to identify and predict improvement areas, and to validate changes in a SECO is related to the concept of Health in SECO. In (Manikas and Hansen, 2013), SECO’s health is defined as the capacity of an ecosystem to attend the user’s needs and keep a high quality products productivity for many years. Dittrich (2014) discussed as a challenge to reach health in SECO, the contact with users and other elements as strategy to keep the focus on innovation for the software products in a SECO. When contextualized to MSECO, new challenges appear (Lim and Bentley, 2012): (a) Prevision of sales and use of mobile apps; (b) Population of apps, users, and developers; (c) Constant evolution of this population; (d) Relationship among these elements. According to (Lim and Bentley, 2013), MSECO, by its developers, users, and app store’s owners, brings new challenges that impact on the software industry. Apps store’s owners are challenged by the rapid growing of content offered in the store and therefore need to encourage users to acquire and accept this content. Developers can have difficulties in making their mobile apps popular for a long period, considering the high number of mobile apps in a store, reaching a high number of downloads and making money. Users of mobile apps are challenged to find good innovative applications among the wide variety of mobile apps available in app stores.
This paper we analyze strategies proposed in the technical literature that investigate how the popularity of mobile apps is discussed/measured in the context of MSECO. In the next section, the concept of popularity of mobile apps is discussed with details.
2.2. Popularity do Mobile Applications The word “popularity” is relative to the fact that something or someone is liked, enjoyed,
or supported by many people (Cambridge, 2016). Since the audience (actors and its
relationships) is something that is easily tracked and measured on the context of the
Internet, popularity is a concept naturally perceived when dealing with websites access,
social networks, online stores, amongst other scenarios. In fact, popularity is related to
the number of users that have installed and that currently use the software application
(Harrison et al., 2013).
Likewise, when relating to mobile market, we also have ways to measure and
quantify the popularity using different metrics. Zhu et al. (2014) suggest there are two
major challenges along this topic. First, the popularity information of mobile apps often varies frequently and has the instinct of sequence dependence. Second, the popularity
information is heterogeneous, but contains latent semantics and relationships. The authors also classify the three main types of important popularity information, namely chart rankings, users ratings, and user reviews. However, they confirm there would be other metrics than can be used to measure popularity of mobile apps, such as the number
XV Simpósio Brasileiro de Qualidade de Software / XV Brazilian Symposium on Software QualityArtigos Técnicos / Research Papers
23
of downloads and visualization of each application inside the app stores, the time spent
by users on the mobile app, and the period between the installation of a mobile app and
its removal from the user’s phone.
In this paper, we investigated how popularity of mobile apps is dealt in the
technical literature, by techniques, methods, and experience reports. Moreover, we
analyzed the objectives in which mobile app’s popularity have been studied in technical literature. Bracher (2015) lists 12 metrics for tracking mobile app’s success, which have similarities to the concept of popularity. However, this result was not provided by a
formal search procedure from the technical literature. Moreover, it reflects the
individual point of view of an expert from the industry, which represents very important
information, but that could be enriched with other information collected from the
technical literature.
Thus, in our work, we searched for information in the technical literature by a
systematic mapping study, described in the next section. As result, we observed that the
metrics reported by (Bracher, 2015) were also mapped, and new metrics were
identified/characterized.
3. Systematic Mapping Study on Apps’ Popularity A systematic mapping study (SMS) is used to state the kinds of research that have been
undertaken and can be conducted to get an overview of a particular research area
(Kitchenham and Charter, 2007).
3.1. Research Questions Following the guidelines proposed in (Kitchenham and Charter, 2007) to conduct a
systematic study, we specified two research questions (RQs) that intend to provide
answer regarding the works published in the technical literature that deal with popularity
of mobile apps, the metrics used to define popularity and the objectives in measuring
popularity of mobile apps. The questions are:
x (RQ1) What are currently the objectives in measuring popularity of mobile apps
in MSECO?
x (RQ2) Which metrics are being used to indicate mobile apps’ popularity in MSECO?
3.2 Identification and Selection of Primary Studies The search string used to identify primary studies was formalized adoption the criterion
P-I-C-O described in (Kitchenham and Charter, 2007) and widely used in SMS
performed in the Software Engineering field. From this structure, the search string was
formalized integrating each element with the logical connector AND. For each element,
synonymous were identified from previous/related works and they were integrated using
the logical connector OR, as described in Table 1.
The electronic search was applied on the following Search Engines: IEEE Xplore, ACM Digital Library, Elsevier Science Direct, Scopus and Web of Science. We defined some inclusion criteria to evaluate and/or analyze the identified studies: (1) Only studies written in English; (2) Studies dealing and referencing any of the subjects
XV Simpósio Brasileiro de Qualidade de Software / XV Brazilian Symposium on Software QualityArtigos Técnicos / Research Papers
24
related to popularity of mobile apps in their title or abstract; (3) Studies with unrestricted publication date; (4) Only not-duplicated studies . Any paper that did not meet all inclusion criteria should be excluded.
Table 1. Composition of search string used in this work.
Element Search String Population ("mobile app*" OR "mobile software app*" OR "app store*")
AND Intervention ("popularity" OR "success" OR "decay" OR "ranking*" OR "rating*")
AND Outcome ("metric*" OR "measure*")
3.3 Data Extraction Form We extracted some specific information about all papers to compare them:
1) Metadata. A Complete paper reference (Venue where the paper was published, Authors’ names, Year of publication); 2) Objective. Defining main paper objective to explore related to popularity of
mobile apps;
3) Niche Type. In which mobile ecosystem (MSECO) is the study based on;
4) Popularity Metrics. Metrics of Mobile Apps’ Popularity cited. For all metrics, we extracted information regarding: name, type (direct [absolute number] or indirect [based on other metrics]), extraction formula, and how to collect it.
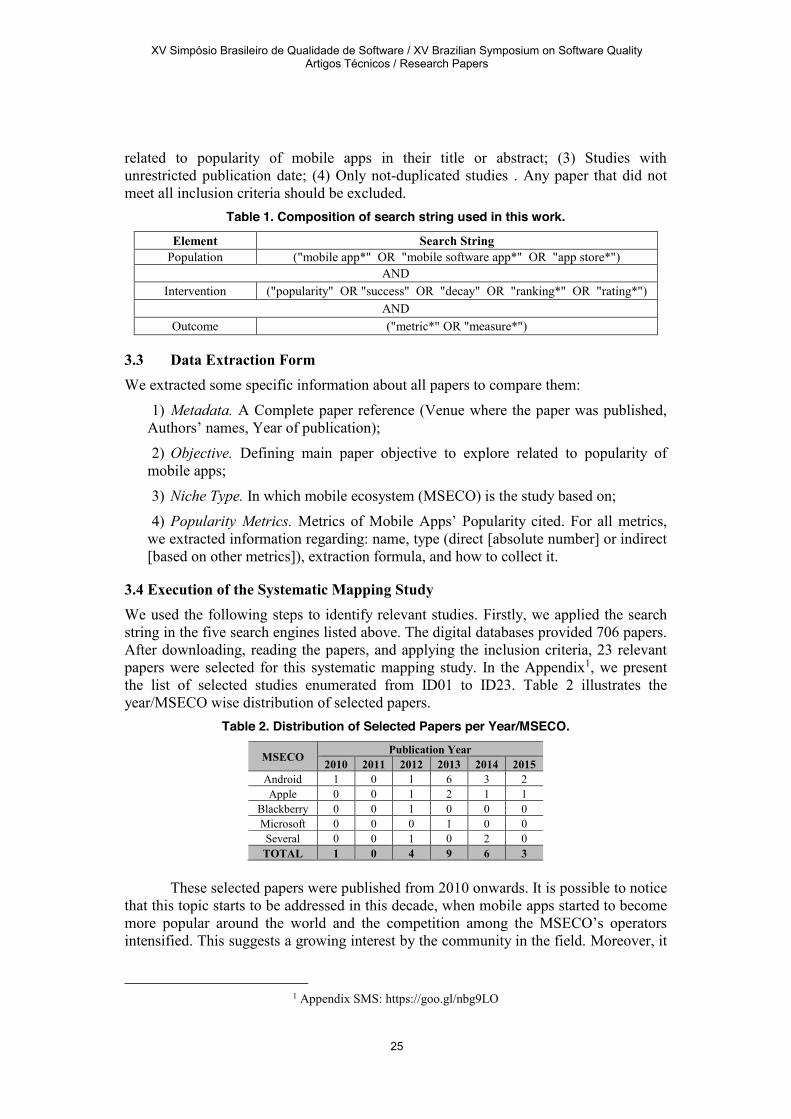
3.4 Execution of the Systematic Mapping Study We used the following steps to identify relevant studies. Firstly, we applied the search string in the five search engines listed above. The digital databases provided 706 papers. After downloading, reading the papers, and applying the inclusion criteria, 23 relevant papers were selected for this systematic mapping study. In the Appendix1, we present the list of selected studies enumerated from ID01 to ID23. Table 2 illustrates the year/MSECO wise distribution of selected papers.
Table 2. Distribution of Selected Papers per Year/MSECO.
MSECO Publication Year 2010 2011 2012 2013 2014 2015
Android 1 0 1 6 3 2
Apple 0 0 1 2 1 1
Blackberry 0 0 1 0 0 0
Microsoft 0 0 0 1 0 0
Several 0 0 1 0 2 0
TOTAL 1 0 4 9 6 3
These selected papers were published from 2010 onwards. It is possible to notice that this topic starts to be addressed in this decade, when mobile apps started to become more popular around the world and the competition among the MSECO’s operators intensified. This suggests a growing interest by the community in the field. Moreover, it
1 Appendix SMS: https://goo.gl/nbg9LO
XV Simpósio Brasileiro de Qualidade de Software / XV Brazilian Symposium on Software QualityArtigos Técnicos / Research Papers
25
indicates this topic is relatively recent in publications. The trend is that the number of research on this topic increases in the next years. We emphasize that papers that use the same metrics identified in this study, but without focus on popularity of mobile apps are not in the selected studies.
Analyzing the MSECO distribution in the selected papers, we can observe Android is the most popular MSECO investigated in this topic (13 studies), probably
because it is an open platform, its significant market share and it is also the most popular app store. Apple’s MSECO is the second one, with five studies. Windows Phone, a recent mobile platform, and Blackberry both have one study on mobile app’s popularity using their app stores. Three studies describe surveys with developers and users, asking for their preferences. These studies are not focused on one specific MSECO and they were classified as Several.
3.5 Results Analysis In this section, we present the results extracted from the papers selected in this study aiming to respond our research questions.
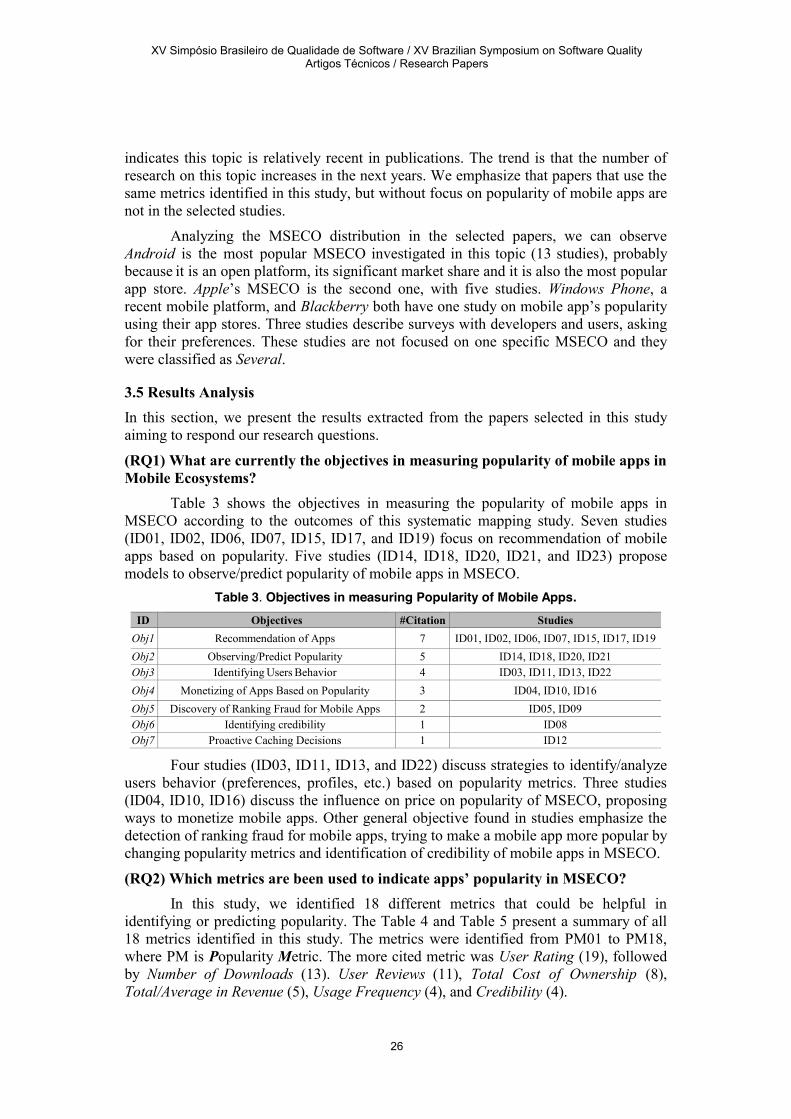
(RQ1) What are currently the objectives in measuring popularity of mobile apps in Mobile Ecosystems? Table 3 shows the objectives in measuring the popularity of mobile apps in MSECO according to the outcomes of this systematic mapping study. Seven studies (ID01, ID02, ID06, ID07, ID15, ID17, and ID19) focus on recommendation of mobile apps based on popularity. Five studies (ID14, ID18, ID20, ID21, and ID23) propose models to observe/predict popularity of mobile apps in MSECO.
Table 3. Objectives in measuring Popularity of Mobile Apps. ID Objectives #Citation Studies
Obj1 Recommendation of Apps 7 ID01, ID02, ID06, ID07, ID15, ID17, ID19
Obj2 Observing/Predict Popularity 5 ID14, ID18, ID20, ID21
Obj3 Identifying Users Behavior 4 ID03, ID11, ID13, ID22
Obj4 Monetizing of Apps Based on Popularity 3 ID04, ID10, ID16
Obj5 Discovery of Ranking Fraud for Mobile Apps 2 ID05, ID09
Obj6 Identifying credibility 1 ID08
Obj7 Proactive Caching Decisions 1 ID12
Four studies (ID03, ID11, ID13, and ID22) discuss strategies to identify/analyze users behavior (preferences, profiles, etc.) based on popularity metrics. Three studies (ID04, ID10, ID16) discuss the influence on price on popularity of MSECO, proposing ways to monetize mobile apps. Other general objective found in studies emphasize the detection of ranking fraud for mobile apps, trying to make a mobile app more popular by changing popularity metrics and identification of credibility of mobile apps in MSECO.
(RQ2) Which metrics are been used to indicate apps’ popularity in MSECO? In this study, we identified 18 different metrics that could be helpful in identifying or predicting popularity. The Table 4 and Table 5 present a summary of all 18 metrics identified in this study. The metrics were identified from PM01 to PM18, where PM is Popularity Metric. The more cited metric was User Rating (19), followed by Number of Downloads (13). User Reviews (11), Total Cost of Ownership (8), Total/Average in Revenue (5), Usage Frequency (4), and Credibility (4).
XV Simpósio Brasileiro de Qualidade de Software / XV Brazilian Symposium on Software QualityArtigos Técnicos / Research Papers
26
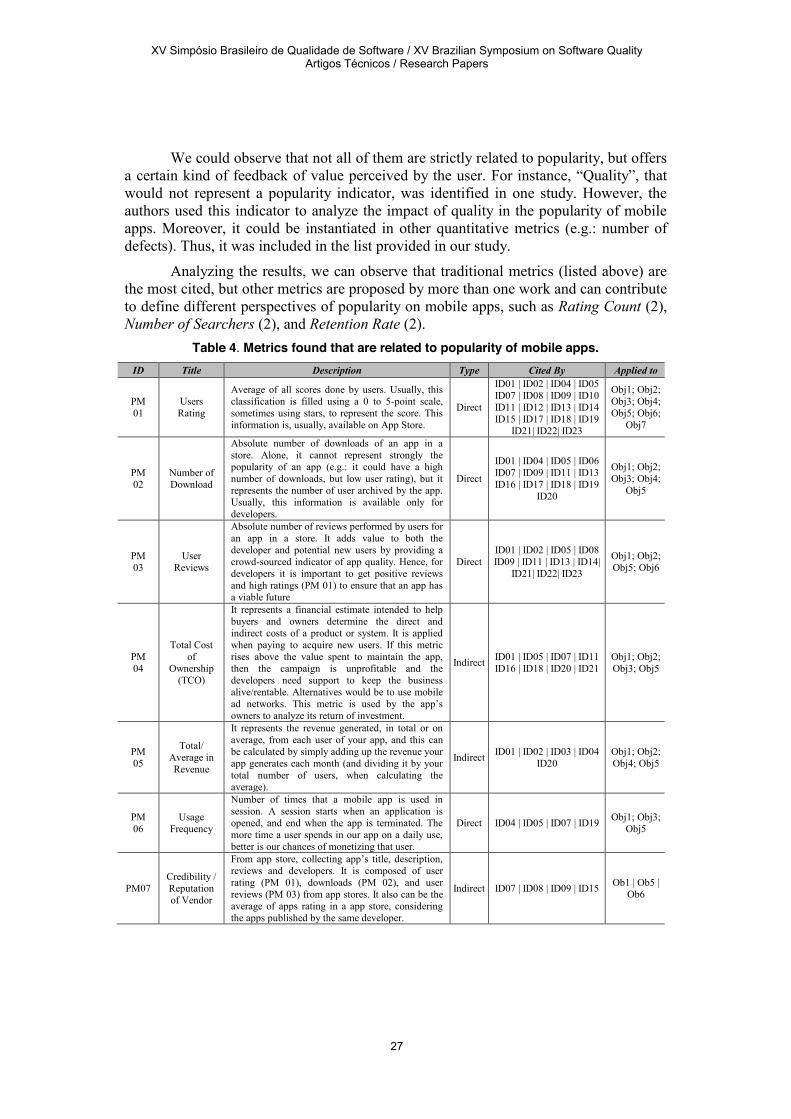
We could observe that not all of them are strictly related to popularity, but offers a certain kind of feedback of value perceived by the user. For instance, “Quality”, that would not represent a popularity indicator, was identified in one study. However, the authors used this indicator to analyze the impact of quality in the popularity of mobile apps. Moreover, it could be instantiated in other quantitative metrics (e.g.: number of defects). Thus, it was included in the list provided in our study.
Analyzing the results, we can observe that traditional metrics (listed above) are the most cited, but other metrics are proposed by more than one work and can contribute to define different perspectives of popularity on mobile apps, such as Rating Count (2), Number of Searchers (2), and Retention Rate (2).
Table 4. Metrics found that are related to popularity of mobile apps. ID Title Description Type Cited By Applied to
PM 01
Users Rating
Average of all scores done by users. Usually, this classification is filled using a 0 to 5-point scale, sometimes using stars, to represent the score. This information is, usually, available on App Store.
Direct
ID01 | ID02 | ID04 | ID05 ID07 | ID08 | ID09 | ID10 ID11 | ID12 | ID13 | ID14 ID15 | ID17 | ID18 | ID19
ID21| ID22| ID23
Obj1; Obj2; Obj3; Obj4; Obj5; Obj6;
Obj7
PM 02
Number of Download
Absolute number of downloads of an app in a store. Alone, it cannot represent strongly the popularity of an app (e.g.: it could have a high number of downloads, but low user rating), but it represents the number of user archived by the app. Usually, this information is available only for developers.
Direct
ID01 | ID04 | ID05 | ID06 ID07 | ID09 | ID11 | ID13 ID16 | ID17 | ID18 | ID19
ID20
Obj1; Obj2; Obj3; Obj4;
Obj5
PM 03
User Reviews
Absolute number of reviews performed by users for an app in a store. It adds value to both the developer and potential new users by providing a crowd-sourced indicator of app quality. Hence, for developers it is important to get positive reviews and high ratings (PM 01) to ensure that an app has a viable future
Direct ID01 | ID02 | ID05 | ID08 ID09 | ID11 | ID13 | ID14|
ID21| ID22| ID23
Obj1; Obj2; Obj5; Obj6
PM 04
Total Cost of
Ownership (TCO)
It represents a financial estimate intended to help buyers and owners determine the direct and indirect costs of a product or system. It is applied when paying to acquire new users. If this metric rises above the value spent to maintain the app, then the campaign is unprofitable and the developers need support to keep the business alive/rentable. Alternatives would be to use mobile ad networks. This metric is used by the app’s owners to analyze its return of investment.
Indirect ID01 | ID05 | ID07 | ID11 ID16 | ID18 | ID20 | ID21
Obj1; Obj2; Obj3; Obj5
PM 05
Total/ Average in Revenue
It represents the revenue generated, in total or on average, from each user of your app, and this can be calculated by simply adding up the revenue your app generates each month (and dividing it by your total number of users, when calculating the average).
Indirect ID01 | ID02 | ID03 | ID04
ID20 Obj1; Obj2; Obj4; Obj5
PM 06
Usage Frequency
Number of times that a mobile app is used in session. A session starts when an application is opened, and end when the app is terminated. The more time a user spends in our app on a daily use, better is our chances of monetizing that user.
Direct ID04 | ID05 | ID07 | ID19 Obj1; Obj3;
Obj5
PM07 Credibility / Reputation of Vendor
From app store, collecting app’s title, description, reviews and developers. It is composed of user rating (PM 01), downloads (PM 02), and user reviews (PM 03) from app stores. It also can be the average of apps rating in a app store, considering the apps published by the same developer.
Indirect ID07 | ID08 | ID09 | ID15 Ob1 | Ob5 |
Ob6
XV Simpósio Brasileiro de Qualidade de Software / XV Brazilian Symposium on Software QualityArtigos Técnicos / Research Papers
27
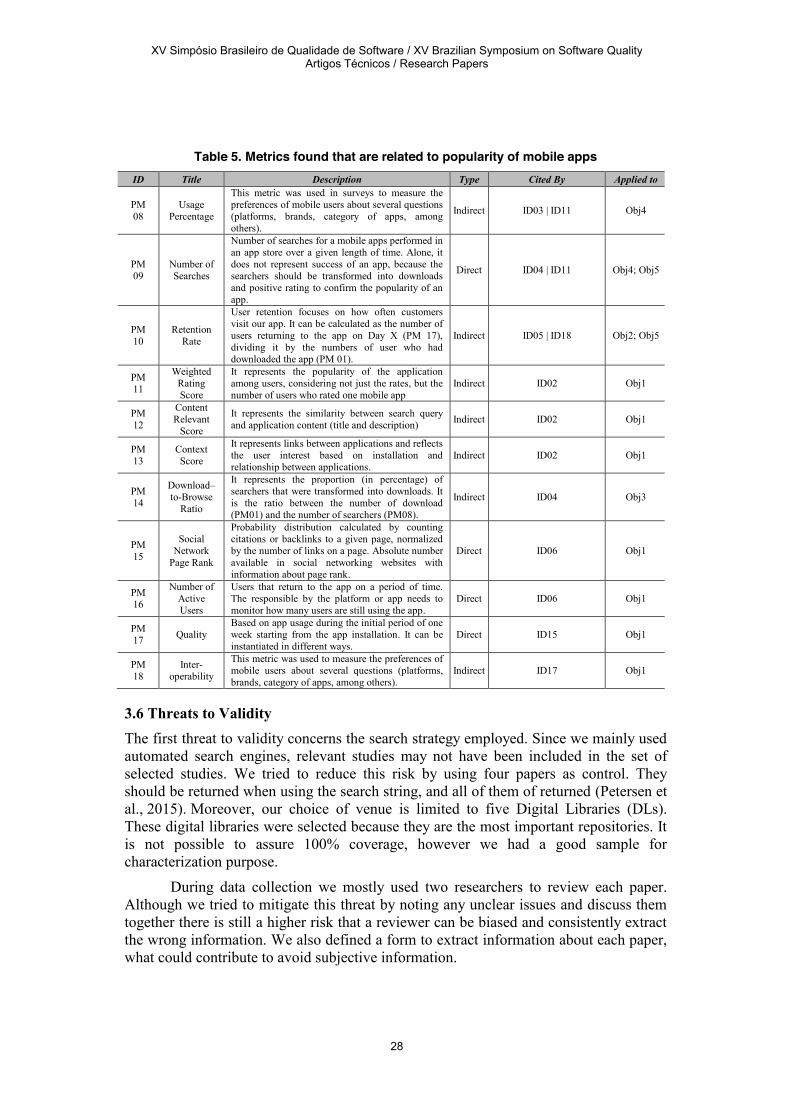
Table 5. Metrics found that are related to popularity of mobile apps ID Title Description Type Cited By Applied to
PM 08
Usage Percentage
This metric was used in surveys to measure the preferences of mobile users about several questions (platforms, brands, category of apps, among others).
Indirect ID03 | ID11 Obj4
PM 09
Number of Searches
Number of searches for a mobile apps performed in an app store over a given length of time. Alone, it does not represent success of an app, because the searchers should be transformed into downloads and positive rating to confirm the popularity of an app.
Direct ID04 | ID11 Obj4; Obj5
PM 10
Retention Rate
User retention focuses on how often customers visit our app. It can be calculated as the number of users returning to the app on Day X (PM 17), dividing it by the numbers of user who had downloaded the app (PM 01).
Indirect ID05 | ID18 Obj2; Obj5
PM 11
Weighted Rating Score
It represents the popularity of the application among users, considering not just the rates, but the number of users who rated one mobile app
Indirect ID02 Obj1
PM 12
Content Relevant
Score
It represents the similarity between search query and application content (title and description)
Indirect ID02 Obj1
PM 13
Context Score
It represents links between applications and reflects the user interest based on installation and relationship between applications.
Indirect ID02 Obj1
PM 14
Download–to-Browse
Ratio
It represents the proportion (in percentage) of searchers that were transformed into downloads. It is the ratio between the number of download (PM01) and the number of searchers (PM08).
Indirect ID04 Obj3
PM 15
Social Network
Page Rank
Probability distribution calculated by counting citations or backlinks to a given page, normalized by the number of links on a page. Absolute number available in social networking websites with information about page rank.
Direct ID06 Obj1
PM 16
Number of Active Users
Users that return to the app on a period of time. The responsible by the platform or app needs to monitor how many users are still using the app.
Direct ID06 Obj1
PM 17
Quality Based on app usage during the initial period of one week starting from the app installation. It can be instantiated in different ways.
Direct ID15 Obj1
PM 18
Inter-operability
This metric was used to measure the preferences of mobile users about several questions (platforms, brands, category of apps, among others).
Indirect ID17 Obj1
3.6 Threats to Validity The first threat to validity concerns the search strategy employed. Since we mainly used automated search engines, relevant studies may not have been included in the set of selected studies. We tried to reduce this risk by using four papers as control. They should be returned when using the search string, and all of them of returned (Petersen et al., 2015). Moreover, our choice of venue is limited to five Digital Libraries (DLs). These digital libraries were selected because they are the most important repositories. It is not possible to assure 100% coverage, however we had a good sample for characterization purpose.
During data collection we mostly used two researchers to review each paper. Although we tried to mitigate this threat by noting any unclear issues and discuss them together there is still a higher risk that a reviewer can be biased and consistently extract the wrong information. We also defined a form to extract information about each paper, what could contribute to avoid subjective information.
XV Simpósio Brasileiro de Qualidade de Software / XV Brazilian Symposium on Software QualityArtigos Técnicos / Research Papers
28
The main issue here is whether our approach adequately addresses the principal research question, which itself involves an assessment of how popularity of mobile apps are measured by the technical literature. There is obviously scope for publication bias to influence our conclusions, partly because we have not performed a systematic search for other metrics not related to popularity of mobile apps, and also because the set selected only covers a limited range of metrics and topics.
4. Survey to Evaluate the Importance of Mobile App’s Popularity Metrics by Developers This section presents a survey planned and executed with the goal of evaluating the set of metrics related to apps’ popularity by the developer’s community. We followed the guidelines recommended by Linaker et al. (2015) for conduction surveys in software engineering.
4.1 Research Question The goal of the study is to analyze metrics related to mobile apps’ popularity with the purpose of characterizing with respect to the usefulness from the point of view of developers in the context of mobile apps development in MSECO. The research question (RQ) and metric to help us to answer it is the following:
x RQ: What are the relevance level of metrics related to popularity used on mobile apps development? Metric: List of metrics that are effectively applied by developers (ordered by relevance).
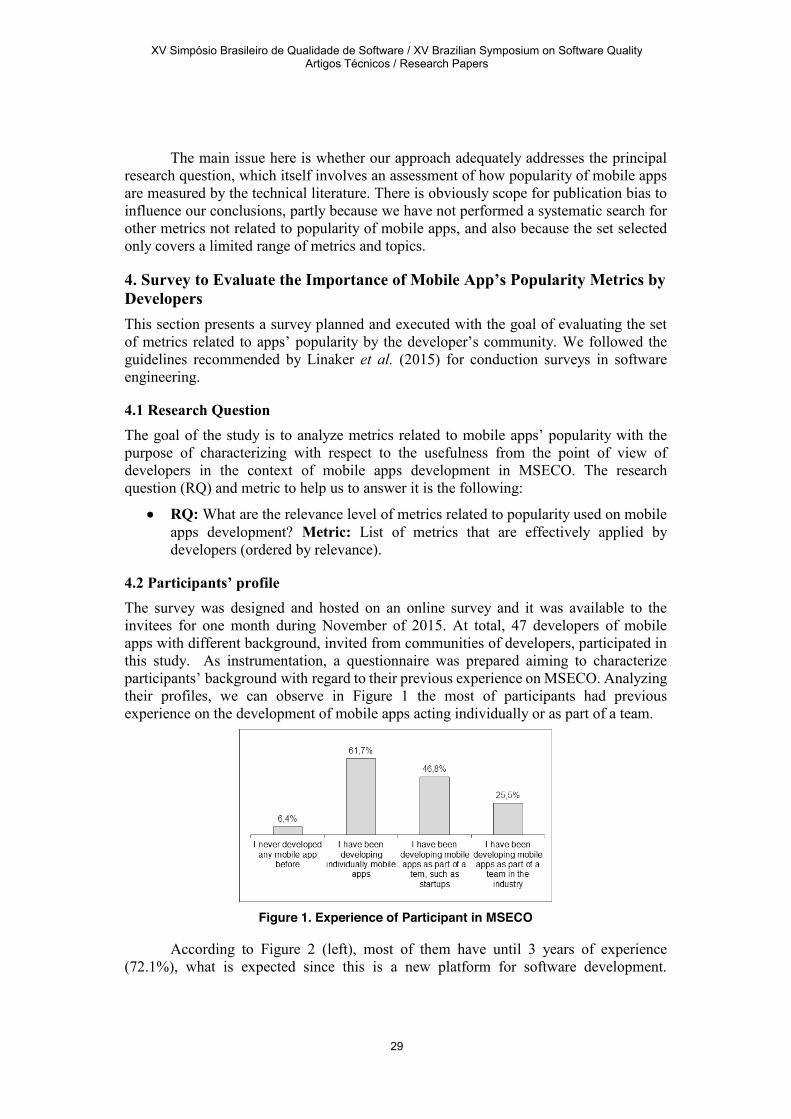
4.2 Participants’ profile The survey was designed and hosted on an online survey and it was available to the invitees for one month during November of 2015. At total, 47 developers of mobile apps with different background, invited from communities of developers, participated in this study. As instrumentation, a questionnaire was prepared aiming to characterize participants’ background with regard to their previous experience on MSECO. Analyzing their profiles, we can observe in Figure 1 the most of participants had previous experience on the development of mobile apps acting individually or as part of a team.
Figure 1. Experience of Participant in MSECO
According to Figure 2 (left), most of them have until 3 years of experience (72.1%), what is expected since this is a new platform for software development.
XV Simpósio Brasileiro de Qualidade de Software / XV Brazilian Symposium on Software QualityArtigos Técnicos / Research Papers
29
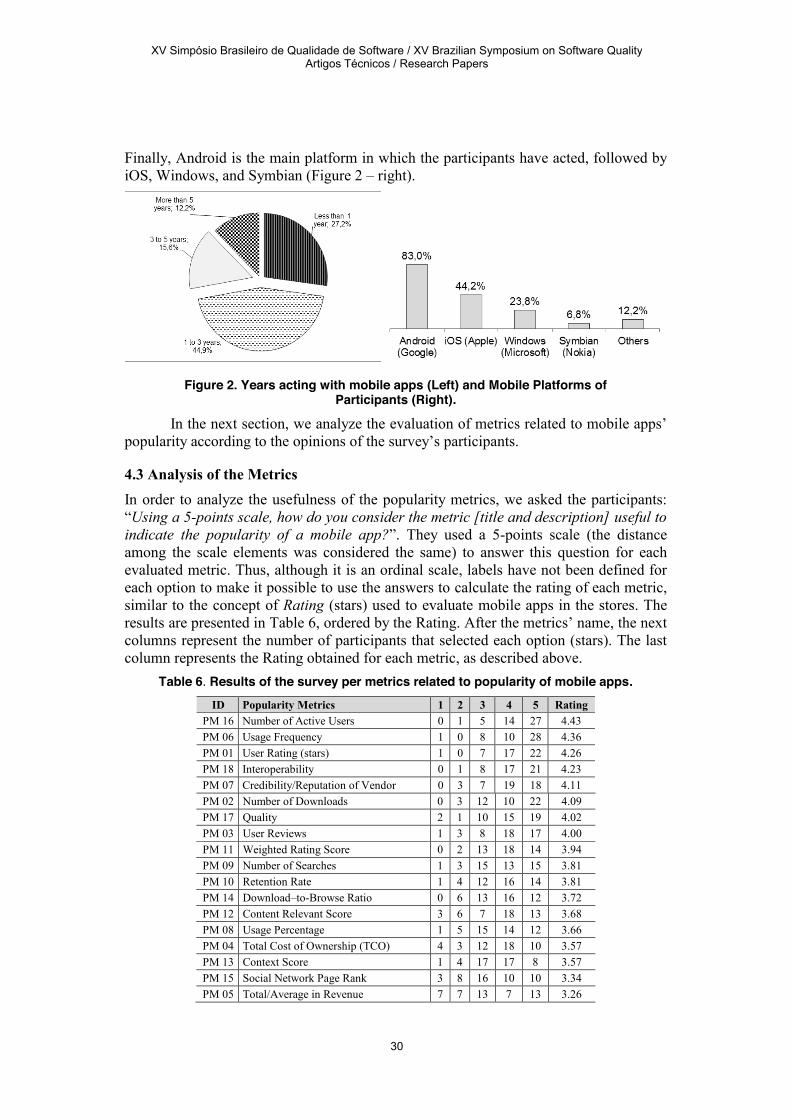
Finally, Android is the main platform in which the participants have acted, followed by iOS, Windows, and Symbian (Figure 2 – right).
Figure 2. Years acting with mobile apps (Left) and Mobile Platforms of Participants (Right).
In the next section, we analyze the evaluation of metrics related to mobile apps’ popularity according to the opinions of the survey’s participants.
4.3 Analysis of the Metrics In order to analyze the usefulness of the popularity metrics, we asked the participants: “Using a 5-points scale, how do you consider the metric [title and description] useful to indicate the popularity of a mobile app?”. They used a 5-points scale (the distance among the scale elements was considered the same) to answer this question for each evaluated metric. Thus, although it is an ordinal scale, labels have not been defined for each option to make it possible to use the answers to calculate the rating of each metric, similar to the concept of Rating (stars) used to evaluate mobile apps in the stores. The results are presented in Table 6, ordered by the Rating. After the metrics’ name, the next columns represent the number of participants that selected each option (stars). The last column represents the Rating obtained for each metric, as described above.
Table 6. Results of the survey per metrics related to popularity of mobile apps. ID Popularity Metrics 1 2 3 4 5 Rating
PM 16 Number of Active Users 0 1 5 14 27 4.43
PM 06 Usage Frequency 1 0 8 10 28 4.36
PM 01 User Rating (stars) 1 0 7 17 22 4.26
PM 18 Interoperability 0 1 8 17 21 4.23
PM 07 Credibility/Reputation of Vendor 0 3 7 19 18 4.11
PM 02 Number of Downloads 0 3 12 10 22 4.09
PM 17 Quality 2 1 10 15 19 4.02
PM 03 User Reviews 1 3 8 18 17 4.00
PM 11 Weighted Rating Score 0 2 13 18 14 3.94
PM 09 Number of Searches 1 3 15 13 15 3.81
PM 10 Retention Rate 1 4 12 16 14 3.81
PM 14 Download–to-Browse Ratio 0 6 13 16 12 3.72
PM 12 Content Relevant Score 3 6 7 18 13 3.68
PM 08 Usage Percentage 1 5 15 14 12 3.66
PM 04 Total Cost of Ownership (TCO) 4 3 12 18 10 3.57
PM 13 Context Score 1 4 17 17 8 3.57
PM 15 Social Network Page Rank 3 8 16 10 10 3.34
PM 05 Total/Average in Revenue 7 7 13 7 13 3.26
XV Simpósio Brasileiro de Qualidade de Software / XV Brazilian Symposium on Software QualityArtigos Técnicos / Research Papers
30
4.4 Threats to Validity Representativeness of sample. We attained a relatively high number of respondents. However, it was not possible to evaluate the representativeness of the sample for our purpose. We were not able to obtain reliable estimators of the total number of mobile app developers to indicate an adequate number. All respondents (from different regions) were selected from communities of mobile app developers (participants act in the main current MSECOs – Android, iOS and Windows), representing the target public to answer this survey. The goal of this study is to get a trend of answers, since surveys are not a conclusive study. We consider these findings as basis for future empirical research that should be confirmed and further explored with experimentation and direct observation.
Training and subjectivity of responses. This study also is subject to the threat of self-aware and difference of training of the subjects that participated, but these two aspect not invalidate our results as we are evaluating the state-of-practice.
5. Comparative Analysis Between the SMS and Survey on Mobile App’s Popularity Metrics In the this section, we present a comparative (correlation) analysis of both studies, trying to understand if the results obtained from the technical literature (by a SMS) is in accordance with the opinion of mobile app developers (obtained by a survey).
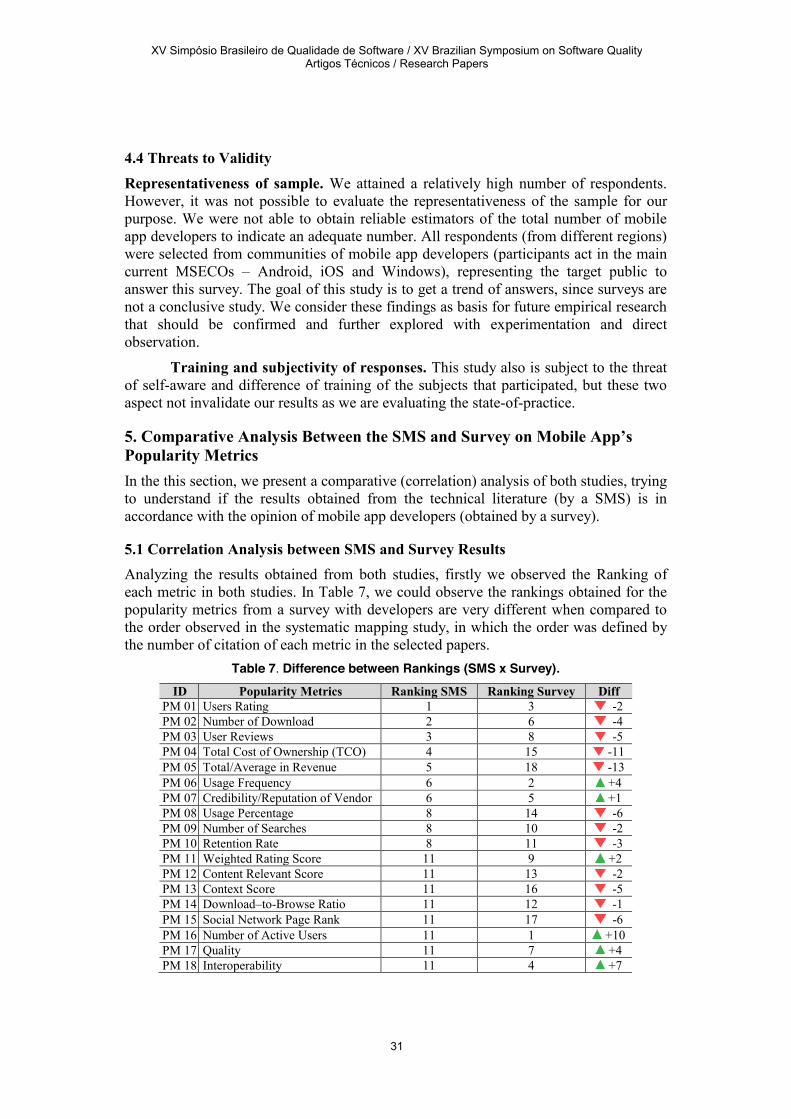
5.1 Correlation Analysis between SMS and Survey Results Analyzing the results obtained from both studies, firstly we observed the Ranking of each metric in both studies. In Table 7, we could observe the rankings obtained for the popularity metrics from a survey with developers are very different when compared to the order observed in the systematic mapping study, in which the order was defined by the number of citation of each metric in the selected papers.
Table 7. Difference between Rankings (SMS x Survey). ID Popularity Metrics Ranking SMS Ranking Survey Diff
PM 01 Users Rating 1 3 -2 PM 02 Number of Download 2 6 -4 PM 03 User Reviews 3 8 -5 PM 04 Total Cost of Ownership (TCO) 4 15 -11 PM 05 Total/Average in Revenue 5 18 -13 PM 06 Usage Frequency 6 2 +4 PM 07 Credibility/Reputation of Vendor 6 5 +1 PM 08 Usage Percentage 8 14 -6 PM 09 Number of Searches 8 10 -2 PM 10 Retention Rate 8 11 -3 PM 11 Weighted Rating Score 11 9 +2 PM 12 Content Relevant Score 11 13 -2 PM 13 Context Score 11 16 -5 PM 14 Download–to-Browse Ratio 11 12 -1 PM 15 Social Network Page Rank 11 17 -6 PM 16 Number of Active Users 11 1 +10 PM 17 Quality 11 7 +4 PM 18 Interoperability 11 4 +7
XV Simpósio Brasileiro de Qualidade de Software / XV Brazilian Symposium on Software QualityArtigos Técnicos / Research Papers
31
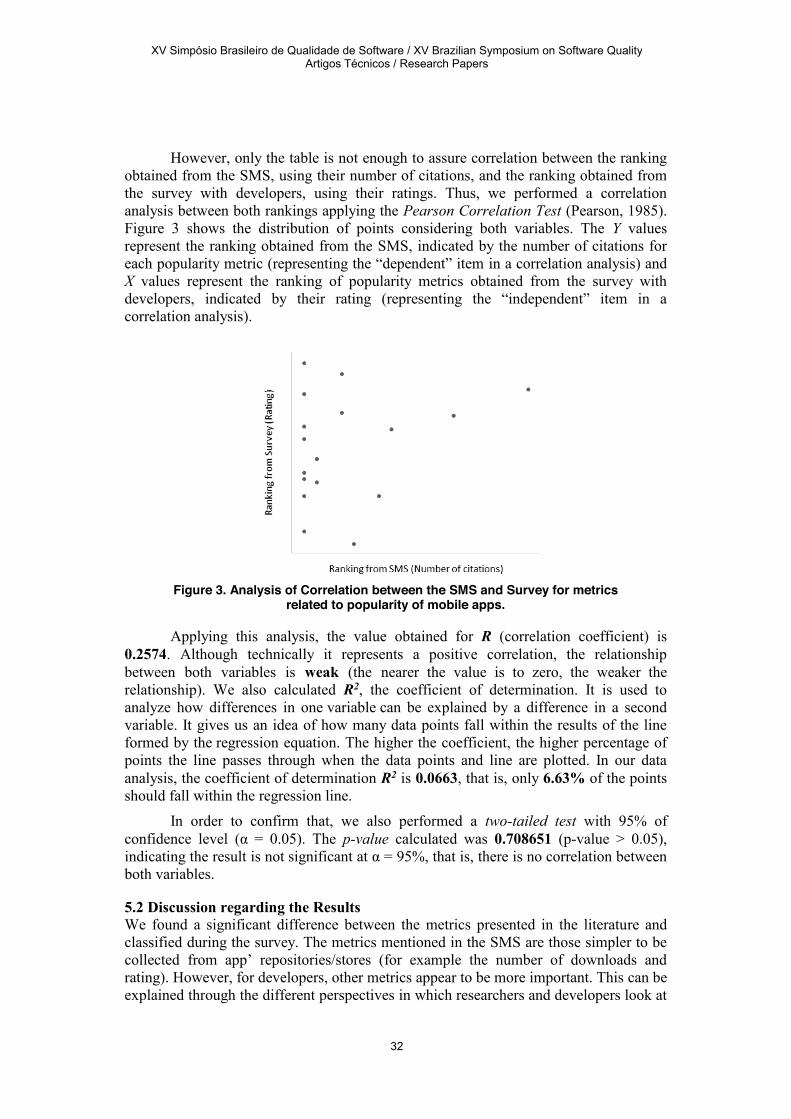
However, only the table is not enough to assure correlation between the ranking obtained from the SMS, using their number of citations, and the ranking obtained from the survey with developers, using their ratings. Thus, we performed a correlation analysis between both rankings applying the Pearson Correlation Test (Pearson, 1985). Figure 3 shows the distribution of points considering both variables. The Y values represent the ranking obtained from the SMS, indicated by the number of citations for each popularity metric (representing the “dependent” item in a correlation analysis) and X values represent the ranking of popularity metrics obtained from the survey with developers, indicated by their rating (representing the “independent” item in a correlation analysis).
Figure 3. Analysis of Correlation between the SMS and Survey for metrics
related to popularity of mobile apps.
Applying this analysis, the value obtained for R (correlation coefficient) is 0.2574. Although technically it represents a positive correlation, the relationship between both variables is weak (the nearer the value is to zero, the weaker the
relationship). We also calculated R2, the coefficient of determination. It is used to analyze how differences in one variable can be explained by a difference in a second variable. It gives us an idea of how many data points fall within the results of the line formed by the regression equation. The higher the coefficient, the higher percentage of points the line passes through when the data points and line are plotted. In our data analysis, the coefficient of determination R2 is 0.0663, that is, only 6.63% of the points should fall within the regression line.
In order to confirm that, we also performed a two-tailed test with 95% of confidence level (α = 0.05). The p-value calculated was 0.708651 (p-value > 0.05), indicating the result is not significant at α = 95%, that is, there is no correlation between both variables.
5.2 Discussion regarding the Results We found a significant difference between the metrics presented in the literature and classified during the survey. The metrics mentioned in the SMS are those simpler to be collected from app’ repositories/stores (for example the number of downloads and rating). However, for developers, other metrics appear to be more important. This can be explained through the different perspectives in which researchers and developers look at
XV Simpósio Brasileiro de Qualidade de Software / XV Brazilian Symposium on Software QualityArtigos Técnicos / Research Papers
32
MSECOs. Analyzing the results from the technical literature perspective, it is possible to observe a greater focus on observing metrics directly linked to overall ecosystem health, covering metrics that express aspects of its main actors (user and mobile apps) and their interactions. Among the main metrics identified from the technical literature, we can cite: user rating, number of downloads, users review. These metrics can be easily retrieved using the data available on app stores. On the other hand, the results obtained from a survey with developers showed that developers are concerned with metrics directly related to their mobile apps, showing acceptance and sustainability of these apps in a MSECO. This scenario suggests that developers want to understand not only the quantitative performance of their apps, as indicated, for instance, by the Number of Downloads, but also how the performance of their mobile apps in qualitative terms. This becomes evident analyzing the most important metrics according to the developers’ opinion: Number of Active Users and Usage Frequency. Future research studies should prioritize metrics more relevant that allow applicability in app industry. Concerning the main metrics indicated by developers, some of them are provided by the mobile platforms (keystones) only for the developer of an app. In the Windows Phone MSECO, for instance, the keystone (Microsoft) provides a service named Visual Studio Application Insights2 that must be activated in a mobile app to provide data regarding Number of Active Users and Usage Frequency (the top 2 metrics). The report generated by the tool provides a high-level look at a mobile app’s usage. The Android MSECO supports its developers with the service Google Analytics3, that lets the developer easily identify unsuccessful/successful features. In the iOS MSECO, Apple (keystone) also provides a service named App Analytics4 included with the Apple Developer Program membership. This service does not require technical implementation to provide information about user engagement (e.g., active user and active devices). The metric User Rating (3rd position according to the developers’ opinion) can help the developer to see the distribution of how users rate a mobile app in the store. All MSECOs provides information about ratings by devices, date and market, what can indicate how to act to improve a mobile app rating in a specific setting (e.g., device and country). Analyzing the 4th metric (Interoperability), the mentioned services help the developers to understand preference of users, for instance, by language, geography, app version and device information. The app store provides this information per category of apps. Finally, the metric Credibility/Reputation of Vendor (5th position) condenses user ratings, number of downloads and user reviews, all provided by the app store. It indicates that the developer prefers to analyze the link among these information as analysis of a mobile app. For other metrics, developers need to be concerned about the collection of these metrics in the development (inserting code to use the provided services in each MSECO) and distribution (when the mobile app is available to users in an app store) phases. This is a current practice because to understand what users do inside a mobile app (user behavior and user value over time) is the key of engaging and monetizing users in the long run. This action helps to construct better mobile apps and supports
2 http://azure.microsoft.com/services/application-insights 3 http://developer.android.com/distribute/analyze/start.html 4 https://developer.apple.com/app-store/app-analytics
XV Simpósio Brasileiro de Qualidade de Software / XV Brazilian Symposium on Software QualityArtigos Técnicos / Research Papers
33
developers’ strategies to enhance and monetize their mobile apps. However, this scenario makes hard to use this information in academic works, since researchers do not have access to these data. The goal was to observe what is the perception of developers regarding these metrics and the intensity of scientific/technical works reporting these metrics and providing suggestions of research topics to be investigated. If a metric cited several times by developers has a small number of works (but they are recent works), this is a hopeful scenario.
6. Conclusion and Future Work In this paper, we presented the results of a mapping study that identified 23 papers that deal with popularity of mobile apps applied to seven different objectives. We extracted 18 metrics cited in these papers that are related to mobile apps’ popularity. These metrics were characterized regarding several attributes. In a second phase, we conducted a survey with 47 mobile apps developers acting in different MSECOs in order to understand and evaluate which metrics they consider important to contextualize popularity (and how useful) in the development of mobile apps. With the results of both studies, we performed a Pearson Correlation analysis between the metrics’ order obtained from the SMS using the number of citations with the order obtained from surveyed developers using the calculate rating. As result, there is no correlation between both variables, suggesting developers understand the importance of metrics to indicate popularity of mobile apps in a different way when compared to the current research that use metrics to deal with popularity of mobile apps. Some reasons to this difference would be some metrics are easier to be collected for scientific research, but they would not represent the main information desired by developers to estimate/indicate popularity of their mobile apps. After analyzing relevant content about mobile app’s popularity, we could observe the application of popularity metrics for several purposes, suggesting the importance of this topic in the context of MSECO. The results extracted in this study can be useful in a broad variety of situations, being helpful for the end user, the developer and the MSECO’s keystone. For users, these metrics are useful to guide mobile apps selection. From the developer’s perspective, they have a set of metrics to evaluate theirs mobile apps acceptance compared to popular apps in the same MSECO. For keynote, the metrics are an important parameter to support MSECO governance activities. As our next challenge related to mobile apps’ popularity, we intend to analyze the relationship among these metrics, MSECO’s roles (e.g.: users, developers, evangelists, keystones) and the MSECO’s health, including surveys with developers. After that, we plan to propose a model to analyze/predict the loss of interest in mobile apps, what could result in popularity decay in the app store. This model would be a valuable tool for developers and companies. Using this information, developers could be aware about the moment when their mobile apps start to become less attractive for user, proving new features and applying some strategy to renew the popularity of their mobile apps. On the other hand, companies could use this information to identify trends and to provide strategies aiming to keep the health of their MSECO in high levels.
XV Simpósio Brasileiro de Qualidade de Software / XV Brazilian Symposium on Software QualityArtigos Técnicos / Research Papers
34
7. Acknowledgment The authors would like to thank FAPEAM and CAPES for the financial support to this research.
References "Popularity." Dictionary.Cambridge.org. Cambridge Dictionaries Online, 2016. Web. 11 June
2016. Apple Appstore [Online]. Available: http://www.apple.com/iphone/from-the-app-store/.
Acessed in 04/25/2016. Bosch, J. (2009) From Software Product Lines to Software Ecosystems. Proceedings of the
13th International Software Product Line Conference (SPLC’09). PA, p. 111-119. Bracher, D. (2015) Vital Metrics For Tracking Your App’s Success. Developer Economics
Blog. Available in: www.developereconomics.com/vital-metrics-tracking-app-success. Acessed in: 02/11/2015.
Dittrich, Y. (2014) Software engineering beyond the project – Sustaining software ecosystems. Information and Software Technology, v. 56, n. 11, p. 1436–1456.
Fontão, A., Santos, R., Dias-Neto, A. C. (2015). Mobile Software Ecosystem: A Systematic Mapping Study. Proceedings of the 39th Annual International Computers, Software & Applications Conference (COMPSAC), Taichung, p. 653-658.
Google Play [Online]. Available: http://play.google.com. Acessed in 04/25/2016. Harrison, R., Flood, D., Duce, D. (2013) Usability of mobile applications: literature review and
rationale for a new usability model. Journal of Interaction Science, vol. 1, p. 1-16. Jansen, S., Cusumano, S. (2012) Defining software ecosystems: A survey of software platforms
and business network governance. Proceedings of the international Workshop on Software Ecosystems, p. 41-58.
Jansen, S., Van Capelleveen, G. (2013) Quality review and approval methods for extensions in software ecosystems. Software Ecosystems – Analyzing and Managing Business Networks in the Software Industry. Edward Elgar Publishing, p. 187–217
Kim, H., Kim, J., Lee, Y., Chae M., Choi, Y. (2002) An Empirical Study of the Use Contexts and Usability Problems in Mobile Internet. Proceedings of the 35th Annual Hawaii International Conference on System Sciences (HICSS'02), Washington, p. 132.
Kitchenham, B., Charters, S. (2007) Guidelines for performing Systematic Literature Reviews in Software Engineering, Technical Report, Keele University, vol. 2, p. 1051.
Lim, S., Bentley, P. (2012) How to be a Successful App Developer: Lessons from the Simulation of an App Ecosystem. SIGEVOlution Journal, vol. 6, p. 2-15.
Lim, S., Bentley, P. (2013) Investigating App Store Ranking Algorithms using a Simulation of Mobile App Ecosystems. IEEE Congress on Evolutionary Computation, Cancun, p. 2672-2679.
Lin, F., Ye, W. (2009) Operating System Battle in the Ecosystem of Smartphone Industry. International Symposium on Information Engineering and Electronic Commerce, p. 617-621.
Linaker, J., Sulaman, S., Mello, R., Host, M., Runeson, P. (2015) Guidelines for Conducting Surveys in Software Engineering. Technical Report, LTH, Lund University.
Manikas, K., Hansen, M. (2013) Software ecosystems – A systematic literature review, J. Syst. Softw., vol. 86, no.5, p.1294-1306.
Pearson, K. (1895) Notes on regression and inheritance in the case of two parents. Proceedings of the Royal Society of London, p. 240–242.
Petersen, K., Vakkalanka, S., Kuzniarz, L. (2015) Guidelines for conducting systematic mapping studies in software engineering: An update. Information and Software Technology, vol. 64, p. 1-18.
XV Simpósio Brasileiro de Qualidade de Software / XV Brazilian Symposium on Software QualityArtigos Técnicos / Research Papers
35