Embed Size (px)
Citation preview
NBER WORKING PAPER SERIES
AN EMPIRICAL ANALYSIS OF 'ACTING WHITE'
Roland G. Fryer, Jr.Paul Torelli
Working Paper 11334http://www.nber.org/papers/w11334
NATIONAL BUREAU OF ECONOMIC RESEARCH1050 Massachusetts Avenue
Cambridge, MA 02138May 2005
This research uses data from Add Health, a program project designed by J. Richard Udry, Peter S.Bearman, and Kathleen Mullan Harris, and funded by a grant P01-HD31921 from the National Instituteof Child Health and Human Development, with cooperative funding from 17 other agencies. Specialacknowledgment is due Ronald R. Rindfuss and Barbara Entwistle for assistance in the original design.Persons interested in obtaining data from Add Health should contact Add Health, Carolina PopulationCenter, 123 W. Franklin Street, Chapel Hill, NC 27516-2524 ([email protected]). We are gratefulto George Akerlof, Pol Antras, David Card, Prudence Carter, Kenneth Chay, William Darity, FedericoEchenique, Ronald Ferguson, Edward Glaeser, Michael Greenstone, Jennifer Hochschild, ChristopherJencks, Adrianna Lleras-Muney, Lawrence Kahn, Lisa Kahn, Lawrence Katz, Rachel Kranton, StevenLevitt, Glenn Loury, Linda Loury, Jens Ludwig, Ted Miguel, Emily Oster, Paul Peterson, Mica Pollock,Gavin Samms, Jesse Shapiro, and Andrei Shleifer for helpful comments and suggestions. AlexanderKaufman and Patricia Foo provided exceptional research assistance. Direct all correspondence to Fryerat Harvard University, 1875 Cambridge Street, Cambridge MA 02138 [e-mail: [email protected].]The usual caveat applies. The views expressed herein are those of the author(s) and do not necessarilyreflect the views of the National Bureau of Economic Research.
© 2005 by Roland G. Fryer, Jr. and Paul Torelli. All rights reserved. Short sections of text, not to exceedtwo paragraphs, may be quoted without explicit permission provided that full credit, including © notice,is given to the source.
An Empirical Analysis of 'Acting White'Roland G. Fryer, Jr. and Paul TorelliNBER Working Paper No. 11334May 2005JEL No. J0,I2
ABSTRACT
There is a debate among social scientists regarding the existence of a peer externality commonly referredto as 'acting white.' Using a newly available data set (the National Longitudinal Study of AdolescentHealth), which allows one to construct an objective measure of a student's popularity, we demonstratethat there are large racial differences in the relationship between popularity and academic achievement;our (albeit narrow) definition of 'acting white.' The effect is intensified among high achievers and inschools with more interracial contact, but non-existent among students in predominantly black schoolsor private schools. The patterns in the data appear most consistent with a two-audience signaling modelin which investments in education are thought to be indicative of an individual's opportunity costsof peer group loyalty. Other models we consider, such as self-sabotage among black youth or the presenceof an oppositional culture, all contradict the data in important ways.
Roland G. Fryer, Jr.Department of EconomicsHarvard UniversityLittauer Center 208Cambridge, MA 02138and [email protected]
Paul Torelli Harvard [email protected]
2
“Go into any inner city neighborhood, and folks will tell you that government alone can’t teach kids to learn. They know that parents have to parent, that children can’t achieve unless we raise their expectations and turn off the television sets and eradicate the slander that says a black youth with a book is acting white.” Senator Barack Obama, 2004 Democratic National Convention Keynote Address
I. Introduction
The racial achievement gap in education is a vexing reality. Black children enter
kindergarten lagging whites, and these differences grow throughout the school years.1 On
every subject at every grade level there are large achievement differences between Blacks
and Whites (Campbell, Hombo, and Mazzeo 2000, Neal 2004). The typical Black
seventeen year-old reads at the proficiency level of the typical White thirteen year-old
(Campbell, Hombo, and Mazzeo 2000). On the Scholastic Aptitude Test, Black students
score, on average, more than one standard deviation below white college goers (Card and
Rothstein 2004). Even in affluent neighborhoods, the racial divide is daunting (Ferguson
2001, 2002 and Ogbu and Davis 2003). Accounting for a host of background factors, the
achievement gap remains essentially unchanged (Jencks and Phillips 1998).
Gaining a better understanding of the underlying causes of the achievement gap is
a question of great importance. Neal and Johnson (1996) and O’neill (1990) find that
most of the observed black-white differential in wages among adults disappears once pre-
market test scores are taken into account. Thus, eliminating the test score gap that exists
at labor market entry may be a critical component of reducing racial wage inequality.
1 This fact was first established by Coleman et al. (1966). For more recent analysis, see Campbell, Hombo, and Mazzeo (2000), Carneiro and Heckman (2002), Fryer and Levitt (2004, 2005), Neal (2004), or Phillips, Crouse, and Ralph (1998).
3
A wide variety of possible explanations for the test score gap have been put forth.
These explanations include differences in genetics (Hernstein and Murray 1994, Jensen
1973), differences in family structure and poverty (Armor 1992, Brooks-Gunn and
Duncan 1997), differences in school quality (Cook and Evans 2000), racial bias in testing
or teachers’ perceptions (Delpit 1995, Ferguson 1998, Rodgers and Spriggs 1996), and
differences in peer culture, socialization, or behavior (Austen-Smith and Fryer 2005,
Cook and Ludwig 1997, Fordham and Ogbu 1986, Steele and Aronson 1998). The
appropriate public policy choice to address the achievement gap may depend critically on
the underlying source.
In this paper, we focus on a highly controversial and well-publicized aspect of
Black peer culture – the existence of a peer externality commonly referred to as ‘acting
white.’2 ‘Acting White’ describes a set of social interactions in which Black adolescents
ridicule other black adolescents for investing in behaviors characteristic of whites (having
an interest in ballet, raising their hand in class, or making good grades, e.g.).3 A primary
obstacle to the study of ‘acting white’ has been the lack of quantitative measures of the
phenomenon. We focus on racial differences in the relationship between popularity and
academic achievement, our (albeit narrow) definition of ‘acting white’.
To circumvent the problems inherent in using self-reported popularity measures,
we construct an index of social status. The index measures, for each student, the number
2 It is imperative to note that there is nothing unique about Black culture. A version of ‘acting white’ is also prevalent in ethnographies involving the Buraku Outcastes of Japan (DeVos and Wagatsuma 1966), Italian immigrants in Boston's West End (Gans 1962), the Maori of New Zealand (Chapple, Jefferies, and Walker 1997), and the working class in Britain (Willis 1977), among others. In all cases high achievers receive a derogatory label from their peer group. For example, in the peer group society documented in Gans (1962), upward mobile youth interested in education were labeled “mobiles” and “sissies.” See Fryer (2004) for a detailed discussion of these groups. Furthermore, we examine Hispanics in addition to blacks throughout this paper. 3 There are many working definitions of ‘acting white’ which we discuss in section II.
4
of same-race friends within her school, weighted by the popularity of each friend. We
implement the index using detailed information on friendship networks within schools
available in the National Longitudinal Study of Adolescent Health (Addhealth).
Addhealth is, in many respects, the ideal data for understanding the existence of ‘acting
white.’ To our knowledge, it is the only available dataset that contains within-school
friendship networks, from which it is possible to construct objective measures of social
status, along with detailed data on parental characteristics, academic achievement, and so
forth. The survey covers a sample of more than 90,000 junior high and high school
students from 175 schools in 80 communities around the country.
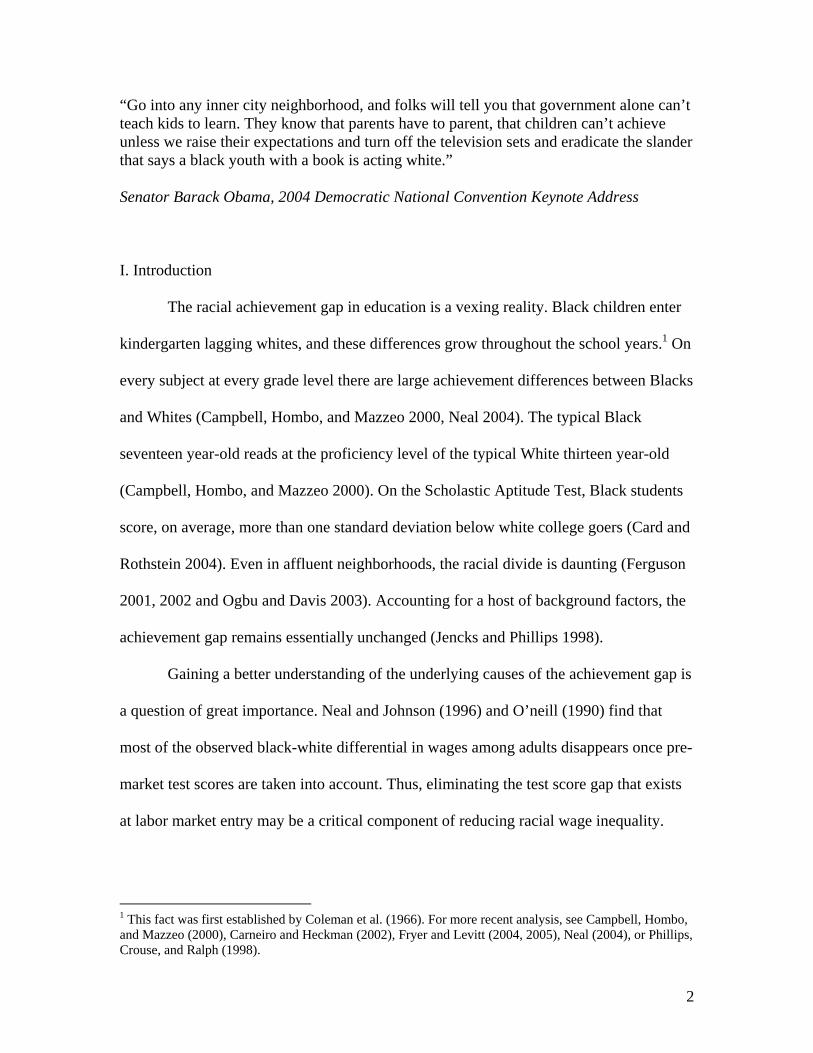
Our empirical analysis of ‘acting white’ uncovers a rich set of new facts. In
contrast to the previous literature (Cook and Ludwig 1997), Figure 1A demonstrates that
there are large racial differences in the relationship between popularity and academic
achievement. Among whites, higher grades yield higher popularity. For Blacks, higher
achievement is associated with modestly higher popularity until a grade point average of
3.5, when the slope turns negative. A black student with a 4.0 has, on average, 1.5 fewer
same-race friends than a white student with a 4.0. Among Hispanics, there is little change
in popularity from a grade point average of 1 through 2.5. After 2.5, the gradient turns
sharply negative. A Hispanic student with a 4.0 grade point average is the least popular of
all Hispanic students, and has 3 fewer friends than a typical white student with a 4.0
grade point average. Put differently, evaluated at the sample mean, a one standard
deviation increase in grades is associated with roughly a .103 standard deviation decrease
in social status for Blacks and a .171 standard deviation decrease for Hispanics. For
students with a 3.5 grade point average or better, the effect triples.
5
Racial differences in the relationship between popularity and achievement are
robust across many alternative specifications, subsets of the data, and different definitions
of popularity or academic achievement. The ‘acting white’ effect differs slightly as
children age. For Black students in junior high school (grades 7-9) a one standard
deviation increase in grades is associated with a .13 standard deviation decrease in
popularity; the decrease is .07 for high school students. Accounting for the number of
students at each GPA level does little to temper the ‘acting white’ effect, suggesting that
the supply of potential friends does not explain the phenomenon. Self-selection of
students into particular activities (sports, band, debate, etc) matters little, and substitution
towards other race friendships does not fully explain the stark difference in the popularity
– achievement gradient. Using class rank (in lieu of GPA) as a measure of academic
achievement confirms our results.
We conclude by describing a model which highlights the tradeoff between peer
group acceptance and academic achievement; a variant of Austen-Smith and Fryer
(2005). The principal idea is that individuals face a two-audience signaling quandary:
signals that beget labor market success are signals that induce peer rejection. The model’s
two distinguishing predictions – racial differences in the relationship between peer group
acceptance and academic achievement will exist and these differences will be
exacerbated in arenas that foster more interracial contact or increased mobility – are
borne out in the data. ‘Acting white’ is more salient in public schools and schools in
which the percentage of black students is less than twenty, but non-existent among blacks
in predominantly black schools or those who attend private schools. Schools with more
interracial contact have an ‘acting white’ coefficient twice as large as more segregated
6
schools (seven times as large for Black males). Other models we consider, such as self-
sabotage among black youth or the presence of an oppositional culture identity, all
contradict the data in important ways.
The remainder of the paper is structured as follows. Section II provides a brief
review of the literature on ‘acting white.’ Section III describes and summarizes the data
used in the analysis. Section IV estimates the relationship between popularity and
academic achievement among racial groups. Section V develops a two-audience
signaling model, that highlights the tradeoff between peer group acceptance and
academic achievement, which is consistent with the data. Section VI concludes. There are
two appendices: an appendix which reconciles our results with those found in previous
analysis of nationally representative data, and a data appendix which provides the details
of our sample and definitions of relevant variables.
II. Background and Previous Literature
‘Acting white’ is a slippery and politically loaded phrase, with little consensus on
a precise definition. Neal-Barnett (2001) assembled student focus groups in an attempt to
deduce what specific behaviors led to accusations of ‘acting white.’ The list included
being enrolled in honors or advanced placement classes, speaking standard English,
wearing clothes from the Gap or Abercrombie and Fitch (instead of Tommy Hilfiger or
FUBU), and wearing shorts in the Winter! While we are cognizant of the complications
and nuances in what is often meant by ‘acting white,’ our data are not rich enough to test
many of the plausible definitions. 4 As such, for the purposes of this paper, we say
4 See Ferguson (1998) for a very nice discussion.
7
‘acting white’ exists if there are statistically significant racial differences in the
relationship between popularity and grades.
For nearly two decades, there has been a rancorous debate among sociologists,
cultural anthropologists, newspaper journalists and policy wonks on the existence of
‘acting white’. Fordham and Ogbu (1986) set the stage with their path-breaking and
controversial analysis of “Capital High,” a predominantly black high school in a low-
income area of Washington, D.C. Fordham and Ogbu (1986) argue for the existence of an
oppositional culture among black youth that eschew behaviors traditionally seen as the
prerogative for whites.
Following the seminal work of Fordham and Ogbu (1986), there has been a flurry
of conflicting opinions as to the nature, extent, and definition of ‘acting white’.
Ethnographic evidence is hopelessly divided, and the only two nationally representative
studies dismiss ‘acting white’ as nothing more than an urban (or more precisely,
ethnographic) legend.
An interesting feature of the ethnographic literature is that many studies report
some negative relationship between “white behaviors” and social status among blacks.5
The key differences lie in the fact that many of the authors do not report that academic
achievement, per se, is identified as a “white behavior.” That is, the literature paints a
picture whereby Black kids do not ridicule other Black kids for making good grades –
instead, they ridicule them for the behaviors that are often associated with good grades
(answering questions in class, being in advanced classes, or proper diction e.g.). Even
when academic achievement is highly correlated with “white behaviors,” many authors
5 See, for example, Ferguson (2001), Roderick (2003), Horvat and Lewis (2003), Bergin and Cooks (2002), Datnow and Cooper (1996), Chin and Phillips (2004), Farkas et. al (2002), and Tyson et. al. (2004).
8
seemingly prefer to make a distinction between resenting achievement and resenting
behaviors that are associated with achievement.6
Although understanding the precise behaviors that lead to accusations of ‘acting
white’ may be useful in designing effective policies. The first-order problem is whether
racial differences in the relationship between social status and achievement exist, as such
differences feed into student’s investment decisions regarding human capital, social
affiliations, and so on.7
There have been two previous studies on the existence of ‘acting white’ using
nationally representative data (Cook and Ludwig 1998 and Ainworth-Darnell and
Downey 1998), both based on the National Educational Longitudinal Study (NELS).
These studies provide evidence that peer group norms are not significantly different
between black and white 10th graders by examining the relationship between self-reported
measures of popularity and academic achievement. Cook and Ludwig (1998) find that
high-achievers are actually more popular than low-achievers, and that this positive
achievement-popularity relationship is not significantly different between whites and
blacks – if anything, the relation is stronger among blacks, providing evidence that
suggest the ‘acting white’ phenomenon is not empirically important.8
One shortcoming of the previous work is that it relies on self-reported measures
of popularity. The NELS contains a question that asks if the student “thinks others see
6 This reticence could be due, in part, to the fear that some may equate ‘acting white’ with Black cultural dysfunctionality. Yet, economic theory informs us that ‘acting white’ is an equilibrium phenomenon; it is the consequence of two-audience signaling (see Austen-Smith and Fryer 2005). As such, any group presented with the same set of payoffs, strategies, and so on, would behave identically. 7 For example, some black students may be accused of ‘acting white’ because of the way they talk or dress, not because they get good grades. This may be because they are in high-ability classes (AP, Honors, etc) where there are few black students, and consequently their social circle may have few blacks. See Ferguson (2001). 8 Their results hold even when they control for nonacademic variables that influence popularity, including family income and participation in varsity sports or band (Cook and Ludwig 1997).
9
him/her as popular.” The answer choices are: not at all; somewhat; or very.
Unfortunately, it is doubtful that individuals truthfully report potentially self-damaging
information.9 The result is a classic measurement error problem which may lead to
misleading inferences (beyond greater standard errors) if the error in the self-reported
variable is related to race or achievement levels.10
III. The Data
The Addhealth database is a nationally representative sample of 90,118 students
entering grades 7 through 12 in the 1994-1995 school year. A stratified random sample of
20,745 students was given an additional (and remarkably comprehensive) in-home
interview; 17,700 parents of these children were also interviewed. Thus far, information
has been collected on these students at 3 separate points in time: 1995, 1996, and 2002.
There are 175 schools in 80 communities included in the sample, with an average of more
than 490 students per school, allowing within school analysis. Students who are missing
data on race, grade level, or attend schools that do not assign grades are dropped from the
sample.
A wide range of data are gathered on the students, as described in detail on the
Addhealth website (http://www.cpc.unc.edu/projects/addhealth). For our purposes, the
key feature of the Addhealth data is the detailed information regarding friendship
associations in schools. All students contained in the in-school survey were asked, “List 9 A classic example of this is that roughly 25% of non-voters report having voted immediately after an election. See Tanur (1992) for more examples of this bias. We are grateful to Jennifer Hochschild for pointing us to this literature. 10 Another potential weakness with the previous studies is that achievement levels are defined dichotomously. Cook and Ludwig (1997) use two such measures: (1) whether the student earns “mostly A’s in math”; and whether the student is in the honor society. When we investigate how popularity varies across a continuous measure of achievement (GPA) using their data and our basic specification, we find that ‘acting white’ exist and is robust to including a myriad controls. See Appendix A and Table 5.
10
your closest male/female friends. List your best male/female friend first, then your next
best friend, and so on.” Students were allowed to list as many as 5 friends from each sex.
Each friend can be linked in the data and the full range of covariates in the in-school
survey (race, gender, grade point average, etc) can be gleaned from each friend.
To circumvent the problems inherent in using self-reported measures of
popularity, we make use of the information on friendship networks within schools to
construct an “objective” measure of social status. Each student was asked to list 10
friends in their school. Instead of using raw counts, our measure of popularity for an
individual i depends on the number of same-race students, j, that list i as a friend,
weighted by the popularity of each j.11 The key innovation here is that we want a student
to be more popular the more popular her friends are. That is, if students A and B have the
same number of individuals who list them as a friend – student A will be more popular if
and only if her friends are more popular. We call this the Spectral Popularity Index and
provide a formal definition below.12
Let K denote a finite set of students, let H be a finite set of race and ethnic groups,
and let HKa →: denote an assignment of students to a race. Thus, ( )kah = implies
that (under assignment a ) student Kk ∈ belongs to race Hh∈ . And, let haA denote the
same-race friendship network of race h under assignment a.
11 We emphasis same-race friends, because we believe it is most consistent with the sociological notion of ‘acting white.’ All our results are robust to including popularity from all racial groups. 12 The Spectral Popularity Index is a special case of the Spectral Segregation Index developed in Echenique and Fryer (2005).
11
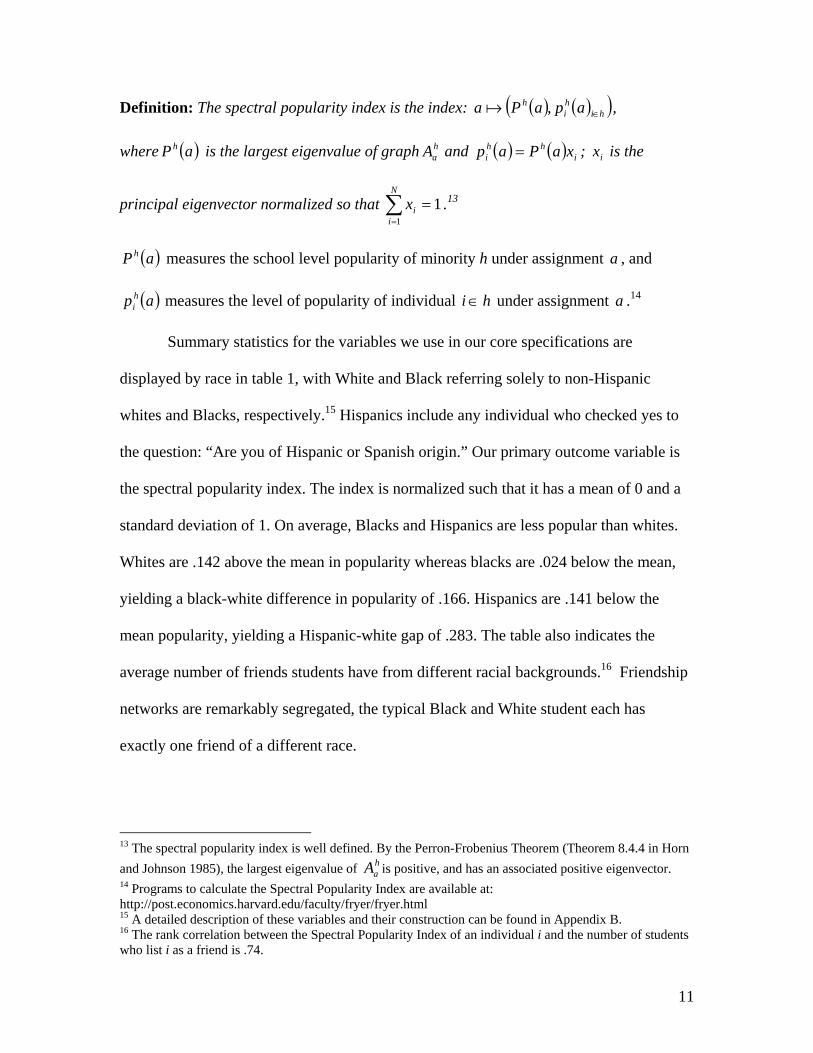
Definition: The spectral popularity index is the index: ( ) ( )( )hihi
h apaPa ∈,a ,
where ( )aPh is the largest eigenvalue of graph haA and ( ) ( ) i
hhi xaPap = ; ix is the
principal eigenvector normalized so that 11
=∑=
N
iix .13
( )aPh measures the school level popularity of minority h under assignment a , and
( )ap hi measures the level of popularity of individual hi∈ under assignment a .14
Summary statistics for the variables we use in our core specifications are
displayed by race in table 1, with White and Black referring solely to non-Hispanic
whites and Blacks, respectively.15 Hispanics include any individual who checked yes to
the question: “Are you of Hispanic or Spanish origin.” Our primary outcome variable is
the spectral popularity index. The index is normalized such that it has a mean of 0 and a
standard deviation of 1. On average, Blacks and Hispanics are less popular than whites.
Whites are .142 above the mean in popularity whereas blacks are .024 below the mean,
yielding a black-white difference in popularity of .166. Hispanics are .141 below the
mean popularity, yielding a Hispanic-white gap of .283. The table also indicates the
average number of friends students have from different racial backgrounds.16 Friendship
networks are remarkably segregated, the typical Black and White student each has
exactly one friend of a different race.
13 The spectral popularity index is well defined. By the Perron-Frobenius Theorem (Theorem 8.4.4 in Horn and Johnson 1985), the largest eigenvalue of h
aA is positive, and has an associated positive eigenvector. 14 Programs to calculate the Spectral Popularity Index are available at: http://post.economics.harvard.edu/faculty/fryer/fryer.html 15 A detailed description of these variables and their construction can be found in Appendix B. 16 The rank correlation between the Spectral Popularity Index of an individual i and the number of students who list i as a friend is .74.
12
The remainder of Table 1 presents summary statistics for the other variables used
in our analysis. The most important of these covariates is a composite measure of grade
point average (GPA) that we constructed. Each student was asked, “At the most recent
grading period, what was your grade in each of the following subjects?” The subjects
included were English/Language Arts, Mathematics, History/Social Studies, and
Science.17 Each of these grades was given on a 4.0 scale (A= 4, D or Lower =1). Relative
to whites, Blacks and Hispanics have lower grades (3.0 grade point average relative to
2.5).18
Other variables used as controls include: parental education, parental occupation,
various school activities (varsity sports, student government, and cheerleading) and
school characteristics. There are substantial differences across races on many of these
variables. Black and Hispanic students come from lower socio-economic status families
(mother and father less likely to be college educated and work in professional jobs), are
more likely to live in urban neighborhoods and less likely to attend private schools, and
so on. While this may seem like a stylized set of covariates to use, they comprise all the
social and demographic variables available in the in-school survey of 90,118 students.19
We strongly caution against a causal interpretation of the coefficients on the
covariates, which we view as proxies for a broad set of environmental and behavioral
factors. Even our main parameter is not void of the potential for reverse causality. We
17 In calculating the GPA of each student, we only used courses in which valid grades were received, as some students did not take particular subjects in every grading period. Students who did not have a grading period that academic year were told to provide grades from the last grading period of the previous academic year. Students in schools that do not assign grades were dropped from the sample. 18 There is some evidence that blacks overstate their grades (Bauman 1996). Our calculations, using the National Educational Longitudinal Study which contains transcript data and self-reported grades, suggests that blacks exaggerate their grades by .3 grade points, on average. 19 A much more exhaustive set of covariates is available for individuals who completed the in-home survey (covering approximately ¼ of the sample).
13
implicitly assume that high grades cause lower popularity; it is plausible that low
popularity causes high grades. Given our interest is in the racial differences in this
relationship, there is less worry.
IV. Racial Differences in the Relationship between Popularity and Achievement
Figure 1A presents the relationship between popularity and grades among whites,
blacks, and Hispanics in the raw data. At low grade point averages, there is little
difference among racial groups in the relationship between popularity and grades; blacks
are more popular than whites. At roughly a 2.5 GPA (an even mix of B’s and C’s) racial
differences start to emerge. Hispanic students lose popularity at an alarming rate after this
cut-off – while Blacks and Whites continue to garner friends as their grades increase; the
white slope is steeper. Black popularity peaks at a grade point average of roughly 3.5 and
turns down afterward. Blacks with straight A’s are as popular as Blacks with a 2.9 GPA.
Whites continue to gain popularity as their grades increase.
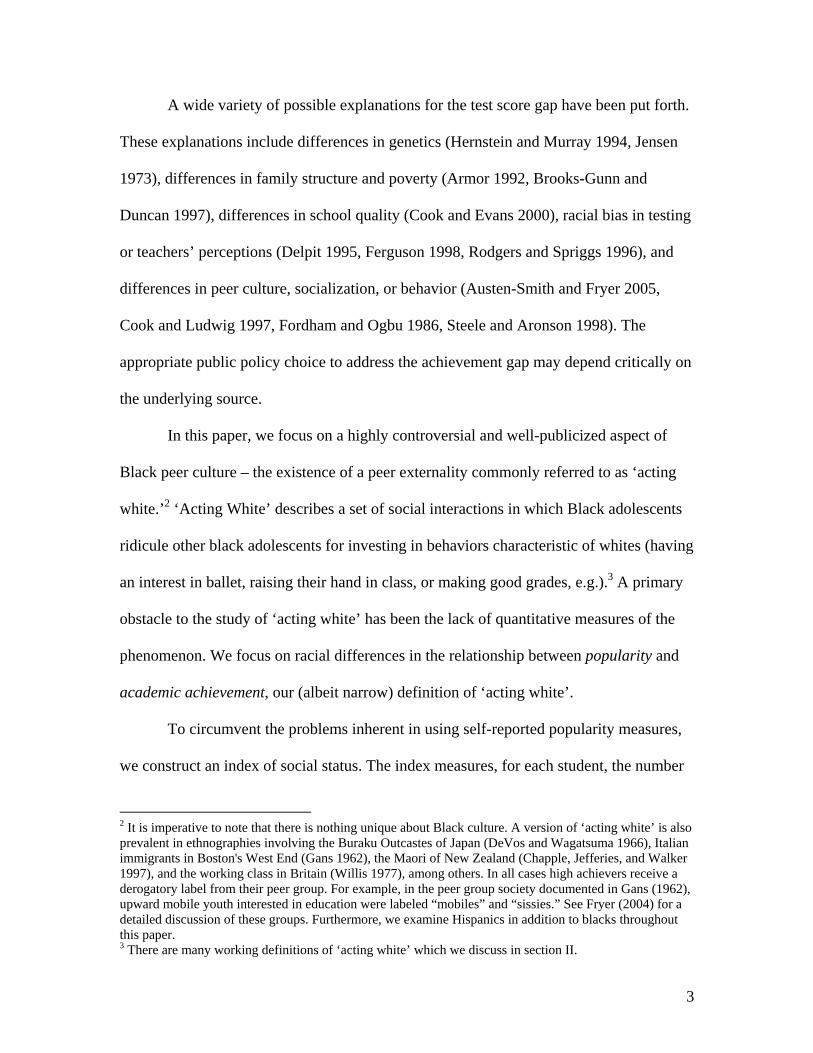
Racial differences in the popularity-grades gradient may be due to various
background factors that are positively related to popularity (having high income parents,
e.g.). Figure 1B estimates a non-parametric relationship between popularity and grades
for Blacks, Hispanics, and Whites, controlling for background factors including school
fixed effects. 20 Our core set of controls include gender, age, parental education and
20 To understand the details, consider the following model: ( ) eXgradesHpopularity ++= γ . We cannot estimate this directly because we do not know H(.). But, ( ) ( ) )|()|(| gradeseEgradesXEgradesHgradespopularityE ++= γ . Taking the difference,
( ) )]|([)]|([| gradeseEegradesXEXgradespopularityEpopularity −+−=− γ . Thus, to obtain
( )gradesH , one needs to: (1) obtain estimates of E(popularity|grades) by running a non-parametric regression of popularity on grades; (2) obtain estimates of E(X|grades) by running a non-parametric regression of X on grades; (3) compute popularity - E(popularity|grades) and X - E(X|grades); (4) obtain
14
occupation, a measure of (self-reported) effort, and various school activities such as
cheerleading, athletics, and student government. Figure 1B demonstrates that including
these controls shrinks the popularity differential among low achievers while maintaining
the shape of the popularity-grades gradient. Black and Hispanic high achievers continue
to be much less popular than similar whites.
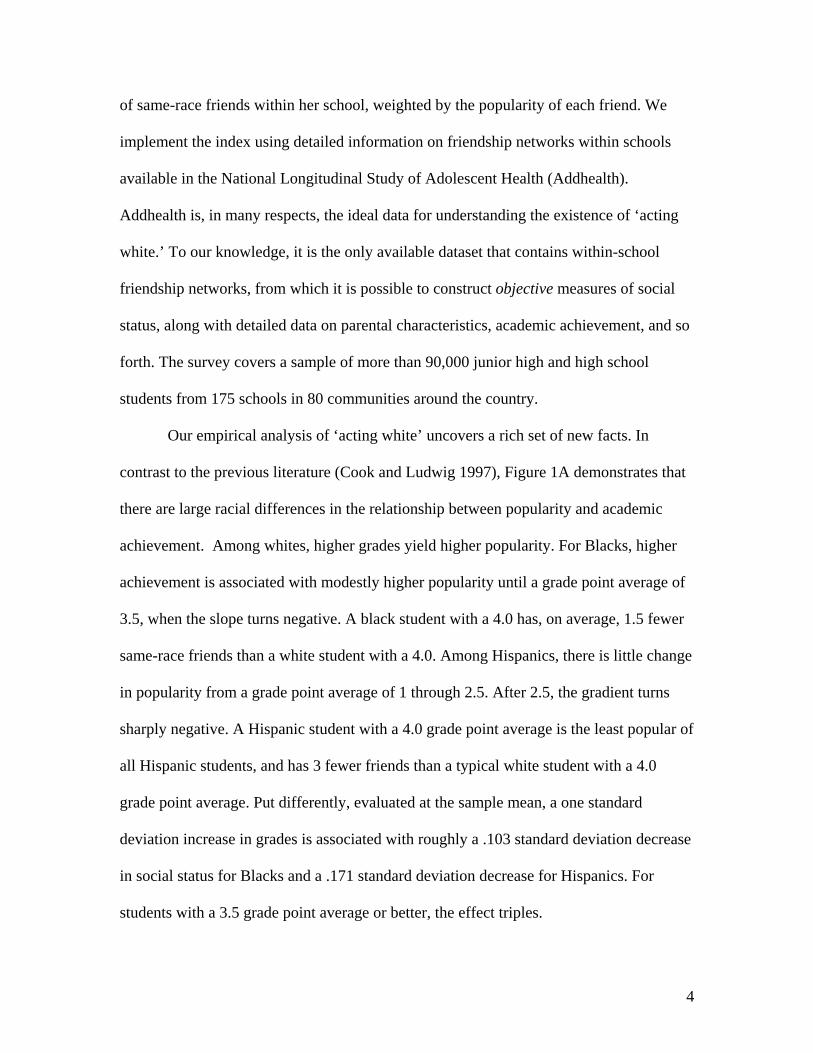
Figure 2 estimates a similar non-parametric relationship between popularity and
grades for Blacks, Hispanics, and Whites, by gender. The relationship is remarkably
similar between boys and girls. One caveat: black high achieving boys have fewer friends
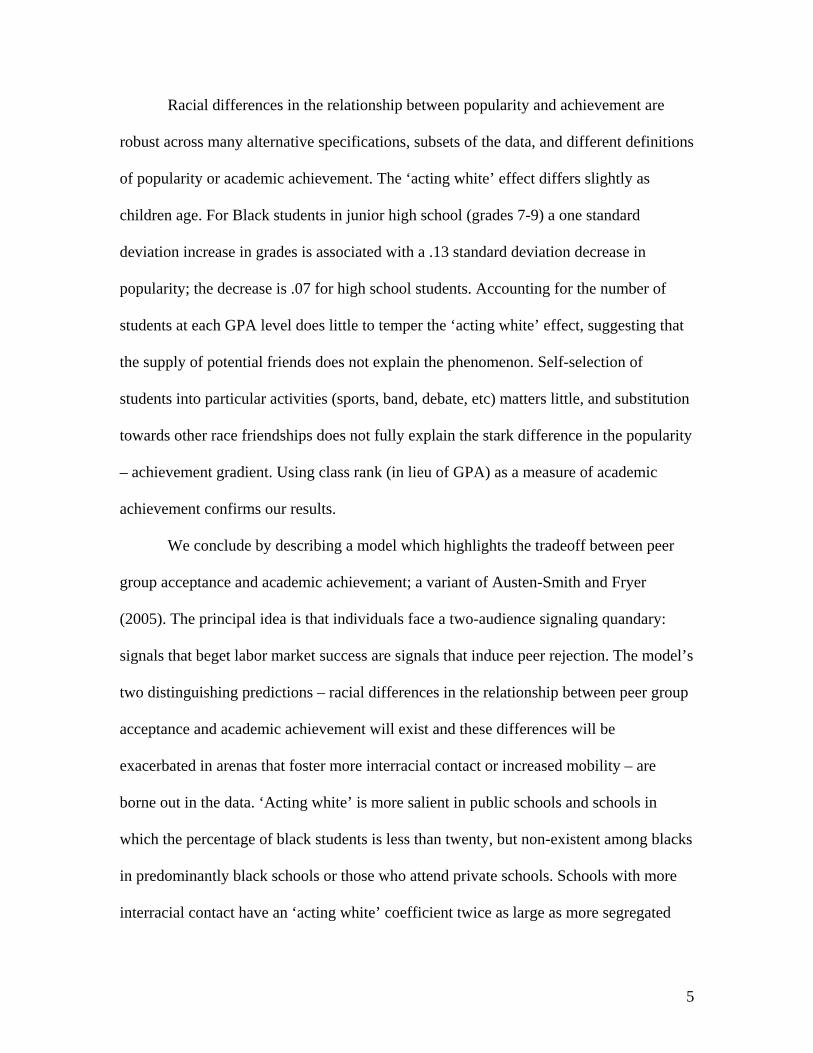
than black high achieving girls. Students in public and private schools face a very
different tradeoff between popularity and grades, as demonstrated in Figure 3. Public
schools mirror the aggregate data presented in Figure 1B. In private schools, Whites with
higher grades are not as popular as their lower achieving peers; the most popular students
have a GPA of roughly 2.0 (C average). For blacks, the gradient is virtually flat. In levels,
Blacks are substantially less popular than whites, which is an artifact of our same-race
popularity measure.
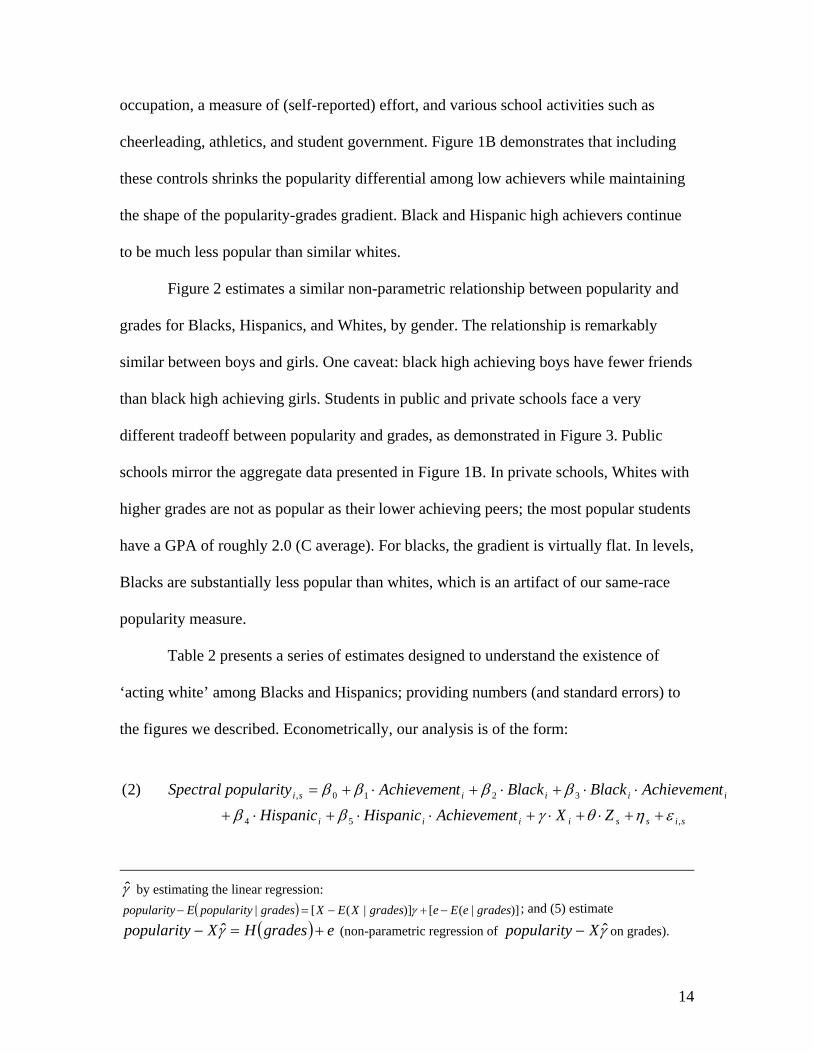
Table 2 presents a series of estimates designed to understand the existence of
‘acting white’ among Blacks and Hispanics; providing numbers (and standard errors) to
the figures we described. Econometrically, our analysis is of the form:
sissiiii
iiiisi
ZXtAchievemenHispanicHispanictAchievemenBlackBlacktAchievemenopularitySpectral p
,54
3210,
)2(
εηθγββ
ββββ
++⋅+⋅+⋅⋅+⋅+
⋅⋅+⋅+⋅+=
γ̂ by estimating the linear regression:
( ) )]|([)]|([| gradeseEegradesXEXgradespopularityEpopularity −+−=− γ ; and (5) estimate
( ) egradesHXpopularity +=− γ̂ (non-parametric regression of γ̂Xpopularity − on grades).
15
where iX denotes an array of individual level variables for agent i, sZ represents school
level variables, and sη denotes an exhaustive set of school dummies. The model is
estimated on a sample of only Black, White, and Hispanic students; thus 2β and 3β are
interpreted as black coefficients relative to whites and 4β and 5β are Hispanic coefficients
relative to whites. We refer to 3β and 5β as the ‘acting white’ coefficients for Blacks and
Hispanics, respectively. The dependent variable is our spectral popularity index. The
independent variables are constant across columns and include: (self-reported) grades and
effort, socioeconomic background (parental occupation and education), and school
activities (cheerleading, sports, and student government). In all cases the estimation is
done using weighted least squares, with weights corresponding to sample weights
provided in the data, and includes school fixed effects. By comparing students who attend
the same school (and likely live in similar neighborhoods), one controls for different
grading standards, social norms, and mean popularity levels across schools.21
Column 1 of Table 2 estimates our specification on the full sample of students.
These results confirm the results illustrated in Figure 1; the ‘acting white’ coefficient is
large and statistically significant for Blacks and Hispanics. To account for the non-
linearity inherent in the relationship between popularity and achievement, we group
students into four categories based solely on GPA: 1 to 2.0, 2.0 to 3.0, 3.0 to 3.5, and 3.5
and higher.22 These categories are roughly aligned with the changes in slope apparent in
Figure 1B.
21 For instance, if high-achieving black students attend schools where grading standards are lax and popularity levels inflated, then this specification will purge the upward bias. 22 The results to come are similar if one includes higher order polynomials on grades as regressors, though the interpretation of the coefficients is more convoluted.
16
The salience of ‘acting white’ increases monotonically with achievement. For low
achievers (students with less than a 2.0 GPA) there is no ‘acting white’ effect, which is
consistent with Figure 1B. For students with a 3.5 GPA or better, the ‘acting white’
coefficient is -.329, over three times the magnitude of the effect in the overall sample.
This captures the divergence in popularity among black and white high achievers
depicted in figure 1B. For Hispanics, the results are more mixed. The smallest effect
exists among low achievers, but ‘acting white’ is most salient among Hispanics with
grade point averages between 3 and 3.5.
A. Sensitivity Analysis and Extensions of the Basic Model
In an effort to uncover other factors that are associated with ‘acting white,’ Tables
3 and 4 explore the sensitivity of our results across a wide variety of sub-samples of the
data and alternative specifications. We estimate separate regressions for each indicated
sub-sample of the data. Table 3 estimates regressions on the full sample of students; table
4 restricts the sample to students with a 3.5 GPA or better (hereafter referred to as “high
achievers”). In most cases the qualitative results are identical, though the magnitude of
the ‘acting white’ coefficient is 3 to 4 times as large among high achievers. We report
only the ‘acting white’ coefficients for Blacks and Hispanics, the coefficient on grades,
and associated standard errors. The top row of the tables present the baseline results from
columns 1 and 5 in table 2, respectively.
As one peruses the tables, it becomes evident that the ‘acting white’ phenomenon
is robust across most subsets of the data, though there are a several notable exceptions.
‘Acting white’ is modestly more prevalent among Black males relative to Black Females,
17
and this is especially true among high achievers.23 Whether or not one uses the sample
weights provided in the Addhealth data matters little. ‘Acting White’ is large in public
schools and non-existent among blacks in private schools. This latter finding may
partially explain why black kids in private schools appear to do especially well (Akerlof
and Kranton 2002, Neal 1997 and Grogger and Neal 2000).24
ALTERNATIVE MEASURES OF POPULARITY
The ‘acting white’ coefficient is also robust to different measures of social
status.25 We include the following three alternative measures of popularity: (1) non-
normalized Spectral popularity; (2) same-race friends – measured as how many
individuals j put i down as a friend (not weighted by the popularity of each j); (3) all-race
popularity; and (4) other-race popularity. All these measures have been normalized such
that they have a mean of zero and a standard deviation of one. The sign and magnitude of
the ‘acting white’ coefficient for Blacks and Hispanics is robust across the first three
measures. The positive coefficient on other-race popularity suggests that blacks and
Hispanics substitute towards other-race friends in the presence of ‘acting white’. The
magnitude of the coefficient, however, is significantly smaller so that on net, ‘acting
23 Plotting race-specific popularity and grades by race and gender reveals that popularity decreases for black boys earlier (3.25 GPA relative to a 3.5 GPA) and the gradient for high achievers is steeper. 24 We have also investigated whether ‘acting outlier’ is the underlying problem and not ‘acting white’ as such, by estimating the relationship between popularity and grades among whites in schools with low average test scores. Whites in these schools continue to have a positive relationship between popularity and grades. 25 We have also investigated alternative measures of academic achievement, such as class rank and a “nerd index” (the number of activities an individual is involved in such as chess club, math club, etc.). In both cases, the results are consistent with our main findings.
18
white’ (race effect minus the substitution effect) still dominates.26 Blacks and Hispanics
with a GPA above 3.5 are actually losing other-race friends, exacerbating the effect of
‘acting white’ among this select group. This result is troubling, as one would hope that
high achieving minority students could find refuge among high achieving whites.27
BY GRADE LEVEL
Theoretically, one could imagine that the prevalence of ‘acting white’ could
change as students are maturing and developing their identities (Cross and Fhagen-Smith
2001). We estimate our main fixed effects equation separately for each grade level from 7
to 12, though we only report ‘acting white’ coefficients for 7th, 9th, and 12th grades.
‘Acting White’ changes slightly as children age, and most pronounced amongst ninth-
graders. We have also pooled grades 7-9 (junior high school) and 10-12 (high school).
The ‘acting white’ coefficient is twice as large in junior high school relative to high
school, though we caution against making too much of the difference.28
ACCOUNTING FOR THE SUPPLY OF HIGH ACHIEVING BLACK STUDENTS
One possible reason that blacks face a steeper popularity-grades gradient is a
supply shortage of high achieving black students. If students tend to associate with other
students with similar backgrounds (in terms of race, grades, neighborhood location, etc),
26 The bulk of the substitution effect is occurring among students with a GPA between 3.0 and 3.5, especially among blacks. Including controls for number of “potential friends” (i.e. number of same-race students in GPA category by school) does little to change this. 27 We are by no means implying that high achieving whites are in any way refusing to befriend minorities; only reporting a correlation in the data. 28 There are many reasons ‘acting white’ could be more salient in junior high school relative to high school including identity development, selection of low-achieving students out of high school, or compression of the grade distribution in high school due to ‘acting white’ in earlier grades. We are unable to adequately test between these competing hypotheses.
19
then one might observe a steep trajectory for blacks at higher GPA levels simply due to
the fact that there are few blacks in their classes. Sociologists have argued for some time
that this is a likely reason for the alienation of black high achieving students. If so, this
potentially provides a different qualitative understanding of the ‘acting white’
phenomenon.29
We account for the number of same-race students with similar grades in each
school, by dividing the GPA distribution into four categories: less than 2.0, 2.0 – 3.0, 3.0
– 3.5, and greater than 3.5. Within each grade category, we count the number of students
by race separately for each school, and we include this variable as an independent
regressor in our basic model, linearly.30 Accounting for the supply of black high
achievers has a modest effect on the ‘acting white’ coefficient, reducing it from -.103 to -
.081, and virtually no effect on other covariates.31
STUDENT ACTIVITIES
There are many opportunities in schools for students to self-select into particular
activities, ensuring that most of their peer interactions are with other students with similar
interests. This includes organized sports and cheerleading, various clubs (languages, math
or science, drama, or debate), band and music, or the national honor society. These
activities likely differ in their affirmation of high achievement; the honor society likely
29 The supply of students with particular grades is itself an endogenous outcome of ‘acting white,’ thus these results should be interpreted with some care. 30 Thus for each school, there are 12 categories of students (three race categories times four GPA categories) and we count how many students there are in each category. 31 We have repeated this specification among students from junior high schools and high schools, respectively. In both instances, accounting for the supply of black high achievers modestly reduces the racial difference in the popularity-grades gradient. The magnitude of the effect remains higher among junior high school students. We have also partitioned the number of potential friends into 20 equally sized bins and included them as dummy variables. Using this non-linear approach modestly decreases the ‘acting white’ effect.
20
affirms achievement in a way that organized sports does not. Yet, across this diverse set
of potential student activities, only one eliminates the racial difference in the relationship
between social status and achievement: the national honor society. In all other activities,
there remains a substantial gap, suggesting that self-selection into extra-curricular
activities does not eliminate the effects of high grades among blacks and Hispanics. Thus,
the hypothesis by some that high-achieving blacks take up extracurricular activities to
deflect hostility (e.g. Farkas et al 2002) is not borne out in the data.
INTERRACIAL CONTACT
The most striking aspect of tables 3 and 4 is how the coefficient on ‘acting white’
varies in arenas with more or less interracial contact. Remarkably, schools that are less
than 20 percent black have the largest ‘acting white’ effect for Blacks and Hispanics.32
Schools in which blacks comprise greater than 80% of the student body there is no
‘acting white’ effect. Indeed, in all black schools, the coefficient on black*grades is
positive.33
Results in tables 3 and 4 are also contrasted between high and low segregated
schools. The amount of segregation in any school A is measured as:
(3) Friends) rossRaceExpected(C
Friends) Race rossObserved(C Friends) rossRaceExpected(CnSegregatio −=A ,
32 This is true even after controlling for the number of blacks within a school or controlling for the number of blacks with similar grades. 33 To test the robustness of this finding, we estimated an identical specification on NELS data – obtaining very similar results.
21
where cross race friends refers to the total number of friends from each race with students
from different races.34 The expected number of cross race friends is the sum of the
expected value for each race combination, omitting friends of the same race. The
expected number of friends between race i and race j is equal to the total number of
friends of race i multiplied by the probability that an individual of race i is friends with a
student of race j.
The segregation index ranges from -1 (pure out race preference) to 1 (total
segregation). A value of 0 indicates that there is no group preference: friends are random
with respect to race. The measure of segregation was calculated for each school and
divided the set into high and low segregation school; cutting at the school median.
Surprisingly, blacks in more segregated schools incur less of a tradeoff between
popularity and achievement. The coefficient on the ‘acting white’ term is twice as large
in schools that are above the median in terms of segregation (-.055 compared to -.136).35
Among high achievers, the differences are more stark (-.102 and -.485). In addition,
Figure 4 which estimates (non-parametrically) the relationship between popularity and
grades, accounting for our core set of controls, in high and low segregation schools
provides more evidence attesting to the fact that ‘acting white’ is particularly salient
among high achievers and those in schools with more interracial contact.
Using the Moving to Opportunity (MTO) experiment, which assigned housing
vouchers via random lottery to public housing residents in five large cities, Kling and
Liebman (2004) and Kling, Ludwig, and Katz (2005) provide evidence of gender
34 This index is a modification of Freeman (1978) and related to Echenique and Fryer (2005). For a complete derivation, see the Addhealth’s School Network Variables Codebook available at: http://www.cpc.unc.edu/projects/addhealth/codebooks/wave1. 35 This result is robust to accounting for the potential supply shortage of black students in very integrated schools.
22
differences in the effect of the treatment on a variety of outcomes for youth. Females
exhibit lower arrests rates, improvements in education and mental health, and are less
likely to engage in risky behaviors. Males, on the other hand, were more likely to engage
in risky behaviors, had no decrease in arrests rates, and experienced more physical health
problems (injuries or accidents, e.g.). These results suggest that males and females may
respond to their environments in distinct ways; ‘acting white’ may well be the underlying
cause.
One way to test this general hypothesis with the current data is to examine
gender/race differences in the relationship between popularity and grades in schools with
more or less interracial contact. Results are presented in the bottom row of Tables 3 and
4. Consistent with the evidence from MTO, ‘acting white’ is twice as large for high
achieving males relative to high achieving females in low segregation schools. The
coefficient on black*grades for males in low segregation schools is seven times as large
as the identical coefficient estimated on the full sample.
The fact that ‘acting white’ is more prevalent in schools with more interracial
contact is surprising, but consistent with our two-audience signaling model that we
describe in the next section and growing evidence that there can be significant pressure in
racially heterogeneous schools to toe the racial line (Tatum 1997).
V. An Economic Model of ‘Acting White’36
A number of stylized facts emerge from the analysis of the preceding sections.
There are large racial differences in the relationship between popularity and grades.
36 The model presented in this section is a variant of Austen-Smith and Fryer (2003) and Austen-Smith and Fryer (2005).
23
These differences are roughly three times as large for black students with a 3.5 grade
point average or higher. ‘Acting White’ is more salient in public schools and among
children from low education families. Accounting for self selection into extra-curricular
activities or the supply of black high achievers does little to undermine the effect.
Environments with more interracial contact are associated with a steeper popularity-
grades gradient among blacks; seven times as large for high achieving black males. The
results are not an artifact of our particular measure of popularity. While there is some
substitution towards other-race friends in the presence of ‘acting white,’ the magnitude is
small.
In this section, we consider the extent to which a two-audience signaling model
can successfully account for this set of facts.
Let there be a continuum of individuals with unit mass, a finite set of firms, and a
(suitably anthropomorphized) peer group. There are two discrete stages of an individual’s
life: “school years” and “employment years,” denoted { }1,0∈τ . Nature moves first and
distributes an innate ability,θ , to each student according to a smooth common knowledge
cumulative distribution function (CDF) F. Abilities, once disseminated, are fixed. An
individual is endowed with one unit of non-storable time in each period; the allocation of
which is common knowledge.
At the start of each period, an individual’s stage τ time allocation problem is
influenced by whether or not she is an accepted member of her peer group. Peer groups
are valued because, other things equal, leisure time spent in the group is more enjoyable
than leisure time spent outside the group. If an individual is not an accepted member,
then she makes decisions without reference to the group. If she is an accepted group
24
member, then she may be called upon to make some observable time contribution to the
group. That is, in each stage τ , Nature chooses a required time contribution
[ ) 10 ,,0 <<∈ κκκτ , from the individual to the group, according to a smooth common
knowledge CDF ( )ττ κG . We assume the school year contribution is expected to be no
greater than the post-school year contribution.
In the “school years,” individuals allocate effort between leisure, group
commitments, and a once-and-for-all investment in education; [ ]1,0∈s . The cost of
investing s for an individual with abilityθ is denoted ( )θ,sc .37 The cost function is
assumed to be strictly increasing and convex in education, strictly decreasing in innate
ability and to satisfy the single-crossing property. To ensure that all ability types choose
interior education levels, we further assume that ( ) ( ) ∞=⋅=⋅→→
,lim and 0,lim10
scsc ssss.
At the end of the school years, an individual’s education level is fixed and firms
choose wage offers to maximize expected profit. Because firms do not observe an
individual’s innate ability, the wage offered to any potential employee is that individual’s
expected marginal product conditional on her observed schooling. Given our empirical
bent, we are not interested in the details of the wage-offer schedule. As such, we simply
assume that individuals are paid a wage equal to their expected marginal product,
( ) 0≥sω , and (where appropriate) specify the firms’ responses to any out of equilibrium
action by an individual.
37 This is in addition to the direct opportunity cost of effort used for education in the school years.
25
Let { }1,0∈τα denote whether the individual is rejected ( )0=τα or accepted
( )1=τα by his or her peer group inτ .38 If an individual is rejected by the group during
the school years, she cannot be accepted in the post-school years; however, an individual
accepted by the group in the school years may be rejected in the post-school years.39 Let
( )ττ αlu be the individual’s stage τ payoff from leisure [ ]1,0∈τl , conditional on the
group’s decision. If an individual is an accepted group member in someτ and is asked to
make a contribution τκ , let { }1,0∈τδ denote an individual’s decision on whether or not to
comply (respectively, 1=τδ or 0=τδ ). Thus, an individual’s stage 0 payoff from
choosing 0δ , given the individual’s innate ability, school year education decision, and
required contribution 0κ can be written as: ( ) ( )θακδα ,1 0000 scsu −−− . Assume ( )⋅lu is
twice differentiable concave, increasing in l over the range (0,1), and no leisure is
worthless irrespective of group acceptance. Further, we assume that both total and
marginal values from consuming any strictly positive amount of leisure are greater as an
accepted group member than otherwise.
At the beginning of the employment years, the group makes another acceptance
decision, and Nature reveals an individual’s post-school year time commitment to the
group, 1κ . Then, each individual decides whether or not to contribute to the group, and
makes work-force effort decision [ ]1,0∈e . Any student who is accepted by the group and
contributes in the post school years receives a lifetime utility benefitβ .40 The
38 We assume throughout that the peer group is nonempty and sidestep the interesting issue of endogenous peer group formation, given the empirical focus of the current paper. 39 This is without any loss of generality (Austen-Smith and Fryer 2003) 40 In the infinite horizon version of the model (Austen-Smith and Fryer, 2003), the value β is explicitly derived as an equilibrium payoff to a repeated interaction game between the individual and the group. As
26
employment years payoff can be written as: ( ) ( ) βδραωακδα 1111111 +−−− seeu , where
( )1,0∈ρ is a standard discount factor.
Suppose an individual is accepted by his peers in the school years. At the
beginning of the employment years, the group decides whether to accept or reject the
individual. Then, Nature randomly chooses the group contribution, 1κ , required of each
individual and they decide whether to make the contribution. The realization 1κ and the
individual’s decision are observed by the group. Let ( )τττ κδψα , be the stage τ payoff
to the group from action τα , given the individual makes decision τδ when the required
contribution is τκ , where for all 0≥τκ , ( ) { } ( ) { }ττττ κκψκεκψ −=>= ,0min,0,max,1 .
The key feature of the group’s payoffs is that the group is strictly worse off having
accepted an individual who chooses not to make her required contribution than it would
be were such an individual rejected.
Solving the preceding model yields three results. First, no equilibria exist in
which all types adopt distinct education choices; all equilibria must involve some
pooling. This result is illustrated in Figure 5, which depicts the net utility accruing to a
type θ̂ individual. As shown in the figure, at any given educational investment level, s,
the individual’s net payoff is strictly greater being accepted than being rejected by the
group, and further, in each case the net payoff is strictly quasi-concave in educational
effort with an interior maximum.
Second and most interesting, after application of a standard belief-based
equilibrium refinement (the D1 criterion), all equilibria involve a partition of individual
such, it depends on school-year decisions, among others. In the two-period model, it is enough for there to be some reason for the individual to contribute in the post-school years if required to do so.
27
abilities into at most three intervals, which is depicted in Figure 6. A (possibly empty) set
of the lowest ability types and the set of highest ability types reveal themselves through a
separating education strategy; ability types in the middle interval pool on a common
education level. Only types in the lower intervals are accepted by the group. It is worth
emphasizing that nothing is built into the model that requires accepted types to adopt a
common educational investment; it is an equilibrium outcome. This partition produces
novel predictions as one varies the wage structure, group size and value of membership,
and the types of social interactions involved.
The two-audience signaling model has two clear predictions – racial differences
in the relationship between social status and academic achievement will exist and these
differences will tend to be exacerbated in environments with more interracial contact and
increased mobility – both of which are consistent with the empirical evidence presented
in section IV. In addition, Black high achievers also report more risky behaviors
(smoking, drinking, lying to their parents) and less happiness than White high achievers
which is consistent with the signaling aspects of the model.
Next, we outline two popular alternative models typically used to explain ‘acting
white,’ and shows that they contradict the data in important ways.
Alternative Models of ‘Acting White’
A. An Oppositional Culture Identity Model
The most prominent theory to explain the stylized facts put forth is the
oppositional culture hypothesis, developed in Fordham and Ogbu (1986).41 The
41 Since then, efforts have been focused on refuting Fordham and Ogbu’s hypothesis, not developing alternative theories.
28
hypothesis states that the observed disparity between blacks and whites stems from the
following factors: (1) white people provide them with inferior schooling and treat them
differently in school; (2) by imposing a job ceiling, white people fail to reward them
adequately for their academic achievement in adult life; and (3) black Americans develop
coping devices which, in turn, further limit their striving for academic success. Fordham
and Ogbu (1986) suggest the problem arose partly because white Americans traditionally
refused to acknowledge that black Americans were capable of intellectual achievement,
and partly because black Americans subsequently began to doubt their own intellectual
ability, began to define academic success as white people’s prerogative, and began to
discourage their peers, perhaps unconsciously, from emulating white people in striving
for academic success.
The Fordham and Ogbu hypothesis can be directly imputed into a simple
economic model of identity and human capital acquisition, ala Akerlof and Kranton
(2000, 2002). In their language, identities are accompanied by certain “prescriptions” that
define appropriate behaviors for a person of that type. When an individual makes
decisions in line with these prescriptions, there is a utility benefit. In standard models, a
student invests in human capital until the marginal cost of investment equals the marginal
benefit of that investment. Fordham and Ogbu (1986) argue that institutional
discrimination lowers the marginal benefit of investment for certain minority groups. As
a rational response, these minorities began to equate educational achievement with
whiteness, thereby altering the prescriptions (e.g. what it means to “be black”).
The predictions of the oppositional culture identity model face mixed success in
terms of the patterns observed in the data. Consistent with the theory, there are no racial

29
differences in the relationship between popularity and achievement among blacks in
private schools and from high socioeconomic status families, as these environments
likely change identity prescriptions. It is unclear what the oppositional identity model
predicts about the salience of ‘acting white’ as a function of the percentage of black
students in a school.42
The theory, however, does quite poorly in explaining why ‘acting white’ does not
exists in predominantly black schools. Indeed, Fordham and Ogbu (1986) base the
oppositional culture hypothesis on observations in an all black high school, yet we find
little evidence in support of their theory.
B. A Sabotage Model
Another explanation for racial differences in the relationship between social status
and achievement is that blacks simply sabotage their high achieving peers.43 McWhorter
(2000) is a prominent advocate of this view.
Consider the following skeletal outline of a sabotage model. Imagine a world with
two neighborhoods: a majority community and a minority community, each containing
many individuals. Individuals come in two flavors: high ability and low ability, which are
determined by Nature and publicly observed within a community. There are two states of
the world: discriminatory and fair; which are unknown. Individuals observe their ability
42 Oppositional culture might be more prevalent in predominantly black or highly segregated schools and less prevalent in integrated schools. As opportunities and the likelihood of success increases, the oppositional culture model predicts that incentives to develop oppositional identities decrease and hence, ‘acting white’ decreases. The countervailing effect is that black identities likely become less salient as the percentage of blacks in a school increase (similar to “American” identities becoming more prevalent in one travels abroad). Which effect will dominate is unclear. 43 There are several mechanisms that could lead to such behavior. The most simplistic is that black and Hispanic cultures are dysfunctional; punishing successful members of their group rather then rewarding their success.
30
type and make a dichotomous human capital decision. Assume that human capital is less
costly to obtain for high ability workers. Individual utility is partly determined by what
others (outside the community) perceive about their ability.
Firms observe each individuals level of human capital and decides whether or not
to hire them. When the state of the world is discriminatory, firms refuse to hire minority
workers. In a fair state, workers are hired if and only if they have invested in human
capital. Assume that payoffs are such that low ability types never have incentive to
acquire human capital.
In this framework, low ability agents have incentive to “hold back” individuals
with high ability when the cost of doing so is less than the net benefit; independent of the
state of the world. As more high ability individuals invest in human capital and garner
success, the world may be revealed to be fair, putting the onus of non-achievement on
low ability individuals. Thus, the net benefit of sabotage is increasing in the fraction of
individuals who escape.
The sabotage theory, irrespective of the details, is at odds with the fact that blacks
in predominantly black schools face no tradeoff between social status and achievement –
the ‘acting white’ coefficient is weakly positive in these schools. The theory also does not
adequately explain why ‘acting white’ is particularly salient in schools with more
interracial contact.
VI. Conclusion
For nearly 20 years, there has been a debate among social scientists on the extent
and potential impact of negative peer sanctions often referred to as ‘acting white.’ The
31
consensus gentium is: (1) ‘acting white’ does not exist in nationally representative
samples, and (2) to the extent that it is discernible in data, it is concentrated in low-
income minority schools. This paper demonstrates that the facts point in the exact
opposite direction: ‘acting white’ is observable in nationally representative data, but non-
existent in predominantly black schools. There is, however, a crucial point of agreement.
We, like Ferguson (2001), Cook and Ludwig (1997), and Ainsworth-Darnell and Downey
(1998), find no empirical support for the oppositional culture hypothesis described in
Fordham and Ogbu (1986).
Most importantly, we demonstrate that the relationship between social status and
achievement is categorically different between racial groups, and this difference is
remarkably robust across a variety of different specifications, sub-samples of the data,
and definitions of social status. Particularly interesting is that high achieving students and
students in environments with more interracial contact are most burdened by ‘acting
white.’ Eliminating racial differences in the relationship between popularity and
achievement will have little effect on the mean student or students who attend
predominantly black schools – but could potentially be a major reason for the
underperformance of minorities in suburban schools or the lack of adequate
representation of Blacks and Hispanics in elite colleges and universities.
Finally, we argue (and provide circumstantial evidence) that ‘acting white’ is an
equilibrium phenomenon, the consequence of two-audience signaling; not self-sabotage
among blacks or the result of an oppositional cultural identity that declares education
useless. While the evidence in favor of the two-audience signaling model is far from

32
overwhelming, it is the only model we consider that does not directly contradict the data
in fundamental ways.
33
Appendix A: Reconciling our Results with the Previous Literature
Table 5 estimates the prevalence of ‘acting white’ among eighth and tenth grade
students in the NELS. The equation estimated is identical to that implemented in the
Addhealth data, described by equation (2). Popularity is measured as a dichotomous
variable; equal to one if students in class see the respondent as very popular and equal to
zero if not.44 The independent variables vary by column and are generally increasing
from left to right.
Columns 1 and 5 of table 5 show that there is a positive relationship between
grades and popularity, though the relationship is smaller for blacks, which is consistent
with ‘acting white.’ The ‘acting white’ coefficient is large and statistically significant for
Blacks in both eighth and tenth grades, but never statistically significant for Hispanics.
Columns 2 and 6 include controls for test score, effort, SES, gender, and extracurricular
activities (athletics, student government, and cheerleading). The coefficient on grades and
the acting white coefficient change little, suggesting that black-white differences in
covariates are not driving the negative ‘acting white’ coefficient (similar to the results in
the Addhealth).45
Columns 3 and 7 include controls for school characteristics. Private school
attendance is associated with greater reported popularity, but the inclusion of school
characteristics does not alter the ‘acting white’ coefficient. Columns 4 and 8 present
results with the inclusion of school fixed-effects. These results are consistent with our
previous analysis using the Addhealth. There is no statistical difference between
44 In the raw data, the measure takes on three values, whether or not students see the respondent as: (1) very popular; (2) somewhat popular; or (3) not popular at all. Only 15% of the 10th grade sample (and 18% of the 8th grade sample) reported being not popular at all – thus we merged responses (2) and (3). See the data appendix for details. 45 Including the interactions Black*Test Score, Black*Effort, or Black*SES does little to alter the results.
34
Hispanics and Whites in the relationship between popularity and grades in the NELS.
Other coefficients stay essentially the same.
Appendix B: Data Description
The Longitudinal Study of Adolescent Health (Addhealth)
Grades
Students were asked “At the most recent grading period, what was your grade in each of
the following subjects?” where the subjects were English/Language Arts, Mathematics,
History/Social Studies, and Science, and possible answers were A, B, C, or “D or lower”.
Assuming student answered that their school grades on a letter basis, we averaged the
grades in these 4 subjects according to a 4.0 scale (i.e. A=4.0, B=3.0, C=2.0, and D or
lower=1.0).
Race
Students were asked “What race are you?” and “Are you of Hispanic or Spanish origin?”
Non-Hispanic white, black, or Asians were coded as separate values. Students answering
yes to the latter question were coded as Hispanic. Answers to the former question could
include multiple races; non-Hispanic mixed race students (i.e. students selecting multiple
races) were also coded separately.
Gender
Students were asked “What sex are you?” Male or female.
35
Age
Students were asked “How old are you?” Answers range from 10 to 19, where 19
indicates age is 19 or older.
Effort
Students were asked “In general, how hard do you try to do your school work well?”
Possible answers were “I try very hard to do my best”; “I try hard enough, but not as hard
as I could”; “I don’t try very hard at all”; and I never try at all”. We coded these on a 1-4
scale where 4 represents the highest level of effort (i.e. the first response) and 1
represents the lowest.
Athletics
Students were asked whether they were participating or planned to participate in a
number of clubs or teams. This variable was coded as one if any of the following teams
were indicated: baseball/softball, basketball, field hockey, football, ice hockey, soccer,
swimming, tennis, track, volleyball, wrestling, or other sport.
Student Government
This variable was coded as one if student indicated he/she participated in the student
council.
Cheerleading
36
This variable was coded as one if student indicated he/she participated in the
cheerleading or dance team.
Parental Education
Student was asked how far in school their mother and father went. This variable is coded
as one if the parent graduated from a college or university, or if they had professional
training beyond a four-year college. If the student doesn’t know the exact level of
education, it is coded as missing. Otherwise, other educational levels are coded as zero.
Parental Occupation
We coded two variables each for the mother and father. The first is based on the
student’s description of their mother or father’s job—whether they are “white collar
professionals”. It was coded as one if according to the student, the parent’s occupation is
“Professional 1” (such as doctor, lawyer or scientist); “Professional 2” (such as teacher,
librarian, nurse); “Manager” (such as executive or director); or “Technical” (such as
computer specialist or radiologist). Other professions are coded as zero. If the parent
doesn’t work or is disabled or retired, it is coded as missing. The second variable is
coded as one if the parent is a housewife or househusband, according to the student, and
zero otherwise.
Urban/Suburban/Rural and Public/Private School
37
We created dummies for whether the school is public or private and whether it is located
in an urban, suburban, or rural setting, according to the school administrator
questionnaire.
Percent Teachers Black/Asian/Hispanic
These variables are taken from the school administrator’s answer to the question
“Approximately what percentage of your full-time classroom teachers are of each of the
following races?” where races listed include black, Asian, and Hispanic.
References
Akerlof, George and Rachel Kranton, “Economics and Identity,” Quarterly Journal of
Economics 115 (2000) 715-753.
Akerlof, George and Rachel Kranton, “Identity and Schooling: Some Lessons
For the Economics of Education,” Journal of Economic Literature, 40 (2002), 1167-
1201.
Ainsworth-Darnell, James and Douglas Downey, "Assessing the Oppositional Culture
Explanation for Racial/Ethnic Differences in School Performance," American
Sociological Review, 63 (1998), 536-553.
Armor, G. “Why is Black Educational Achievement Rising?” Public Interest (1992), 65-
80.
Austen-Smith, David and Roland Fryer, “The Economics of ‘Acting White’,”
Unpublished Manuscript, Harvard University, 2003.
38
Austen-Smith, David and Roland Fryer, “An Economic Analysis of ‘Acting White’,”
Forthcoming Quarterly Journal of Economics, May 2005.
Bauman, K. 1996. Trying to get ahead: school work and grades in the educational advance of African-Americans. Institute for Research on Poverty. Washington, DC.
Bergin, David and Helen Cooks. “High School Students of Color Talk about
Accusations of ‘Acting White’,” Urban Review, 34 (2002), 113-34.
Brooks-Gunn, J. and G. Duncan (Eds.), The Consequences of Growing Up Poor. (New
York: Russell Sage), 1997.
Campbell, Jay, Catherine Hombo, and John Mazzeo, “NAEP 1999 trends in academic
progress: Three decades of student performance,” Washington, DC: U.S. Department of
Education’s Office of Educational Research and Improvement (NCES 2000–469), 2000.
Card, David and Jesse Rothstein, “Racial Segregation and the Black-White Test Score
Gap,” Unpublished Manuscript, Princeton University, 2004.
Carneiro, Pedro and James Heckman, “Human Capital Policy,” Working Paper,
University of Chicago, 2002.
Chapple, Simon, Richard Jefferies, and Rita Walker, “Maori Education
Participation and Performance: A Literature Review and Research Programme,”
Paper for the New Zealand Ministry of Education, 1997.
Coleman, J. S., Campbell, E. Q., Hobson, C. J., McPartland, J., Mood, A. M., Weinfeld,
F. D., & York, R. L. Equality of educational opportunity. Washington, DC: U.S.
Government Printing Office, 1966.
Cook, M. and W. Evans. “Families or Schools? Explaining the Convergence in White
and Black Academic Performance.” Journal of Labor Economics 18:4 (2000), 729-754.
39
Cook, Phillip, Jens Ludwig. Weighing the “burden of ‘acting white’”: are there race
differences in attitudes towards education? Journal of Public Policy and Analysis, 16
(1997), 256-278.
Cook, Phillip, Jens Ludwig. 1998. The Burden of ‘Acting white’: Do black Adolescents
Disparage Academic Achievement? In Christopher Jenks and Meredith Phillips, eds.,
The Black-White Test Score Gap, Brookings Press.
Cross, William and Peony Fhagen-Smith. “Patterns of African American Identity
Development: A Life Span Perspective,” in New Perspectives on Racial Identity
Development: A Theoretical and Practical Anthology, Charmaine L. Wijeyesinghe and
Bailey W. Jackson, eds. New York: New York University Press.
Datnow, Amanda and Robert Cooper, “Peer Networks of African American Students in
Independent Schools: Affirming Academic Success and Racial Identity,” Journal of
Negro Education, 65 (1996), 56-72.
Delpit, Lisa. Other People’s Children: Cultural Conflict in the Classroom. (New York:
New Press), 1995.
DeVos, George, and Wagatsuma Hiroshi, “Japan's Invisible Race: Caste in Culture and
Personality,” (Berkeley: University of California Press, 1966).
Echenique Federico and Roland Fryer, “On the Measurement of Segregation,”
Unpublished manuscript, NBER Working Paper No. 11258, 2005.
Farkas, George, Christy Lleras, and Steve Maczuga, “Comment: does oppositional
culture exist in minority and poverty peer groups?” American Sociological Review, 67:1
(2002), 148-155.
40
Ferguson, Ronald. Teacher’s Perceptions and Expectations and the Black-White Test
Score Gap,” in C. Jencks and M. Phillips (Eds.), The Black-White Test Score Gap
(Washington, DC: The Brookings Institute), 1998.
Ferguson, Ronald. Can schools narrow the black-white test score gap? In C. Jencks and
M. Phillips (Eds.), The black-white test score gap (pp. 318-374). (Washington, DC:
Brookings Institution), 1998.
Ferguson, Ronald. “A Diagnostic Analysis of Black-White GPA Disparities in
Shaker Heights, Ohio.” Pp. 347-414 in Brookings Papers on Education Policy
2001, edited by Diane Ravitch. Washington, DC: Brookings Institution Press, 2001.
Ferguson, Ronald, “What Doesn't Meet the Eye: Understanding and Addressing Racial
Disparities in High-Achieving Suburban Schools,” Working Paper, Wiener Center for
Social Policy, Harvard University, 2002.
Fordham, Signithia. 1996. Blacked Out: Dilemmas of Race, Identity, and Success at
Capital High. Chicago: University of Chicago Press.
Fordham, Signithia, and John Ogbu, “Black Students’ School Successes: Coping
with the Burden of ‘Acting White’,” The Urban Review, XVIII (1986),
176–206.
Freeman, Linton C. “Segregation in Social Networks.” Sociological Methods and
Research, 6(4) 411-430, 1978.
Fryer, Roland, and Steve Levitt, “Understanding the Black-White Test Score Gap in the
First Two Years of School,” Review of Economics and Statistics, LXXXVI (2004), 447-
464.
41
Fryer, Roland, and Steve Levitt, “The Black-White Test Score Gap through Third
Grade,” NBER Working Paper No. 11049, 2005.
Gans, Herbert, The Urban Villagers: Group and Class in the Life of Italian-Americans,
New York: The Free Press, 1962.
Grogger, Jeffrey, and Derek Neal, “Further Evidence on the Benefits of Catholic
Secondary Schooling,” Brookings-Wharton Papers on Urban Affairs, 2000, 151-193.
Herrnstein, R. and C. Murray. The Bell Curve: Intelligence and Class Structure in
American Life, (The Free Press), 1994.
Horn, Roger, and Charles Johnson, Matrix Analysis (Cambridge: Cambridge University
Press, 1985).
Horvat, Erin McNamara, and Kristine S. Lewis, “Reassessing the ‘Burden of
‘Acting White’: The Importance of Peer Groups in Managing Academic Success,”
Sociology of Education, 76 (2003), 265-280.
Jencks, Chris, and Meredith Phillips, “The Black-White Test Score Gap: An
Introduction.” In Jencks and Phillips, eds., The Black-White Test Score Gap, p. 1-51,
Brookings, 1998.
Jensen, Arthur. The G Factor: The Science of Mental Ability (Greenwood Publishing
Group), 1998.
Kling, Jeffrey and Jeffrey Liebman. “Experimental Analysis of Neighborhood Effects on
Youth.” Working Paper. Princeton University, 2004.
42
Kling, Jeffrey, Jens Ludwig, and Lawrence Katz. “Neighborhood Effects on Crime for
Female and Male Youth: Evidence from a Randomized Housing Voucher Experiment,”
Quarterly Journal of Economics, 120:1 87-130, 2005.
McWhorter, John. Losing the Race: Self Sabotage in Black America. New York: Free
Press, 2000.
Neal, Derek and William Johnson. “The Role of Pre-Market Factors in Black-White
Wage Differentials.” Journal of Political Economy 104 (1996), 869-895.
Neal, Derek, “The Effects of Catholic Secondary Schooling on Educational
Achievement,” Journal of Labor Economics, 15 (1997), 98-123.
Neal, Derek, “Has Black-White Skill Convergence Stopped?” mimeo, University of
Chicago, 2004.
Neal-Barnett, Angela. (2001). Being Black: A new conceptualization of acting white. In
A. M. Neal-Barnett, J. Contreras, & K. Kerns (Eds.), Forging Links: African American
Children Clinical Developmental Perspectives. Westport, CT: Greenwood Publishing
Group.
Ogbu, John, and Signithia Fordham, “Black Students’ School Success: Coping with the
Burden of ‘Acting white’,” The Urban Review, 18:3 (1986), 176-206.
Ogbu, John, and Astrid Davis, Black American Students in an Affluent Suburb: A Study of
Academic Disengagement (Mahwah, NJ: Lawrence Erlbaum Associates, Inc, 2003).
O’Neill, June. “The Role of Human Capital in Earnings Differences Between Black and
White Men,” Journal of Economic Perspectives 4:4 (1990), 25-46.
43
Phillips, Meredith, James Crouse, and John Ralph, “Does the Black-White Test Score
Gap Widen After Children Enter School?” in The Black-White Test Score Gap, C. Jencks
and M. Phillips, eds. (Washington, DC: The Brookings Institute) pp. 229-272, 1998.
Rodgers, W. and W. Spriggs. “What Does AFQT Really Measure: Race, Wages,
Schooling, and the AFQT Score,” The Review of Black Political Economy 24:4, 1996,
13-46.
Steele, S. and J Aronson. “Stereotype Threat and the Test Performance of Academically
Sucessful African Americans,” in C. Jencks and M. Phillips (Eds.), The black-white test
score gap (pp. 401-430). (Washington, DC: Brookings Institution), 1998.
Tanur, Judith, Questions About Questions: Inquiries into the Cognitive Bases of Surveys
(New York: Russell Sage Foundation, 1992).
Tatum, Beverly. Why Are All the Black Kids Sitting Together in the Cafeteria? And Other
Conversations About Race. New York: Basic Books, 1997.
Tyson, Karolyn, William Darity Jr., and Domini Castellino. “Breeding Animosity: the
‘Burden of Acting White’ and Other Problems of Status Group Hierarchies in Schools,”
Working paper, Department of Sociology University of North Carolina Chapel Hill,
2004.
Willis, Paul, Learning to Labor: How Working Class Kids Get Working Class Jobs (New
York City: Columbia University Press, 1977).
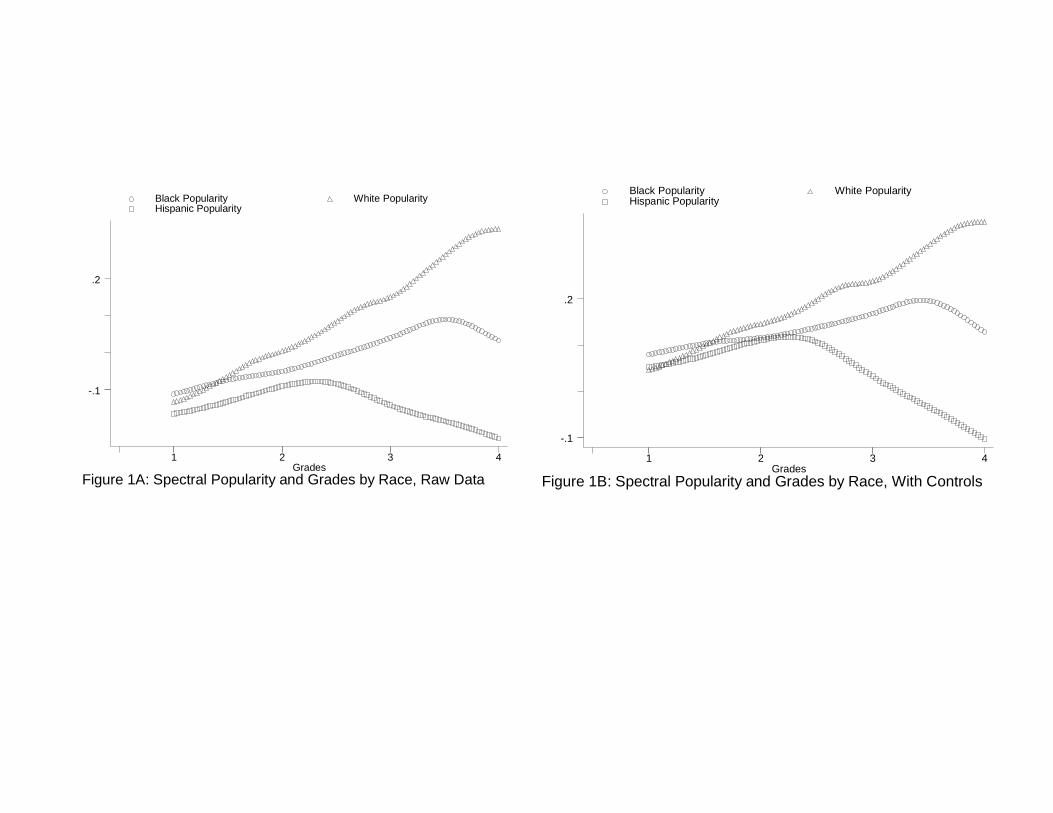
Figure 1A: Spectral Popularity and Grades by Race, Raw DataGrades
Black Popularity White Popularity Hispanic Popularity
1 2 3 4
-.1
.2
Figure 1B: Spectral Popularity and Grades by Race, With ControlsGrades
Black Popularity White Popularity Hispanic Popularity
1 2 3 4
-.1
.2
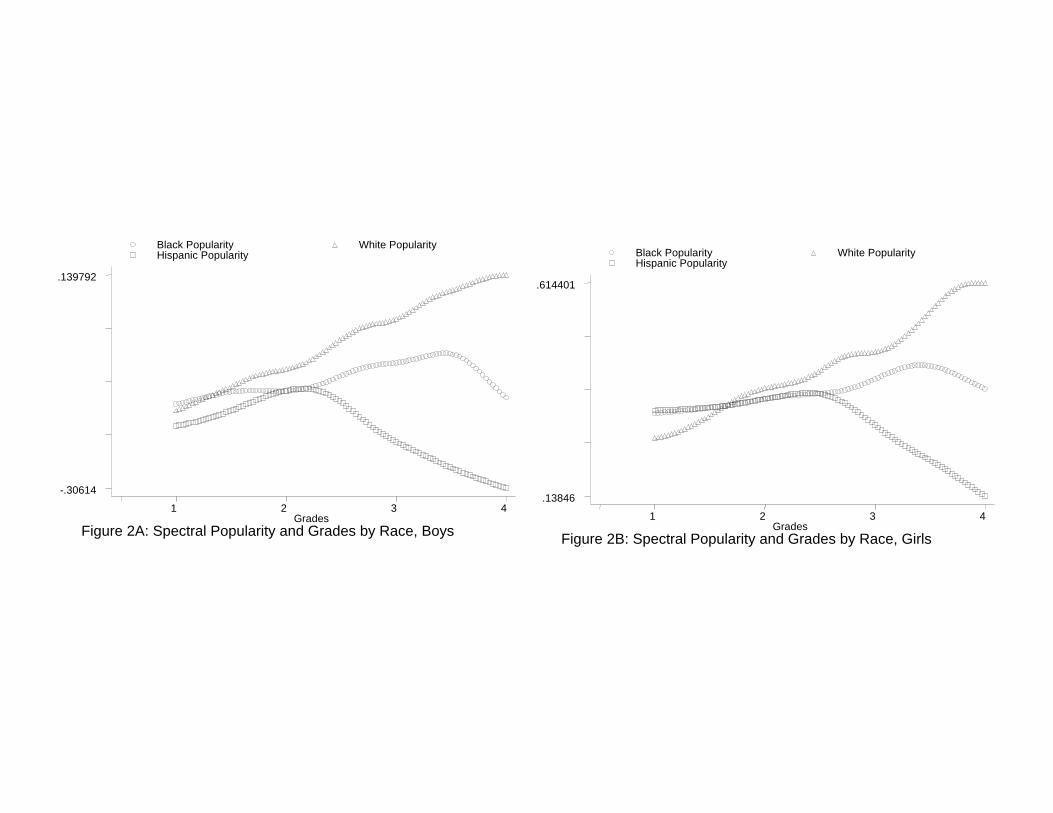
Figure 2A: Spectral Popularity and Grades by Race, BoysGrades
Black Popularity White PopularityHispanic Popularity
1 2 3 4
-.30614
.139792
Figure 2B: Spectral Popularity and Grades by Race, GirlsGrades
Black Popularity White PopularityHispanic Popularity
1 2 3 4
.13846
.614401
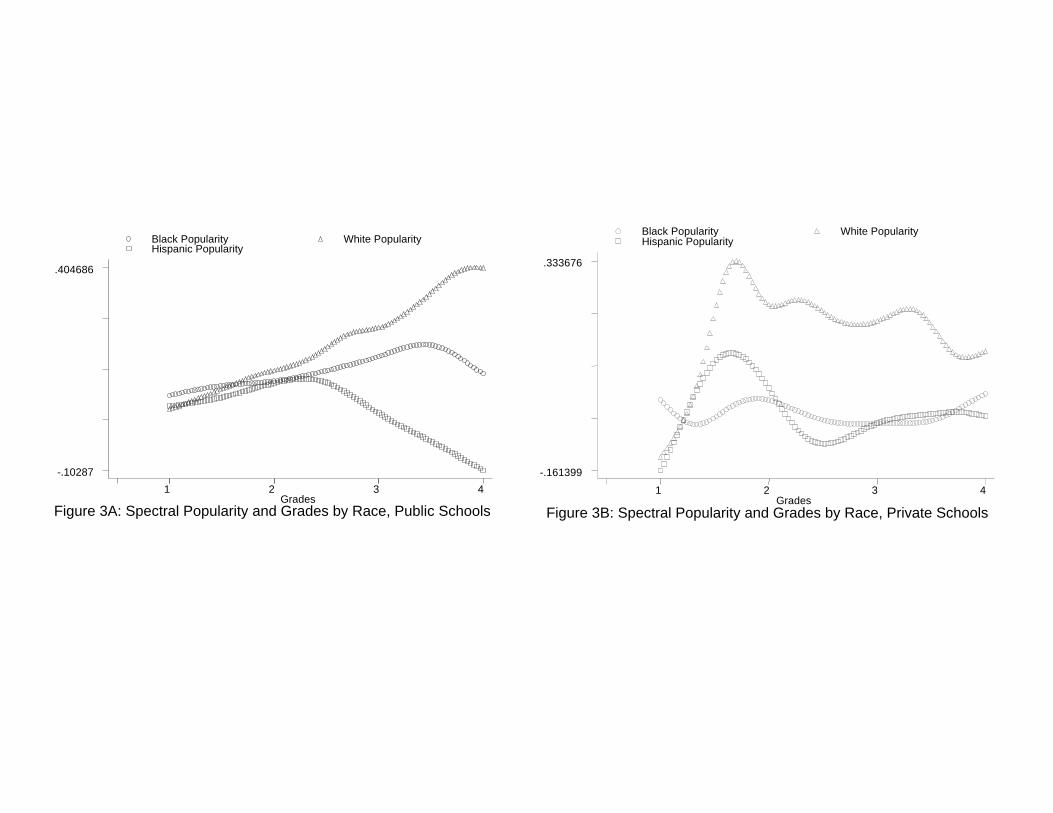
Figure 3A: Spectral Popularity and Grades by Race, Public SchoolsGrades
Black Popularity White PopularityHispanic Popularity
1 2 3 4-.10287
.404686
Figure 3B: Spectral Popularity and Grades by Race, Private SchoolsGrades
Black Popularity White PopularityHispanic Popularity
1 2 3 4
-.161399
.333676
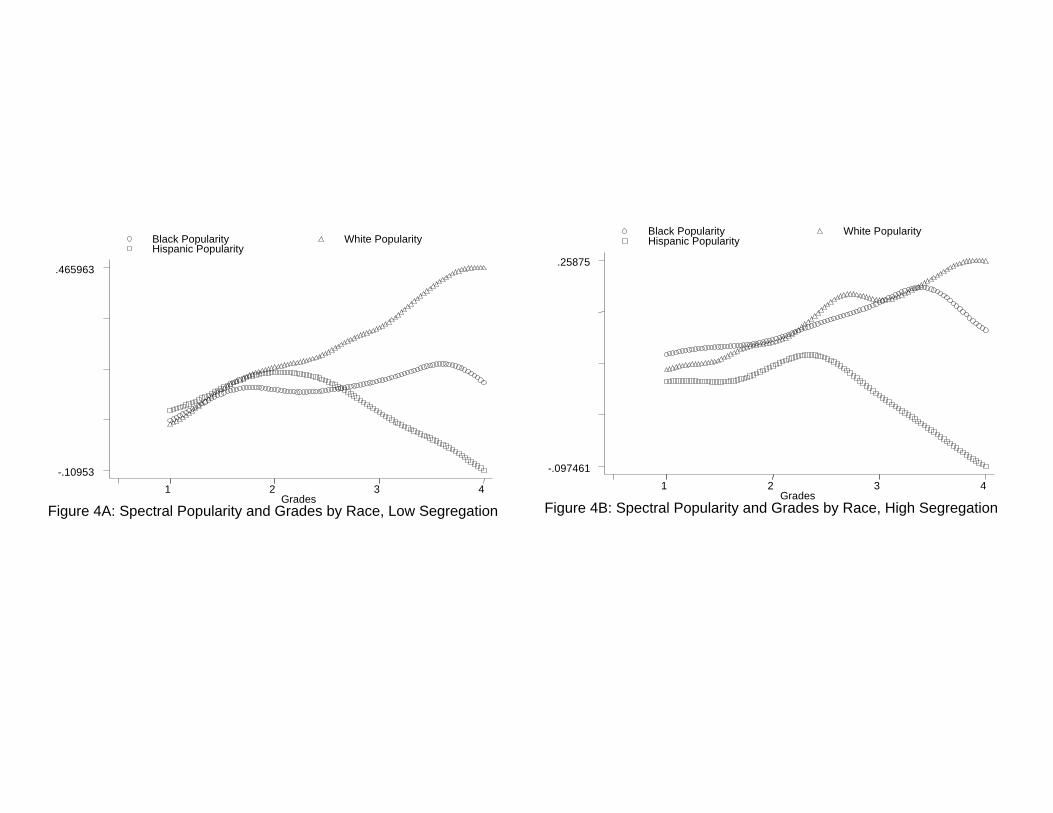
Figure 4A: Spectral Popularity and Grades by Race, Low SegregationGrades
Black Popularity White PopularityHispanic Popularity
1 2 3 4-.10953
.465963
Figure 4B: Spectral Popularity and Grades by Race, High SegregationGrades
Black Popularity White PopularityHispanic Popularity
1 2 3 4-.097461
.25875
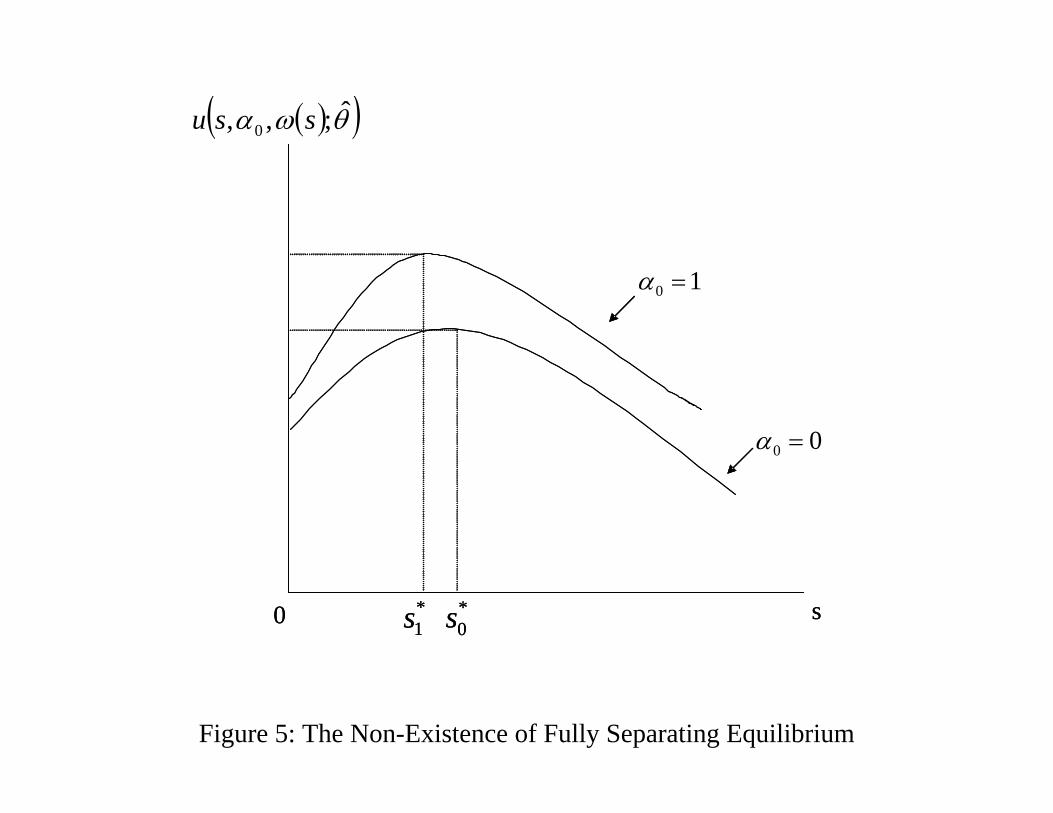
0 s*1s
*0s0 s*
1s*0s
10 =α
00 =α
( )( )θωα ˆ;,, 0 ssu
Figure 5: The Non-Existence of Fully Separating Equilibrium
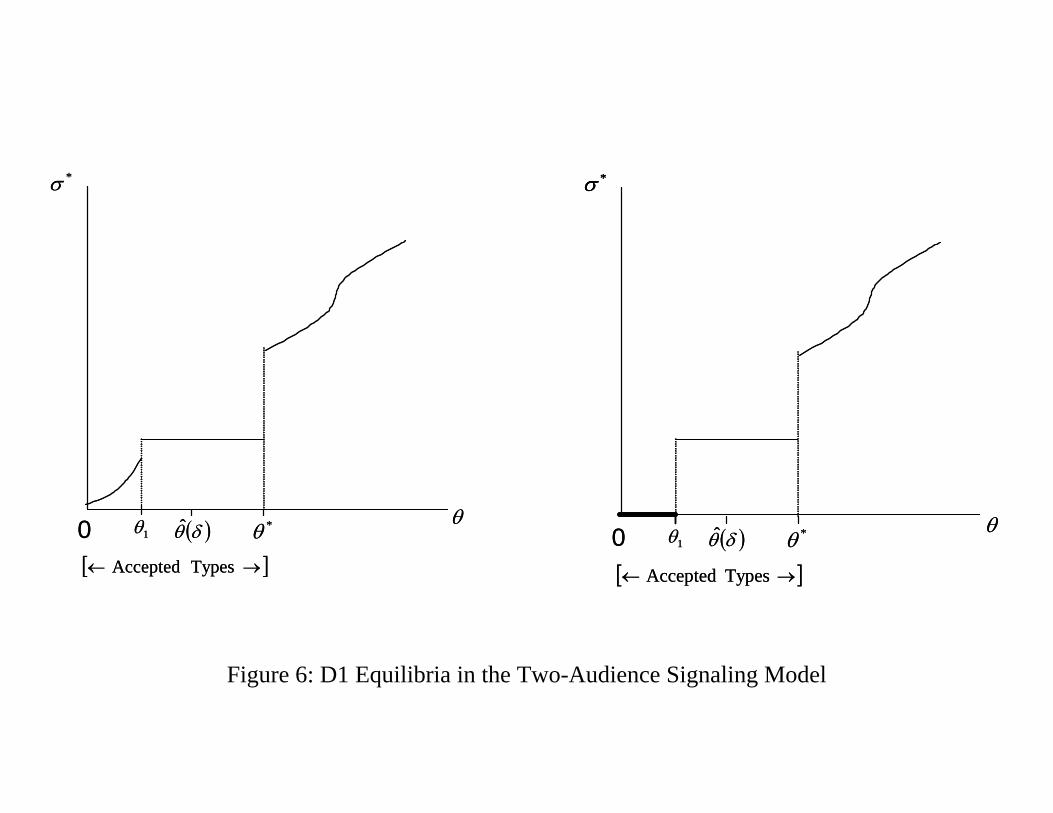
[ ]→← Types Accepted
0 ( )δθ̂ *θθ
*σ
[ ]→← Types Accepted
0 ( )δθ̂ *θθ1θ
*σ
1θ[ ]→← Types Accepted
0 ( )δθ̂ *θθ
*σ
[ ]→← Types Accepted
0 ( )δθ̂ *θθ1θ
*σ *σ
1θ
Figure 6: D1 Equilibria in the Two-Audience Signaling Model
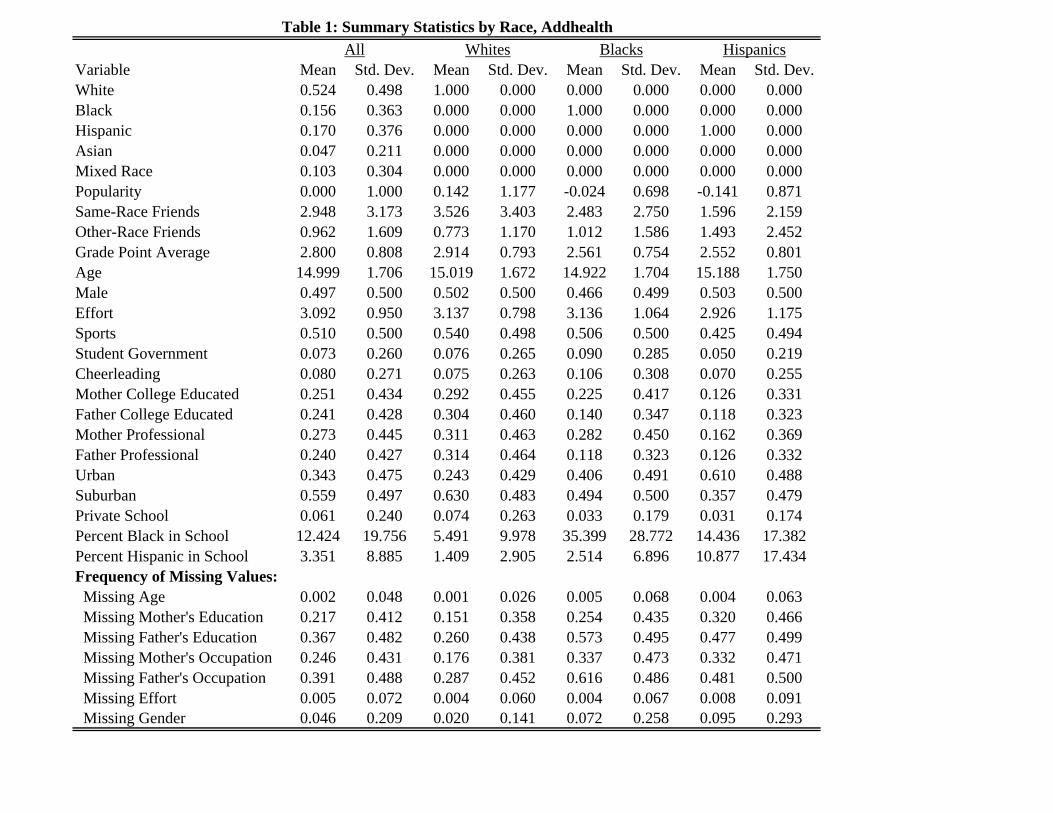
Variable Mean Std. Dev. Mean Std. Dev. Mean Std. Dev. Mean Std. Dev.White 0.524 0.498 1.000 0.000 0.000 0.000 0.000 0.000Black 0.156 0.363 0.000 0.000 1.000 0.000 0.000 0.000Hispanic 0.170 0.376 0.000 0.000 0.000 0.000 1.000 0.000Asian 0.047 0.211 0.000 0.000 0.000 0.000 0.000 0.000Mixed Race 0.103 0.304 0.000 0.000 0.000 0.000 0.000 0.000Popularity 0.000 1.000 0.142 1.177 -0.024 0.698 -0.141 0.871Same-Race Friends 2.948 3.173 3.526 3.403 2.483 2.750 1.596 2.159Other-Race Friends 0.962 1.609 0.773 1.170 1.012 1.586 1.493 2.452Grade Point Average 2.800 0.808 2.914 0.793 2.561 0.754 2.552 0.801Age 14.999 1.706 15.019 1.672 14.922 1.704 15.188 1.750Male 0.497 0.500 0.502 0.500 0.466 0.499 0.503 0.500Effort 3.092 0.950 3.137 0.798 3.136 1.064 2.926 1.175Sports 0.510 0.500 0.540 0.498 0.506 0.500 0.425 0.494Student Government 0.073 0.260 0.076 0.265 0.090 0.285 0.050 0.219Cheerleading 0.080 0.271 0.075 0.263 0.106 0.308 0.070 0.255Mother College Educated 0.251 0.434 0.292 0.455 0.225 0.417 0.126 0.331Father College Educated 0.241 0.428 0.304 0.460 0.140 0.347 0.118 0.323Mother Professional 0.273 0.445 0.311 0.463 0.282 0.450 0.162 0.369Father Professional 0.240 0.427 0.314 0.464 0.118 0.323 0.126 0.332Urban 0.343 0.475 0.243 0.429 0.406 0.491 0.610 0.488Suburban 0.559 0.497 0.630 0.483 0.494 0.500 0.357 0.479Private School 0.061 0.240 0.074 0.263 0.033 0.179 0.031 0.174Percent Black in School 12.424 19.756 5.491 9.978 35.399 28.772 14.436 17.382Percent Hispanic in School 3.351 8.885 1.409 2.905 2.514 6.896 10.877 17.434Frequency of Missing Values: Missing Age 0.002 0.048 0.001 0.026 0.005 0.068 0.004 0.063 Missing Mother's Education 0.217 0.412 0.151 0.358 0.254 0.435 0.320 0.466 Missing Father's Education 0.367 0.482 0.260 0.438 0.573 0.495 0.477 0.499 Missing Mother's Occupation 0.246 0.431 0.176 0.381 0.337 0.473 0.332 0.471 Missing Father's Occupation 0.391 0.488 0.287 0.452 0.616 0.486 0.481 0.500 Missing Effort 0.005 0.072 0.004 0.060 0.004 0.067 0.008 0.091 Missing Gender 0.046 0.209 0.020 0.141 0.072 0.258 0.095 0.293
Table 1: Summary Statistics by Race, AddhealthWhites Blacks HispanicsAll

Full Sample < 2.0 2.0 - 3.0 3.0 - 3.5 > 3.5(1) (2) (3) (4)
Black 0.148 0.013 0.134 0.488 0.9860.031** 0.097 0.117 0.487 0.432*
Hispanic 0.164 -0.09 0.173 0.761 0.2690.031** 0.094 0.122 0.409* 0.372
Grades 0.135 0.118 0.157 0.223 0.0970.007** 0.042** 0.034** 0.089** 0.056*
Black*Grades -0.103 -0.035 -0.097 -0.198 -0.3290.012** 0.066 0.049* 0.157 0.116**
Hispanic*Grades -0.171 -0.048 -0.171 -0.347 -0.20.011** 0.065 0.051** 0.131** 0.099*
Effort -0.035 -0.009 -0.013 -0.028 -0.0050.006** 0.006 0.004** 0.006** 0.007
Male 0.021 0.015 0.019 0.045 0.0130.008** 0.015 0.011* 0.016** 0.018
Age -0.014 0.003 -0.038 -0.06 -0.0390.003** 0.009 0.009** 0.012** 0.014**
Cheerleading 0.205 0.109 0.187 0.218 0.2840.016** 0.015** 0.011** 0.016** 0.017**
Athlete 0.21 -0.001 0.195 0.229 0.1890.007** 0.05 0.033** 0.036** 0.028**
Student Government 0.195 0.143 0.159 0.221 0.2610.017** 0.042** 0.025** 0.032** 0.033**
Father Househusband 0.039 0.014 0.035 0.046 0.0090.013** 0.025 0.017* 0.023* 0.025
Mother Housewife 0.057 0.015 0.033 0.029 0.0440.012** 0.027 0.019* 0.024 0.027
Father Education 0.032 0.003 0.035 0.013 0.0720.012** 0.022 0.016* 0.023 0.024**
Father Professional 0.039 0.059 0.045 0.071 0.0560.011** 0.027* 0.018** 0.025** 0.025*
Mother Education -0.151 -0.019 0.01 -0.029 -0.0430.041** 0.023 0.019 0.023 0.024*
Mother Professional -0.023 -0.038 -0.119 -0.128 -0.2490.011* 0.058 0.082 0.074* 0.087**
School Fixed Effects? Y Y Y Y YObservations 9464 24055 15984 18698R-squared 0.11 0.09 0.1 0.13
All data are drawn from the National Longitudinal Study of Adolescent Health. The dependent variable is Spectral Popularity. Robust standard errors used. Standard errors under coefficients. Dummies for missing values for all variables except race and grades. Weights used in all regressions. Note: * denotes significant at 5% level, ** denotes significant at 1% level.
Table 2: The Prevalence of 'Acting White,' by GPA
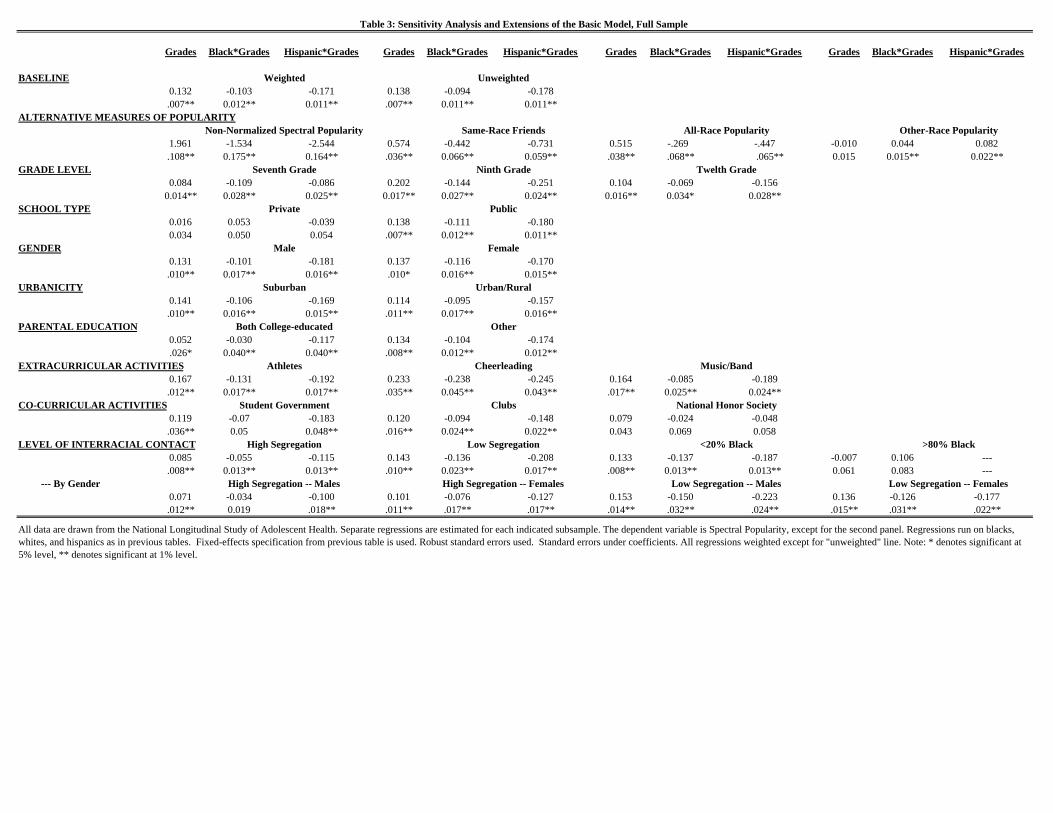
Grades Black*Grades Hispanic*Grades Grades Black*Grades Hispanic*Grades Grades Black*Grades Hispanic*Grades Grades Black*Grades Hispanic*Grades
BASELINE0.132 -0.103 -0.171 0.138 -0.094 -0.178.007** 0.012** 0.011** .007** 0.011** 0.011**
ALTERNATIVE MEASURES OF POPULARITY
1.961 -1.534 -2.544 0.574 -0.442 -0.731 0.515 -.269 -.447 -0.010 0.044 0.082.108** 0.175** 0.164** .036** 0.066** 0.059** .038** .068** .065** 0.015 0.015** 0.022**
GRADE LEVEL0.084 -0.109 -0.086 0.202 -0.144 -0.251 0.104 -0.069 -0.156
0.014** 0.028** 0.025** 0.017** 0.027** 0.024** 0.016** 0.034* 0.028**SCHOOL TYPE
0.016 0.053 -0.039 0.138 -0.111 -0.1800.034 0.050 0.054 .007** 0.012** 0.011**
GENDER0.131 -0.101 -0.181 0.137 -0.116 -0.170.010** 0.017** 0.016** .010* 0.016** 0.015**
URBANICITY0.141 -0.106 -0.169 0.114 -0.095 -0.157.010** 0.016** 0.015** .011** 0.017** 0.016**
PARENTAL EDUCATION0.052 -0.030 -0.117 0.134 -0.104 -0.174.026* 0.040** 0.040** .008** 0.012** 0.012**
EXTRACURRICULAR ACTIVITIES0.167 -0.131 -0.192 0.233 -0.238 -0.245 0.164 -0.085 -0.189.012** 0.017** 0.017** .035** 0.045** 0.043** .017** 0.025** 0.024**
CO-CURRICULAR ACTIVITIES0.119 -0.07 -0.183 0.120 -0.094 -0.148 0.079 -0.024 -0.048.036** 0.05 0.048** .016** 0.024** 0.022** 0.043 0.069 0.058
LEVEL OF INTERRACIAL CONTACT0.085 -0.055 -0.115 0.143 -0.136 -0.208 0.133 -0.137 -0.187 -0.007 0.106 ---.008** 0.013** 0.013** .010** 0.023** 0.017** .008** 0.013** 0.013** 0.061 0.083 ---
--- By Gender0.071 -0.034 -0.100 0.101 -0.076 -0.127 0.153 -0.150 -0.223 0.136 -0.126 -0.177.012** 0.019 .018** .011** .017** .017** .014** .032** .024** .015** .031** .022**
Low Segregation -- FemalesHigh Segregation -- Males High Segregation -- Females Low Segregation -- Males
Table 3: Sensitivity Analysis and Extensions of the Basic Model, Full Sample
All data are drawn from the National Longitudinal Study of Adolescent Health. Separate regressions are estimated for each indicated subsample. The dependent variable is Spectral Popularity, except for the second panel. Regressions run on blacks, whites, and hispanics as in previous tables. Fixed-effects specification from previous table is used. Robust standard errors used. Standard errors under coefficients. All regressions weighted except for "unweighted" line. Note: * denotes significant at 5% level, ** denotes significant at 1% level.
National Honor Society
Music/BandCheerleadingAthletes
High Segregation Low Segregation
Student Government
>80% Black
Other-Race Popularity
Private Public
<20% Black
Male
Suburban
Female
Urban/Rural
Clubs
Other
All-Race Popularity
Both College-educated
Weighted Unweighted
Non-Normalized Spectral Popularity Same-Race Friends
Seventh Grade Ninth Grade Twelth Grade
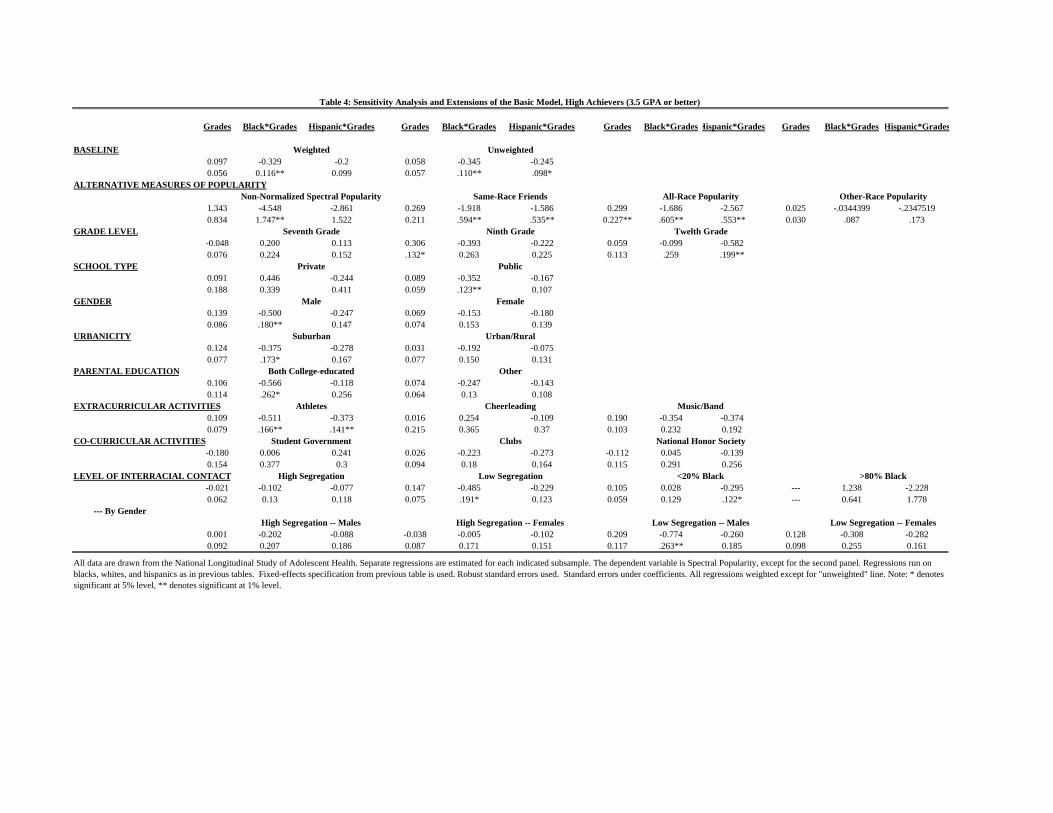
Grades Black*Grades Hispanic*Grades Grades Black*Grades Hispanic*Grades Grades Black*GradesHispanic*Grades Grades Black*Grades Hispanic*Grades
BASELINE0.097 -0.329 -0.2 0.058 -0.345 -0.2450.056 0.116** 0.099 0.057 .110** .098*
ALTERNATIVE MEASURES OF POPULARITY
1.343 -4.548 -2.861 0.269 -1.918 -1.586 0.299 -1.686 -2.567 0.025 -.0344399 -.23475190.834 1.747** 1.522 0.211 .594** .535** 0.227** .605** .553** 0.030 .087 .173
GRADE LEVEL-0.048 0.200 0.113 0.306 -0.393 -0.222 0.059 -0.099 -0.5820.076 0.224 0.152 .132* 0.263 0.225 0.113 .259 .199**
SCHOOL TYPE0.091 0.446 -0.244 0.089 -0.352 -0.1670.188 0.339 0.411 0.059 .123** 0.107
GENDER0.139 -0.500 -0.247 0.069 -0.153 -0.1800.086 .180** 0.147 0.074 0.153 0.139
URBANICITY0.124 -0.375 -0.278 0.031 -0.192 -0.0750.077 .173* 0.167 0.077 0.150 0.131
PARENTAL EDUCATION0.106 -0.566 -0.118 0.074 -0.247 -0.1430.114 .262* 0.256 0.064 0.13 0.108
EXTRACURRICULAR ACTIVITIES0.109 -0.511 -0.373 0.016 0.254 -0.109 0.190 -0.354 -0.3740.079 .166** .141** 0.215 0.365 0.37 0.103 0.232 0.192
CO-CURRICULAR ACTIVITIES-0.180 0.006 0.241 0.026 -0.223 -0.273 -0.112 0.045 -0.1390.154 0.377 0.3 0.094 0.18 0.164 0.115 0.291 0.256
LEVEL OF INTERRACIAL CONTACT-0.021 -0.102 -0.077 0.147 -0.485 -0.229 0.105 0.028 -0.295 --- 1.238 -2.2280.062 0.13 0.118 0.075 .191* 0.123 0.059 0.129 .122* --- 0.641 1.778
--- By Gender
0.001 -0.202 -0.088 -0.038 -0.005 -0.102 0.209 -0.774 -0.260 0.128 -0.308 -0.2820.092 0.207 0.186 0.087 0.171 0.151 0.117 .263** 0.185 0.098 0.255 0.161
All data are drawn from the National Longitudinal Study of Adolescent Health. Separate regressions are estimated for each indicated subsample. The dependent variable is Spectral Popularity, except for the second panel. Regressions run on blacks, whites, and hispanics as in previous tables. Fixed-effects specification from previous table is used. Robust standard errors used. Standard errors under coefficients. All regressions weighted except for "unweighted" line. Note: * denotes significant at 5% level, ** denotes significant at 1% level.
High Segregation Low Segregation <20% Black >80% Black
High Segregation -- Males High Segregation -- Females Low Segregation -- Males Low Segregation -- Females
Music/Band
Student Government Clubs National Honor Society
Both College-educated Other
Athletes Cheerleading
Male Female
Suburban Urban/Rural
Seventh Grade Ninth Grade Twelth Grade
Private Public
Table 4: Sensitivity Analysis and Extensions of the Basic Model, High Achievers (3.5 GPA or better)
Weighted Unweighted
Non-Normalized Spectral Popularity Same-Race Friends All-Race Popularity Other-Race Popularity
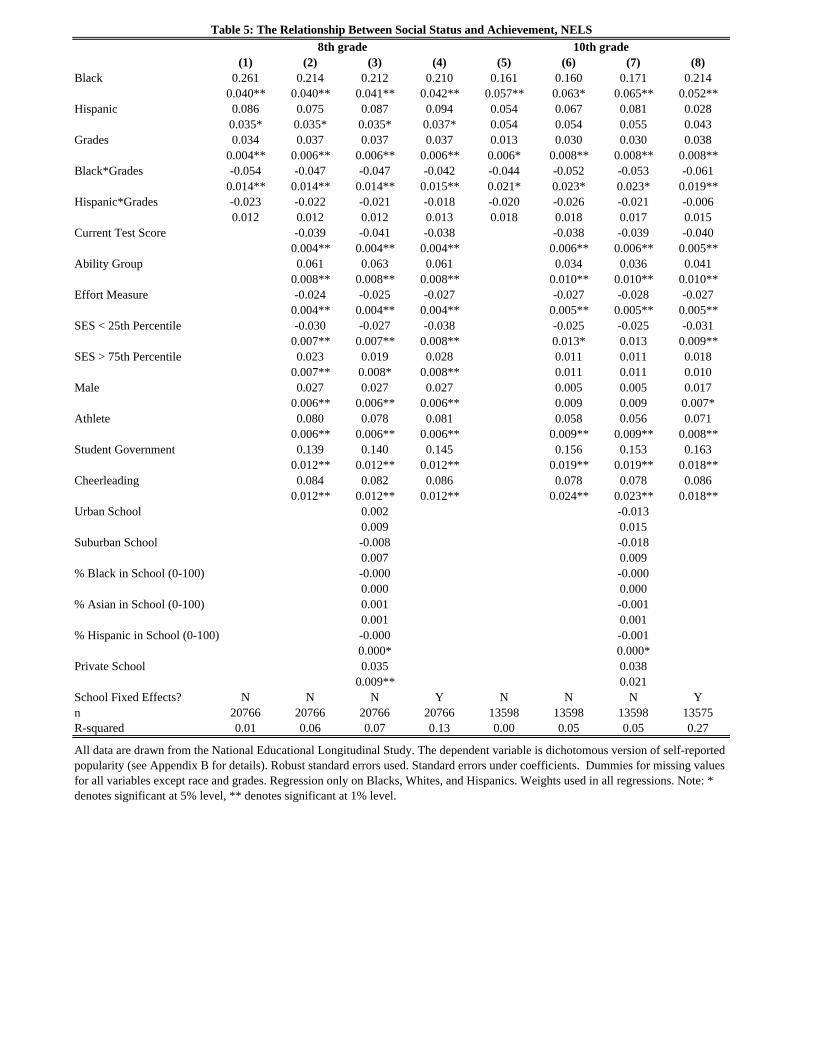
(1) (2) (3) (4) (5) (6) (7) (8)Black 0.261 0.214 0.212 0.210 0.161 0.160 0.171 0.214
0.040** 0.040** 0.041** 0.042** 0.057** 0.063* 0.065** 0.052**Hispanic 0.086 0.075 0.087 0.094 0.054 0.067 0.081 0.028
0.035* 0.035* 0.035* 0.037* 0.054 0.054 0.055 0.043Grades 0.034 0.037 0.037 0.037 0.013 0.030 0.030 0.038
0.004** 0.006** 0.006** 0.006** 0.006* 0.008** 0.008** 0.008**Black*Grades -0.054 -0.047 -0.047 -0.042 -0.044 -0.052 -0.053 -0.061
0.014** 0.014** 0.014** 0.015** 0.021* 0.023* 0.023* 0.019**Hispanic*Grades -0.023 -0.022 -0.021 -0.018 -0.020 -0.026 -0.021 -0.006
0.012 0.012 0.012 0.013 0.018 0.018 0.017 0.015Current Test Score -0.039 -0.041 -0.038 -0.038 -0.039 -0.040
0.004** 0.004** 0.004** 0.006** 0.006** 0.005**Ability Group 0.061 0.063 0.061 0.034 0.036 0.041
0.008** 0.008** 0.008** 0.010** 0.010** 0.010**Effort Measure -0.024 -0.025 -0.027 -0.027 -0.028 -0.027
0.004** 0.004** 0.004** 0.005** 0.005** 0.005**SES < 25th Percentile -0.030 -0.027 -0.038 -0.025 -0.025 -0.031
0.007** 0.007** 0.008** 0.013* 0.013 0.009**SES > 75th Percentile 0.023 0.019 0.028 0.011 0.011 0.018
0.007** 0.008* 0.008** 0.011 0.011 0.010Male 0.027 0.027 0.027 0.005 0.005 0.017
0.006** 0.006** 0.006** 0.009 0.009 0.007*Athlete 0.080 0.078 0.081 0.058 0.056 0.071
0.006** 0.006** 0.006** 0.009** 0.009** 0.008**Student Government 0.139 0.140 0.145 0.156 0.153 0.163
0.012** 0.012** 0.012** 0.019** 0.019** 0.018**Cheerleading 0.084 0.082 0.086 0.078 0.078 0.086
0.012** 0.012** 0.012** 0.024** 0.023** 0.018**Urban School 0.002 -0.013
0.009 0.015Suburban School -0.008 -0.018
0.007 0.009% Black in School (0-100) -0.000 -0.000
0.000 0.000% Asian in School (0-100) 0.001 -0.001
0.001 0.001% Hispanic in School (0-100) -0.000 -0.001
0.000* 0.000*Private School 0.035 0.038
0.009** 0.021School Fixed Effects? N N N Y N N N Yn 20766 20766 20766 20766 13598 13598 13598 13575R-squared 0.01 0.06 0.07 0.13 0.00 0.05 0.05 0.27
Table 5: The Relationship Between Social Status and Achievement, NELS8th grade 10th grade
All data are drawn from the National Educational Longitudinal Study. The dependent variable is dichotomous version of self-reported popularity (see Appendix B for details). Robust standard errors used. Standard errors under coefficients. Dummies for missing values for all variables except race and grades. Regression only on Blacks, Whites, and Hispanics. Weights used in all regressions. Note: * denotes significant at 5% level, ** denotes significant at 1% level.