Embed Size (px)
Citation preview
Dynamic Article LinksC<Journal ofMaterials Chemistry
Cite this: J. Mater. Chem., 2012, 22, 23799
www.rsc.org/materials PAPER
Dow
nloa
ded
by G
eorg
e M
ason
Uni
vers
ity o
n 06
/05/
2013
04:
25:5
1.
Publ
ishe
d on
24
Sept
embe
r 20
12 o
n ht
tp://
pubs
.rsc
.org
| do
i:10.
1039
/C2J
M35
128E
View Article Online / Journal Homepage / Table of Contents for this issue
An efficient oxygen reduction electrocatalyst from graphene bysimultaneously generating pores and nitrogen doped active sites†
Thangavelu Palaniselvam, Harshitha Barike Aiyappa and Sreekumar Kurungot*
Received 1st August 2012, Accepted 21st September 2012
DOI: 10.1039/c2jm35128e
A simple way to simultaneously create pores and nitrogen doped active sites on graphene for the
electrochemical oxygen reduction reaction (ORR) is developed. The key aspect of the process is the in-
situ generation of Fe2O3 nanoparticles and their concomitant dispersion on graphene by pyrolyzing
graphene oxide (GO) with the iron phenanthroline complex. Thus the deposited Fe2O3 nanoparticles
act as the seeds for pore generation by etching the carbon layer along the graphene–Fe2O3 interface.
Detection of the presence of Fe3C along with Fe2O3 confirms carbon spill-over from graphene as a
plausible step involved in the pore engraving process. Since the process offers a good control on the size
and dispersion of the Fe2O3 nanoparticles, the pore size and distribution also could be managed very
effectively in this process. As the phenanthroline complex decomposes and gives Fe2O3 nanoparticles
and subsequently the pores on graphene, the unsaturated carbons along the pore openings
simultaneously capture nitrogen of the phenanthroline complex and provide very efficient active sites
for ORR under alkaline conditions. The degree of nitrogen doping and hence the ORR activity could
be further improved by subjecting the porous material for a second round of nitrogen doping using
iron-free phenanthroline. This porous graphene enriched with the N-doped active sites effectively
reduces oxygen molecule through a 3e� pathway, suggesting a preferential shift towards the more
favourable 4e� route compared to the 2e� reaction as reported for many N-doped carbon nano-
morphologies. The 90 mV onset potential difference for oxygen reduction as compared to the state-of-
the art 20 wt% Pt/C catalyst is significantly low compared to the overpotentials in the range of 120–
200 mV reported in the literature for few N-doped graphenes.
1. Introduction
Inclusion of porosity into the uniform matrix of graphene (Gr) is
expected to modulate the mechanical, electrical, optical and
thermal properties of Gr. In view of that, porous graphene (PG)
has drawn significant attention recently, motivated by the uses of
its ancestral two dimensional Gr1 in nano-electronics and energy
applications such as Li-ion batteries,2 solar cells,3 super capaci-
tors,4 gas sensors5 and polymer electrolyte membrane fuel cells
(PEMFCs).6 However, the lack of band gap in graphene mini-
mizes the prospects of Gr based nanomaterials for the solar cell
applications. Preparation of Gr with preferred structures and
tunable electrical conductivity is highly desired. Recent hypoth-
eses suggest that Gr with a well-defined porous structure can be
another promising material for Li–air battery7 and gas separa-
tion.8 Creation of porosity in the Gr matrix is predicted to tune
the band gap energy of Gr (3.2 eV) similar to the band gap of
Physical and Materials Chemistry Division, National ChemicalLaboratory, Pune-411008, India. E-mail: [email protected]; Fax:+91 20 2590 2636; Tel: +91 20 2590 2566
† Electronic supplementary information (ESI) available: Supportingfigures. See DOI: 10.1039/c2jm35128e
This journal is ª The Royal Society of Chemistry 2012
TiO2.9 However, the experimental realization of creation of
porosity on Gr is conceivably challenging. Firstly, Fasel et al.10
initiated the synthesis of porous graphene by the fabrication of
two-dimensional polyphenylene networks. A recent attempt has
been made to create vacancy on Gr by pulsed vapor deposition
(PLD) for single atom doping (Pt, Co and In) on the desired
vacancy.11 It is also known that the created vacancy on Gr is a
perfect trapping site for heteroatom doping such as nitrogen8 (N)
and boron (B).
Indeed, an electrochemical reaction on the edge planes of
carbon nanostructures is more facile than that on the basal
planes. Further, when doped with N, it induces an additional
exposure of the edge planes and, thus, a controlled interplay of
these two types of active sites together contribute towards the
improvement of the catalytic activity for the sluggish oxygen
reduction reaction (ORR) in PEMFCs.12–15 On the other hand,
there is evidence on the metal (Fe or Co) coordinated N-doping
on carbon nanostructures providing superior electrocatalytic
activity compared to N alone.16–21 Accordingly, we also reported
that the Fe coordinated nitrogen doped carbon nanofiber (i.e.
FeNxCNF) reduces the oxygen (O2) molecule in the preferred
4e� pathway as compared to the N doped-carbon nanofiber
J. Mater. Chem., 2012, 22, 23799–23805 | 23799
Scheme 1 Schematic representation of the process involved in the
creation of pores and the nitrogen and iron nitride doped active sites on
graphene.
Dow
nloa
ded
by G
eorg
e M
ason
Uni
vers
ity o
n 06
/05/
2013
04:
25:5
1.
Publ
ishe
d on
24
Sept
embe
r 20
12 o
n ht
tp://
pubs
.rsc
.org
| do
i:10.
1039
/C2J
M35
128E
View Article Online
(N-CNF) in acid medium.22 The FeNx doping could be achieved
significantly on CNF due to the rich defect sites i.e., the inherent
slanting edges and the cup-stacked structure of CNF.
Here, we show a proficient way to create highly densed N and
iron nitride doped nanoporous Gr (FeNGr) via pyrolysis of the
partially reduced graphene oxide (r-GO) with the iron phenan-
throline (Fe(phen)32+) complex. The created vacancy has been
effectively utilized for subsequent N doping which has further
been explored for electrochemical ORR activity. Earlier,
Dai et. al. synthesized N-doped Gr by thermal annealing of GO
with NH3 and reported the essential role played by the different
oxygen functional groups such as carboxyl, carbonyl and
lactones for the effective nitrogen doping.23 Similarly, in the
present work, r-GO gets reduced into Gr during annealing, while
the functional groups present between the basal planes of r-GO
interact with Fe from iron acetate (Fe(OAc)2) to form uniformly
distributed iron oxide (Fe2O3) nanoparticles. Thus the formed
Fe2O3 nanoparticles trigger etching of carbon at the Fe2O3–Gr
interface and generate multi-vacancies on Gr as shown in
Scheme 1. Moreover, the lingering iron in coordination with
phen tends to cause iron nitride (FeN) doping during the thermal
treatment process. Subsequent removal of the entrapped Fe2O3
nanoparticles leads to exposure of the unsaturated pore openings
of graphene where further N doping can be done very effectively.
In this way the number density of the active sites responsible for
ORR can be increased all the while keeping the material highly
porous, which is an important requirement in electrocatalysts for
PEMFCs, where mass transfer generally plays a key role.
2. Materials and methods
2.1. Synthesis of graphene oxide (GO)
GOwas synthesized by an improved Hummer’s method.24 Briefly
1 g of graphite powder was ground with 6 g of potassium
23800 | J. Mater. Chem., 2012, 22, 23799–23805
permanganate (KMnO4) and this was slowly added into the
solvent mixture of con. H2SO4 : H3PO4 (9 : 1 ratio) with
mechanical stirring at room temperature. Further, the tempera-
ture of the reaction mixture was increased and maintained at
55 �C for 12 h. The oxidation reaction was stopped by adding the
colloidal solution into 400 ml of cold water which contains 3 ml
of 30% H2O2. The brownish yellow colored solution was
centrifuged (10 000 rpm) and the supernatant solution was dec-
anted away and the resulting material was subjected to multiple
washings with water, ethanol, acetone and polyether.
2.2. Synthesis of partially reduced GO (r-GO)
GO obtained from the previous process was subjected to mild
reduction by heating at 100 �C in an Ar atmosphere to obtain the
partially reduced GO (r-GO). The purpose of the mild reduction
is essentially to decrease the number density of the oxygen
functional groups in GO.
2.3. Pore generation and nitrogen doping
For all the catalysts in this work, we have used commercially
obtained iron acetate (Fe(OAc)2) (Aldrich) and 1,10-phenan-
throline (phen) (Aldrich 99%) as the Fe and nitrogen precursors,
respectively. In a typical synthesis of iron nitride-doped Gr
(FeNGr), the weighed amount of r-GO (100 mg) was dispersed in
50 ml of ethanol (Rankem 99.9%) by ultrasonication. An excess
amount of phen (200 mg) in 25 ml of ethanol was added and
allowed to intersperse in between the basal planes of r-GO by
magnetic stirring for about 30 min. Further, the required amount
of (Fe(OAc)2) (7 mg) in ethanol was added drop by drop into the
phen–r-GO mixture. The final weight percentage of Fe was
determined by EDAX analysis. The Fe(OAc)2 reacts with phen
to form the Fe[(phen) 3]2+ chelate complex, which was confirmed
from the color change from pale yellow to wine red. Subse-
quently, the chelate complex solution was mechanically stirred
for 24 h at room temperature to achieve efficient diffusion of the
iron chelate complex into the basal plane of r-GO. The resulting
mixture was placed in a beaker inside an oven and the solvent
was evaporated at 50 �C for about 3 h. The resulting solid
material was placed in a quartz tube and was pyrolysed in an Ar
atmosphere at 900 �C. The temperature ramp was 10 �C per
minute till it reaches 900 �C and the system was maintained at
that temperature for 3 h with an Ar flow of 0.5 sccm. Subse-
quently, the system was allowed to cool to room temperature
under an Ar flow. The pyrolysed product was then washed with
ethanol and filtered (filter paper 0.2 mm pore size, Rankem) to
remove the chars of organic residues. The material obtained at
this stage was dried at 80 �C for 2 h and was preserved for further
studies (FeNGr-1). During the annealing at 900 �C, r-GO gets
reduced into Gr while the functional groups present between the
basal planes of r-GO interact with Fe from iron acetate
(Fe(OAc)2) to form uniformly distributed iron oxide (Fe2O3)
nanoparticles. This in turn generates multi-vacancies on Gr by
etching the carbon atoms on the reduced Gr surface as shown in
Scheme 1 (main text). Moreover, the lingering iron in coordi-
nation with the phenanthroline tends to cause iron nitride doping
during the thermal treatment. On subsequent acid treatment, the
Fe2O3 gets leached out by creating well-distributed nanometer
This journal is ª The Royal Society of Chemistry 2012
Dow
nloa
ded
by G
eorg
e M
ason
Uni
vers
ity o
n 06
/05/
2013
04:
25:5
1.
Publ
ishe
d on
24
Sept
embe
r 20
12 o
n ht
tp://
pubs
.rsc
.org
| do
i:10.
1039
/C2J
M35
128E
View Article Online
sized pores on Gr. This iron nitride-doped porous Gr is desig-
nated as FeNGr2. Successive N doping on the created pore
openings of FeNGr-2 was done by annealing the material with
phen alone. The resulting N rich porous material is named as
FeNGr3. Since the oxygen (O) functional groups reflect the
relative content of the porosity and nitrogen doping on the
graphene sheets, we applied the same approach to prepare
another form of iron nitride doped Gr (FeNGr4) by using GO
(without the mild reduction). In order to study the role of the
functional groups present on the basal plane of r-GO to facilitate
the Fe2O3 formation, a sample was prepared by using pre-
reduced GO (FeNGr5). The pre-reduction of GO was obtained
by mild thermal treatment of GO at 600 �C for 1 h in an Ar
atmosphere. Finally, to compare the role of Fe, nitrogen doped
Gr (N-Gr) was prepared by pyrolyzing r-GO directly with phen
(i.e. by avoiding Fe addition).
2.4. Structural characterization
X-ray photoelectron spectroscopy (XPS) was carried out on a
VG Microtech Multilab ESCA 3000 spectrometer that was
equipped with an Mg Ka X-ray source (hv ¼ 1253.6 eV). The
X-ray diffraction (XRD) patterns of the prepared catalysts were
obtained by using a PANalytical X’pert Pro instrument. All data
were collected with a scan rate of 0.5� per min using Cu Ka
(1.5418 �A) radiation. A high resolution transmission electron
microscope (HR-TEM) FEI model TECNAI G2 F30 instrument
operated at an accelerating voltage of 300 kV (Cs ¼ 0.6 mm,
resolution 1.7 �A) was used to analyze the structure and
morphology of the prepared Gr based samples. TEM samples
were prepared by drop casting the prepared catalysts in ethanol
on a 200 mesh copper grid coated with the carbon film (ICON
Analytical) and dried in vacuum overnight and loaded in the
electron microscope chamber. Energy dispersive X-ray analysis
(EDX) measurements were performed on a scanning electron
microscope (SEM) system (FEI, Model Quanta 200 3D) equip-
ped with an EDX attachment.
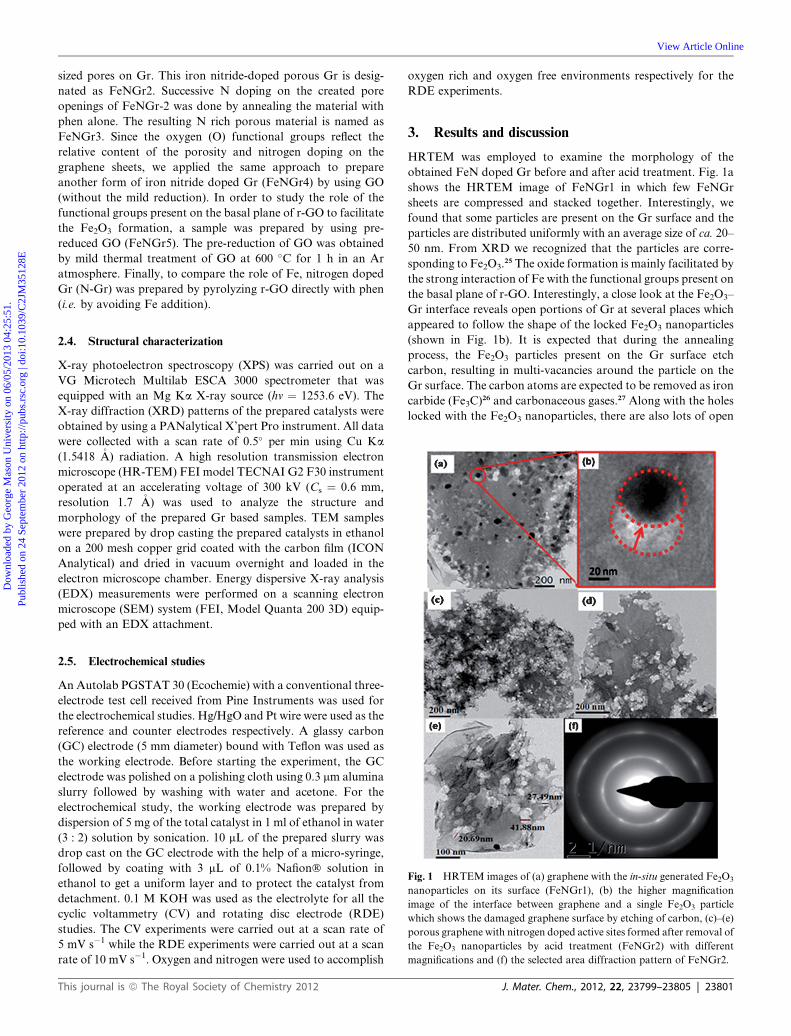
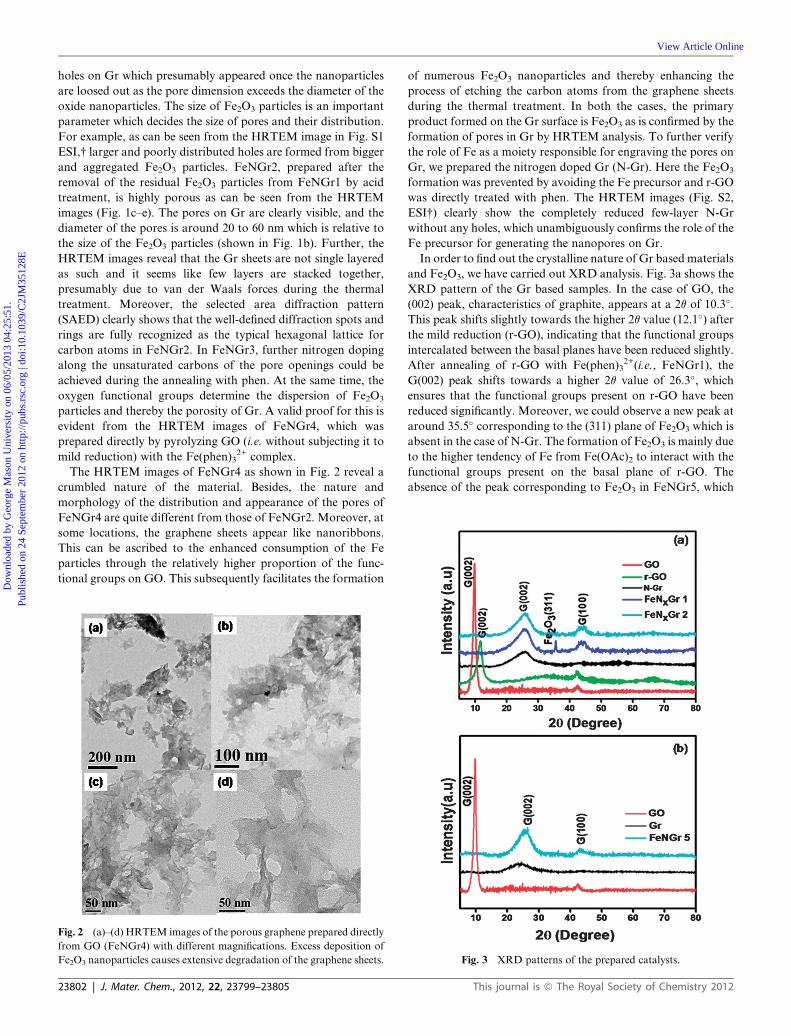
Fig. 1 HRTEM images of (a) graphene with the in-situ generated Fe2O3
nanoparticles on its surface (FeNGr1), (b) the higher magnification
image of the interface between graphene and a single Fe2O3 particle
which shows the damaged graphene surface by etching of carbon, (c)–(e)
porous graphene with nitrogen doped active sites formed after removal of
the Fe2O3 nanoparticles by acid treatment (FeNGr2) with different
magnifications and (f) the selected area diffraction pattern of FeNGr2.
2.5. Electrochemical studies
An Autolab PGSTAT 30 (Ecochemie) with a conventional three-
electrode test cell received from Pine Instruments was used for
the electrochemical studies. Hg/HgO and Pt wire were used as the
reference and counter electrodes respectively. A glassy carbon
(GC) electrode (5 mm diameter) bound with Teflon was used as
the working electrode. Before starting the experiment, the GC
electrode was polished on a polishing cloth using 0.3 mm alumina
slurry followed by washing with water and acetone. For the
electrochemical study, the working electrode was prepared by
dispersion of 5 mg of the total catalyst in 1 ml of ethanol in water
(3 : 2) solution by sonication. 10 mL of the prepared slurry was
drop cast on the GC electrode with the help of a micro-syringe,
followed by coating with 3 mL of 0.1% Nafion� solution in
ethanol to get a uniform layer and to protect the catalyst from
detachment. 0.1 M KOH was used as the electrolyte for all the
cyclic voltammetry (CV) and rotating disc electrode (RDE)
studies. The CV experiments were carried out at a scan rate of
5 mV s�1 while the RDE experiments were carried out at a scan
rate of 10 mV s�1. Oxygen and nitrogen were used to accomplish
This journal is ª The Royal Society of Chemistry 2012
oxygen rich and oxygen free environments respectively for the
RDE experiments.
3. Results and discussion
HRTEM was employed to examine the morphology of the
obtained FeN doped Gr before and after acid treatment. Fig. 1a
shows the HRTEM image of FeNGr1 in which few FeNGr
sheets are compressed and stacked together. Interestingly, we
found that some particles are present on the Gr surface and the
particles are distributed uniformly with an average size of ca. 20–
50 nm. From XRD we recognized that the particles are corre-
sponding to Fe2O3.25 The oxide formation is mainly facilitated by
the strong interaction of Fe with the functional groups present on
the basal plane of r-GO. Interestingly, a close look at the Fe2O3–
Gr interface reveals open portions of Gr at several places which
appeared to follow the shape of the locked Fe2O3 nanoparticles
(shown in Fig. 1b). It is expected that during the annealing
process, the Fe2O3 particles present on the Gr surface etch
carbon, resulting in multi-vacancies around the particle on the
Gr surface. The carbon atoms are expected to be removed as iron
carbide (Fe3C)26 and carbonaceous gases.27 Along with the holes
locked with the Fe2O3 nanoparticles, there are also lots of open
J. Mater. Chem., 2012, 22, 23799–23805 | 23801
Dow
nloa
ded
by G
eorg
e M
ason
Uni
vers
ity o
n 06
/05/
2013
04:
25:5
1.
Publ
ishe
d on
24
Sept
embe
r 20
12 o
n ht
tp://
pubs
.rsc
.org
| do
i:10.
1039
/C2J
M35
128E
View Article Online
holes on Gr which presumably appeared once the nanoparticles
are loosed out as the pore dimension exceeds the diameter of the
oxide nanoparticles. The size of Fe2O3 particles is an important
parameter which decides the size of pores and their distribution.
For example, as can be seen from the HRTEM image in Fig. S1
ESI,† larger and poorly distributed holes are formed from bigger
and aggregated Fe2O3 particles. FeNGr2, prepared after the
removal of the residual Fe2O3 particles from FeNGr1 by acid
treatment, is highly porous as can be seen from the HRTEM
images (Fig. 1c–e). The pores on Gr are clearly visible, and the
diameter of the pores is around 20 to 60 nm which is relative to
the size of the Fe2O3 particles (shown in Fig. 1b). Further, the
HRTEM images reveal that the Gr sheets are not single layered
as such and it seems like few layers are stacked together,
presumably due to van der Waals forces during the thermal
treatment. Moreover, the selected area diffraction pattern
(SAED) clearly shows that the well-defined diffraction spots and
rings are fully recognized as the typical hexagonal lattice for
carbon atoms in FeNGr2. In FeNGr3, further nitrogen doping
along the unsaturated carbons of the pore openings could be
achieved during the annealing with phen. At the same time, the
oxygen functional groups determine the dispersion of Fe2O3
particles and thereby the porosity of Gr. A valid proof for this is
evident from the HRTEM images of FeNGr4, which was
prepared directly by pyrolyzing GO (i.e. without subjecting it to
mild reduction) with the Fe(phen)32+ complex.
The HRTEM images of FeNGr4 as shown in Fig. 2 reveal a
crumbled nature of the material. Besides, the nature and
morphology of the distribution and appearance of the pores of
FeNGr4 are quite different from those of FeNGr2. Moreover, at
some locations, the graphene sheets appear like nanoribbons.
This can be ascribed to the enhanced consumption of the Fe
particles through the relatively higher proportion of the func-
tional groups on GO. This subsequently facilitates the formation
Fig. 2 (a)–(d) HRTEM images of the porous graphene prepared directly
from GO (FeNGr4) with different magnifications. Excess deposition of
Fe2O3 nanoparticles causes extensive degradation of the graphene sheets.
23802 | J. Mater. Chem., 2012, 22, 23799–23805
of numerous Fe2O3 nanoparticles and thereby enhancing the
process of etching the carbon atoms from the graphene sheets
during the thermal treatment. In both the cases, the primary
product formed on the Gr surface is Fe2O3 as is confirmed by the
formation of pores in Gr by HRTEM analysis. To further verify
the role of Fe as a moiety responsible for engraving the pores on
Gr, we prepared the nitrogen doped Gr (N-Gr). Here the Fe2O3
formation was prevented by avoiding the Fe precursor and r-GO
was directly treated with phen. The HRTEM images (Fig. S2,
ESI†) clearly show the completely reduced few-layer N-Gr
without any holes, which unambiguously confirms the role of the
Fe precursor for generating the nanopores on Gr.
In order to find out the crystalline nature of Gr based materials
and Fe2O3, we have carried out XRD analysis. Fig. 3a shows the
XRD pattern of the Gr based samples. In the case of GO, the
(002) peak, characteristics of graphite, appears at a 2q of 10.3�.This peak shifts slightly towards the higher 2q value (12.1�) afterthe mild reduction (r-GO), indicating that the functional groups
intercalated between the basal planes have been reduced slightly.
After annealing of r-GO with Fe(phen)32+(i.e., FeNGr1), the
G(002) peak shifts towards a higher 2q value of 26.3�, whichensures that the functional groups present on r-GO have been
reduced significantly. Moreover, we could observe a new peak at
around 35.5� corresponding to the (311) plane of Fe2O3 which is
absent in the case of N-Gr. The formation of Fe2O3 is mainly due
to the higher tendency of Fe from Fe(OAc)2 to interact with the
functional groups present on the basal plane of r-GO. The
absence of the peak corresponding to Fe2O3 in FeNGr5, which
Fig. 3 XRD patterns of the prepared catalysts.
This journal is ª The Royal Society of Chemistry 2012
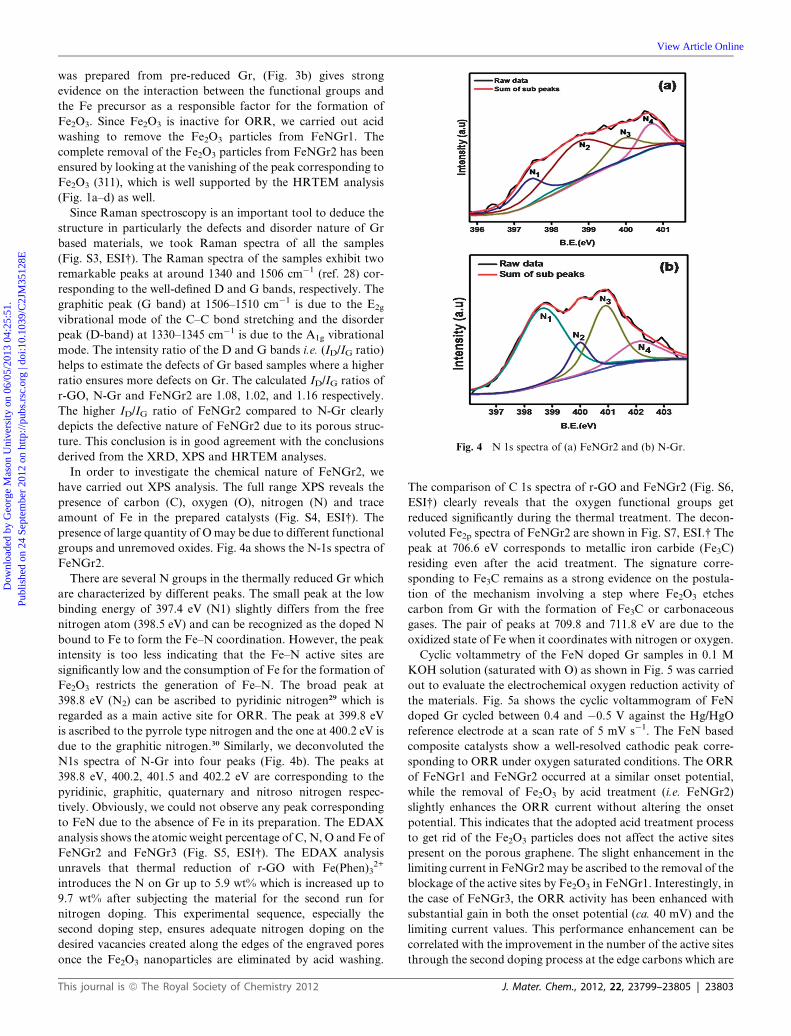
Fig. 4 N 1s spectra of (a) FeNGr2 and (b) N-Gr.
Dow
nloa
ded
by G
eorg
e M
ason
Uni
vers
ity o
n 06
/05/
2013
04:
25:5
1.
Publ
ishe
d on
24
Sept
embe
r 20
12 o
n ht
tp://
pubs
.rsc
.org
| do
i:10.
1039
/C2J
M35
128E
View Article Online
was prepared from pre-reduced Gr, (Fig. 3b) gives strong
evidence on the interaction between the functional groups and
the Fe precursor as a responsible factor for the formation of
Fe2O3. Since Fe2O3 is inactive for ORR, we carried out acid
washing to remove the Fe2O3 particles from FeNGr1. The
complete removal of the Fe2O3 particles from FeNGr2 has been
ensured by looking at the vanishing of the peak corresponding to
Fe2O3 (311), which is well supported by the HRTEM analysis
(Fig. 1a–d) as well.
Since Raman spectroscopy is an important tool to deduce the
structure in particularly the defects and disorder nature of Gr
based materials, we took Raman spectra of all the samples
(Fig. S3, ESI†). The Raman spectra of the samples exhibit two
remarkable peaks at around 1340 and 1506 cm�1 (ref. 28) cor-
responding to the well-defined D and G bands, respectively. The
graphitic peak (G band) at 1506–1510 cm�1 is due to the E2g
vibrational mode of the C–C bond stretching and the disorder
peak (D-band) at 1330–1345 cm�1 is due to the A1g vibrational
mode. The intensity ratio of the D and G bands i.e. (ID/IG ratio)
helps to estimate the defects of Gr based samples where a higher
ratio ensures more defects on Gr. The calculated ID/IG ratios of
r-GO, N-Gr and FeNGr2 are 1.08, 1.02, and 1.16 respectively.
The higher ID/IG ratio of FeNGr2 compared to N-Gr clearly
depicts the defective nature of FeNGr2 due to its porous struc-
ture. This conclusion is in good agreement with the conclusions
derived from the XRD, XPS and HRTEM analyses.
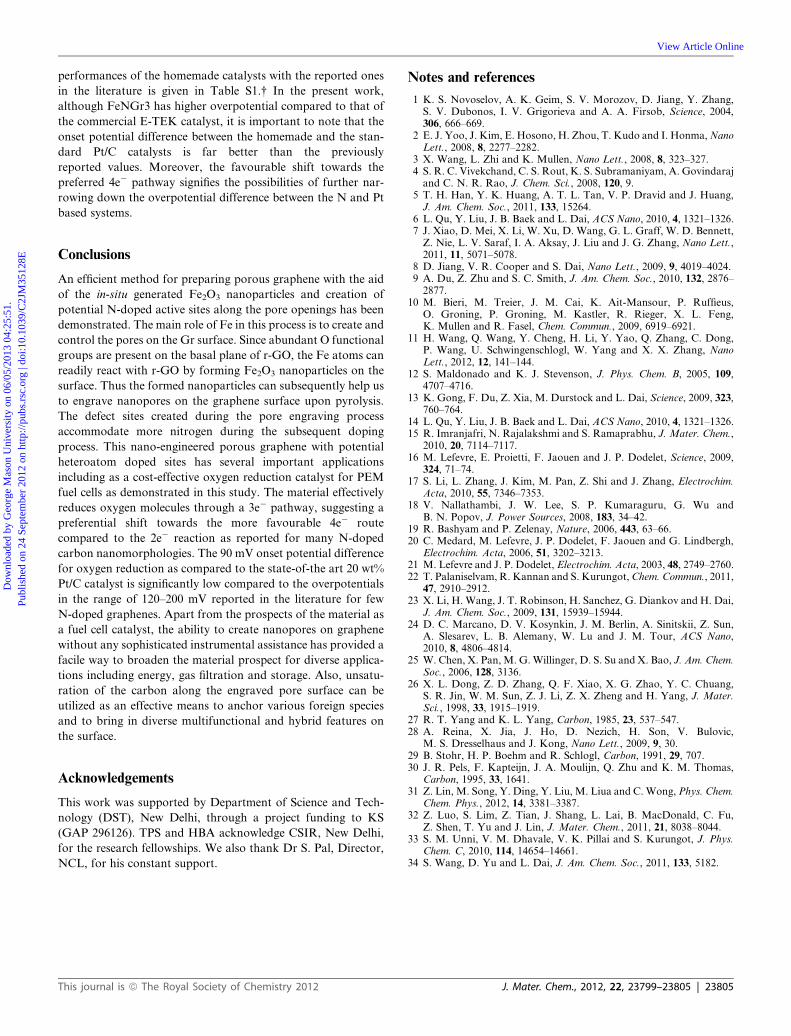
In order to investigate the chemical nature of FeNGr2, we
have carried out XPS analysis. The full range XPS reveals the
presence of carbon (C), oxygen (O), nitrogen (N) and trace
amount of Fe in the prepared catalysts (Fig. S4, ESI†). The
presence of large quantity of Omay be due to different functional
groups and unremoved oxides. Fig. 4a shows the N-1s spectra of
FeNGr2.
There are several N groups in the thermally reduced Gr which
are characterized by different peaks. The small peak at the low
binding energy of 397.4 eV (N1) slightly differs from the free
nitrogen atom (398.5 eV) and can be recognized as the doped N
bound to Fe to form the Fe–N coordination. However, the peak
intensity is too less indicating that the Fe–N active sites are
significantly low and the consumption of Fe for the formation of
Fe2O3 restricts the generation of Fe–N. The broad peak at
398.8 eV (N2) can be ascribed to pyridinic nitrogen29 which is
regarded as a main active site for ORR. The peak at 399.8 eV
is ascribed to the pyrrole type nitrogen and the one at 400.2 eV is
due to the graphitic nitrogen.30 Similarly, we deconvoluted the
N1s spectra of N-Gr into four peaks (Fig. 4b). The peaks at
398.8 eV, 400.2, 401.5 and 402.2 eV are corresponding to the
pyridinic, graphitic, quaternary and nitroso nitrogen respec-
tively. Obviously, we could not observe any peak corresponding
to FeN due to the absence of Fe in its preparation. The EDAX
analysis shows the atomic weight percentage of C, N, O and Fe of
FeNGr2 and FeNGr3 (Fig. S5, ESI†). The EDAX analysis
unravels that thermal reduction of r-GO with Fe(Phen)32+
introduces the N on Gr up to 5.9 wt% which is increased up to
9.7 wt% after subjecting the material for the second run for
nitrogen doping. This experimental sequence, especially the
second doping step, ensures adequate nitrogen doping on the
desired vacancies created along the edges of the engraved pores
once the Fe2O3 nanoparticles are eliminated by acid washing.
This journal is ª The Royal Society of Chemistry 2012
The comparison of C 1s spectra of r-GO and FeNGr2 (Fig. S6,
ESI†) clearly reveals that the oxygen functional groups get
reduced significantly during the thermal treatment. The decon-
voluted Fe2p spectra of FeNGr2 are shown in Fig. S7, ESI.† The
peak at 706.6 eV corresponds to metallic iron carbide (Fe3C)
residing even after the acid treatment. The signature corre-
sponding to Fe3C remains as a strong evidence on the postula-
tion of the mechanism involving a step where Fe2O3 etches
carbon from Gr with the formation of Fe3C or carbonaceous
gases. The pair of peaks at 709.8 and 711.8 eV are due to the
oxidized state of Fe when it coordinates with nitrogen or oxygen.
Cyclic voltammetry of the FeN doped Gr samples in 0.1 M
KOH solution (saturated with O) as shown in Fig. 5 was carried
out to evaluate the electrochemical oxygen reduction activity of
the materials. Fig. 5a shows the cyclic voltammogram of FeN
doped Gr cycled between 0.4 and �0.5 V against the Hg/HgO
reference electrode at a scan rate of 5 mV s�1. The FeN based
composite catalysts show a well-resolved cathodic peak corre-
sponding to ORR under oxygen saturated conditions. The ORR
of FeNGr1 and FeNGr2 occurred at a similar onset potential,
while the removal of Fe2O3 by acid treatment (i.e. FeNGr2)
slightly enhances the ORR current without altering the onset
potential. This indicates that the adopted acid treatment process
to get rid of the Fe2O3 particles does not affect the active sites
present on the porous graphene. The slight enhancement in the
limiting current in FeNGr2 may be ascribed to the removal of the
blockage of the active sites by Fe2O3 in FeNGr1. Interestingly, in
the case of FeNGr3, the ORR activity has been enhanced with
substantial gain in both the onset potential (ca. 40 mV) and the
limiting current values. This performance enhancement can be
correlated with the improvement in the number of the active sites
through the second doping process at the edge carbons which are
J. Mater. Chem., 2012, 22, 23799–23805 | 23803
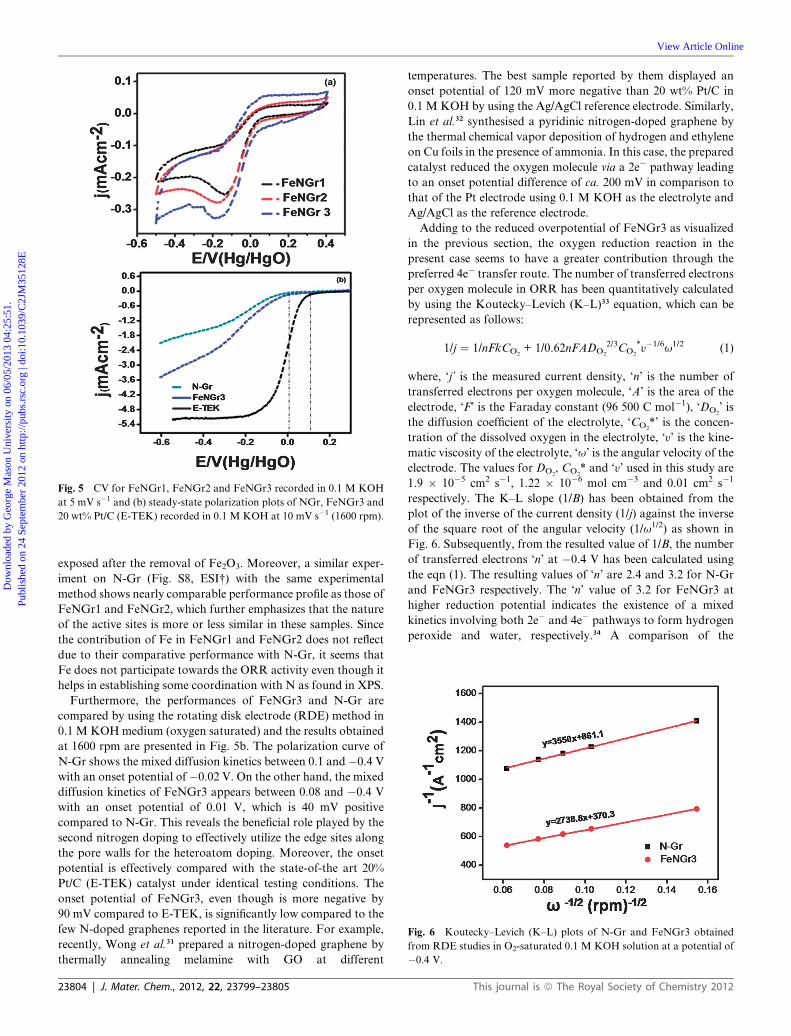
Fig. 5 CV for FeNGr1, FeNGr2 and FeNGr3 recorded in 0.1 M KOH
at 5 mV s�1 and (b) steady-state polarization plots of NGr, FeNGr3 and
20 wt% Pt/C (E-TEK) recorded in 0.1 M KOH at 10 mV s�1 (1600 rpm).
Fig. 6 Koutecky–Levich (K–L) plots of N-Gr and FeNGr3 obtained
from RDE studies in O2-saturated 0.1 M KOH solution at a potential of
�0.4 V.
Dow
nloa
ded
by G
eorg
e M
ason
Uni
vers
ity o
n 06
/05/
2013
04:
25:5
1.
Publ
ishe
d on
24
Sept
embe
r 20
12 o
n ht
tp://
pubs
.rsc
.org
| do
i:10.
1039
/C2J
M35
128E
View Article Online
exposed after the removal of Fe2O3. Moreover, a similar exper-
iment on N-Gr (Fig. S8, ESI†) with the same experimental
method shows nearly comparable performance profile as those of
FeNGr1 and FeNGr2, which further emphasizes that the nature
of the active sites is more or less similar in these samples. Since
the contribution of Fe in FeNGr1 and FeNGr2 does not reflect
due to their comparative performance with N-Gr, it seems that
Fe does not participate towards the ORR activity even though it
helps in establishing some coordination with N as found in XPS.
Furthermore, the performances of FeNGr3 and N-Gr are
compared by using the rotating disk electrode (RDE) method in
0.1 M KOHmedium (oxygen saturated) and the results obtained
at 1600 rpm are presented in Fig. 5b. The polarization curve of
N-Gr shows the mixed diffusion kinetics between 0.1 and�0.4 V
with an onset potential of�0.02 V. On the other hand, the mixed
diffusion kinetics of FeNGr3 appears between 0.08 and �0.4 V
with an onset potential of 0.01 V, which is 40 mV positive
compared to N-Gr. This reveals the beneficial role played by the
second nitrogen doping to effectively utilize the edge sites along
the pore walls for the heteroatom doping. Moreover, the onset
potential is effectively compared with the state-of-the art 20%
Pt/C (E-TEK) catalyst under identical testing conditions. The
onset potential of FeNGr3, even though is more negative by
90 mV compared to E-TEK, is significantly low compared to the
few N-doped graphenes reported in the literature. For example,
recently, Wong et al.31 prepared a nitrogen-doped graphene by
thermally annealing melamine with GO at different
23804 | J. Mater. Chem., 2012, 22, 23799–23805
temperatures. The best sample reported by them displayed an
onset potential of 120 mV more negative than 20 wt% Pt/C in
0.1 M KOH by using the Ag/AgCl reference electrode. Similarly,
Lin et al.32 synthesised a pyridinic nitrogen-doped graphene by
the thermal chemical vapor deposition of hydrogen and ethylene
on Cu foils in the presence of ammonia. In this case, the prepared
catalyst reduced the oxygen molecule via a 2e� pathway leading
to an onset potential difference of ca. 200 mV in comparison to
that of the Pt electrode using 0.1 M KOH as the electrolyte and
Ag/AgCl as the reference electrode.
Adding to the reduced overpotential of FeNGr3 as visualized
in the previous section, the oxygen reduction reaction in the
present case seems to have a greater contribution through the
preferred 4e� transfer route. The number of transferred electrons
per oxygen molecule in ORR has been quantitatively calculated
by using the Koutecky–Levich (K–L)33 equation, which can be
represented as follows:
1/j ¼ 1/nFkCO2+ 1/0.62nFADO2
2/3CO2
*y�1/6u1/2 (1)
where, ‘j’ is the measured current density, ‘n’ is the number of
transferred electrons per oxygen molecule, ‘A’ is the area of the
electrode, ‘F’ is the Faraday constant (96 500 C mol�1), ‘DO2’ is
the diffusion coefficient of the electrolyte, ‘CO2*’ is the concen-
tration of the dissolved oxygen in the electrolyte, ‘y’ is the kine-
matic viscosity of the electrolyte, ‘u’ is the angular velocity of the
electrode. The values for DO2, CO2
* and ‘y’ used in this study are
1.9 � 10�5 cm2 s�1, 1.22 � 10�6 mol cm�3 and 0.01 cm2 s�1
respectively. The K–L slope (1/B) has been obtained from the
plot of the inverse of the current density (1/j) against the inverse
of the square root of the angular velocity (1/u1/2) as shown in
Fig. 6. Subsequently, from the resulted value of 1/B, the number
of transferred electrons ‘n’ at �0.4 V has been calculated using
the eqn (1). The resulting values of ‘n’ are 2.4 and 3.2 for N-Gr
and FeNGr3 respectively. The ‘n’ value of 3.2 for FeNGr3 at
higher reduction potential indicates the existence of a mixed
kinetics involving both 2e� and 4e� pathways to form hydrogen
peroxide and water, respectively.34 A comparison of the
This journal is ª The Royal Society of Chemistry 2012
Dow
nloa
ded
by G
eorg
e M
ason
Uni
vers
ity o
n 06
/05/
2013
04:
25:5
1.
Publ
ishe
d on
24
Sept
embe
r 20
12 o
n ht
tp://
pubs
.rsc
.org
| do
i:10.
1039
/C2J
M35
128E
View Article Online
performances of the homemade catalysts with the reported ones
in the literature is given in Table S1.† In the present work,
although FeNGr3 has higher overpotential compared to that of
the commercial E-TEK catalyst, it is important to note that the
onset potential difference between the homemade and the stan-
dard Pt/C catalysts is far better than the previously
reported values. Moreover, the favourable shift towards the
preferred 4e� pathway signifies the possibilities of further nar-
rowing down the overpotential difference between the N and Pt
based systems.
Conclusions
An efficient method for preparing porous graphene with the aid
of the in-situ generated Fe2O3 nanoparticles and creation of
potential N-doped active sites along the pore openings has been
demonstrated. The main role of Fe in this process is to create and
control the pores on the Gr surface. Since abundant O functional
groups are present on the basal plane of r-GO, the Fe atoms can
readily react with r-GO by forming Fe2O3 nanoparticles on the
surface. Thus the formed nanoparticles can subsequently help us
to engrave nanopores on the graphene surface upon pyrolysis.
The defect sites created during the pore engraving process
accommodate more nitrogen during the subsequent doping
process. This nano-engineered porous graphene with potential
heteroatom doped sites has several important applications
including as a cost-effective oxygen reduction catalyst for PEM
fuel cells as demonstrated in this study. The material effectively
reduces oxygen molecules through a 3e� pathway, suggesting a
preferential shift towards the more favourable 4e� route
compared to the 2e� reaction as reported for many N-doped
carbon nanomorphologies. The 90 mV onset potential difference
for oxygen reduction as compared to the state-of-the art 20 wt%
Pt/C catalyst is significantly low compared to the overpotentials
in the range of 120–200 mV reported in the literature for few
N-doped graphenes. Apart from the prospects of the material as
a fuel cell catalyst, the ability to create nanopores on graphene
without any sophisticated instrumental assistance has provided a
facile way to broaden the material prospect for diverse applica-
tions including energy, gas filtration and storage. Also, unsatu-
ration of the carbon along the engraved pore surface can be
utilized as an effective means to anchor various foreign species
and to bring in diverse multifunctional and hybrid features on
the surface.
Acknowledgements
This work was supported by Department of Science and Tech-
nology (DST), New Delhi, through a project funding to KS
(GAP 296126). TPS and HBA acknowledge CSIR, New Delhi,
for the research fellowships. We also thank Dr S. Pal, Director,
NCL, for his constant support.
This journal is ª The Royal Society of Chemistry 2012
Notes and references
1 K. S. Novoselov, A. K. Geim, S. V. Morozov, D. Jiang, Y. Zhang,S. V. Dubonos, I. V. Grigorieva and A. A. Firsob, Science, 2004,306, 666–669.
2 E. J. Yoo, J. Kim, E. Hosono, H. Zhou, T. Kudo and I. Honma,NanoLett., 2008, 8, 2277–2282.
3 X. Wang, L. Zhi and K. Mullen, Nano Lett., 2008, 8, 323–327.4 S. R. C. Vivekchand, C. S. Rout, K. S. Subramaniyam, A. Govindarajand C. N. R. Rao, J. Chem. Sci., 2008, 120, 9.
5 T. H. Han, Y. K. Huang, A. T. L. Tan, V. P. Dravid and J. Huang,J. Am. Chem. Soc., 2011, 133, 15264.
6 L. Qu, Y. Liu, J. B. Baek and L. Dai, ACS Nano, 2010, 4, 1321–1326.7 J. Xiao, D. Mei, X. Li, W. Xu, D. Wang, G. L. Graff, W. D. Bennett,Z. Nie, L. V. Saraf, I. A. Aksay, J. Liu and J. G. Zhang, Nano Lett.,2011, 11, 5071–5078.
8 D. Jiang, V. R. Cooper and S. Dai, Nano Lett., 2009, 9, 4019–4024.9 A. Du, Z. Zhu and S. C. Smith, J. Am. Chem. Soc., 2010, 132, 2876–2877.
10 M. Bieri, M. Treier, J. M. Cai, K. Ait-Mansour, P. Ruffieus,O. Groning, P. Groning, M. Kastler, R. Rieger, X. L. Feng,K. Mullen and R. Fasel, Chem. Commun., 2009, 6919–6921.
11 H. Wang, Q. Wang, Y. Cheng, H. Li, Y. Yao, Q. Zhang, C. Dong,P. Wang, U. Schwingenschlogl, W. Yang and X. X. Zhang, NanoLett., 2012, 12, 141–144.
12 S. Maldonado and K. J. Stevenson, J. Phys. Chem. B, 2005, 109,4707–4716.
13 K. Gong, F. Du, Z. Xia, M. Durstock and L. Dai, Science, 2009, 323,760–764.
14 L. Qu, Y. Liu, J. B. Baek and L. Dai, ACS Nano, 2010, 4, 1321–1326.15 R. Imranjafri, N. Rajalakshmi and S. Ramaprabhu, J. Mater. Chem.,
2010, 20, 7114–7117.16 M. Lefevre, E. Proietti, F. Jaouen and J. P. Dodelet, Science, 2009,
324, 71–74.17 S. Li, L. Zhang, J. Kim, M. Pan, Z. Shi and J. Zhang, Electrochim.
Acta, 2010, 55, 7346–7353.18 V. Nallathambi, J. W. Lee, S. P. Kumaraguru, G. Wu and
B. N. Popov, J. Power Sources, 2008, 183, 34–42.19 R. Bashyam and P. Zelenay, Nature, 2006, 443, 63–66.20 C. Medard, M. Lefevre, J. P. Dodelet, F. Jaouen and G. Lindbergh,
Electrochim. Acta, 2006, 51, 3202–3213.21 M. Lefevre and J. P. Dodelet, Electrochim. Acta, 2003, 48, 2749–2760.22 T. Palaniselvam, R. Kannan and S. Kurungot,Chem. Commun., 2011,
47, 2910–2912.23 X. Li, H. Wang, J. T. Robinson, H. Sanchez, G. Diankov and H. Dai,
J. Am. Chem. Soc., 2009, 131, 15939–15944.24 D. C. Marcano, D. V. Kosynkin, J. M. Berlin, A. Sinitskii, Z. Sun,
A. Slesarev, L. B. Alemany, W. Lu and J. M. Tour, ACS Nano,2010, 8, 4806–4814.
25 W. Chen, X. Pan,M. G.Willinger, D. S. Su and X. Bao, J. Am. Chem.Soc., 2006, 128, 3136.
26 X. L. Dong, Z. D. Zhang, Q. F. Xiao, X. G. Zhao, Y. C. Chuang,S. R. Jin, W. M. Sun, Z. J. Li, Z. X. Zheng and H. Yang, J. Mater.Sci., 1998, 33, 1915–1919.
27 R. T. Yang and K. L. Yang, Carbon, 1985, 23, 537–547.28 A. Reina, X. Jia, J. Ho, D. Nezich, H. Son, V. Bulovic,
M. S. Dresselhaus and J. Kong, Nano Lett., 2009, 9, 30.29 B. Stohr, H. P. Boehm and R. Schlogl, Carbon, 1991, 29, 707.30 J. R. Pels, F. Kapteijn, J. A. Moulijn, Q. Zhu and K. M. Thomas,
Carbon, 1995, 33, 1641.31 Z. Lin, M. Song, Y. Ding, Y. Liu, M. Liua and C.Wong, Phys. Chem.
Chem. Phys., 2012, 14, 3381–3387.32 Z. Luo, S. Lim, Z. Tian, J. Shang, L. Lai, B. MacDonald, C. Fu,
Z. Shen, T. Yu and J. Lin, J. Mater. Chem., 2011, 21, 8038–8044.33 S. M. Unni, V. M. Dhavale, V. K. Pillai and S. Kurungot, J. Phys.
Chem. C, 2010, 114, 14654–14661.34 S. Wang, D. Yu and L. Dai, J. Am. Chem. Soc., 2011, 133, 5182.
J. Mater. Chem., 2012, 22, 23799–23805 | 23805