Embed Size (px)
Citation preview
An Effective Data Analysis on Spectral
Clustering & Semi Supervised Consensus
Spectral Clustering using Consistent Iris
Datasets. 1Ramachandro Majji and
2Bhramaramba Ravi
1Department of CSE,
GMRIT, Rajam.
[email protected] 2Department of Information Technology,
GIT, GITAM University,
Visakhapatnam.
Abstract Data clustering (DC) is the process of grouping of data or dividing a
large data set into smaller data sets of similarity. There are many clustering
techniques which are used for gene expression data analysis. However,
choice of suitable methods for a given experimental dataset is not straight
forward. Clustering methods such as hierarchical clustering and k-means
are widely used for data analysis, but they are unable to deal with noise
and high dimensionality. Methods such as agglomerative hierarchical
clustering and k-means have been widely used on data analysis. Individual
clustering algorithms have their limitations in dealing with different
datasets. For example, k-means cannot handle clusters with complex
structures effectively, and selection of k value is somewhat challenge
without subjectivity. Therefore, many studies used different clustering
techniques to improve the robustness and quality of clustering results. In
this paper, we are implementing semi-supervised consensus (SSC)
clustering for effectively analysing the data.
Key Words:Data clustering, consensus, K-means, spectral & semi
supervised.
International Journal of Pure and Applied MathematicsVolume 119 No. 10 2018, 515-529ISSN: 1311-8080 (printed version); ISSN: 1314-3395 (on-line version)url: http://www.ijpam.euSpecial Issue ijpam.eu
515
1. Introduction
Data Mining (DM) is defined as extracting the information from the huge set of
data. In other words we can say, data mining is mining the knowledge from
data. It extracts knowledge from dataset in human understandable structure.
Simple clustering algorithms such as K-means (Kehar et al., 2009) and
hierarchical are widely used for analysing large data sets, but they are unable
to deal with noise and high dimensional data. Incorporating prior knowledge
in clustering has been shown to improve the consistency between the data
partitioning and domain knowledge (Sami A¨yra¨mo¨et al., 2009). It improves
the robustness and quality of clustering and also eliminates the noise before
partitioning and thus helps us in analysing the large data sets easily.
1.1. Existing System
Individual clustering algorithms have their limitations in dealing with different
datasets. For example, k-means is unable to capture clusters with complex
structures, and selection of k value is somewhat challenge without subjectivity.
Therefore, many studies used consensus clustering to improve the robustness
and quality of clustering results. The simple K-means algorithm (Nazeer et al.,
2009) is applied in an iterative fashion. Normally, K-means has some
challenges like selection of initial centroids, selecting “k” value. Usually K-
means is calculated by distance measure. Hierarchical clustering (Feng Luo et
al., 2005) is a method which seeks to build a hierarchy of clusters. Interpretation
of the hierarchy is complex and often confusing.
1.2. Proposed System
The proposed system deals with effective data analysis because the proposed
evolutionary algorithm for clustering (Shi Na, Li Xumin & Guan Yong et al.,
2010) high dimensional data and can handle noise. General clustering
algorithms such as k means and hierarchical cannot handle data sets with
complex data structures and different data sets. In this proposed work the two
algorithms semi-supervised spectral clustering and semi-supervised consensus
clustering are considered for evaluation. The output of spectral clustering is
used by the semi-supervised consensus clustering. This helps us in removing the
noise as well as effective clustering of data points.
1.2.1. Advantages
Using the algorithm in this work could reduce the data analysis for clustering by
removing the noise in the initial stage. It also reduces the number of data points
for analysis thus making the task simpler for analysis of data (Sunila Godara,
Amita Vermaet al., 2013). Many studies used prior knowledge in clustering
genes. These methods are referred as semi-supervised clustering approaches.
The results showed that using adequate amount of prior knowledge was able to
significantly improve the clustering results; also the more specific prior
knowledge used the better in improving the quality of clustering.
International Journal of Pure and Applied Mathematics Special Issue
516
Consensus clustering solves a clustering problem in two steps.
The first step, known as base clustering, takes a dataset as input and
outputs an ensemble of clustering solutions.
The second step takes the cluster ensemble as input and combines the
solutions through a consensus function, and then produces final
partitioning as the final output.
1.2.2 Disadvantages
The main drawback of the existing system is that it may not effectively cluster
different data sets and affects the efficiency of forming clusters. It may not
handle the noise data.
1.2.2.1. Finding the “k” value
A value often labelled k is a frequent problem in data clustering, and is a
distinct issue from the process of actually solving the clustering problem
where k specifies the number of clusters to detect.
The correct choice of k is often ambiguous, with interpretations depending on
the shape and scale of the distribution of points in a dataset and the desired
clustering resolution of the user. In addition, increasing k without penalty will
always reduce the amount of error in the resulting clustering, to the extreme
case of zero error if each data point is considered its own cluster (Taoying Li,
Yan Chen et al., 2010).
Intuitively then, the optimal choice of k will strike a balance between
maximum compression of the data using a single cluster, and maximum
accuracy by assigning each data point to its own cluster. If an appropriate
value of k is not apparent from prior knowledge of the properties of the dataset,
it must be chosen randomly.
1.3. Core Identifications
Basic Problem with the K-means algorithm given earlier is that empty clusters
can be obtained if no points are allocated to a cluster during the assignment
step. If this happens, then a strategy is needed to choose a replacement centroid,
otherwise, the squared error will be larger than necessary.
When outliers are present, the resulting cluster centroids (prototypes) may not
be as representative as they otherwise would be and thus, the SSE will be higher
as well.
2. Literature Study
Data Mining is defined as extracting the information from the huge set of data.
In other words we can say that DM is mining the knowledge from data. Data
clustering is one of the most popular techniques in DM. Clustering means
grouping of data or dividing a large data set into smaller sets of data based
relation degree of similarity. Each group, called a „cluster‟, consists of objects
International Journal of Pure and Applied Mathematics Special Issue
517
that are similar between themselves and dissimilar to objects of other groups.
This notion of similarity can be expressed in very different ways, according to
the purpose of the study, to domain-specific assumptions and to prior
knowledge of the problem. Clustering algorithms have been applied to a
w i d e range of specific problems, including exploratory data analysis, data
mining, image segmentation.
Clustering algorithms (Reza Ghaemi et al., 2009) can be grouped into two main
classes of algorithms, namely supervised and unsupervised. Clustering is
usually performed when no information is available concerning the membership
of data items to predefined classes. For this reason, clustering is traditionally
seen as part of unsupervised learning.
Examples are DBSCAN and Hierarchical. In addition to the similarity
information used by unsupervised clustering, in many cases a small amount of
knowledge is available concerning either pairwise constraints (Prasad et al.,
2014) between data items or class labels for some items. Instead of simply
using this knowledge for the external validation of the results of clustering, one
can imagine letting it “guide” or “adjust” the clustering process, i.e. provide a
limited form of supervision.
The resulting approach is called semi-supervised clustering. One of the
examples is Semi-supervised consensus clustering (SSC) (Swift et al., 2014).
Among the various clustering algorithms, k-means is the one of most widely
used clustering technique in data mining.
The performance of k-means clustering depends on the initial clusters and
might converge to local optimum. K-means does not guarantee the unique
clustering because it generates different results with randomly chosen initial
clusters for different runs of k-means algorithm.
Hierarchical clustering is a method of cluster analysis which seeks to build
a hierarchy of clusters. Strategies generally fall into two types: Agglomerative,
a "bottom up" approach and Divisive, a "top down" approach.
Semi-supervised clustering is partially supervised and improves the quality of
results in domain knowledge directed fashion. It was originally proposed by
(Yunli Wang & Youlian Pan, 2014).
This algorithm is mainly used for analysing micro array data. An Eigen matrix
for each and every cluster obtained in spectral clustering and thus produces the
Eigen values. Based on the Eigen values the noisy data is removed. SSC mainly
removes the noise data and thus reduces the data points for analysis. Therefore,
this algorithm can be widely used for analysing complex data structures such as
genes.
International Journal of Pure and Applied Mathematics Special Issue
518
3. Implementation
3.1. Cluster Analysis
The size of data is increasing vigorously every day. The clustering
methods are used to quickly retrieve the required information from the
large data repositories. Clustering is the process of grouping the data objects
into clusters. Clustering is a main task of explorative data mining, and a
common technique for statistical data analysis (Prasad et al., 2015 & 2016)
used in many fields, including machine learning, pattern recognition, image
analysis & information retrieval.
Cluster analysis itself i s not a specific algorithm, but the general task to be
solved. It can be achieved by various algorithms that differ significantly in
their notion of what constitutes a cluster and how to efficiently are found.
Popular notions (Mu-Chun Su et al., 2001) of clusters include groups with
low distances among the cluster members or particular statistical
distributions. Clustering can be formulated as a multi-objective optimization
problem. Mu-Chun Su
3.2. Main Elements of Cluster Analysis Data Representation.
Objects Choice.
Variables Choice.
Clusters?.
Normalization of variables.
Similarity or Dissimilarity measures.
Criteria for Clustering.
Missing Data Strategy.
Algorithms & Implementation.
Clusters Count.
Interpretation Results.
3.3. Clustering Techniques 3.3.1. Spectral Clustering (SC)
The notion of SC contains two steps:
A. Spectral Representation.
B. Clustering.
In spectral representation, each data point is represented with a vertex in a
weighted graph. The clustering step is to find partitions in the graph.
Given a dataset as X = {xi|i = 1, . . . , n} and similarity sij ≥ 0 between data
points xi and xj, the clustering process first construct a similarity graph G = (V,
E), V = {vi}, E = {eij} to represent relationship among the data points; where
each node vi represents a data point xi, and each edge eij represents the link
between two nodes vi and vj, if their similarity sij satisfies a given condition.
International Journal of Pure and Applied Mathematics Special Issue
519
The edge between nodes is weighted by sij.
The clustering process becomes a graph dividing problem such that the edges in
a group have high weights and those that have low weights.
The weighted similarity graph can be fully connected graph. The Gaussian
similarity function is usually used as sij = exp( |xi − xj|2 /2σ
2),
Where the parameter σ controls the width of the neighbourhoods.
3.3.2. Semi-supervised Spectral Clustering (SSC)
SSC uses foreknowledge in spectral clustering and pairwise conditions from
the domain knowledge. Pairwise conditions between two data points can be
represented as must-links and cannot-links.
For each pair of must-link (x,y), assign sxy= syx= 1.
For each pair of cannot-link (x,y), assign sxy= syx= 0.
If we use SSC for clustering samples in gene expression data using t-nearest
neighbor graph representation then two samples with highly similar expression
profiles are connected in the graph.In the graph,the change in the similarity
between the pairs of samples into 0 by using cannot-links, which breaks edges
between a pair of samples. Therefore, only must-links are preferable (Ulrike et
al., 2010).
4. Methodology of Implementation in Detail
4.1. Evolutionary Technique as Semi-Supervised Consensus Clustering
Pre-science knowledge can be applied in base clustering or consensus function
or in final clustering, to make a semi-supervised consensus clustering. Usually,
final clustering is applied on the consensus matrix generated from base
clustering.
Semi-supervised clustering algorithm (SSC) is used for base clustering in SSC
and it does not use pre-science knowledge either in consensus function or final
clustering. K-means can be used as base clustering on subspace datasets and
graph-cut algorithms for final clustering.
By using h-fold cross-validation we will perform the experiment. The dataset
was divided into training and testing sets, and the prescience knowledge was
added to the h − 1 folds training set. After obtaining of final clustering result, it
was evaluated on the testing set alone. The pre-science knowledge influence
could be assessed in a cross-validation framework.
A basic cluster-association matrix(BM) is generated at first based on the crisp
associations between samples and clusters using HBGF. Next, a refined cluster-
International Journal of Pure and Applied Mathematics Special Issue
520
association matrix(RM_ is generated from BM by estimating new association
values in RM. Finally, spectral clustering is applied on RM to obtain the final
clustering solution.
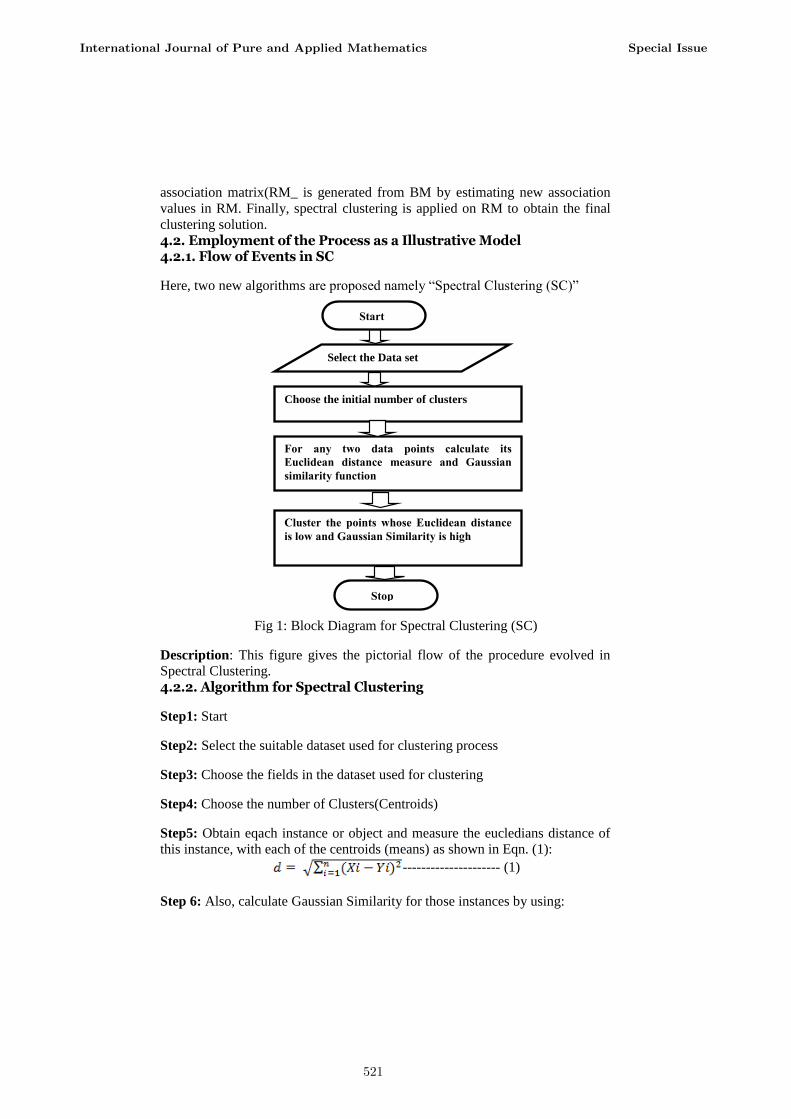
4.2. Employment of the Process as a Illustrative Model 4.2.1. Flow of Events in SC
Here, two new algorithms are proposed namely “Spectral Clustering (SC)”
Fig 1: Block Diagram for Spectral Clustering (SC)
Description: This figure gives the pictorial flow of the procedure evolved in
Spectral Clustering.
4.2.2. Algorithm for Spectral Clustering
Step1: Start
Step2: Select the suitable dataset used for clustering process
Step3: Choose the fields in the dataset used for clustering
Step4: Choose the number of Clusters(Centroids)
Step5: Obtain eqach instance or object and measure the eucledians distance of
this instance, with each of the centroids (means) as shown in Eqn. (1):
--------------------- (1)
Step 6: Also, calculate Gaussian Similarity for those instances by using:
Select the Data set
Choose the initial number of clusters
For any two data points calculate its
Euclidean distance measure and Gaussian
similarity function
Cluster the points whose Euclidean distance
is low and Gaussian Similarity is high
Stop
Start
International Journal of Pure and Applied Mathematics Special Issue
521
i.e., =
Where,
= Sum of
Xi = Each value in the data set
= Mean of all values in the data set
Step 7: Assign the points to those clusters whose Euclidean distance is less and
similarity is high with the data point.
Step 8: Stop
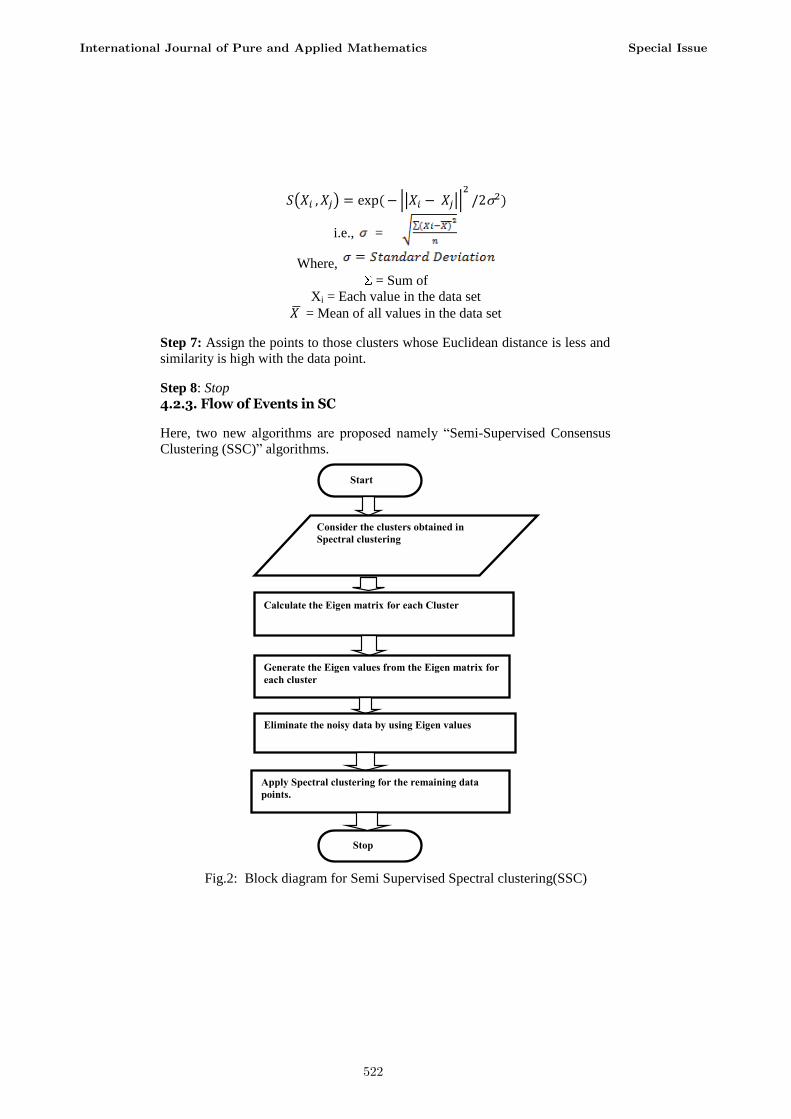
4.2.3. Flow of Events in SC
Here, two new algorithms are proposed namely “Semi-Supervised Consensus
Clustering (SSC)” algorithms.
Fig.2: Block diagram for Semi Supervised Spectral clustering(SSC)
Start
Consider the clusters obtained in
Spectral clustering
Calculate the Eigen matrix for each Cluster
Generate the Eigen values from the Eigen matrix for
each cluster
Eliminate the noisy data by using Eigen values
Stop
Apply Spectral clustering for the remaining data
points.
International Journal of Pure and Applied Mathematics Special Issue
522
Description: This figure gives the pictorial flow of the procedure evolved in
Semi Supervised Spectral Clustering.
4.2.4. Algorithm for Semi Supervised Consensus Spectral Clustering Step 1: Start
Step 2: Consider the clusters obtained in spectral clustering as input
Step 3: Generate the Eigen matrix as per class of each cluster
Step 4: Obtain the Eigen values from the Eigen matrix
Step 5: Eliminate the noisy data by comparing every data point with Eigen
value.
Step 6: Choose the number of partitions according to our requirement
Step 7: Cluster the remaining points by using Spectral clustering
Step 8: Stop
5. Results and Discussions
5.1. Iris Data Set
Iris data set consists of 4 attributes and 150 instances. The attributes are
“petal length”, “sepal length”, “petal width” and “sepal width”. Using this
data, the grouping in the persons having the similar eye structures is obtained.
(UCI).
Table 1: Iris Datasets Sample Data for Working on SC & SSC Proposed Algorithms
S.NO SEPAL LENGTH SEPAL WIDTH PETAL LENGTH PETAL WIDTH
1 5.1 3.5 1.4 0.2
2 4.9 3 1.4 0.2
3 4.7 3.2 1.3 0.2
4 5 3.1 1.5 0.2
5 4.6 3.6 1.4 0.2
6 5 3.9 1.7 0.4
7 5.4 3.4 1.4 0.3
8 4.4 3.4 1.5 0.2
9 4.9 2.9 1.4 0.2
10 5.4 3.1 1.5 0.1
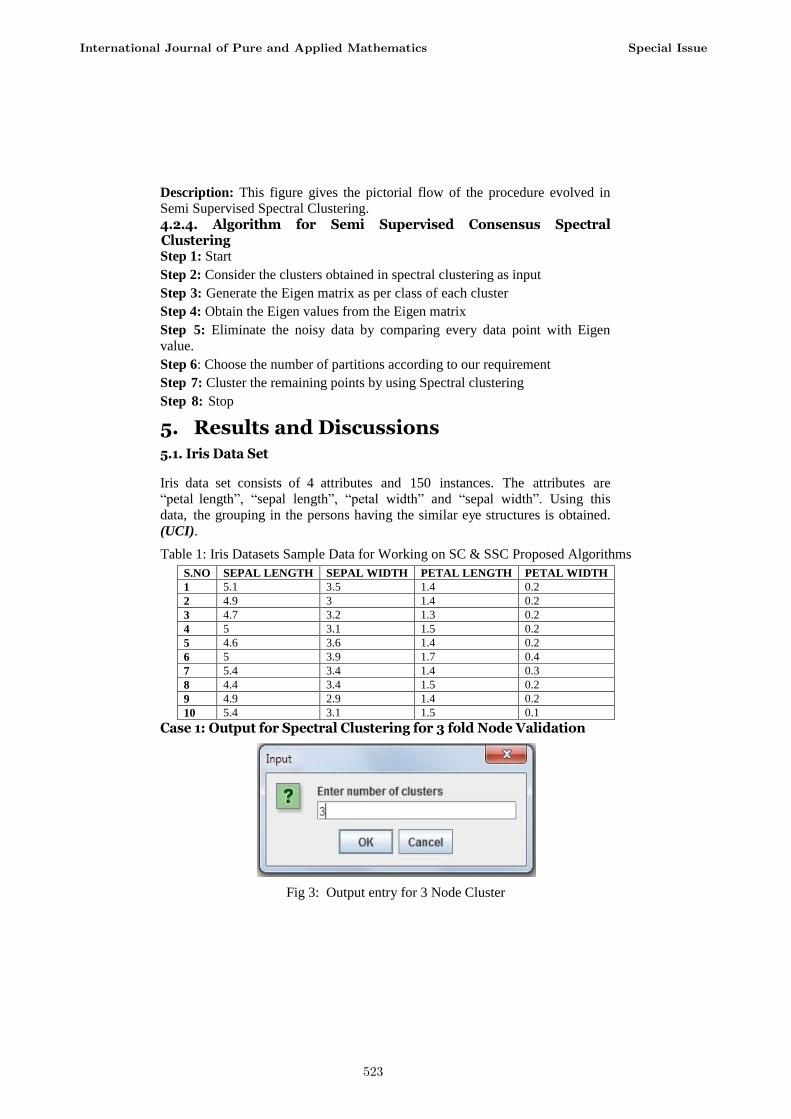
Case 1: Output for Spectral Clustering for 3 fold Node Validation
Fig 3: Output entry for 3 Node Cluster
International Journal of Pure and Applied Mathematics Special Issue
523
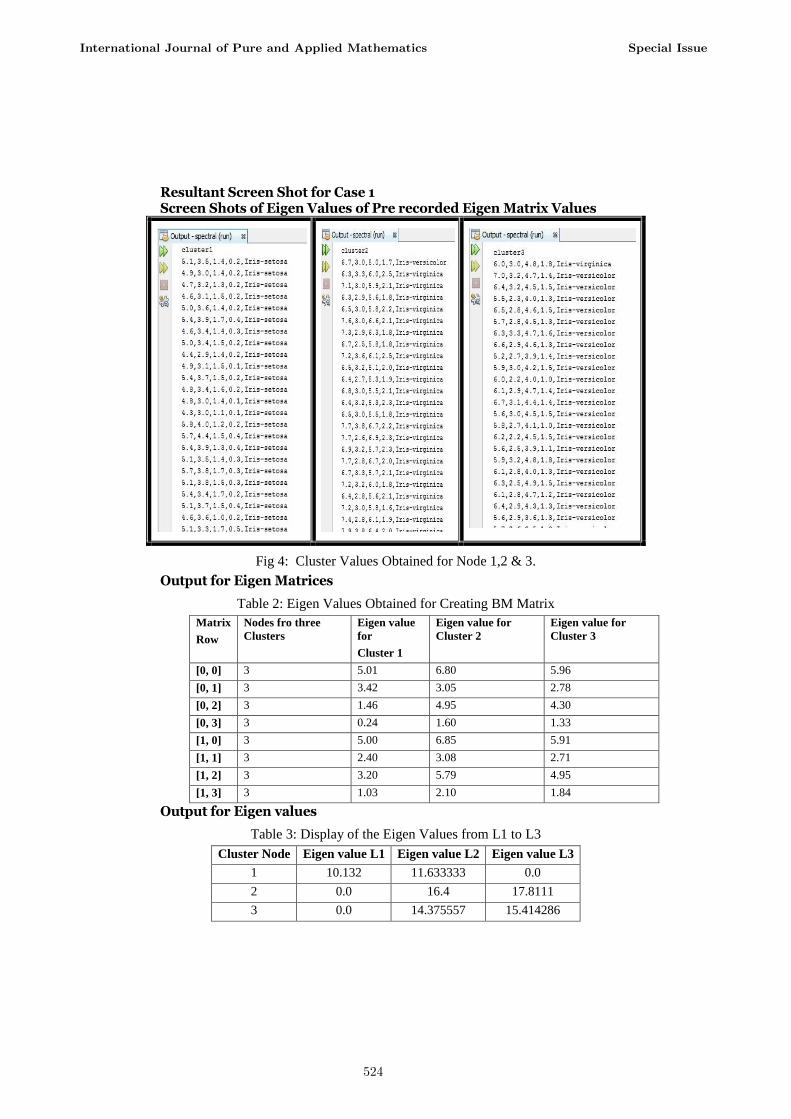
Resultant Screen Shot for Case 1 Screen Shots of Eigen Values of Pre recorded Eigen Matrix Values
Fig 4: Cluster Values Obtained for Node 1,2 & 3.
Output for Eigen Matrices
Table 2: Eigen Values Obtained for Creating BM Matrix
Matrix
Row
Nodes fro three
Clusters
Eigen value
for
Cluster 1
Eigen value for
Cluster 2
Eigen value for
Cluster 3
[0, 0] 3 5.01 6.80 5.96
[0, 1] 3 3.42 3.05 2.78
[0, 2] 3 1.46 4.95 4.30
[0, 3] 3 0.24 1.60 1.33
[1, 0] 3 5.00 6.85 5.91
[1, 1] 3 2.40 3.08 2.71
[1, 2] 3 3.20 5.79 4.95
[1, 3] 3 1.03 2.10 1.84
Output for Eigen values
Table 3: Display of the Eigen Values from L1 to L3
Cluster Node Eigen value L1 Eigen value L2 Eigen value L3
1 10.132 11.633333 0.0
2 0.0 16.4 17.8111
3 0.0 14.375557 15.414286
International Journal of Pure and Applied Mathematics Special Issue
524
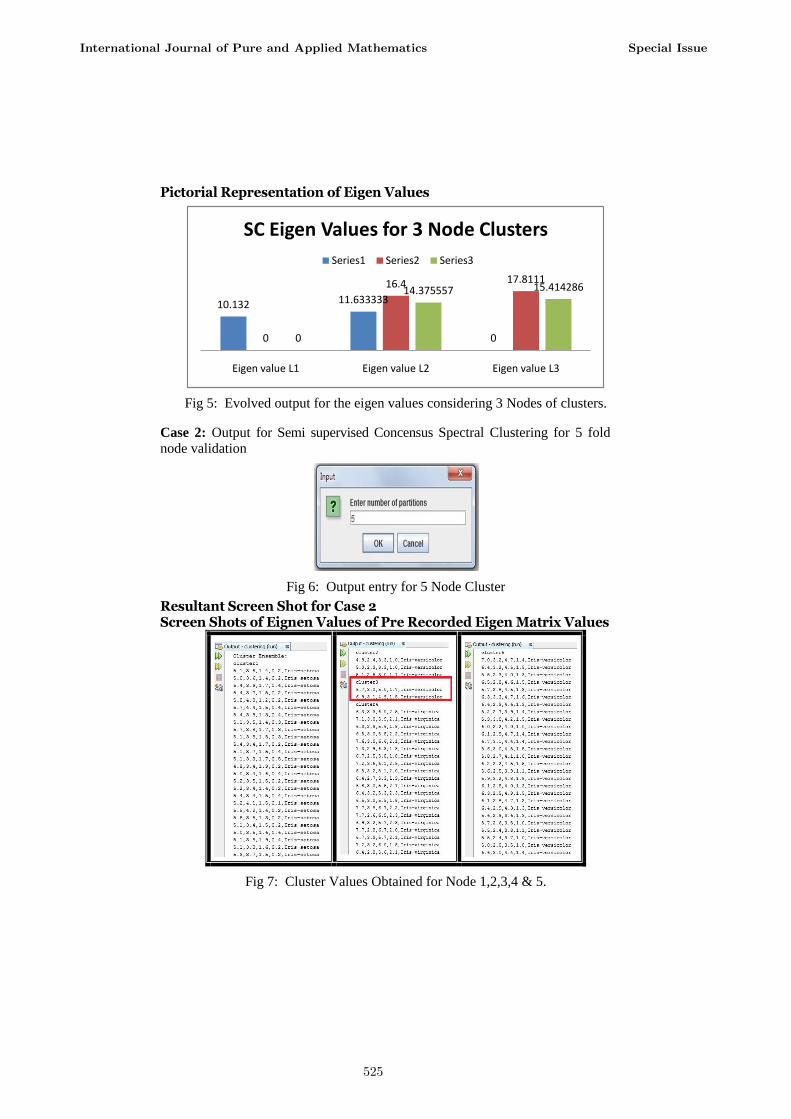
Pictorial Representation of Eigen Values
Fig 5: Evolved output for the eigen values considering 3 Nodes of clusters.
Case 2: Output for Semi supervised Concensus Spectral Clustering for 5 fold
node validation
Fig 6: Output entry for 5 Node Cluster
Resultant Screen Shot for Case 2 Screen Shots of Eignen Values of Pre Recorded Eigen Matrix Values
Fig 7: Cluster Values Obtained for Node 1,2,3,4 & 5.
10.132 11.633333
00
16.4 17.8111
0
14.375557 15.414286
Eigen value L1 Eigen value L2 Eigen value L3
SC Eigen Values for 3 Node Clusters
Series1 Series2 Series3
International Journal of Pure and Applied Mathematics Special Issue
525
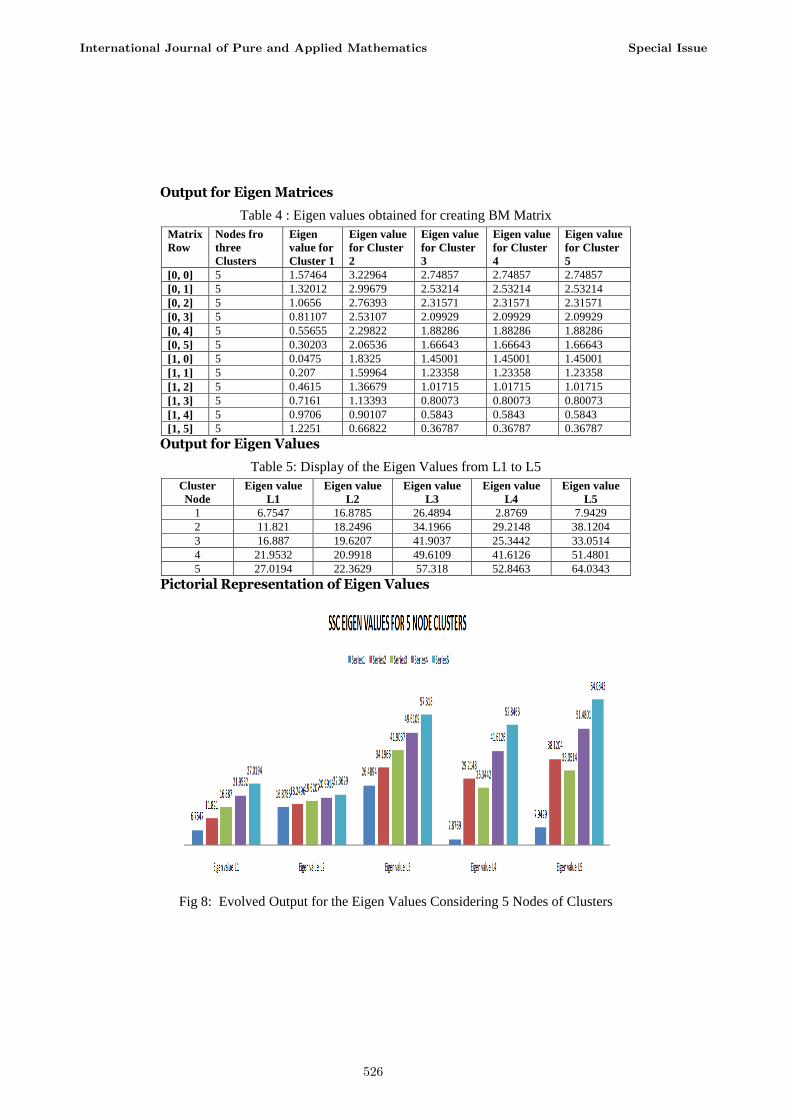
Output for Eigen Matrices
Table 4 : Eigen values obtained for creating BM Matrix
Matrix
Row
Nodes fro
three
Clusters
Eigen
value for
Cluster 1
Eigen value
for Cluster
2
Eigen value
for Cluster
3
Eigen value
for Cluster
4
Eigen value
for Cluster
5
[0, 0] 5 1.57464 3.22964 2.74857 2.74857 2.74857
[0, 1] 5 1.32012 2.99679 2.53214 2.53214 2.53214
[0, 2] 5 1.0656 2.76393 2.31571 2.31571 2.31571
[0, 3] 5 0.81107 2.53107 2.09929 2.09929 2.09929
[0, 4] 5 0.55655 2.29822 1.88286 1.88286 1.88286
[0, 5] 5 0.30203 2.06536 1.66643 1.66643 1.66643
[1, 0] 5 0.0475 1.8325 1.45001 1.45001 1.45001
[1, 1] 5 0.207 1.59964 1.23358 1.23358 1.23358
[1, 2] 5 0.4615 1.36679 1.01715 1.01715 1.01715
[1, 3] 5 0.7161 1.13393 0.80073 0.80073 0.80073
[1, 4] 5 0.9706 0.90107 0.5843 0.5843 0.5843
[1, 5] 5 1.2251 0.66822 0.36787 0.36787 0.36787
Output for Eigen Values
Table 5: Display of the Eigen Values from L1 to L5
Cluster
Node
Eigen value
L1
Eigen value
L2
Eigen value
L3
Eigen value
L4
Eigen value
L5
1 6.7547 16.8785 26.4894 2.8769 7.9429
2 11.821 18.2496 34.1966 29.2148 38.1204
3 16.887 19.6207 41.9037 25.3442 33.0514
4 21.9532 20.9918 49.6109 41.6126 51.4801
5 27.0194 22.3629 57.318 52.8463 64.0343
Pictorial Representation of Eigen Values
Fig 8: Evolved Output for the Eigen Values Considering 5 Nodes of Clusters
International Journal of Pure and Applied Mathematics Special Issue
526
6. Conclusion
This proposed semi-supervised consensus clustering method using prior
knowledge improved the performance of clustering in IRIS datasets. Consensus
clustering is able to reach the goal of maximizing intra-cluster similarity and
minimizing inter-cluster similarity. Also, using prior knowledge it is clearly
shown in the results section, i.e., it enhances the high consistency between data
partitioning and domain knowledge. The combination of this both significantly
improved the quality of clustering.
References
[1] Feng Luo, Richardson, TX, USA; KunTang, Khan L., Hierarchical clustering for complex data, (2005).
[2] Abdul Nazeer K.A., Sebastian M.P., Improving the Accuracy and Efficiency of the k-means Clustering Algorithm, Proceeding of the World Congress on Engineering 1 (2009).
[3] Kehar Singh, Dimple Malik, Naveen Sharma: Evolving limitations in K-means algorithm in data mining and their removal, (2011).
[4] Mu-Chun Su, Chien-Hsing Chou, A Modified version of k-means Algorithm with a Distance Based on Cluster Symmetry, IEEE Transactions On Pattern Analysis and Machine Intelligence 23(6) (2001).
[5] Prasad V., Comparative study of medical datasets IETD and UCITD using statistical methods, (2015).
[6] Prasad V., Siva Kumar R., Mamtha M., Plug in generator to produce variant outputs for unique data, Int J Res Eng Sci., 2(4) (2014), 1-7.
[7] Prasad Vadamodula T., Srinivasa Rao, PVGD Prasad Reddy, Improvised prophecy using regularization method of machine learning algorithms on medical data, Personalized Medicine Universe 5 (2016), 32-40.
[8] Prasad, Vadamodula, Thamada Srinivasa Rao, Ankit Kumar Surana, Standard cog exploration on medicinal data, International Journal of Computer Applications 119(10) (2015).
[9] Reza Ghaemi, Nasir Sulaiman, Hamidah Ibrahim, Norwati Mustapha: A Survey: Clustering Ensembles Techniques, World Academy of Science, Engineering and Technology, (2009).
[10] Sami A¨yra¨mo¨ Tommi Ka¨rkka¨inen: Introduction to partitioning based Clustering methods with a robust example, University of Jyv¨askyl¨a, 2006.
[11] Yunli wang, Youlian Pan, Semi-supervised consensus clustering for Gene expression data analysis, (2014).
International Journal of Pure and Applied Mathematics Special Issue
527
[12] Shi Na, Li Xumin, Guan Yong, Research on K-means clustering algorithm, Proc of Third International symposium on Intelligent Information Technology and Security Informatics, IEEE, (2010).
[13] Sunila Godara, Amita Verma: Analysis of Various Clustering Algorithms 3(1) (2013).
[14] Swift S., Tucker A., Vinciotti V., Martin N., Orengo C., Liu X., Kellam P: Consensus clustering and functional interpretation of gene expression data, Genome Biol., 5 (2004).
[15] Taoying Li, Yan Chen, Fuzzy Clustering Ensemble with Selection of Number of Clusters, Dalian Maritime University, (2010).
[16] Ulrike von Luxburg, Max Planck Institute for Biological Cybernetics Spemannstr, T¨ubingen, Germany: A Tutorial on Spectral Clustering Statistics and Computing 17 (4) (2007).
[17] https://archive.ics.uci.edu/ml/datasets/iris
International Journal of Pure and Applied Mathematics Special Issue
528

529

530


![Preparing a voxel-simulator of Alderson Rando physical phantom · 2012. 6. 26. · Alderson Rando [1] voxel simulator, which starts with the analysis of images which were produced](https://img.pdfslide.us/doc/110x75/611657e5f4d5a245dc0fc233/preparing-a-voxel-simulator-of-alderson-rando-physical-phantom-2012-6-26-alderson.jpg)


![[Henry Stark, John W. Woods] Probability and Rando(BookFi.org)](https://img.pdfslide.us/doc/110x75/55cf9a54550346d033a1420a/henry-stark-john-w-woods-probability-and-randobookfiorg.jpg)
![[Henry Stark, John W. Woods] Probability and Rando(BookZZ.org)](https://img.pdfslide.us/doc/110x75/55cf8de4550346703b8c5ebd/henry-stark-john-w-woods-probability-and-randobookzzorg.jpg)