Embed Size (px)
Citation preview
An ecosystem-based spatial conservation
plan for the South African sandy beaches
L. R. Harris
2012

An ecosystem-based spatial conservation plan
for the South African sandy beaches
By
Linda R. Harris
Submitted in fulfillment of the requirements for the degree of
Doctor of Philosophy to be awarded at the
Nelson Mandela Metropolitan University
December 2012
Promoter: Dr R. Nel
Co-Promoter: Dr D.S. Schoeman

CHAPTER 3
57
Spatial representation of sandy-beach biodiversity reveals surprising
patterns in richness and endemism
Abstract
Many nations have committed to conserving biodiversity as signatories to international treaties, such as
the Convention on Biological Diversity. Beyond this political obligation, however, are strong ecological,
social and economic imperatives for maintaining biodiversity, including sustained delivery of ecosystem
services that support basic human needs. While sandy beaches have comparatively low diversity, the
species that are present form a unique collection that delivers invaluable ecosystem services, all of
which warrants protection. While surrogates, such as bioregions or habitats, can serve as a good starting
point for site-prioritization for conservation, individual species distributions are better data inputs. The
aim of this paper is to quantify the spatial trends in species richness and endemism of the South African
sandy shore biota by creating a comprehensive digital map of the species' distributions. Existing spatial
information of coastal vegetation and focal vertebrate species (predominantly birds) was collated from
various sources, and two databases (one each for macrofauna and microflora) of all sites that have been
sampled in South Africa were compiled. The probabilistic distributions of all macrofauna (n = 30) and
microflora (n = 60) species present at more than 10 sampled locations along the South African coast
were modelled. Threshold probabilities were calculated, above which a species is predicted to be
present, and below which it is predicted to be absent. Model prediction accuracy was then evaluated
based on threshold-independent and threshold-dependent statistics. Models were also tested to
determine whether they could predict the species' distributions better than a random classifier. Almost
all models (89 %) performed very well, and the predicted species distributions were coded to a map of
the South African shoreline, and summed per 100-km strip of the coast. Overall, 536 species across all
taxa have been recorded on the South African sandy shores, although 140 "resident" species (including
those present at 10 or more locations) is probably a better estimate of the national beach biodiversity.
Diversity is greatest along the South African south coast, and endemism is highest along the west and
south coasts. Notably, two-thirds of the resident macrofauna are endemic species, half of which (n = 8)
are found only in one or two of the three South African coastal bioregions. Because these species also
have specific habitat preferences (beach morphodynamic types and across-shore zones), the amount of
habitat available to them is exceptionally limited. The concern is that the part of the shore that many of
these species require for survival, and that threatened vertebrates use to nest on, is the driftline and
supralittoral, which in turn is most vulnerable to transformation by coastal development and coastal
squeeze. The outputs of the modelling exercise also provide testable hypotheses with potential
applications including predicting range shifts under different scenarios of global change. Overall,
beaches contain a unique suite of species, a large proportion of which are endemic, that deserve greater
attention and conservation than they have been afforded to date.
Chapter 3
58
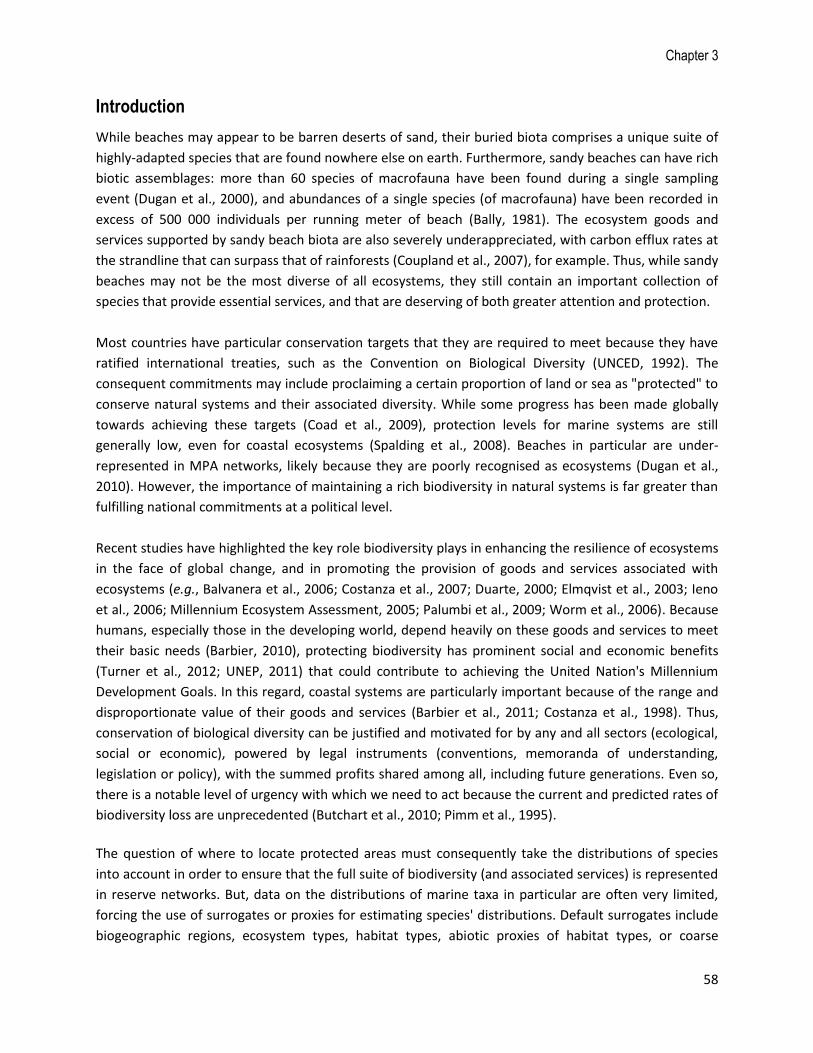
Introduction
While beaches may appear to be barren deserts of sand, their buried biota comprises a unique suite of
highly-adapted species that are found nowhere else on earth. Furthermore, sandy beaches can have rich
biotic assemblages: more than 60 species of macrofauna have been found during a single sampling
event (Dugan et al., 2000), and abundances of a single species (of macrofauna) have been recorded in
excess of 500 000 individuals per running meter of beach (Bally, 1981). The ecosystem goods and
services supported by sandy beach biota are also severely underappreciated, with carbon efflux rates at
the strandline that can surpass that of rainforests (Coupland et al., 2007), for example. Thus, while sandy
beaches may not be the most diverse of all ecosystems, they still contain an important collection of
species that provide essential services, and that are deserving of both greater attention and protection.
Most countries have particular conservation targets that they are required to meet because they have
ratified international treaties, such as the Convention on Biological Diversity (UNCED, 1992). The
consequent commitments may include proclaiming a certain proportion of land or sea as "protected" to
conserve natural systems and their associated diversity. While some progress has been made globally
towards achieving these targets (Coad et al., 2009), protection levels for marine systems are still
generally low, even for coastal ecosystems (Spalding et al., 2008). Beaches in particular are under-
represented in MPA networks, likely because they are poorly recognised as ecosystems (Dugan et al.,
2010). However, the importance of maintaining a rich biodiversity in natural systems is far greater than
fulfilling national commitments at a political level.
Recent studies have highlighted the key role biodiversity plays in enhancing the resilience of ecosystems
in the face of global change, and in promoting the provision of goods and services associated with
ecosystems (e.g., Balvanera et al., 2006; Costanza et al., 2007; Duarte, 2000; Elmqvist et al., 2003; Ieno
et al., 2006; Millennium Ecosystem Assessment, 2005; Palumbi et al., 2009; Worm et al., 2006). Because
humans, especially those in the developing world, depend heavily on these goods and services to meet
their basic needs (Barbier, 2010), protecting biodiversity has prominent social and economic benefits
(Turner et al., 2012; UNEP, 2011) that could contribute to achieving the United Nation's Millennium
Development Goals. In this regard, coastal systems are particularly important because of the range and
disproportionate value of their goods and services (Barbier et al., 2011; Costanza et al., 1998). Thus,
conservation of biological diversity can be justified and motivated for by any and all sectors (ecological,
social or economic), powered by legal instruments (conventions, memoranda of understanding,
legislation or policy), with the summed profits shared among all, including future generations. Even so,
there is a notable level of urgency with which we need to act because the current and predicted rates of
biodiversity loss are unprecedented (Butchart et al., 2010; Pimm et al., 1995).
The question of where to locate protected areas must consequently take the distributions of species
into account in order to ensure that the full suite of biodiversity (and associated services) is represented
in reserve networks. But, data on the distributions of marine taxa in particular are often very limited,
forcing the use of surrogates or proxies for estimating species' distributions. Default surrogates include
biogeographic regions, ecosystem types, habitat types, abiotic proxies of habitat types, or coarse
Sandy beach biodiversity
59
taxonomic groupings (e.g., Banks and Skilleter, 2002, 2007; Gladstone and Alexander, 2005; Pressey,
2004; Shokri and Gladstone, 2012). Representation accuracy certainly improves with finer-resolution
surrogates. For example, a taxon may not occur across the entire extent of a bioregion if it does not
occupy all habitats within the bioregion equally; similarly, patches of habitats may be of unequal quality,
and may not always contain the specific features required by a taxon to persist in a particular patch.
Thus, while using surrogates certainly has its merits, provides a good starting point for spatial planning
exercises (Pressey, 2004), and is widely practised, the ideal is certainly to know (at least with some
degree of certainty) and map the spatial distributions of individual species.
From a sandy beach perspective, our understanding of spatial biodiversity patterns is good, making the
selection of biodiversity surrogates a fairly easy task. Most of the beach ecological theory has been
based on observed patterns in macrofaunal biodiversity, and consequently, trends in macrofaunal
species richness, abundance and community composition with latitude (Defeo and McLachlan, 2005;
Dexter, 1992; McLachlan and Dorvlo, 2005), beach morphodynamic type (Defeo and McLachlan, 2005;
McLachlan and Dorvlo, 2005; and many others; McLachlan et al., 1993), and across the shore (i.e.,
zonation; Alves and Pezzuto, 2009; Dahl, 1952; McLachlan and Jaramillo, 1995; Salvat, 1964) is well
documented. In addition, the role of smaller-scale factors that can modify these patterns (often related
to temporal trends) has been highlighted. These factors include: nutrient availability (Ortega Cisneros et
al., 2011); salinity gradients (Barboza et al., 2012; Lercari and Defeo, 2006); presence of wrack (Dugan et
al., 2003); beach length (Brazeiro, 1999; Deidun and Schembri, 2008; Rodil et al., 2006; Short, 1996);
pulse disturbances (e.g., Harris et al., 2011b; Jaramillo et al., 1987; Jaramillo et al., 2012); and habitat
transformation from coastal urban development or shoreline armouring (Dugan et al., 2008), among
many others. Of the intertidal fauna, we know least about meiofauna and microbes, in spite of the
critical role these species play in ecosystem processes and services (e.g., Koop and Griffiths, 1982).
However, there are a few studies that have indicated no latitudinal trends in meiofaunal diversity
(Kotwicki et al., 2005), but distinct patterns among beach morphodynamic types, across the shore and
with depth (McLachlan and Brown, 2006; McLachlan et al., 1981). The vertebrates associated with
beaches tend to have much wider distributions, and many are migrant species. However, there is some
evidence that shorebird and coastal fish communities, for example, exhibit bioregional patterns (Hockey
et al., 1983; Turpie et al., 2000). For microflora, the information is similarly sparse, although studies have
shown that diatoms (broadly) can range from being cosmopolitan to narrow endemics (e.g., Mann and
Droop, 1996; Vanormelingen et al., 2008). While there are no studies to date (that I am aware of) that
evaluate the relationship between beach morphodynamics and surf-zone phytoplankton communities
specifically, surf-zone diatom accumulations occur only in wide surf zones with well-developed rip
currents, typical of dissipative or dissipative-intermediate beaches (Campbell and Bate, 1997). Thus, it
seems that in the absence of data describing individual species distributions, beach biodiversity can be
adequately represented (at least as a first step) by morphodynamic types, nested within bioregions.
Given these well-documented patterns, it is surprising that there have been so few attempts to
represent sandy beach diversity (either habitats or species) spatially. The South African sandy beach
biodiversity map, the focus of the present study, has come a long way in recent years. One of the first
national, spatial surveys of the coastline was by Tinley (1985) in his review of the coastal dunes in South

Chapter 3
60
Africa, with annotated maps and drawings indicating where certain dune and vegetation types occurred
along the shore. Sandy beaches specifically were initially represented in the 2004 National Spatial
Biodiversity Assessment (Lombard et al., 2004) as "sand". Significant progress was made for the
following National Biodiversity Assessment in 2011 (Driver et al., 2012; Sink et al., 2012), where beaches
were represented as morphodynamic types per bioregion, also distinguishing between estuarine
beaches and open-ocean beaches (Chapter 2; Harris et al., 2011a). While spatial planning could proceed
based on this map (sensu the arguments above), the nuances of sandy beach biodiversity patterns
would be missed in fine-scale analyses. The primary aim of this paper is therefore to quantify the spatial
trends in species richness and endemism of the South African sandy shore biota by creating a
comprehensive digital map of the species' distributions, which could also be used in spatial conservation
planning exercises (among many other applications). Specifically, the objectives are to compile existing
data on species distributions, to model the distributions of additional species, and to integrate the
information into a single map. While other countries have mapped sandy shore habitats along the
length of their national coastline (Short, 2006), this is the first time that beach biodiversity (biota) is
represented as a digital map of their respective probabilistic distributions.
Methodology
Study site
The South African shoreline extends about 3113 km along the southern edge of Africa, with 1204 km of
sandy beaches, and the remainder comprising predominantly rocky and mixed shores in near-equal
proportions (see Chapter 2 and Harris et al., 2011a for a more detailed description). At their seaward
margin, beaches are bounded by the warm Agulhas current along the east and south coasts (although
the current deflects offshore along the Agulhas banks, away from the shoreline along the south coast),
and the cool Benguela current up the west coast. The thermal differences between these two currents
divide the shoreline into three bioregions: the subtropical east coast; warm-temperate south coast; and
cold-temperate west coast, separated by two transition zones along the Wild Coast (former Transkei)
and between Cape Agulhas and Cape Point, respectively (Awad et al., 2002; Bustamante and Branch,
1996; Emanuel et al., 1992; Griffiths et al., 2010; Hockey et al., 1983; Kensley, 1981; McLachlan et al.,
1981; Procheş and Marshall, 2002; Stephenson and Stephenson, 1972; Teske et al., 2011; Turpie et al.,
2000)
In order to align with existing spatial products for the South African coast, the area coded to represent
sandy beaches matches the habitat (planning) units used in the South African National Biodiversity
Assessment 2011 (Driver et al., 2012; Sink et al., 2012). These habitat units span the coastal area, with a
seaward boundary at the 5-m isobath and a landward boundary 500 m inland from the approximate
midshore of the beach. These are divided alongshore by the habitat types mapped by Harris et al.
(2011a; Chapter 2), and split across-shore into a landward (beach and dune) and a seaward (surf zone)
portion of the littoral active zone at the approximate midshore. However, this latter delineation was
improved for this study, so that the habitat units were divided into surf zone (area between the 5-m
isobath and the low water mark), intertidal (low water mark to the driftline) and supratidal (drfitline to

Sandy beach biodiversity
61
500 m inland) components (see Appendix 2). Species distributions were evaluated by, and coded to
these refined habitat units.
Data collection and analysis
Vertebrates
Many of the vertebrates associated with sandy beaches are well studied, likely because they are large
and conspicuous (compared to the microscopic phytoplankton and fossorial micro- and macrofauna),
and thus relatively easy to study. Furthermore, these species attract much research focus because they
tend to be: top predators that play important roles in food webs and coastal fisheries; threatened,
endangered and/or migratory species that use beaches to support critical stages in their life histories;
and popular among the public, with strong participation in citizen science initiatives, particularly by bird-
watchers. Consequently, data on the distributions of vertebrates associated with sandy beaches already
exist, and maps representing these distributions were compiled from existing data sources. These
included maps of: shorebirds, based on observations of birds made within a 5'-grid of southern Africa
(Second Southern African Bird Atlas project (SABAP2), unpublished data, Animal Demography Unit,
University of Cape Town); the intertidal area occupied by breeding colonies of Cape fur seals (Kirkman et
al., 2012); and the beaches used by turtles for nesting (Nel et al., in review; Ezemvelo KwaZulu-Natal
Wildlife, unpublished data). These distributions were coded to the habitat units in ArcGIS 10 (ESRI).
Other vertebrates frequent sandy shores, including (among many others) monitor lizards, gerbils, honey
badgers and jackals, but there are currently insufficient data available to map their occurrences
nationally. Their omission here is (partly) justified because most of these species make opportunistic use
of sandy beaches rather than being facultative beach species.
Macrofauna
A database of results from all previously published macrofauna sampling on South African sandy shores
was compiled from peer-reviewed literature, contract reports, and student dissertations and theses;
unpublished data were also included where they were determined to be reliable (Table 3.1). To
supplement these data, geographic areas that were previously under-represented in the database were
identified, and beaches within these areas were sampled. The key criterion for selecting which beaches
to sample was representation of local beach types, targeting maximum diversity at each site (i.e.,
making an effort to sample towards the middle of the beach rather than at the terminal ends; see Donn,
1987; Schoeman and Richardson, 2002). In total, data from 163 previous sampling events were compiled
(from 112 sites - some beaches have been surveyed more than once), and supplemented with data from
23 beaches sampled specifically for this paper, giving a total of 135 sites (186 sampling events) sampled
for macrofauna in South Africa (Fig. 3.1, Table 3.1). In almost all cases the data have been collected
using the standard sampling methodology (Schlacher et al., 2008): three 10-m spaced shore-normal
transects spanning the intertidal zone at spring low tide, each transect with 10 equidistant across-shore
stations, from which 0.1 m2 of sediment was excavated to a depth of 25 - 30 cm, and sieved through a
1-mm mesh. Macrofauna were elutriated from the retained sediment in a small bucket half-filled with
sea water (by swirling the sea water to suspend the macrofauna, and pouring the water through a small
sieve thereby capturing the animals), preserved, and taken back to the laboratory for analysis. The

Chapter 3
62
sampling for this study used an identical approach to that described above. Where the sampling
methodology from previous studies deviated from the standard procedure (e.g., stratified random
sampling; or sampling four 0.025 m2 cores at each station rather than 1 x 0.1 m2 core), the total sample
area per site was similar (mean ± standard deviation of 3.3 m2 ± 0.6 m2 across the whole database). The
original descriptions of the species, records in the Annals of the South African Museum, taxonomic keys
and identification guides (chiefly: Branch et al., 2010; Day, 1967a, b; Griffiths, 1976; Kensley, 1978), and
the online databases: WoRMS (Appeltans et al., 2012), OBIS (IOC, 2012) and Catalogue of Life (Bisby et
al., 2012) were consulted to determine the distribution of each of the species to ascertain which species
are regional endemics (i.e., endemic to the southern African region comprising coastal Namibia, South
Africa and Mozambique), and which are South African bioregional endemics (i.e., endemic to one or two
of the three coastal bioregions around South Africa).
Figure 3.1. Map indicating the distribution of sampling sites (n = 135 sites and 186 sampling events, see Table 3.1 for details) for beach macrofauna from the database (white points) and from this study (black points). The broad shoreline type (sandy beach versus not sandy beach) is shown to provide an indication of the sampling coverage relative to the distribution of sandy beaches in South Africa. Major coastal urban nodes are labelled.
Sandy beach biodiversity
63
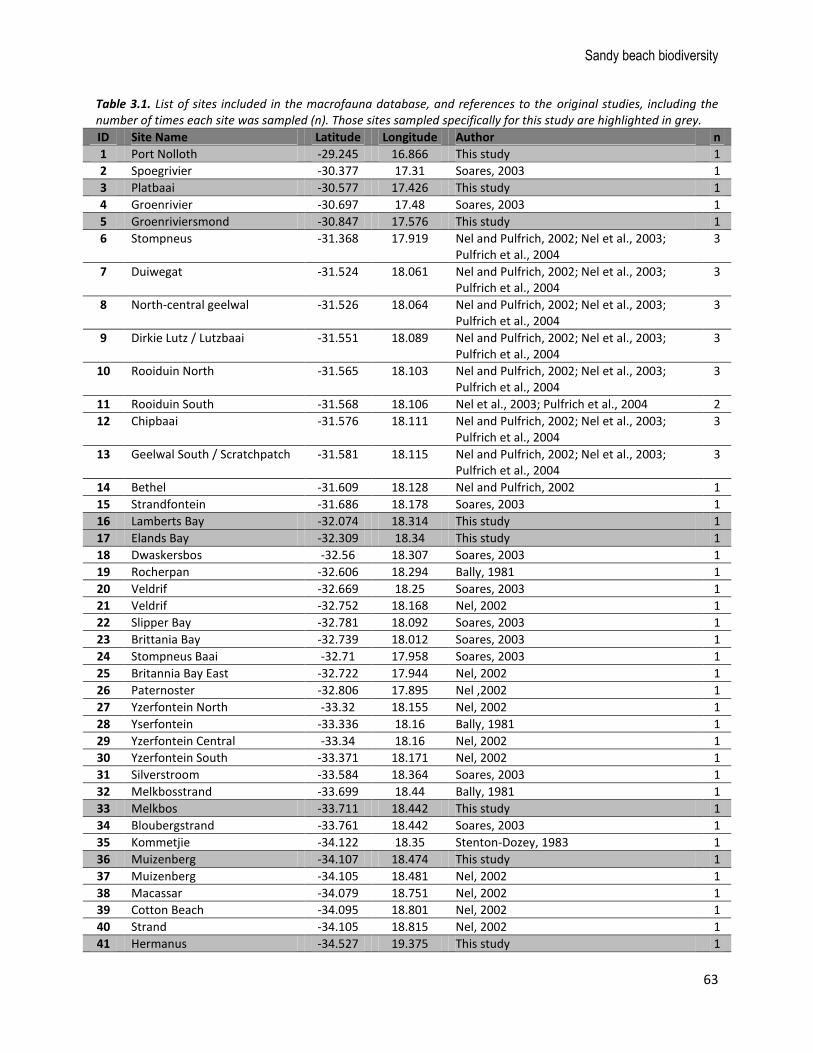
Table 3.1. List of sites included in the macrofauna database, and references to the original studies, including the number of times each site was sampled (n). Those sites sampled specifically for this study are highlighted in grey.
ID Site Name Latitude Longitude Author n
1 Port Nolloth -29.245 16.866 This study 1
2 Spoegrivier -30.377 17.31 Soares, 2003 1
3 Platbaai -30.577 17.426 This study 1
4 Groenrivier -30.697 17.48 Soares, 2003 1
5 Groenriviersmond -30.847 17.576 This study 1
6 Stompneus -31.368 17.919 Nel and Pulfrich, 2002; Nel et al., 2003; Pulfrich et al., 2004
3
7 Duiwegat -31.524 18.061 Nel and Pulfrich, 2002; Nel et al., 2003; Pulfrich et al., 2004
3
8 North-central geelwal -31.526 18.064 Nel and Pulfrich, 2002; Nel et al., 2003; Pulfrich et al., 2004
3
9 Dirkie Lutz / Lutzbaai -31.551 18.089 Nel and Pulfrich, 2002; Nel et al., 2003; Pulfrich et al., 2004
3
10 Rooiduin North -31.565 18.103 Nel and Pulfrich, 2002; Nel et al., 2003; Pulfrich et al., 2004
3
11 Rooiduin South -31.568 18.106 Nel et al., 2003; Pulfrich et al., 2004 2
12 Chipbaai -31.576 18.111 Nel and Pulfrich, 2002; Nel et al., 2003; Pulfrich et al., 2004
3
13 Geelwal South / Scratchpatch -31.581 18.115 Nel and Pulfrich, 2002; Nel et al., 2003; Pulfrich et al., 2004
3
14 Bethel -31.609 18.128 Nel and Pulfrich, 2002 1
15 Strandfontein -31.686 18.178 Soares, 2003 1
16 Lamberts Bay -32.074 18.314 This study 1
17 Elands Bay -32.309 18.34 This study 1
18 Dwaskersbos -32.56 18.307 Soares, 2003 1
19 Rocherpan -32.606 18.294 Bally, 1981 1
20 Veldrif -32.669 18.25 Soares, 2003 1
21 Veldrif -32.752 18.168 Nel, 2002 1
22 Slipper Bay -32.781 18.092 Soares, 2003 1
23 Brittania Bay -32.739 18.012 Soares, 2003 1
24 Stompneus Baai -32.71 17.958 Soares, 2003 1
25 Britannia Bay East -32.722 17.944 Nel, 2002 1
26 Paternoster -32.806 17.895 Nel ,2002 1
27 Yzerfontein North -33.32 18.155 Nel, 2002 1
28 Yserfontein -33.336 18.16 Bally, 1981 1
29 Yzerfontein Central -33.34 18.16 Nel, 2002 1
30 Yzerfontein South -33.371 18.171 Nel, 2002 1
31 Silverstroom -33.584 18.364 Soares, 2003 1
32 Melkbosstrand -33.699 18.44 Bally, 1981 1
33 Melkbos -33.711 18.442 This study 1
34 Bloubergstrand -33.761 18.442 Soares, 2003 1
35 Kommetjie -34.122 18.35 Stenton-Dozey, 1983 1
36 Muizenberg -34.107 18.474 This study 1
37 Muizenberg -34.105 18.481 Nel, 2002 1
38 Macassar -34.079 18.751 Nel, 2002 1
39 Cotton Beach -34.095 18.801 Nel, 2002 1
40 Strand -34.105 18.815 Nel, 2002 1
41 Hermanus -34.527 19.375 This study 1

Chapter 3
64
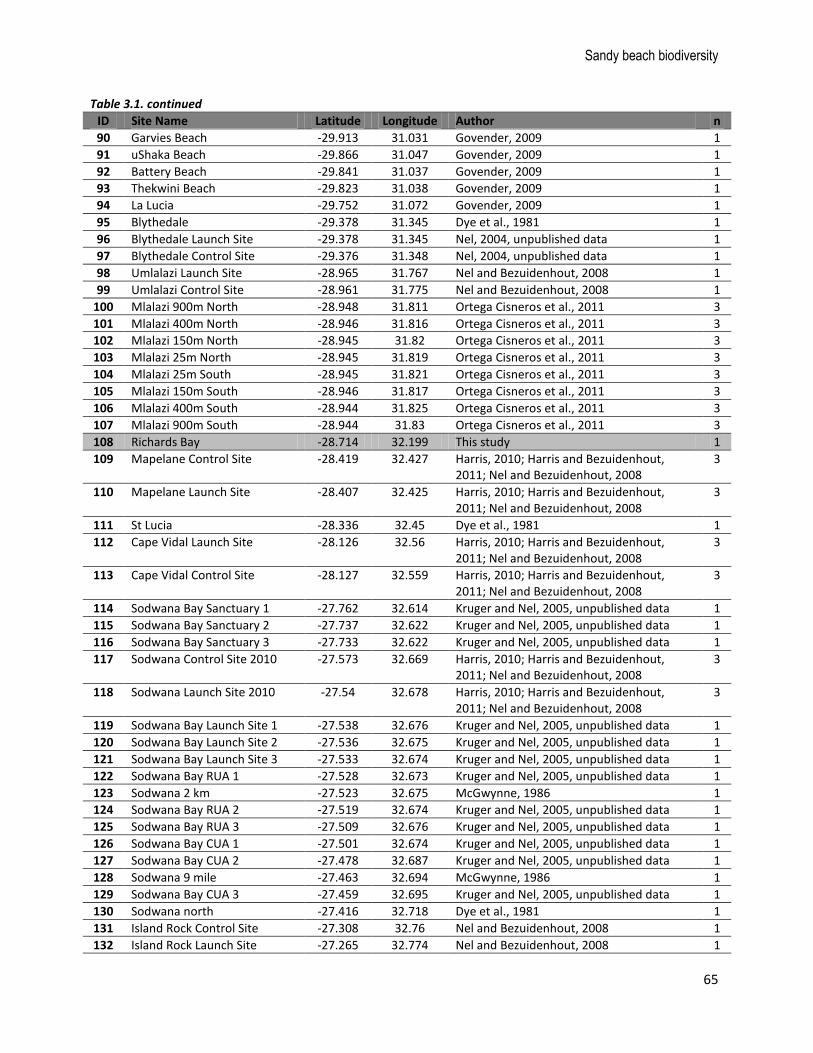
Table 3.1. continued
ID Site Name Latitude Longitude Author n
42 Struis -34.696 20.167 McLachlan et al., 1981 1
43 De Hoop -34.484 20.495 This study 1
44 Still Bay -34.371 21.438 McLachlan et al., 1981 1
45 Mossel Bay -34.161 22.111 This study 1
46 Sedgefield 1 -34.033 22.8 Hutchings and Clark, 2010 1
47 Sedgefield 2 -34.035 22.803 Hutchings and Clark, 2010 1
48 Sedgefield 3 -34.035 22.804 Hutchings and Clark, 2010 1
49 Sedgefield 4 -34.037 22.809 Hutchings and Clark, 2010 1
50 Wilderness -34.048 22.843 McLachlan et al., 1981 1
51 Plettenberg Bay 1 -34.098 23.376 Wooldridge, 1988 1
52 Plettenberg Bay 2 -34.095 23.374 Wooldridge, 1988 1
53 Plettenberg Bay 3 -34.086 23.371 Wooldridge, 1988 1
54 Plettenberg Bay 4 -34.073 23.374 Wooldridge, 1988 1
55 East of Keurbooms River -34.017 23.417 Wooldridge, 1988 1
56 Keurboomstrand -34.038 23.387 McLachlan et al., 1981 1
57 Huisklip -34.13 24.431 This study 1
58 Oyster Bay -34.174 24.652 This study 1
59 Jeffreys Bay -34.055 24.925 This study 1
60 Van Staadens -33.966 25.186 Nel, 2002 1
61 Maitlands -33.982 25.27 Nel, 2002 1
62 Sardinia Bay 1 -34.034 25.492 Harris et al., 2011b 5
63 Sardinia Bay 2 -34.035 25.502 Harris et al., 2011b 5
64 Kings Beach -33.973 25.647 Nel, 2002 1
65 Sundays -33.714 25.9 Nel, 2002 1
66 Sundays 1 -33.709 25.962 Wendt and McLachlan, 1985 1
67 Sundays 2 -33.706 26.07 Wendt and McLachlan, 1985 1
68 Sundays 3 -33.719 26.153 Wendt and McLachlan, 1985 1
69 Boknes -33.726 26.588 This study 1
70 Port Alfred -33.581 26.937 This study 1
71 Marie's Cottage -33.411 27.281 This study 1
72 Gulu Beach -33.167 27.668 Wooldridge et al., 1981 1
73 Orient Beach -33.025 27.916 McLachlan, 1984 1
74 Eastern Beach -33.008 27.927 McLachlan, 1984 1
75 Point Beach -32.999 27.946 McLachlan, 1984 1
76 Nahoon Beach -32.988 27.951 McLachlan, 1984 1
77 Quinera Beach -32.974 27.968 McLachlan, 1984 1
78 Wavecrest -32.578 28.535 Nel, 2007, unpublished data 1
79 Cebe Beach -32.518 28.59 Wooldridge et al., 1981 1
80 Hole in the Wall -32.03 29.116 This study 1
81 Mpande Beach -31.76 29.357 Wooldridge et al., 1981 1
82 Port St Johns -31.623 29.556 This study 1
83 Msikhaba -31.323 29.966 This study 1
84 Thompson's Beach -31.092 30.18 Wooldridge et al., 1981 1
85 Trafalgar -30.951 30.301 Harris, 2008 1
86 Southbroom -30.908 30.335 Harris, 2008 1
87 Port Shepstone -30.731 30.463 Harris, 2008 1
88 Kelso -30.418 30.675 Dye et al., 1981 1
89 Amanzimtoti -30.075 30.874 This study 1
Sandy beach biodiversity
65
Table 3.1. continued
ID Site Name Latitude Longitude Author n
90 Garvies Beach -29.913 31.031 Govender, 2009 1
91 uShaka Beach -29.866 31.047 Govender, 2009 1
92 Battery Beach -29.841 31.037 Govender, 2009 1
93 Thekwini Beach -29.823 31.038 Govender, 2009 1
94 La Lucia -29.752 31.072 Govender, 2009 1
95 Blythedale -29.378 31.345 Dye et al., 1981 1
96 Blythedale Launch Site -29.378 31.345 Nel, 2004, unpublished data 1
97 Blythedale Control Site -29.376 31.348 Nel, 2004, unpublished data 1
98 Umlalazi Launch Site -28.965 31.767 Nel and Bezuidenhout, 2008 1
99 Umlalazi Control Site -28.961 31.775 Nel and Bezuidenhout, 2008 1
100 Mlalazi 900m North -28.948 31.811 Ortega Cisneros et al., 2011 3
101 Mlalazi 400m North -28.946 31.816 Ortega Cisneros et al., 2011 3
102 Mlalazi 150m North -28.945 31.82 Ortega Cisneros et al., 2011 3
103 Mlalazi 25m North -28.945 31.819 Ortega Cisneros et al., 2011 3
104 Mlalazi 25m South -28.945 31.821 Ortega Cisneros et al., 2011 3
105 Mlalazi 150m South -28.946 31.817 Ortega Cisneros et al., 2011 3
106 Mlalazi 400m South -28.944 31.825 Ortega Cisneros et al., 2011 3
107 Mlalazi 900m South -28.944 31.83 Ortega Cisneros et al., 2011 3
108 Richards Bay -28.714 32.199 This study 1
109 Mapelane Control Site -28.419 32.427 Harris, 2010; Harris and Bezuidenhout, 2011; Nel and Bezuidenhout, 2008
3
110 Mapelane Launch Site -28.407 32.425 Harris, 2010; Harris and Bezuidenhout, 2011; Nel and Bezuidenhout, 2008
3
111 St Lucia -28.336 32.45 Dye et al., 1981 1
112 Cape Vidal Launch Site -28.126 32.56 Harris, 2010; Harris and Bezuidenhout, 2011; Nel and Bezuidenhout, 2008
3
113 Cape Vidal Control Site -28.127 32.559 Harris, 2010; Harris and Bezuidenhout, 2011; Nel and Bezuidenhout, 2008
3
114 Sodwana Bay Sanctuary 1 -27.762 32.614 Kruger and Nel, 2005, unpublished data 1
115 Sodwana Bay Sanctuary 2 -27.737 32.622 Kruger and Nel, 2005, unpublished data 1
116 Sodwana Bay Sanctuary 3 -27.733 32.622 Kruger and Nel, 2005, unpublished data 1
117 Sodwana Control Site 2010 -27.573 32.669 Harris, 2010; Harris and Bezuidenhout, 2011; Nel and Bezuidenhout, 2008
3
118 Sodwana Launch Site 2010 -27.54 32.678 Harris, 2010; Harris and Bezuidenhout, 2011; Nel and Bezuidenhout, 2008
3
119 Sodwana Bay Launch Site 1 -27.538 32.676 Kruger and Nel, 2005, unpublished data 1
120 Sodwana Bay Launch Site 2 -27.536 32.675 Kruger and Nel, 2005, unpublished data 1
121 Sodwana Bay Launch Site 3 -27.533 32.674 Kruger and Nel, 2005, unpublished data 1
122 Sodwana Bay RUA 1 -27.528 32.673 Kruger and Nel, 2005, unpublished data 1
123 Sodwana 2 km -27.523 32.675 McGwynne, 1986 1
124 Sodwana Bay RUA 2 -27.519 32.674 Kruger and Nel, 2005, unpublished data 1
125 Sodwana Bay RUA 3 -27.509 32.676 Kruger and Nel, 2005, unpublished data 1
126 Sodwana Bay CUA 1 -27.501 32.674 Kruger and Nel, 2005, unpublished data 1
127 Sodwana Bay CUA 2 -27.478 32.687 Kruger and Nel, 2005, unpublished data 1
128 Sodwana 9 mile -27.463 32.694 McGwynne, 1986 1
129 Sodwana Bay CUA 3 -27.459 32.695 Kruger and Nel, 2005, unpublished data 1
130 Sodwana north -27.416 32.718 Dye et al., 1981 1
131 Island Rock Control Site -27.308 32.76 Nel and Bezuidenhout, 2008 1
132 Island Rock Launch Site -27.265 32.774 Nel and Bezuidenhout, 2008 1

Chapter 3
66
Table 3.1. continued
ID Site Name Latitude Longitude Author n
133 Rocktail Bay -27.176 32.807 This study 1
134 Bhanga Nek -26.993 32.868 McGwynne, 1986 1
135 Bhanga Nek -26.992 32.868 This study 1
Species-accumulation curves were constructed in R 2.15.0 (R Development Core Team, 2012) using the
specaccum function (random method) from the vegan package (Oksanen et al., 2012) to confirm
whether or not there has been sufficient sampling to represent the full suite of sandy beach macrofauna
in South Africa. Because the data were compiled from a range of sources (Table 3.1), not all
identifications have been made to species level, with a variety of specimens recorded only to a coarse
taxonomic resolution. Note here that the term "morphospecies" is used to refer to a group of animals
that look the same as one another, but sufficiently different from other taxa to be judged as being
different a species, even if the formal scientific name was not assigned to the group. Polychaetes and
insects in particular have been poorly identified by many researchers, most likely because of limited
taxonomic expertise (by beach ecologists) in these groups, time constraints, and because specific
community composition was not the focus of their studies (as opposed to more general metrics such as
species richness). Consequently, species-accumulation curves were compared for the full dataset of
morphospecies, and for a subset of specimens where formal identifications had been made to species
level.
Species recorded on 10 or more beaches in South Africa were then subjected to species distribution
modelling. However, Eurydice longicornis and Eurydice kensleyi were excluded from this analysis
because of the taxonomic confusion in this genus, which is currently under revision (M. Hawkins, pers.
comm.). Although a number of potential methods were considered for constructing the distribution
models (see Elith and Leathwick, 2009 for a comprehensive review), the programme MaxEnt (Elith et al.,
2011; Phillips et al., 2006; Phillips and Dudík, 2008; Phillips et al., 2004) was selected, for several
reasons. First, studies have shown that the current beach sampling design (described above) captures
only about 70 % of species present per site (Schoeman et al., 2003). Thus, failure to record a species at a
site does not imply its absence. Second, sandy beach communities can be dynamic (e.g., Albuquerque et
al., 2007; Harris et al., 2011b; Jaramillo et al., 1987; Jaramillo et al., 1996; Ortega Cisneros et al., 2011),
and failure to detect a species in one sampling event, again, does not imply its absence. Therefore, one
strength of using MaxEnt for the current analysis is that it requires presence-only data. Finally, the
sample sizes (number of presence localities per species) in this study were relatively small, and MaxEnt
is relatively insensitive to small sample sizes (where n = 10 - 30; Wisz et al., 2008).
The environmental data that served as potential predictors of macrofaunal distributions included the
continuous variables: sea-surface temperature (decadal average of mean monthly temperatures as a
continuous measure of biogeography; see Acker and Leptoukh, 2007; NASA GES DISC, 2012), and
chlorophyll-a (decadal average of mean monthly chlorophyll-a as a measure of productivity; Acker and
Leptoukh, 2007; NASA GES DISC, 2012), and the categorical variables: beach morphodynamic type
(sensu Harris et al., 2011a; Chapter 2) and bioregion (as an ordinal measure of biogeography, sensu Sink
et al., 2012). Note that the five-bioregion scheme used here is a finer-scale representation of the three-
Sandy beach biodiversity
67
bioregion scheme, with the Namaqua and Southwestern-Cape bioregions being nested within the cold-
temperate bioregion, the warm-temperate bioregion being equivalent to the Agulhas bioregion, and the
Natal and Delagoa bioregions being nested within the subtropical bioregion. While sandy beach
communities appear to match the three-bioregion scheme (as described above), some species may
reflect subsets of the five-bioregion scheme. The sea-surface temperature and chlorophyll-a data were
converted from point shapefiles (in a 4-km grid) into raster surfaces using the krig function in ArcGIS 10
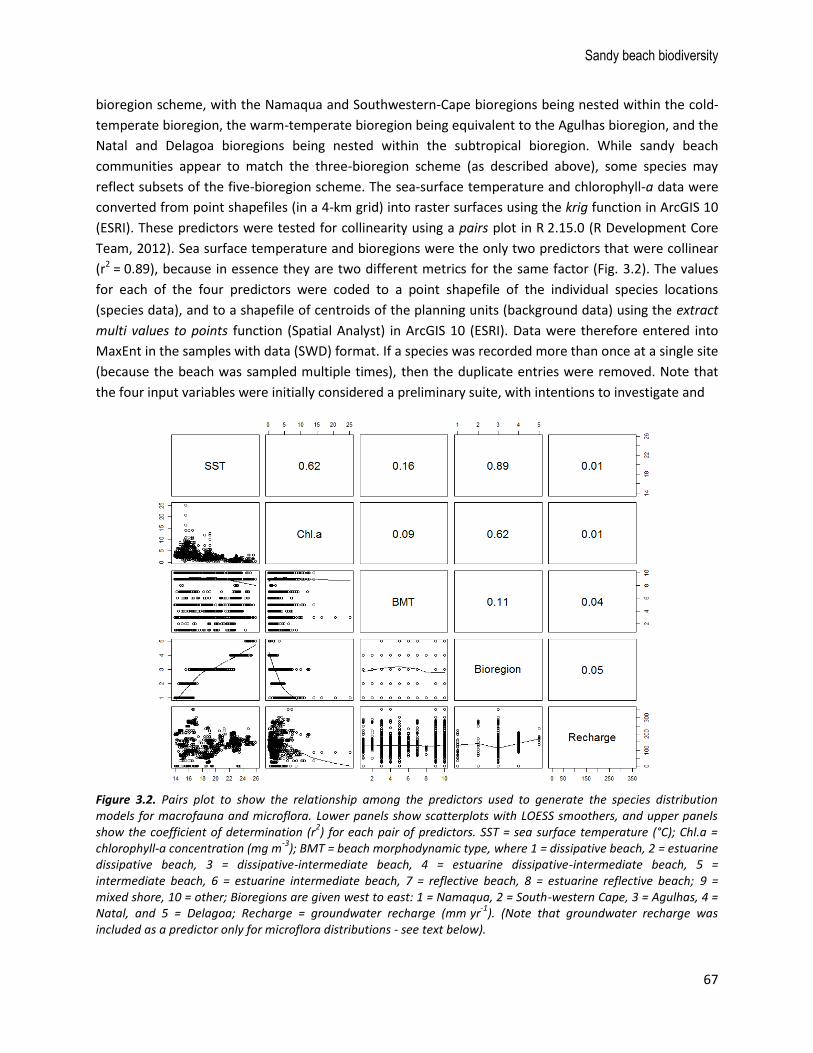
(ESRI). These predictors were tested for collinearity using a pairs plot in R 2.15.0 (R Development Core
Team, 2012). Sea surface temperature and bioregions were the only two predictors that were collinear
(r2 = 0.89), because in essence they are two different metrics for the same factor (Fig. 3.2). The values
for each of the four predictors were coded to a point shapefile of the individual species locations
(species data), and to a shapefile of centroids of the planning units (background data) using the extract
multi values to points function (Spatial Analyst) in ArcGIS 10 (ESRI). Data were therefore entered into
MaxEnt in the samples with data (SWD) format. If a species was recorded more than once at a single site
(because the beach was sampled multiple times), then the duplicate entries were removed. Note that
the four input variables were initially considered a preliminary suite, with intentions to investigate and
Figure 3.2. Pairs plot to show the relationship among the predictors used to generate the species distribution models for macrofauna and microflora. Lower panels show scatterplots with LOESS smoothers, and upper panels show the coefficient of determination (r
2) for each pair of predictors. SST = sea surface temperature (°C); Chl.a =
chlorophyll-a concentration (mg m-3
); BMT = beach morphodynamic type, where 1 = dissipative beach, 2 = estuarine dissipative beach, 3 = dissipative-intermediate beach, 4 = estuarine dissipative-intermediate beach, 5 = intermediate beach, 6 = estuarine intermediate beach, 7 = reflective beach, 8 = estuarine reflective beach; 9 = mixed shore, 10 = other; Bioregions are given west to east: 1 = Namaqua, 2 = South-western Cape, 3 = Agulhas, 4 = Natal, and 5 = Delagoa; Recharge = groundwater recharge (mm yr
-1). (Note that groundwater recharge was
included as a predictor only for microflora distributions - see text below).

Chapter 3
68
add other variables after testing the methodology. However, the models performed so well (see results
below) that it was considered unnecessary to include additional predictors.
The species distribution models were run in MaxEnt version 3.3.3k (Phillips et al., 2006; Phillips and
Dudík, 2008; Phillips et al., 2004), with data randomly partitioned into a 75 % training set, and a 25 %
testing set. Using a subset of the primary dataset for testing model performance has been criticised
previously, often on the basis of spatial autocorrelation violating the assumption of independence
among cases (Fielding and Bell, 1997). Collecting an independent data set, either in space or time, for
model testing is therefore recommended (Fielding and Bell, 1997). But, because the data in the current
study were sampled at a reasonably coarse resolution, and because the samples were collected over a
30-year period, it is assumed that randomly partitioning the data into model training and model testing
subsets is appropriate and will not violate the assumptions of independence. The models were run so
that the sample and background predictions were created as output files that could be subjected to
statistical evaluation of model performance in R 2.15.0 (R Development Core Team, 2012).
Models were evaluated using the R packages ROCR (Sing et al., 2005; Sing et al., 2009) and boot (Canty
and Ripley, 2012; Davison and Hinkley, 1997) to plot receiver operating characteristic (ROC) curves:
model sensitivity (true positive rate) versus model specificity (false positive rate), calculate the area
under the curve (AUC), and bootstrap the latter to give an estimate of the standard error (following
Phillips, 2006). These analyses were repeated using the model training and testing data separately (see
Phillips et al., 2006 for an explanation of constructing ROC curves with presence-only data). While the
AUC statistic has proven to be a robust measure of model performance, partly because it is independent
of both thresholds and species prevalence (Fielding and Bell, 1997; Manel et al., 2001; McPherson et al.,
2004), Allouche et al. (2006) point out that in cases where distribution models are reduced to a binary,
presence-absence output (for use in conservation planning exercises, for example), it is preferable to
evaluate the models using a threshold-dependent method. Selecting a threshold in itself is a complex
decision because it can influence the outputs of reserve-selection procedures (Wilson et al., 2005).
Ultimately, threshold selection depends on the research objectives that, in turn, will require a trade-off
between risk and efficiency of the reserve network (Wilson et al., 2005). A posteriori threshold selection
is a more risk-averse approach because it ensures that only probabilistically suitable habitat patches are
included as occupied habitat, and thus as candidate areas to conserve a species during reserve-site
selection (Wilson et al., 2005). In the present study, there is no motivation to select any one of the many
potential thresholds over the others. Therefore, 11 of the 12 thresholds (excluding the a priori default
threshold of 0.5) were determined using the optimal.thresholds function in the PresenceAbsence
package (Freeman, 2012; Freeman and Moisen, 2008) in R 2.15.0 (R Development Core Team, 2012).
From these results, the median threshold value was calculated. This value was used to construct a
confusion matrix, from which the threshold-dependent statistics: model sensitivity; model specificity;
Cohen's kappa statistic (Cohen, 1960); and the true skill statistic (TSS; Allouche et al., 2006) were
calculated, as per the equations in Allouche et al. (2006). Since these latter analyses require presence-
absence data, a dataset was created, comprising the presence data and n pseudo-absence records,
where n = the number of presence localities for each respective species. The latter data were generated
by randomly selecting uninhabitable (for beach biota) rocky shore sites as pseudo-absence locations.
Sandy beach biodiversity
69
Finally, a one-tailed binomial test was performed to determine if the model predicted the test data
significantly better than random (following Phillips, 2006).
Once model performance was evaluated and accuracy was verified, the models were reconstructed
using all of the data (Rencher, 1995). This was because some of the sample sizes were fairly small (as
few as n = 10) and using all the data in the training set would generate the most robust species
distribution models (Fielding and Bell, 1997). The outputs generated in MaxEnt for these latter models
were coded back into the habitat units in ArcGIS 10 (ESRI) for display, and further analysis (see
Integration of beach biodiversity layers below, and Appendix 2). Species presence was assigned in a
binary fashion: present or absent if the probability of occurrence was respectively greater or less than
the optimum threshold probability that was calculated, per species, during model evaluation.
Microflora
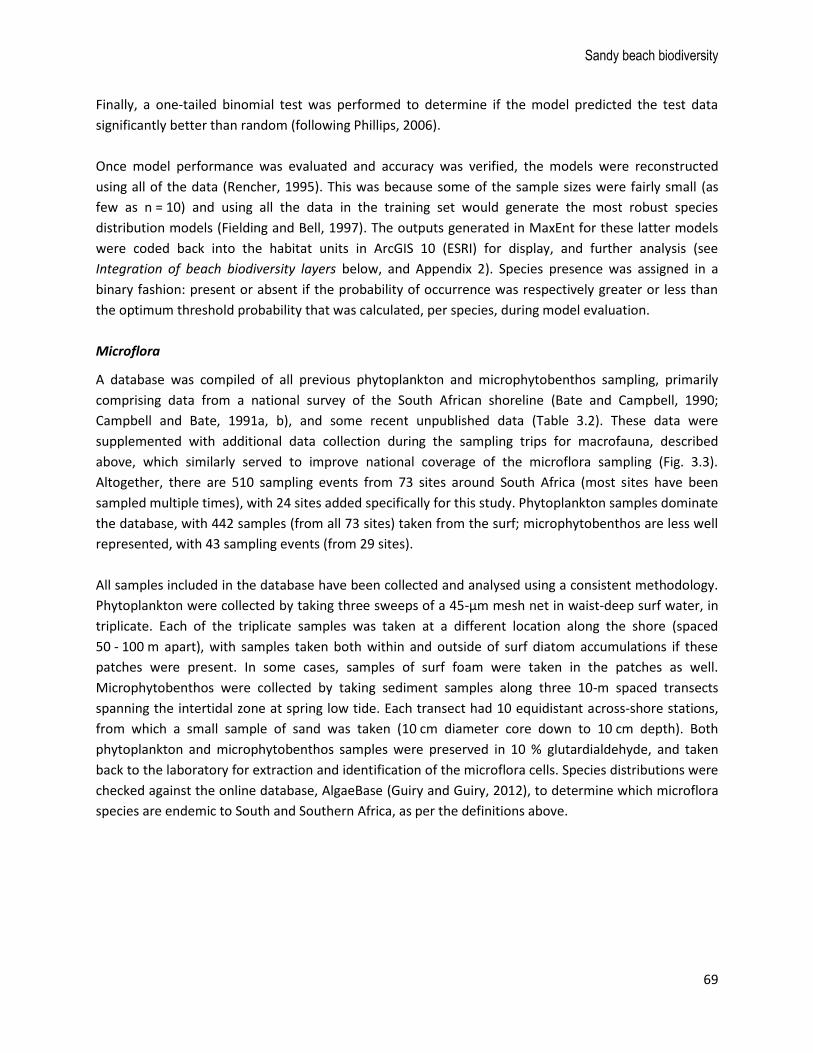
A database was compiled of all previous phytoplankton and microphytobenthos sampling, primarily
comprising data from a national survey of the South African shoreline (Bate and Campbell, 1990;
Campbell and Bate, 1991a, b), and some recent unpublished data (Table 3.2). These data were
supplemented with additional data collection during the sampling trips for macrofauna, described
above, which similarly served to improve national coverage of the microflora sampling (Fig. 3.3).
Altogether, there are 510 sampling events from 73 sites around South Africa (most sites have been
sampled multiple times), with 24 sites added specifically for this study. Phytoplankton samples dominate
the database, with 442 samples (from all 73 sites) taken from the surf; microphytobenthos are less well
represented, with 43 sampling events (from 29 sites).
All samples included in the database have been collected and analysed using a consistent methodology.
Phytoplankton were collected by taking three sweeps of a 45-μm mesh net in waist-deep surf water, in
triplicate. Each of the triplicate samples was taken at a different location along the shore (spaced
50 - 100 m apart), with samples taken both within and outside of surf diatom accumulations if these
patches were present. In some cases, samples of surf foam were taken in the patches as well.
Microphytobenthos were collected by taking sediment samples along three 10-m spaced transects
spanning the intertidal zone at spring low tide. Each transect had 10 equidistant across-shore stations,
from which a small sample of sand was taken (10 cm diameter core down to 10 cm depth). Both
phytoplankton and microphytobenthos samples were preserved in 10 % glutardialdehyde, and taken
back to the laboratory for extraction and identification of the microflora cells. Species distributions were
checked against the online database, AlgaeBase (Guiry and Guiry, 2012), to determine which microflora
species are endemic to South and Southern Africa, as per the definitions above.
Chapter 3
70
Figure 3.3. Map indicating the distribution of sampling sites (n = 73 sites and 510 samples, see Table 3.2 for details) for beach microflora. Black points represent sites where both phytoplankton and microphytobenthos samples have been taken, and white points represent sites where only phytoplankton samples have been taken. The broad shoreline type (sandy beach versus not sandy beach) is shown to provide an indication of the sampling coverage relative to the distribution of sandy beaches in South Africa. Major coastal urban nodes are labelled.
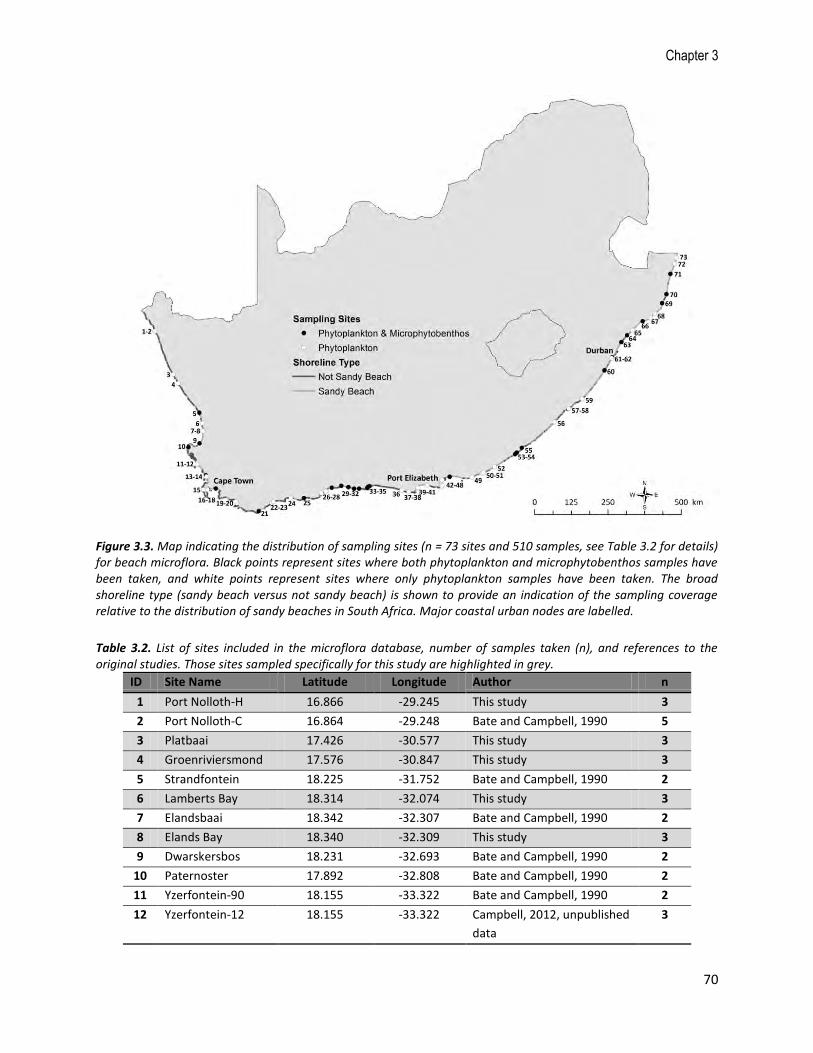
Table 3.2. List of sites included in the microflora database, number of samples taken (n), and references to the original studies. Those sites sampled specifically for this study are highlighted in grey.
ID Site Name Latitude Longitude Author n
1 Port Nolloth-H 16.866 -29.245 This study 3
2 Port Nolloth-C 16.864 -29.248 Bate and Campbell, 1990 5
3 Platbaai 17.426 -30.577 This study 3
4 Groenriviersmond 17.576 -30.847 This study 3
5 Strandfontein 18.225 -31.752 Bate and Campbell, 1990 2
6 Lamberts Bay 18.314 -32.074 This study 3
7 Elandsbaai 18.342 -32.307 Bate and Campbell, 1990 2
8 Elands Bay 18.340 -32.309 This study 3
9 Dwarskersbos 18.231 -32.693 Bate and Campbell, 1990 2
10 Paternoster 17.892 -32.808 Bate and Campbell, 1990 2
11 Yzerfontein-90 18.155 -33.322 Bate and Campbell, 1990 2
12 Yzerfontein-12 18.155 -33.322 Campbell, 2012, unpublished
data
3
Sandy beach biodiversity
71
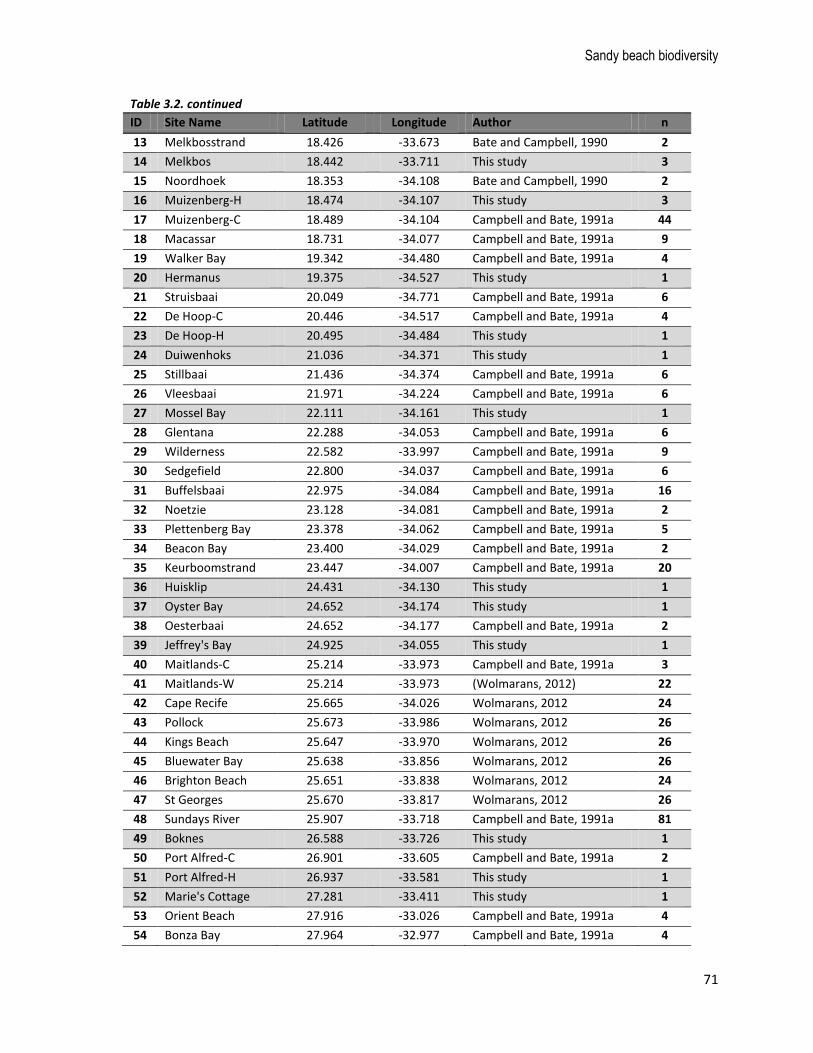
Table 3.2. continued
ID Site Name Latitude Longitude Author n
13 Melkbosstrand 18.426 -33.673 Bate and Campbell, 1990 2
14 Melkbos 18.442 -33.711 This study 3
15 Noordhoek 18.353 -34.108 Bate and Campbell, 1990 2
16 Muizenberg-H 18.474 -34.107 This study 3
17 Muizenberg-C 18.489 -34.104 Campbell and Bate, 1991a 44
18 Macassar 18.731 -34.077 Campbell and Bate, 1991a 9
19 Walker Bay 19.342 -34.480 Campbell and Bate, 1991a 4
20 Hermanus 19.375 -34.527 This study 1
21 Struisbaai 20.049 -34.771 Campbell and Bate, 1991a 6
22 De Hoop-C 20.446 -34.517 Campbell and Bate, 1991a 4
23 De Hoop-H 20.495 -34.484 This study 1
24 Duiwenhoks 21.036 -34.371 This study 1
25 Stillbaai 21.436 -34.374 Campbell and Bate, 1991a 6
26 Vleesbaai 21.971 -34.224 Campbell and Bate, 1991a 6
27 Mossel Bay 22.111 -34.161 This study 1
28 Glentana 22.288 -34.053 Campbell and Bate, 1991a 6
29 Wilderness 22.582 -33.997 Campbell and Bate, 1991a 9
30 Sedgefield 22.800 -34.037 Campbell and Bate, 1991a 6
31 Buffelsbaai 22.975 -34.084 Campbell and Bate, 1991a 16
32 Noetzie 23.128 -34.081 Campbell and Bate, 1991a 2
33 Plettenberg Bay 23.378 -34.062 Campbell and Bate, 1991a 5
34 Beacon Bay 23.400 -34.029 Campbell and Bate, 1991a 2
35 Keurboomstrand 23.447 -34.007 Campbell and Bate, 1991a 20
36 Huisklip 24.431 -34.130 This study 1
37 Oyster Bay 24.652 -34.174 This study 1
38 Oesterbaai 24.652 -34.177 Campbell and Bate, 1991a 2
39 Jeffrey's Bay 24.925 -34.055 This study 1
40 Maitlands-C 25.214 -33.973 Campbell and Bate, 1991a 3
41 Maitlands-W 25.214 -33.973 (Wolmarans, 2012) 22
42 Cape Recife 25.665 -34.026 Wolmarans, 2012 24
43 Pollock 25.673 -33.986 Wolmarans, 2012 26
44 Kings Beach 25.647 -33.970 Wolmarans, 2012 26
45 Bluewater Bay 25.638 -33.856 Wolmarans, 2012 26
46 Brighton Beach 25.651 -33.838 Wolmarans, 2012 24
47 St Georges 25.670 -33.817 Wolmarans, 2012 26
48 Sundays River 25.907 -33.718 Campbell and Bate, 1991a 81
49 Boknes 26.588 -33.726 This study 1
50 Port Alfred-C 26.901 -33.605 Campbell and Bate, 1991a 2
51 Port Alfred-H 26.937 -33.581 This study 1
52 Marie's Cottage 27.281 -33.411 This study 1
53 Orient Beach 27.916 -33.026 Campbell and Bate, 1991a 4
54 Bonza Bay 27.964 -32.977 Campbell and Bate, 1991a 4
Chapter 3
72
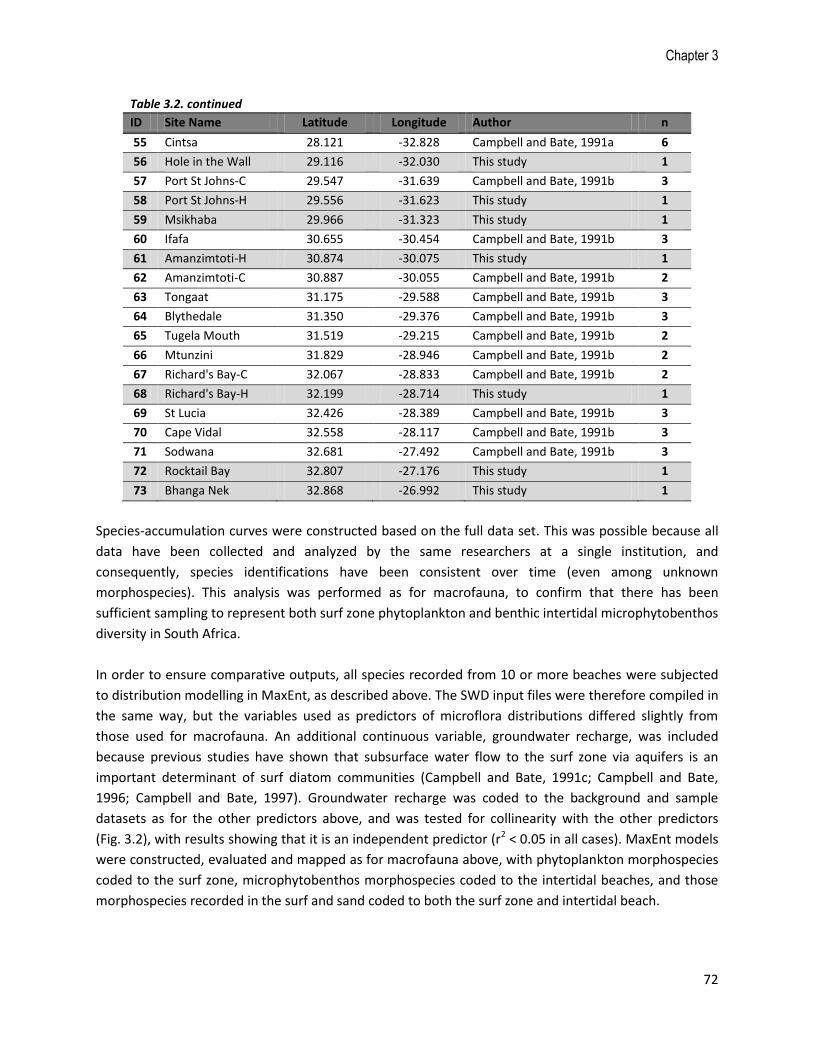
Table 3.2. continued
ID Site Name Latitude Longitude Author n
55 Cintsa 28.121 -32.828 Campbell and Bate, 1991a 6
56 Hole in the Wall 29.116 -32.030 This study 1
57 Port St Johns-C 29.547 -31.639 Campbell and Bate, 1991b 3
58 Port St Johns-H 29.556 -31.623 This study 1
59 Msikhaba 29.966 -31.323 This study 1
60 Ifafa 30.655 -30.454 Campbell and Bate, 1991b 3
61 Amanzimtoti-H 30.874 -30.075 This study 1
62 Amanzimtoti-C 30.887 -30.055 Campbell and Bate, 1991b 2
63 Tongaat 31.175 -29.588 Campbell and Bate, 1991b 3
64 Blythedale 31.350 -29.376 Campbell and Bate, 1991b 3
65 Tugela Mouth 31.519 -29.215 Campbell and Bate, 1991b 2
66 Mtunzini 31.829 -28.946 Campbell and Bate, 1991b 2
67 Richard's Bay-C 32.067 -28.833 Campbell and Bate, 1991b 2
68 Richard's Bay-H 32.199 -28.714 This study 1
69 St Lucia 32.426 -28.389 Campbell and Bate, 1991b 3
70 Cape Vidal 32.558 -28.117 Campbell and Bate, 1991b 3
71 Sodwana 32.681 -27.492 Campbell and Bate, 1991b 3
72 Rocktail Bay 32.807 -27.176 This study 1
73 Bhanga Nek 32.868 -26.992 This study 1
Species-accumulation curves were constructed based on the full data set. This was possible because all
data have been collected and analyzed by the same researchers at a single institution, and
consequently, species identifications have been consistent over time (even among unknown
morphospecies). This analysis was performed as for macrofauna, to confirm that there has been
sufficient sampling to represent both surf zone phytoplankton and benthic intertidal microphytobenthos
diversity in South Africa.
In order to ensure comparative outputs, all species recorded from 10 or more beaches were subjected
to distribution modelling in MaxEnt, as described above. The SWD input files were therefore compiled in
the same way, but the variables used as predictors of microflora distributions differed slightly from
those used for macrofauna. An additional continuous variable, groundwater recharge, was included
because previous studies have shown that subsurface water flow to the surf zone via aquifers is an
important determinant of surf diatom communities (Campbell and Bate, 1991c; Campbell and Bate,
1996; Campbell and Bate, 1997). Groundwater recharge was coded to the background and sample
datasets as for the other predictors above, and was tested for collinearity with the other predictors
(Fig. 3.2), with results showing that it is an independent predictor (r2 < 0.05 in all cases). MaxEnt models
were constructed, evaluated and mapped as for macrofauna above, with phytoplankton morphospecies
coded to the surf zone, microphytobenthos morphospecies coded to the intertidal beaches, and those
morphospecies recorded in the surf and sand coded to both the surf zone and intertidal beach.
Sandy beach biodiversity
73
Coastal/dune vegetation
A recently-created map of vegetation types (including coastal dune vegetation) is available for South
Africa (Mucina and Rutherford, 2006). However, the resolution along the shoreline was too coarse for
the purposes of the fine-scale analysis in the present study, and simply using the vegetation type
categories would not meet the objective of mapping individual species distributions. Furthermore,
including species comprising coastal dune thicket or forests would not be representative of sandy beach
biodiversity proper. Consequently, polygons representing primary dunes and hummocks (defined as
areas of sand backing the beach that are only partly vegetated) were created as a shapefile in ArcGIS 10
(ESRI). Mapping was digitized based on a series of georeferenced images that were exported from
Google Earth 2012 using the Shape2Earth plugin for the open-source programme MapWindow GIS
(available at: http://shape2earth.com/shp2e.aspx). Coastal dune plants that are considered pioneer
species occurring in Zone I, the strand plant zone (sensu Tinley, 1985), were coded to the primary dune
polygons as far alongshore as their known individual extent of occurrence (from Fig. 14.17 in Mucina et
al., 2006, p. 674).
Integration of beach biodiversity layers
In order to compare results in this study specifically with those recorded for South(ern) African intertidal
algae (Bolton and Stegenga, 2002), marine invertebrates (Awad et al., 2002; Emanuel et al., 1992),
coastal fish (Turpie et al., 2000), and all currently-known coastal and marine taxa (Griffiths et al., 2010;
Scott et al., 2012), the species richness and endemism data were coded into 100-km long segments of
shoreline. These sections were constructed from the co-ordinates tabulated in Bolton and Stegenga
(2002), summing the 50-km long segments into 100-km long portions because the latter gave better
representation of the national trends in beach diversity.
Results
Vertebrates
There are 21 species of birds in South Africa that have a direct link to sandy beaches, either for feeding,
roosting or nesting (Table 3.3). Ten of these are resident, three are endemic, and one (the African
Penguin, Spheniscus demersus) is endangered (BirdLife International, 2012). Overall, avian species
richness is highest in the south-western Cape region (from Elands Bay to Cape Agulhas), with up to 17
species per habitat unit (Fig. 3.4b). Diversity generally tapers off to the north and east, with a few "hot
spots" along the south coast that relate mainly to the sandy portions of the log spiral bays. The most
notable of these are St Francis Bay and Algoa Bay, with as many as 19 species represented in the latter.
Diversity is also reasonably high along the wild coast, at Durban Bay, and along the Mtunzini dunefield
up the east coast, with up to 14 - 15 species recorded per 5'-grid cell in each of these three areas.
Other vertebrates that nest on sandy beaches in South Africa include two species of sea turtles:
loggerheads (Caretta caretta) and leatherbacks (Dermochelys coriacea) that are endangered and
critically endangered, respectively (IUCN, 2012). Every summer, females of both species haul out onto
the beaches along the north-east coast to lay their eggs in well-concealed sandy nests above the high
Chapter 3
74
water mark. While neither species is endemic to South Africa, the populations of both species nest only
in northern KwaZulu-Natal and southern Mozambique and are genetically isolated from other
populations of their respective species (Wallace et al., 2010). Thus to some extent, these two species
could be considered endemics at a population level.
Cape fur seals (Arctocephalus pusillus pusillus) haul out on the opposite (west) coast for resting, mating
and pupping (see Kirkman, 2010). Their use of sandy beaches is fairly limited, though, with apparent
preferences for the rocky shores and islands in the area. Cape fur seals are present along the South
African west coast, Namibia and southern Angola (Kirkman, 2010) and are therefore included here as a
southern African endemic species.
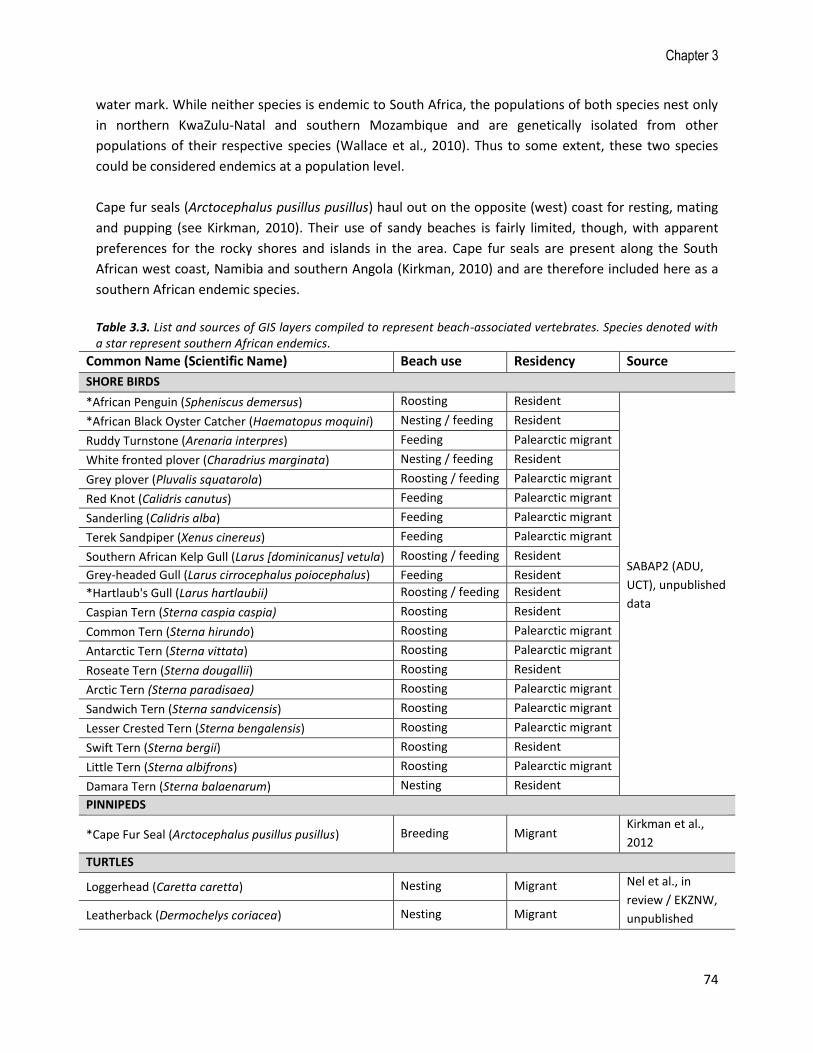
Table 3.3. List and sources of GIS layers compiled to represent beach-associated vertebrates. Species denoted with a star represent southern African endemics.
Common Name (Scientific Name) Beach use Residency Source
SHORE BIRDS
*African Penguin (Spheniscus demersus) Roosting Resident
SABAP2 (ADU,
UCT), unpublished
data
*African Black Oyster Catcher (Haematopus moquini) Nesting / feeding Resident
Ruddy Turnstone (Arenaria interpres) Feeding Palearctic migrant
White fronted plover (Charadrius marginata) Nesting / feeding Resident
Grey plover (Pluvalis squatarola) Roosting / feeding Palearctic migrant
Red Knot (Calidris canutus) Feeding Palearctic migrant
Sanderling (Calidris alba) Feeding Palearctic migrant
Terek Sandpiper (Xenus cinereus) Feeding Palearctic migrant
Southern African Kelp Gull (Larus [dominicanus] vetula) Roosting / feeding Resident
Grey-headed Gull (Larus cirrocephalus poiocephalus) Feeding Resident
*Hartlaub's Gull (Larus hartlaubii) Roosting / feeding Resident
Caspian Tern (Sterna caspia caspia) Roosting Resident
Common Tern (Sterna hirundo) Roosting Palearctic migrant
Antarctic Tern (Sterna vittata) Roosting Palearctic migrant
Roseate Tern (Sterna dougallii) Roosting Resident
Arctic Tern (Sterna paradisaea) Roosting Palearctic migrant
Sandwich Tern (Sterna sandvicensis) Roosting Palearctic migrant
Lesser Crested Tern (Sterna bengalensis) Roosting Palearctic migrant
Swift Tern (Sterna bergii) Roosting Resident
Little Tern (Sterna albifrons) Roosting Palearctic migrant
Damara Tern (Sterna balaenarum) Nesting Resident
PINNIPEDS
*Cape Fur Seal (Arctocephalus pusillus pusillus) Breeding Migrant Kirkman et al.,
2012
TURTLES
Loggerhead (Caretta caretta) Nesting Migrant Nel et al., in
review / EKZNW,
unpublished Leatherback (Dermochelys coriacea) Nesting Migrant

Sandy beach biodiversity
75
Figure 3.4. Summarized results indicating the alongshore trends in sandy beach species richness and endemism in (a) 100-km sections of the South African coast, for the (b) vertebrates, (c) "resident" macrofauna, (d) "resident" microflora , (e) foredune pioneer plants, and (f) all taxa combined. Light grey represents cosmopolitan species; intermediate grey, southern African endemics; and dark grey, South African endemics, as per the definitions in the text above.
0
5
10
15
20
25
1 3 5 7 9 11 13 15 17 19 21 23 25 27 29
Nu
mb
er
of
spe
cie
s
Distance (x100 km) along the shore (W-E)
0
5
10
15
20
25
1 3 5 7 9 11 13 15 17 19 21 23 25 27 29
Nu
mb
er
of
spe
cie
s
Distance (x100 km) along the shore (W-E)
0
10
20
30
40
50
60
1 3 5 7 9 11 13 15 17 19 21 23 25 27 29
Nu
mb
er
of
spe
cie
s
Distance (x100 km) along the shore (W-E)
0
5
10
15
20
1 3 5 7 9 11 13 15 17 19 21 23 25 27 29
Nu
mb
er
of
spe
cie
s
Distance (x100 km) along the shore (W-E)
0
20
40
60
80
100
120
1 3 5 7 9 11 13 15 17 19 21 23 25 27 29
Nu
mb
er
of
spe
cie
s
Distance (x100 km) along the shore (W-E)
b. Vertebrates c. Macrofauna
d. Microflora e. Foredune plants
f. All sandy beach taxa
a.
Cosmopolitan species
Southern African endemics
South African endemics
Chapter 3
76
Macrofauna
A total of 199 morphospecies of macrofauna have been recorded on the South African sandy shores,
although half of these (n = 102) are singletons (present only once) or doubletons (present only twice). Of
these 199 morphospecies, 110 have been fully identified to species level. Even still, half of these fully-
identified species (n = 56) have been recorded as singletons or doubletons, and only 31 species
(excluding Eurydice longicornis and Eurydice kensleyi) have been recorded from 10 or more sampling
events; 30 species from 10 or more beaches. However, had the numerous morphospecies been properly
identified, this latter number of "resident" sandy beach macrofauna would likely be higher.
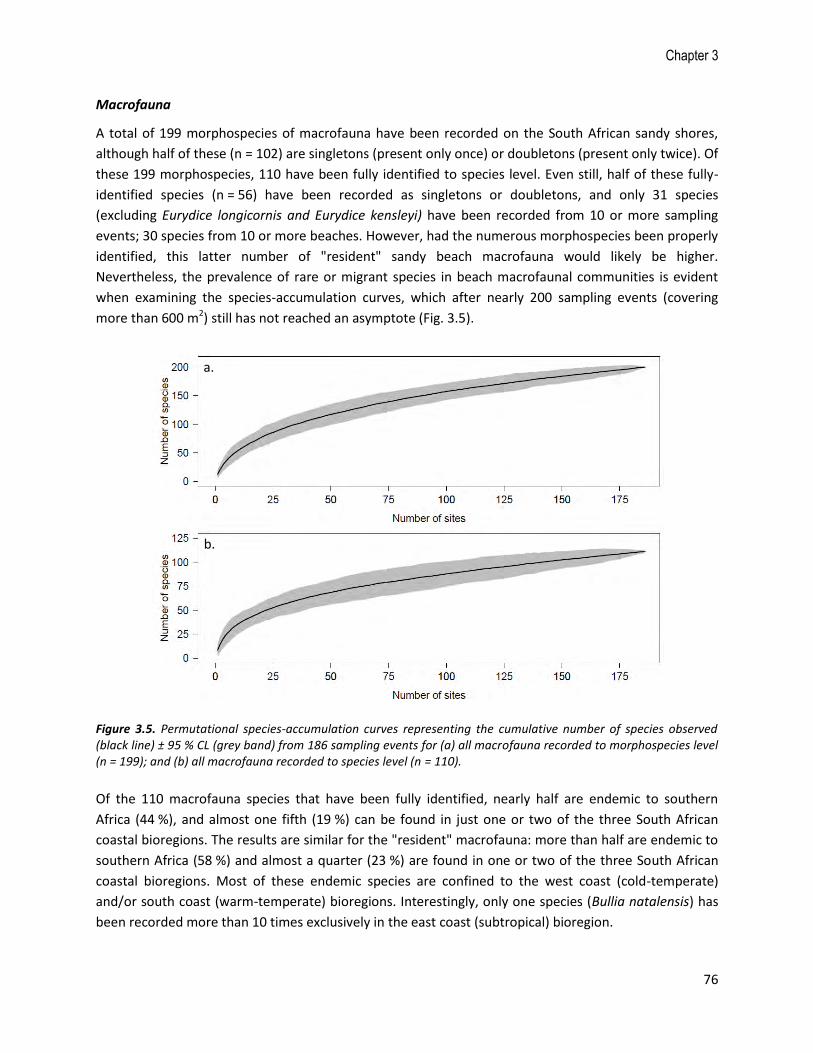
Nevertheless, the prevalence of rare or migrant species in beach macrofaunal communities is evident
when examining the species-accumulation curves, which after nearly 200 sampling events (covering
more than 600 m2) still has not reached an asymptote (Fig. 3.5).
Figure 3.5. Permutational species-accumulation curves representing the cumulative number of species observed (black line) ± 95 % CL (grey band) from 186 sampling events for (a) all macrofauna recorded to morphospecies level (n = 199); and (b) all macrofauna recorded to species level (n = 110).
Of the 110 macrofauna species that have been fully identified, nearly half are endemic to southern
Africa (44 %), and almost one fifth (19 %) can be found in just one or two of the three South African
coastal bioregions. The results are similar for the "resident" macrofauna: more than half are endemic to
southern Africa (58 %) and almost a quarter (23 %) are found in one or two of the three South African
coastal bioregions. Most of these endemic species are confined to the west coast (cold-temperate)
and/or south coast (warm-temperate) bioregions. Interestingly, only one species (Bullia natalensis) has
been recorded more than 10 times exclusively in the east coast (subtropical) bioregion.
a.
b.
Sandy beach biodiversity
77
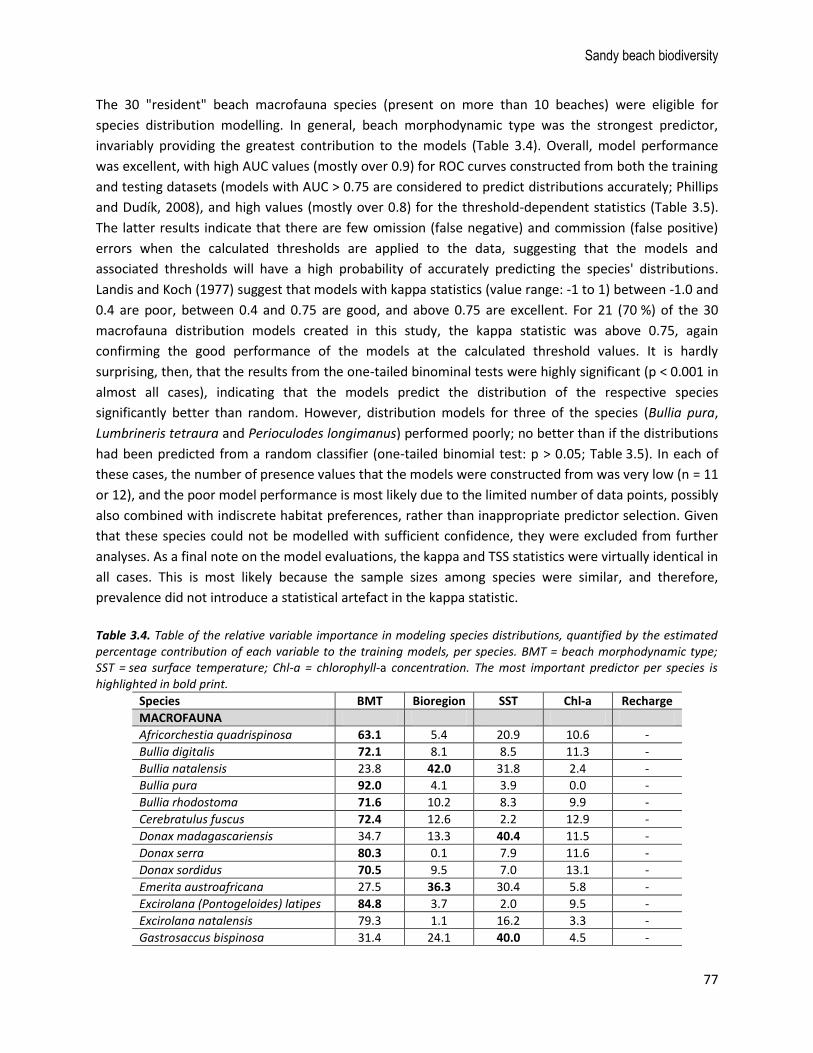
The 30 "resident" beach macrofauna species (present on more than 10 beaches) were eligible for
species distribution modelling. In general, beach morphodynamic type was the strongest predictor,
invariably providing the greatest contribution to the models (Table 3.4). Overall, model performance
was excellent, with high AUC values (mostly over 0.9) for ROC curves constructed from both the training
and testing datasets (models with AUC > 0.75 are considered to predict distributions accurately; Phillips
and Dudík, 2008), and high values (mostly over 0.8) for the threshold-dependent statistics (Table 3.5).
The latter results indicate that there are few omission (false negative) and commission (false positive)
errors when the calculated thresholds are applied to the data, suggesting that the models and
associated thresholds will have a high probability of accurately predicting the species' distributions.
Landis and Koch (1977) suggest that models with kappa statistics (value range: -1 to 1) between -1.0 and
0.4 are poor, between 0.4 and 0.75 are good, and above 0.75 are excellent. For 21 (70 %) of the 30
macrofauna distribution models created in this study, the kappa statistic was above 0.75, again
confirming the good performance of the models at the calculated threshold values. It is hardly
surprising, then, that the results from the one-tailed binominal tests were highly significant (p < 0.001 in
almost all cases), indicating that the models predict the distribution of the respective species
significantly better than random. However, distribution models for three of the species (Bullia pura,
Lumbrineris tetraura and Perioculodes longimanus) performed poorly; no better than if the distributions
had been predicted from a random classifier (one-tailed binomial test: p > 0.05; Table 3.5). In each of
these cases, the number of presence values that the models were constructed from was very low (n = 11
or 12), and the poor model performance is most likely due to the limited number of data points, possibly
also combined with indiscrete habitat preferences, rather than inappropriate predictor selection. Given
that these species could not be modelled with sufficient confidence, they were excluded from further
analyses. As a final note on the model evaluations, the kappa and TSS statistics were virtually identical in
all cases. This is most likely because the sample sizes among species were similar, and therefore,
prevalence did not introduce a statistical artefact in the kappa statistic.
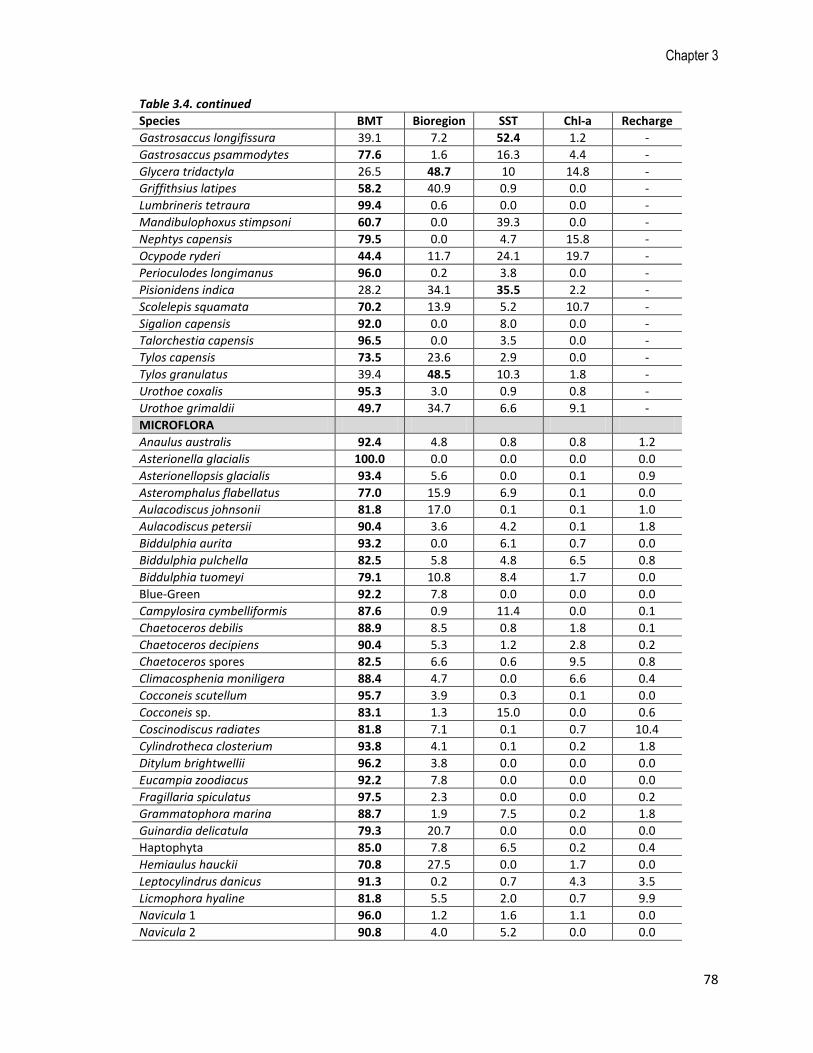
Table 3.4. Table of the relative variable importance in modeling species distributions, quantified by the estimated percentage contribution of each variable to the training models, per species. BMT = beach morphodynamic type; SST = sea surface temperature; Chl-a = chlorophyll-a concentration. The most important predictor per species is highlighted in bold print.
Species BMT Bioregion SST Chl-a Recharge
MACROFAUNA
Africorchestia quadrispinosa 63.1 5.4 20.9 10.6 -
Bullia digitalis 72.1 8.1 8.5 11.3 -
Bullia natalensis 23.8 42.0 31.8 2.4 -
Bullia pura 92.0 4.1 3.9 0.0 -
Bullia rhodostoma 71.6 10.2 8.3 9.9 -
Cerebratulus fuscus 72.4 12.6 2.2 12.9 -
Donax madagascariensis 34.7 13.3 40.4 11.5 -
Donax serra 80.3 0.1 7.9 11.6 -
Donax sordidus 70.5 9.5 7.0 13.1 -
Emerita austroafricana 27.5 36.3 30.4 5.8 -
Excirolana (Pontogeloides) latipes 84.8 3.7 2.0 9.5 -
Excirolana natalensis 79.3 1.1 16.2 3.3 -
Gastrosaccus bispinosa 31.4 24.1 40.0 4.5 -
Chapter 3
78
Table 3.4. continued
Species BMT Bioregion SST Chl-a Recharge
Gastrosaccus longifissura 39.1 7.2 52.4 1.2 -
Gastrosaccus psammodytes 77.6 1.6 16.3 4.4 -
Glycera tridactyla 26.5 48.7 10 14.8 -
Griffithsius latipes 58.2 40.9 0.9 0.0 -
Lumbrineris tetraura 99.4 0.6 0.0 0.0 -
Mandibulophoxus stimpsoni 60.7 0.0 39.3 0.0 -
Nephtys capensis 79.5 0.0 4.7 15.8 -
Ocypode ryderi 44.4 11.7 24.1 19.7 -
Perioculodes longimanus 96.0 0.2 3.8 0.0 -
Pisionidens indica 28.2 34.1 35.5 2.2 -
Scolelepis squamata 70.2 13.9 5.2 10.7 -
Sigalion capensis 92.0 0.0 8.0 0.0 -
Talorchestia capensis 96.5 0.0 3.5 0.0 -
Tylos capensis 73.5 23.6 2.9 0.0 -
Tylos granulatus 39.4 48.5 10.3 1.8 -
Urothoe coxalis 95.3 3.0 0.9 0.8 -
Urothoe grimaldii 49.7 34.7 6.6 9.1 -
MICROFLORA
Anaulus australis 92.4 4.8 0.8 0.8 1.2
Asterionella glacialis 100.0 0.0 0.0 0.0 0.0
Asterionellopsis glacialis 93.4 5.6 0.0 0.1 0.9
Asteromphalus flabellatus 77.0 15.9 6.9 0.1 0.0
Aulacodiscus johnsonii 81.8 17.0 0.1 0.1 1.0
Aulacodiscus petersii 90.4 3.6 4.2 0.1 1.8
Biddulphia aurita 93.2 0.0 6.1 0.7 0.0
Biddulphia pulchella 82.5 5.8 4.8 6.5 0.8
Biddulphia tuomeyi 79.1 10.8 8.4 1.7 0.0
Blue-Green 92.2 7.8 0.0 0.0 0.0
Campylosira cymbelliformis 87.6 0.9 11.4 0.0 0.1
Chaetoceros debilis 88.9 8.5 0.8 1.8 0.1
Chaetoceros decipiens 90.4 5.3 1.2 2.8 0.2
Chaetoceros spores 82.5 6.6 0.6 9.5 0.8
Climacosphenia moniligera 88.4 4.7 0.0 6.6 0.4
Cocconeis scutellum 95.7 3.9 0.3 0.1 0.0
Cocconeis sp. 83.1 1.3 15.0 0.0 0.6
Coscinodiscus radiates 81.8 7.1 0.1 0.7 10.4
Cylindrotheca closterium 93.8 4.1 0.1 0.2 1.8
Ditylum brightwellii 96.2 3.8 0.0 0.0 0.0
Eucampia zoodiacus 92.2 7.8 0.0 0.0 0.0
Fragillaria spiculatus 97.5 2.3 0.0 0.0 0.2
Grammatophora marina 88.7 1.9 7.5 0.2 1.8
Guinardia delicatula 79.3 20.7 0.0 0.0 0.0
Haptophyta 85.0 7.8 6.5 0.2 0.4
Hemiaulus hauckii 70.8 27.5 0.0 1.7 0.0
Leptocylindrus danicus 91.3 0.2 0.7 4.3 3.5
Licmophora hyaline 81.8 5.5 2.0 0.7 9.9
Navicula 1 96.0 1.2 1.6 1.1 0.0
Navicula 2 90.8 4.0 5.2 0.0 0.0

Sandy beach biodiversity
79
Table 3.4. continued
Species BMT Bioregion SST Chl-a Recharge
Navicula 3 83.5 16.5 0.0 0.0 0.0
Navicula 4 94.0 5.1 0.3 0.4 0.2
Navicula 5 96.0 4.0 0.0 0.0 0.0
Navicula 6 79.9 10.5 9.3 0.0 0.3
Navicula 7 92.6 7.4 0.0 0.0 0.0
Navicula 8 94.2 3.2 2.5 0.0 0.1
Navicula 9 68.8 31.1 0.1 0.0 0.0
Neoceratium furca 88.6 7.6 2.6 0.5 0.7
Neoceratium pulchellum 64.6 23.3 0.0 9.4 2.8
Nitzschia delicatissima 88.6 7.3 3.1 0.7 0.3
Nitzschia longissima 87.4 10.3 0.1 0.9 1.2
Nitzschia sp. 89.8 9.2 0.2 0.7 0.1
Noctiluca miliaris 89.9 8.5 0.0 0.0 1.6
Odontella mobiliensis 85.4 5.7 0.0 5.4 3.5
Paralia sulcata 93.1 3.5 0.5 2.2 0.6
Peridinium sp. 88.6 4.9 0.0 6.5 0.0
Plagiogrammopsis vanheurckii 85.0 0.5 2.7 11.9 0.0
Pleurosigma sp. 95.4 4.6 0.0 0.0 0.0
Proboscia alata 76.5 18.7 0.1 0.9 3.9
Prorocentrum micans 86.4 10.6 0.6 2.0 0.5
Pseudonitzschia seriata 89.0 5.2 0.2 0.5 5.1
Rhizosolenia formosa 90.0 1.8 0.0 7.3 0.9
Skeletonema costatum 89.4 1.1 0.6 4.9 4.1
Stephanopyxis turris 86.9 4.6 0.0 0.0 8.5
Thalassionema nitzschioides 93.9 1.1 3.9 1.0 0.1
Thalassiosira angulata 87.8 12.2 0.0 0.0 0.0
Thalassiosira rotula 81.5 13.1 5.1 0.0 0.3
Thalassiosira sp. 79.0 12.8 7.0 1.2 0.0
Thalassiothrix sp. 83.2 16.8 0.0 0.0 0.0
Triceratium favus 91.3 4.8 1.0 1.8 1.2
The binary distribution maps conformed neatly to the known distributions of the macrofauna. For some
species, though, the models predicted additional habitat at the ends of the known ranges as being
probabilistically suitable. Overall, the map of summed species richness shows beaches (from west to
east) with relatively low diversity (mostly fewer than 10 species, although note that this comprises
about 30 % of the species modelled), but interspersed with more diverse beaches (up to 16 species) in
the north west, high diversity between Elands Bay and Cape Agulhas (up to 21 species per beach), fairly
high diversity (14 to 18 species) in the log-spiral bays along the south coast and pocket beaches along
the Wild Coast, and low diversity through southern KwaZulu-Natal (fewer than 9 species), which
increases again north of Mtunzini (to 10 - 15 species). The South African and southern African endemic
species are mostly located on the south and west coasts, with fewer represented along the east coast
(Fig. 3.4c).

Table 3.5. Statistics evaluating the performance of the species distribution models, based on n presence records per species. AUCTRAIN and AUCTEST = area under
the ROC curve of the model created using the training and testing data, respectively, ± standard error (SE). Sensitivity, specificity, kappa and true skill statistic (TSS) scores (as defined in the text) are presented for the optimal, median threshold probability (Threshold). The significance (p) values of the one-tail binominal test are also given, with models performing significantly better than random (at alpha = 0.05) indicated with an asterisk.
Species n AUCTRAIN (±SE) AUCTEST (±SE) Threshold Sensitivity Specificity Kappa TSS p
MACROFAUNA
Africorchestia quadrispinosa 33 0.948 (0.013) 0.964 (0.023) 0.190 0.909 0.969 0.877 0.878 < 0.001*
Bullia digitalis 30 0.972 (0.010) 0.956 (0.013) 0.145 0.833 0.967 0.800 0.800 < 0.001*
Bullia natalensis 11 0.983 (0.009) 0.992 (0.005) 0.185 0.909 1.000 0.909 0.909 0.004*
Bullia pura 12 0.944 (0.010) 0.938 (0.002) 0.535 0.500 0.750 0.250 0.250 0.171
Bullia rhodostoma 41 0.963 (0.013) 0.967 (0.010) 0.265 0.854 1.000 0.854 0.854 < 0.001*
Cerebratulus fuscus 45 0.938 (0.023) 0.889 (0.038) 0.240 0.800 0.822 0.622 0.622 < 0.001*
Donax madagascariensis 24 0.984 (0.003) 0.964 (0.013) 0.340 0.875 0.875 0.750 0.750 < 0.001*
Donax serra 44 0.961 (0.006) 0.977 (0.006) 0.205 0.932 1.000 0.932 0.932 < 0.001*
Donax sordidus 26 0.979 (0.006) 0.980 (0.003) 0.295 0.962 1.000 0.962 0.962 < 0.001*
Emerita austroafricana 51 0.977 (0.005) 0.975 (0.007) 0.115 0.961 1.000 0.961 0.961 < 0.001*
Excirolana (Pontogeloides) latipes 76 0.943 (0.008) 0.923 (0.016) 0.223 0.908 0.947 0.855 0.855 < 0.001*
Excirolana natalensis 123 0.937 (0.009) 0.892 (0.032) 0.160 0.927 0.992 0.919 0.919 < 0.001*
Gastrosaccus bispinosa 50 0.976 (0.004) 0.946 (0.023) 0.125 0.940 1.000 0.940 0.940 < 0.001*
Gastrosaccus longifissura 10 0.958 (0.012) 0.949 (0.031) 0.270 1.000 0.700 0.700 0.700 0.012*
Gastrosaccus psammodytes 57 0.959 (0.006) 0.967 (0.008) 0.194 0.912 0.965 0.877 0.877 < 0.001*
Glycera tridactyla 22 0.977 (0.008) 0.954 (0.027) 0.080 0.955 1.000 0.955 0.955 0.002*
Griffithsius latipes 16 0.974 (0.011) 0.959 (0.032) 0.492 0.688 0.688 0.375 0.375 < 0.001*
Lumbrineris tetraura 12 0.802 (0.079) 0.872 (0.021) 0.576 0.500 0.667 0.167 0.167 0.298
Mandibulophoxus stimpsoni 13 0.955 (0.009) 0.895 (0.068) 0.320 0.846 0.846 0.692 0.692 0.030*
Nephtys capensis 27 0.973 (0.007) 0.977 (0.010) 0.140 0.963 1.000 0.963 0.963 < 0.001*
Ocypode ryderi 19 0.962 (0.009) 0.899 (0.060) 0.235 0.947 0.895 0.842 0.842 0.008*
Perioculodes longimanus 11 0.960 (0.010) 0.943 (0.006) 0.550 0.273 0.909 0.182 0.182 1.000
Pisionidens indica 31 0.977 (0.005) 0.975 (0.009) 0.150 1.000 0.900 0.901 0.900 < 0.001*
Scolelepis squamata 79 0.948 (0.011) 0.940 (0.016) 0.155 0.924 0.975 0.899 0.899 < 0.001*
Sigalion capensis 12 0.973 (0.009) 0.772 (0.145) 0.570 0.500 0.923 0.430 0.430 0.043*
Talorchestia capensis 12 0.964 (0.007) 0.978 (0.013) 0.210 1.000 1.000 1.000 1.000 0.002*
Tylos capensis 16 0.956 (0.005) 0.966 (0.005) 0.482 0.875 0.438 0.313 0.313 < 0.001*
Tylos granulates 23 0.972 (0.010) 0.992 (0.005) 0.165 0.957 0.913 0.870 0.870 < 0.001*
Urothoe coxalis 14 0.927 (0.027) 0.941 (0.006) 0.580 0.857 0.929 0.788 0.788 < 0.001*
Urothoe grimaldii 29 0.974 (0.006) 0.939 (0.039) 0.155 0.931 1.000 0.931 0.931 < 0.001*
80
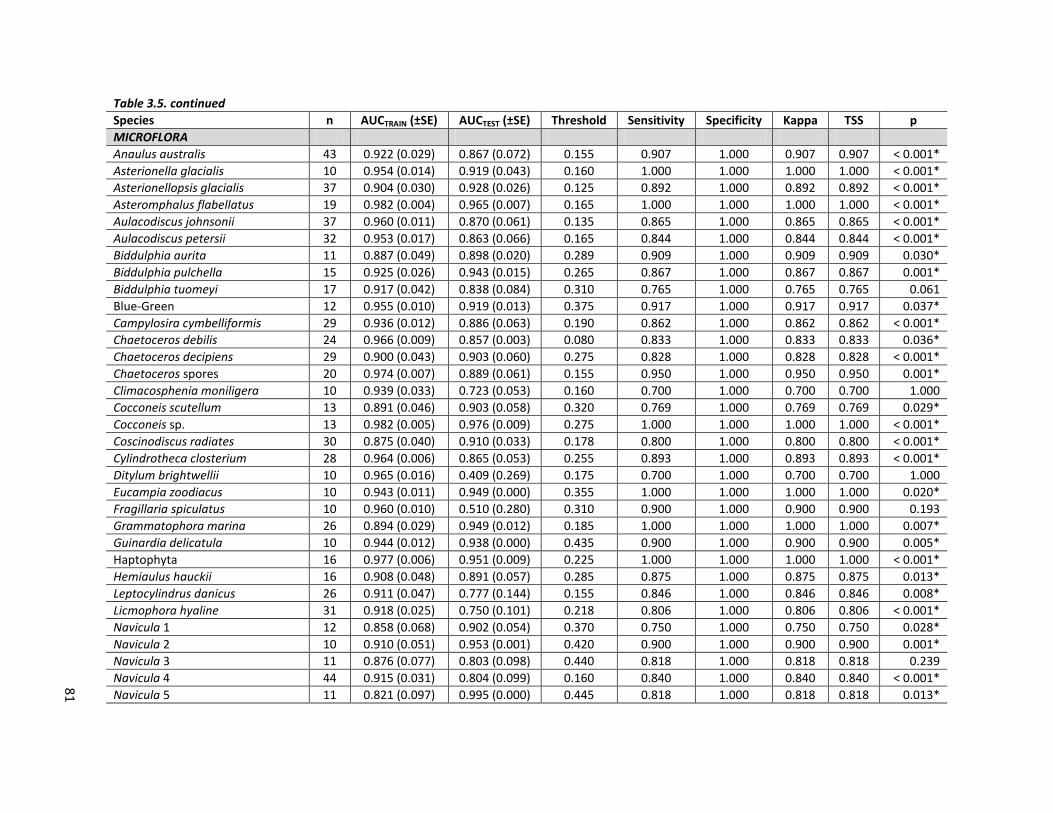
Table 3.5. continued
Species n AUCTRAIN (±SE) AUCTEST (±SE) Threshold Sensitivity Specificity Kappa TSS p
MICROFLORA
Anaulus australis 43 0.922 (0.029) 0.867 (0.072) 0.155 0.907 1.000 0.907 0.907 < 0.001*
Asterionella glacialis 10 0.954 (0.014) 0.919 (0.043) 0.160 1.000 1.000 1.000 1.000 < 0.001*
Asterionellopsis glacialis 37 0.904 (0.030) 0.928 (0.026) 0.125 0.892 1.000 0.892 0.892 < 0.001*
Asteromphalus flabellatus 19 0.982 (0.004) 0.965 (0.007) 0.165 1.000 1.000 1.000 1.000 < 0.001*
Aulacodiscus johnsonii 37 0.960 (0.011) 0.870 (0.061) 0.135 0.865 1.000 0.865 0.865 < 0.001*
Aulacodiscus petersii 32 0.953 (0.017) 0.863 (0.066) 0.165 0.844 1.000 0.844 0.844 < 0.001*
Biddulphia aurita 11 0.887 (0.049) 0.898 (0.020) 0.289 0.909 1.000 0.909 0.909 0.030*
Biddulphia pulchella 15 0.925 (0.026) 0.943 (0.015) 0.265 0.867 1.000 0.867 0.867 0.001*
Biddulphia tuomeyi 17 0.917 (0.042) 0.838 (0.084) 0.310 0.765 1.000 0.765 0.765 0.061
Blue-Green 12 0.955 (0.010) 0.919 (0.013) 0.375 0.917 1.000 0.917 0.917 0.037*
Campylosira cymbelliformis 29 0.936 (0.012) 0.886 (0.063) 0.190 0.862 1.000 0.862 0.862 < 0.001*
Chaetoceros debilis 24 0.966 (0.009) 0.857 (0.003) 0.080 0.833 1.000 0.833 0.833 0.036*
Chaetoceros decipiens 29 0.900 (0.043) 0.903 (0.060) 0.275 0.828 1.000 0.828 0.828 < 0.001*
Chaetoceros spores 20 0.974 (0.007) 0.889 (0.061) 0.155 0.950 1.000 0.950 0.950 0.001*
Climacosphenia moniligera 10 0.939 (0.033) 0.723 (0.053) 0.160 0.700 1.000 0.700 0.700 1.000
Cocconeis scutellum 13 0.891 (0.046) 0.903 (0.058) 0.320 0.769 1.000 0.769 0.769 0.029*
Cocconeis sp. 13 0.982 (0.005) 0.976 (0.009) 0.275 1.000 1.000 1.000 1.000 < 0.001*
Coscinodiscus radiates 30 0.875 (0.040) 0.910 (0.033) 0.178 0.800 1.000 0.800 0.800 < 0.001*
Cylindrotheca closterium 28 0.964 (0.006) 0.865 (0.053) 0.255 0.893 1.000 0.893 0.893 < 0.001*
Ditylum brightwellii 10 0.965 (0.016) 0.409 (0.269) 0.175 0.700 1.000 0.700 0.700 1.000
Eucampia zoodiacus 10 0.943 (0.011) 0.949 (0.000) 0.355 1.000 1.000 1.000 1.000 0.020*
Fragillaria spiculatus 10 0.960 (0.010) 0.510 (0.280) 0.310 0.900 1.000 0.900 0.900 0.193
Grammatophora marina 26 0.894 (0.029) 0.949 (0.012) 0.185 1.000 1.000 1.000 1.000 0.007*
Guinardia delicatula 10 0.944 (0.012) 0.938 (0.000) 0.435 0.900 1.000 0.900 0.900 0.005*
Haptophyta 16 0.977 (0.006) 0.951 (0.009) 0.225 1.000 1.000 1.000 1.000 < 0.001*
Hemiaulus hauckii 16 0.908 (0.048) 0.891 (0.057) 0.285 0.875 1.000 0.875 0.875 0.013*
Leptocylindrus danicus 26 0.911 (0.047) 0.777 (0.144) 0.155 0.846 1.000 0.846 0.846 0.008*
Licmophora hyaline 31 0.918 (0.025) 0.750 (0.101) 0.218 0.806 1.000 0.806 0.806 < 0.001*
Navicula 1 12 0.858 (0.068) 0.902 (0.054) 0.370 0.750 1.000 0.750 0.750 0.028*
Navicula 2 10 0.910 (0.051) 0.953 (0.001) 0.420 0.900 1.000 0.900 0.900 0.001*
Navicula 3 11 0.876 (0.077) 0.803 (0.098) 0.440 0.818 1.000 0.818 0.818 0.239
Navicula 4 44 0.915 (0.031) 0.804 (0.099) 0.160 0.840 1.000 0.840 0.840 < 0.001*
Navicula 5 11 0.821 (0.097) 0.995 (0.000) 0.445 0.818 1.000 0.818 0.818 0.013*
81

Table 3.5. continued
Species n AUCTRAIN (±SE) AUCTEST (±SE) Threshold Sensitivity Specificity Kappa TSS p
Navicula 6 25 0.922 (0.017) 0.938 (0.016) 0.265 0.800 1.000 0.800 0.800 < 0.001*
Navicula 7 17 0.968 (0.008) 0.651 (0.185) 0.105 0.882 1.000 0.882 0.882 0.071
Navicula 8 28 0.926 (0.020) 0.851 (0.086) 0.130 0.893 1.000 0.893 0.893 < 0.001*
Navicula 9 11 0.976 (0.007) 0.983 (0.010) 0.275 1.000 1.000 1.000 1.000 0.005*
Neoceratium furca 20 0.943 (0.030) 0.949 (0.033) 0.160 0.900 1.000 0.900 0.900 < 0.001*
Neoceratium pulchellum 13 0.904 (0.042) 0.847 (0.081) 0.270 0.846 0.846 0.692 0.692 0.207
Nitzschia delicatissima 28 0.905 (0.044) 0.902 (0.029) 0.155 0.788 1.000 0.788 0.788 0.015*
Nitzschia longissima 25 0.950 (0.016) 0.927 (0.017) 0.150 0.880 1.000 0.880 0.880 < 0.001*
Nitzschia sp. 20 0.924 (0.029) 0.784 (0.148) 0.315 0.800 1.000 0.800 0.800 < 0.001*
Noctiluca miliaris 14 0.967 (0.009) 0.972 (0.007) 0.185 1.000 1.000 1.000 1.000 0.001*
Odontella mobiliensis 13 0.861 (0.049) 0.949 (0.010) 0.325 0.923 1.000 0.923 1.000 0.021*
Paralia sulcata 20 0.920 (0.042) 0.930 (0.017) 0.240 0.850 1.000 0.850 0.850 < 0.001*
Peridinium sp. 19 0.977 (0.008) 0.750 (0.184) 0.145 0.947 1.000 0.947 0.947 0.005*
Plagiogrammopsis vanheurckii 20 0.900 (0.046) 0.711 (0.151) 0.330 0.750 1.000 0.750 0.750 0.008*
Pleurosigma sp. 14 0.875 (0.060) 0.956 (0.004) 0.325 0.857 1.000 0.857 0.857 < 0.001*
Proboscia alata 30 0.926 (0.025) 0.816 (0.098) 0.175 0.833 1.000 0.833 0.833 < 0.001*
Prorocentrum micans 22 0.939 (0.028) 0.979 (0.006) 0.265 0.909 1.000 0.909 0.909 < 0.001*
Pseudonitzschia seriata 40 0.937 (0.014) 0.919 (0.034) 0.175 0.875 1.000 0.875 0.875 < 0.001*
Rhizosolenia Formosa 10 0.952 (0.015) 0.959 (0.016) 0.330 0.900 1.000 0.900 0.900 0.013*
Skeletonema costatum 25 0.951 (0.001) 0.870 (0.072) 0.130 0.920 1.000 0.920 0.920 < 0.001*
Stephanopyxis turris 15 0.918 (0.041) 0.951 (0.016) 0.330 0.867 1.000 0.867 0.867 < 0.001*
Thalassionema nitzschioides 33 0.925 (0.025) 0.930 (0.015) 0.185 0.879 1.000 0.879 0.879 < 0.001*
Thalassiosira angulata 14 0.849 (0.066) 0.943 (0.000) 0.465 0.857 1.000 0.857 0.857 0.001*
Thalassiosira rotula 18 0.982 (0.004) 0.987 (0.006) 0.245 1.000 1.000 1.000 1.000 < 0.001*
Thalassiosira sp. 12 0.982 (0.005) 0.988 (0.004) 0.315 1.000 1.000 1.000 1.000 < 0.001*
Thalassiothrix sp. 11 0.931 (0.020) 0.895 (0.055) 0.315 0.909 1.000 0.909 0.909 0.033*
Triceratium favus 20 0.913 (0.032) 0.808 (0.129) 0.310 0.750 1.000 0.750 0.750 < 0.001*
82

Chapter 3
83
Microflora
The microflora associated with beaches in South Africa are more diverse than the macrofauna, with 287
morphospecies recorded to date. This includes 29 morphospecies of microphytobenthos, 191
morphospecies of phytoplankton, and 67 morphospecies present in both the sand and surf. However, in
contrast to the high level of endemism recorded for the macrofauna, not a single morphospecies of
microflora occurs solely in South or Southern Africa. The number of "resident" morphospecies is much
smaller than the total species richness. Of the 287 microflora morphospecies, 107 have been recorded
as singletons or doubletons, and 60 have been recorded on 10 or more beaches and are considered to
be the resident suite in South Africa. Almost two thirds of the resident micoroflora morphospecies are
exclusively phytoplankton (n = 38), nearly a third are present in both sand and surf (n = 17), and the
remainder (n = 5) are exclusively microphytobenthos. It must be noted, though, that the sampling effort
for microphytobenthos is considerably less than that for phytoplankton, and that the number of
resident microphytobenthos morphospecies will very likely rise as more sampling is undertaken. This is
confirmed when analysing the species-accumulation curves. Asymptotes appear to be reached for all
microflora morphospecies when pooled, all phytoplankton, and surf-sand morphospecies, but not for
microphytobenthos (Fig. 3.6). Note also that a species-accumulation curve was plotted by the number of
sites sampled (Fig. 3.6a). This was because sampling effort has varied per sampling event, over time, and
among sites; plotting the species-accumulation curves in this latter form thus provided a different way
of evaluating whether or not microflora diversity has been captured sufficiently. Because this plot also
reached an asymptote, it is concluded that microflora are adequately represented at a national level in
this assessment.
Species distribution models were created for the 60 resident sandy beach microflora morphospecies.
Interestingly, beach morphodynamic type was also the predictor that contributed the most to all these
models (generally 80 - 90 %), with bioregion being the second greatest contributor overall (around
10 %), and sea-surface temperature, chlorophyll-a concentration and groundwater recharge
contributing the rest, if featuring at all (Table 3.4). Statistical evaluation of the microflora distribution
models produced similar results to those of the macrofauna distribution models, with high AUC values
(generally 0.8 - 0.9) for the model training and testing data, and high values (also around 0.8 - 0.9) for
the threshold-dependent statistics (Table 3.5). Interestingly, model specificity was perfect (1.000) in all
but one case, suggesting no commission errors in the models. Apart from seven morphospecies for
which model performance was no better than random (again, likely due to small sample sizes), the
microflora distribution models performed very well, and the calculated threshold values split the data
appropriately into species presence and absence. As above, the microflora morphospecies that could
not be modelled with sufficient confidence were excluded from further analyses.
The summed species richness for microflora is moderate along the South African north-west coast
(generally fewer than 15 morphospecies), but with some beaches supporting up to 47 morphospecies
(Fig. 3.4d). Species richness increases south of the Langebaan lagoon (Yzerfontein beaches) to Cape
Agulhas, with several beaches in this region containing all 53 morphospecies of microflora. The log-spiral
bays along the south coast, and the shoreline between Port Elizabeth and East London have similarly

Sandy beach biodiversity
84
Figure 3.6. Permutational species-accumulation curves representing the cumulative number of morphospecies observed (black line) ± 95 % CL (grey band) (a) by the number of sites sampled for all microflora; and by the number of samples taken for (b) all microflora; (c) phytoplankton, (d) microphytobenthos, and (e) microflora morphospecies recorded in both the surf and sand.
a.
b.
c.
d.
e.

Chapter 3
85
high diversity. Microflora communities are moderately diverse throughout the Wild Coast, but decline to
fewer than 20 morphospecies along southern and central KwaZulu-Natal. Further north up the east
coast, the beaches between Mtunzini and Richard's Bay, and between St Lucia and Cape Vidal support
up to 45 morphospecies of microflora; most beaches north of Sodwana support 26 species, although
some can be as diverse as 42 morphospecies.
Coastal/dune vegetation
There are 26 species of dune pioneer plants that were included in this study, of which 11 are listed by
the South African National Biodiversity Institute as South African endemics (see:
http://redlist.sanbi.org). One other species occurs in South Africa and Namibia, and is considered a
southern African endemic. Diversity is highest along the south-east to south-west coasts (Fig 3.4e), with
as many as 17 species present in a single habitat unit in this region, and less than half of that in the
north-eastern and north-western sections of the South African coast.
Integration of beach biodiversity layers
Altogether, 536 morphospecies of vertebrates, plants, macrofauna and microflora have been recorded
on the South African sandy beaches. Even if the number of macrofauna and microflora species is
reduced to only those that have been recorded at 10 or more beaches, i.e., the resident biota, the total
species richness is still fairly high, at 140 species (see Table 3.6). Overall (Fig. 3.4f), beach diversity is
higher along the south coast, but this is largely due to the alongshore trends in the floral communities
(both microflora and foredune plants). In contrast, macrofauna and vertebrates have a much more
consistent number of species making up their respective communities, regardless of their position along
the shoreline.
Remarkably, two-thirds of the resident macrofaunal communities comprise endemic species. About half
of these are found only in southern African (n = 10 species), and the other half are confined to just one
or two of the South African coastal bioregions (n = 8; Table 3.6). If the suite of macrofauna is broadened
to include all species that have been found on the South African beaches and identified to species level
(n = 110 species), then the number of southern African endemics increases to 36 species, and the
number of South African endemics increases to 22 species.
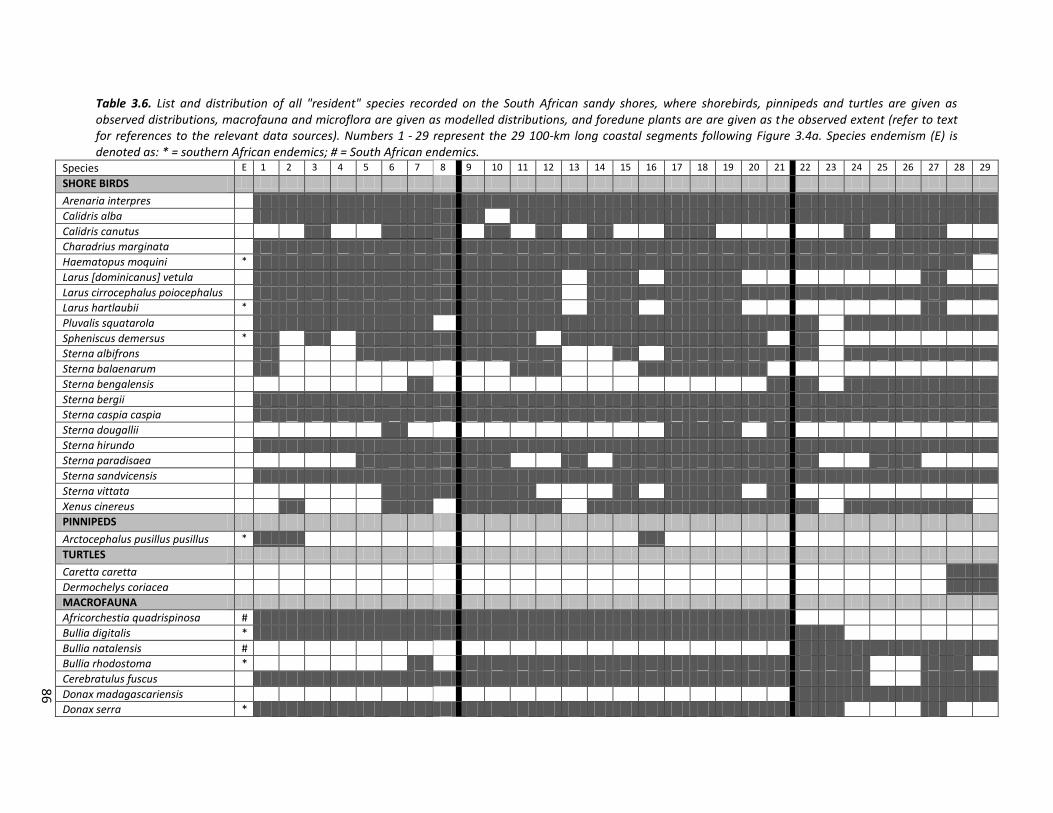
Table 3.6. List and distribution of all "resident" species recorded on the South African sandy shores, where shorebirds, pinnipeds and turtles are given as observed distributions, macrofauna and microflora are given as modelled distributions, and foredune plants are are given as the observed extent (refer to text for references to the relevant data sources). Numbers 1 - 29 represent the 29 100-km long coastal segments following Figure 3.4a. Species endemism (E) is denoted as: * = southern African endemics; # = South African endemics.
Species E 1 2 3 4 5 6 7 8 9 10 11 12 13 14 15 16 17 18 19 20 21 22 23 24 25 26 27 28 29
SHORE BIRDS
Arenaria interpres
Calidris alba
Calidris canutus
Charadrius marginata
Haematopus moquini *
Larus [dominicanus] vetula
Larus cirrocephalus poiocephalus
Larus hartlaubii *
Pluvalis squatarola
Spheniscus demersus *
Sterna albifrons
Sterna balaenarum
Sterna bengalensis
Sterna bergii
Sterna caspia caspia
Sterna dougallii
Sterna hirundo
Sterna paradisaea
Sterna sandvicensis
Sterna vittata
Xenus cinereus
PINNIPEDS
Arctocephalus pusillus pusillus *
TURTLES
Caretta caretta
Dermochelys coriacea
MACROFAUNA
Africorchestia quadrispinosa #
Bullia digitalis *
Bullia natalensis #
Bullia rhodostoma *
Cerebratulus fuscus
Donax madagascariensis
Donax serra *
86
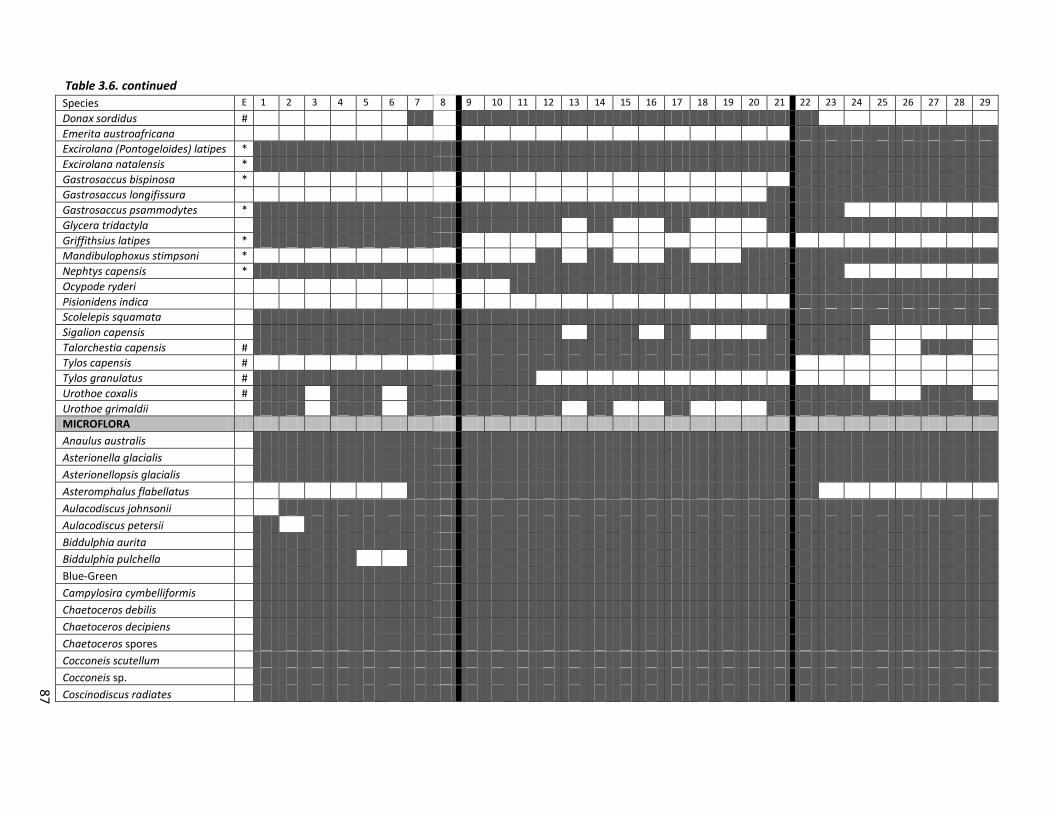
Species E 1 2 3 4 5 6 7 8 9 10 11 12 13 14 15 16 17 18 19 20 21 22 23 24 25 26 27 28 29
Donax sordidus #
Emerita austroafricana
Excirolana (Pontogeloides) latipes *
Excirolana natalensis *
Gastrosaccus bispinosa *
Gastrosaccus longifissura
Gastrosaccus psammodytes *
Glycera tridactyla
Griffithsius latipes *
Mandibulophoxus stimpsoni *
Nephtys capensis *
Ocypode ryderi
Pisionidens indica
Scolelepis squamata
Sigalion capensis
Talorchestia capensis #
Tylos capensis #
Tylos granulatus #
Urothoe coxalis #
Urothoe grimaldii
MICROFLORA
Anaulus australis
Asterionella glacialis
Asterionellopsis glacialis
Asteromphalus flabellatus
Aulacodiscus johnsonii
Aulacodiscus petersii
Biddulphia aurita
Biddulphia pulchella
Blue-Green
Campylosira cymbelliformis
Chaetoceros debilis
Chaetoceros decipiens
Chaetoceros spores
Cocconeis scutellum
Cocconeis sp.
Coscinodiscus radiates
Table 3.6. continued
87

Species E 1 2 3 4 5 6 7 8 9 10 11 12 13 14 15 16 17 18 19 20 21 22 23 24 25 26 27 28 29
Cylindrotheca closterium
Eucampia zoodiacus
Fragillaria spiculatus
Grammatophora marina
Guinardia delicatula
Haptophyta
Hemiaulus hauckii
Leptocylindrus danicus
Licmophora hyaline
Navicula 1
Navicula 2
Navicula 4
Navicula 5
Navicula 6
Navicula 8
Navicula 9
Neoceratium furca
Nitzschia delicatissima
Nitzschia longissima
Nitzschia sp.
Noctiluca miliaris
Odontella mobiliensis
Paralia sulcata
Peridinium sp.
Plagiogrammopsis vanheurckii
Pleurosigma sp.
Proboscia alata
Prorocentrum micans
Pseudonitzschia seriata
Species E 1 2 3 4 5 6 7 8 9 10 11 12 13 14 15 16 17 18 19 20 21 22 23 24 25 26 27 28 29
Rhizosolenia formosa
Skeletonema costatum
Stephanopyxis turris
Thalassionema nitzschioides
Thalassiosira angulata
Table 3.6. continued
88

Thalassiosira rotula
Thalassiosira sp.
Thalassiothrix sp.
Triceratium favus
FOREDUNE PLANTS
Arctotheca populifolia
Canavalia rosea
Carpobrotus acinaciformis #
Cladoraphis cyperoides
Cyperus crassipes
Dasispermum suffruticosum #
Didelta carnosa var. tomentosa *
Ehrharta villosa var. maxima #
Eragrostis sabulosa #
Gazania rigens var. leucolaena #
Gazania rigens var. uniflora
Hebenstretia cordata
Ipomoea pes-caprae
Launaea sarmentosa
Manulea tormentosa
Oncosiphon sabulosum #
Phylohydrax carnosa
Scaevola plumeri
Scaevola sericea
Senecio elegans #
Senecio litorosus #
Senecio maritimus #
Silene crassifolia #
Tetragonia decumbens
Thinopyrum distichum
Trachyandra divaricatum #
Table 3.6. continued
89
Sandy beach biodiversity
90
Discussion
It is well documented that marine species richness tends to increase from west to east along the South
African coast (community biomass tends to decrease along the same gradient), with greatest endemism
along the south coast (Bustamante and Branch, 1996; and more specifically - coastal fish: Turpie et al.,
2000; coastal and marine invertebrates: Awad et al., 2002; Scott et al., 2012; decapod crustaceans:
Kensley, 1981; intertidal acari: Procheş and Marshall, 2002; and polychaetes: Day, 1967a, b). However,
some groups show exception to this broad trend, with highest diversity along the south coast (see Awad
et al., 2002). Sandy beach taxa align with these latter groups, having greatest species richness along the
south coast, and highest endemism along the west and south coasts. The contrasting spatial patterns in
species richness and endemism of sandy shore communities compared to those of other coastal and
marine systems is because the widespread Indo-Pacific species (driving higher species richness on the
north east coast; e.g., Scott et al., 2012) tend to be associated more with rocky shore and coral reef
communities than with sandy beach communities. Furthermore, the distribution of beach
morphodynamic types along the South African coastline (Chapter 2; Harris et al., 2011a) also plays an
important role in determining spatial trends in the beach communities at a national scale.
Dissipative beaches and dissipative-intermediate beaches with broad surf zones support accumulations
of surf diatoms (Campbell and Bate, 1997) and much richer assemblages of macrofauna, including more
specialist species, compared to reflective or intermediate beaches (e.g., Defeo and McLachlan, 2005;
McLachlan and Brown, 2006; McLachlan and Dorvlo, 2005, 2007). While the west coast is relatively
rocky and has representatives from all beach types, the long dissipative beaches in South Africa are
located in this region. The south coast comprises predominantly dissipative-intermediate beaches in log-
spiral bays, and the east coast has a greater proportion of reflective and intermediate beach forms
(Chapter 2; Harris et al., 2011a). Beach microflora, particularly phytoplankton diversity is thus variable
on the west coast, highest along the south coast, and least along the east coast - the latter also likely
because productivity on the east coast is much lower compared to that on the west coast. Macrofauna
show a fairly consistent range in species richness that peaks along the Wild Coast, which is a transition
area between the subtropical and warm-temperate bioregions, and hence raises the local diversity. The
peak in species richness suggested to occur around Mtunzini and St Lucia is probably an overestimation
that arose because the models predicted beaches in this region to be suitable for a number of the south
coast macrofauna, which have not (yet) been recorded that far north. The shorebirds are likely
responding more to coastal features than beach morphodynamics per se. For example, their greatest
diversity is associated with the Langebaan lagoon region and the Alexandria dunefield, and least
diversity is associated with shoreline segments that are predominantly rocky and/or have a narrow
supratidal component that is also transformed by development. Foredune plants show the most marked
differences among the west, south and east coasts. These species are more likely responding to
terrestrial abiotic drivers, such as rainfall, wind and soil type, which are largely beyond the scope of this
study.
It was remarkable that two-thirds of the resident sandy beach macrofauna species are endemic either to
South or southern Africa. It was also surprising to see how many additional (n = 40) species have been

Chapter 3
91
recorded in the database, which are also endemic to South(ern) Africa, but have been captured in less
than 5 % of the sampling events and thus are also relatively rare species (e.g., Glycera natalensis, Bullia
mozambicensis, Eurydice barnardi and Bathyporeia cunctator). In terms of both conservation and
general awareness, the South African endemic species certainly need greater attention. Considering that
these species, by definition, occur in just one or two of the South African bioregions, and that they likely
have a preferred beach morphodynamic type and an across-shore zone that they inhabit (e.g., Dahl,
1952; Lercari and Defeo, 2006; McLachlan and Brown, 2006; McLachlan and Dorvlo, 2005, 2007;
McLachlan and Jaramillo, 1995; McLachlan et al., 1993; Salvat, 1964; Soares, 2003), the amount of
available habitat is incredibly limited for these species. The high-shore species are further imperilled by
habitat transformation and loss from coastal development and coastal squeeze, and from management
actions due to tourism pressures, such as beach grooming or wrack removal (Dugan et al., 2008). Tylos
capensis and Tylos granulatus, for example, need dunes and supralittoral habitat to survive; Talorchestia
capensis and Africorchestia quadrispinosa need supralittoral habitat and wrack piles on the strandline.
To make matters worse for these species, dispersal is limited because they are terrestrial invertebrates,
without a pelagic larval phase. Brown (2000) noted that Tylos granulatus may be an endangered species.
This hypothesis has yet to be tested, but it and the other three high-shore endemic species are strong
candidates for Red Data listing because of their severely restricted distributions, and ever-expanding
habitat threats, which makes them likely candidates for the risk of extinction.
After considering the high level of endemism in sandy beach macrofauna, it was paradoxical that there
were no endemic microflora species. However, it is unlikely that a country like South Africa will support
endemic surf phytoplankton species. This is because the South African shoreline is exposed, with open-
ocean beaches and strong currents that hug the coast on all ocean-bounded sides, which likely
contributes to strong connectivity in phytoplankton communities. It is therefore not surprising that
many of the species had widespread distributions, with bioregional predictors contributing hardly any
predictive power to the species distribution models. The perceived biogeography in these species (Harris
et al., 2010) is more likely to be related to the distribution of beach morphodynamic types in South
Africa, which affects the relative abundances of the species. For example, the south and south-west
coasts are favourable for the formation of surf diatom accumulations, which separates the
phytoplankton communities found along this part of the shoreline from the rest of the communities,
thereby, suggesting three bioregions. However, this would need to be tested formally to be a conclusive
result.
To my knowledge, this is the first time species distribution modelling techniques have been applied to
sandy beach species anywhere in the world. The tight relationships between the biota and descriptors of
their habitats, particularly for the macrofauna, make them very amenable to this kind of analysis, and as
was shown, can produce very good results with relatively small sample sizes and just a few predictors. In
addition, the resulting models are more likely to be accurate for beach species than for organisms from
most other ecosystems, for the following reason. Fielding and Bell (1997) describe two origins of
prediction errors: algorithmic errors arising from the model algorithms; and biotic errors arising from
the ecology of the species being modelled (e.g., competitive exclusion). They argue that individuals are
constrained in their decisions across landscapes, being influenced by intra- and inter-specific

Sandy beach biodiversity
92
interactions. Because these are often difficult to integrate into species distribution models, they, in turn,
lead to omission and commission errors (see also Anderson et al., 2002; Fielding and Bell, 1997).
However, because sandy beach ecosystems are so physically dominated (McLachlan et al., 1993), beach
biota appear to be an exception to Fielding and Bell's arguments, except in the most extreme cases (see
Defeo and McLachlan, 2005; Dugan et al., 2004; Van Tomme et al., 2012). Consequently, one of the
strengths of doing species distribution modelling for sandy beach biota is that the number of prediction
errors is likely to be restricted to algorithmic errors (which can be explicitly quantified) rather than biotic
errors, resulting in relatively better-performing models.
These benefits notwithstanding, one possible source of biotic errors in the current models lies in the
connectivity of habitats and populations of species, which was not taken into account here because it is
currently one of the conspicuous knowledge gaps in sandy beach ecological theory. It is possible that,
while some beaches may meet the criteria for being suitable to support a population of a certain
species, some of these beaches may be located too far from other suitable (source) beaches to sustain a
viable population. In other words, the models might accurately predict alongshore-distribution
component of a species' fundamental niche, but not that of the realized niche. (Hereafter, for
simplification, these are referred to as the fundamental and realized distributions, respectively,
recognizing that distribution is only one aspect of ecological niches, as defined in classic texts by Grinnell
(1917), Elton (1927) and Hutchinson (1957)). Given how well the models predicted the test data, though,
excluding connectivity processes in the models is not considered to be a significant shortcoming at this
time. Further, including parts of the whole fundamental distribution in conservation planning exercises,
for example, might well serve to be a proactive strategy in keeping potentially suitable habitat in a good
state that could be colonized as local conditions change and species ranges are required to shift. For
example, the model predicted the distribution of the ghost crab, Ocypode ryderi, to extend (in patches)
southwards along the Eastern Cape coast. Megalopa larvae certainly do arrive on the Eastern Cape
shores from KwaZulu-Natal, but they (currently) do not survive the cold winters, so adults are rarely
observed (McLachlan, 1980). However, there is evidence to suggest that the Agulhas current is warming
(Rouault et al., 2009), and perhaps we will see a southward extension in the O. ryderi range in time.
While the species distribution models constructed in this study did perform well, and confirmed the
assumption that beach morphodynamic type and bioregion are good initial proxies for representing
beach biodiversity, there are several shortcomings that need consideration. Firstly, the map of
distributions from which the models were constructed is based on snap-shot sampling across four
decades; there are no data (apart from a few cases where beaches have been sampled multiple times,
e.g., Harris et al., 2011b; Ortega Cisneros et al., 2011) on the persistence/residency of species on
beaches or in the surf. While local residency may be a valid assumption for the dominant species, it may
not be the case for rarer species, or for those that have less resistance to wave force, e.g., polychaetes
(Tamaki, 1987), and are more easily dispersed. Similarly, phytoplankton communities are likely to be
dynamic in space and time. The assumption is that if a species is recorded on a beach, then that beach
construes suitable habitat. Secondly, the distribution models are largely based on the presence of
individuals, but presence does not imply fitness (or abundance), which may have implications for the
selection of beaches in a conservation planning context. It certainly would not be an optimal strategy to

Chapter 3
93
protect only sink habitat (see Caddy and Defeo, 2003; Celentano et al., 2010) for any of the species. The
only solution to this is to increase the sample size on which the models are based, thereby reducing the
relative importance of any one data point and thus increasing the probability that source (and sink)
habitats are represented. The choice of 10 data points in this study was a pragmatic decision, based on a
trade-off of having sufficient data to generate suitable model outputs, and including as many species as
possible. Mitigating against these shortcomings is the fact that these spatial analyses are easily updated
as more information becomes available. Information about population connectivity is likely to be the key
area where analyses of this nature can be improved, particularly with regards to our understanding of
metapopulation dynamics and hypothesized source-sink dynamics (Caddy and Defeo, 2003; Celentano
et al., 2010). In the interim, invoking the precautionary principle is advocated until beach population
dynamics are better understood.
While the distribution models are good starting points for conservation planning analyses, they are also
neat hypotheses to test. For example, a species’ fundamental distribution could be modelled, and then
that species could be targeted for sampling throughout its predicted range to establish its realized
distribution. The rest of the probabilistically suitable habitat (fundamental distribution) could be flagged
as key habitat that the species could potentially move into. Subsequent investigation could include why
the fundamental distribution is not occupied in entirety, either by a priori factors, such as barriers to
dispersal, or a posteriori factors, such as habitat transformation. Naturally, the next step would be
predictive modelling, to include effects from global change (which could include expansion of coastal
urban development nodes) explicitly in modelling likely distributions under various future scenarios.
In conclusion, sandy beach ecosystems as a whole contain many more species than expected.
Importantly, the species richness tallied in this study is a conservative estimate because there are
several other taxa (e.g., meiofauna and zooplankton) that were not included in the analyses because of
low sampling effort. The level of endemism in macrofauna was also impressive. This high degree of
specialization should be anticipated, to some degree, because beaches are such dynamic, physically-
dominated ecosystems, and species would need to be highly adapted to survive. The corollary, given
these species' additional distinct habitat preferences, is that their habitats are extremely small in an
absolute sense. It is therefore important that efforts are made to ensure the protection of these species,
particularly because they play key ecological roles, e.g., links between marine and terrestrial systems as
prey items to both shorebirds and fish. Also, conservation measures should be implemented quickly
because there are so many threats to sandy shores, and the species of greatest concern (highly endemic,
limited available habitat, and most threatened) on beaches, including vertebrates, macrofauna and
foredune plants, tend to require features associated with the high shore/supralittoral to complete their
life histories, where habitat degradation and risk of loss are greatest. This study has highlighted the
value of representing sandy beach data in a comprehensive, spatial manner and has revealed interesting
biodiversity trends. Sandy beaches truly are unique ecosystems with unique biota, and are thoroughly
deserving of more attention and protection.
Sandy beach biodiversity
94
References
Acker, J.G., Leptoukh, G., 2007. Online analysis enhances use of NASA Earth science data. Eos, Transactions of the American Geophysical Union 88, 14 and 17.
Albuquerque, E.F., Pinto, A.P.B., de Queiroz Perez, A., Veloso, V.G., 2007. Spatial and temporal changes in interstitial meiofauna on a sandy ocean beach of South America. Brazilian Journal of Oceanography 55, 121-131.
Allouche, O., Tsoar, A., Kadmon, R., 2006. Assessing the Accuracy of Species Distribution Models: Prevalence, Kappa and the True Skill Statistic (TSS). Journal of Applied Ecology 43, 1223-1232.
Alves, E.d.S., Pezzuto, P.R., 2009. Effect of cold fronts on the benthic macrofauna of exposed sandy beaches with contrasting morphodynamics. Brazilian Journal of Oceanography 57, 73-94.
Anderson, R.P., Peterson, A.T., Gómez-Laverde, M., 2002. Using niche-based GIS modeling to test geographic predictions of competitive exclusion and competitive release in South American pocket mice. Oikos 98, 3-16.
Appeltans, W., Bouchet, P., Boxshall, G.A., De Broyer, C., de Voogd, N.J., Gordon, D.P., Hoeksema, B.W., Horton, T., Kennedy, M., Mees, J., Poore, G.C.B., Read, G., Stöhr, S., Walter, T.C., Costello, M.J., 2012. World Register of Marine Species. Accessed at http://www.marinespecies.org on 2012-07-19.
Awad, A.A., Griffiths, C.L., Turpie, J.K., 2002. Distribution of South African marine benthic invertebrates applied to the selection of priority conservation areas. Diversity and Distributions 8, 129-145.
Bally, R., 1981. The ecology of three sandy beaches on the west coast of South Africa. PhD thesis. University of Cape Town, South Africa.
Balvanera, P., Pfisterer, A.B., Buchmann, N., He, J.S., Nakashizuka, T., Raffaelli, D., Schmid, B., 2006. Quantifying the evidence for biodiversity effects on ecosystem functioning and services. Ecology Letters 9, 1146-1156.
Banks, S.A., Skilleter, G.A., 2002. Mapping intertidal habitats and an evaluation of their conservation status in Queensland, Australia. Ocean & Coastal Management 45, 485-509.
Banks, S.A., Skilleter, G.A., 2007. The importance of incorporating fine-scale habitat data into the design of an intertidal marine reserve system. Biological Conservation 138, 13-29.
Barbier, E.B., 2010. Poverty, development, and environment. Environment and Development Economics 15, 635-660.
Barbier, E.B., Hacker, S.D., Kennedy, C., Koch, E.W., Stier, A.C., Silliman, B.R., 2011. The value of estuarine and coastal ecosystem services. Ecological Monographs 81, 169-193.
Barboza, F.R., Gómez, J., Lercari, D., Defeo, O., 2012. Disentangling Diversity Patterns in Sandy Beaches along Environmental Gradients. PLoS ONE 7, e40468.
Bate, G.C., Campbell, E.E., 1990. The flora of the sandy beaches of southern Africa. II. The West Coast. Institute for Coastal Research Report No. 25, University of Port Elizabeth, South Africa.
BirdLife International, 2012. Spheniscus demersus. In: IUCN 2012. IUCN Red List of Threatened Species. Version 2012.2. <www.iucnredlist.org>. Downloaded on 15 November 2012.
Bisby, F., Roskov, Y., Culham, A., Orrell, T., Nicolson, D., Paglinawan, L., Bailly, N., Kirk, P., Bourgoin, T., Baillargeon, G., 2012. Species 2000 & ITIS Catalogue of Life, 25th June 2012. Digital resource at www.catalogueoflife.org/col/. Species 2000: Reading, UK.
Bolton, J.J., Stegenga, H., 2002. Seaweed species diversity in South Africa. South African Journal of Marine Science 24, 9-18.
Branch, G.M., Griffiths, C.L., Branch, M.L., Beckley, L.E., 2010. Two Oceans: A guide to the marine life of southern Africa. Struik Nature, Cape Town.
Brazeiro, A., 1999. Community patterns in sandy beaches of Chile: richness, composition, distribution and abundance of species. Revista Chilena De Historia Natural 72, 93-105.
Brown, A., 2000. Is the sandy-beach isopod Tylos granulatus an endangered species? South African Journal of Science 96, 466-473.
Bustamante, R., Branch, G., 1996. Large scale patterns and trophic structure of southern African rocky shores: the roles of geographic variation and wave exposure. Journal of Biogeography 23, 339-351.
Butchart, S.H.M., Walpole, M., Collen, B., van Strien, A., Scharlemann, J.P.W., Almond, R.E.A., Baillie, J.E.M., Bomhard, B., Brown, C., Bruno, J., Carpenter, K.E., Carr, G.M., Chanson, J., Chenery, A.M., Csirke, J., Davidson, N.C., Dentener, F., Foster, M., Galli, A., Galloway, J.N., Genovesi, P., Gregory, R.D., Hockings, M.,
Chapter 3
95
Kapos, V., Lamarque, J.-F., Leverington, F., Loh, J., McGeoch, M.A., McRae, L., Minasyan, A., Morcillo, M.H., Oldfield, T.E.E., Pauly, D., Quader, S., Revenga, C., Sauer, J.R., Skolnik, B., Spear, D., Stanwell-Smith, D., Stuart, S.N., Symes, A., Tierney, M., Tyrrell, T.D., Vié, J.-C., Watson, R., 2010. Global Biodiversity: Indicators of Recent Declines. Science 328, 1164-1168.
Caddy, J.F., Defeo, O., 2003. Enhancing or restoring the productivity of natural populations of shellfish and other marine invertebrate resources. FAO Fisheries Technical Paper, 1-159, IV.
Campbell, E.E., Bate, G.C., 1991a. The flora of the sandy beaches of southern Africa. III. The South Coast microflora. Institute for Coastal Research Report No. 26, University of Port Elizabeth, South Africa.
Campbell, E.E., Bate, G.C., 1991b. The flora of the sandy beaches of southern Africa. IV. The East Coast microflora. Institute for Coastal Research Report No. 28, University of Port Elizabeth, South Africa.
Campbell, E.E., Bate, G.C., 1991c. Ground water in the Alexandria dune field and its potential influence on the adjacent surf zone. Water SA 17, 155-160.
Campbell, E.E., Bate, G.C., 1996. Groundwater as a possible controller of surf diatom biomass. Revista Chilena de Historia Natural 69, 503-510.
Campbell, E.E., Bate, G.C., 1997. Coastal features associated with diatom disoloration of surf-zones. Botanica Marina 40, 179-185.
Canty, A., Ripley, B., 2012. boot: Bootstrap R (S-Plus) Functions. R package version 1.3-7. Celentano, E., Gutiérrez, N., Defeo, O., 2010. Effects of morphodynamic and estuarine gradients on the
demography and distribution of a sandy beach mole crab: implications for source-sink habitat dynamics. Marine Ecology Progress Series 398, 193-205.
Coad, L., Burgess, N.D., Bomhard, B., Besançon, C., 2009. Progress towards the Convention on Biological Diversity’s 2010 and 2012 targets for protected area coverage. Parks: The International Journal for Protected Area Managers 17, 35-72.
Cohen, J., 1960. A coefficient of agreement for nominal scales. Educational and Psychological Measurement 20, 37-46.
Costanza, R., d'Arge, R., de Groot, R., Farber, S., Grasso, M., Hannon, B., Limburg, K., Naeem, S., O'Neill, R.V., Paruelo, J., Raskin, R.G., Sutton, P., van den Belt, M., 1998. The value of the world's ecosystem services and natural capital. Ecological Economics 25, 3-15.
Costanza, R., Fisher, B., Mulder, K., Liu, S., Christopher, T., 2007. Biodiversity and ecosystem services: A multi-scale empirical study of the relationship between species richness and net primary production. Ecological Economics 61, 478-491.
Coupland, G.T., Duarte, C.M., Walker, D.I., 2007. High metabolic rates in beach cast communities. Ecosystems 10, 1341-1350.
Dahl, E., 1952. Some Aspects of the Ecology and Zonation of the Fauna on Sandy Beaches. Oikios 4, 1-27. Davison, A.C., Hinkley, D.V., 1997. Bootstrap Methods and Their Applications. Cambridge University Press,
Cambridge. Day, J.H., 1967a. A Monograph on the Polychaeta of Southern Africa. Part I: Errantia. Trustees of the British
Museum (Natural History), London. Day, J.H., 1967b. A Monograph on the Polychaeta of Southern Africa. Part II: Sedentaria. Trustees of the British
Museum (Natural History), London. Defeo, O., McLachlan, A., 2005. Patterns, processes and regulatory mechanisms in sandy beach macrofauna: a
multi-scale analysis. Marine Ecology-Progress Series 295, 1-20. Deidun, A., Schembri, P.J., 2008. Long or short? Investigating the effect of beach length and other environmental
parameters on macrofaunal assemblages of Maltese pocket beaches. Estuarine, Coastal and Shelf Science 79, 17-23.
Dexter, D.M., 1992. Sandy Beach Community Structure - the Role of Exposure and Latitude. Journal of Biogeography 19, 59-66.
Donn, T., 1987. Longshore distribution of Donax serra in two log-spiral bays in the eastern Cape, South Africa. Marine Ecology Progress Series 35, 217-222.
Driver, A., Sink, K.J., Nel, J.N., Holness, S., Van Niekerk, L., Daniels, F., Jonas, Z., Majiedt, P.A., Harris, L., Maze, K., 2012. National Biodiversity Assessment 2011: An assessment of South Africa’s biodiversity and ecosystems. Synthesis Report. . South African National Biodiversity Institute and Department of Environmental Affairs, Pretoria.

Sandy beach biodiversity
96
Duarte, C.M., 2000. Marine biodiversity and ecosystem services: an elusive link. Journal of Experimental Marine Biology and Ecology 250, 117-131.
Dugan, J., Hubbard, D.M., McCrary, M.D., Pierson, M.O., 2003. The response of macrofauna communities and shorebirds to macrophyte wrack subsidies on exposed sandy beaches of southern California. Estuarine Coastal and Shelf Science 58S, 25-40.
Dugan, J., Hubbard, D.M., Rodil, I.F., Revell, D., Schroeter, S., 2008. Ecological effects of coastal armouring on sandy beaches. Marine Ecology 29, 160-170.
Dugan, J.E., Defeo, O., Jaramillo, E., Jones, A.P., Lastra, M., Nel, R., Peterson, C.H., Scapini, F., Schlacher, T.A., Schoeman, D.S., 2010. Give beach ecosystems their day in the sun. Science 329, 1146.
Dugan, J.E., Hubbard, D.M., Engle, J.M., Martin, D.L., Richards, D.M., Davis, G.E., Lafferty, K.D., Ambrose, R.F., 2000. Macrofauna communities of exposed sandy beaches on the Southern California mainland and Channel Islands, in: Brown, D.R., Mitchell, K.L., Chang, H.W. (Eds.), Fifth California Islands Symposium, OCS Study, MMS 99-0038, pp. 339-346.
Dugan, J.E., Jaramillo, E., Hubbard, D.M., Contreras, H., Duarte, C., 2004. Competitive interactions in macroinfaunal animals of exposed sandy beaches. Oecologia 139, 630-640.
Dye, A.H., McLachlan, A., Wooldridge, T., 1981. The ecology of sandy beaches in Natal. South African Journal of Zoology 16, 200-209.
Elith, J., Leathwick, J., 2009. Conservation Prioritization Using Species Distribution Modelling, in: Moilanen, A., Wilson, K.A., Possingham, H.P. (Eds.), Spatial Conservation Prioritization: Quantitative Methods and Computational Tools. Oxford University Press, Oxford, UK.
Elith, J., Phillips, S.J., Hastie, T., Dudík, M., Chee, Y.E., Yates, C.J., 2011. A statistical explanation of MaxEnt for ecologists. Diversity and Distributions 17, 43-57.
Elmqvist, T., Folke, C., Nyström, M., Peterson, G., Bengtsson, J., Walker, B., Norberg, J., 2003. Response diversity, ecosystem change, and resilience. Frontiers in Ecology and the Environment 1, 488-494.
Elton, C., 1927. Animal Ecology. Sidgwick & Jackson, London. Emanuel, B.P., Bustamante, R.H., Branch, G.M., Eekhout, S., Odendaal, F.J., 1992. A zoogeographic and functional
approach to the selection of marine reserves on the west coast of South Africa. South African Journal of Marine Science 12, 341 - 354.
Fielding, A.H., Bell, J.F., 1997. A review of methods for the assessment of prediction errors in conservation presence/absence models. Environmental Conservation 24, 38-49.
Freeman, E.A., 2012. PresenceAbsence: Presence-Absence Model Evaluation. R package version 1.1.9. Freeman, E.A., Moisen, G., 2008. PresenceAbsence: An R Package for Presence-Absence Model Analysis. Journal of
Statistical Software 23, 1-31. Gladstone, W., Alexander, T., 2005. A Test of the Higher-Taxon Approach in the Identification of Candidate Sites for
Marine Reserves. Biodiversity and Conservation 14, 3151-3168. Govender, N., 2009. Aspects of the ecology of sandy beaches along Durban’s urbanized coastline. MSc dissertation.
University of KwaZulu-Natal, South Africa. Griffiths, C.L., 1976. Guide to the benthic marine amphipods of Southern Africa. Trustees of the South African
Museum, Cape Town. Griffiths, C.L., Robinson, T.B., Lange, L., Mead, A., 2010. Marine Biodiversity in South Africa: An Evaluation of
Current States of Knowledge. PLoS ONE 5, e12008. Grinnell, J., 1917. The niche-relationships of the California Thrasher. The Auk 34, 427-433. Guiry, M.D., Guiry, G.M., 2012. AlgaeBase. World-wide electronic publication, National University of Ireland,
Galway. http://www.algaebase.org; searched 9-13 July 2012. Harris, L.R., 2008. The ecological implications of sea-level rise and storms for sandy beaches in KwaZulu-Natal. MSc
dissertation. University of KwaZulu-Natal, South Africa. Harris, L.R., 2010. The impact of beach driving on macrofauna communities: northern KwaZulu-Natal. Unpublished
contract report for Ezemvelo KwaZulu-Natal Wildlife. Nelson Mandela Metropolitan University, Port Elizabeth.
Harris, L.R., Bezuidenhout, K., 2011. The impact of beach driving on macrofauna communities: northern KwaZulu-Natal. Unpublished contract report for Ezemvelo KwaZulu-Natal Wildlife. Nelson Mandela Metropolitan University, Port Elizabeth.

Chapter 3
97
Harris, L.R., Nel, R., Campbell, E.E., 2010. Report to SANBI for the Marine Component of the National Biodiversity Assessment 2011: National Beach Classification and Mapping. Integrated Environmental and Coastal Management Unit, Nelson Mandela Metropolitan University, Port Elizabeth.
Harris, L.R., Nel, R., Schoeman, D.S., 2011a. Mapping beach morphodynamics remotely: A novel application tested on South African sandy shores. Estuarine Coastal and Shelf Science 92, 78-89.
Harris, L.R., Nel, R., Smale, M., Schoeman, D.S., 2011b. Swashed away? Storm impacts to sandy beach macrofaunal communities at Sardinia Bay, South Africa. Estuarine Coastal and Shelf Science 94, 210-221.
Hockey, P.A.R., Siegfried, W.R., Crowe, A.A., 1983. Ecological structure and energy requirements of the sandy beach avifauna of southern Africa, in: McLachlan, A., Erasmus, T. (Eds.), Sandy beaches as ecosystems. Dr W Junk, The Hague, pp. 501-506.
Hutchings, K., Clark, B., 2010. Marine ecology monitoring report for the reverse osmosis desalination plant at Myoli beach, Sedgefield. Unpublished contract report for Cape Environmental Assessment Practitioners. Anchor Environmental, Cape Town.
Hutchinson, G.E., 1957. Concluding Remarks. Cold Spring Harbor Symposia on Quantitative Biology 22, 415-427. Ieno, E.N., Solan, M., Batty, P., Pierce, G.J., 2006. How biodiversity affects ecosystem functioning: roles of infaunal
species richness, identity and density in the marine benthos. Marine Ecology Progress Series 311, 263-271.
IOC (Intergovernmental Oceanographic Commission IOC of UNESCO), 2012. The Ocean Biogeographic Information System. Available at: http://www.iobis.org. (Consulted on 16-18/07/2012).
IUCN, 2012. IUCN Red List of Threatened Species. Version 2012.2. <www.iucnredlist.org>. Downloaded on 15 November 2012.
Jaramillo, E., Crocker, R.A., Hatfield, E.B., 1987. Long-term structure, disturbance, and recolonization of macroinfauna in a New Hampshire sand beach. Canadian Journal of Zoology 65, 3024-3031.
Jaramillo, E., Dugan, J.E., Hubbard, D.M., Melnick, D., Manzano, M., Duarte, C., Campos, C., Sanchez, R., 2012. Ecological Implications of Extreme Events: Footprints of the 2010 Earthquake along the Chilean Coast. PLoS ONE 7, e35348.
Jaramillo, E., Stead, R., Quijon, P., Gonzalez, M., 1996. Temporal variability of the sand beach macroinfauna in south-central Chile. Revista Chilena de Historia Natural 69, 641-653.
Kensley, B., 1978. Guide to the Marine Isopods of Southern Africa. Trustees of the South African Museum, Cape Town.
Kensley, B., 1981. On the Zoogeography of Southern African Decapod Crustaceans, with a Distributional Checklist of the Species, Smithsonian Contributions to Zoology Number 338. Smithsonian Institution Press, City of Washington.
Kirkman, S.P., 2010. The Cape Fur Seal: Monitoring and Management in the Benguela Current Ecosystem. PhD thesis. University of Cape Town, South Africa.
Kirkman, S.P., Yemane, D., Oosthuizen, W.H., Meÿer, M.A., Kotze, P.G.H., Skrypzeck, H., Vaz Velho, F., Underhill, L.G., 2012. Spatio-temporal shifts of the dynamic Cape fur seal population in southern Africa, based on aerial censuses (1972–2009). Marine Mammal Science doi: 10.1111/j.1748-7692.2012.00584.x.
Koop, K., Griffiths, C., 1982. The relative significance of bacteria, meio- and macrofauna on an exposed sandy beach. Marine Biology 66, 295-300.
Kotwicki, L., Szymelfenig, M., De Troch, M., Urban-Malinga, B., Węsławski, J., 2005. Latitudinal biodiversity patterns of meiofauna from sandy littoral beaches. Biodiversity and Conservation 14, 461-474.
Landis, J.R., Koch, G.G., 1977. The Measurement of Observer Agreement for Categorical Data. Biometrics 33, 159-174.
Lercari, D., Defeo, O., 2006. Large-scale diversity and abundance trends in sandy beach macrofauna along full gradients of salinity and morphodynamics. Estuarine Coastal and Shelf Science 68, 27-35.
Lombard, A.T., Strauss, T., Harris, J., Sink, K., Attwood, C., Hiutchings, L., 2004. South African National Spatial Biodiversity Asssessment 2004: Technical Report. South African National Biodiversity Insitute, Pretoria.
Manel, S., Williams, H.C., Ormerod, S.J., 2001. Evaluating Presence-Absence Models in Ecology: The Need to Account for Prevalence. Journal of Applied Ecology 38, 921-931.
Mann, D., Droop, S., 1996. 3. Biodiversity, biogeography and conservation of diatoms. Hydrobiologia 336, 19-32. McGwynne, L., 1986. Sandy beaches of Maputaland - Ecology, Conservation & Management. Report Number 16.
Institute for Coastal Research, University of Port Elizabeth, Port Elizabeth.

Sandy beach biodiversity
98
McLachlan, A., 1980. Occurrence of ghost crabs, Ocypode spp., in the eastern Cape. South African Journal of Zoology 15, 57-58.
McLachlan, A., 1984. The ecology of sandy beaches in the East London area, in: Wooldridge, T. (Ed.), East London Programme: Final Report. Report Number 7. Institute for Coastal Research, University of Port Elizabeth, Port Elizabeth, pp. 99-117.
McLachlan, A., Brown, A.C., 2006. The ecology of sandy shores. Academic Press, Burlington, MA, USA. McLachlan, A., Dorvlo, A., 2005. Global patterns in sandy beach macrobenthic communities. Journal of Coastal
Research 21, 674-687. McLachlan, A., Dorvlo, A., 2007. Global patterns in sandy beach macrobenthic communities: Biological factors.
Journal of Coastal Research 23, 1081-1087. McLachlan, A., Jaramillo, E., 1995. Zonation on sandy beaches. Oceanography and Marine Biology, an Annual
Review 33, 305-335. McLachlan, A., Jaramillo, E., Donn, T., Wessels, F., 1993. Sandy beach macrofauna communities and their control
by the physical environment: a geographical comparison. Journal of Coastal Research, Special Issue 15, 27-38.
McLachlan, A., Wooldridge, T., Dye, A.H., 1981. The ecology of sandy beaches in southern Africa. South African Journal of Zoology 16, 219-231.
McPherson, J.M., Jetz, W., Rogers, D.J., 2004. The Effects of Species' Range Sizes on the Accuracy of Distribution Models: Ecological Phenomenon or Statistical Artefact? Journal of Applied Ecology 41, 811-823.
Millennium Ecosystem Assessment, 2005. Ecosystems and Human Well-Being: Synthesis. Island Press, Washington, DC.
Mucina, L., Adams, J.B., Knevel, I.C., Rutherford, M.C., Powrie, L.W., Bolton, J.J., van der Merwe, J.H., Anderson, R.J., Bornman, T.G., le Roux, A., Janssen, J.A.M., 2006. Coastal Vegetation of South Africa, in: Mucina, L., Rutherford, M.C. (Eds.), The Vegetation of South Africa, Lesotho and Swaziland. Strelitzia 19. South African National Biodiversity Institute, Pretoria, pp. 659-696.
Mucina, L., Rutherford, M.C., 2006. The Vegetation of South Africa, Lesotho and Swaziland. Strelitzia 19. South African National Biodiversity Institute, Pretoria. (Reprinted in 2011).
NASA GES DISC, 2012. Analyses and visualizations used in this paper were produced with the Giovanni online data system, developed and maintained by the NASA GES DISC. Accessed from: http://disc.sci.gsfc.nasa.gov.
Nel, P., 2002. Physical and biological factors structuring sandy beach macrofauna communities. PhD thesis. University of Cape Town, South Africa.
Nel, R., Bezuidenhout, K., 2008. Ecological effects of off-road vehicle driving (for boat launching) on macroinfauna of sandy beaches of northern Kwazulu-Natal. Unpublished Report for EKZNW. Nelson Mandela Metropolitan University, Port Elizabeth.
Nel, R., Pulfrich, A., 2002. An assessment of the impacts of diamond mining operations on beach macrofaunal communities between the Sout River and Olifants River mouth. PICES Environmental Services, Cape Town, p. 38.
Nel, R., Pulfrich, A., Penney, A.J., 2003. Impacts of Beach Mining Operations on Sandy Beach Macrofaunal Communities on the Beaches of Geelwal Karoo. Report to Trans Hex Operations (Pty) Ltd. Pisces Environmental Services (Pty) Ltd., Cape Town.
Nel, R., Punt, A.E., Hughes, G.R., in review. Are coastal Marine Protected Areas always successful in achieving population recovery for nesting sea turtles? PLoS ONE.
Oksanen, J., Blanchet, F.G., Kindt, R., Legendre, P., Minchin, P.R., O'Hara, R.G., Simpson, G.L., Solymos, P., Stevens, M.H.H., Wagner, H., 2012. vegan: Community Ecology Package. R package version 2.0-4. http://CRAN.R-project.org/package=vegan.
Ortega Cisneros, K., Smit, A.J., Laudien, J., Schoeman, D.S., 2011. Complex, dynamic combination of physical, chemical and nutritional variables controls spatio-temporal variation of sandy beach community structure. PLoS ONE 6, e23724.
Palumbi, S.R., Sandifer, P.A., Allan, J.D., Beck, M.W., Fautin, D.G., Fogarty, M.J., Halpern, B.S., Incze, L.S., Leong, J.A., Norse, E., 2009. Managing for ocean biodiversity to sustain marine ecosystem services. Frontiers in Ecology and the Environment 7, 204-211.
Phillips, S.J., 2006. A brief tutorial on Maxent. AT & T Research. Available at: http://www.cs.princeton.edu/~schapire/maxent/tutorial/tutorial.doc. Accessed 6 October 2011.
Chapter 3
99
Phillips, S.J., Anderson, R.P., Schapire, R.E., 2006. Maximum entropy modeling of species geographic distributions. Ecological Modelling 190, 231-259.
Phillips, S.J., Dudík, M., 2008. Modeling of species distributions with Maxent: new extensions and a comprehensive evaluation. Ecography 31, 161-175.
Phillips, S.J., Dudík, M., Schapire, R.E., 2004. A maximum entropy approach to species distribution modeling. Proceedings of the Twenty-first International Conference on Machine Learning, 655-662.
Pimm, S.L., Russell, G.J., Gittleman, J.L., Brooks, T.M., 1995. The future of biodiversity. Science 269, 347-350. Pressey, R.L., 2004. Conservation Planning and Biodiversity: Assembling the Best Data for the Job. Conservation
Biology 18, 1677-1681. Procheş, Ş., Marshall, D.J., 2002. Diversity and biogeography of southern African intertidal Acari. Journal of
Biogeography 29, 1201-1215. Pulfrich, A., Nel, R., Penney, A.J., 2004. Impacts of Beach Mining Operations on Sandy Beach Macrofaunal
Communities on the Beaches of Geelwal Karoo: 2004 Beach Survey. Report to Trans Hex Operations (Pty) Ltd. Pisces Environmental Services (Pty) Ltd., Cape Town.
R Development Core Team, 2012. R: A language and environment for statistical computing. R Foundation for Statistical Computing, Vienna, Austria. ISBN 3-900051-07-0. URL http://www.R-project.org/.
Rencher, A.C., 1995. Methods of Multivariate Analysis. Wiley, New York, USA. Rodil, I.F., Lastra, M., Sanchez-Mata, A.G., 2006. Community structure and intertidal zonation of the macroinfauna
in intermediate sandy beaches in temperatue latitudes: North coast of Spain. Estuarine Coastal and Shelf Science 67, 267-279.
Rouault, M., Penven, P., Pohl, B., 2009. Warming in the Agulhas Current system since the 1980's. Geophysical Research Letters 36, L12602.
Salvat, B., 1964. Les conditions hydrodynamiques interstitielles de sediments meubles intertidaux et la rapartition verticale de la fauna endogee. C.R.Academic Sciences Paris 259, 1576-1579.
Schlacher, T.A., Schoeman, D.S., Dugan, J., Lastra, M., Jones, A., Scapini, F., McLachlan, A., 2008. Sandy beach ecosystems: key features, sampling issues, management challenges and climate change impacts. Marine Ecology 29, 70-90.
Schoeman, D.S., Richardson, A.J., 2002. Investigating biotic and abiotic factors affecting the recruitment of an intertidal clam on an exposed sandy beach using a generalized additive model. Journal of Experimental Marine Biology and Ecology 276, 67-81.
Schoeman, D.S., Wheeler, M., Wait, M., 2003. The relative accuracy of standard estimators for macrofaunal abundance and species richness derived from selected intertidal transect designs used to sample exposed sandy beaches. Estuarine, Coastal and Shelf Science 58, 5-16.
Scott, R.J., Griffiths, C.L., Robinson, T.B., 2012. Patterns of endemicity and range restriction among southern African coastal marine invertebrates. African Journal of Marine Science 34, 341-347.
Shokri, M., Gladstone, W., 2012. Limitations of habitats as biodiversity surrogates for conservation planning in estuaries. Environmental Monitoring and Assessment, 1-16.
Short, A.D., 1996. The role of wave height, period, slope, tide range and embaymentisation in beach classifications: a review. Revista Chilena de Historia Natural 69, 589-604.
Short, A.D., 2006. Australian beach systems - nature and distribution. Journal of Coastal Research 22, 11-27. Sing, T., Sander, O., Beerenwinkel, N., Lengauer, T., 2005. ROCR: visualizing classifier performance in R.
Bioinformatics 21, 3940-3941. Sing, T., Sander, O., Beerenwinkel, N., Lengauer, T., 2009. ROCR: Visualizing the performance of scoring classifiers.
R package version 1.0-4. http://rocr.bioinf.mpi-sb.mpg.de/ Sink, K., Holness, S., Harris, L., Majiedt, P., Atkinson, L., Robinson, T., Kirkman, S., Hutchings, L., Leslie, R., Lamberth,
S., Kerwath, S., von der Heyden, S., Lombard, A., Attwood, C., Branch, G., Fairweather, T., Taljaard, S., Weerts, S., Cowley, P., Awad, A., Halpern, B., Grantham, H., Wolf, T., 2012. National Biodiversity Assessment 2011: Technical Report. Volume 4: Marine and Coastal Component. South African National Biodiversity Institute, Pretoria.
Soares, A.G., 2003. Sandy beach morphodynamics and macrobenthic comminities in temperate, subtropical and tropical regions - a macroecological approach. PhD thesis. University of Port Elizabeth, South Africa.
Spalding, M.D., Fish, L., Wood, L.J., 2008. Toward representative protection of the world's coasts and oceans - progress, gaps, and opportunities. Conservation Letters 1, 217-226.
Sandy beach biodiversity
100
Stenton-Dozey, J., 1983. Stranded kelp - its fauna and influence on sandy beach energetics. MSc dissertation. University of Cape Town, South Africa.
Stephenson, T.A., Stephenson, A., 1972. Life between tidemarks on rocky shores. W.H. Freeman, San Francisco. Tamaki, A., 1987. Comparison of resistivity to transport by wave action in several polychaete species on an
intertidal sand flat. Marine Ecology Progress Series 37, 181-189. Teske, P.R., von der Heyden, S., McQuaid, C.D., Barker, N.P., 2011. A review of marine phylogeography in southern
Africa. South African Journal of Science 107, 43-53. Tinley, K.L., 1985. Coastal Dunes of South Africa. A report for the Committee for Nature Conservation Research,
National Programme for Ecosystem Research, South African National Scientific Programmes Report No 109. CSIR, Pretoria.
Turner, W.R., Brandon, K., Brooks, T.M., Gascon, C., Gibbs, H.K., Lawrence, K.S., Mittermeier, R.A., Selig, E.R., 2012. Global biodiversity conservation and the alleviation of poverty. BioScience 62, 85-92.
Turpie, J.K., Beckley, L.E., Katua, S.M., 2000. Biogeography and the selection of priority areas for conservation of South African coastal fishes. Biological Conservation 92, 59-72.
UNCED, 1992. The Convention on Biological Diversity. United Nations Conference on Environment and Development, Rio.
UNEP, 2011. Towards a Green Economy: Pathways to Sustainable Development and Poverty Eradication - A Synthesis for Policy Makers, www.unep.org/greeneconomy.
Van Tomme, J., Van Colen, C., Degraer, S., Vincx, M., 2012. Encounter competition partly explains the segregation of the sandy beach amphipods Bathyporeia pilosa and Bathyporeia sarsi. A mesocosm experiment. Journal of Experimental Marine Biology and Ecology 438, 118-124.
Vanormelingen, P., Verleyen, E., Vyverman, W., 2008. The diversity and distribution of diatoms: from cosmopolitanism to narrow endemism. Biodiversity and Conservation 17, 393-405.
Wallace, B.P., DiMatteo, A.D., Hurley, B.J., Finkbeiner, E.M., Bolten, A.B., Chaloupka, M.Y., Hutchinson, B.J., Abreu-Grobois, F.A., Amorocho, D., Bjorndal, K.A., 2010. Regional management units for marine turtles: a novel framework for prioritizing conservation and research across multiple scales. PLoS ONE 5, e15465.
Wendt, G.E., McLachlan, A., 1985. Zonation and biomass of the intertidal macrofauna along a South African sandy beach. Cahiers de Biologie Marine 26, 1-14.
Wilson, K.A., Westphal, M.I., Possingham, H.P., Elith, J., 2005. Sensitivity of conservation planning to different approaches to using predicted species distribution data. Biological Conservation 122, 99-112.
Wisz, M.S., Hijmans, R., Li, J., Peterson, A.T., Graham, C., Guisan, A., 2008. Effects of sample size on the performance of species distribution models. Diversity and Distributions 14, 763-773.
Wolmarans, K., 2012. The influence of nutrients on surf-zone phytoplankton dynamics MSc Dissertation. Nelson Mandela Metropolitan University, South Africa.
Wooldridge, T., 1988. Proposed marina development in the Southwest sector of Plettenberg Bay - An ecological assessment. Report number 18. Institute for Coastal Research, University of Port Elizabeth, Port Elizabeth.
Wooldridge, T., Dye, A.H., McLachlan, A., 1981. The ecology of sandy beaches in Transkei. South African Journal of Zoology 16, 210-217.
Worm, B., Barbier, E.B., Beaumont, N., Duffy, J.E., Folke, C., Halpern, B.S., Jackson, J.B.C., Lotze, H.K., Micheli, F., Palumbi, S.R., 2006. Impacts of biodiversity loss on ocean ecosystem services. Science 314, 787-790.