Embed Size (px)
Citation preview
i
An Economic Analysis of Grain Legumes Utilization and Gross
Margins in Nandi County, Kenya
MERCY ANYANGO ONYANGO
A THESIS SUBMITTED IN PARTIAL FULFILLMENT OF THE REQUIREMENTS
FOR THE AWARD OF THE DEGREE OF MASTER OF SCIENCE IN
AGRICULTURAL AND APPLIED ECONOMICS
UNIVERSITY OF NAIROBI
DECEMBER 2017
ii
Declaration and Approval
I, Mercy Anyango Onyango hereby declare that this thesis is my original work and has not been
presented to any other university for any award.
Reg. No. A56/69522/2013
Signature: -------------------------------------
Date: -------------------------------------
Approval
This work has been submitted with our approval as University supervisors.
Dr. David Jakinda Otieno
Department of Agricultural Economics, University of Nairobi
Signature: --------------------------------------
Date: -------------------------------------
Prof. Rose Adhiambo Nyikal
Department of Agricultural Economics, University of Nairobi
Signature: -------------------------------------
Date: -------------------------------------
Dr. John Ojiem
Kenya Agricultural and Livestock Research Organization (KALRO)-Kibos Kisumu
Signature: -------------------------------------
Date: -------------------------------------

iii
Dedication
This thesis is dedicated to my mum Margaret Onyango for her love and moral support. I thank
her immeasurably.
iv
Acknowledgement
First and foremost, I thank Almighty God for granting me the energy and good health through
my entire study period. Glory to Him!
I wish to acknowledge the African Economic Research Consortium (AERC) for funding my
studies and research. Special thanks to Dr. John Ojiem, the Centre Director of the Kenya
Agricultural and Livestock Research Organization (KALRO), Kibos for providing additional
funding for my research through the McKnight Foundation-supported Multipurpose Legume
Project (MLP) in Kenya.
Also, special thanks to my supervisors; Dr. David Jakinda and Prof. Rose Nyikal for their
support and effort in bringing the best out of what I learnt in class and their guidance in research.
The precious time they spent reading and providing valuable insights to this work was of great
importance in completing this thesis. I also appreciate my classmates and colleagues for their
positive criticisms. Lastly, I would like to thank all respondents to my field survey and all those
who assisted in its success.
v
Abstract
Grain legumes have great potential for improving smallholder farmers’ productivity in Sub-
Saharan Africa (SSA). However, this has not been fully exploited due to critical problems such
as high insect pests and disease infestation. As part of addressing these challenges, Kenya
Agricultural and Livestock Research Organization (KALRO) in collaboration with Cornell
University and supported by the Collaborative Crop Research Program (CCRP) introduced crop
and soil enhancing strategies in Western Kenya. One of the strategies included use of
multipurpose grain legumes species in Nandi County. Through this initiative, various legume
species including common bean, cowpea, groundnuts, dolichos lablab and soybean are being
promoted at the farm level. However, the extent of their utilization and the actual benefit is not
known precisely as it is not comprehensively documented. Furthermore, no empirical study has
delved in the assessment of the economic benefits that farmers are likely to obtain if they adopt
the legume species. In order to address the aforementioned knowledge gaps, the present study
sought to analyze utilization and evaluate gross margins of grain legumes. Data was collected
from a random sample of 163 farmers from three study sites in Nandi County (Koibem, Kapkerer
and Kiptaruswo sites). Descriptive statistics on frequencies and percentages on utilization and
legume attributes were presented in graphs and tables. Further, gross margins were computed
from farm-level data while multiple regression model was applied to determine factors
influencing the gross margins obtained. Results showed that farmers’ priorities for use of legume
included; food dishes, income generation, forage and soil fertility improvement. This indicates
that farmers value legumes for home consumption purposes and also for income. Descriptive
statistics revealed that about 56 percent of the households had positive gross margins while the
rest incured losses in the production of grain. Further, beans, groundnuts, cowpeas and soybean
had positive gross margins while dolichos lablab gross margin was negative. This indicates that
vi
generally legumes farming is feasible. Groundnuts and beans accounted for about 49 percent and
36 percent, respectively of the total legume gross margins. Farm labour cost was the largest
component of cost, accounting for about 68 percent of the total variable production cost of
legumes. An analysis of variance (ANOVA) showed that there was no statistical difference at 95
percent in the mean gross margins for the legumes studied. Further, the multiple regressions
indicated that area under grain legumes, age of the farmer, access to extension services and
access to credit had significant influence on gross margin. As such, different interventions are
needed so as to promote the production and diversify utilization patterns of the legumes. For
instance, interventions geared towards increasing diversification of utilization of legumes
through processing and value addition by for instance processor village groups for soybean or
any other legume through provision of processing equipment and training on the usage by the
project is necessary. Also, there is need to minimize labour cost for instance through provision of
seeds with less labour requirements to farmers. Further, there is the need for appraisals of
extension services in order to improve the delivery to farmers. Similarly, policies and
interventions which can promote credit access would enhance gains from legumes.
Key words: Legumes, utilization, gross margins, Kenya.
vii
Table of Contents
Declaration and Approval ............................................................................................................... ii
Approval ......................................................................................................................................... ii
Dedication ...................................................................................................................................... iii
Acknowledgement ......................................................................................................................... iv
Abstract ........................................................................................................................................... v
List of Tables ................................................................................................................................. ix
List of Figures ................................................................................................................................ ix
List of Acronyms ............................................................................................................................ x
CHAPTER ONE ............................................................................................................................. 1
INTRODUCTION .......................................................................................................................... 1
1.1 Background to Legume Diversity and Livelihoods .............................................................. 1
1.2 Opportunities for Boosting Grain Legume Production in Kenya ......................................... 2
1.3 Statement of the Research Problem ...................................................................................... 3
1.4 Objectives of the Study ......................................................................................................... 4
1.5 Justification of the Study ....................................................................................................... 4
1.6 Study Area ............................................................................................................................. 5
1.7 Thesis Outline ....................................................................................................................... 6
CHAPTER TWO ............................................................................................................................ 8
LITERATURE REVIEW ............................................................................................................... 8
2.1 A Review of Insights on Legume Utilization and Diversification ........................................ 8
2.2 A Review of Knowledge Gaps on Legumes ....................................................................... 10
2.3. Methods Used in Economic Returns Analysis ................................................................... 12
CHAPTER THREE ...................................................................................................................... 14
METHODOLOGY ....................................................................................................................... 14
3.1 Conceptual Framework ....................................................................................................... 14
3.2 Theoretical framework ........................................................................................................ 15
3.3 Sampling and Data Collection............................................................................................. 17
3.4 Empirical Data Analysis ..................................................................................................... 18
3.4.1 Calculation of Gross Margins ....................................................................................... 18
3.4.2 Diagnostic Tests ........................................................................................................... 22
CHAPTER FOUR ......................................................................................................................... 25
RESULTS AND DISCUSSIONS ................................................................................................. 25
4.1. Sample Farmers’ Socio-Economic Characteristics ............................................................ 25
4.2. Patterns of Utilization of the Grain Legumes..................................................................... 30
4.3 Analysis of Gross Margins from Various Legumes ............................................................ 33
4.4 Determinants of Gross Margins of Grain Legumes ............................................................ 39
viii
CHAPTER FIVE .......................................................................................................................... 41
SUMMARY, CONCLUSIONS AND POLICY RECOMMENDATIONS ................................. 41
5.1 Summary ............................................................................................................................. 41
5.2 Conclusions and Policy Recommendations ........................................................................ 43
5.3 Contributions to Knowledge ............................................................................................... 45
5.4 Suggestions for Further Research ....................................................................................... 46
REFERENCES ............................................................................................................................. 47
APPENDICES .............................................................................................................................. 57
Appendix 1: Checklist for conducting Focus Group Discussions............................................. 57
Appendix 2: Survey Questionnaire Used for Data Collection .................................................. 59
ix
List of Tables
Table 1: Test for Multicollinearity ................................................................................................ 23
Table 2: Sample Characteristics for Grain Legume Farmers in Nandi County, Kenya ............... 25
Table 3: Percentage of Farmers Ranking Legume Species .......................................................... 32
Table 4: Summary of Preferred Characteristics for Each Legume (Percentage of farmers) ........ 32
Table 5: Costs and Returns Analysis per acre from the Grain Legumes ...................................... 35
Table 6: Comparison of Gross Margins from Various Legumes (in ‘0000 Kshs)........................ 36
Table 7: Determinants of Gross Margins of Grain Legumes in Nandi County ............................ 39
List of Figures
Figure 1: Map of Nandi County ...................................................................................................... 6
Figure 2: Profitability Conceptual Analysis ................................................................................. 15
Figure 3: Distribution of the Error Term ...................................................................................... 24
Figure 4 : Use of Proceeds from Grain Legume Sales .................................................................. 28
Figure 5 : Reasons for Group Membership.................................................................................. 29
Figure 6: Main Patterns of Utilization of Legumes Grown .......................................................... 30
Figure 7: Comparison of Legume Annual Gross Margins Analysis in Kenya shillings/acre ....... 33
Figure 8: Percentage Returns and Costs Disaggregated by Gender. ............................................ 38
x
List of Acronyms
ANOVA Analysis of Variance
ASDS Agricultural Sector Development Strategy (Kenya)
CAPI Canadian Agri-Food Policy Institute
CBA Cost Benefit Analysis
CCRP Collaborative Crop Research Program
CIAT Centro Internacional de agricultura tropical (International Centre for Tropical
Agriculture)
FAO Food and Agriculture Organization of the United Nations
FGD Focus Group Discussion
GDP Gross Domestic Product
GM Gross Margin
ICRISAT International Crops Research Institute for the Semi-Arid Tropics
IITA International Institute of Tropical Agriculture
IRR Internal Rate of Return
KALRO Kenya Agricultural and Livestock Research Organization
OLS Ordinary Least Squares
MLP Multi-purpose Legume Project
SPSS Statistical Package for Social Sciences
SSA Sub-Saharan Africa
1
CHAPTER ONE
INTRODUCTION
1.1 Background to Legume Diversity and Livelihoods
Grain legumes are not only a source of protein and other minerals but are also considered to play
important roles in the nutritional and health of many rural smallholder farmers in Sub Saharan
Africa (SSA). They form a major diet for the rural households who cannot afford the relatively
more expensive animal proteins. In addition, because of the health risk of consuming some or
excess animal proteins, the demand for legume-based products is expected to increase
(Daryanto et al., 2015). Legumes are multipurpose crops and are consumed either directly as
food or in various processed forms or used as feed in many animal farming systems (Gowda et
al., 1997).
According to Mafongoya et al. (2006), the main challenge to improving agricultural productivity
is building and maintaining soil fertility. Farmers are faced with many challenges such as
limited resources and inadequate skills that negatively affect agricultural productivity. Grain
legumes have the potential to improve soil fertility and often they are intercropped with cereals,
mostly maize. By improving soil fertility through biological nutrient fixation, legumes also play
an important role in conservation agriculture by reducing amount of chemical fertilizer used. For
instance results by Ojiem et al., (2006) indicated that Lablab purpureus produced high grain
yield on small holder farms in Western Kenya while significantly improving soil nitrogen
fertility i.e.net soil input 42 – 131 kg N/ha.
However, legume production in SSA (Kenya included) is very low due to poor soil fertility, and
incidences of pest and diseases, (Odendo et al. 2006). Kosura (2013) states that the yields of
grain legumes in much of Africa are low (typically less than 1 ton per hectare) despite their
2
economic and food security importance. Even with their importance many studies observe a
yield gap. Mutegi and Zingore (2014) state that the average grain legume yields have stagnated
to about 0.7 tons per hectare against a potential of 3 tons per hectare, resulting into increased
food insecurity in most parts of SSA.
Kenya has a rich diversity of grain legumes. Common bean is the most important species with
over 100 cultivars having been identified in the country (Wambugu and Muthamia, 2009).
Groundnuts are mostly grown in western Kenya while soya bean (Glycine max) is grown only on
a very limited scale. Farmers’ choices to grow grain legumes are influenced by socio-economic
and biophysical factors. This is because smallholder systems differ in terms of rainfall,
temperature, soil fertility, pests and diseases, land and labor availability, income, market
availability, and farmer preferences (Ojiem et al., 2006). The various production enhancing
options availed by incorporating multipurpose grain legumes into the farming systems, must
therefore be well adapted to specific contexts.
1.2 Opportunities for Boosting Grain Legume Production in Kenya
Grain legumes have the economic importance in the provision of food to humans and at the same
time are used as feeds for animals. They have high calorie and protein content. Grain legumes
are the most important source of proteins especially in the developing countries because they are
relatively inexpensive compared to other sources of protein. In the urban Kenya, many people
rely on protein from animal products, but which is relatively more expensive than protein from
plant sources.
According to Eskola (2005) grain legumes contain as much protein as animal sources and are
therefore the most practical means of reducing protein malnutrition. Increase in population in
3
western Kenya has decreased land sizes leading to intensive cultivation of the available crop land
without replacing nutrients taken up by the crop. This has resulted into degraded soils and low
crop yield (Onyango, 2010). Similarly a study by Conelly and Chaiken (2000) in western Kenya
found that intense population pressure resulted in small land holdings, and that diet quality and
food security were at a risk. It is in this regard that the Multipurpose Legume Project (MLP)
initiated by KALRO in 2008 introduced promising grain legumes of diverse varieties including
beans, groundnuts, lablab, cowpea and soybean that to address assortments of farmers’ needs.
These legumes have been used as an entry point to improve productivity, food security in terms
of nutrition and availability aspect and income for the smallholder farmers in Nandi County.
Economic evaluation of a technology is necessary as it is an important dimension on the
sustainability of a given technology.
1.3 Statement of the Research Problem
Grain legumes play important roles in smallholder farmers’ livelihood. From a producer’s point
of view, integration of legumes in the farm enhances soil fertility and broadens the amount and
stability of household income streams (Mhango, 2011). To consumers, legumes are considered to
be among the least expensive sources of protein in a vegetarian’s diet and supplement mineral
and vitamin requirements (Joshi et al., 2000). Some of the challenges towards optimum benefits
from grain legumes include inadequate access to farm support services and insufficient attention
by researchers to multi-functionality of legumes (Kerr et al., 2007).
For initiatives such MLP to succeed, the beneficiaries must fully contextualize the technologies
within their farming systems and resource limits, and accept and own them, especially when they
are introduced by external organizations. However, ever since the introduction of these legume
4
varieties, their utilization and respective benefits are not yet adequately established; no study has
been done to assess their gross margins and the extent to which farmers are utilizing them.
1.4 Objectives of the Study
The purpose of this study was to assess the utilization and the contribution of grain legume
species in smallholder farming systems in Nandi County. The specific objectives were to:
1. Characterize the utilization of the grain legumes
2. Analyze the gross margins of the grain legumes
3. Assess factors influencing the gross margins of the respective grain legumes
1.5 Justification of the Study
The United Nations (UN) Sustainable Development Goals (SDGs) numbers one and two aim at
reducing poverty and hunger to zero levels by 2030. Even though production of grain legumes
has not been mentioned as one of the targets in achieving the goals, adoption of the improved
varieties of grain legume species by smallholder farmers can be the starting point towards
achieving these goals. Conducting an economic analysis of the grain legumes is important for
proper acceptability of a technology. Farmers will easily adopt crops that they perceive to have
more benefits. Information on the profitable grain legume species to farmers will lead to more
farmers incorporating them into their farming and hence inform farmers on profitable cultivation
practices and help them make decisions on effective changes for higher income and better
nutrition.
The contribution of both farmers and scientists are important for successful technology
development (Onyango, 2010). Understanding the extent of utilization and farmers’ opinions
about grain legumes will provide information for breeders to develop varieties taking into
5
account farmers’ views. The scientific community will also gain information which will enable
them to modify on how to approach the technology innovatively. Also, the findings will inform
the CCRP whether the farmers are utilizing the grain legumes innovatively or not and inform
them based on the results on better ways that will improve the utilization of legumes at
household level.
The findings of this study provide insights on the patterns of utilization of the legumes studied.
This information will improve the way farmers utilize legumes both in their diet and as non-food
by learning how other farmers utilize the legumes. Understanding of better utilization ways
particularly in their diet will not only improve their health due to provision of vitamins from
legumes but also will prevent use of expensive interventions such as fortification and pure
supplements which have low coverage in rural areas (Xiao et al., 2007). Therefore improving
their welfare and nutrition.
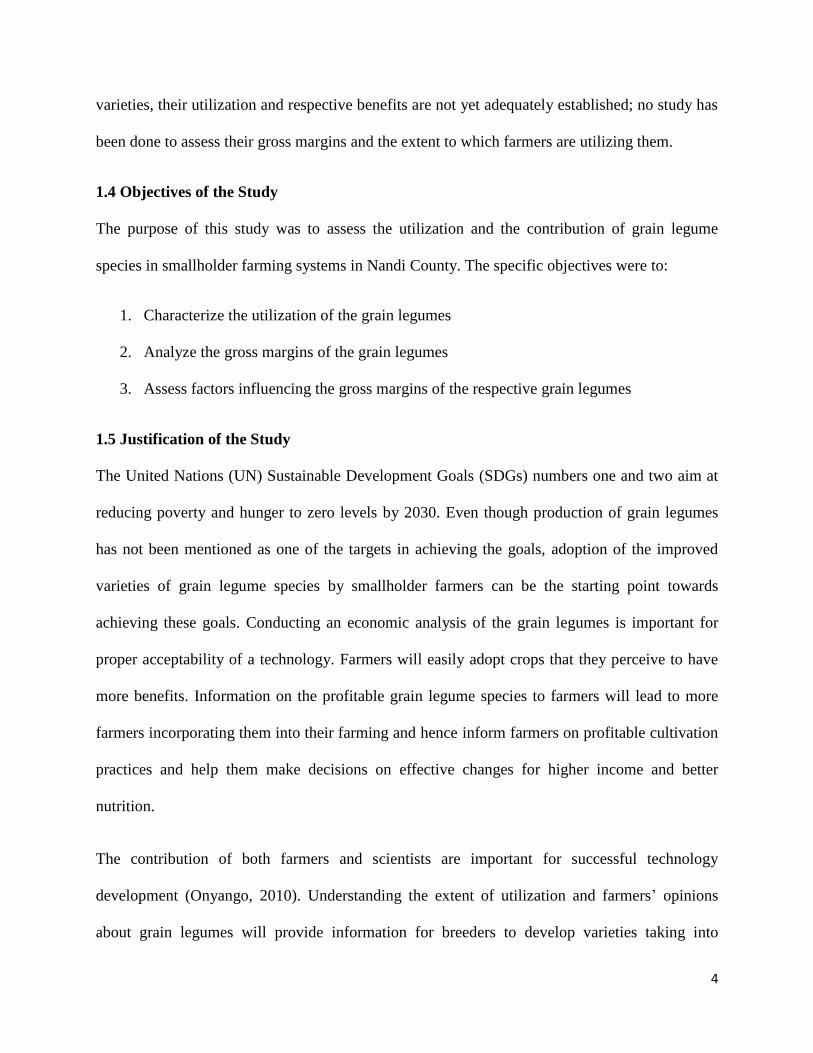
1.7 Study Area
This study was undertaken in Nandi county that is located in the Rift Valley region of Kenya. It
occupies a total area of 2884.5 square kilometers, with arable land of 206,959 hectares.
Temperatures range from 150C to 26
0C and rainfall of between 1200mm and 2000mm per
annum. Nandi county has two rainy seasons; the long rains between March and June and the
short rains between October and early December and the dry spell usually experienced from end
of December to March. With an estimated population of about 753,000 (Kenya National Bureau
of Statistics, 2009), the area is mainly characterized by subsistence agriculture and livestock
rearing. The main staple food crops are maize and beans,finger millet, sorghum, sweet potatoes,
bananas and vegetables, while the chief cash income earners are tea, sugarcane and coffee.
Western Kenya, (Nandi County inclusive) has highest rural population which has led to farm
6
fragmentation, resulting in continuous cropping in an effort to ensure household food security.
This has resulted in the reduction of soil fertility and decrease in productivity increasing poverty
levels in the County. It is for this reason that MLP implemented its activities in Nandi County in
order to rejuvenate the system health and improve productivity.
Figure 1: Map of Nandi County
Source: Republic of Kenya (2013).
7
1.8 Thesis Outline
This thesis has five chapters as follows: chapter one provides an overview of the diversity and
the role of grain legumes in smallholder farming livelihoods. It also provides an insight on
various opportunities towards increasing the production of grain legumes in Kenya. The problem
being investigated, objectives to be achieved and importance of the study are also discussed here.
Chapter two entails a review of literature on utilization and diversification of legumes,
knowledge gaps and methods for conducting farm profitability. Chapter three includes a detailed
discussion of framework on which the study is based on, sampling, data collection and analysis
methods. Results of the study are presented in chapter four while the final chapter concludes the
study by making some recommendations that would improve legume gross margin.
8
CHAPTER TWO
LITERATURE REVIEW
2.1 A Review of Insights on Legume Utilization and Diversification
Malnutrition is a serious challenge to poor households in the SSA region and thus increasing the
rate of food insecurity in the region. For instance, Abdulkadir et al. (2009) showed that stunting
and emaciation as a result of malnutrition affected up to 70 percent of children in Western
Kenya. Regular consumption of grain legumes such as beans have the potential in reducing risk
of diseases including cancer and coronary heart diseases (Winham et al., 2007; Lanza et al.,
2006).
Grain legumes play an important role as food security crop for smallholder farming households
in Africa. Cowpea, soybean, groundnut and common bean are the most important grain legumes
in SSA (Odendo et al., 2006). They are mostly regarded as women crops since in many cases the
women are the ones involved in the production and even marketing. These crops provide
multiple benefits including food, fodder, weed control and water conservation (Kiptot et al.,
2007). Odendo et al. (2006) also noted that grain legumes are particularly important human food
as they are rich in protein and sometimes sold for cash income. In addition, herbaceous legumes
such as dolichos lablab have the ability to improve soil fertility because of their high biomass
production. A study by Ngwira et al. (2012) pointed out that groundnuts enrich the soil with
nitrogen through biological fixation; and its husks can be used as fodder and fuel. In addition,
Erskine (2001) highlighted that legumes may be a useful protein and energy source for ruminant
and monograstric animals.
Farmers have multiple reasons for growing legumes depending on priorities. The various reasons
include for home consumption, income generation, green manure and forage. These reasons are
9
often influenced by socioeconomic and biophysical factors. Snapp and Silim (2002) showed that
farmers in Eastern and Southern Africa are concerned with factors such as ability to adapt to
local conditions, tolerance to low soil fertility, effect on soil fertility, maturity period, yield, food
security, grain quality, marketability and non-food benefits such as forage, fuel wood, or less
labor demands. Separately, Freeman et al. (2002) found that high yield, drought resistance, good
taste and short cooking time influenced choice of groundnut varieties.
Despite the multiple benefits stated above, utilization of grain legumes in smallholder farming
systems is still low. In many parts of Eastern and Southern Africa, the perception that beans,
cowpeas, and other pulses are ‘poor man’s food’ has been the main obstacle to broader
consumption of these grains. Mwenye (2003) noted lack of knowledge on the utilization of
legumes for human consumption and stock feed as one of the shortcomings in the promotion of
legumes that were studied. Similarly, Nhemachena et al. (2003) noted that the potential for
expanding legume production has not been realized due to shortage of knowledge among other
factors. The author further stated that there is need to explain the benefits of legumes to farmers.
Rowe and Giller (2003) further stated that underutilization of legumes may be due to poor
market development.
The diversity of varieties within the legume species and the knowledge about their utilization is
currently on the decline among many communities. For instance, cowpea has been classified
under neglected and underutilized crop species due to limited research done on the crop
(Chivenge et al, 2015). This leads to weak demand and depressed economic value of grain
legumes which in turn results to limited incentive to invest in grain legume production and
utilization.
10
Proper utilization of crops has the ability to significantly promote economic development
because legumes have the ability to contribute to food and nutritional security, income and
sustainable production systems (Ebert, 2014). This illustrates the need to evaluate utilization of
grain legumes that were introduced in Nandi.
2.2 A Review of Knowledge Gaps on Legumes
Literature on the utilization of legumes have mainly focused on the grain taking less account on
other legume parts such as pods, leaves and other non-food aspects of legumes which also play
significant roles. Wanjekeche et al. (2003) assessed utilization methods of new legumes that
were introduced in North Western Kenya. The authors focused on the food value with less
attention on other parts such as the leaves that are also consumed as vegetable. Other studies, for
instance Ojiewo et al. (2015), acknowledge that research gaps and other areas of emphasis along
the value chains in the process of mainstreaming the legumes into production and utilization
systems for improved livelihoods have also been highlighted with emphasis on nutrition security.
CCRP in its development efforts has carried some studies on grain legumes that were introduced,
but has been silent on the economic benefit of the legumes. One of the studies (Ojiem et al.,
2013) focused on benefits of various leguminous crops when intercropped with other food crops.
It demonstrated that crop production can be improved with integration of grain legumes; for
example it was found that up to 53 percent reduction in striga population was achieved through
rotation of maize with the grain legumes. In another study, Omondi (2011) focused on dolichos
lablab and assessed the benefits of the legume in improving consumption adequacy for protein,
iron and zinc intake in Nandi County.
11
Results obtained from the various previous project research activities indicated that the new
legume species introduced in Nandi (bean, lablab, groundnut, cowpea and soybean) are suitable
for integration into the smallholder farming systems to provide ecological benefits and improve
system productivity (Njeru et al. 2007). Within the Agro-Ecological Intensification (AEI)
domain, multipurpose grain legumes are capable of diversifying the production systems achieve
biological control of pests and diseases (Abang et al., 2014). Also, large amounts of high quality
biomass produced, e.g. by dolichos lablab can facilitate nutrient recycling, thus allowing farmers
to improve legume productivity with the limited resources available to them (Mugambi, 2013).
Whereas previous CCRP studies elicited important insights on issues on grain legume sector as a
whole, these aspects only guarantee farmers against agronomic related constrains. Agronomic
results alone do not provide complete picture when assessing a given technology (Onyango,
2010). It needs to be supplemented by insights from economic analysis and understanding of
farmer perceptions (Odendo et al., 2006). Other aspects of legumes such as preferences, prices
and production objectives are also of importance (Ojiem et al., 2006).
It is against the aforementioned background that the present study sought to assess the extent
and forms of utilization of grain legume and farmers’ opinions on the suitability of the legumes
introduced. Further, this study assessed economic gross margins of grain legume and
investigated factors that explain the level of profits generated from the grain legumes. The results
can be useful for better understanding of the economic potential of legume as well as important
for the county government and other NGOs interested in legume production to provide better
policies for instance, that could lower labour costs and increase returns..
12
2.3. Review of Methods Used in Economic Returns Analysis
In analyzing farm profitability, gross margin has been suggested as the best method due to its
simplicity and accuracy (Ahmad, 2004). According to Chisoni (2012) gross margin is the
simplest and most practical method of assessing enterprise profitability and it is widely used in
farm management economics. Gross margin has been defined as total income less total variable
costs. It serves as the unit of analysis in evaluating the economic performance of an enterprise
and gives an indicator of the feasibility of an enterprise and its potential contributing to
household income (Masvongo et al., 2013). Gross margins are usually computed per year or per
cropping season (Zulu, 2011). Gross margin approach as a proxy for profitability of agricultural
enterprises has been applied severally in the literature (see for example, Tschering, 2002;
Erbaugh et al., 2010; Sulumbe et al., 2010). In addition, it has been argued that most farmers use
farm management techniques like gross margin and partial budgeting in making farm decisions
(Longworth and Kenneth, 1980).
Computation of gross margin only takes into account variable costs and hence does not misjudge
the economic value of each enterprise which tends to be undervalued when fixed costs are
included. Gross margin was used in the current study because it is a relatively accurate indicator
of the performance of an individual farm and it allows a comparison of the performance of
different farms (Nemes, 2009) as used by Kraybil and Kidoido (2009) to calculate the
profitability of Ugandan agricultural enterprises.
Conversely, gross margin has limitations as it does not quantify net profit of an enterprise and
only considers variable costs in its calculation. However, in most smallholder assessments fixed
costs such as land and permanent labour will not necessarily be included in computation of the
gross margin. The gross profit margin is appropriate for this study since when using the net profit
13
margin, the costs farmers incur are extremely high and do not illustrate any efficiency on the use
of land and profitability.
Other methods that have also been used in evaluating benefits and costs include; internal rate of
return (IRR), cost-benefit analysis (CBA), partial budgeting analysis (PBA), and return on
investment (ROI), and all these are anchored on gross margin analysis. PBA and CBA include
fixed costs of the whole farm. The strength of such techniques is that they help to identify all
costs involved in a particular enterprise. However, full cost techniques (PBA and CBA) have
difficulties and sometimes arbitrary decisions have to be made concerning the allocation of
overhead expenses between enterprises (Firth, 2002). As such gross margin is not the same as
profit since it does not consider overhead costs, permanent costs and capital costs (interest). It is
appropriate in analyzing small scale farm enterprises since these enterprises require negligible
fixed costs. The gross margin analysis was used with the assumption that fixed costs of
production are negligible (Olukosi and Erhabor, 1988 and Samboko, 2011).Net profit estimates
per enterprise tend to ignore the interrelated nature of enterprises and are thus less useful for
most farm enterprises (Firth and Lennartsson, 1999). The return on investment is similar to CBA,
since it also measures benefits and costs in monetary terms.
14
CHAPTER THREE
METHODOLOGY
3.1 Conceptual Framework
The driving force of economics of agricultural production at the micro level is to help farmers to
meet their objectives through efficient farm allocation of resources over a specified period of
time. Hence this study assumes that producers attempt to maximize some objective function
subject to a set of constraints determined by institutional set up and socio-economic
characteristics. In this case, maximizing returns from production factors as described from the
production theory. Literature suggests that farmers may be motivated to produce on the basis of
the utility derived from production; and for profit reasons (Knight 1923; Bioca 1997). Following
this, the current study conceptualizes returns status as an outcome of farm and household
characteristics, volume of production, price received per enterprise and cost associated with the
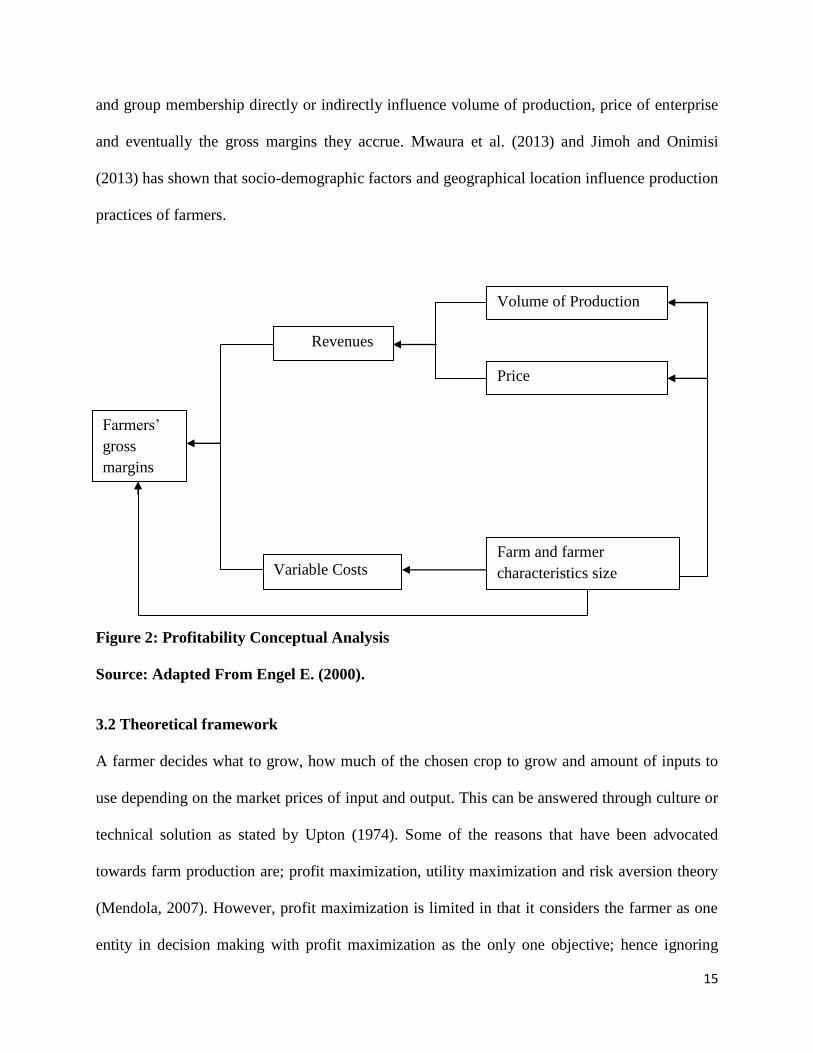
production of the commodity. The study adopted and modified conceptual framework developed
by Engel (2010) as shown in Figure 2. It illustrates that different farm and physical
characteristics among farmers influence profits by having effect on the volume of production,
price received per unit of enterprise and the cost structure.
Different factors influence legumes gross margins. This is because individuals in a community
often vary in terms of age, education, gender, wealth and access to credit. As such, farmer
attributes like age, gender, education, income, family size, group membership, primary economic
activity, resource endowments, have been shown to influence farmer decisions. Furthermore,
such variables may influence the costs of production, volume of production which also influence
the revenues and one’s ability to comprehend technologies. For instance, farm and farmer
characterisctics such as access to credit, distance to input and output market, size of the farm
15
and group membership directly or indirectly influence volume of production, price of enterprise
and eventually the gross margins they accrue. Mwaura et al. (2013) and Jimoh and Onimisi
(2013) has shown that socio-demographic factors and geographical location influence production
practices of farmers.
Figure 2: Profitability Conceptual Analysis
Source: Adapted From Engel E. (2000).
3.2 Theoretical framework
A farmer decides what to grow, how much of the chosen crop to grow and amount of inputs to
use depending on the market prices of input and output. This can be answered through culture or
technical solution as stated by Upton (1974). Some of the reasons that have been advocated
towards farm production are; profit maximization, utility maximization and risk aversion theory
(Mendola, 2007). However, profit maximization is limited in that it considers the farmer as one
entity in decision making with profit maximization as the only one objective; hence ignoring
Farmers’
gross
margins
Revenues
Variable Costs
Volume of Production
Farm and farmer
characteristics size
Price
16
consumption (Ellis, 1992). Due to the limitations of profit maximization theory, household
decision making theory was suggested. The theory states that a farmer makes two decisions
simultaneously that is: production and consumption decisions which has impact on household
utility
On the other hand, one of the stated flaws in the utility maximization theory is absence of
consideration of the risk aspect of farmers. Explanations that have refuted this theory are such as
those of Nyikal and Kosura, (2005) who indicated that farmers want to exclusively spread
production risk by planting a number of crops in the farm in order to meet the household
subsistence needs.
Therefore, based on the above discussion, the current study adopted producer theory and utility
maximizing households. In producer theory, firms are described by fixed and exogenously given
technologies that allow them to convert inputs (land, labor, capital and raw materials) into
outputs (Levin and Milgrom 2004). Hence, legume farmers expect yields which are output from
the production which involves use of input. Further, from the fact that legumes will be expected
to meet household food requirements brings about utility maximization. Levin and Milgrom
(2004) further states that producers take both input and output prices as given, and choose a
production plan (a technologically feasible set of inputs and outputs) to maximize profits. In this
study, grain legume farmers are conceptualized to be maximizing returns so as to achieve their
subsistence and/or income goals.
Gardner, (1995) states that improvement of farm incomes is one of the ways of solving the farm
problem. The output is a function of the inputs which the farmer uses as indicated below.
…………………………………………………………………………1
17
where Y represents the output and xi represents the factors of production. Therefore the producer
theory is suitable in this case since farmers use inputs in the production of legumes.
3.3 Sampling and Data Collection
Household survey data were collected through face-to-face interviews for long ans short rain
seasons in 2015. Face-to-face interviews guarantee high response rates besides enabling
clarification of survey questions in interviews (Bennett and Birol, 2010). Three focus group
discussions (FGDs) were held with an average of eight participants in each of the three study
sites to obtain general information on farmers’ perspectives on grain legumes. Participants of the
FGDs were farmers who have participated in the project activities for a long period of time and
were well conversant with the study sites and the project.
Semi-structured questionnaires used in the survey captured information on input costs, yields per
acre, market price and data on socioeconomic characteristics. The current study used multi stage
sampling technique because it greatly reduces the variation of the estimate while collecting less
data (Allen et al., 2002). Selection of the study sites was purposive; focusing on sites where the
CCRP activities were being implemented. The three study sites are Kiptaruswo (medium fertility
site), Kapkerer (low fertility) and Koibem (high fertility site) which falls into different sub
counties within Nandi County. Each of the sub counties are demarcated into Divisions which are
administrative units. The sampling was done in three stages, first, in each Sub county, the
Divisions where CCRP activities are concentrated were identified. The second stage involved
selecting farmers who participated in th MLP project. Finally a random selection was made to
determine the farmers to participate in the interview.
18
In determining the sample size, a list of 487 farmers who have participated in the project was
made and employing probability proportionate to size sampling technique a sample of 163
farmers was chosen. Probability proportional to size is where by larger clusters have bigger
probability of being selected. Stratification is done to ensure proper representation of important
sub-population groups without biasing the selection operation (Turner, 2003).
3.4 Empirical Data Analysis
3.4.1 Calculation of Gross Margins
Gross margins were calculated for each respondent using Microsoft Excel spread sheet to
estimate costs and returns of the smallholder grain legume farmers. Gross Margin in this study
was calculated as shown in Equation 2.
GM=TR - TVC………………………….……………………………………………………………….. 2
where GM is the gross margin,
TR is total revenue, and TVC is total variable costs.
The formula can further be written as;
…………………….…………….…………….……………….… 3
where, GM is gross margin in Kenya shillings per acre for the selected grain legumes species; Pq
is the average price of the grain legume per kg; Q is the quantity of crop output per acre in kg; Pi
is the price of the ith
variable input used in the production of the grain legume; and Xi is the
quantity of the ith
variable input per acre.
In this study average quantity and costs of different inputs (such as seed, fertilizer, fungicides,
herbicides and insecticides) used per acre were computed for each of the grain legume. In
addition labour use (man hours per acre) and the cost involved per acre for each activity carried
19
out during legume production were computed. Appropriate labor equivalences according to
Abdulahi (1990) were used to adjust for man hours in cases where children and women worked
even though there is possibility of exceptions in activities where women are faster, like in
weeding of legumes. Family labor was valued at its opportunity cost according to the prevailing
market rates. All the analyses were done on the basis of per acre because of the ease of
computation and availability and nature of data (Onyango, 2010).
Revenue was calculated by multiplying output in kilograms (kg) per acre for each household by
the price per unit (kg) at which a household sold the grain legume as computed by Ahmad et al.,
(2005). Total output included output harvested, consumed, paid in kind or kept for future use.
The prevailing market price was used to estimate the cost of farm inputs and value of outputs as
used by Mutuma et al., (2014). Non market transactions were valued at the average market price.
In order to analyze factors influencing gross margins of the selected grain legume species,
multiple regression models (Gujarati, 2003) were used in this study. Computed gross margin for
each household was regressed on the hypothesized variables. The subsequent step involved
multiple regression estimation to investigate possible determinants of the gross margins for each
legume.
Annual gross margin for each legume was used as a dependent variable (Y) and explanatory
variables (X) include; socioeconomic and institutional characteristics (Age of the respondent,
number of years of education, household size, distance in kilometers to the market, experience in
farming, site, group membership, extension services and access to credit). Categorical variable
such as gender was converted into dummy variable so that it could be included into the
regression model.
20
Multiple regression model is still the widely used for empirical analysis and social sciences
(Wooldridge, 2004). The author further states that multiple regression models accommodate
many regressors which may be correlated hence one can infer causality where simple regression
could mislead. Multiple regressions was used in this study because it gives opportunity to
explicitly control for many other factors which simultaneously affect the dependent variable and
also incorporates fairly general functional form relationships (Samboko, 2011).
The multiple regression with n independent variables was stated as;
y=β0 +β 1 X1+ β 2 X2+ β 3 X3……………β n X n + e………………………………………………4
Where y is the dependent variable, Xi are the independent variable, βi are the coefficients,
and e is the error term.
The model was specified as:
GM = β0+ β1 Access to credit + β2 Distance to the market in kilometres? + β3 Household
size + β4 Group membership + β5 Education in years + β6 Site (Dummy) + β7 Log area
under grain legume production in acres + β8 Age of the farmer in years + β9 Undertake
value addition+ Β10 Access to extension services + e…………………………………………5
The head of a household is assumed to be responsible for the co-ordination of the household
activities and as such, it is important to include attributes such as gender, age and education of
the household head in the specification of the model for factors influencing profitability
(Makhura, 2001).
Legume is mostly considered to be women’s crop as they are major sources of income for
smallholder farmers especially women (Muimui, 2010). However, women are faced with a
21
couple of challanges including lack of access to productive resources and lower mobility owing
to their cultural roles and responsibilities. On the other hand, Marenya and Barrett (2007) stated
that men have more access to production resources, hence stand at a better position to use quality
and more inputs. Hence the inclusion of gender.
Distance to the nearest market has been found to significantly influence market participation
(Otieno et al., 2009), and gross margin. This is because households that are located near the
markets incur lesser transport costs hence they can easily access inputs and outputs needed for
production. Kamara (2004), illustrated that market access improves farmers’ productivity.
Therefore distance to market was expected to have an inverse relationship with gross margin.
In addition, the age of the household head can often be indicative of farming experience as well
as the ability to comprehend new technologies (Matungul et al., 2001). The age of the head of the
household is also important since it determines whether the household benefits from the
experience of an older person, or has to base its decisions on the risk-taking attitude of a younger
farmer (Makhura, 2001).
The larger the family size the more the provision of family labour needed in the production of
legumes. On the other hand, Otieno et al. (2009) findings indicated that household size had a
negative significant effect on participation in markets since larger family size will less likely
participate in market due to lesser market surplus. The inconsistency of the influence of
household size on gross margins prompted the need to include it in this analysis.
Group membership was anticipated to have influence in the legumes gross margin. This is
because group membership increases farmers bargaining power interms of credit and market
22
access. Ngugi et al., (2007) show that groups increase the bargaining power of smallholder
farmers thus shielding them from over exploitation.
Mwaura et al. (2013) found that including resource endowment, access to credit and information
influenced gross margins from production of African Indigenous Vegetables (AIVs). Access to
credit has been indicated to positively affect gross margins in that the farmer can not only afford
more but also high quality inputs which can increase yields. According to Nyoro (2002), lack of
access to credit facilities has been highlighted a key constraint to farmers investment. In this
study, access to credit was measured by determining whether the farmer had any collateral,
ability of the farmer to meet basic loan requirements by financial institutions and interest on
loans which hinders farmer’s access to credit.
Descriptive statistics on socio-demographic characteristics of the household, utilization of
legumes and preferred legume attributes were analyzed, and results were presented in tables and
bar graphs. Analysis of Variance was used to test any statistical differences within the categories
for continuous variables. For proportional data within the categories, column proportions
comparison (z-test) using bonferroni method at (p < 0.05) was done. Significance results were
identified using an APA-style notation with subscript letter. Data were analyzed using the
STATA version 13 software. Results from the analysis are presented in the next section.
3.4.2 Diagnostic Tests
To ensure the regression model was in line with assumptions and requirements of Ordinary Least
Squares (OLS) a number of tests were performed. Multicollinearity, heteroskedasticity,
normality test and the Ramsey's test for omitted-variable problems was carried out. None of
these tests exhibited significance. To test heteroskedasticity Breusch Pagan test was used. A chi
23
square value of 15.88 and a p-value of 0.1970 was evidence that the null hypothesis of
homoscedasticity was not rejected hence error term had constant variance. Further, Ramsey test
(Ramsey 1969) was used to test for any omitted variable in the model. The results showed that
there was no omitted variable since the F-value and p-value were 2.33 and 0.0770 respectively.
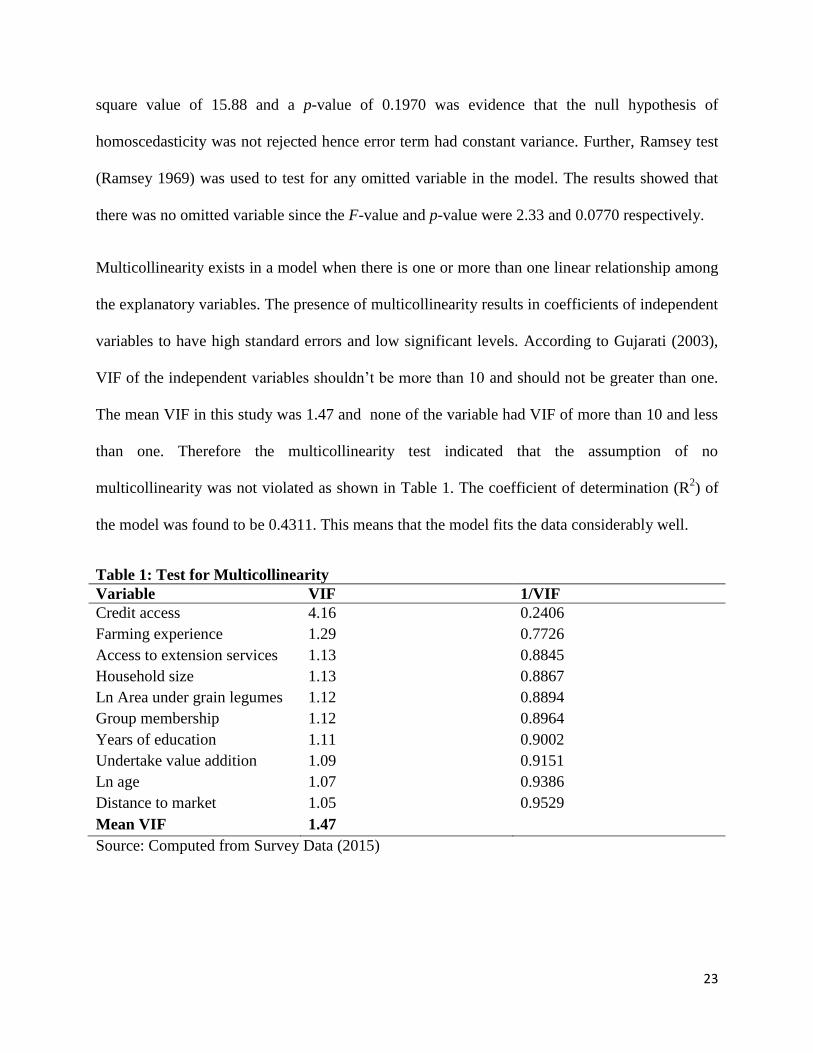
Multicollinearity exists in a model when there is one or more than one linear relationship among
the explanatory variables. The presence of multicollinearity results in coefficients of independent
variables to have high standard errors and low significant levels. According to Gujarati (2003),
VIF of the independent variables shouldn’t be more than 10 and should not be greater than one.
The mean VIF in this study was 1.47 and none of the variable had VIF of more than 10 and less
than one. Therefore the multicollinearity test indicated that the assumption of no
multicollinearity was not violated as shown in Table 1. The coefficient of determination (R2) of
the model was found to be 0.4311. This means that the model fits the data considerably well.
Table 1: Test for Multicollinearity
Variable VIF 1/VIF
Credit access 4.16 0.2406
Farming experience 1.29 0.7726
Access to extension services 1.13 0.8845
Household size 1.13 0.8867
Ln Area under grain legumes 1.12 0.8894
Group membership 1.12 0.8964
Years of education 1.11 0.9002
Undertake value addition 1.09 0.9151
Ln age 1.07 0.9386
Distance to market 1.05 0.9529
Mean VIF 1.47
Source: Computed from Survey Data (2015)
24
0
.05
.1.1
5.2
Density
-10 -5 0 5 10Residuals
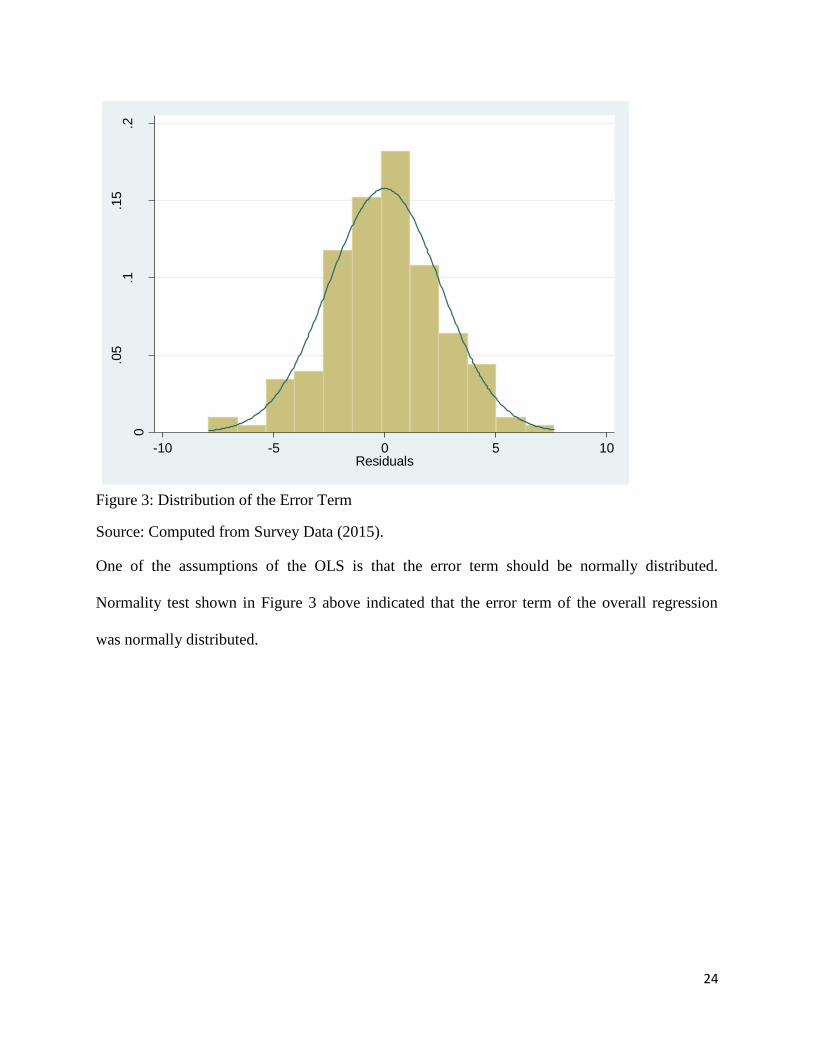
Figure 3: Distribution of the Error Term
Source: Computed from Survey Data (2015).
One of the assumptions of the OLS is that the error term should be normally distributed.
Normality test shown in Figure 3 above indicated that the error term of the overall regression
was normally distributed.
25
CHAPTER FOUR
RESULTS AND DISCUSSIONS
4.1. Sample Farmers’ Socio-Economic Characteristics
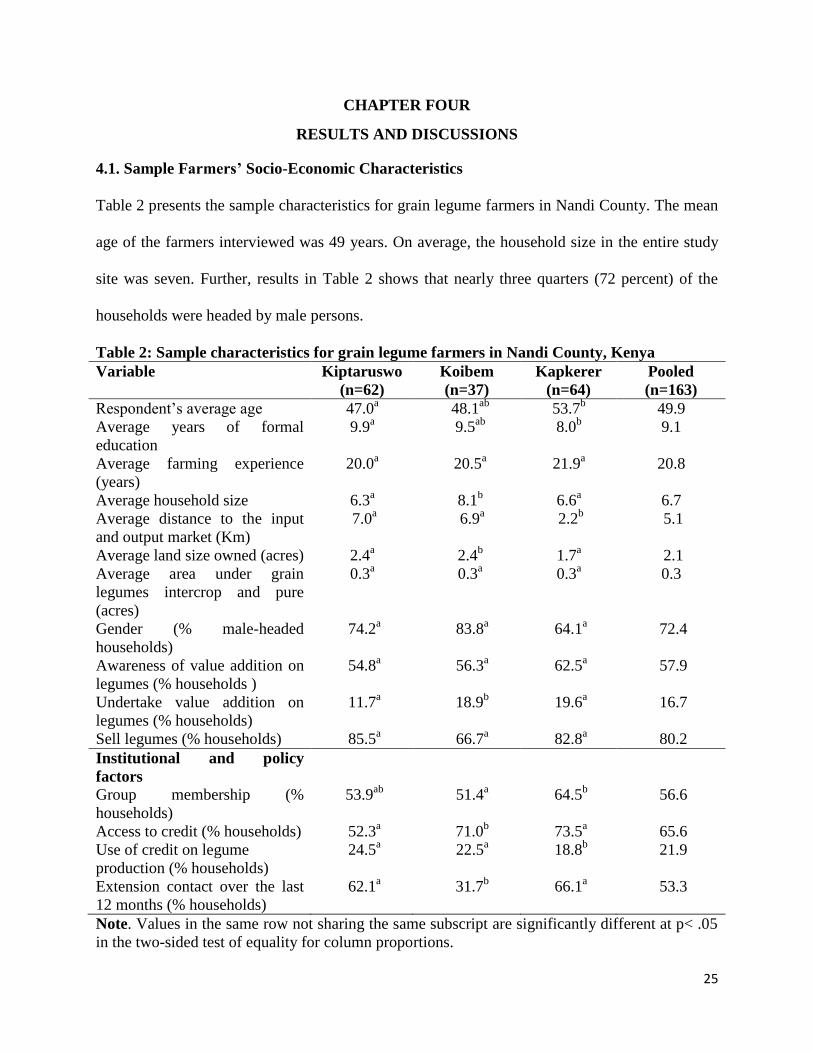
Table 2 presents the sample characteristics for grain legume farmers in Nandi County. The mean
age of the farmers interviewed was 49 years. On average, the household size in the entire study
site was seven. Further, results in Table 2 shows that nearly three quarters (72 percent) of the
households were headed by male persons.
Table 2: Sample characteristics for grain legume farmers in Nandi County, Kenya
Variable Kiptaruswo
(n=62)
Koibem
(n=37)
Kapkerer
(n=64)
Pooled
(n=163)
Respondent’s average age 47.0a 48.1
ab 53.7
b 49.9
Average years of formal
education
9.9a 9.5
ab 8.0
b 9.1
Average farming experience
(years)
20.0a 20.5
a 21.9
a 20.8
Average household size 6.3a 8.1
b 6.6
a 6.7
Average distance to the input
and output market (Km)
7.0a 6.9
a 2.2
b 5.1
Average land size owned (acres) 2.4a 2.4
b 1.7
a 2.1
Average area under grain
legumes intercrop and pure
(acres)
0.3a 0.3
a 0.3
a 0.3
Gender (% male-headed
households)
74.2a
83.8a
64.1a 72.4
Awareness of value addition on
legumes (% households )
54.8a 56.3
a 62.5
a 57.9
Undertake value addition on
legumes (% households)
11.7a 18.9
b 19.6
a 16.7
Sell legumes (% households) 85.5a 66.7
a 82.8
a 80.2
Institutional and policy
factors
Group membership (%
households)
53.9ab
51.4a
64.5b
56.6
Access to credit (% households) 52.3a 71.0
b 73.5
a 65.6
Use of credit on legume
production (% households)
24.5a 22.5
a 18.8
b 21.9
Extension contact over the last
12 months (% households)
62.1a
31.7b
66.1a
53.3
Note. Values in the same row not sharing the same subscript are significantly different at p< .05
in the two-sided test of equality for column proportions.
26
However, in Kapkerer more households are headed by females and this could indicate low
profits of grain legumes in Kapkerer because women lack resources for market access as
opposed to men. This could also bring out a difference in the way legumes are utilized across the
three sites because households headed by men would utilize legumes differently from households
headed by women.
The mean land size owned by the sampled farmers was about 2 acres, but only 5 percent of the
land size owned was dedicated to grain legumes production. Land ownership influences
agricultural productivity, hence gross margins, since farmers who do not own land can be
unwilling to develop and maintain the land (Randela, et al. 2000). The small land sizes is
attributed to intense population pressure in the region (Conelly and Chaiken, 2000). This
therefore results in small sizes of land devoted to farming.
The mean year of formal education of household heads was approximately 9 years (varying from
0 to 18), indicating many respondents completed at least the primary level and got into high
schools. Education is important in agriculture because it affects the ability to read and write
extension information on various farming technologies (Mhango, 2011). Therefore, respondents
with more years of education are expected to utilize legumes innovatively and have higher
profits since education should translate to increased information for better agricultural practices.
Also years of formal education is assumed to increase the probability of understanding new
technologies. Better educated farmers can be expected to be more aware of the positive benefits
associated with new technologies.
Distance to the main market was used as a proxy of access to input and output market for grain
legumes. The average distance in this study was 5.1 kilometers. Closer markets reduce
27
transportation costs hence motivate the farmers to improve production (Masuku and Xaba,
2013). The authors further state that the far away the production area is to the market, the lesser
would be the probability to participate in commercial agricultural production, hence poor profits
because of high transport costs.
In general, more than half (58 percent) of the farmers were aware of value addition in legumes.
However, only 17 percent of these farmers were undertaking value addition on their legumes.
This could be attributed to inadequate knowledge of farmers on some of the value addition
processes on legumes. This may illustrate poor and non-innovative utilization trends of legumes.
Also, farmers were asked if they sold grain legumes after harvest. About 80 percent of farmers
sold the legumes for income purposes and this reaffirmed the multiple benefits of legumes. In
fact, more than 90 percent of farmers perceived production of grain legumes as a profitable
enterprise. Farmers used proceeds from the sale of legumes mainly for school fees payment,
purchase farm input, payment of loan, purchase food and farm labour expenses as shown in
Figure 4 below. Therefore, farmers saving money that could have otherwise been used in those
responsibilities.
28
0
10
20
30
40
50
60
Table
banking
School fees Purchase
farm input
Pay loan Farm
labour
expenses
Household
items
Purchase
food
Per
cen
tag
e o
f h
ou
seh
old
s
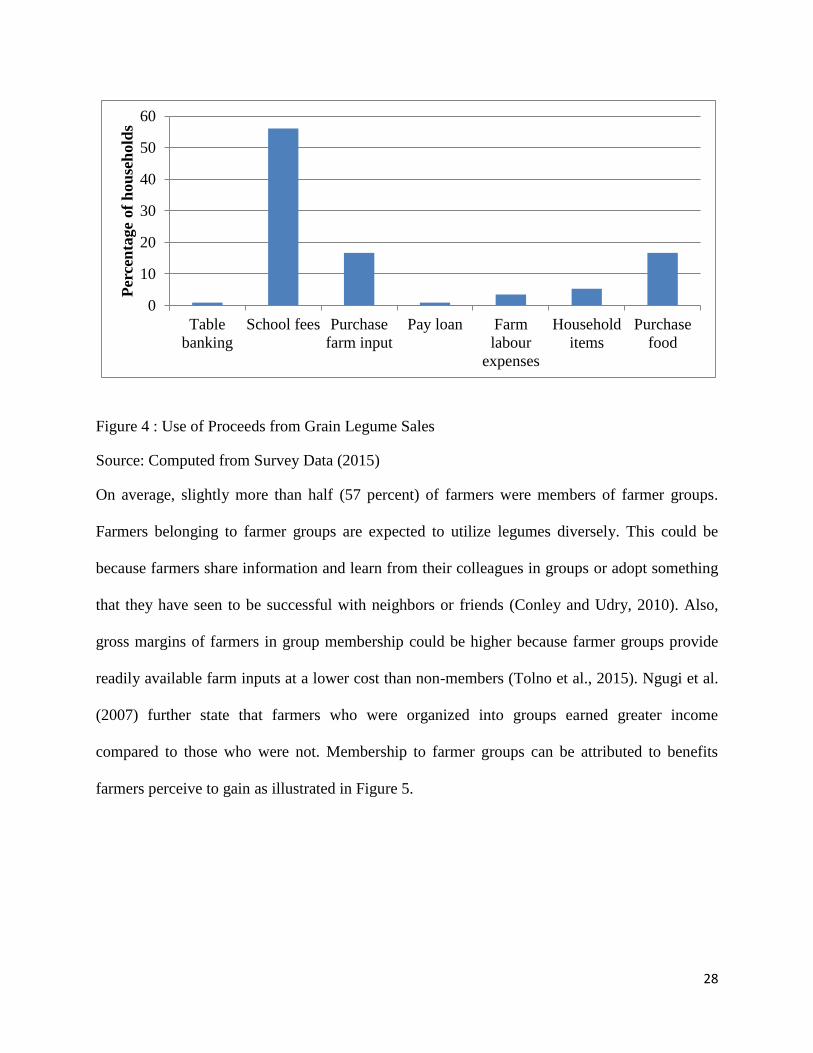
Figure 4 : Use of Proceeds from Grain Legume Sales
Source: Computed from Survey Data (2015)
On average, slightly more than half (57 percent) of farmers were members of farmer groups.
Farmers belonging to farmer groups are expected to utilize legumes diversely. This could be
because farmers share information and learn from their colleagues in groups or adopt something
that they have seen to be successful with neighbors or friends (Conley and Udry, 2010). Also,
gross margins of farmers in group membership could be higher because farmer groups provide
readily available farm inputs at a lower cost than non-members (Tolno et al., 2015). Ngugi et al.
(2007) further state that farmers who were organized into groups earned greater income
compared to those who were not. Membership to farmer groups can be attributed to benefits
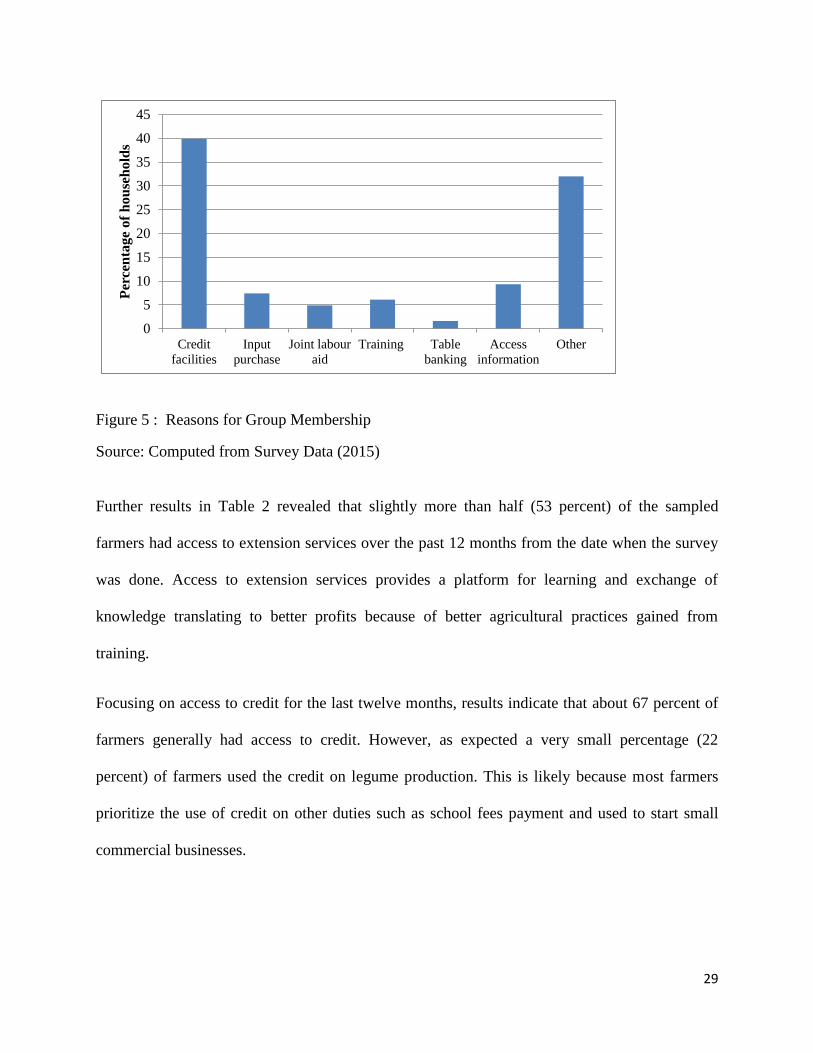
farmers perceive to gain as illustrated in Figure 5.
29
0
5
10
15
20
25
30
35
40
45
Credit
facilities
Input
purchase
Joint labour
aid
Training Table
banking
Access
information
Other
Per
cen
tage
of
hou
seh
old
s
Figure 5 : Reasons for Group Membership
Source: Computed from Survey Data (2015)
Further results in Table 2 revealed that slightly more than half (53 percent) of the sampled
farmers had access to extension services over the past 12 months from the date when the survey
was done. Access to extension services provides a platform for learning and exchange of
knowledge translating to better profits because of better agricultural practices gained from
training.
Focusing on access to credit for the last twelve months, results indicate that about 67 percent of
farmers generally had access to credit. However, as expected a very small percentage (22
percent) of farmers used the credit on legume production. This is likely because most farmers
prioritize the use of credit on other duties such as school fees payment and used to start small
commercial businesses.
30
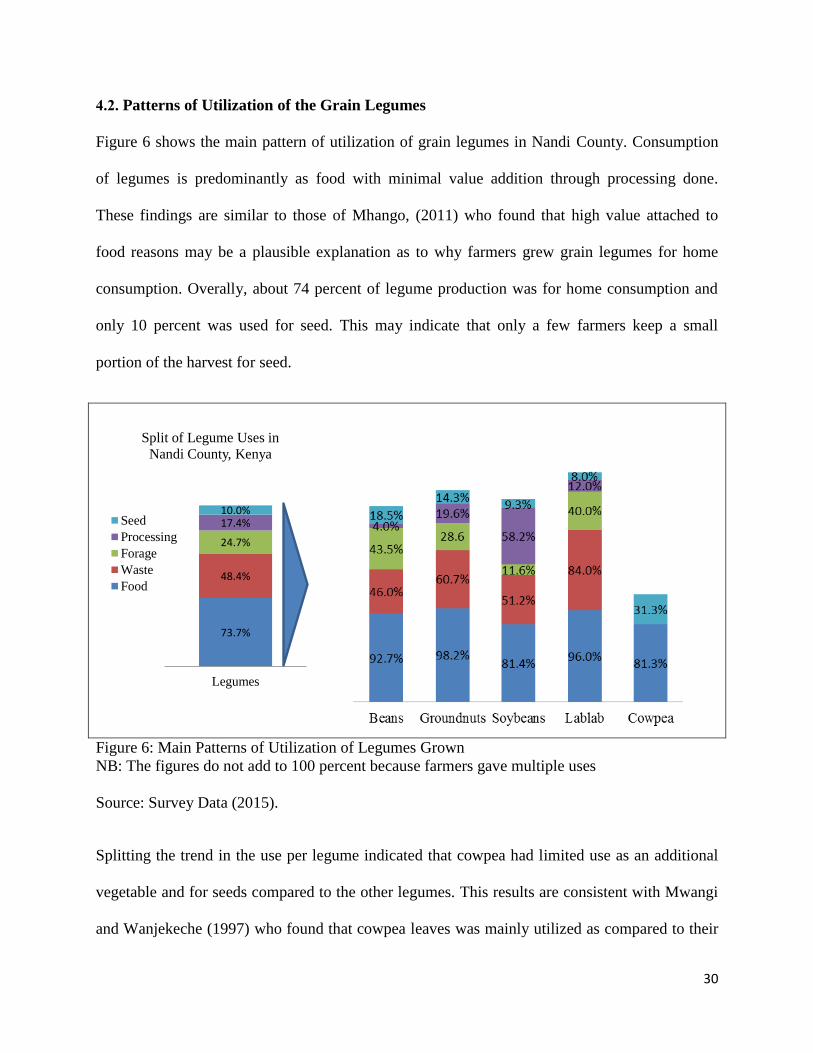
4.2. Patterns of Utilization of the Grain Legumes
Figure 6 shows the main pattern of utilization of grain legumes in Nandi County. Consumption
of legumes is predominantly as food with minimal value addition through processing done.
These findings are similar to those of Mhango, (2011) who found that high value attached to
food reasons may be a plausible explanation as to why farmers grew grain legumes for home
consumption. Overally, about 74 percent of legume production was for home consumption and
only 10 percent was used for seed. This may indicate that only a few farmers keep a small
portion of the harvest for seed.
73.7%
48.4%
24.7%
17.4% 10.0%
Legumes
Split of Legume Uses in
Nandi County, Kenya
Seed
Processing
Forage
Waste
Food
Figure 6: Main Patterns of Utilization of Legumes Grown
NB: The figures do not add to 100 percent because farmers gave multiple uses
Source: Survey Data (2015).
Splitting the trend in the use per legume indicated that cowpea had limited use as an additional
vegetable and for seeds compared to the other legumes. This results are consistent with Mwangi
and Wanjekeche (1997) who found that cowpea leaves was mainly utilized as compared to their
31
grains. This suggests that cowpea grain is underutilized and this is because in Western Keny
cowpeas is mainly grown for its leaves and utilized as vegetable eaten with ugali. The species
they grow for leaf do not produce much of seed, but eventually they do and the households use
them in a mixture with maize (githeri) due to inadequate knowledge on other ways of utilization
of cowpea grains.
Results in Figure 6 indicate that soybean was the most processed legume. About 58 percent of
soybean farmers processed soybean grain with other cereals such as maize, millet and sorghum
to make porridge flour mostly for the young ones. Also, few farmers processed soybean to
powders and soy milk by soaking it in water and later grinding and sieving used as beverage.
These results suggest that majority of farmers perceive soybean to be more nutritious to children
than other legumes. More than 90 percent of farmers who grew groundnuts and beans mainly
used them for home consumption and income generation. Groundnuts were roasted and
consumed as snacks at home while beans were mainly mixed with maize and boiled to make
githeri. Results in figure 6 further show that dolichos lablab was mainly utilized for meals and as
waste to make manure.
Other uses cited included traditional seed preservative and vegetable softener. For instance, for
the case of beans, 12 percent of farmers indicated they burned the dried foliage and soaked the
ash in water, and the resulting sieved liquid used as vegetable tenderizer.
Further analysis was done to assess preferred legume attributes as shown in Tables 3 and 4.
Common beans was the most popular legume grown by about 81 percent of the farmers while
cowpeas was only grown by about 10 percent of the farmers interviewed. Farmers were also
asked to rank legumes based on the legume attributes they desired. Table 3 shows that more than
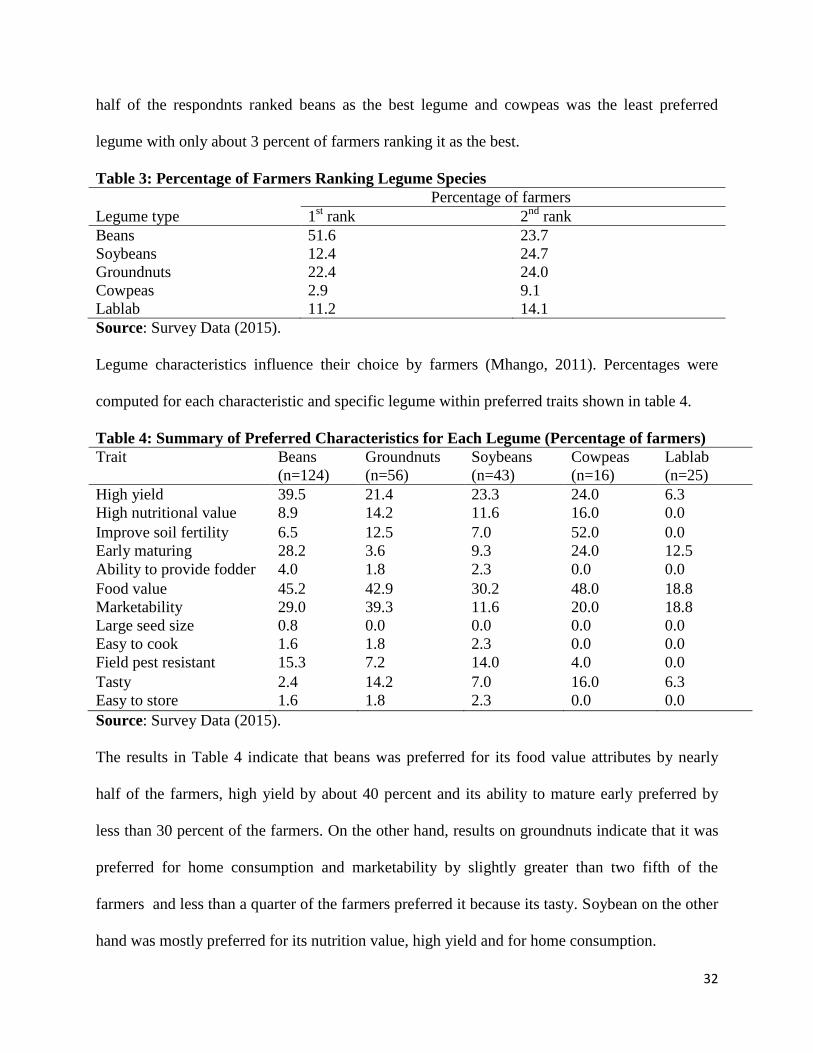
32
half of the respondnts ranked beans as the best legume and cowpeas was the least preferred
legume with only about 3 percent of farmers ranking it as the best.
Table 3: Percentage of Farmers Ranking Legume Species
Percentage of farmers
Legume type 1st rank 2
nd rank
Beans 51.6 23.7
Soybeans 12.4 24.7
Groundnuts 22.4 24.0
Cowpeas 2.9 9.1
Lablab 11.2 14.1
Source: Survey Data (2015).
Legume characteristics influence their choice by farmers (Mhango, 2011). Percentages were
computed for each characteristic and specific legume within preferred traits shown in table 4.
Table 4: Summary of Preferred Characteristics for Each Legume (Percentage of farmers)
Trait Beans
(n=124)
Groundnuts
(n=56)
Soybeans
(n=43)
Cowpeas
(n=16)
Lablab
(n=25)
High yield 39.5 21.4 23.3 24.0 6.3
High nutritional value 8.9 14.2 11.6 16.0 0.0
Improve soil fertility 6.5 12.5 7.0 52.0 0.0
Early maturing 28.2 3.6 9.3 24.0 12.5
Ability to provide fodder 4.0 1.8 2.3 0.0 0.0
Food value 45.2 42.9 30.2 48.0 18.8
Marketability 29.0 39.3 11.6 20.0 18.8
Large seed size 0.8 0.0 0.0 0.0 0.0
Easy to cook 1.6 1.8 2.3 0.0 0.0
Field pest resistant 15.3 7.2 14.0 4.0 0.0
Tasty 2.4 14.2 7.0 16.0 6.3
Easy to store 1.6 1.8 2.3 0.0 0.0
Source: Survey Data (2015).
The results in Table 4 indicate that beans was preferred for its food value attributes by nearly
half of the farmers, high yield by about 40 percent and its ability to mature early preferred by
less than 30 percent of the farmers. On the other hand, results on groundnuts indicate that it was
preferred for home consumption and marketability by slightly greater than two fifth of the
farmers and less than a quarter of the farmers preferred it because its tasty. Soybean on the other
hand was mostly preferred for its nutrition value, high yield and for home consumption.
33
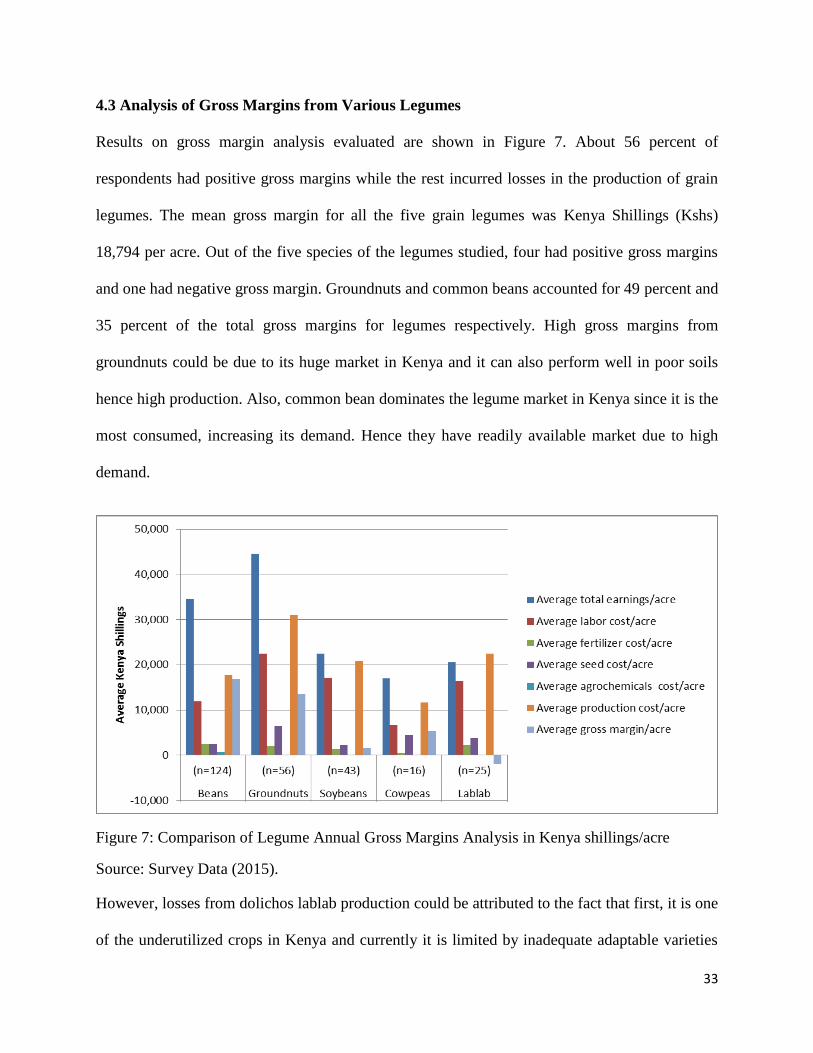
4.3 Analysis of Gross Margins from Various Legumes
Results on gross margin analysis evaluated are shown in Figure 7. About 56 percent of
respondents had positive gross margins while the rest incurred losses in the production of grain
legumes. The mean gross margin for all the five grain legumes was Kenya Shillings (Kshs)
18,794 per acre. Out of the five species of the legumes studied, four had positive gross margins
and one had negative gross margin. Groundnuts and common beans accounted for 49 percent and
35 percent of the total gross margins for legumes respectively. High gross margins from
groundnuts could be due to its huge market in Kenya and it can also perform well in poor soils
hence high production. Also, common bean dominates the legume market in Kenya since it is the
most consumed, increasing its demand. Hence they have readily available market due to high
demand.
Figure 7: Comparison of Legume Annual Gross Margins Analysis in Kenya shillings/acre
Source: Survey Data (2015).
However, losses from dolichos lablab production could be attributed to the fact that first, it is one
of the underutilized crops in Kenya and currently it is limited by inadequate adaptable varieties
34
in wide agro-ecological zones. The current dolichos lablab varieties that farmers grow have low
yields, as they are susceptible to diseases and drought. Also, poor gross margins from dolichos
lablab could be explained by its low acceptance by smallholder farmers in Kenya as stated by
(Shivachi et al. 2012) hence have lower market value compared to other legumes. The findings
in this study on the average gross margins are similar to findings in other studies (Zulu, 2011;
Samboko, 2011). The results generally show that production of grain legume species is viable in
smallholder farming systems.
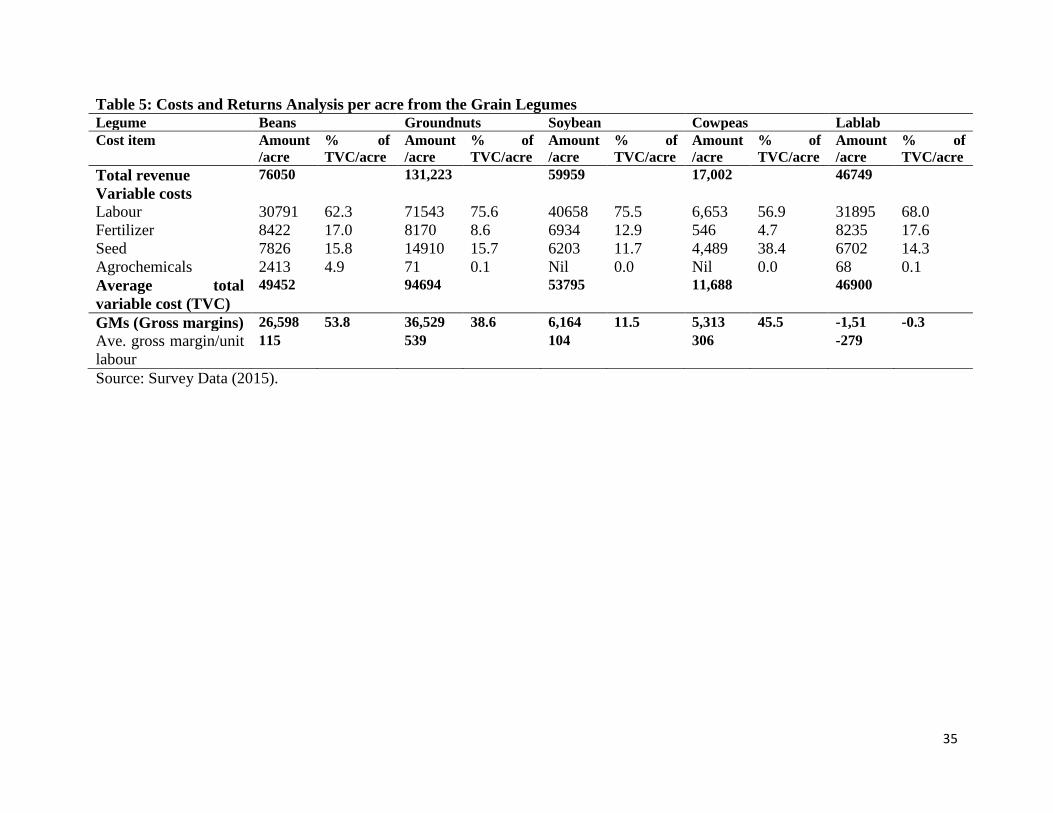
Results in Table 5 show cost and return structure of grain legumes production in the study area.
Among the variable costs included in the study, expenditure on labour operational activities for
land preparation, sowing, weeding, harvesting and post-harvest activities formed the largest cost
item. Table 5 illustrate that averagely for all the grain legumes 67 percent of the total variable
cost was spent on labour. High labour costs in legume production has been observed in previous
cost benefit analysis for legumes for instance in beans (Katungi et al; 2011).
Groundnuts showed the highest labour cost representing about 76 percent of the total variable
cost used in the production. High groundnuts labour costs can be attributed to additional
activities needed such as plucking and shelling that is, physical removal of the husks. Also,
groundnuts require more management skills than other legumes. Generally, labour cost was the
highest cost in grain legume production.
35
Table 5: Costs and Returns Analysis per acre from the Grain Legumes Legume Beans Groundnuts Soybean Cowpeas Lablab
Cost item Amount
/acre
% of
TVC/acre
Amount
/acre
% of
TVC/acre
Amount
/acre
% of
TVC/acre
Amount
/acre
% of
TVC/acre Amount
/acre
% of
TVC/acre
Total revenue 76050 131,223 59959 17,002 46749
Variable costs
Labour 30791 62.3 71543 75.6 40658 75.5 6,653 56.9 31895 68.0
Fertilizer 8422 17.0 8170 8.6 6934 12.9 546 4.7 8235 17.6
Seed 7826 15.8 14910 15.7 6203 11.7 4,489 38.4 6702 14.3
Agrochemicals 2413 4.9 71 0.1 Nil 0.0 Nil 0.0 68 0.1
Average total
variable cost (TVC)
49452 94694 53795 11,688 46900
GMs (Gross margins) 26,598 53.8 36,529 38.6 6,164 11.5 5,313 45.5 -1,51 -0.3
Ave. gross margin/unit
labour
115 539 104 306 -279
Source: Survey Data (2015).
36
However, costs of fertilizer and agrochemicals were minimal across all the legumes studied. This
demonstrated low use of agrochemicals and fertilizer in the production of legumes in the study
area. The results further illustrated that the total revenue of the legumes were higher than the
total variable costs used in their production except for the case of lablab. This means that legume
cultivation in the study area was profitable. Thus it is desirable that more farmers should be
encouraged to engage in legume production as a source of income to the households.
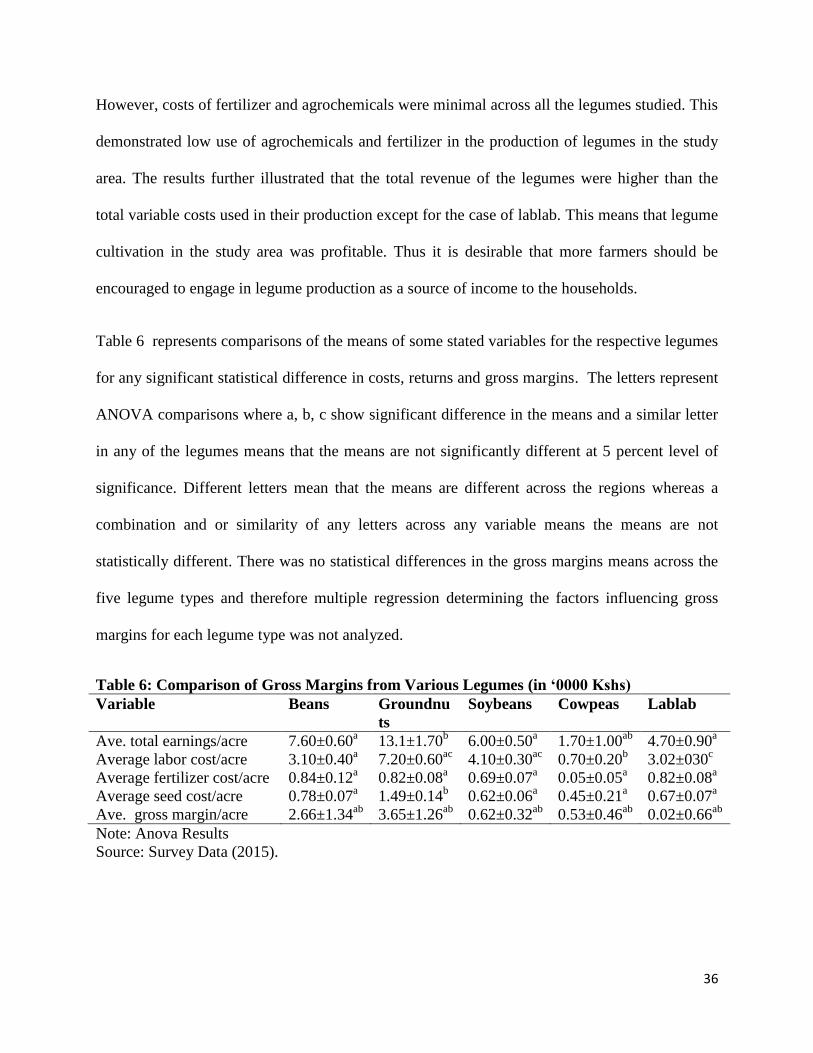
Table 6 represents comparisons of the means of some stated variables for the respective legumes
for any significant statistical difference in costs, returns and gross margins. The letters represent
ANOVA comparisons where a, b, c show significant difference in the means and a similar letter
in any of the legumes means that the means are not significantly different at 5 percent level of
significance. Different letters mean that the means are different across the regions whereas a
combination and or similarity of any letters across any variable means the means are not
statistically different. There was no statistical differences in the gross margins means across the
five legume types and therefore multiple regression determining the factors influencing gross
margins for each legume type was not analyzed.
Table 6: Comparison of Gross Margins from Various Legumes (in ‘0000 Kshs)
Variable Beans Groundnu
ts
Soybeans Cowpeas Lablab
Ave. total earnings/acre 7.60±0.60a 13.1±1.70
b 6.00±0.50
a 1.70±1.00
ab 4.70±0.90
a
Average labor cost/acre 3.10±0.40a 7.20±0.60
ac 4.10±0.30
ac 0.70±0.20
b 3.02±030
c
Average fertilizer cost/acre 0.84±0.12a 0.82±0.08
a 0.69±0.07
a 0.05±0.05
a 0.82±0.08
a
Average seed cost/acre 0.78±0.07a 1.49±0.14
b 0.62±0.06
a 0.45±0.21
a 0.67±0.07
a
Ave. gross margin/acre 2.66±1.34ab
3.65±1.26ab
0.62±0.32ab
0.53±0.46ab
0.02±0.66ab
Note: Anova Results
Source: Survey Data (2015).
37
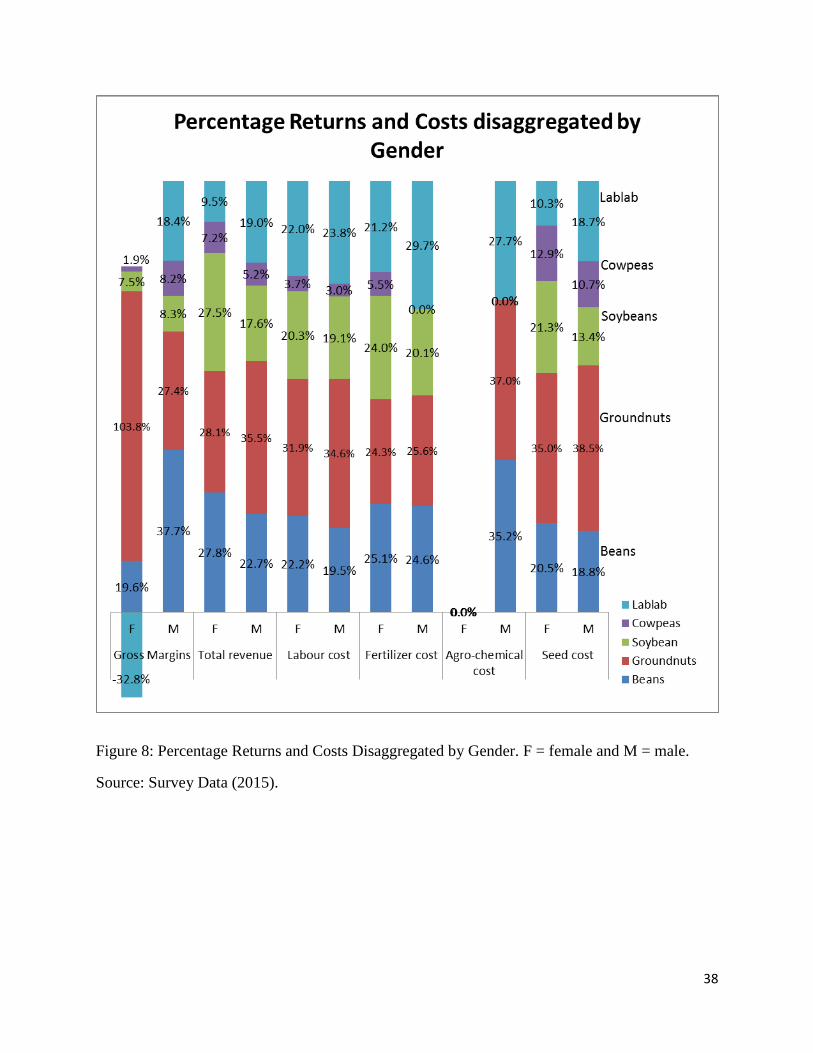
Again, disaggregating legume costs and returns by gender is shown in Figure 8. Some of the
outstanding differences were demonstrated in the use of agrochemicals. None of the female
headed households incurred costs from the use of agro chemicals. Contrary, in male headed
households, groundnut accounted for 37 percent of the total legume agro chemical costs.
However, none of the female and male headed households used agrochemicals in the production
of soybeans and cowpeas.
However, Figure 8 indicates that there was fair representation of allocation of seed, fertilizer and
labour costs across all the legumes among the male and female headed households. Female
headed households benefited more in groundnut production. On the other hand the male headed
households benefited more on beans production accounting for 38 percent of the total gross
margins from all the legumes and benefited less on the production of soybeans and cowpeas.
38
Figure 8: Percentage Returns and Costs Disaggregated by Gender. F = female and M = male.
Source: Survey Data (2015).
39
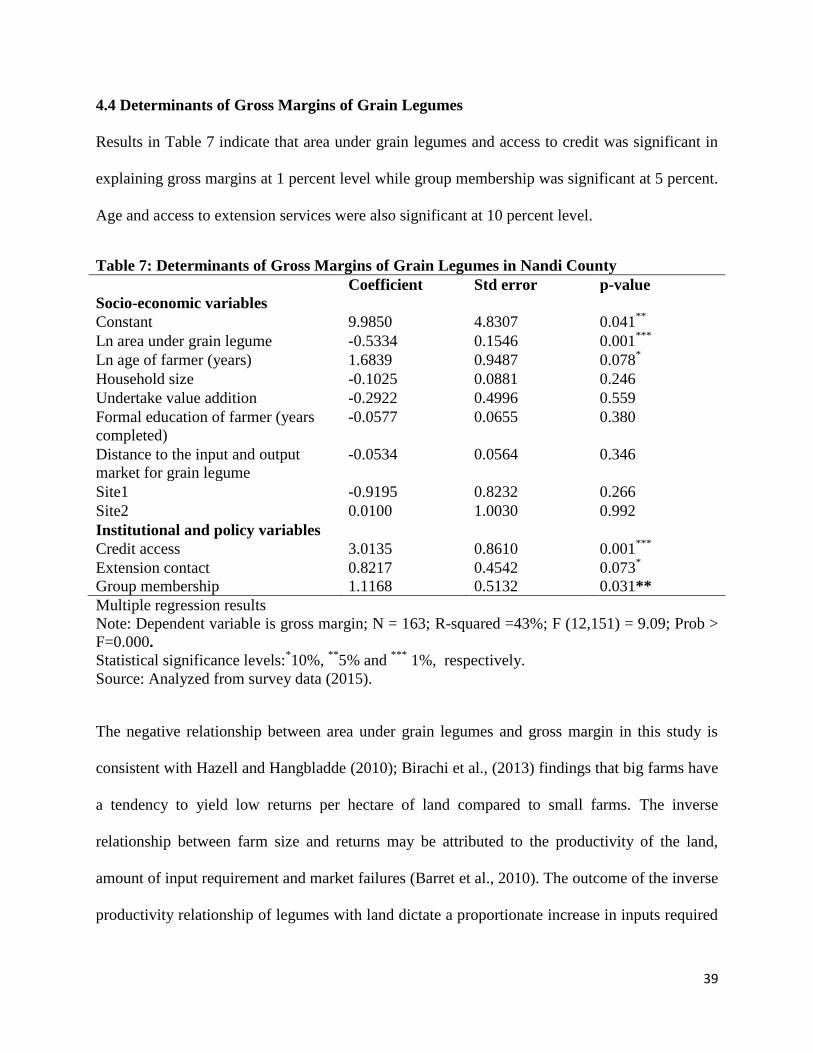
4.4 Determinants of Gross Margins of Grain Legumes
Results in Table 7 indicate that area under grain legumes and access to credit was significant in
explaining gross margins at 1 percent level while group membership was significant at 5 percent.
Age and access to extension services were also significant at 10 percent level.
Table 7: Determinants of Gross Margins of Grain Legumes in Nandi County
Multiple regression results
Note: Dependent variable is gross margin; N = 163; R-squared =43%; F (12,151) = 9.09; Prob >
F=0.000.
Statistical significance levels:*10%,
**5% and
*** 1%, respectively.
Source: Analyzed from survey data (2015).
The negative relationship between area under grain legumes and gross margin in this study is
consistent with Hazell and Hangbladde (2010); Birachi et al., (2013) findings that big farms have
a tendency to yield low returns per hectare of land compared to small farms. The inverse
relationship between farm size and returns may be attributed to the productivity of the land,
amount of input requirement and market failures (Barret et al., 2010). The outcome of the inverse
productivity relationship of legumes with land dictate a proportionate increase in inputs required
Coefficient Std error p-value
Socio-economic variables
Constant 9.9850 4.8307 0.041**
Ln area under grain legume -0.5334 0.1546 0.001***
Ln age of farmer (years) 1.6839 0.9487 0.078*
Household size -0.1025 0.0881 0.246
Undertake value addition -0.2922 0.4996 0.559
Formal education of farmer (years
completed)
-0.0577 0.0655 0.380
Distance to the input and output
market for grain legume
-0.0534 0.0564 0.346
Site1 -0.9195 0.8232 0.266
Site2 0.0100 1.0030 0.992
Institutional and policy variables
Credit access 3.0135 0.8610 0.001***
Extension contact 0.8217 0.4542 0.073*
Group membership 1.1168 0.5132 0.031**
40
for the production of the legumes for farmers to gain proportionately from the land increase
(Boughton et al., 2010).
However, age was positively related to gross margin, which is consistent with the findings of the
study by Ugwumba (2010) which indicated that higher age among farmers had a positive impact
on profitability of the farms. This could be attributed to the fact that older farmers have many
years of farming experience and therefore have gained better skills and knowledge over time. In
contrast, the results by Mishra et al. (1999) and Muhammad-Laval et al. (2012), which showed
that higher age among farmers, had a negative impact on profitability of the farms.
The coefficient of access to credit was significant (p < 0. 01) and positively related to gross
margin. Access to credit only generally increases liquidity. The results suggest that when access
to credit increased by one unit, all else equal, the gross margins of grain legumes would increase
by 3.09 Kenya shillings per acre. Further, profitability studies for instance (Fischer and Qaim,
2012) illustrated the importance of credit access to farmers could lead to higher returns. The
results further suggest that access to extension services increased the gross margins. This could
be attributed to farmers with access to extension services receiving trainings on best practices on
crop productions hence improving their skills about the crop. Results on extension services is
consistent with the findings of Sulumbe, et al., (2010).
Also, site was included in the regression model to determine whether it influenced profits
generated. Results indicated that the site where the legumes are grown did not have any influence
on gross margins of the legumes studied. Since the variable site was not significant in
determining the level of profits from the grain legumes, it was not important to compare factors
influencing gross margins per site.
41
Group membership had a positive relationship with grain legume gross margin i.e group
membership would increase gross margin. This was expected because farmers in groups could
have readily available farm inputs at a lower cost than non-members. As explained by Tolno et
al. (2015) that this could be due to bulk purchasing of farm inputs by the group members.
CHAPTER FIVE
SUMMARY, CONCLUSIONS AND POLICY RECOMMENDATIONS
5.1 Summary
This study aimed to explore utilization and gross margin of grain legumes in smallholder rural in
Nandi county. In order for farmers to accept and adopt new technologies presented to them, it is
important to determine whether farmers are benefiting from the new crop strategies or not.
Therefore, this study aimed at adding limited information on the extent of utilization patterns as
well as the actual benefits of the legumes introduced in Nandi County. The specific objectives
were: (1) assessment of utilization patterns and perceptions of farmers on grain legume
attributes. (2) economic analysis of legume gross margin (3) determinants of grain legume gross
margin. To achieve these objectives, a survey was conducted on 163 randomly selected
participants in three sites in Nandi county; Kapkerer, Koibem and Kiptaruswo, the sites where
MLP initiated the project. The survey procedure comprised of FGD; the pre-test survey and the
actual survey. Frequencies and percentages presented in tables and graphs were used to assess
extent of utilization of the legumes while gross margin analysis and multiple regression analysis
were used to evaluate the level of gross margin and determinants of gross margin respectively.
The first objective explored priorities for the use of the legumes that were introduced. In
addition, farmers’ opinion on the attributes of the grain legume species was assessed. The main
legume grown by most of the farmers was beans while the least was cowpeas. The results
42
showed that there is a broad diversity in the utilization of the legumes ranging from food to non-
food uses. Also legume wastes were used to make compost manure. Results showed farmers
preferred high yield, nutritional value, food value, early maturity and high market potential traits
of legume as opposed ease of storage and seed size characteristics which were not highly valued
by farmers. Therefore, the results showed that farmers preferred legumes that are high yielding,
early nutritious grain that could be eaten or sold and also legumes that have the ability to
improve soil fertility.
The second objective assessed the gross margin of the legume species. The gross margin results
indicated that the highest monetary returns from legume production were accrued in groundnuts,
beans, soybean and cowpeas whereas dolichos lablab was negative. Groundnut was found to
have the highest annual gross margin. Even though the gross margin of dolichos lablab was
found to be negative, it provided many other benefits, probably not given value in money terms,
such as shown from the results. A comparison of revenue from legumes, gross margin and
production costs across the five legumes exhibited similarities in all the legumes except lablab.
Further, labour was found to be more productive in groundnuts and cowpeas production as
compared to beans and soybeans (gross margin per unit labour was negative for lablab). Labour
costs contributed highest in terms of the total costs in the production of legumes. Cost on
agrochemicals was minimal.
The study also found out different factors to be influencing the gross margins of legumes.
Results on multiple regression showed credit, group membership, access to extension services
and age of the farmer were positive and significant in determining gross margins of legumes
while age was negative and significant.
43
5.2 Conclusions and Policy Recommendations
This study has examined trends in the of legumes utilization and the attributes that farmers
valued in legumes. The results suggest that the production of legumes is lucrative as it does not
only provide food to the household but it also a source of income not only for women but also to
men. Also results have suggested that legumes are crops that require a lot of labour input during
the production.
There is high diversity of legumes utilization among farmers as shown from the results. The
priorities for the use of legumes were mainly for income generation and home consumption as
opposed to other benefits such as for provision of fodder. This study has also shown that the
utilization of legumes depends on the type of legume.For groundnuts, farmers utilize it more for
income generation as much as for home consumption. Cowpeas was kept for seed and its leaves
were eaten as vegetables. This imply that cowpeas grain is underutilized. It was evident that
other uses other than income generation and food provision for dolichos lablab were valued. The
findings suggest that dolichos lablab was mostly used in making green manure as it has high
biomass provison. Moreover, soybean was preferred in making porridge as most farmers believe
that it has nutritious benefits. Farmers mainly utilize the grain of the legumes to make various
dishes as opposed to other parts such as leaves. Other non-food uses included; income
generation, medicinal purposes.
Generally, it was noted that there has been minimal grain legume processing undertaken. There
is need to enhance and diversify legume utilization trends for instance soybeans which has been
cited to take longer cooking hours through establishment of simple processing technologies. This
can be achieved through partnership with interested agencies in provision of simple processors to
44
farmers and collaboration in coaching on the use of the processing equipment. Also looking
market for produce and value addition may increase the diversification of utilization of legumes.
The choice of legume depends mainly on food value, yield potential, early maturity and market
potential. The results imply that farmers value high yielding, early maturing and marketable
legumes, for both home consumption and for the market. Breeders and scientific community
should take into account farmers’ opinions on a given technology for successful adoption.
Therefore farmer’s tradeoff legumes with the benefits they value most. For instance a farmer that
values fodder would prefer to grow lablab and tradeoff other legumes that would have provided
other benefits.
From the results, it is evident that legumes that were utilized mostly for income generation and
for home consumption such as groundnuts, beans and soybeans had higher gross margins as
compared to the others that were utilized for green manure and fodder. In addition, Credit, group
membership, access to extension services, area under legumes and age of the farmer play a
major role in enhancing economic returns from legumes.
Based on these findings, the following recommendation were made: Firstly, the low level of
gross margins may be attributed to high labour costs involved during the production, therefore
there is need to reduce labour requirements for instance through labour saving mechanical
technologies to offset rising labour costs for instance, adoption of labour saving processing
techniques like the simple shelling equipments for groundnuts. In addition increased
mechanization for ploughing and weeding and also less labor-demanding legume varieties
should be developed. There is need to introduce and develop high yielding, disease resistant new
varieties of lablab. Also, better extension service delivery to the farmers should also be put in
45
place through appraisal of the extension service activities by the county government. Another
feasible recommendation is organizing farmers into co-operative society into membership group
as it can improve access to facilities such as credit and also markets.
5.3 Contributions to Knowledge
This study focused on the utilization pattern, gross margin and factors affecting legumes gross
margins in Nandi County. Beans, soybeans, groundnuts, cowpeas and dolichos lablab were
introduced in Nandi County to improve the livelihood of farmers in the area through increased
nutrition and improved health benefits. This study revealed the trend of legumes utilization
mainly for home consumption as primary source of food.
In Kenya, grain legumes are known to be subsistence crops.The study reveals that smallholder
farmers of grain legumes are currently perceiving legume as an income generating crop.
However, the income generating ability of legumes depends on the type of legume grown. At the
same time, farmers are beginning to practise minimal value addition on legumes for instance for
the case of soybeans.
The study reveals that farmers are not only keen on the yields from the grain legumes, but they
want legumes that could also improve their nutritional status, health and incomes. Generally,
farmers prefer legumes that can meet their daily needs. The study emphasizes the importance of
strengthening the institutional framework especially extension service delivery through
appraisals at the county levels.
46
5.4 Suggestions for Further Research
The current study was limited valuing only tangible benefits. Therefore, researchers interested in
conducting research on legumes need to value other benefits derived from grain legumes such as
environmental, medicinal and non monetary benefits since the other uses are important too for
instance for environmental sustainability. Also, this study focused on total output after harvest
and did not include post harvest losses of grain legumes. Further research on consumer
preferences for various forms of value addition in legumes.
47
REFERENCES
Abang, M., Muthomi, J., Onyancha, J., Were, H., and Wesonga, M. (2014). Supporting
investment for up scaling of grain legumes in Western Kenya through assessing and
modeling the threat of biotic stressors. McKnight Foundation Collaborative Crops
Research Project No. 12-151. Cornell University.
Abdulahi, A. M. (1990). Pastoral Production Systems in Africa: A study of nomadic household
economy in central Somalia. Farming Systems in Resource Economics in the Tropics.
WissenschaftsverlagVauk Kiel, Germany.
Abdulai, A., and Binder, R. (2006). Slash-and-burn cultivation practice and agricultural input
demand and output supply. Environment and Development Economics, 11(02), 201-220.
Ahmad, B., Hassan, S., and Bakhsh, K. (2005). Factors affecting yield and profitability of carrot
in two districts of Punjab. International Journal of Agriculture and Biology, 7, 794-798.
Allen, M., Kilpatrik, D., Armstrong, M., Briggs, R. and Perez, N. (2002). Multistage cluster
sampling design and optimal sample sizes for estimation of fish discards from
commercial trawlers. Fisheries Research, 55: 11–24.
Bennett, J. and Birol, E. (2010). Choice experiments in developing countries: Implementation,
challenges and policy implications. Edward Elgar: Cheltenhalm Pages: 352.
Birachi, E., Zozo, R., Vanlauwe, B., Chianu, J., & Chiuri, W. (2013). An analysis of the
determinants of household level production and marketing of beans in Eastern Congo.
African Journal of Agricultural.
Chisoni, M. (2012). Economic analysis of the viability of the smallholder dairy farming in
Zambia. Master of Science Thesis, University of Zambia.
Chivenge, P., Mabhaudhi, T., Modi, A. , and Mafongoya, P. (2015). The potential role of
neglected and underutilised crop species as future crops under water scarce conditions in
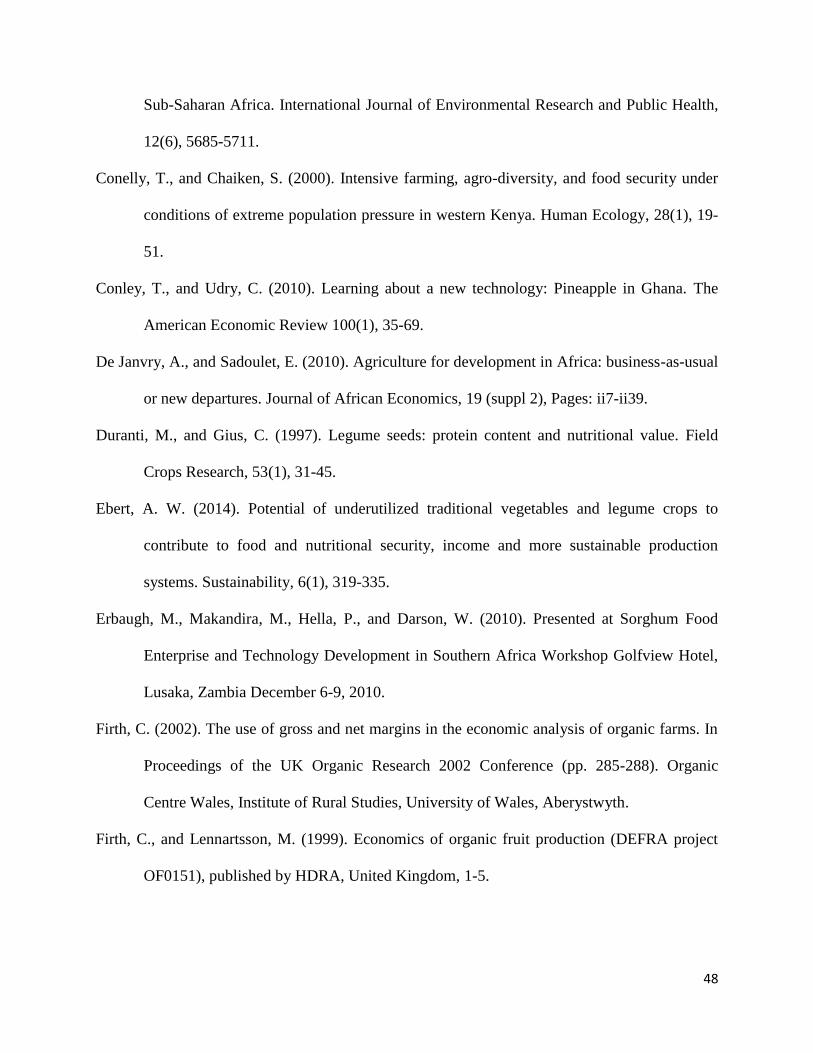
48
Sub-Saharan Africa. International Journal of Environmental Research and Public Health,
12(6), 5685-5711.
Conelly, T., and Chaiken, S. (2000). Intensive farming, agro-diversity, and food security under
conditions of extreme population pressure in western Kenya. Human Ecology, 28(1), 19-
51.
Conley, T., and Udry, C. (2010). Learning about a new technology: Pineapple in Ghana. The
American Economic Review 100(1), 35-69.
De Janvry, A., and Sadoulet, E. (2010). Agriculture for development in Africa: business-as-usual
or new departures. Journal of African Economics, 19 (suppl 2), Pages: ii7-ii39.
Duranti, M., and Gius, C. (1997). Legume seeds: protein content and nutritional value. Field
Crops Research, 53(1), 31-45.
Ebert, A. W. (2014). Potential of underutilized traditional vegetables and legume crops to
contribute to food and nutritional security, income and more sustainable production
systems. Sustainability, 6(1), 319-335.
Erbaugh, M., Makandira, M., Hella, P., and Darson, W. (2010). Presented at Sorghum Food
Enterprise and Technology Development in Southern Africa Workshop Golfview Hotel,
Lusaka, Zambia December 6-9, 2010.
Firth, C. (2002). The use of gross and net margins in the economic analysis of organic farms. In
Proceedings of the UK Organic Research 2002 Conference (pp. 285-288). Organic
Centre Wales, Institute of Rural Studies, University of Wales, Aberystwyth.
Firth, C., and Lennartsson, M. (1999). Economics of organic fruit production (DEFRA project
OF0151), published by HDRA, United Kingdom, 1-5.
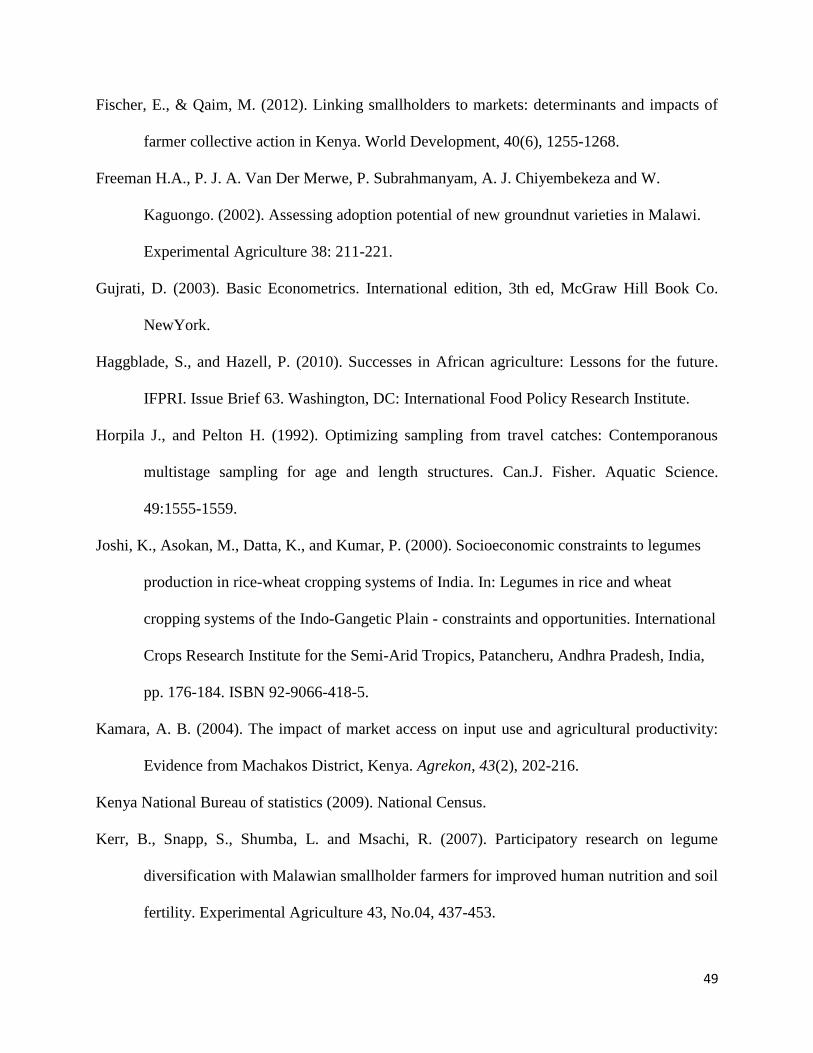
49
Fischer, E., & Qaim, M. (2012). Linking smallholders to markets: determinants and impacts of
farmer collective action in Kenya. World Development, 40(6), 1255-1268.
Freeman H.A., P. J. A. Van Der Merwe, P. Subrahmanyam, A. J. Chiyembekeza and W.
Kaguongo. (2002). Assessing adoption potential of new groundnut varieties in Malawi.
Experimental Agriculture 38: 211-221.
Gujrati, D. (2003). Basic Econometrics. International edition, 3th ed, McGraw Hill Book Co.
NewYork.
Haggblade, S., and Hazell, P. (2010). Successes in African agriculture: Lessons for the future.
IFPRI. Issue Brief 63. Washington, DC: International Food Policy Research Institute.
Horpila J., and Pelton H. (1992). Optimizing sampling from travel catches: Contemporanous
multistage sampling for age and length structures. Can.J. Fisher. Aquatic Science.
49:1555-1559.
Joshi, K., Asokan, M., Datta, K., and Kumar, P. (2000). Socioeconomic constraints to legumes
production in rice-wheat cropping systems of India. In: Legumes in rice and wheat
cropping systems of the Indo-Gangetic Plain - constraints and opportunities. International
Crops Research Institute for the Semi-Arid Tropics, Patancheru, Andhra Pradesh, India,
pp. 176-184. ISBN 92-9066-418-5.
Kamara, A. B. (2004). The impact of market access on input use and agricultural productivity:
Evidence from Machakos District, Kenya. Agrekon, 43(2), 202-216.
Kenya National Bureau of statistics (2009). National Census.
Kerr, B., Snapp, S., Shumba, L. and Msachi, R. (2007). Participatory research on legume
diversification with Malawian smallholder farmers for improved human nutrition and soil
fertility. Experimental Agriculture 43, No.04, 437-453.
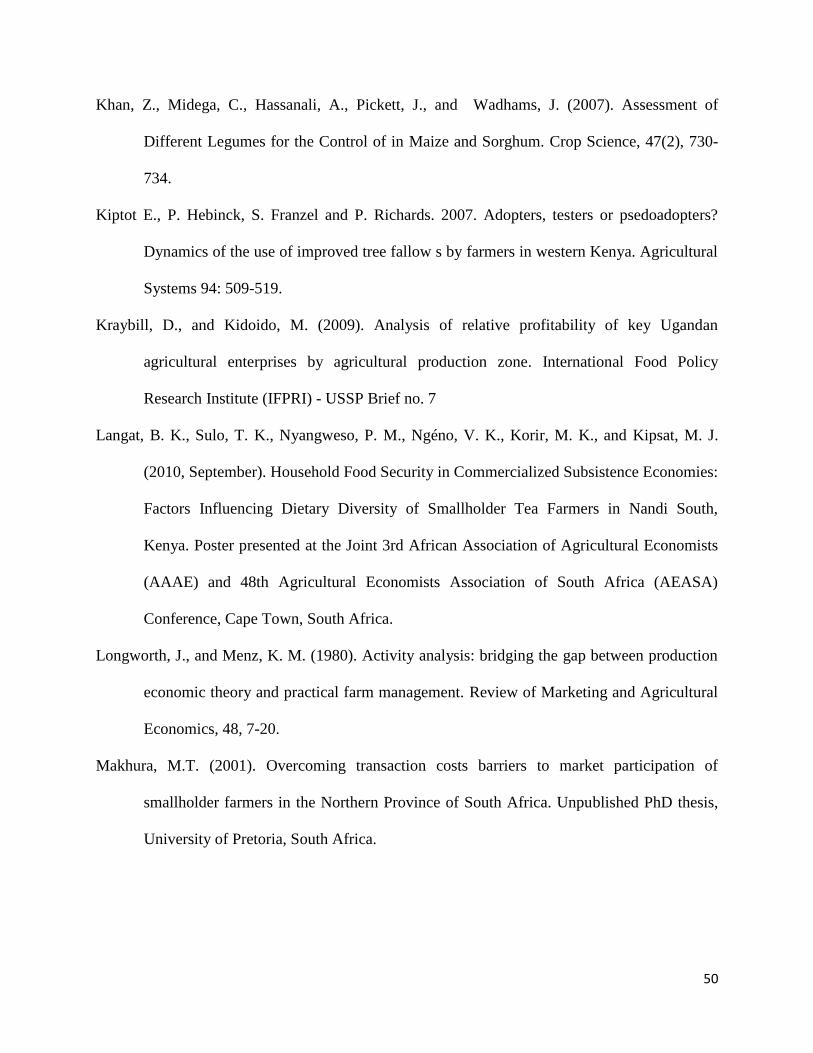
50
Khan, Z., Midega, C., Hassanali, A., Pickett, J., and Wadhams, J. (2007). Assessment of
Different Legumes for the Control of in Maize and Sorghum. Crop Science, 47(2), 730-
734.
Kiptot E., P. Hebinck, S. Franzel and P. Richards. 2007. Adopters, testers or psedoadopters?
Dynamics of the use of improved tree fallow s by farmers in western Kenya. Agricultural
Systems 94: 509-519.
Kraybill, D., and Kidoido, M. (2009). Analysis of relative profitability of key Ugandan
agricultural enterprises by agricultural production zone. International Food Policy
Research Institute (IFPRI) - USSP Brief no. 7
Langat, B. K., Sulo, T. K., Nyangweso, P. M., Ngéno, V. K., Korir, M. K., and Kipsat, M. J.
(2010, September). Household Food Security in Commercialized Subsistence Economies:
Factors Influencing Dietary Diversity of Smallholder Tea Farmers in Nandi South,
Kenya. Poster presented at the Joint 3rd African Association of Agricultural Economists
(AAAE) and 48th Agricultural Economists Association of South Africa (AEASA)
Conference, Cape Town, South Africa.
Longworth, J., and Menz, K. M. (1980). Activity analysis: bridging the gap between production
economic theory and practical farm management. Review of Marketing and Agricultural
Economics, 48, 7-20.
Makhura, M.T. (2001). Overcoming transaction costs barriers to market participation of
smallholder farmers in the Northern Province of South Africa. Unpublished PhD thesis,
University of Pretoria, South Africa.
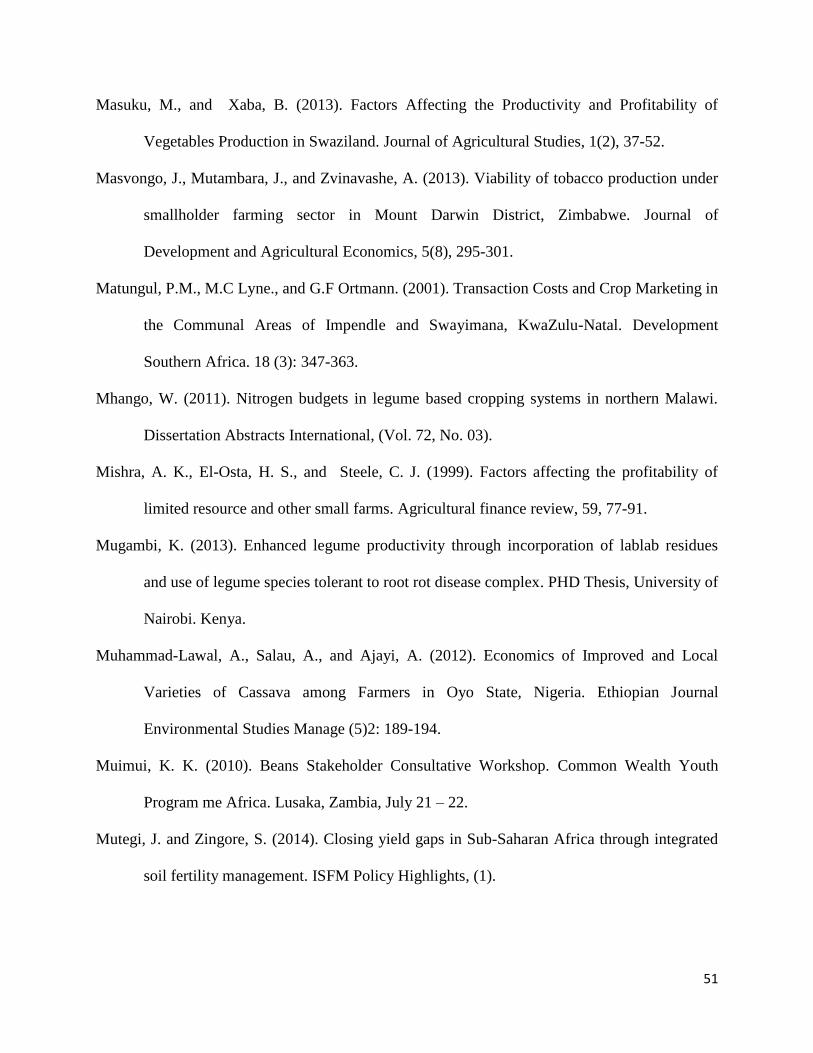
51
Masuku, M., and Xaba, B. (2013). Factors Affecting the Productivity and Profitability of
Vegetables Production in Swaziland. Journal of Agricultural Studies, 1(2), 37-52.
Masvongo, J., Mutambara, J., and Zvinavashe, A. (2013). Viability of tobacco production under
smallholder farming sector in Mount Darwin District, Zimbabwe. Journal of
Development and Agricultural Economics, 5(8), 295-301.
Matungul, P.M., M.C Lyne., and G.F Ortmann. (2001). Transaction Costs and Crop Marketing in
the Communal Areas of Impendle and Swayimana, KwaZulu-Natal. Development
Southern Africa. 18 (3): 347-363.
Mhango, W. (2011). Nitrogen budgets in legume based cropping systems in northern Malawi.
Dissertation Abstracts International, (Vol. 72, No. 03).
Mishra, A. K., El-Osta, H. S., and Steele, C. J. (1999). Factors affecting the profitability of
limited resource and other small farms. Agricultural finance review, 59, 77-91.
Mugambi, K. (2013). Enhanced legume productivity through incorporation of lablab residues
and use of legume species tolerant to root rot disease complex. PHD Thesis, University of
Nairobi. Kenya.
Muhammad-Lawal, A., Salau, A., and Ajayi, A. (2012). Economics of Improved and Local
Varieties of Cassava among Farmers in Oyo State, Nigeria. Ethiopian Journal
Environmental Studies Manage (5)2: 189-194.
Muimui, K. K. (2010). Beans Stakeholder Consultative Workshop. Common Wealth Youth
Program me Africa. Lusaka, Zambia, July 21 – 22.
Mutegi, J. and Zingore, S. (2014). Closing yield gaps in Sub-Saharan Africa through integrated
soil fertility management. ISFM Policy Highlights, (1).
52
Mutuma, P., Okello, J., Karanja, K. and Woomer, L. (2014). Smallholder farmers’ use and
profitability of legume inoculants in Western Kenya. Africa Crop Science Journal, Vol
22, No. 3, 205-213.
Mwangi T. and Wanjekeche E. (1997). Performance and acceptability of new food legumes in
Cheptuya village of West Pokot district, Kenya. In Mureithi JG, ed. Participatory
technology development for food management by smallholders in Kenya. Proceedings of
the 2nd Scientific Conference of the Soil Management and Legume Research Network
Projects, 281 287.
Mwenye, D. (2003). Evaluation and promotion of various classes of annual legumes with
farmers in Chiota, Zimbabwe. Waddington, S.R. (ed.) 2003. Grain Legumes and Green
Manures for Soil Fertility in Southern Africa: Taking Stock of Progress. Proceedings of a
Conference held 8-11 October 2002 at the Leopard Rock Hotel, Vumba, Zimbabwe. Soil
Fert Net and CIMMYT-Zimbabwe, Harare,.Zimbabwe. 246 pp.
Nemes, N. (2009). Comparative analysis of organic and non-organic farming systems: A critical
assessment of farm profitability. Natural Resources Management and Environment
Department (Ed.) Department (Ed.), FAO, Rome.
Ngugi, K., Gitau, R., and Nyoro, J. (2007). Access to High Value Markets by Smallholder
Farmers of African Indigenous Vegetables in Kenya, IIED, London. Published by:
Sustainable Markets Group International Institute for Environment and Development
(IIED).3 Endsleigh Street. London WC1H 0DD.
Ngwira, A., Simtowe, F., and Siambi, M. (2012). Assessing the competitiveness of groundnut
production in Malawi: a policy analysis matrix approach.Odendo, M., Ojiem, J., Bationo,
A., and Mudeheri, M. (2006). On-farm evaluation and scaling-up of soil fertility
53
management technologies in western Kenya. Nutrient Cycling in Agroecosystems, 76(2-
3), 369-381.
Nhemachena, C., Murwira, H. , Mutiro, K., and Chivenge, P. (2003). A Socio-economic
Analysi s of Legume Production Motives and Productivity Variations Among
Smallholder Farmers of Shurugwi Communal Area, Zimbabwe. In Grain Legumes and
Green Manures for Soil Fertility in Southern Africa: Taking Stock of Progress:
Proceedings of a Conference Held 8-11 October 2002 at the Leopard Rock Hotel,
Vumba, Zimbabwe (p. 223). Cimmyt.
Njeru, C., Okalebo, R., Ojiem, J., Othieno, Lauren, J., and Medvecky, B. (2007) Maize-Bean
intercrop response to sole and combined organic and inorganic fertilizer application in
low and high fertility areas of Nandi South district. Proceedings of the 12th KARI
biennial scientific Conference, Kenya Agricultural Research Institute, Nairobi, Kenya.
Nyoro, J. (2002) Agriculture and Rural Growth in Kenya. Nairobi. Tegemeo Institute, Egerton
University.
Odendo, M., Ojiem, J., Bationo, A., and Mudeheri, M. (2006). On-farm evaluation and scaling-
up of soil fertility management technologies in western Kenya. Nutrient Cycling in
Agroecosystems, 76(2-3), 369-381.
Ojiem, J. O., De Ridder, N., Vanlauwe, B., and Giller, K. E. (2006). Socio-ecological niche: a
conceptual framework for integration of legumes in smallholder farming systems.
International Journal of Agricultural Sustainability, 4(1), 79-93.
Ojiem, J., Medvecky, B., Muthomi, J., Mwonga, S., Omondi, B., Ambuga, J. and Lubondi, J.
(2013). Multipurpose legumes for health and productivity of smallholder farming
systems. McKnight Foundation Collaborative Crops Research Project Grant No: 10-473 .
54
Olukosi, J.O. and Erhabor, A.O. (1988). Introduction to Farm Management Economics:
Principles and Application. Agitab Publisher Limited, Zaria, Nigeria, 16- 18.
Omondi, O. (2011). The potential for njahi (lablab purpureus l.) in improving consumption
adequacy for protein, iron and zinc in households: a case for nandi south district, Kenya .
Msc Thesis, Department of Food Technology and Nutrition, Nairobi University, Kenya.
Onyango, E. (2010). Perception of farmers on vigour enhancing strategies for crop and soil
fertility management in Nandi South District: Msc Thesis, Department of Applied
Environmental Social Sciences, Moi University.
Otieno, D. J., Omiti, J., Nyanamba, T., and McCullough, E. (2009). Market participation by
vegetable farmers in Kenya: A comparison of rural and peri-urban areas. African Journal
of Agricultural Research, 4(5), 451-460.
Randela, R., Liebenberg, C., Kirsten, J., and Townsend, R. (2000). Demand for livestock tick
control service in the Venda region, Northern Province. Agrekon, 39(4), 644-655.
Rogers E., (1995). Diffusion of innovation. 4th Edition. New York. The Free Press.
Rowe, E., and Giller, K. (2003). Legumes for soil fertility in southern Africa: Needs, potential
and realities. Grain Legumes and Green Manures for Soil Fertility in Southern Africa:
Taking Stock of Progress. Soil Fert Net-CIMMYT, Harare, Zimbabwe, 15-19.
Samboko, P. C. (2011). An assessment of factors influencing the profitability of bean production
in Zambia. B. Sc. project dissertation, University of Zambia.
Shivachi, A., Kiplagat, K. O., and Kinyua, G. M. (2012). Microsatellite analysis of selected
Lablab purpureus genotypes in Kenya. Rwanda Journal, 28(1), 39-52.
Singh, I., Squire, L., and Strauss, J. (1986). Agricultural household models: extensions,
applications, and policy. Johns Hopkins University Press.
55
Snapp, S., and Silim, S. (2002). Farmer preferences and legume intensification for low nutrient
environments. In Food Security in Nutrient-Stressed Environments: Exploiting Plants’
Genetic Capabilities (pp. 289-300). Springer Netherlands.
Sulumbe, M, Iheanacho, C, Mohammed, T. (2010). Profitability Analysis of Cotton Production
under sole-cropping system in Adamawa State, Nigeria. Journal of Sustainable
Development in Agriculture and Environment (Paraclete publishers) 5, no.1 (March,
2010).
Tolno, E., Kobayashi, H., Ichizen, M., Esham, M., & Balde, B. S. (2015). Economic Analysis of
the Role of Farmer Organizations in Enhancing Smallholder Potato Farmers' Income in
Middle Guinea. Journal of Agricultural Science, 7(3), 123.
Tshering, C. (2002). Profitability analysis of bean production in Honduras. Agricultural
Economics Report, 616.
Ugwumba, C. (2010). Environmental Sustainability and Profitability of Integrated Fish cum
Crop Farming in Anambra State, Nigeria. Agriculture Journal (5)3: 229-233.
Wanjekeche, E., Mwangi, T. J., Kamidi, M., Powon, P., and Khaemba, J. (2003). Farmer
participation in the evaluation of grain legumes in north-western Kenya. JG Mureithi;
CK Gachene; FN Muyekho,39: 273-279.
Wooldridge, J. (2003). Introductory econometrics: A modern approach. Second edition; Mason,
OH: Thomson South-Western.
Xiao,Y., Wen-Rong, C., and Ying, F. (2007). Improving human micronutrient nutrition through
biofortification in the soil–plant system: China as a case study. Environ Geochem
Health, Vol.29, p.413–428.
56
Zulu, E. (2011). Profitability of Smallholder Cowpea Production in Zambia. B.Sc Thesis
University of Zambia, Lusaka.
.
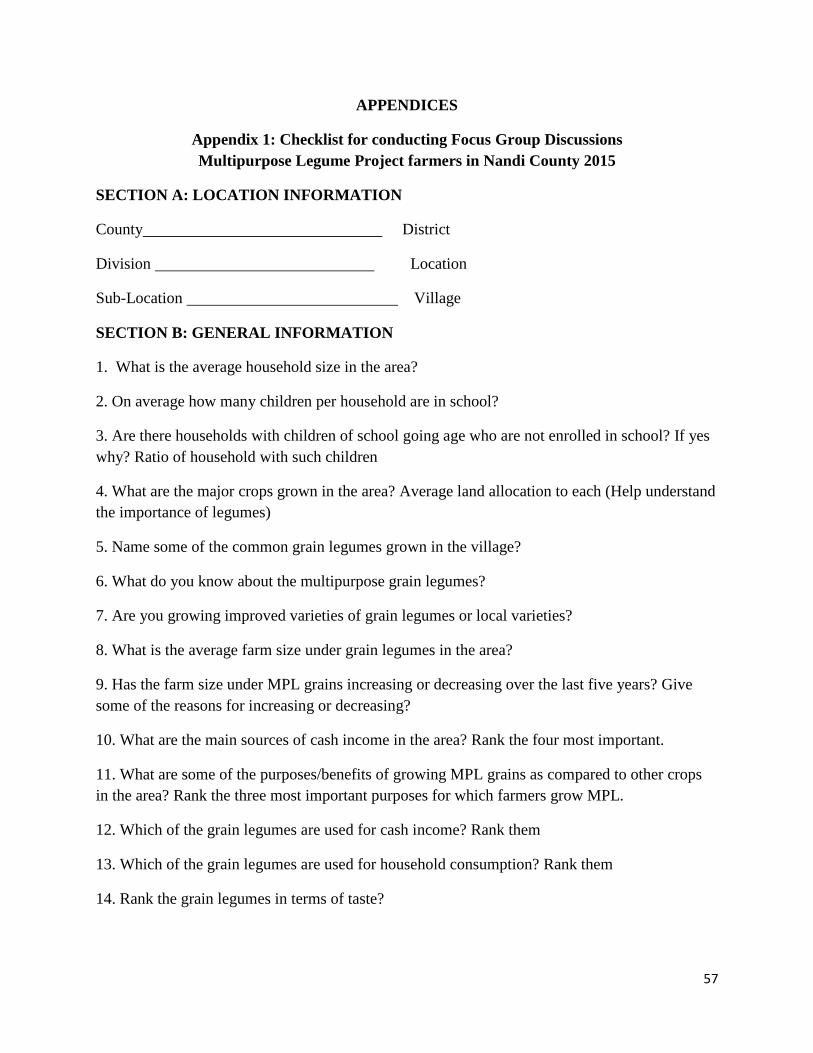
57
APPENDICES
Appendix 1: Checklist for conducting Focus Group Discussions
Multipurpose Legume Project farmers in Nandi County 2015
SECTION A: LOCATION INFORMATION
County District
Division Location
Sub-Location Village
SECTION B: GENERAL INFORMATION
1. What is the average household size in the area?
2. On average how many children per household are in school?
3. Are there households with children of school going age who are not enrolled in school? If yes
why? Ratio of household with such children
4. What are the major crops grown in the area? Average land allocation to each (Help understand
the importance of legumes)
5. Name some of the common grain legumes grown in the village?
6. What do you know about the multipurpose grain legumes?
7. Are you growing improved varieties of grain legumes or local varieties?
8. What is the average farm size under grain legumes in the area?
9. Has the farm size under MPL grains increasing or decreasing over the last five years? Give
some of the reasons for increasing or decreasing?
10. What are the main sources of cash income in the area? Rank the four most important.
11. What are some of the purposes/benefits of growing MPL grains as compared to other crops
in the area? Rank the three most important purposes for which farmers grow MPL.
12. Which of the grain legumes are used for cash income? Rank them
13. Which of the grain legumes are used for household consumption? Rank them
14. Rank the grain legumes in terms of taste?
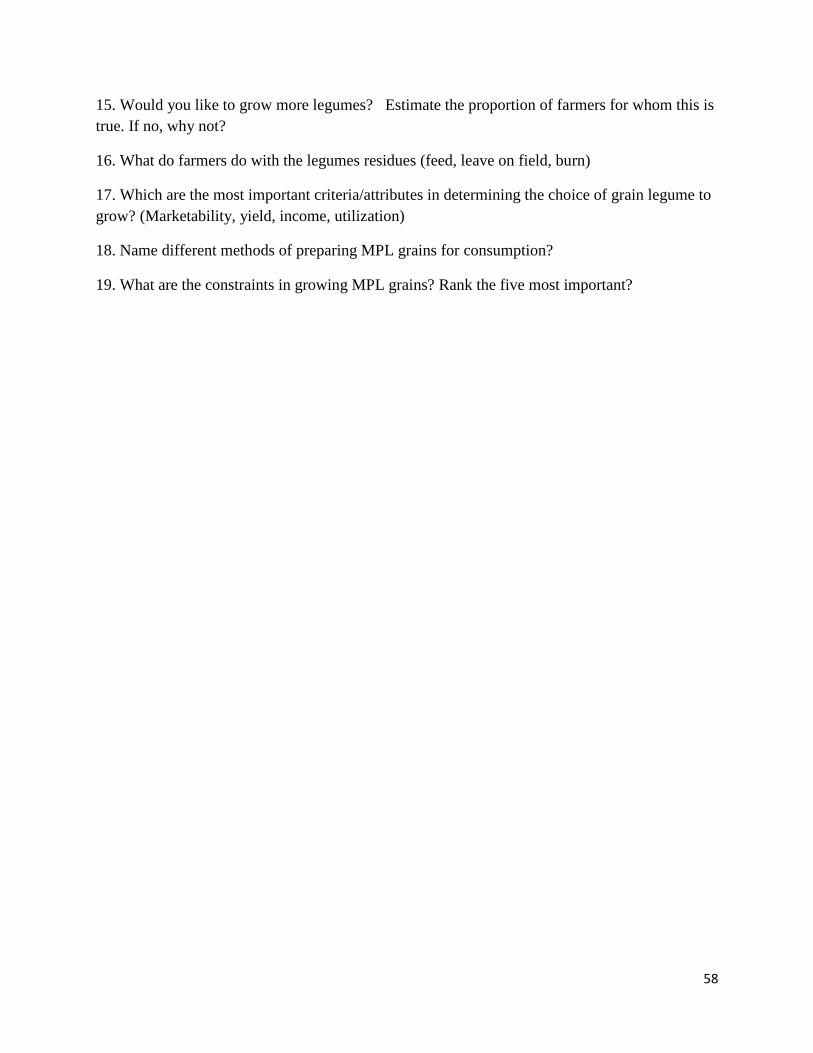
58
15. Would you like to grow more legumes? Estimate the proportion of farmers for whom this is
true. If no, why not?
16. What do farmers do with the legumes residues (feed, leave on field, burn)
17. Which are the most important criteria/attributes in determining the choice of grain legume to
grow? (Marketability, yield, income, utilization)
18. Name different methods of preparing MPL grains for consumption?
19. What are the constraints in growing MPL grains? Rank the five most important?
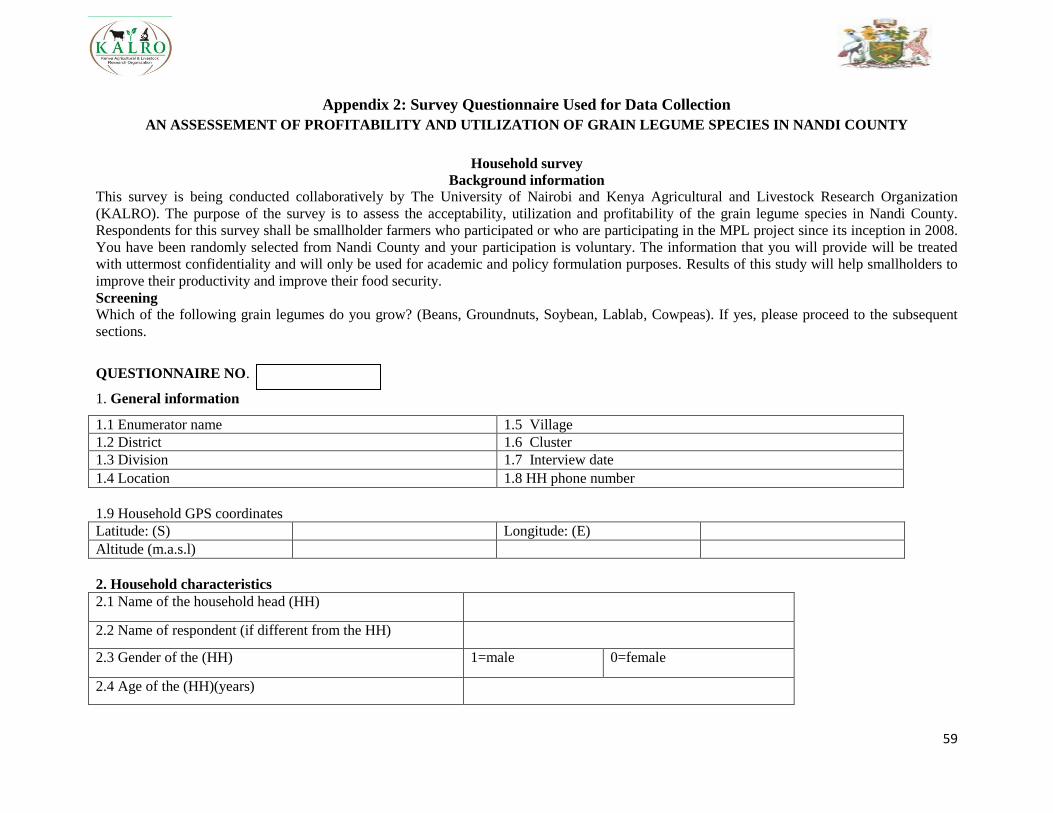
59
Appendix 2: Survey Questionnaire Used for Data Collection
AN ASSESSEMENT OF PROFITABILITY AND UTILIZATION OF GRAIN LEGUME SPECIES IN NANDI COUNTY
Household survey
Background information
This survey is being conducted collaboratively by The University of Nairobi and Kenya Agricultural and Livestock Research Organization
(KALRO). The purpose of the survey is to assess the acceptability, utilization and profitability of the grain legume species in Nandi County.
Respondents for this survey shall be smallholder farmers who participated or who are participating in the MPL project since its inception in 2008.
You have been randomly selected from Nandi County and your participation is voluntary. The information that you will provide will be treated
with uttermost confidentiality and will only be used for academic and policy formulation purposes. Results of this study will help smallholders to
improve their productivity and improve their food security.
Screening
Which of the following grain legumes do you grow? (Beans, Groundnuts, Soybean, Lablab, Cowpeas). If yes, please proceed to the subsequent
sections.
QUESTIONNAIRE NO.
1. General information
1.1 Enumerator name 1.5 Village
1.2 District 1.6 Cluster
1.3 Division 1.7 Interview date
1.4 Location 1.8 HH phone number
1.9 Household GPS coordinates
Latitude: (S) Longitude: (E)
Altitude (m.a.s.l)
2. Household characteristics
2.1 Name of the household head (HH)
2.2 Name of respondent (if different from the HH)
2.3 Gender of the (HH) 1=male 0=female
2.4 Age of the (HH)(years)
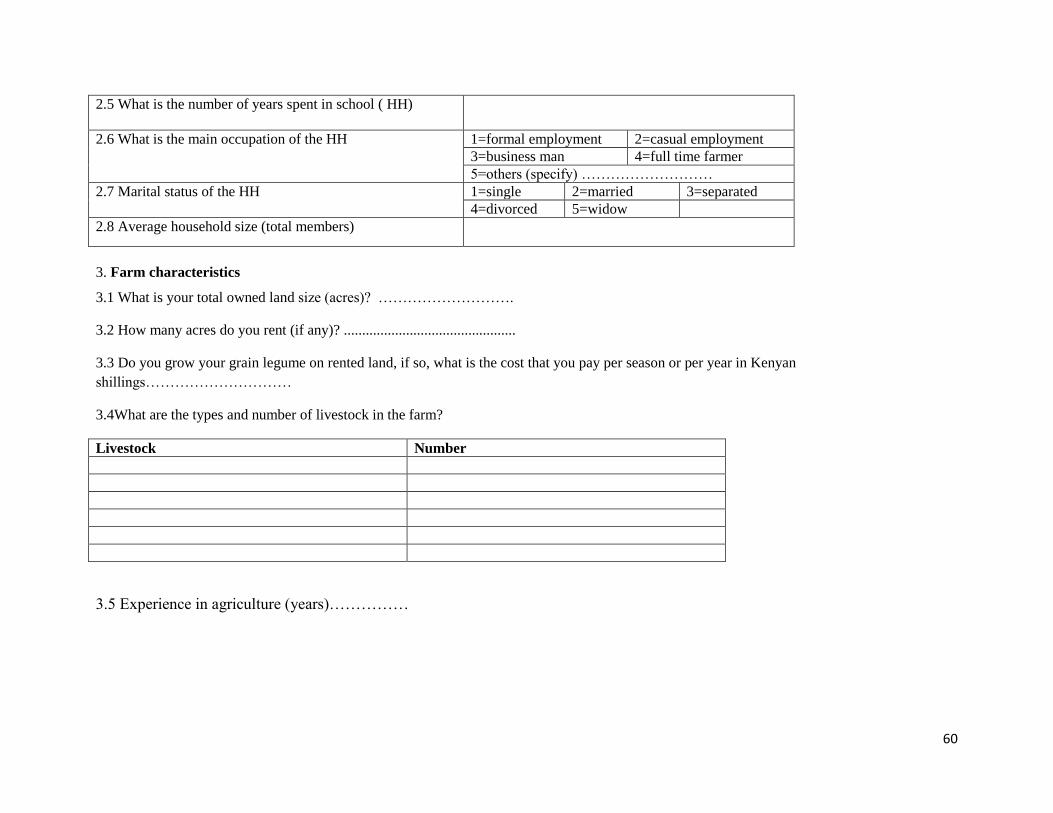
60
2.5 What is the number of years spent in school ( HH)
2.6 What is the main occupation of the HH 1=formal employment 2=casual employment
3=business man 4=full time farmer
5=others (specify) ………………………
2.7 Marital status of the HH 1=single 2=married 3=separated
4=divorced 5=widow
2.8 Average household size (total members)
3. Farm characteristics
3.1 What is your total owned land size (acres)? ……………………….
3.2 How many acres do you rent (if any)? ...............................................
3.3 Do you grow your grain legume on rented land, if so, what is the cost that you pay per season or per year in Kenyan
shillings…………………………
3.4What are the types and number of livestock in the farm?
Livestock Number
3.5 Experience in agriculture (years)……………
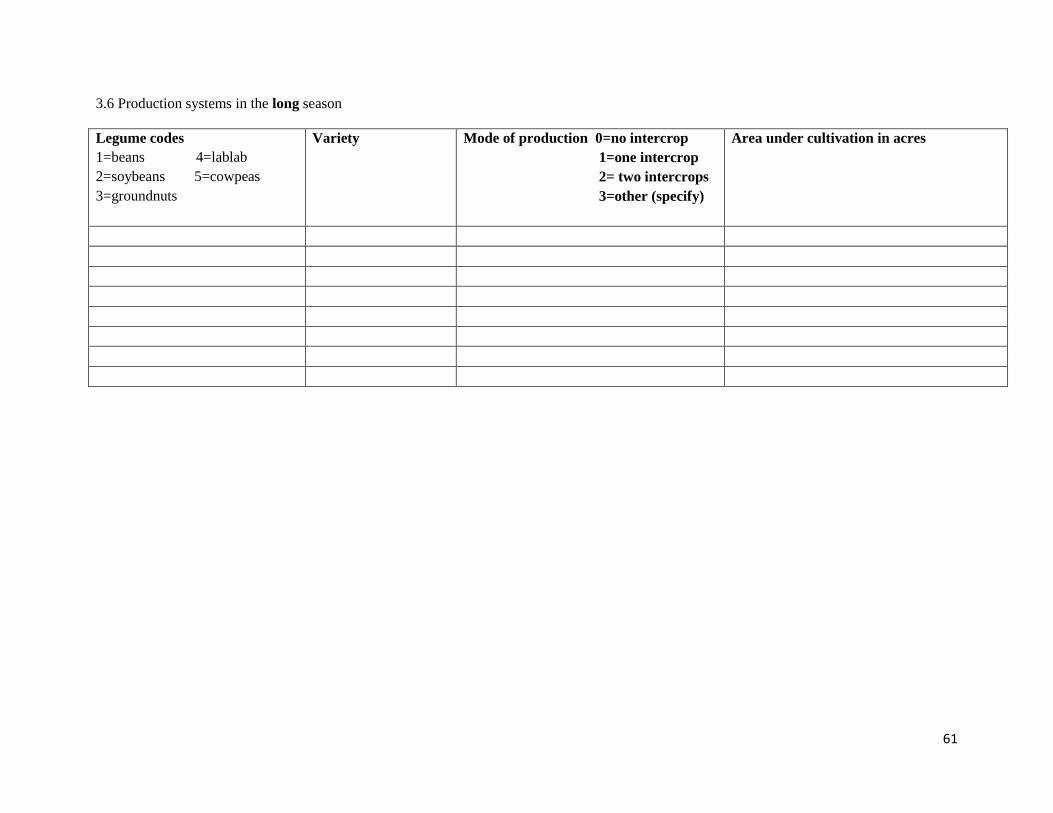
61
3.6 Production systems in the long season
Legume codes
1=beans 4=lablab
2=soybeans 5=cowpeas
3=groundnuts
Variety Mode of production 0=no intercrop
1=one intercrop
2= two intercrops
3=other (specify)
Area under cultivation in acres
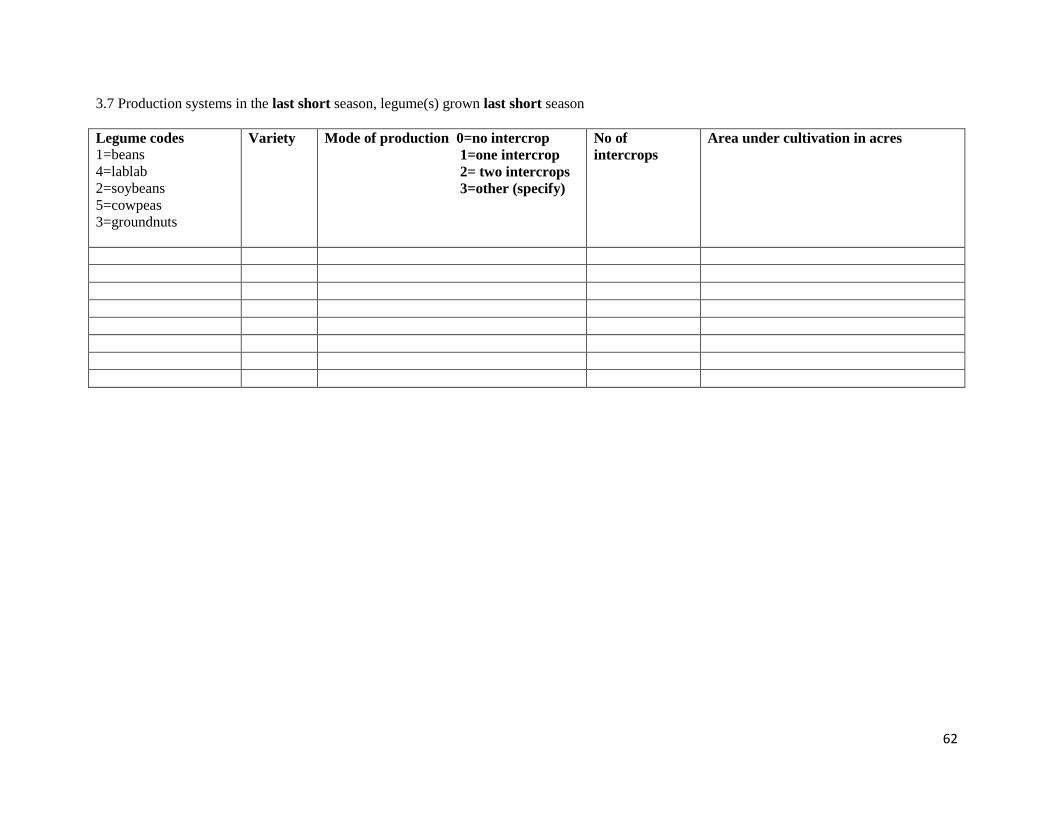
62
3.7 Production systems in the last short season, legume(s) grown last short season
Legume codes
1=beans
4=lablab
2=soybeans
5=cowpeas
3=groundnuts
Variety Mode of production 0=no intercrop
1=one intercrop
2= two intercrops
3=other (specify)
No of
intercrops
Area under cultivation in acres
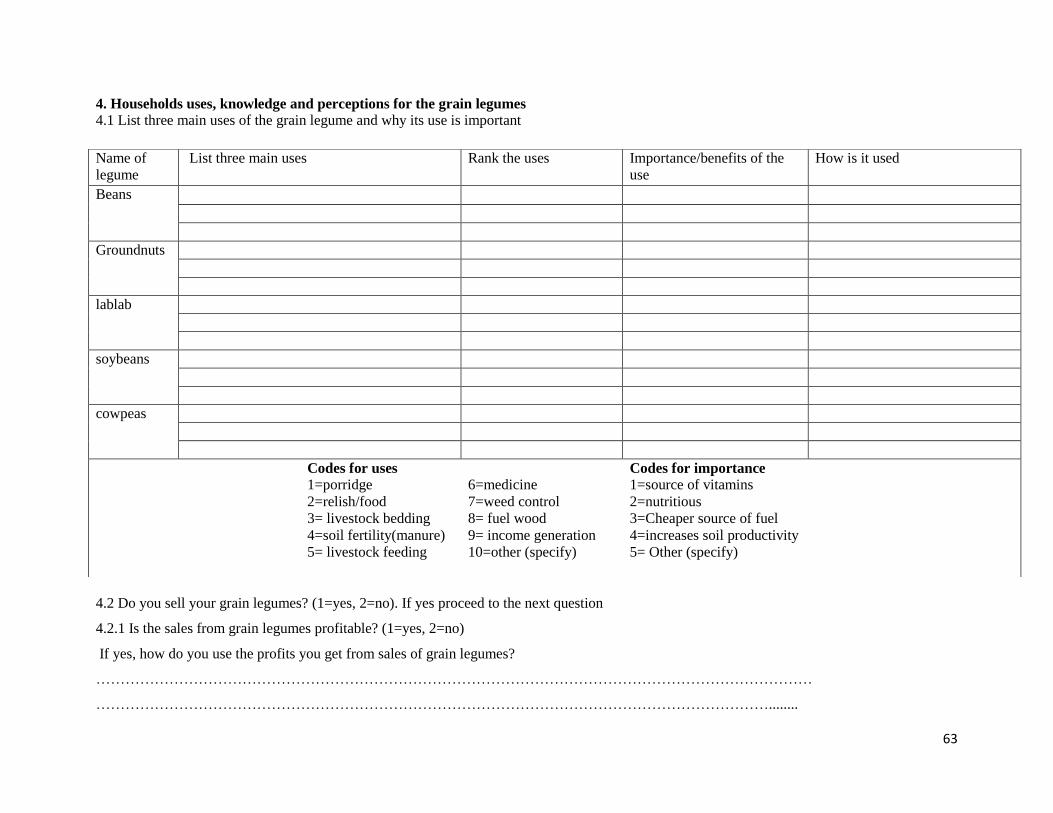
63
4. Households uses, knowledge and perceptions for the grain legumes
4.1 List three main uses of the grain legume and why its use is important
4.2 Do you sell your grain legumes? (1=yes, 2=no). If yes proceed to the next question
4.2.1 Is the sales from grain legumes profitable? (1=yes, 2=no)
If yes, how do you use the profits you get from sales of grain legumes?
…………………………………………………………………………………………………………………………………
…………………………………………………………………………………………………………………………........
Name of
legume
List three main uses Rank the uses Importance/benefits of the
use
How is it used
Beans
Groundnuts
lablab
soybeans
cowpeas
Codes for uses
1=porridge
2=relish/food
3= livestock bedding
4=soil fertility(manure)
5= livestock feeding
6=medicine
7=weed control
8= fuel wood
9= income generation
10=other (specify)
Codes for importance
1=source of vitamins
2=nutritious
3=Cheaper source of fuel
4=increases soil productivity
5= Other (specify)
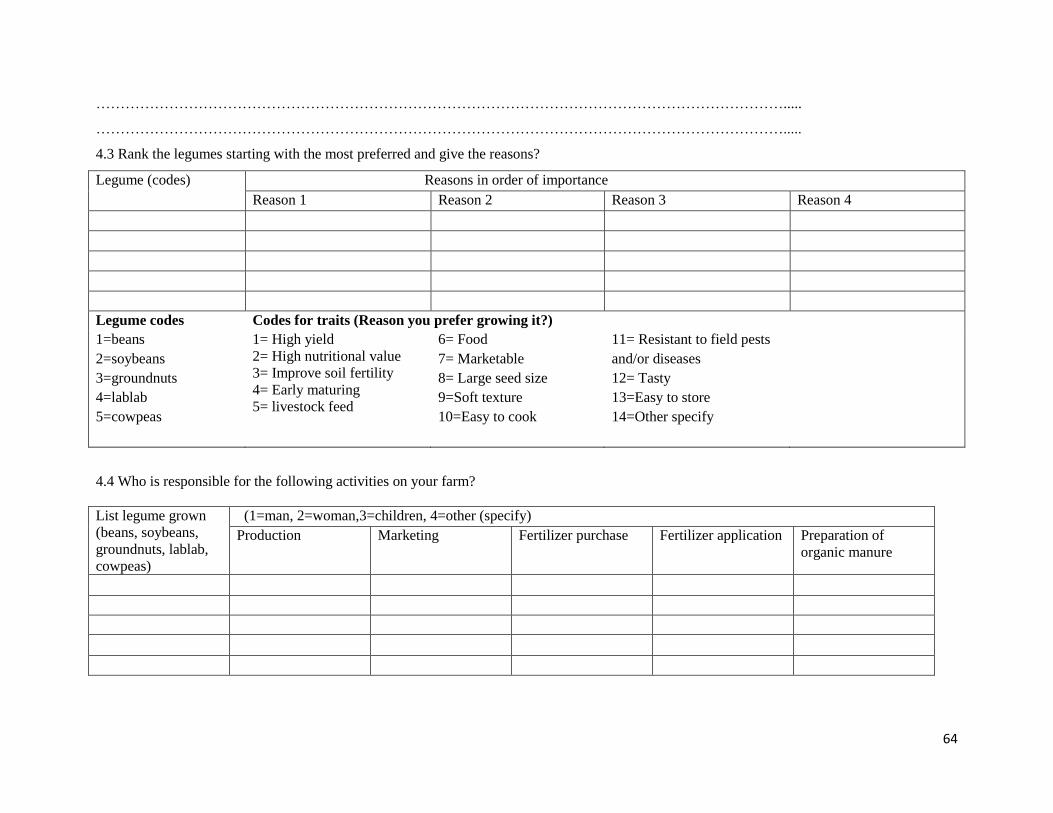
64
…………………………………………………………………………………………………………………………….....
…………………………………………………………………………………………………………………………….....
4.3 Rank the legumes starting with the most preferred and give the reasons?
Legume (codes) Reasons in order of importance
Reason 1 Reason 2 Reason 3 Reason 4
Legume codes Codes for traits (Reason you prefer growing it?)
1=beans
2=soybeans
3=groundnuts
4=lablab
5=cowpeas
1= High yield
2= High nutritional value
3= Improve soil fertility
4= Early maturing
5= livestock feed
6= Food
7= Marketable
8= Large seed size
9=Soft texture
10=Easy to cook
11= Resistant to field pests
and/or diseases
12= Tasty
13=Easy to store
14=Other specify
4.4 Who is responsible for the following activities on your farm?
List legume grown
(beans, soybeans,
groundnuts, lablab,
cowpeas)
(1=man, 2=woman,3=children, 4=other (specify)
Production Marketing Fertilizer purchase Fertilizer application Preparation of
organic manure
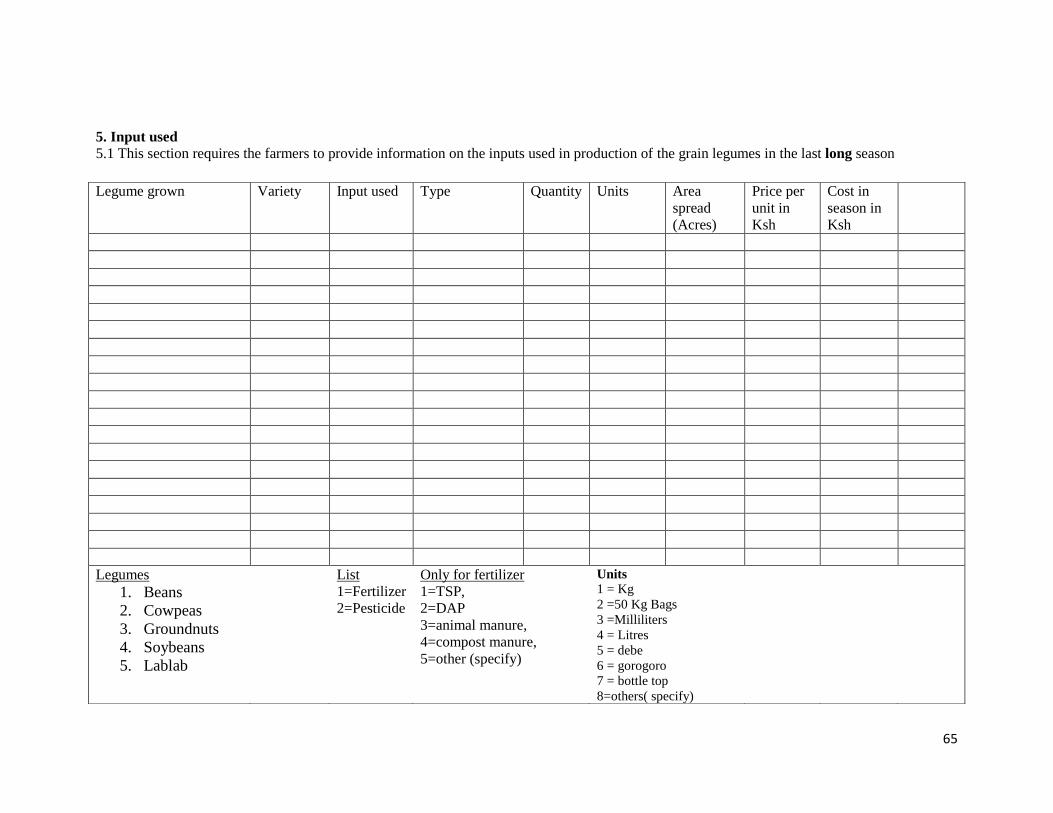
65
5. Input used
5.1 This section requires the farmers to provide information on the inputs used in production of the grain legumes in the last long season
Legume grown Variety Input used Type Quantity Units Area
spread
(Acres)
Price per
unit in
Ksh
Cost in
season in
Ksh
Legumes
1. Beans
2. Cowpeas
3. Groundnuts
4. Soybeans
5. Lablab
List
1=Fertilizer
2=Pesticide
Only for fertilizer
1=TSP,
2=DAP
3=animal manure,
4=compost manure,
5=other (specify)
Units
1 = Kg
2 =50 Kg Bags
3 =Milliliters
4 = Litres
5 = debe
6 = gorogoro
7 = bottle top 8=others( specify)
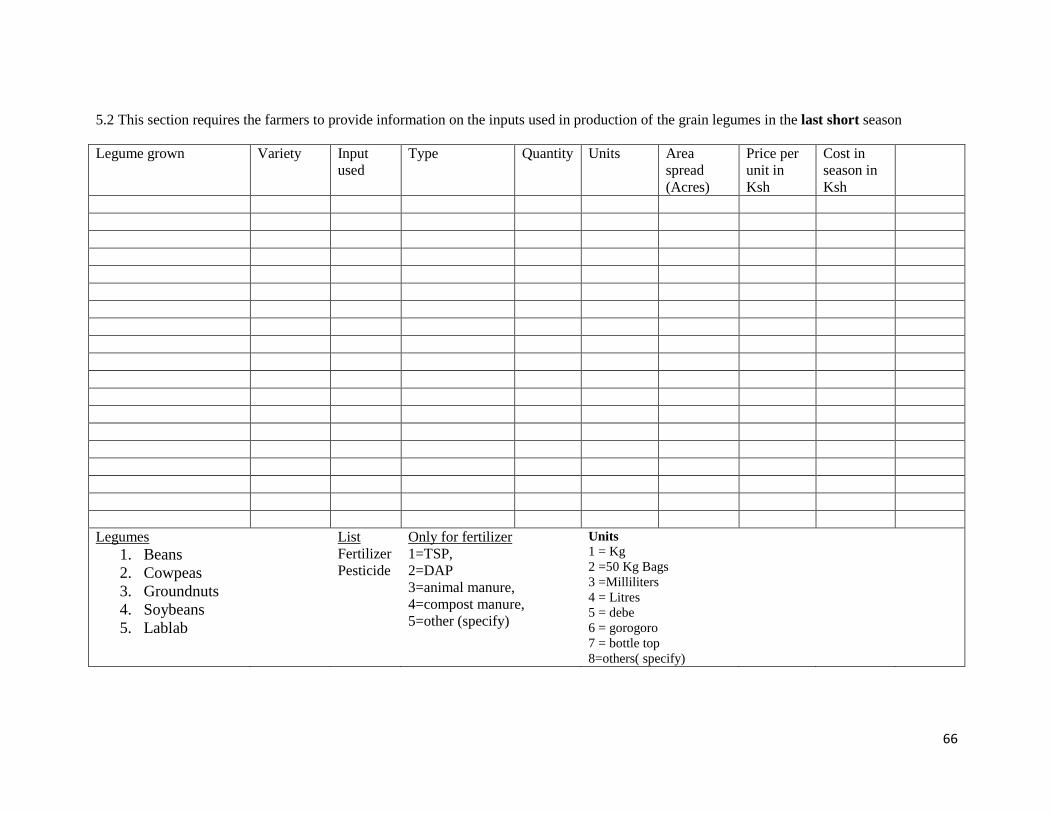
66
5.2 This section requires the farmers to provide information on the inputs used in production of the grain legumes in the last short season
Legume grown Variety Input
used
Type Quantity Units Area
spread
(Acres)
Price per
unit in
Ksh
Cost in
season in
Ksh
Legumes
1. Beans
2. Cowpeas
3. Groundnuts
4. Soybeans
5. Lablab
List
Fertilizer
Pesticide
Only for fertilizer
1=TSP,
2=DAP
3=animal manure,
4=compost manure,
5=other (specify)
Units
1 = Kg
2 =50 Kg Bags
3 =Milliliters
4 = Litres
5 = debe
6 = gorogoro
7 = bottle top 8=others( specify)
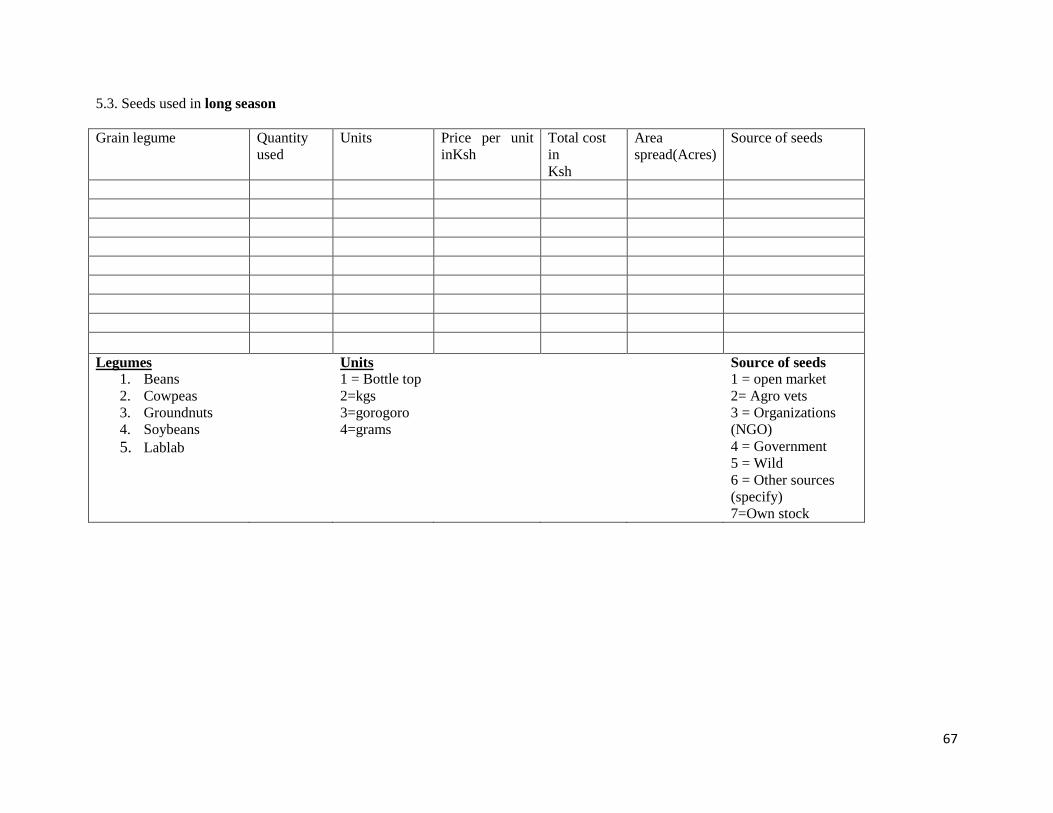
67
5.3. Seeds used in long season
Grain legume Quantity
used
Units Price per unit
inKsh
Total cost
in
Ksh
Area
spread(Acres)
Source of seeds
Legumes
1. Beans
2. Cowpeas
3. Groundnuts
4. Soybeans
5. Lablab
Units
1 = Bottle top
2=kgs
3=gorogoro
4=grams
Source of seeds
1 = open market
2= Agro vets
3 = Organizations
(NGO)
4 = Government
5 = Wild
6 = Other sources
(specify)
7=Own stock
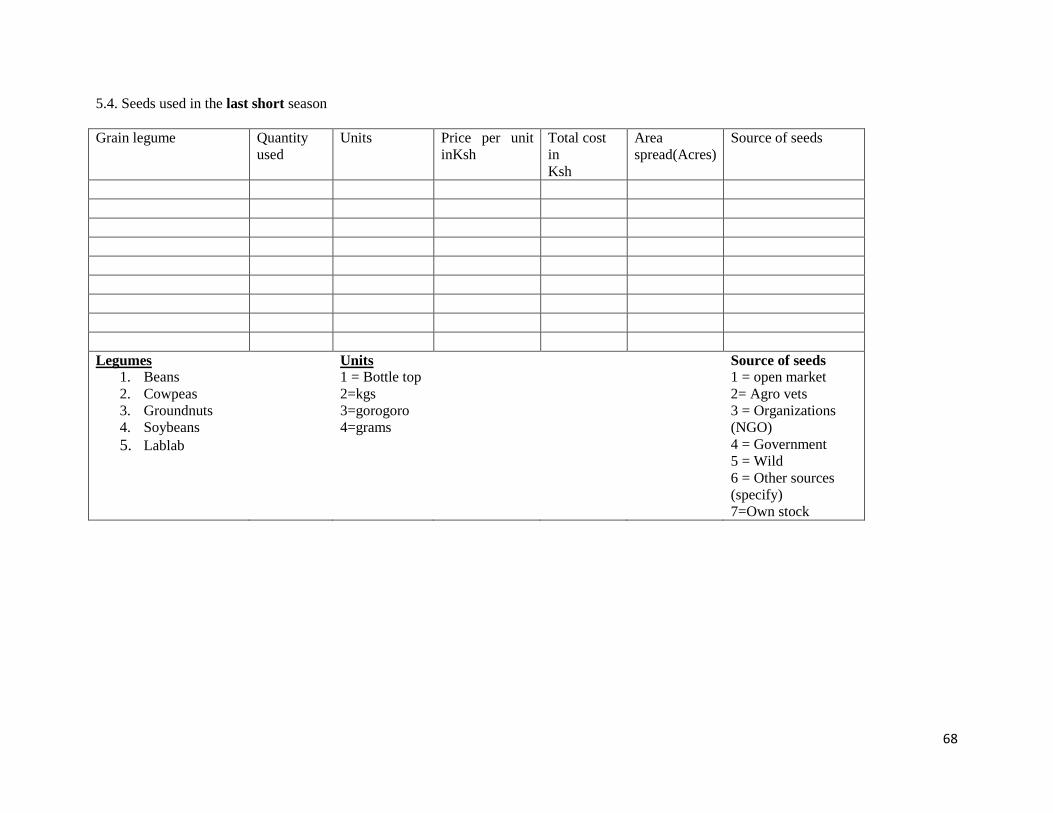
68
5.4. Seeds used in the last short season
Grain legume Quantity
used
Units Price per unit
inKsh
Total cost
in
Ksh
Area
spread(Acres)
Source of seeds
Legumes
1. Beans
2. Cowpeas
3. Groundnuts
4. Soybeans
5. Lablab
Units
1 = Bottle top
2=kgs
3=gorogoro
4=grams
Source of seeds
1 = open market
2= Agro vets
3 = Organizations
(NGO)
4 = Government
5 = Wild
6 = Other sources
(specify)
7=Own stock
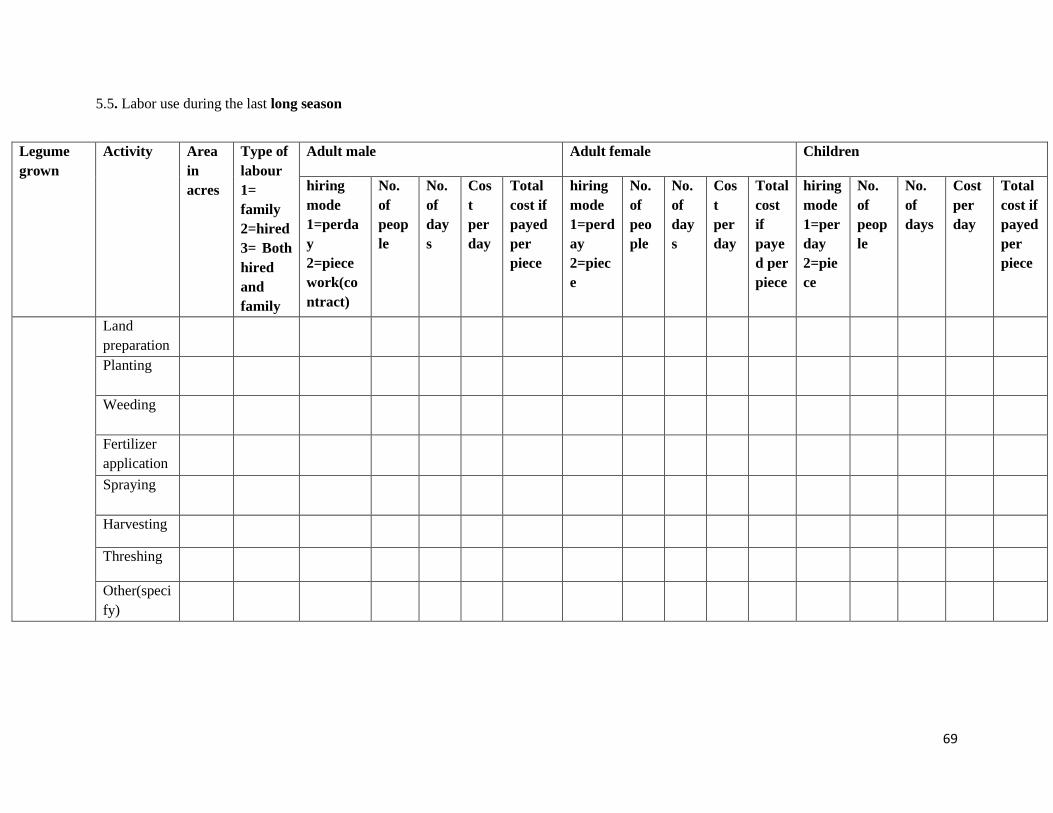
69
5.5. Labor use during the last long season
Legume
grown
Activity Area
in
acres
Type of
labour
1=
family
2=hired
3= Both
hired
and
family
Adult male Adult female Children
hiring
mode
1=perda
y
2=piece
work(co
ntract)
No.
of
peop
le
No.
of
day
s
Cos
t
per
day
Total
cost if
payed
per
piece
hiring
mode
1=perd
ay
2=piec
e
No.
of
peo
ple
No.
of
day
s
Cos
t
per
day
Total
cost
if
paye
d per
piece
hiring
mode
1=per
day
2=pie
ce
No.
of
peop
le
No.
of
days
Cost
per
day
Total
cost if
payed
per
piece
Land
preparation
Planting
Weeding
Fertilizer
application
Spraying
Harvesting
Threshing
Other(speci
fy)
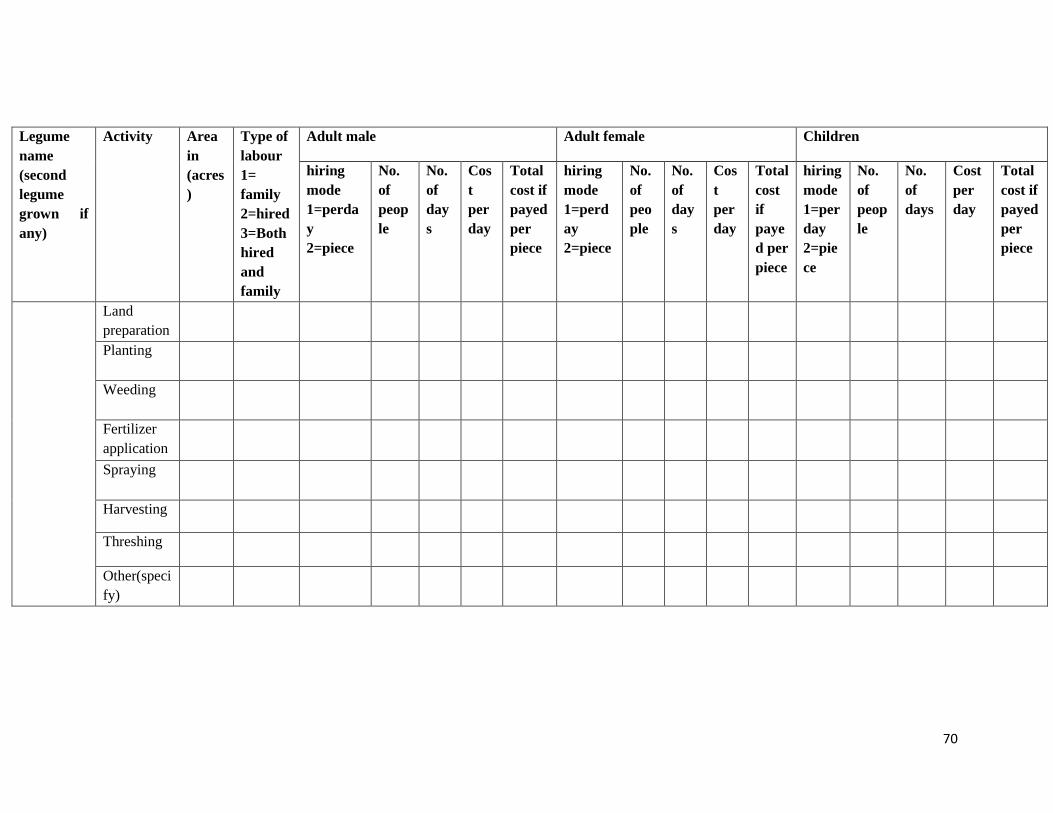
70
Legume
name
(second
legume
grown if
any)
Activity Area
in
(acres
)
Type of
labour
1=
family
2=hired
3=Both
hired
and
family
Adult male Adult female Children
hiring
mode
1=perda
y
2=piece
No.
of
peop
le
No.
of
day
s
Cos
t
per
day
Total
cost if
payed
per
piece
hiring
mode
1=perd
ay
2=piece
No.
of
peo
ple
No.
of
day
s
Cos
t
per
day
Total
cost
if
paye
d per
piece
hiring
mode
1=per
day
2=pie
ce
No.
of
peop
le
No.
of
days
Cost
per
day
Total
cost if
payed
per
piece
Land
preparation
Planting
Weeding
Fertilizer
application
Spraying
Harvesting
Threshing
Other(speci
fy)
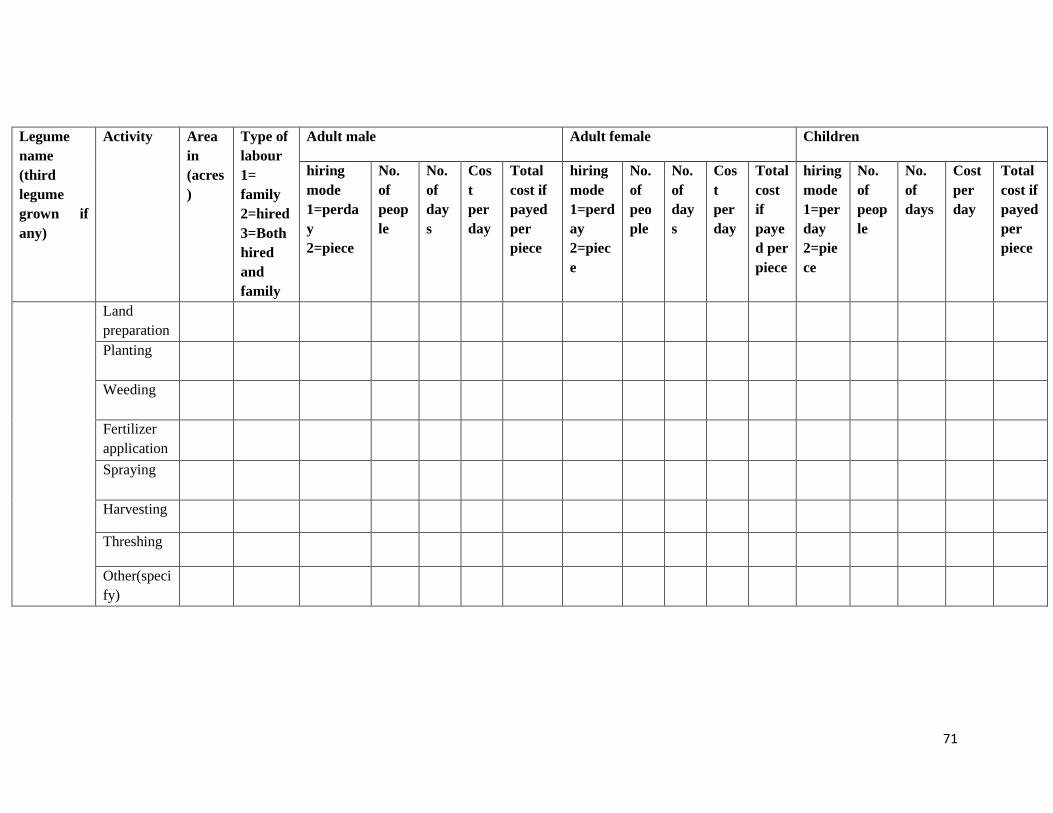
71
Legume
name
(third
legume
grown if
any)
Activity Area
in
(acres
)
Type of
labour
1=
family
2=hired
3=Both
hired
and
family
Adult male Adult female Children
hiring
mode
1=perda
y
2=piece
No.
of
peop
le
No.
of
day
s
Cos
t
per
day
Total
cost if
payed
per
piece
hiring
mode
1=perd
ay
2=piec
e
No.
of
peo
ple
No.
of
day
s
Cos
t
per
day
Total
cost
if
paye
d per
piece
hiring
mode
1=per
day
2=pie
ce
No.
of
peop
le
No.
of
days
Cost
per
day
Total
cost if
payed
per
piece
Land
preparation
Planting
Weeding
Fertilizer
application
Spraying
Harvesting
Threshing
Other(speci
fy)

72
Legume
name
(forth
legume
grown if
any)
Activity Area
in
(acres
)
Type of
labour
1=
family
2=hired
3=Both
hired
and
family
Adult male Adult female Children
hiring
mode
1=perda
y
2=piece
No.
of
peop
le
No.
of
day
s
Cos
t
per
day
Total
cost if
payed
per
piece
hiring
mode
1=perd
ay
2=piec
e
No.
of
peo
ple
No.
of
day
s
Cos
t
per
day
Total
cost
if
paye
d per
piece
hiring
mode
1=per
day
2=pie
ce
No.
of
peop
le
No.
of
days
Cost
per
day
Total
cost if
payed
per
piece
Land
preparation
Planting
Weeding
Fertilizer
application
Spraying
Harvesting
Threshing
Other(speci
fy)
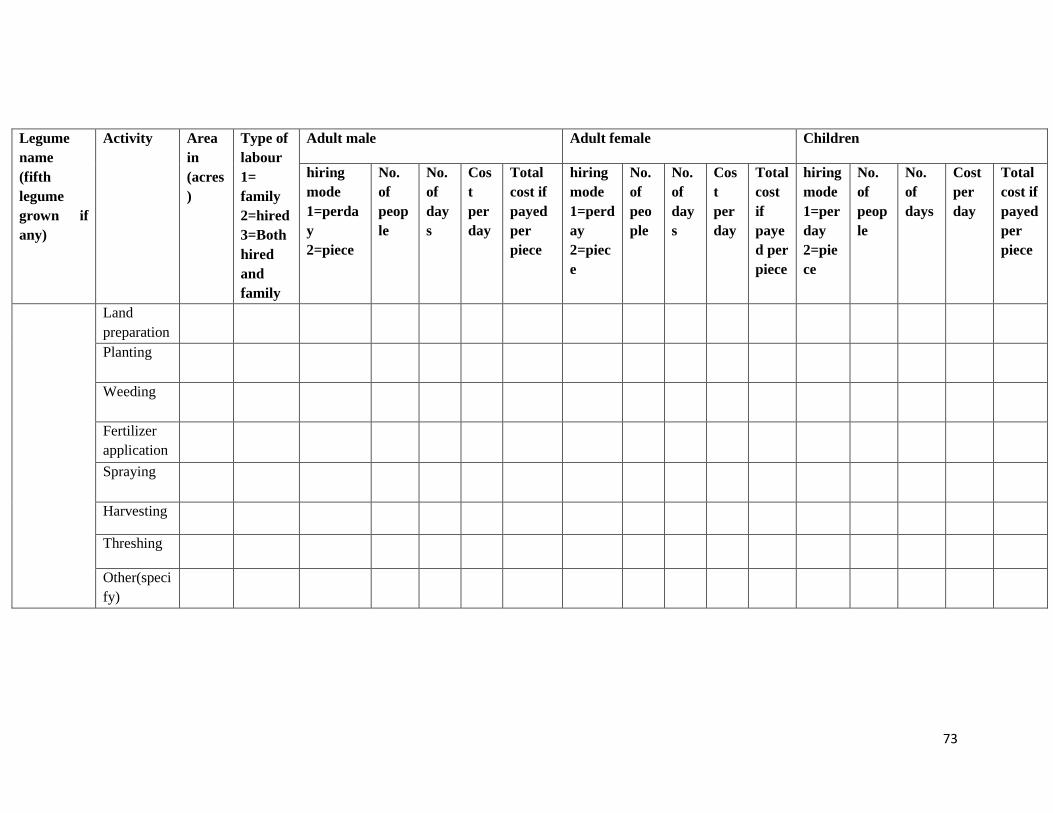
73
Legume
name
(fifth
legume
grown if
any)
Activity Area
in
(acres
)
Type of
labour
1=
family
2=hired
3=Both
hired
and
family
Adult male Adult female Children
hiring
mode
1=perda
y
2=piece
No.
of
peop
le
No.
of
day
s
Cos
t
per
day
Total
cost if
payed
per
piece
hiring
mode
1=perd
ay
2=piec
e
No.
of
peo
ple
No.
of
day
s
Cos
t
per
day
Total
cost
if
paye
d per
piece
hiring
mode
1=per
day
2=pie
ce
No.
of
peop
le
No.
of
days
Cost
per
day
Total
cost if
payed
per
piece
Land
preparation
Planting
Weeding
Fertilizer
application
Spraying
Harvesting
Threshing
Other(speci
fy)

74
5.6. Labor use during the last short season
Legume
grown
Activity Area
in
acres
Type of
labour
1=
family
2=hired
3= Both
hired
and
family
Adult male Adult female Children
hiring
mode
1=perda
y
2=piece
work(co
ntract)
No.
of
peop
le
No.
of
day
s
Cos
t
per
day
Total
cost if
payed
per
piece
hiring
mode
1=perd
ay
2=piec
e
No.
of
peo
ple
No.
of
day
s
Cos
t
per
day
Total
cost
if
paye
d per
piece
hiring
mode
1=per
day
2=pie
ce
No.
of
peop
le
No.
of
days
Cost
per
day
Total
cost if
payed
per
piece
Land
preparation
Planting
Weeding
Fertilizer
application
Spraying
Harvesting
Threshing
Drying (or
any other
activity)
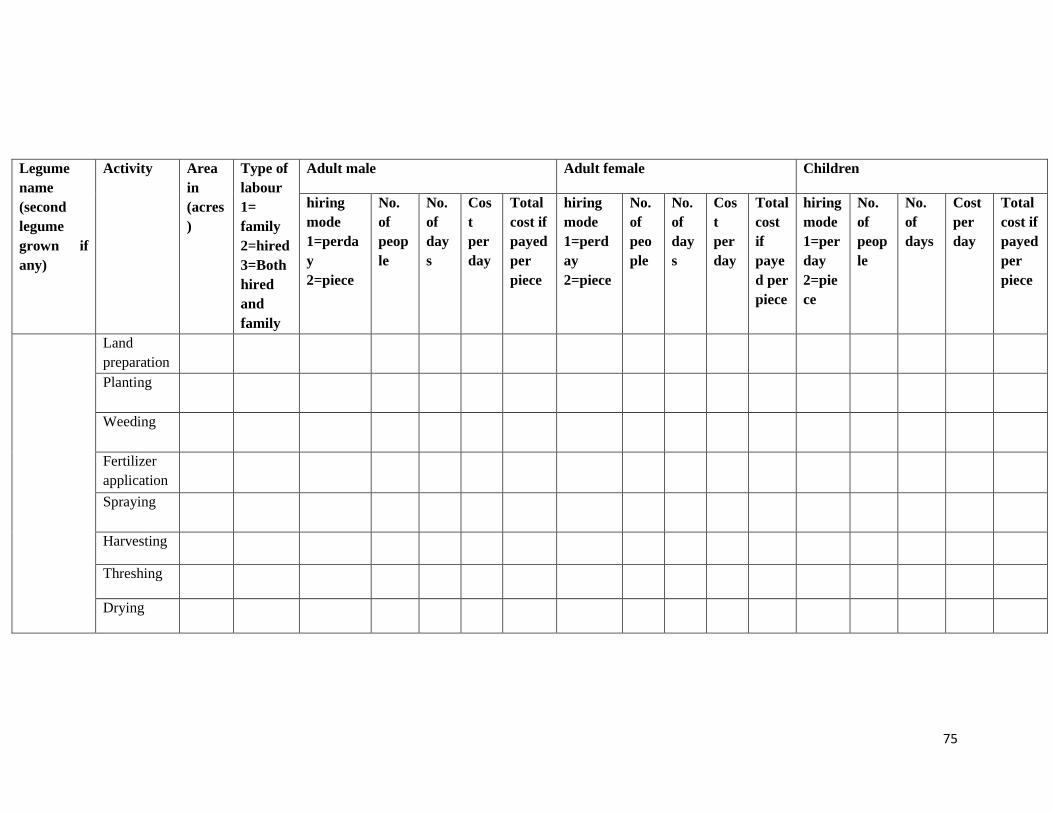
75
Legume
name
(second
legume
grown if
any)
Activity Area
in
(acres
)
Type of
labour
1=
family
2=hired
3=Both
hired
and
family
Adult male Adult female Children
hiring
mode
1=perda
y
2=piece
No.
of
peop
le
No.
of
day
s
Cos
t
per
day
Total
cost if
payed
per
piece
hiring
mode
1=perd
ay
2=piece
No.
of
peo
ple
No.
of
day
s
Cos
t
per
day
Total
cost
if
paye
d per
piece
hiring
mode
1=per
day
2=pie
ce
No.
of
peop
le
No.
of
days
Cost
per
day
Total
cost if
payed
per
piece
Land
preparation
Planting
Weeding
Fertilizer
application
Spraying
Harvesting
Threshing
Drying
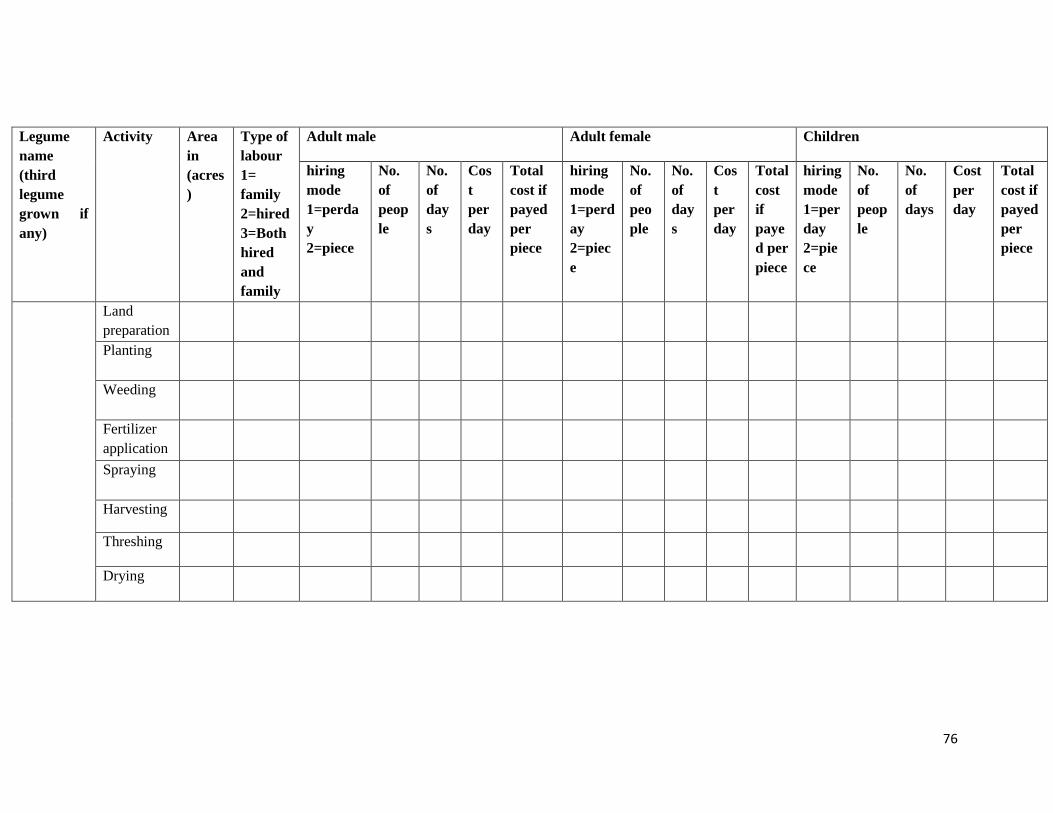
76
Legume
name
(third
legume
grown if
any)
Activity Area
in
(acres
)
Type of
labour
1=
family
2=hired
3=Both
hired
and
family
Adult male Adult female Children
hiring
mode
1=perda
y
2=piece
No.
of
peop
le
No.
of
day
s
Cos
t
per
day
Total
cost if
payed
per
piece
hiring
mode
1=perd
ay
2=piec
e
No.
of
peo
ple
No.
of
day
s
Cos
t
per
day
Total
cost
if
paye
d per
piece
hiring
mode
1=per
day
2=pie
ce
No.
of
peop
le
No.
of
days
Cost
per
day
Total
cost if
payed
per
piece
Land
preparation
Planting
Weeding
Fertilizer
application
Spraying
Harvesting
Threshing
Drying
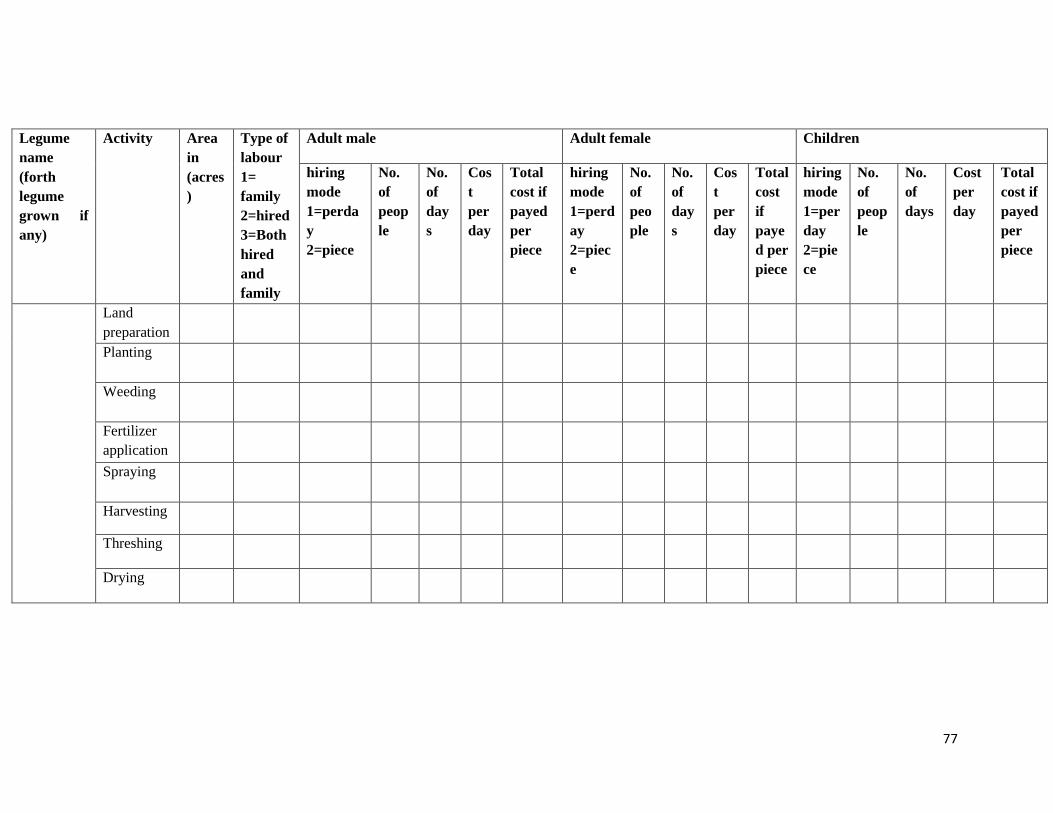
77
Legume
name
(forth
legume
grown if
any)
Activity Area
in
(acres
)
Type of
labour
1=
family
2=hired
3=Both
hired
and
family
Adult male Adult female Children
hiring
mode
1=perda
y
2=piece
No.
of
peop
le
No.
of
day
s
Cos
t
per
day
Total
cost if
payed
per
piece
hiring
mode
1=perd
ay
2=piec
e
No.
of
peo
ple
No.
of
day
s
Cos
t
per
day
Total
cost
if
paye
d per
piece
hiring
mode
1=per
day
2=pie
ce
No.
of
peop
le
No.
of
days
Cost
per
day
Total
cost if
payed
per
piece
Land
preparation
Planting
Weeding
Fertilizer
application
Spraying
Harvesting
Threshing
Drying

78
Legume
name
(fifth
legume
grown if
any)
Activity Area
in
(acres
)
Type of
labour
1=
family
2=hired
3=Both
hired
and
family
Adult male Adult female Children
hiring
mode
1=perda
y
2=piece
No.
of
peop
le
No.
of
day
s
Cos
t
per
day
Total
cost if
payed
per
piece
hiring
mode
1=perd
ay
2=piec
e
No.
of
peo
ple
No.
of
day
s
Cos
t
per
day
Total
cost
if
paye
d per
piece
hiring
mode
1=per
day
2=pie
ce
No.
of
peop
le
No.
of
days
Cost
per
day
Total
cost if
payed
per
piece
Land
preparation
Planting
Weeding
Fertilizer
application
Spraying
Harvesting
Threshing
Drying
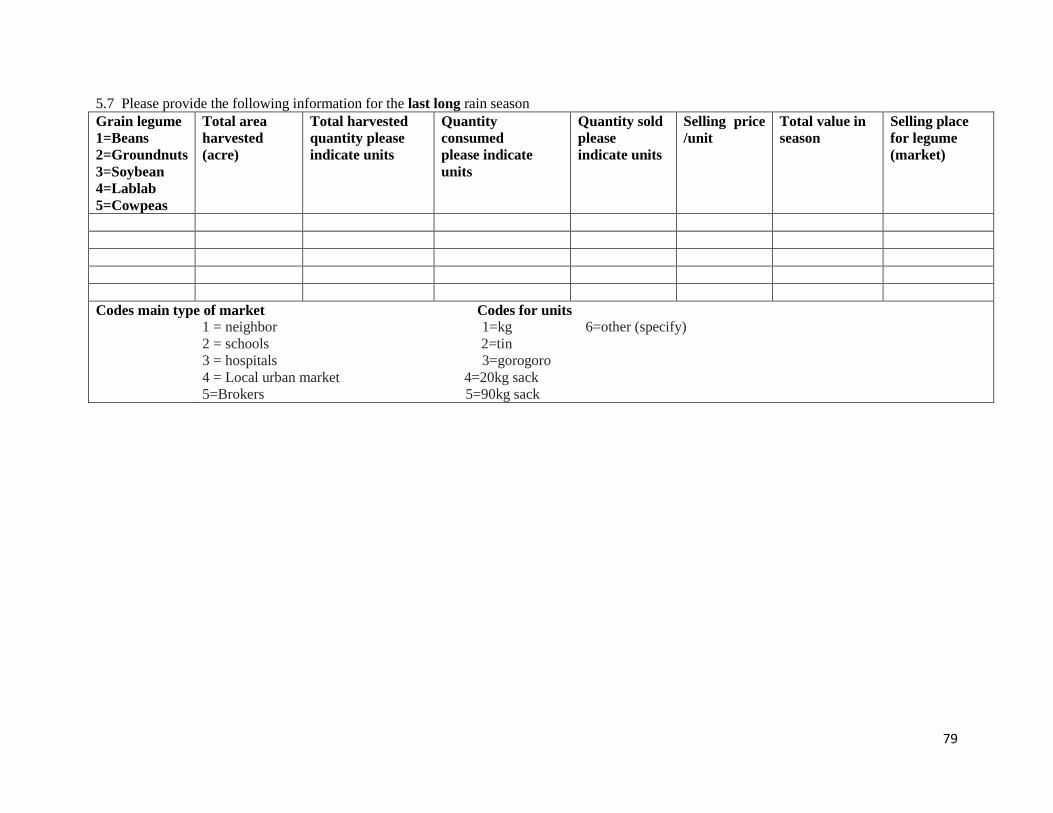
79
5.7 Please provide the following information for the last long rain season Grain legume
1=Beans
2=Groundnuts
3=Soybean
4=Lablab
5=Cowpeas
Total area
harvested
(acre)
Total harvested
quantity please
indicate units
Quantity
consumed
please indicate
units
Quantity sold
please
indicate units
Selling price
/unit
Total value in
season
Selling place
for legume
(market)
Codes main type of market Codes for units
1 = neighbor 1=kg 6=other (specify)
2 = schools 2=tin
3 = hospitals 3=gorogoro
4 = Local urban market 4=20kg sack
5=Brokers 5=90kg sack
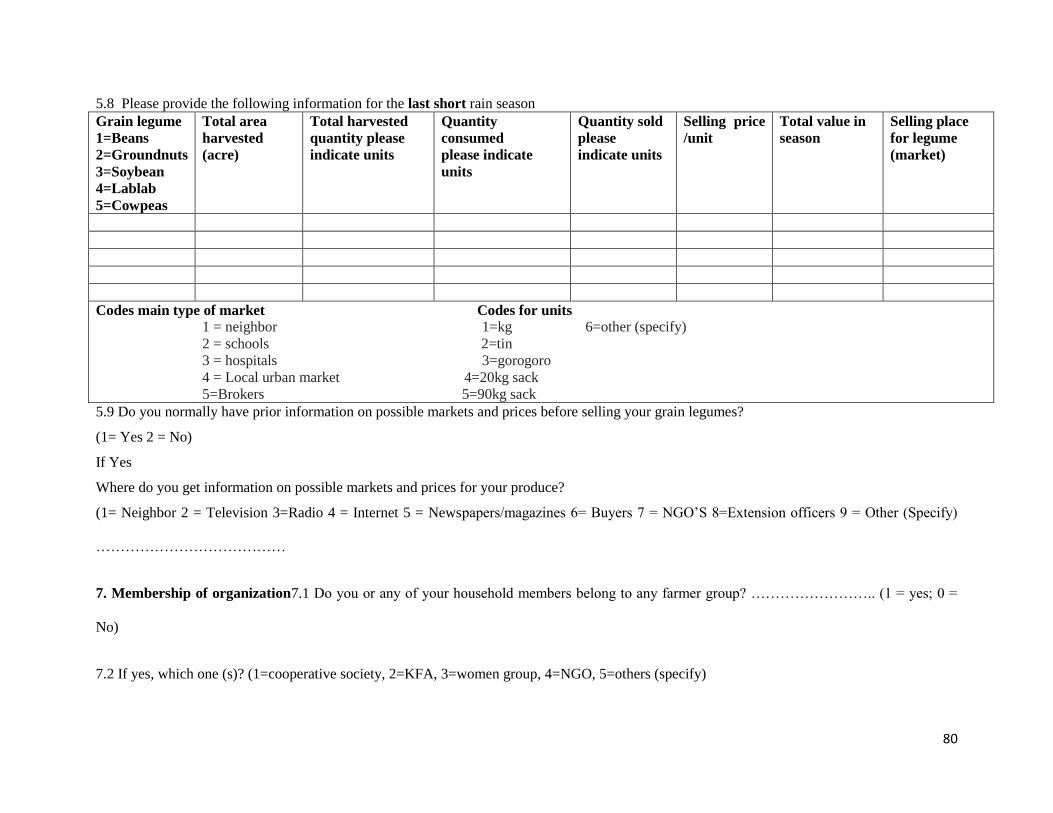
80
5.8 Please provide the following information for the last short rain season Grain legume
1=Beans
2=Groundnuts
3=Soybean
4=Lablab
5=Cowpeas
Total area
harvested
(acre)
Total harvested
quantity please
indicate units
Quantity
consumed
please indicate
units
Quantity sold
please
indicate units
Selling price
/unit
Total value in
season
Selling place
for legume
(market)
Codes main type of market Codes for units
1 = neighbor 1=kg 6=other (specify)
2 = schools 2=tin
3 = hospitals 3=gorogoro
4 = Local urban market 4=20kg sack
5=Brokers 5=90kg sack
5.9 Do you normally have prior information on possible markets and prices before selling your grain legumes?
(1= Yes 2 = No)
If Yes
Where do you get information on possible markets and prices for your produce?
(1= Neighbor 2 = Television 3=Radio 4 = Internet 5 = Newspapers/magazines 6= Buyers 7 = NGO’S 8=Extension officers 9 = Other (Specify)
…………………………………
7. Membership of organization7.1 Do you or any of your household members belong to any farmer group? …………………….. (1 = yes; 0 =
No)
7.2 If yes, which one (s)? (1=cooperative society, 2=KFA, 3=women group, 4=NGO, 5=others (specify)
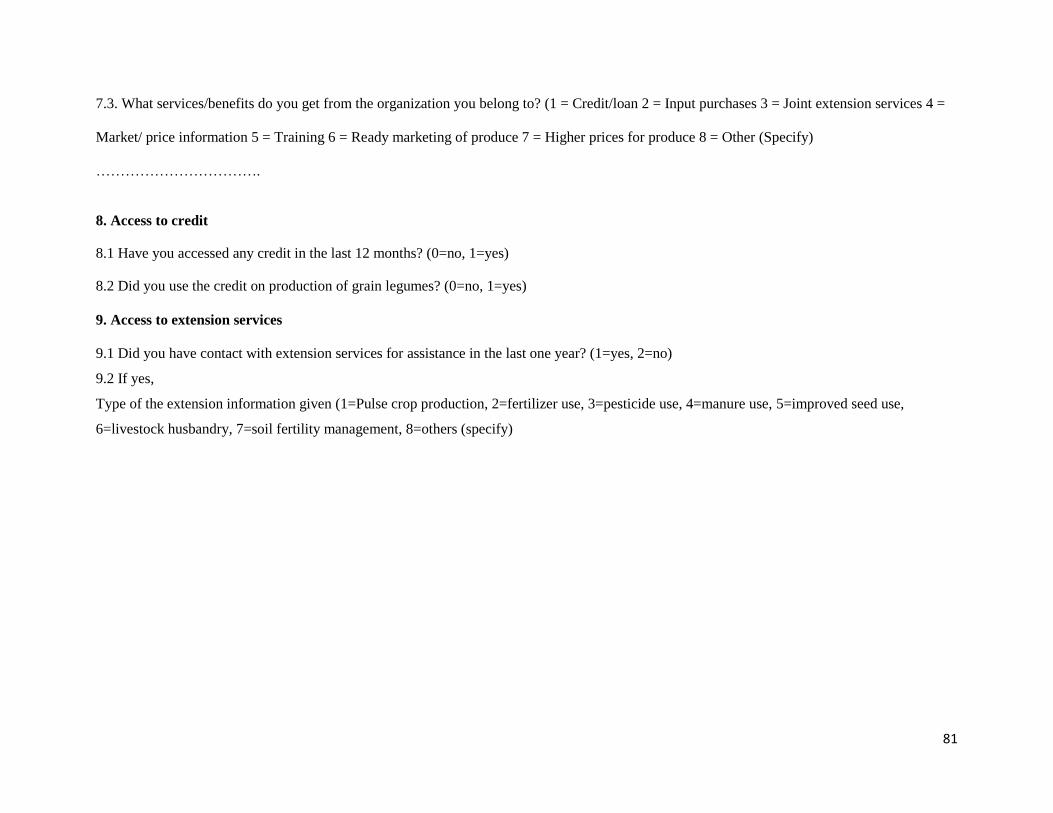
81
7.3. What services/benefits do you get from the organization you belong to? (1 = Credit/loan 2 = Input purchases 3 = Joint extension services 4 =
Market/ price information 5 = Training 6 = Ready marketing of produce 7 = Higher prices for produce 8 = Other (Specify)
…………………………….
8. Access to credit
8.1 Have you accessed any credit in the last 12 months? (0=no, 1=yes)
8.2 Did you use the credit on production of grain legumes? (0=no, 1=yes)
9. Access to extension services
9.1 Did you have contact with extension services for assistance in the last one year? (1=yes, 2=no)
9.2 If yes,
Type of the extension information given (1=Pulse crop production, 2=fertilizer use, 3=pesticide use, 4=manure use, 5=improved seed use,
6=livestock husbandry, 7=soil fertility management, 8=others (specify)
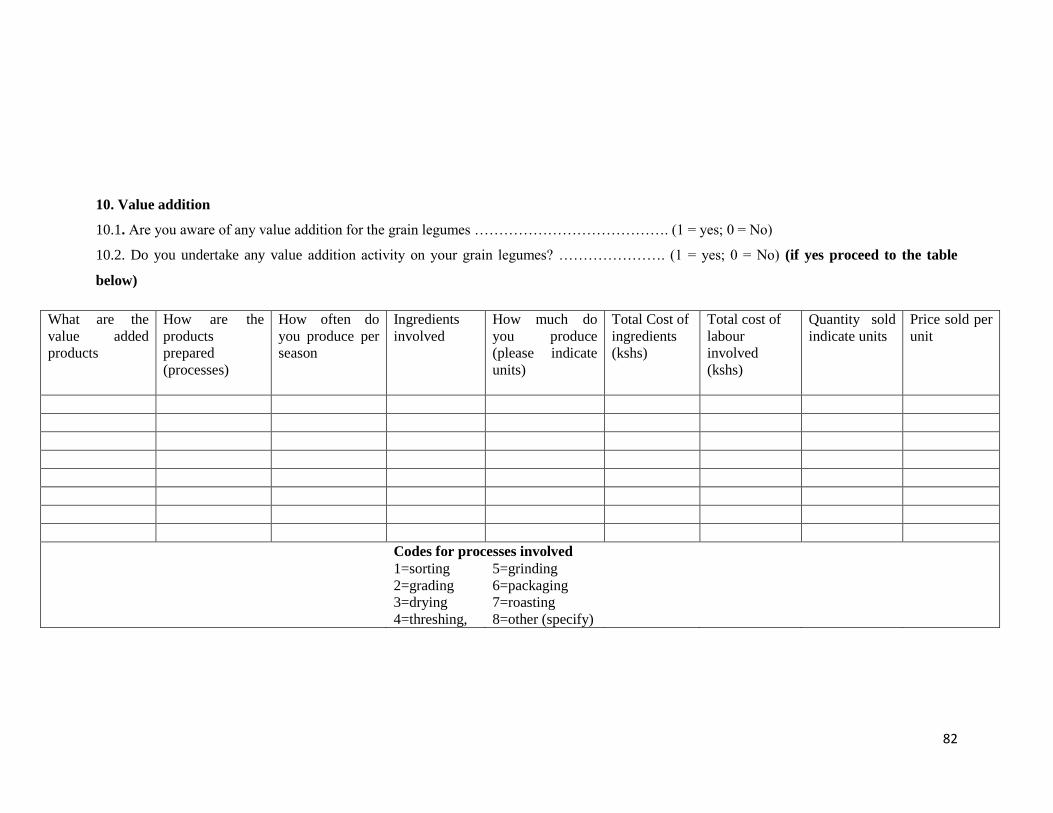
82
10. Value addition
10.1. Are you aware of any value addition for the grain legumes …………………………………. (1 = yes; 0 = No)
10.2. Do you undertake any value addition activity on your grain legumes? …………………. (1 = yes; 0 = No) (if yes proceed to the table
below)
What are the
value added
products
How are the
products
prepared
(processes)
How often do
you produce per
season
Ingredients
involved
How much do
you produce
(please indicate
units)
Total Cost of
ingredients
(kshs)
Total cost of
labour
involved
(kshs)
Quantity sold
indicate units
Price sold per
unit
Codes for processes involved
1=sorting
2=grading
3=drying
4=threshing,
5=grinding
6=packaging
7=roasting
8=other (specify)
83
10.3 Do you transport your legumes to the market ……………………………… (1 = yes; 2 = No)
10.4 If yes, what means do you use ……………………………………………………………………………………
10.5 What is the approximate total cost incurred in transporting the legumes in Kenyan shillings……………………………………………………
11. Access to infrastructure services
11.1 Distance from home to nearest market/ trading centre…………………………..Km.
11.2 Status of main road to the nearest trading centre……….. (1=mud road, 2=murram, 3=tarmac, 4=other …………………….………..)
11.3. Distance from home to nearest extension services office……………………….Km
Thank you very much for your time