Embed Size (px)
Citation preview

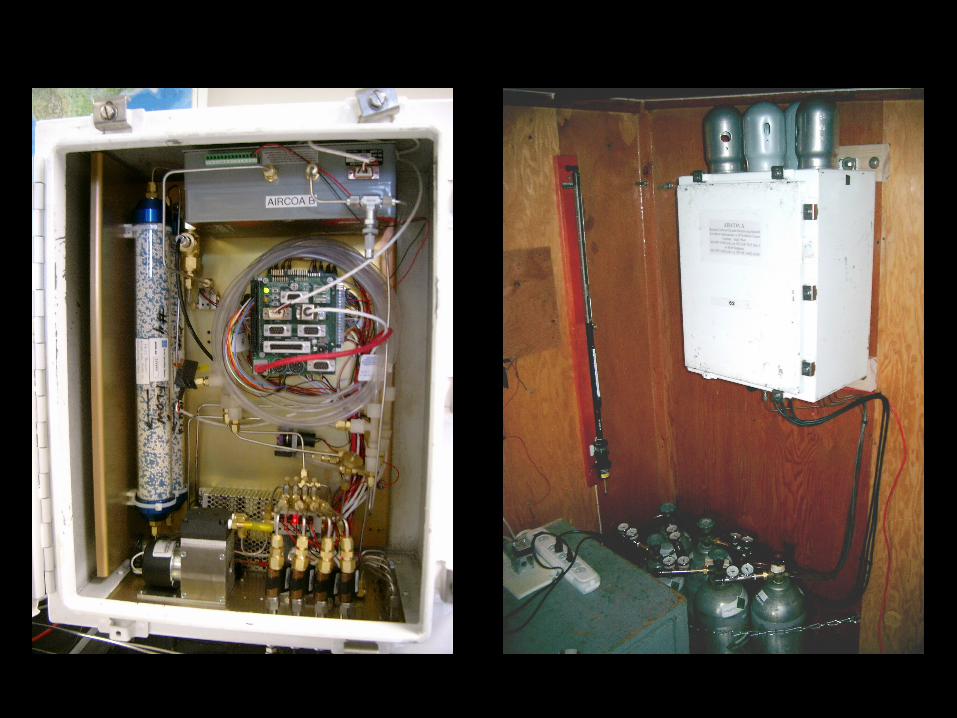
An Autonomous Inexpensive Robust CO2 Analyzer (AIRCOA)
Britton Stephens, Andrew Watt, and Gordon MacleanNational Center for Atmospheric Research, Boulder, Colorado, USA

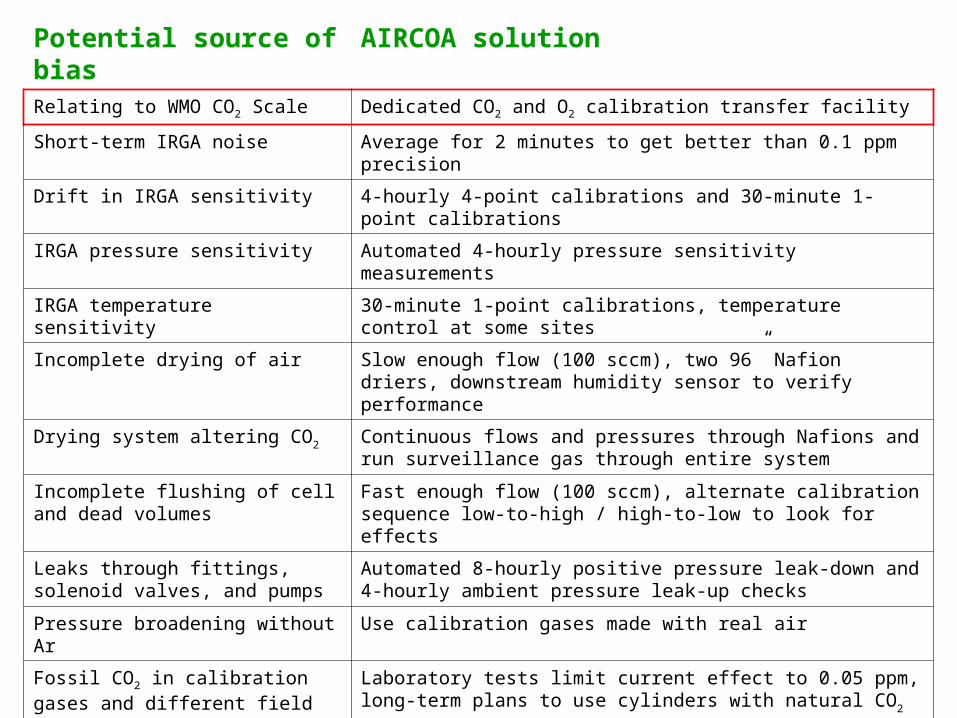
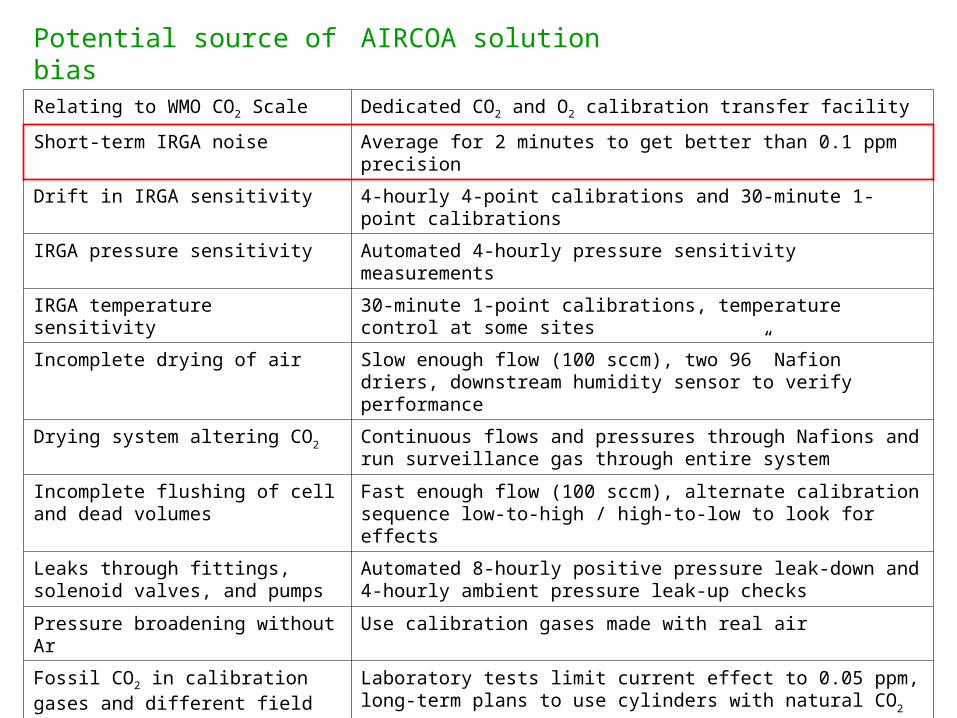
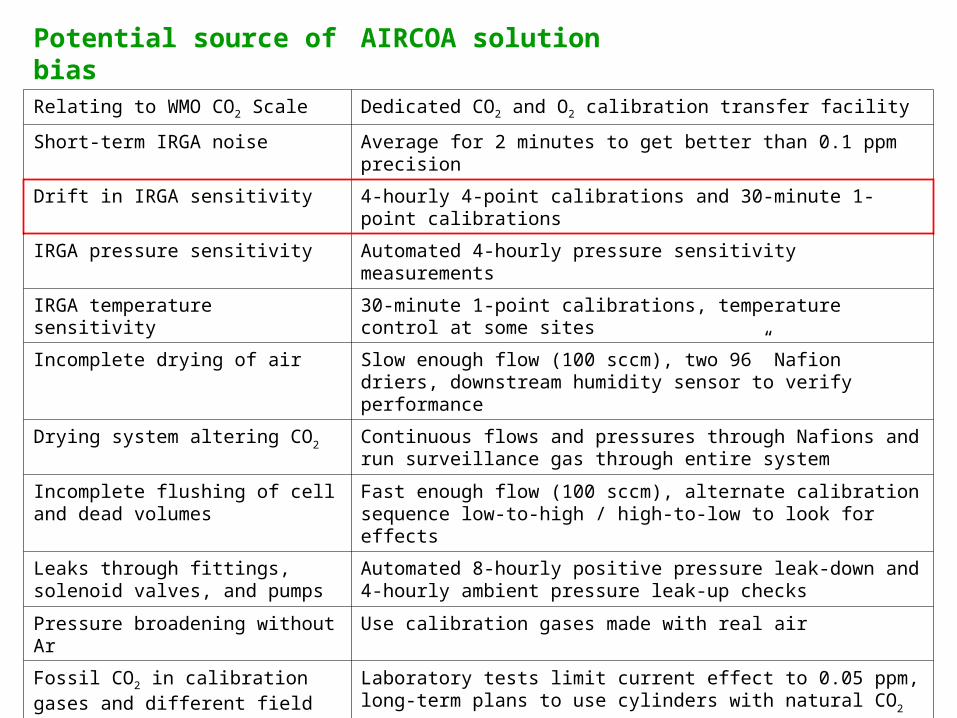
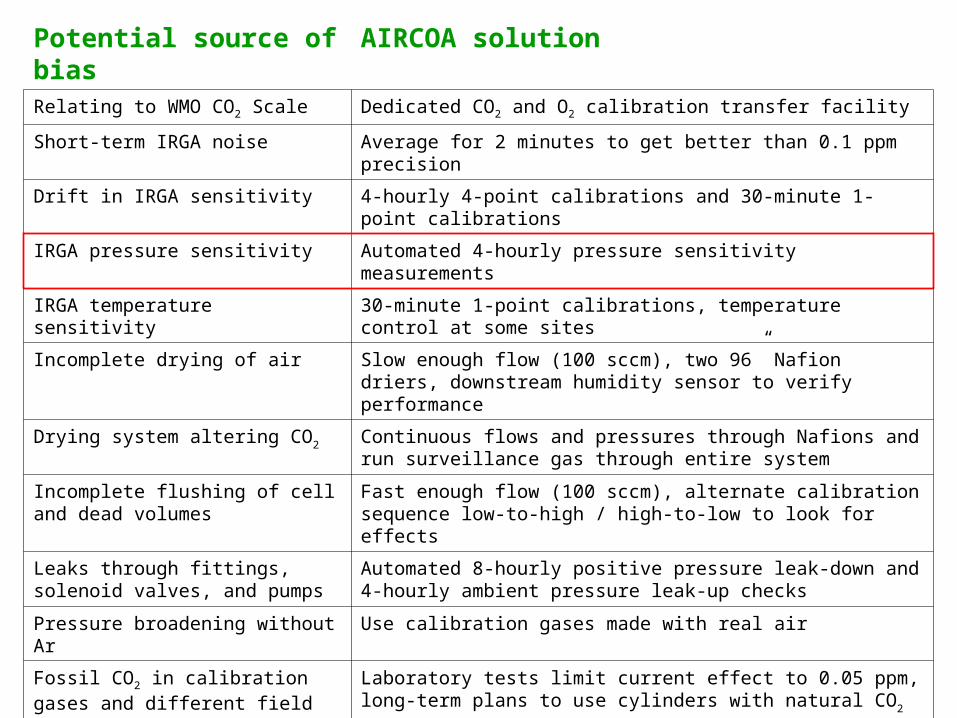
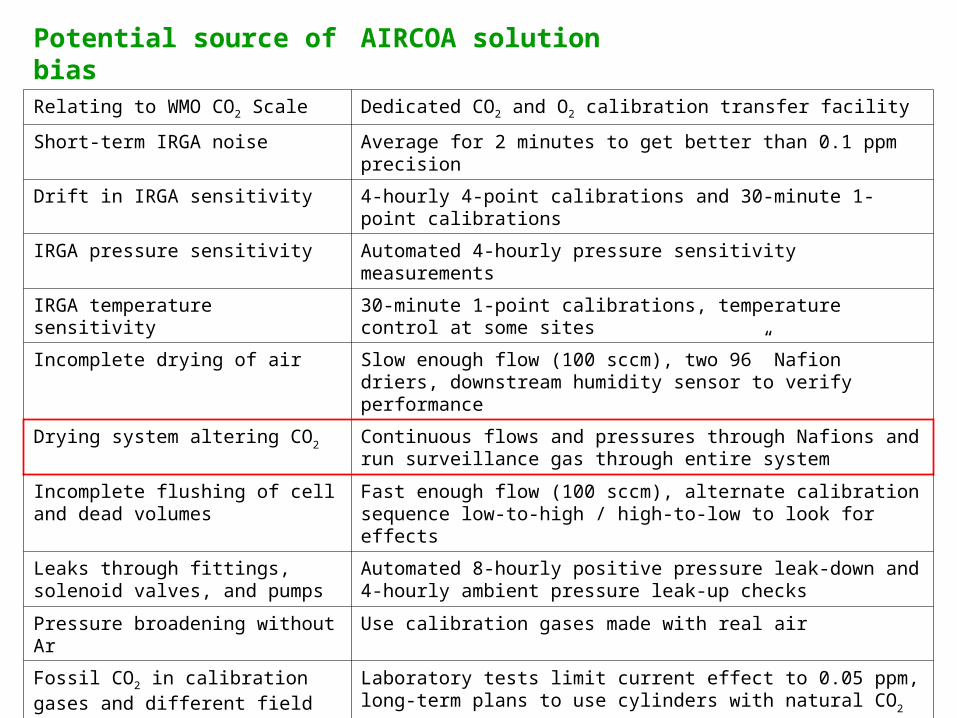
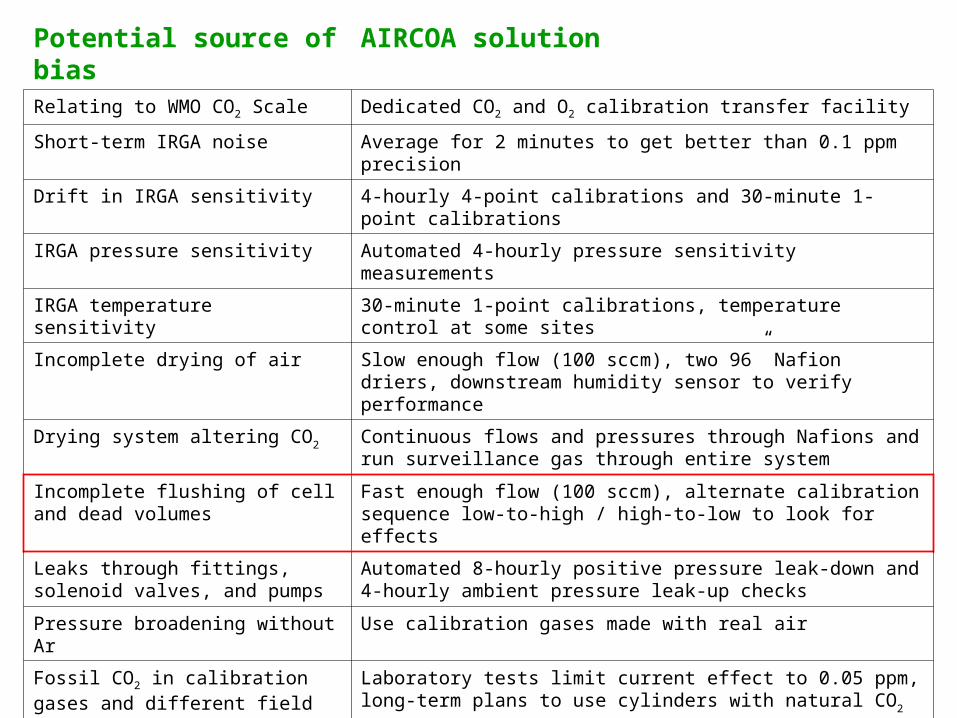
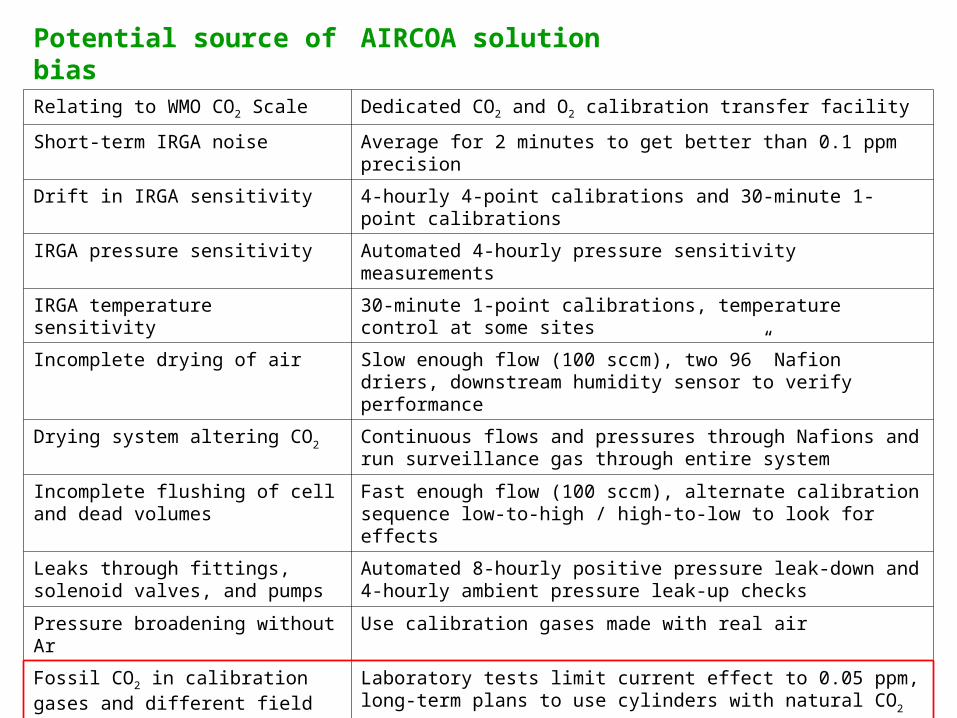
Potential source of bias AIRCOA solutionRelating to WMO CO2 Scale Dedicated CO2 and O2 calibration transfer facility
Short-term IRGA noise Average for 2 minutes to get better than 0.1 ppm precision
Drift in IRGA sensitivity 4-hourly 4-point calibrations and 30-minute 1-point calibrations
IRGA pressure sensitivity Automated 4-hourly pressure sensitivity measurements
IRGA temperature sensitivity 30-minute 1-point calibrations, temperature control at some sites
Incomplete drying of air Slow enough flow (100 sccm), two 96” Nafion driers, downstream humidity sensor to verify performance
Drying system altering CO2 Continuous flows and pressures through Nafions and run surveillance gas through entire system
Incomplete flushing of cell and dead volumes
Fast enough flow (100 sccm), alternate calibration sequence low‑to-high / high-to-low to look for effects
Leaks through fittings, solenoid valves, and pumps
Automated 8-hourly positive pressure leak-down and 4-hourly ambient pressure leak-up checks
Pressure broadening without Ar Use calibration gases made with real air
Fossil CO2 in calibration gases and different field and lab 13C sensitivities
Laboratory tests limit current effect to 0.05 ppm, long-term plans to use cylinders with natural CO2
Regulator temperature effects Tests suggest effect is negligible, but could be regulator dependent
Regulator flushing effects Repeat calibration tests suggest the effect is negligible
Whole-system diagnostics and comparability verification
Long-term surveillance tank analyzed every 8 hours, co-location with other programs, rotating cylinders, and laboratory comparisons
Delay in diagnosis of errors Near real-time data acquisition, processing, and dissemination
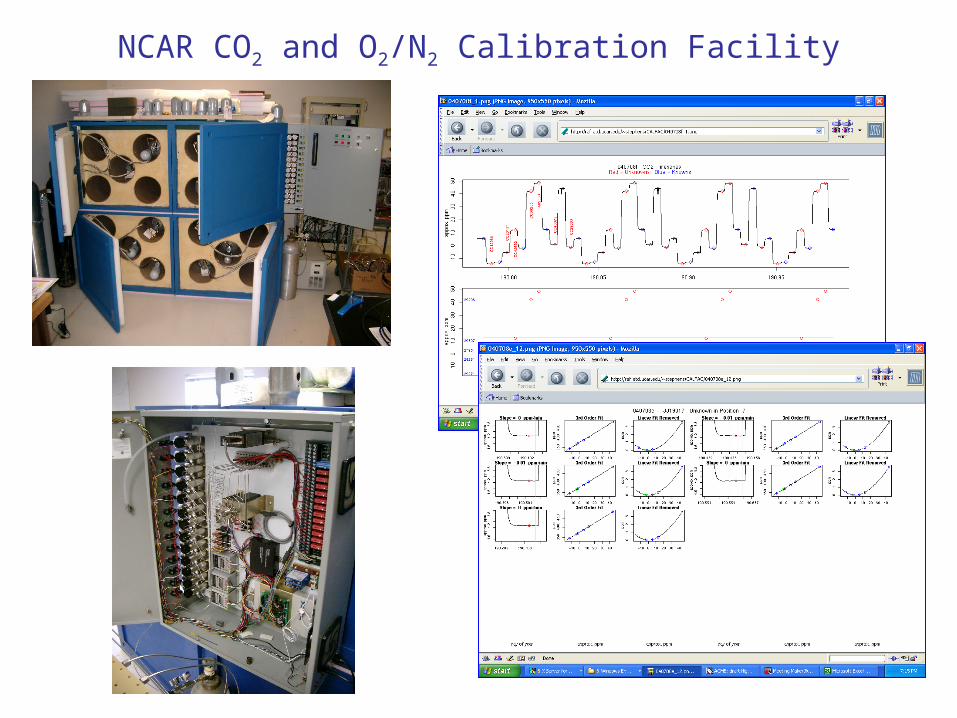
NCAR CO2 and O2/N2 Calibration Facility
Potential source of bias AIRCOA solutionRelating to WMO CO2 Scale Dedicated CO2 and O2 calibration transfer facility
Short-term IRGA noise Average for 2 minutes to get better than 0.1 ppm precision
Drift in IRGA sensitivity 4-hourly 4-point calibrations and 30-minute 1-point calibrations
IRGA pressure sensitivity Automated 4-hourly pressure sensitivity measurements
IRGA temperature sensitivity 30-minute 1-point calibrations, temperature control at some sites
Incomplete drying of air Slow enough flow (100 sccm), two 96” Nafion driers, downstream humidity sensor to verify performance
Drying system altering CO2 Continuous flows and pressures through Nafions and run surveillance gas through entire system
Incomplete flushing of cell and dead volumes
Fast enough flow (100 sccm), alternate calibration sequence low‑to-high / high-to-low to look for effects
Leaks through fittings, solenoid valves, and pumps
Automated 8-hourly positive pressure leak-down and 4-hourly ambient pressure leak-up checks
Pressure broadening without Ar Use calibration gases made with real air
Fossil CO2 in calibration gases and different field and lab 13C sensitivities
Laboratory tests limit current effect to 0.05 ppm, long-term plans to use cylinders with natural CO2
Regulator temperature effects Tests suggest effect is negligible, but could be regulator dependent
Regulator flushing effects Repeat calibration tests suggest the effect is negligible
Whole-system diagnostics and comparability verification
Long-term surveillance tank analyzed every 8 hours, co-location with other programs, rotating cylinders, and laboratory comparisons
Delay in diagnosis of errors Near real-time data acquisition, processing, and dissemination

CO2 signal averaged over 2.5 min. measurement cycle
Potential source of bias AIRCOA solutionRelating to WMO CO2 Scale Dedicated CO2 and O2 calibration transfer facility
Short-term IRGA noise Average for 2 minutes to get better than 0.1 ppm precision
Drift in IRGA sensitivity 4-hourly 4-point calibrations and 30-minute 1-point calibrations
IRGA pressure sensitivity Automated 4-hourly pressure sensitivity measurements
IRGA temperature sensitivity 30-minute 1-point calibrations, temperature control at some sites
Incomplete drying of air Slow enough flow (100 sccm), two 96” Nafion driers, downstream humidity sensor to verify performance
Drying system altering CO2 Continuous flows and pressures through Nafions and run surveillance gas through entire system
Incomplete flushing of cell and dead volumes
Fast enough flow (100 sccm), alternate calibration sequence low‑to-high / high-to-low to look for effects
Leaks through fittings, solenoid valves, and pumps
Automated 8-hourly positive pressure leak-down and 4-hourly ambient pressure leak-up checks
Pressure broadening without Ar Use calibration gases made with real air
Fossil CO2 in calibration gases and different field and lab 13C sensitivities
Laboratory tests limit current effect to 0.05 ppm, long-term plans to use cylinders with natural CO2
Regulator temperature effects Tests suggest effect is negligible, but could be regulator dependent
Regulator flushing effects Repeat calibration tests suggest the effect is negligible
Whole-system diagnostics and comparability verification
Long-term surveillance tank analyzed every 8 hours, co-location with other programs, rotating cylinders, and laboratory comparisons
Delay in diagnosis of errors Near real-time data acquisition, processing, and dissemination
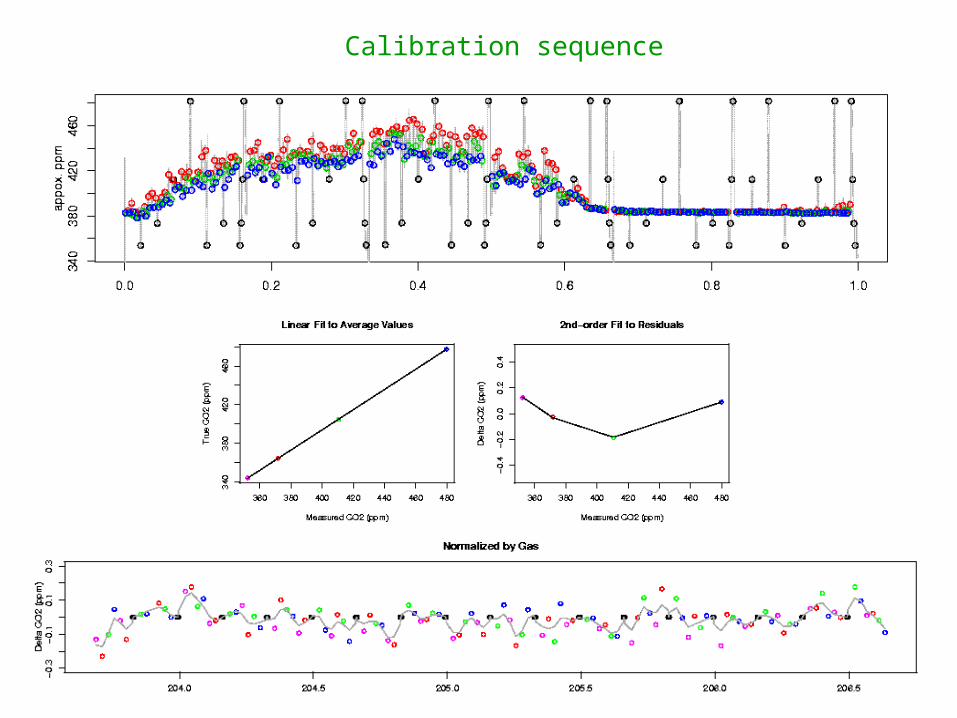
Calibration sequence
Potential source of bias AIRCOA solutionRelating to WMO CO2 Scale Dedicated CO2 and O2 calibration transfer facility
Short-term IRGA noise Average for 2 minutes to get better than 0.1 ppm precision
Drift in IRGA sensitivity 4-hourly 4-point calibrations and 30-minute 1-point calibrations
IRGA pressure sensitivity Automated 4-hourly pressure sensitivity measurements
IRGA temperature sensitivity 30-minute 1-point calibrations, temperature control at some sites
Incomplete drying of air Slow enough flow (100 sccm), two 96” Nafion driers, downstream humidity sensor to verify performance
Drying system altering CO2 Continuous flows and pressures through Nafions and run surveillance gas through entire system
Incomplete flushing of cell and dead volumes
Fast enough flow (100 sccm), alternate calibration sequence low‑to-high / high-to-low to look for effects
Leaks through fittings, solenoid valves, and pumps
Automated 8-hourly positive pressure leak-down and 4-hourly ambient pressure leak-up checks
Pressure broadening without Ar Use calibration gases made with real air
Fossil CO2 in calibration gases and different field and lab 13C sensitivities
Laboratory tests limit current effect to 0.05 ppm, long-term plans to use cylinders with natural CO2
Regulator temperature effects Tests suggest effect is negligible, but could be regulator dependent
Regulator flushing effects Repeat calibration tests suggest the effect is negligible
Whole-system diagnostics and comparability verification
Long-term surveillance tank analyzed every 8 hours, co-location with other programs, rotating cylinders, and laboratory comparisons
Delay in diagnosis of errors Near real-time data acquisition, processing, and dissemination
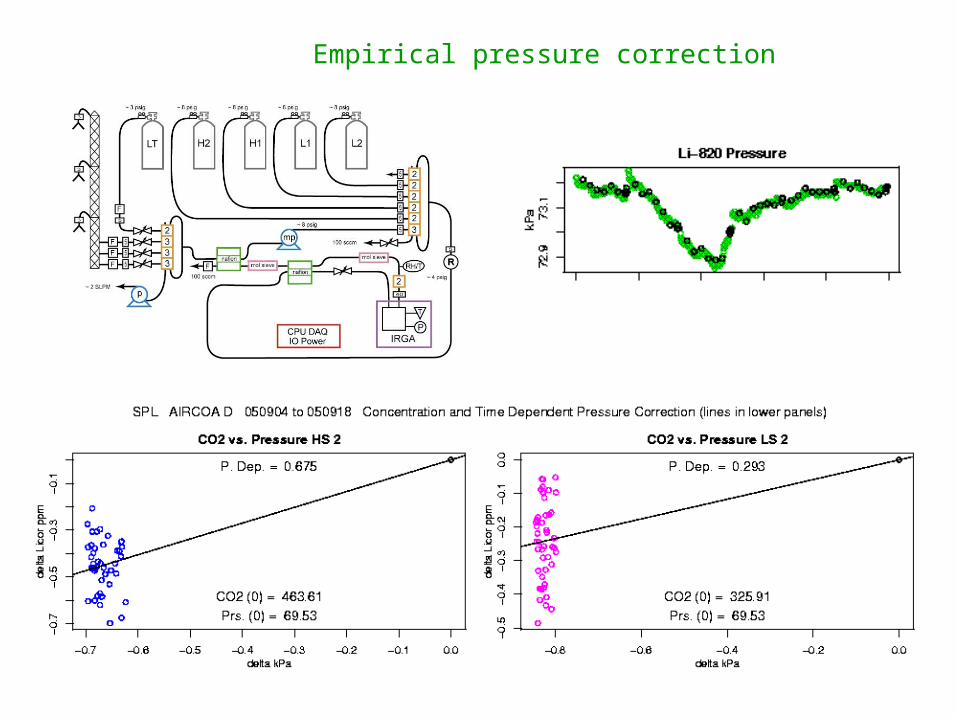
Empirical pressure correction

Potential source of bias AIRCOA solutionRelating to WMO CO2 Scale Dedicated CO2 and O2 calibration transfer facility
Short-term IRGA noise Average for 2 minutes to get better than 0.1 ppm precision
Drift in IRGA sensitivity 4-hourly 4-point calibrations and 30-minute 1-point calibrations
IRGA pressure sensitivity Automated 4-hourly pressure sensitivity measurements
IRGA temperature sensitivity 30-minute 1-point calibrations, temperature control at some sites
Incomplete drying of air Slow enough flow (100 sccm), two 96” Nafion driers, downstream humidity sensor to verify performance
Drying system altering CO2 Continuous flows and pressures through Nafions and run surveillance gas through entire system
Incomplete flushing of cell and dead volumes
Fast enough flow (100 sccm), alternate calibration sequence low‑to-high / high-to-low to look for effects
Leaks through fittings, solenoid valves, and pumps
Automated 8-hourly positive pressure leak-down and 4-hourly ambient pressure leak-up checks
Pressure broadening without Ar Use calibration gases made with real air
Fossil CO2 in calibration gases and different field and lab 13C sensitivities
Laboratory tests limit current effect to 0.05 ppm, long-term plans to use cylinders with natural CO2
Regulator temperature effects Tests suggest effect is negligible, but could be regulator dependent
Regulator flushing effects Repeat calibration tests suggest the effect is negligible
Whole-system diagnostics and comparability verification
Long-term surveillance tank analyzed every 8 hours, co-location with other programs, rotating cylinders, and laboratory comparisons
Delay in diagnosis of errors Near real-time data acquisition, processing, and dissemination
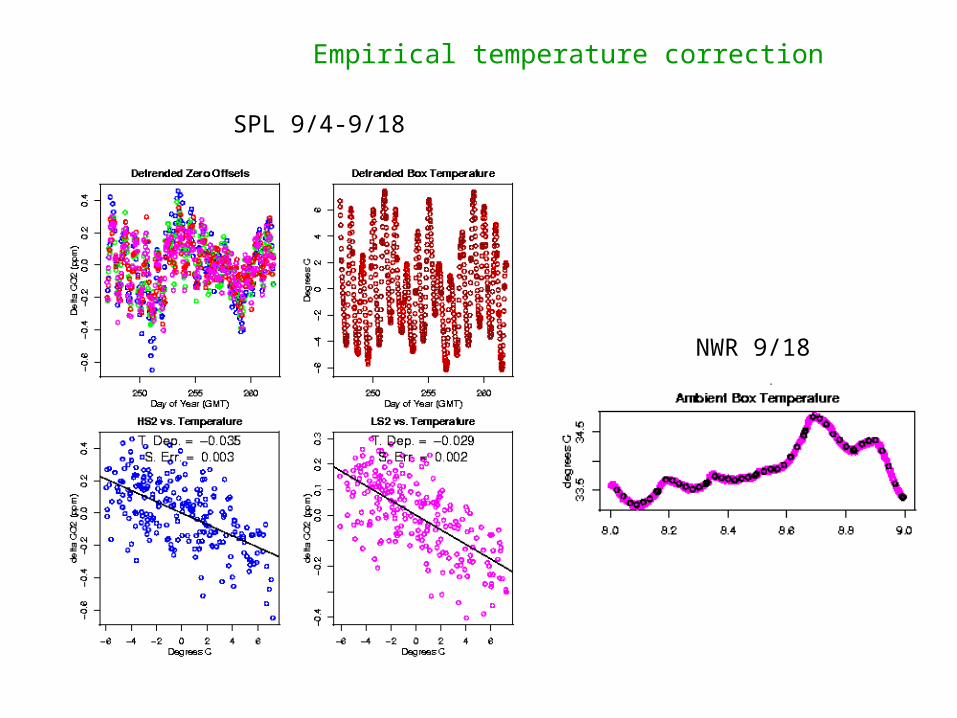
SPL 9/4-9/18
NWR 9/18
Empirical temperature correction

Potential source of bias AIRCOA solutionRelating to WMO CO2 Scale Dedicated CO2 and O2 calibration transfer facility
Short-term IRGA noise Average for 2 minutes to get better than 0.1 ppm precision
Drift in IRGA sensitivity 4-hourly 4-point calibrations and 30-minute 1-point calibrations
IRGA pressure sensitivity Automated 4-hourly pressure sensitivity measurements
IRGA temperature sensitivity 30-minute 1-point calibrations, temperature control at some sites
Incomplete drying of air Slow enough flow (100 sccm), two 96” Nafion driers, downstream humidity sensor to verify performance
Drying system altering CO2 Continuous flows and pressures through Nafions and run surveillance gas through entire system
Incomplete flushing of cell and dead volumes
Fast enough flow (100 sccm), alternate calibration sequence low‑to-high / high-to-low to look for effects
Leaks through fittings, solenoid valves, and pumps
Automated 8-hourly positive pressure leak-down and 4-hourly ambient pressure leak-up checks
Pressure broadening without Ar Use calibration gases made with real air
Fossil CO2 in calibration gases and different field and lab 13C sensitivities
Laboratory tests limit current effect to 0.05 ppm, long-term plans to use cylinders with natural CO2
Regulator temperature effects Tests suggest effect is negligible, but could be regulator dependent
Regulator flushing effects Repeat calibration tests suggest the effect is negligible
Whole-system diagnostics and comparability verification
Long-term surveillance tank analyzed every 8 hours, co-location with other programs, rotating cylinders, and laboratory comparisons
Delay in diagnosis of errors Near real-time data acquisition, processing, and dissemination
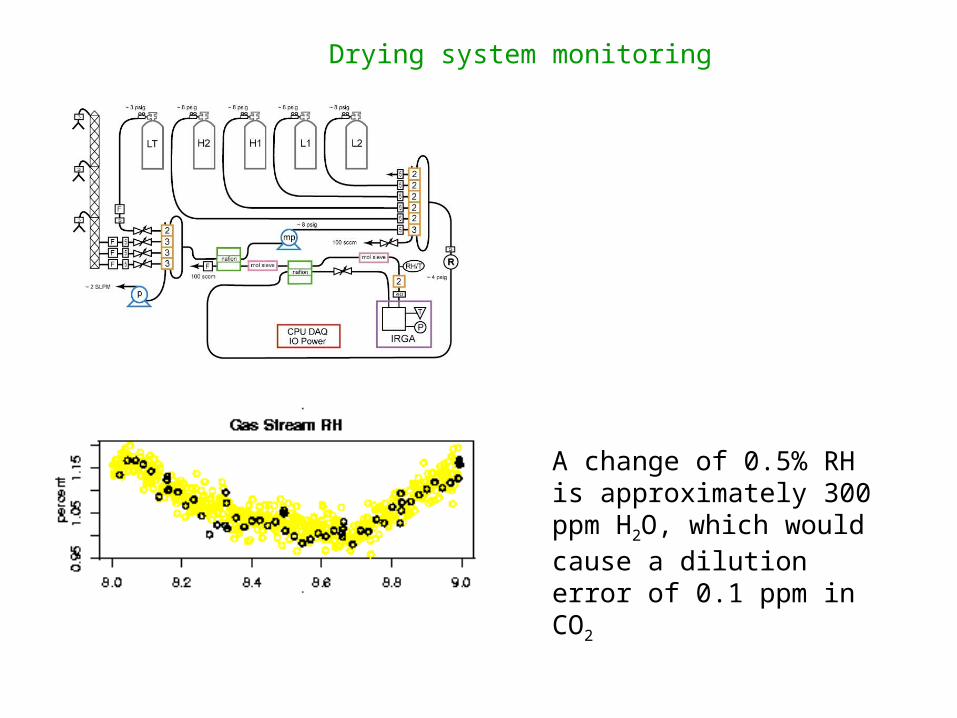
Drying system monitoring
A change of 0.5% RH is approximately 300 ppm H2O, which would cause a dilution error of 0.1 ppm in CO2
Potential source of bias AIRCOA solutionRelating to WMO CO2 Scale Dedicated CO2 and O2 calibration transfer facility
Short-term IRGA noise Average for 2 minutes to get better than 0.1 ppm precision
Drift in IRGA sensitivity 4-hourly 4-point calibrations and 30-minute 1-point calibrations
IRGA pressure sensitivity Automated 4-hourly pressure sensitivity measurements
IRGA temperature sensitivity 30-minute 1-point calibrations, temperature control at some sites
Incomplete drying of air Slow enough flow (100 sccm), two 96” Nafion driers, downstream humidity sensor to verify performance
Drying system altering CO2 Continuous flows and pressures through Nafions and run surveillance gas through entire system
Incomplete flushing of cell and dead volumes
Fast enough flow (100 sccm), alternate calibration sequence low‑to-high / high-to-low to look for effects
Leaks through fittings, solenoid valves, and pumps
Automated 8-hourly positive pressure leak-down and 4-hourly ambient pressure leak-up checks
Pressure broadening without Ar Use calibration gases made with real air
Fossil CO2 in calibration gases and different field and lab 13C sensitivities
Laboratory tests limit current effect to 0.05 ppm, long-term plans to use cylinders with natural CO2
Regulator temperature effects Tests suggest effect is negligible, but could be regulator dependent
Regulator flushing effects Repeat calibration tests suggest the effect is negligible
Whole-system diagnostics and comparability verification
Long-term surveillance tank analyzed every 8 hours, co-location with other programs, rotating cylinders, and laboratory comparisons
Delay in diagnosis of errors Near real-time data acquisition, processing, and dissemination
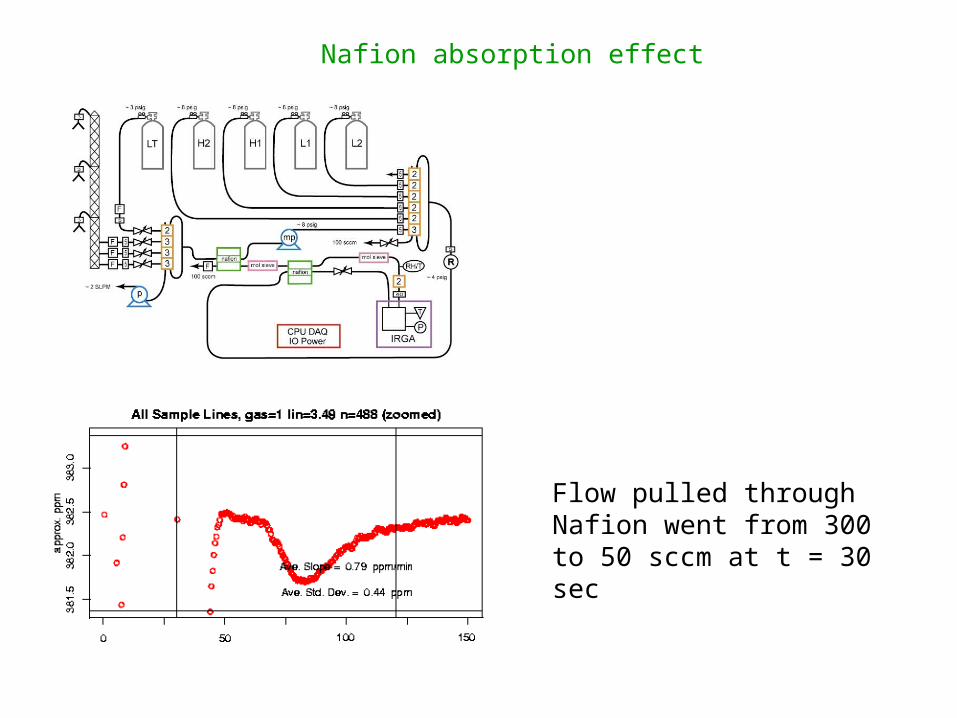
Nafion absorption effect
Flow pulled through Nafion went from 300 to 50 sccm at t = 30 sec
Potential source of bias AIRCOA solutionRelating to WMO CO2 Scale Dedicated CO2 and O2 calibration transfer facility
Short-term IRGA noise Average for 2 minutes to get better than 0.1 ppm precision
Drift in IRGA sensitivity 4-hourly 4-point calibrations and 30-minute 1-point calibrations
IRGA pressure sensitivity Automated 4-hourly pressure sensitivity measurements
IRGA temperature sensitivity 30-minute 1-point calibrations, temperature control at some sites
Incomplete drying of air Slow enough flow (100 sccm), two 96” Nafion driers, downstream humidity sensor to verify performance
Drying system altering CO2 Continuous flows and pressures through Nafions and run surveillance gas through entire system
Incomplete flushing of cell and dead volumes
Fast enough flow (100 sccm), alternate calibration sequence low‑to-high / high-to-low to look for effects
Leaks through fittings, solenoid valves, and pumps
Automated 8-hourly positive pressure leak-down and 4-hourly ambient pressure leak-up checks
Pressure broadening without Ar Use calibration gases made with real air
Fossil CO2 in calibration gases and different field and lab 13C sensitivities
Laboratory tests limit current effect to 0.05 ppm, long-term plans to use cylinders with natural CO2
Regulator temperature effects Tests suggest effect is negligible, but could be regulator dependent
Regulator flushing effects Repeat calibration tests suggest the effect is negligible
Whole-system diagnostics and comparability verification
Long-term surveillance tank analyzed every 8 hours, co-location with other programs, rotating cylinders, and laboratory comparisons
Delay in diagnosis of errors Near real-time data acquisition, processing, and dissemination
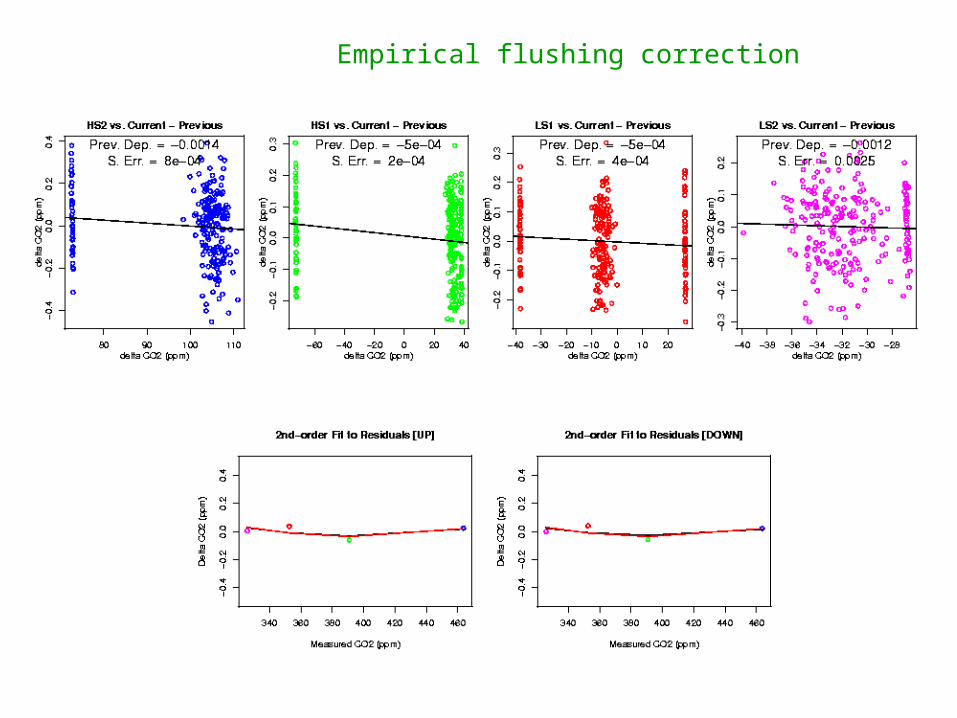
Empirical flushing correction

Potential source of bias AIRCOA solutionRelating to WMO CO2 Scale Dedicated CO2 and O2 calibration transfer facility
Short-term IRGA noise Average for 2 minutes to get better than 0.1 ppm precision
Drift in IRGA sensitivity 4-hourly 4-point calibrations and 30-minute 1-point calibrations
IRGA pressure sensitivity Automated 4-hourly pressure sensitivity measurements
IRGA temperature sensitivity 30-minute 1-point calibrations, temperature control at some sites
Incomplete drying of air Slow enough flow (100 sccm), two 96” Nafion driers, downstream humidity sensor to verify performance
Drying system altering CO2 Continuous flows and pressures through Nafions and run surveillance gas through entire system
Incomplete flushing of cell and dead volumes
Fast enough flow (100 sccm), alternate calibration sequence low‑to-high / high-to-low to look for effects
Leaks through fittings, solenoid valves, and pumps
Automated 8-hourly positive pressure leak-down and 4-hourly ambient pressure leak-up checks
Pressure broadening without Ar Use calibration gases made with real air
Fossil CO2 in calibration gases and different field and lab 13C sensitivities
Laboratory tests limit current effect to 0.05 ppm, long-term plans to use cylinders with natural CO2
Regulator temperature effects Tests suggest effect is negligible, but could be regulator dependent
Regulator flushing effects Repeat calibration tests suggest the effect is negligible
Whole-system diagnostics and comparability verification
Long-term surveillance tank analyzed every 8 hours, co-location with other programs, rotating cylinders, and laboratory comparisons
Delay in diagnosis of errors Near real-time data acquisition, processing, and dissemination
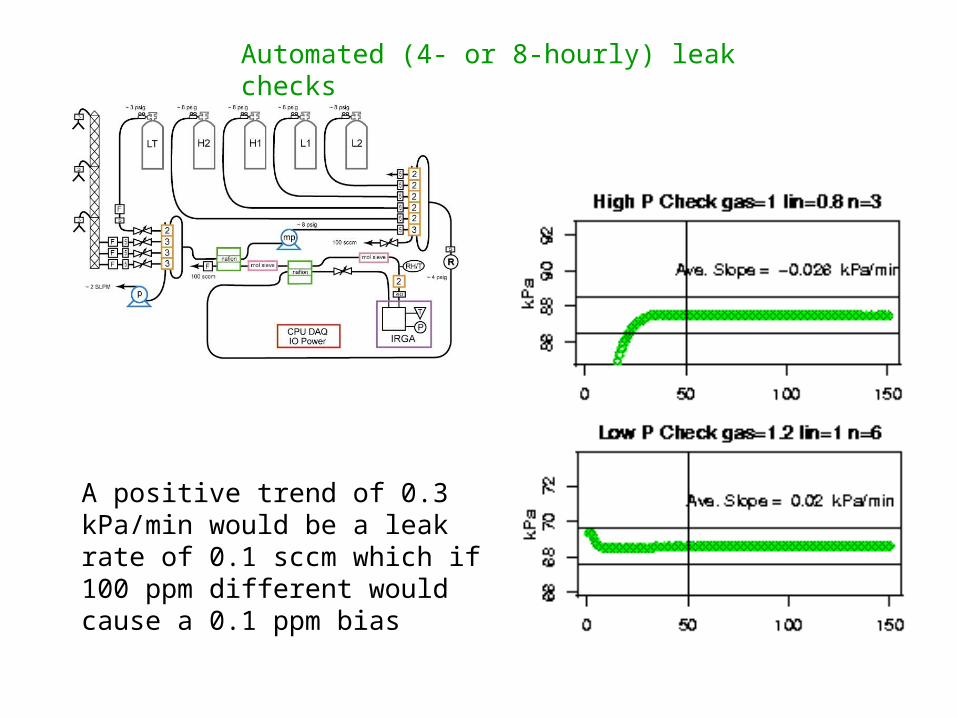
Automated (4- or 8-hourly) leak checks
A positive trend of 0.3 kPa/min would be a leak rate of 0.1 sccm which if 100 ppm different would cause a 0.1 ppm bias

Potential source of bias AIRCOA solutionRelating to WMO CO2 Scale Dedicated CO2 and O2 calibration transfer facility
Short-term IRGA noise Average for 2 minutes to get better than 0.1 ppm precision
Drift in IRGA sensitivity 4-hourly 4-point calibrations and 30-minute 1-point calibrations
IRGA pressure sensitivity Automated 4-hourly pressure sensitivity measurements
IRGA temperature sensitivity 30-minute 1-point calibrations, temperature control at some sites
Incomplete drying of air Slow enough flow (100 sccm), two 96” Nafion driers, downstream humidity sensor to verify performance
Drying system altering CO2 Continuous flows and pressures through Nafions and run surveillance gas through entire system
Incomplete flushing of cell and dead volumes
Fast enough flow (100 sccm), alternate calibration sequence low‑to-high / high-to-low to look for effects
Leaks through fittings, solenoid valves, and pumps
Automated 8-hourly positive pressure leak-down and 4-hourly ambient pressure leak-up checks
Pressure broadening without Ar Use calibration gases made with real air
Fossil CO2 in calibration gases and different field and lab 13C sensitivities
Laboratory tests limit current effect to 0.05 ppm, long-term plans to use cylinders with natural CO2
Regulator temperature effects Tests suggest effect is negligible, but could be regulator dependent
Regulator flushing effects Repeat calibration tests suggest the effect is negligible
Whole-system diagnostics and comparability verification
Long-term surveillance tank analyzed every 8 hours, co-location with other programs, rotating cylinders, and laboratory comparisons
Delay in diagnosis of errors Near real-time data acquisition, processing, and dissemination

= Scott Marrin = SIO
JJ8588 JJ13623 CC79567 CC79546 JJ8550 JJ21201 CC161533
Li820-Siemens CO2 0.000 -0.084 -0.028 -0.014 -0.035 -0.051 0.044
ave Scott Marrin -0.043 ave SIO 0.001stdev Scott Marrin 0.035 stdev SIO 0.038stderr Scott Marrin 0.017 stderr SIO 0.022
Scott Marrin cylinders have a small (~ -0.04 ppm) bias on Li820 relative to Siemens
O2 Variability 4.980 5.250 0.600 0.540 4.700 4.030 0.390
ave Scott Marrin 4.740 ave SIO 0.510stdev Scott Marrin 0.524 stdev SIO 0.108stderr Scott Marrin 0.262 stderr SIO 0.062
6/24-6/21 O2 24.060 26.950 1.350 0.850 29.030 25.470 0.480
ave Scott Marrin 26.378 ave SIO 0.893stdev Scott Marrin 2.126 stdev SIO 0.437stderr Scott Marrin 1.063 stderr SIO 0.252
Scott Marrin cylinders have much more short-term and long-term drift for O2
13C bias test

Potential source of bias AIRCOA solutionRelating to WMO CO2 Scale Dedicated CO2 and O2 calibration transfer facility
Short-term IRGA noise Average for 2 minutes to get better than 0.1 ppm precision
Drift in IRGA sensitivity 4-hourly 4-point calibrations and 30-minute 1-point calibrations
IRGA pressure sensitivity Automated 4-hourly pressure sensitivity measurements
IRGA temperature sensitivity 30-minute 1-point calibrations, temperature control at some sites
Incomplete drying of air Slow enough flow (100 sccm), two 96” Nafion driers, downstream humidity sensor to verify performance
Drying system altering CO2 Continuous flows and pressures through Nafions and run surveillance gas through entire system
Incomplete flushing of cell and dead volumes
Fast enough flow (100 sccm), alternate calibration sequence low‑to-high / high-to-low to look for effects
Leaks through fittings, solenoid valves, and pumps
Automated 8-hourly positive pressure leak-down and 4-hourly ambient pressure leak-up checks
Pressure broadening without Ar Use calibration gases made with real air
Fossil CO2 in calibration gases and different field and lab 13C sensitivities
Laboratory tests limit current effect to 0.05 ppm, long-term plans to use cylinders with natural CO2
Regulator temperature effects Tests suggest effect is negligible, but could be regulator dependent
Regulator flushing effects Repeat calibration tests suggest the effect is negligible
Whole-system diagnostics and comparability verification
Long-term surveillance tank analyzed every 8 hours, co-location with other programs, rotating cylinders, and laboratory comparisons
Delay in diagnosis of errors Near real-time data acquisition, processing, and dissemination
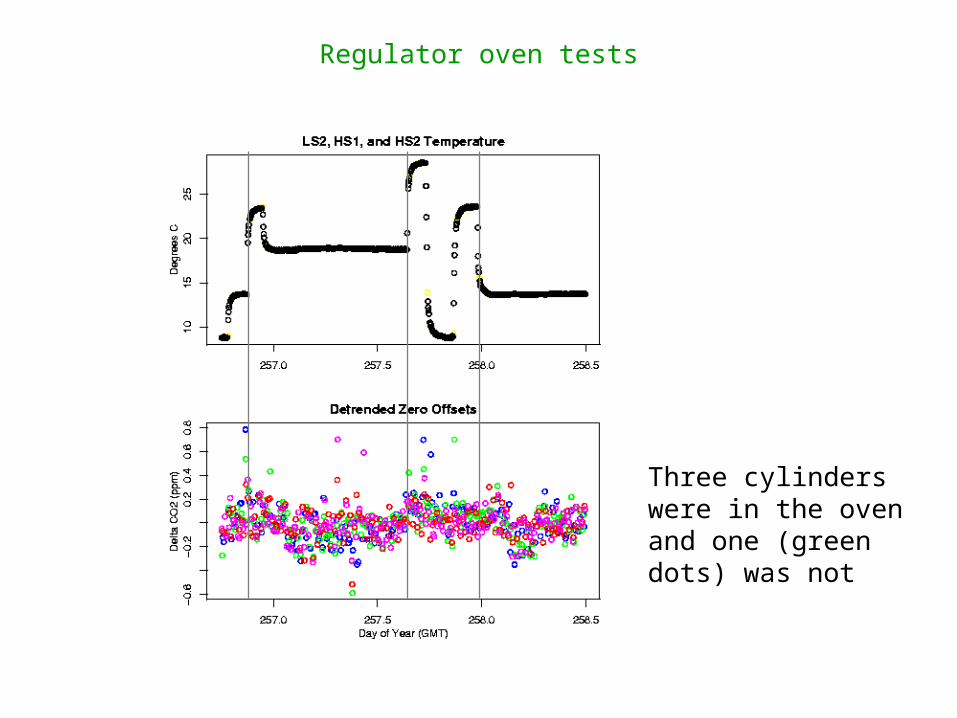
Three cylinders were in the oven and one (green dots) was not
Regulator oven tests

Potential source of bias AIRCOA solutionRelating to WMO CO2 Scale Dedicated CO2 and O2 calibration transfer facility
Short-term IRGA noise Average for 2 minutes to get better than 0.1 ppm precision
Drift in IRGA sensitivity 4-hourly 4-point calibrations and 30-minute 1-point calibrations
IRGA pressure sensitivity Automated 4-hourly pressure sensitivity measurements
IRGA temperature sensitivity 30-minute 1-point calibrations, temperature control at some sites
Incomplete drying of air Slow enough flow (100 sccm), two 96” Nafion driers, downstream humidity sensor to verify performance
Drying system altering CO2 Continuous flows and pressures through Nafions and run surveillance gas through entire system
Incomplete flushing of cell and dead volumes
Fast enough flow (100 sccm), alternate calibration sequence low‑to-high / high-to-low to look for effects
Leaks through fittings, solenoid valves, and pumps
Automated 8-hourly positive pressure leak-down and 4-hourly ambient pressure leak-up checks
Pressure broadening without Ar Use calibration gases made with real air
Fossil CO2 in calibration gases and different field and lab 13C sensitivities
Laboratory tests limit current effect to 0.05 ppm, long-term plans to use cylinders with natural CO2
Regulator temperature effects Tests suggest effect is negligible, but could be regulator dependent
Regulator flushing effects Repeat calibration tests suggest the effect is negligible
Whole-system diagnostics and comparability verification
Long-term surveillance tank analyzed every 8 hours, co-location with other programs, rotating cylinders, and laboratory comparisons
Delay in diagnosis of errors Near real-time data acquisition, processing, and dissemination
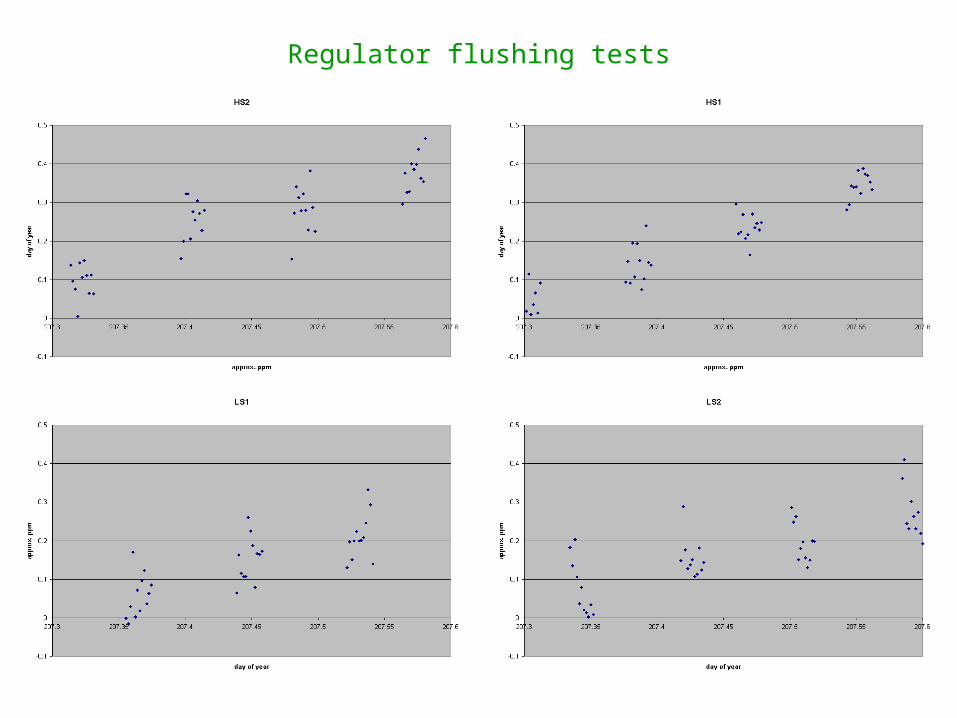
Regulator flushing tests

Potential source of bias AIRCOA solutionRelating to WMO CO2 Scale Dedicated CO2 and O2 calibration transfer facility
Short-term IRGA noise Average for 2 minutes to get better than 0.1 ppm precision
Drift in IRGA sensitivity 4-hourly 4-point calibrations and 30-minute 1-point calibrations
IRGA pressure sensitivity Automated 4-hourly pressure sensitivity measurements
IRGA temperature sensitivity 30-minute 1-point calibrations, temperature control at some sites
Incomplete drying of air Slow enough flow (100 sccm), two 96” Nafion driers, downstream humidity sensor to verify performance
Drying system altering CO2 Continuous flows and pressures through Nafions and run surveillance gas through entire system
Incomplete flushing of cell and dead volumes
Fast enough flow (100 sccm), alternate calibration sequence low‑to-high / high-to-low to look for effects
Leaks through fittings, solenoid valves, and pumps
Automated 8-hourly positive pressure leak-down and 4-hourly ambient pressure leak-up checks
Pressure broadening without Ar Use calibration gases made with real air
Fossil CO2 in calibration gases and different field and lab 13C sensitivities
Laboratory tests limit current effect to 0.05 ppm, long-term plans to use cylinders with natural CO2
Regulator temperature effects Tests suggest effect is negligible, but could be regulator dependent
Regulator flushing effects Repeat calibration tests suggest the effect is negligible
Whole-system diagnostics and comparability verification
Long-term surveillance tank analyzed every 8 hours, co-location with other programs, rotating cylinders, and laboratory comparisons
Delay in diagnosis of errors Near real-time data acquisition, processing, and dissemination
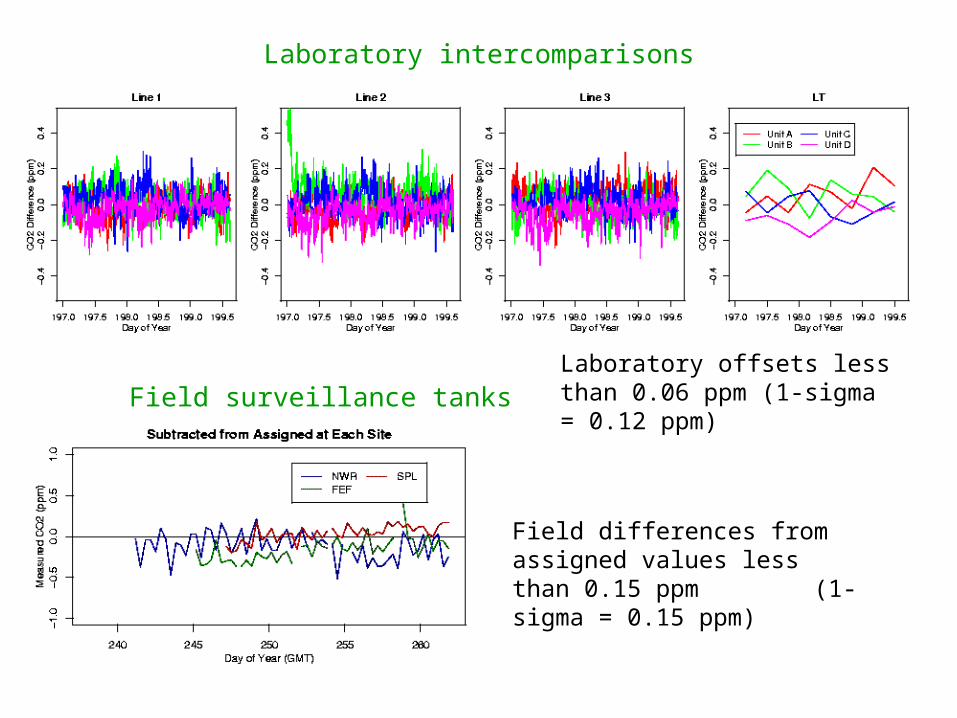
Laboratory intercomparisons
Field surveillance tanksLaboratory offsets less than 0.06 ppm (1-sigma = 0.12 ppm)
Field differences from assigned values less than 0.15 ppm (1-sigma = 0.15 ppm)

Potential source of bias AIRCOA solutionRelating to WMO CO2 Scale Dedicated CO2 and O2 calibration transfer facility
Short-term IRGA noise Average for 2 minutes to get better than 0.1 ppm precision
Drift in IRGA sensitivity 4-hourly 4-point calibrations and 30-minute 1-point calibrations
IRGA pressure sensitivity Automated 4-hourly pressure sensitivity measurements
IRGA temperature sensitivity 30-minute 1-point calibrations, temperature control at some sites
Incomplete drying of air Slow enough flow (100 sccm), two 96” Nafion driers, downstream humidity sensor to verify performance
Drying system altering CO2 Continuous flows and pressures through Nafions and run surveillance gas through entire system
Incomplete flushing of cell and dead volumes
Fast enough flow (100 sccm), alternate calibration sequence low‑to-high / high-to-low to look for effects
Leaks through fittings, solenoid valves, and pumps
Automated 8-hourly positive pressure leak-down and 4-hourly ambient pressure leak-up checks
Pressure broadening without Ar Use calibration gases made with real air
Fossil CO2 in calibration gases and different field and lab 13C sensitivities
Laboratory tests limit current effect to 0.05 ppm, long-term plans to use cylinders with natural CO2
Regulator temperature effects Tests suggest effect is negligible, but could be regulator dependent
Regulator flushing effects Repeat calibration tests suggest the effect is negligible
Whole-system diagnostics and comparability verification
Long-term surveillance tank analyzed every 8 hours, co-location with other programs, rotating cylinders, and laboratory comparisons
Delay in diagnosis of errors Near real-time data acquisition, processing, and dissemination
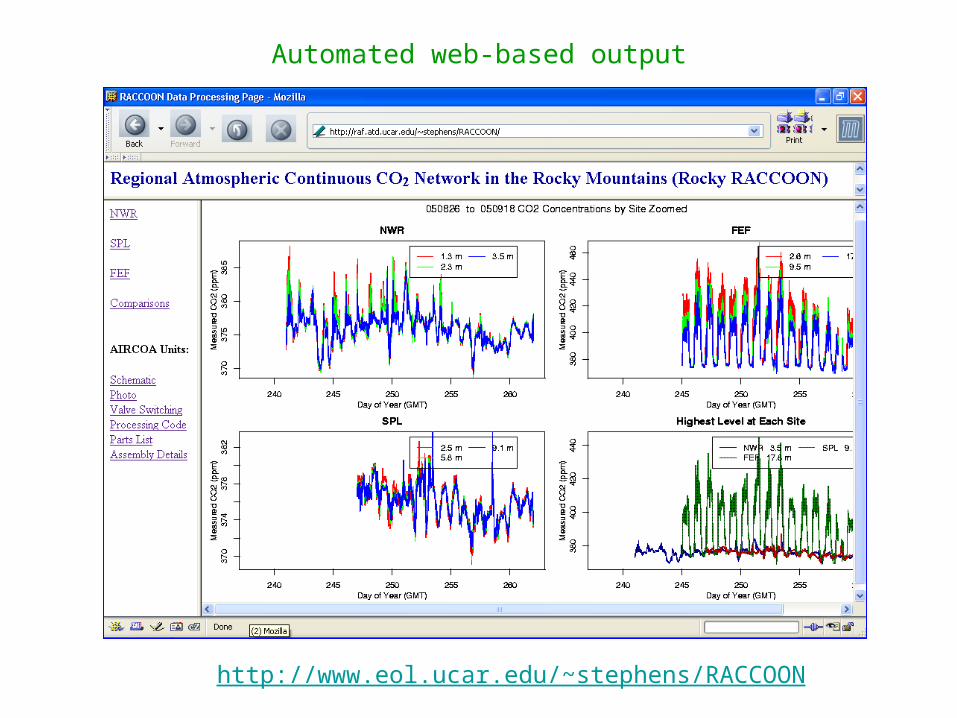
Automated web-based output
http://www.eol.ucar.edu/~stephens/RACCOON