Embed Size (px)
Citation preview
DOT/FAA/PM-84/ 13
(Y) .Project Report.......................ATC-128.
00
An Automatic Weather Station Networkfor Low-Altitude 'Wind Shear Investigations.
M.M. WolfsonJ.T. DiStefano
D.L Mingle
18 September 1984
Lincoln Laboratory.'MASSACHUSETTS INSTITUTE OF TECHNOLOGY
LwNcroiy. PAscasIZeTT .-..
Prepared for the Federal A v~ios Admiiuion.
Doennoent is a'v1abke to e pu)1c~rwg d- 4.tbe NadoeW Teehgicai Informaton Scrv4e,* : qUV .30 1994,
Springfield, Virginia 2216L . - .

NOTICE
This document is disseminated under the sponsorship of theDepartment of Transportation in the interest of informationexchange. The United States Government assumes no liabilityfor its contents or use thereof.
4
. ... . . . . . . . . . . . ... °

TECHNICAL REPORT DOCUMENTATION PAGE
1. Report u. 2, Govermaet Accoaia no. M. Reclpieffs catele ma.
DOT-FAA-PM-84/13
4. "rns. SAW Sobtl I. Reo as"
An Automatic Weather Station Nework for Low-Altitude 18 September 1984S. Podusill Orgaized Ceft
Wind Shear Investigations
7. Ater(s) 8. Pereruieg Orspizele eai't U.
Marilyn M. Wolfson, John T. DiSteifano, Diana L. Klingle ATC-128
1. Pereorlg Orp zstle Nme 11d, AiAdrM IN. Wwk tidt Ro.
Lincoln Laboratory, M.I.T. ___. _ ________o.
P.O. Box 73 CeeActer Greet HeLexington. MA 02173-0073 1 DTFAo1-80-Y-10546
i2. Tyrpe eil epetmd Peried Ceaef
12. Speos rig Alncy ame Ied Address
Department of Transportation Project ReportFederal Aviation AdministrationSystems Research and Development Service 1. Sor Ce
Washington, D.C. 20591
Is. Sempeanterr Notes
The work reported in this document was performed at Lincoln Laboratory, a center for research operatedby Massachusetts Institute of Technology, under Air Force Contract F19628-80-C0002.
15. Abstract
4 During the summer of 1983 an exi :,*mental network of automatic weather stations (amesonet) was operated in the vicinity of Hanscom Field. northwest of Boston. as part of alarger effort to collect Doppler radar and meteorological data on thunderstorms and otherpotentially hazardous weather events in this area. This report describes the mesonet systemused and preswnts in detail the data collected on 21-22 July 1983. Conclusions about the limi-tations and the future use of the mesonet system are also included.
17. Key Words 18. Desee Stme"
mesonet low altitude wind shear Document is available to the public through
automatic weather station Doppler weather radar the National Technical Information Service.PROBE station microburst Springfield, Virgins 22161.
1. Secvrity Classil. (of tIis report) 20. Security Csode. (oftis pe) 21. Me. of Paes 22. Price
Unclassified Unclassified 68
Form DOT F 1700.7 (8.69)
ACKNOWLEDGEMENTS
Many individuals were responsible for making the mesonet project a
reality in a very short period of time. We wish to specially thank
A. Cameron, M. Couture, N. Kinch, D. Meuse, A. Doiron, F. Groezinger,
M. Merritt, D. Hamilton, E. Becotte, J. A. Pisner, B. Farino, M. Dalpe' and
K. Callvood of Lincoln Laboratory, K. Hardy, R. Fournier, and S. Meunch of
the Air Force Geophysics Laboratory, P. Hurley, W. Harrison, B. Silverman,and P. Bajney of the Bureau of Reclamation, R. McConnell of ERT, and D.Turnbull and C. jones of the FAA.
We also thank the Air Force Geophysics Laboratory for the satellite
data published herein, and the Bureau of Reclamation for some of the soft-ware used in plotting the resonet data.
Above all, we thank the individual landowners who, by allowing us touse their property, gave us the chance to experiment with our weather sta-
t~onB and gain valuable experience in their deployT ent and operation.
I~ .V
lli -'I.

LIST OF ACRONYMS AND ABBREVIATIONS
AFGL Air Force Geophysics Laboratory
AWS Air Force Air Weather Service
DCP Data Collection Platform
EDT Eastern Daylight Time
EST Eastern Standard Time
FAA Federal Aviation Administration
GOES Geostationary Operational Environmental Satellite
JAWS Joint Airport Weather Studies
mesonet Mesoscale network (usually of weather stations)
MIT Massachusetts Institute of Technology
NEMA National Electrical Manufacturers' Association
NESDIS National Environmental Satellite, Data, and Information Service
NEXVAD Next Generation Weather Radar
NOAA National Oceanic and Atmospheric Administration
NWS National Weather Service
PROBE Portable Remote Observations cf the Environment(name for automatic weather stations)
iv
0i

CONTENTS
Acknowledgements iiList of Acronyms and Abbreviations iv
List of Figures Vii
I. INTRODUCTION 1
A. Overview of Weather Radar Studies - Summer 1983 1
B. Low Altitude Wind Shear 2C. Scientific Objectives 4
D. Experimental Design 7
II. THE MESONET 10
A. Background 10
B. The 1983 Network 13
C. Weather Station Instrumentation 15
0 1. Wind Speed and Direction Sensors 162. Temperature and Humidity Probe lb3. Pressure Tranaducer 17
4. Precipitation Gauge 17
D. Data Collection Platforms 18
E. Site Hardware 19
I. Tower 192. Electronics Enclosure 19
3. Solar Panels 19
4. Lightning Protection 19
III. CASE STUDY: 21 July 1983 20
A. Introduction 20B. Summary of Weather Situation 20
C. Satellite Data 26
D. Mesonet Data 26
I. Explanation of Figures 31
2. Features of the Data 31
3. Discussion of Individual Station Data 32
E. Doppler Radar Data 48F. Damage Reports 46
IV. CONCLUSIONS 50
A. Upgrading Mesonet Equipment 50
1. Temporal Resolution 502. Operational Reliability 50
V

CONTENTrS
V. RECOMMENDATIONS 53
A. Equipment Upgrades 53B. Future Measurements 53
KEFERE jZ 54
APPENDIX A Summary of Weather Eveuts and Collected Data 55
rAPPENDIX B Data Requests 58
vi

LIST OF FIGURES
1-1 Typical structure of a mature storm cell. 3
1-2 Schematic drawing of an aircraft encounter with a 5microburst.
1-3 Vertical cross-section of microburst winds at the 6time of PA 759 take-off from New Orleans InternationalAirport.
1b 1-4 HIT Doppler Weather Radar in Cambridge, MA. 8
1-5 University of North Dakota instrumented Cessaa 9Citation 11.
1-6 Lincoln Laboratory Experimental Operations Control 9Center.
2-1 PROBE automatic weather station. 11
2-2 View of PROBE station from side not shown in Fig. 2-1. 12
2-3 Summer 1983 Mesonet. 14
3-1 Surface weatiher map for 2100Z on 21 July 1983. 21
3-2 Surface weather map for OOOOZ on 22 July 1983. 22
3-3 Surface weather map for 0300Z on 22 July 1983. 23
3-4 Station model showing symbolic form of synoptic 24weather code.
3-5 Visible satellite image for 12:30 p.m. (EDT) on 2522 July 1983.
3-6 Visible satellite image for 11:00 a.m. (EDT) on 2721 July 1983.
3-7 Visible satellite image for 11:30 am. (EDT) on 27
21 July 1983.
3-8 Visible satell'te image for 12 Noon (EDT) on 2721 July 1983.
3-9 Visiblc satellite image for 12:30 p.m. (EDT) on 2821 July 1983.
vii
- .. .- . • a.

LIST OF FIGURES (Continued)
Visible satellite image for 1:00 p.m. (EDT) on 28
21 July 1983.
Visible satellite iuage for 1:30 p.m. (EDT) on 28 45
21 July 1983. 46
Visible satellite liage for 2:00 p.m. (ElT) on 29 47
21 July 1983.
Visible satellite image for 2:30 p.m. (EDT) on 29 49
21 July 1983. 49
Visible satellite image for 3:00 p.m. (EDT) on 29 49
21 July 1983.
Visible satellite image for 3:30 p.m. (EDT) on 30 tat& 51
21 July 1983.
Visible satellite image for 4:00 p.m. (EDT) on 30
21 July 1983.
Visible satellite image for 4:30 p.m. (Eui) on 30
21 July 1983.
Map of weather stations (for msonet) showing relative 34
locations and 3-letter identifying names.
Mesonet data - AFC 35
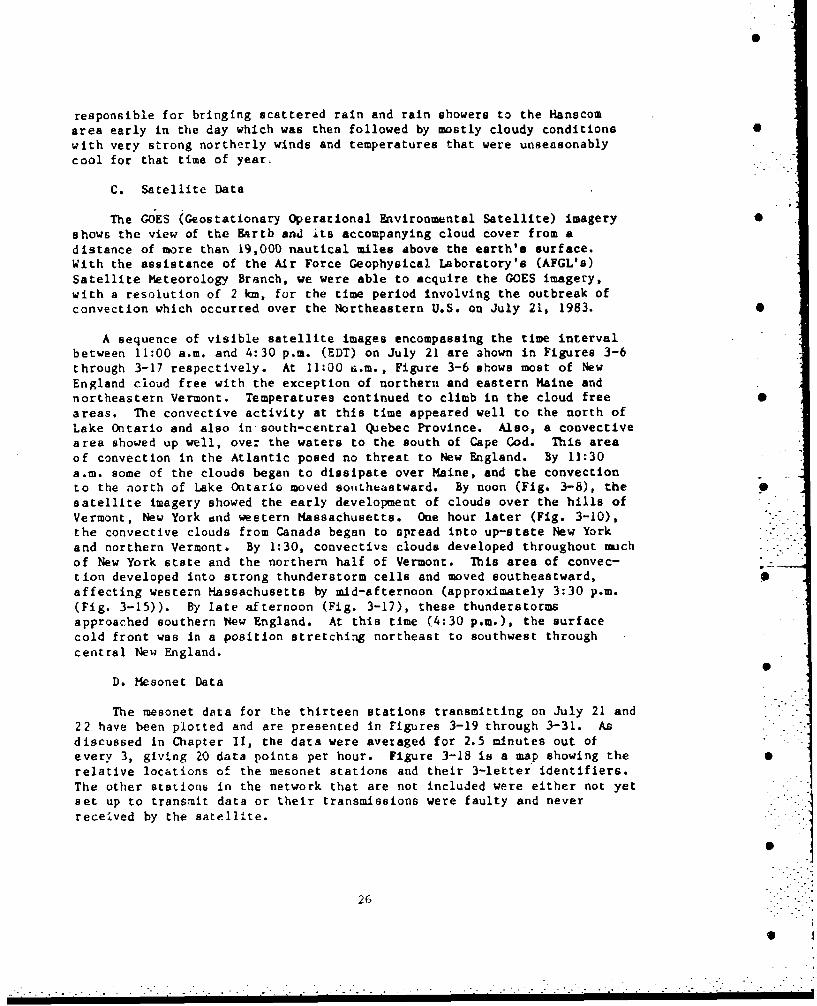
Hesonet data - LAW 36
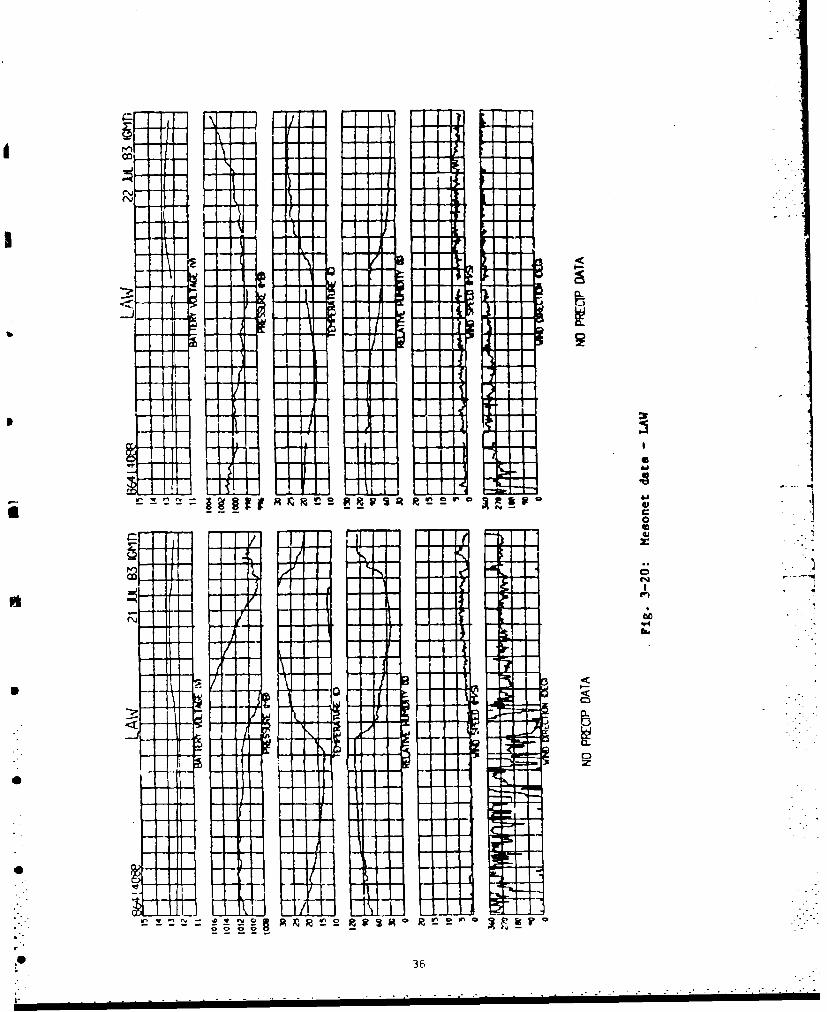
Mesonet data - CON 37
Mesonet data - DUD 18
Hesonet data - VER 39
Mesonet data - NUB 40
Hesonet data - NAG 41
* Mesonet data - JWL 42
Mesonet data - PIG 43
Mesonet data - VAL 44
viii
-0

1. INTRODUCTION
A. Overview of Weather Radar Studies - Summer 1983
The Lincoln Laboratory Group 47 FAA Weather Radar Project has been
concerned with identifying and understanding the technical issues asso-
ciated with unique FAA needs for weather information used by pilots, air
traffic controllers and meteorologists. The weather radar is a primary
source of this information, but the radars currently is use have a number
of deficiencies. The FAA, the National Weather Service (NWS), and the Air
Fcrce Air Weather Service (AWS) have joined together to fund a national
network of "next generation" weather radars (NEXRAD) that will have
advanced capabilities. In particular, the radars will be capable of
sensing wind speed and direction by Doppler processing. These Doppler
radars can detect rain, hail, turbulence, and low altitude wind shear and
can measure the wind characteristics as a function of altitude.
However, without an expert to interpret the raw Doppler weather radar
data the pilots and controllers would be unable to spot the hazards. Thus
the FAA will require an automated system of weather hazard detection based
on Doppler radar data. They further require that the detection be per-formed in real time and that the warnings be free of false alarms and be
issued in a timely manner.
During the summer of 1983, Lincoln began a long term study that places
emphasis on automated hazardous weather detection in the airport terminal
area with a NEXRAD-like Doppler weather radar. Most fatal aircraft acci-
dents for which weather has been cited as the cause have occurred in the
airport terminal area. From investigations of these accidents it hab beendetermined that low altitude wind shear specifically has often been the
cause. Understandably, the FAA is especially interested in knowing more
about the causes and the characteristics of low altitude wind shear. Thus,the Lincoln Doppler radar studies of aviation-hazardous weather focus.on
the automatic detection and warning of low altitude wind shear in an air-
port terminal area.
It is this focus on low altittide wind shear that lead us to realize
that a network of automatic weather stations (the "mesonet") would be
required to gather surface meteoro*.ogical data in conjunction with our
collection of Doppler weather radar data. The reasons for this are
reviewed in section D of this chapier, on Experimental Design. A lull
understanding of the experiment rec uires that the reader have someknowledge of exactly what is meant by low altitude wind shear (this is pre-
sented in the following section) aid some knowledge of our overall scien-
tific objectives and goals (sectioi C) as well.
. . ..S. .. . . _ . . _ . . ° . . . . .

Details on the mesonet system are presented in the second chapter ofthis report which inc~udes information on the Summer 1983 network, the sen-
sors used to measure the meteorological variables, and how the data is
collected and processed. Although the summer of 1983 was very calm and dryin the Boston area, a data set was collected on 21 July that consisted ofmuch rain and some hazardous weather. A case study of that day is pru-sented in'Chapter Ill. Finally, conclusions about the use of our weatherstation equipment are presented in Chapter IV, and some of our future plansare presented in Chapter V.
B. Low Altitude Wind Shear
Low altitude wind shear, in its various forms, has long been known asa hazard to aviation for it influences aircraft at probably the most
vulnerable time during their entire flight. The wind shear encountered ontake-off or landing has caused several tragic accidents, the most recentbeing the Pan Am 759 crash in July 1982 just outside of the Kew OrleansInternational Airport.
Low altitude wind shear is a broad category encompassing severaldistinct meteorological phenomena. The most common of these is the -gustfront", the boundary between cool air flowing out from beneath a maturethundecstorm and the surrounding warm environmental air. Although a gustfront it created by a particular storm cell, it can propagate miles awayfrom tht parent ccll and caii last for hours, as well as begre and aix with
outflow currents from other neighboring cells.
The main danger for aircraft encountering a gust front is the suddenchange in both horizontal and vertical wind speed and direction across thefront. Since the shear zone associated with the gust front is spatiallylarge in the along-front direction (10 km or more), is fairly perslitent(lifetimes greater than 20 min), and is advected horizontally in the lowlevel flow, the task of automatically predictiug gust fronts will be mana-geable as long as they can be detected some distance away from the airport.Figure i-1 shows the structure of a mature thunderstorm with an overlay.showing a typical aircraft glideslope penetrating the shear zone associatedwith the gust front.
A more recently discovered, but possibly also common meteorologicalphenomenon contributing to low level wind shear is the "downburst". Thedownburst is defined as a divergent outflow of damaging wind (>18 metersper second, 35 nautical miles per hour) of spatial extent greater than 4 kmacross. If the outflow is less that 4 km across, it is called a"microbu s t". Although downbursts and microbursts are the resuilt ofdowndrafts of various sizes ipacting the ground and spreading, the expla-nations for the downdrafts themselves differ.
2. "

TYPICAL STRUCTURE OF A SEVERETHUNDERSTORM CELL IN THE MATURE STAGE
UPPER WINDS
ALTI7Uf)E Ifil
40 000
ICE CRYSTALS35 000 -
30000SNOW (and Ned,)
26000 \~T20 004DSO
WATER
6 000SHA
91SUFACE SURFACEORAIN
0 t': I M,HORIZONTAL SCALE
0 30 9il. aDRAFT VECTOR SCALE
S Fig. 1-1: Typical structure of a mnature stor-m cell. The solid line,separatinp updraft frzDm downdraft inside the cell and outflowfrom inflow in front of the cell, represents the turbulentshear zone.

I
I
The downburst or microburst, unlike the gust front, is a small scalehighly divergent wind shear event. The temporal scale of a microburst canbe characterized by the time from initial low altitude divergence to thetime of maximum velocity differential. Wilson and Roberts (1) have shownthis time scale to the approximately 4 minutes, which is in agreement withindividual analyses done by Fujita (2). However, the peak outflow windsmay 'ast only one minute and be 25% to 50% stronger than those in the pre-ceding or following minute. These features, compounded with the fact thatdownbursts descend from aloft rather than propagate horizontally into anarea, will make them extreaely difficult to predict and detect.
The downburst/microburst is truly an aircraft hazard; a plane may£ experience increased lift when first encountering the downburst outflow but
the central downdraft and increased tailwind on the far side force theaircraft to lose airspeed and sink rapidly. Figure 1-2 illustrates thedanger of an aircraft encounter with a microburst. An analysis of the PanAm Flight 759 accident revealed that a microburst was responsible for thewind shear that caused the plane to crash. Figure 1-3 shows a verticalcross cross sectiou of the low altitude winds at the time that accidenttook place (3).
Other sources of low altitude wind shear are squall lines, cold fronts,low level jet streams, tornadoes, and any strong localized convection whichproduces gusty winds and low altitude turbulence. Of all of these phenomena,the tornado is by far the most devastating. In our wind shear studies theemphasis is placed on downbursts and microbursts for they appear to be com-mon (at least near Denver and Chicago), are not well understood, and may bethe most aviation-hazardous form of low altitude wind shear.
C. Scientific Objectives
The ultimate goal of our studies Is the achievement of an automatedo'erational capability of low altitude wind shear detection and predictionin the airport terminal environment. Other data gathering experiments haveshown that downbursts/microbursts are indeed a real problem and that theDoppler radar is a useful tool for detecting them. However, we need todetermine the applicability of those conclusions to weather in various
*I geographical locations.
As a first step in meeting our objective, the Lincoln Laboratory FAA :1Weather Radar Project conducteu a small field experiment during the summerof 1983 to gather data on low altitude wind shear and dowubursts associatedwith convective storms in the Boston area. The experiment, based in the 'area north and west of Bostcn around Hanscom Field, did provide some indica-tion of the low altitude wind shear frequency in this area, even though thesummer was unusually storm free. The main reason for conducting theexperiment here was not the severity of ihc storms or the frequency of lowaltitude wind shear in this area. The reasons were:
1. because we had accef;s to the MIT radar, and could adapt a signalprocessor capable of estimating Doppler velocity and filteringground clutte- to the radar fairly easily, and
4
L

AIRCRAFT ENCOUNTER WITH A MICROBURST
FEET
400
400
300-
200
100 _______
SLOP
0
Fig. 1-2: Schematic drawing of an aircraft encounter wi1rh a microburst.Notice how the increased headwind lifts the plane above itsintended glideslope while tL.e increased tailwind causes theplane to fall below its intended glideslope.
"0
• , 5
S .

VEtITICAL CROSS SECTION OF MICROBURST WINDS7z
600 _ W
40Z) 0
allI
L ~~UTFLO / SA STGNATION . ... ... .
CO iNE
0 20 00 6000 12;00 CjOOQ
F'ig. 1-3: Vertical cross section of microburst winds at the time ofPA 759 take off from New Orleans International Airport.The dow'nflow combined with the strong outflow caused theplane to lose lift and crash in a residential i.eighborhoodnear the airport. After Fulita (3).

S
2. to allow us to examine the degree to which a Doppler radarcould collect data for use in automatic detection algorithmsin the challenging ground clutter environment typical of manyeast coast airports.
Additionally, our experiment last summer served primarily as preparationfor the use of an FAA transportable Doppler weather radar teetbed now beingdeveloped at Lincoln. Upon completion (June, 1984), the testbed will betaken to its first field site in the Memphis, TN area (Olive Branch,Mississippi) where the thunderstorm frequency is expected to be very high. 0Subsequently, the testbed will be used to collect storm data under varyinggeographic and meteorological conditions.
D. Experimental Design
The Weather Radar Project collected meteorological and radar data in athe Boston area during the months of July and August, 1983. Simultaneousmeasurements were made by the MIT S-band Doppler radar located atop theGreen Building on the MIT Campus in Cambridge (Fig. 1-4), the University ofNorth Dakota instrumented Citation II research aircraft (Fig. 1-5), and a
dense array of 25 automatic surface weather stations (average spacing of 3km) located in the area around Hanscom Field. It is this array we call a •mesonet" which is short for "mesoscale network" of weather stations.
The primary object Lve of operating a mesonet of automatic weather sta-tions in conjunction -.ith the testbed are:
I. to provide confirmation and quantification of low altitude wind ashear events detected in the Doppler radar data (which detectsonly the radial (relative to the radar) comronent of thewind), and
2. to provide an indication of otherwise undetected wind shearevents.
The hope is that with this mesonet data we can quantify the relationshipbetween known wind shear events and their signatures in the radar fields.This is an essential step in development of automatic wind shear hazarddetection techniques based on single Doppler radar data.
Our experimental operations control center was located at LincolnLaboratory, wh.ere we had real-time displays of reflectivity, Doppler velo-city, and turbulence (derived from the width of th" Doppler spectrum) fromthe MIT radar, and aircraft location" on an air traffic controller's planview display (see Fig. 1-6).
7

0 C/
*0 0
I"A I 1 U T
a- Ii i CUI L) ~
Zi .i] I mTL I, 1 9
o1 1 '- 1 o
I Al'~ZM

0 F
BA
F'ig. 1-5; University of North Dakota instrumented Cessna Citation II1jet, parked in front of the Lincoln Laboratory FlightFa cilit y.
.1<.
V.-. --~2 ~- _ ____
.0p
Fig 3-6 Lncon Lboatoy EpeimetalOpratonsCotro Cetein Anex11. Radr daa i beng isplyedon nre
i tafefic cnrd er ' data is e displaydo. ne
9

II. THE KESONET
A. Background
The automatic weather stations that were first used by Lincoln
Laboratory in the summer of 1983 were developed by the US Department of theInterior Bureau of Reclamation's Office of Atmospheric Resources Managementin the late 1970's. These stations were given the name PROBE, standing for
Portable Remote OBservations o! Lhe Environment - exactly what they were
designed to provide. There was a basic research need at that time for a
meteorological data collection ietwork that would allow short term predic-tions of convective activity, could provide good time resolution, and couldbe operational in very little time without the need for installing power or
r telephone data lines.
The stations, shown in Figs. 2-1 and 2-2, were designed to record thefollowing surface meteorological data: temperature, relative humidity,
barometric pressure, wind speed, wind direction, and precipitation amounts.Each station averagee its data according to the selected interval (2 to 5
min), stores the averaged data in memory, and transmits the data at regu-
larly timed intervals to the GOES (Geostationary Operational Environmental
Satellite). The data is rel&yed by the satellite back to earth where it is
collected by the NOAA National Environmental Satellite, Data, andInformation Service's (NESDIS's) ground station on Wallops Island and by
anyone with a receiving station tuned to the correct channel. An addi-tional advantage to collecting the data this way is that the sites almost
never have to be visited if they are working properly. The power for the
stations is provided by a 12V dee- cycle battery which is continuously
trickle-charged during daylight hours by the solar panels.
The FAA arranged for the Bureau of Reclamation to furnish 25 of thesePROBE stations to Lincoln Laboratory to be operated in the vicinity of
Hanscom Field in support of our Summer 1983 Doppler radar experiments. Thego-ahead to transfer the equipment was granted in late May and the equip-ment was received by Lincoln in mid-June, Sites were selected and land-
owners were contacted for permission to use their open fields.
Unfortunately, a number of problems such as a delay in the allocationof a channel on the GOES EAST satellite, the failure to record data within
24 hours of its reception (the data was then lost), equipment problems andof course, inexperience all prevented the data from being continuously
recorded until well into July. Even then, we had far too many problemswith the equipeent (some of which are illustrated in the 21 July case stu-
dy) to consider the data collection successful. We did, however, achieveone of our primary objectives which was to learn what would be needed in
order to successfully collect data in 1984!
01
10.

IL
Af
Ila-qv. i a
Fig.2-2 Vie ofPROE sttio fro sie nt shwn n fiure2-1
Technician is working o antnn .Noiewnsnormt
is( self-uyed

B. The 1983 Network
There were three main reasons for locating the 1983 network of automa-tic weather stations in the vicinity of Hanscom Field. First, it wouldhave been difficult to locate sites for the stations in the densely popu-lated areas closer to the radar and Logan International Airport. Second,our research aircraft (from the University of North Dakota) was based atthe Lincoln Laboratory Flight Facility on Hanscom Field and, due to airtraffic considerations, flew experiments mainly between Gardner, HA,Hanscom, MA, and Manchester, NH. Third, the frequency of thunderstorms isgreater inland than near the coast so the chances for measuring low alti-tude wind shear should be somewhat better.
Once the general area was decided upon, care had to be taken inchoosing the Individual sites. In order for an area to qualify as an
acceptable site, a number of characteristics had to be considered. Theweather station was placed in 4 to 5 acre open fields (pasture or crop)when possible. This size insured adequate exposure to wind and precipita-tion and reduced the influence of nearby buildings and trees on themeasurements. Orography was another consideration in site selection.Valleys, hillsides and nearby lakes and swamps could produce microscaleeffects on the local weather, causing stations to report data that wouldnot be representative of the mesoscale environment. We tried to findfields that had lim-4-1 access to the public in order to guard against van-dalism, but that : Zhe nearby roads necessary foL work crews to erect andmaintain the stations.
The network finally selected for the Hanscom Field area is depicted inFig. 2-3. Although there is a fair amount of unusable wooded and parkland, with the help of many kind and generous landowners we were able tosituate the stations in a fairly regularly spaced grid.
The station spacing was determined by the size and scale of the low -altitude wind shear that we were hoping to measure. The horizontal scaleof a microburst is initially less than 4 km across. Thus, we tried to sitethe stations approximately 3 km apart, with a maximum allowable distanceof 5 km. It is sometimes difficult to justify siting the stations thisclose together for if they were farther apart the total network could covera much larger area and the probability of measuring a low altitude windshear event would be greater. However, with that approach the low resolu-tion data collected would not reveal important features of the wind blrand would therefore be of doubtful value.
Note that there is an unusually dense network of stations aroundHanscom Field. The research aircraft that we operated was able to measurewind speed and direction along its flight path. We placed weather sta-tions at both ends of the long runway so that when the plane came in for alow approach over the airport, we would have wind measurements both at thesurface and aloft.
13
_I

., . . . t , : . - - .. , .. .'L . , * '
* ~4V
• .- I , , "" ' - -- , . - -. .T ,I, %
.*',' ' , ' 'U .,' . -" A .-,. i " i , f, " ' ,f-- ° o "~ •- ~ ..
" ; ." • J • '. D .' - . . . - :,
", . -" -/ ". -1. -r \, . 'A -' € 7 " ' ..- '
_ .I •" -% . i "i '. /i . . . " ,
..- _ - .; / : . . . . - - " .r. .. ... -' ..
4' .*-,1.'. .. , . , ., . U , , - . . . , • f
M -4
* .. .. . ; - I. '..' .' ' "
... -4
. , '....- -.. _ " :
i-v1
• / .,. ,. " - . ., (. , ,--,.A ~2~ . v 1.'
r " , - , 'C - - " " , r , " ; " . .X, ,
," ' U . .r . 7 - ' "*. --"" 1 "
"11 • .A -i * ' 4 • •,
: " ' - ,, " ",. ,it '. ". 'l' / ., -, , ,/ I2 .-. ,i ". . .* . -, . . . .,C.
: ; , .. " - AL ., " . .j . I. " o
0 . -. ' *- . * , . -" . " . o
" A '
' " """ " - " "" "" # l ' i. , :€14""

C. Weather Station Instrumentation
Tne PROBE weather stations, designed by the Bureau of Reclamation areequipped to measure temperature, relative humidity, pressure, wind speed,
wind direction, and precipitation amounts. The sensors were purchased fromvarious manufacturers and, with the exception of the barometer, were usedwithout modification. The standard station is equipped with the following
sensors:
Wind Speed and Direction Meteorological Research, Inc. (MRI)model with sine-cosine output
Speed; Range: 0.2 to 54. m/sResolution: 0.05 m/s
Direction: Range: 0 to 360 degreesAccuracy: 2.5 degreesResolution: 0.4 degrees
Temperature and Humidity Weathertronics model 5121-99
Temperature: Range: -30 to +50 degrees CAccuracy; 0.2 degrees C
r Resolution: 0.1 degree C
Humidity: Range: 0 to 100 percentAccuracy: 3 percent
r Resolution: 2 percent
Pressure Weathertronics model 7115modified for temperature regulation
Range: 200 millibarsResolution: 0.1 millibar
Precipitation Belfort Instrument Co. model 5915R(weighing gauge)
Range: 0 to 300 millimetersResolution: 0.3 mm
Each sensor is described briefly in the following sections. The completeMechanical and electrical specifications for the sensors are available inthe individual owner's manuals and have not been reproduced in this report.
15
.0

1. Wind Speed ane Direction Sensors
The PROBE stations are equipped with the MRI model 1022 wind speed and
direction sensors. The instrument set consists of a cup and vane sensor
arrangement using a common cross arm for mounting. The cross arm is
attached to the top of the mast with a "T" mounting bracket equipped with
set screws. The cross arm height on the PROBE station is 6.8 meters above
ground level. (See Fig. 2-2.)
The sensor housing consists of a long tapered upper column, an inner
cap keyed lower section and a mounting insert all made of die-cast alumi-
num. The sensor housings are held in place on the cross arm with hex-key
set screws. The anemometer cups and the direction vane are also held with
hex-key set screws.
Wind speed is derived from a photo chopper disk assembly attached to
the lower end of the anemometer shaft. As the cups turn, the chopper disk
breaks the light beam from a light mitting diode exactly 100 times per
revolution. The output signal is a sine wave that has the came frequency
as these light pulses. This frequency is directly proportional to the wind
speed.
The wind direction transducer is a sine/coslne potentiometer which
provides the vector components of the wind directi ector (cosine signal
provides a voltage proportional to the east-west coiponent and the sine
signal, the north-south component). The sine/cosine potentiometer elim-
inates the ambiguity that can arise from averaging the wind direction over
time with a straight 0-360 degree potentiometer. For example, if the wind
were coming from 358 degrees half the time and from 2 degrees half the
time, a 0-360 pot average would indicate a direction of 180 degrees,
exactly opposite the actual average wind direction.
2. Temperature and Humidity Probe
The temperature and relative humidity probe is packaged by
Weathertronics, and contains the Vaisala Humicap relative humidity sensor
and the Yellow Springs Instrument (YSI) temperature sensor.
The Humicap sensing element is a thin film capacitive sensor. A very
thin (I micron) dielectric polymer layer absorbs water molecules that
readily pass thr,.ugh a thin metal electrode causing a change in capacitance
as a function of relative humidity. This function is essentially linear
and independent of temperature. A solid state electronlc circuit located
in the probe body provides the voltage output directly proportional to per-
cent relative humidity, over the range from 0 to 100 percent.
The temperature sensor is a YSI two element precision thermistor.
Circuitry is provided in the probe for an output voltage inversely propor-
tional to temperature. Tempe-ature measurements are accurate over the
range from -30 to +50 degrees C.
1E0 . . . . . • . . . • . . • . . . .• . - . . - . . _ - . . - - - . " . , . , .

S!
The temperature and relative humidity probe is situated on one cornerof the PROBE station inside a vane aspirator (Fig. 2-1, left corner). Thevane aspirator shields the probe from direct sunlight. It is painted whiteto reflect the sun and keep the air inside from heating up, and has a finto keep. t e open end of the tube pointed into the wind. This insures agood airflow over the sensors at all times (particularly important for thet hermistor).
3. Pressure Transducer
The pressure sensors used in the PROBE stations are a modified versionof the Weathertronics 7115 strain gage bridge pressure transducer. Thestrain gage bridge has a good linear response with pressure and wears verywell because it has no moving parts. Its one main drawback is the strongdependence of output on temperature.
The electronics company that developed the data collection package forthe Bureau of Reclamation chose to keep the barometer at a constant tem-perature of 95*F as a method of temperature compensation. This wasaccomplished by inatalling a heater next to the strain gage, wrapping thepackage in insulating foam, putting that package inside a thermos bottleand placing the thermos inside a large styrofoam cylinder. A thermistatwas put in line with the heater so that the temperature would not riseabove 95°F. One of the problems with this system is the excess power itneeds to keep the barometers warm. However, once the sensor has reached aconstant temperature, the power used to keep it warm is minimal.
The barometer is located inside the lai~e white armored box hanging onone side of the station triangle (see Figs. k-l and 2-2). This box effec-tively shields the barometer from the wind, which is a source of dynamicpressure fluctuations.
4. Precipitation Gauge
The precipitation gauges that were chosen for use with the weather sta-tions are the "weighing bucket" type. These do not have the high resolu-tion of, for example, the "tipping bucket" variety but they can measurerainfall accurately :o within one-tenth of a millimeter. The gauge issimply a calibrated weighing scale an which a bucket sits. Whatever fallsinto the bucket will get weighed as if it were rain. For that reason andalso because of evaporation, precipitation amount differences are used todetermine rainfall within a given period of time.
Most of the stations in our summer 1983 network were deployed withoutrain gauges because the equipment was not available in time.
17

D. Data Collection Platforms
The data from the meteorological sensors consists of analog voltagesignals or, in the case of wind speed, of frequency outputs which need to
be averaged and stored fir transmission. The Bureau of Reclamation had a
electronic sensor interface built to perform this task. The sensor inter-
face is connected to the Data Collection Platform which reads the data andformats It for transmission at user-specified intervals.
The electronic sensor interface is of modular design with a "mother"
board and seven individual "daughter" boards, one for each sensor. Thedaughter boards provide the signal conditioning and digital averaging forto specified period. All daughter boards are connected to the motherboardwhich provides the operating and regulating voltages for the sensors and
signal conditioners.
The Data Collection Platform (DCP) is a microprocessor based environ-mental data collection system. The user specifies which measurements are
to be made and the time intervals between data collection cycles. The dataare collected from the mother board, reformatted according to the requiredtransmission protocol, and transmitted to one of the geostationary satelli-
tes (we used the GOES-EAST). The transmissions occur at regularly spacedintervals agreed upon by the satellite's controlling agency (NOAA).
There are two limitations on the everaging pcriod selectable with theDCP. First, the design of this equipment forces 22 seconds of dead timeout of every averaging period to allow the DCP to read the data from memory
on the motherboard. This interruption in data sampling is acceptable withthe five minute averaging period for which the equipment was originallydesigned, but with a one minute averaging period the system would becollecting data just over half the time.
The second limitation on the averaging period is that the DCP must be
programmed with interger-minute averaging periods while the averagingperiod on the motherboard is a -multiple (by a power of 2) of the basic fiveminute averaging period. There is no suitable match between the mother-
board and the DCP for averaging periods less than two minutes. We chose a3 minute averaging period on the DCP and a 2.5 minute period on the mother-board for our implementation. Taking into consideration the 22 seconds ofdead time, we had only an 8 second discrepancy with this arrangement.
The Data Collection Platform used was the Handar Model 500. The DCP
is housed in a cylindrical environentally sealed can. Electrical connec-tions are made by multipin connectors on the outside of the can. The DCPis programmable with the use of a special programming set which itself is
microprocessor based. The user can program the number of data channels,the data scan times, the date transmission times, and the mode of data
collection.
18 "
• " " . .. . . .- - -. i . . . ** " " . -* . - . . - . . . - - -

E. Site Hardware
The site hardware consists of the tower and tripod, the electronicsenclosure and armored shielding, the solar panels and battery, and a
lightning kit. Each part is described briefly in the following sections.
1. Tower
The Lower consists of the Synergetics Model I tripod with a crossarm
for wind sensor mounting at the top of the mast. The tower is a self-guyed, free standing structurc capable of withbtanding 50 m/s winds andlimiting the mast whip to less than + 5 cm. The mast tips down to alloweasy access to the wind sensors and lightning rod. The structure easilysupports up to 200 kg and has adjustable legs to provide leveling on uneventerrain. The large foot pads reduce the footprint loading of the tower
icself to less than 75 g/cm 2 . The station is shown in Figs. 2-1 and 2-2.
2. Electronics Enclosure
The station has an environmental enclosure meeting Type 12 specifica-
tions. The DCP and the sensor interface electronics are mounted within the
NF24A enclosure.
The NEMA enclosure is itself surrounded by nearly 3/8 inches of steelplate. This armor is configured in two half-boxes which become part of themounting bracket for the environmental enclosure. This white armor boxcompletely surrounds the environmental enclosure (See Figs. 2-1 and 2-2.)
3. Solar Panels
'he solar panels are mounted on the south side ot the tripod and areset at a favorable angle for receiving the sun's rays. Two ARCO model16-1200 panels are used per station. These panels each contain 36 three-inch single-crystal silicon cells eticlosed in a fully weather proofassembly with a rigid, self-supporting frame. The power output is anaverage of 1.2 amperes at 16.2 volts DC. With two panels in parallel the
peak power provided is nearly 40 watts.
The battery used is a Delco model 1150 heavy duty maintenance freebattery designed for cycling applications. The battery provides 105 amp-hour capacity which could power a typical statio, for at least two weeks
without charging. The battery is trickle--charged continously by the output
Ufrom the solar panels.
4. Lightning Protection
The lightning protection kit consists of an aluminum rod, ground wire,ground rod, cable clamps and mounting hardware. The lightning rod can beseen in Figs. 2-1 and 2-2 between the anemometer and wind vane at the topof the wind sensor mast.
S .-.

III. CASE STUDY: 21 JULY 1983
A. Introduction
Our intent when we initially set up our network of weather stationswas to provide each landowner with a record of the data collected by the
3Lation on their property. However, analysis showed that a substantial
fraction of the total data set was flawed by electronics malfunctions,
recorder failures, etc. Thus, tabulation and publication of the full meso-
net results would not be appropriate.
We have decided instead to illustrate some of these problems and the
utility of the mesonet data by presenting the data collected during a 48hour period, beginning on 21 July 1983, in which severe thunderstorms broke
out in oui area. Along with the mesonet data, we present surface synopticdata, satellite data, and radar data. This additional data is meant toserve both as an aid in understanding the general weather situation and asan example of the different types of data that are readily available fordetecting and predictiug potentially hazardous weather.
We have omitted the radar Doppler velocity and spectrum width fieldsfor this caae because their interpretation is not simple and a suitable
explanation is beyond the scope of this work. However, Doppler radar datais available for the 21 July case and others as well. The data collected
during the summer of 1983 is summarized in Akpendix A. All of this data isavailable to anyone interested, and the procedure for requesting it isdetailed in Appendix B.
B. Summary of Weather Situation
Upper level charts at 1200 GMT (8:00 AM (EDT)) on July 21, 1983
revealed an intensifying trough of low pressure approaching New Englandfrom the northwest. Strong cyclonic vorticity advection was evident in
advance of this trough. This, combined with warm advection ahead of anapproaching cold front at the surface and moisture which was available at
low- and raid-levels in the atmosphere, set the stage for strong thunder-storm development by late in the afternoon in most of Mew England.
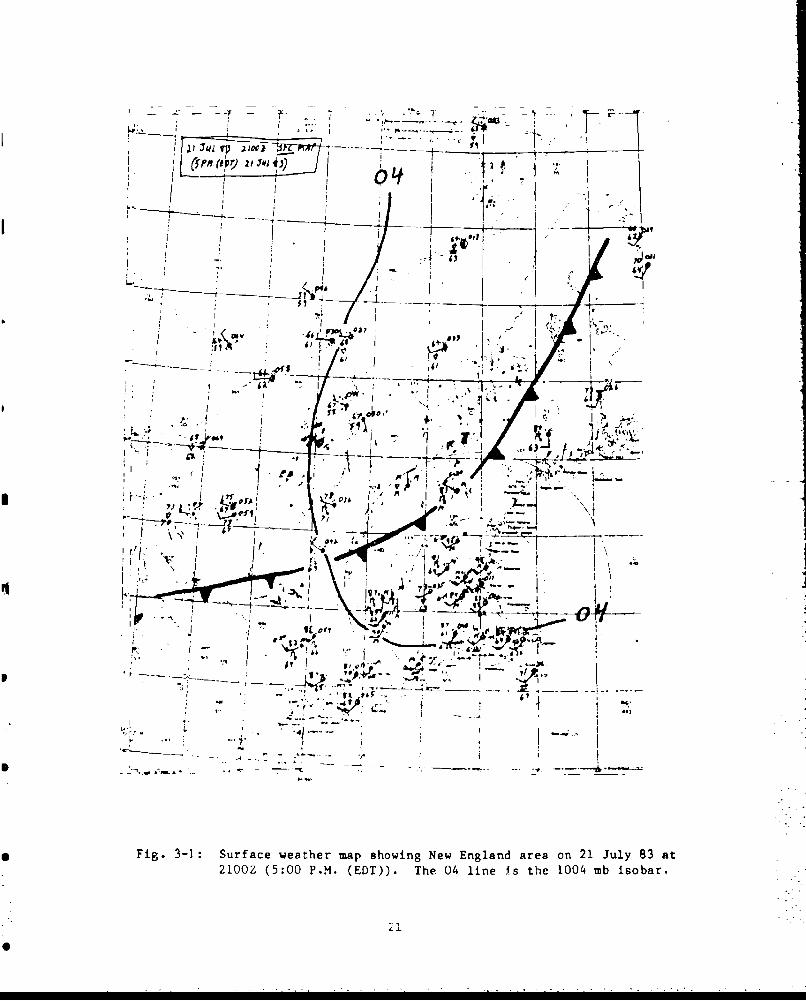
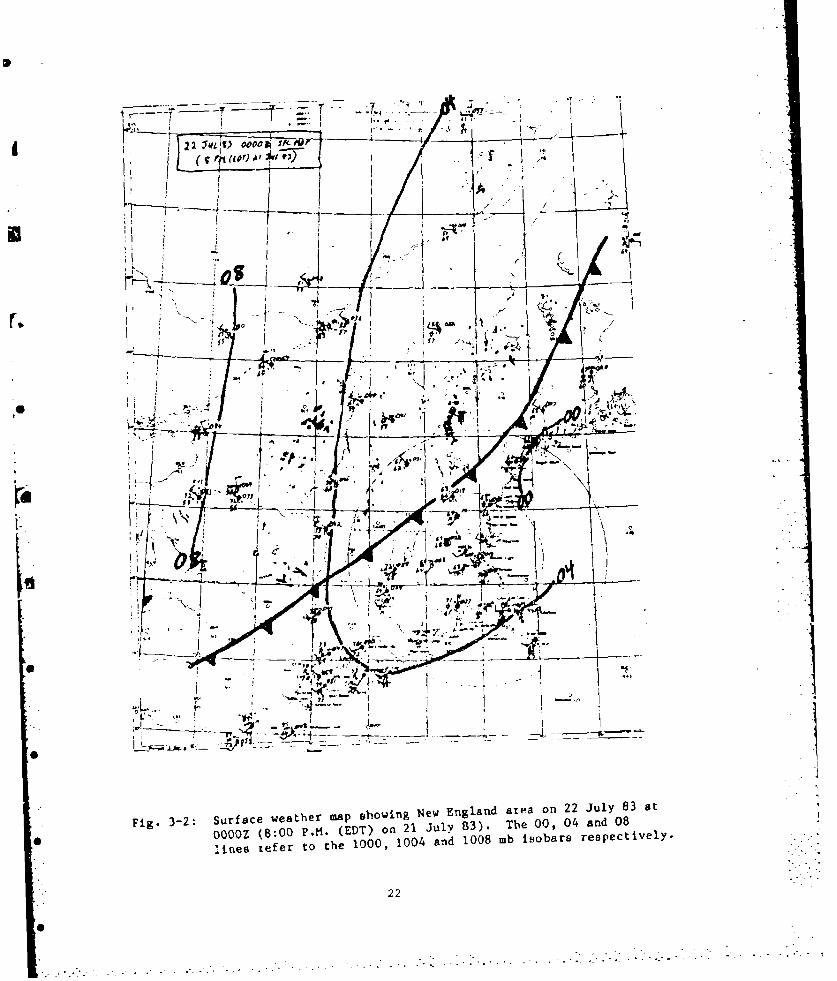
The cold front came through southern and eastern New England duringthe evening hours of the 21st. Figures 3-1, 3-2 and 3-3 show theprogression of this cold front as it swept southeastward through our area.Figure 3-4 gives an explanation of the station model which appears at eachobservation point on the surface weather maps in the three previousfigures. After the front's passage, a strong surface low developed off-
shore on the following day (July 22, 1983). The circulation from this
system was quitt In evidence af shown in Figure 3-5. This storm was
20
I - : - - - -T --
" ', -'. T
": -
-" , ---- "
. , .~
- ,,.----.-- .-- ,.
'a.
_47~
, I
)"LfJ , , f • I
I
I I , 1
,
I.
. t-''
--- f . / -",-
----r-- ,.- ...
/ , 9
--
":
/I ;
; I : b
r
S
I .
..
.,i, ,
•I
• -
I'
0
'1
O "
r " "
"
-"
'
. ...
• "i.
.- --- -. A.
,- ,..-
I. ;' :
-,
,
I ., ,
- !,
r. .
II
-JV-.i
I .-
vI)4,
- --- ,-- - . . _I
Ik
",
- "
.J ;
i4' "d
I" '
" *'
'
.. _."
- . ...
.. ..
• -i -,o"I
y,
0-7 ' J
j
'Am
. . . ..
. • . . . .
It. 0!
Fig. "-: SraewahrmpsoigNe4nln rao 1Jl 3a
210.Z (50 .. (D). Te0 iei h 04m sbr
:.~--
!r-.. - +------ -- T - t.7 " " - - "
__*
°.
I II I *..
-
l. - 'I ' " I :
4 'Am' , , f - , , i " ] " " ' -
' . . -.' I '
I,- , - -
i~ * ' ... "i -
* ...
Ii', , " " " " .1
-.
4
4 --- - - - " - -
0..0
Fig. 3-2: Surface weather map showing New England area on 22 July 83 at
0 O000Z (8:00 P.M. (EDT) on 21 July 83). The 00, 04 and 08lines 0 efer to the 1000, 1004 and 1008 mb isobars respectively.
22
~~~~~~~.. -.. -.. . .. ..... .. .-. . .. ... .. .... .. . .. .. .. ..... ...... . .. . ........ ... . ..... ... : .. . I .- - i i .. ... . ,

-4-----
I ~~ A
- !4
-. N
I I I
Fig. ~ 3-3 Sufc ete a hwn e nln rao 2Jl 3a
03O (1:0PM ETNn2 uy8) h 0 4ad0 ie
refer ~ ~ ~ ~ ~ ~ ~ ~ J& tote10,10.ad10.bioar epciey

Abridged U S Model/
fi
dd
Fig. 3-4: Station model shewing symbolic form of synoptic weather
code. Represented codes are: 1) N-Sky Condition; 2) dd-Wind Direction; 3) ff-Wind Speed (kts); 4) TT-Temperature
(*F); 5) ww-Present Weather Condition; 6) TxTx-Dew Point
Temperature (*F); 7) PPP-Pressure (coded).
24
6-

1E312.~J83 1~-2 01123 177211 D85
Fig. 3-5: Visible satellite image showing eastern half of U.S. for22 July 83 at 12:30 P.,,. (EDT).
25
responsible for bringing scattered rain and rain showers to the Hanscom
area early in the day which was then followed by mostly cloudy conditions Swith very strong northerly winds and temperatures that were unseasonablycool for that time of year,
C. Satellite Data
The GOES (Geostationary Operational Environmental Satellite) imagery Sshows the view of the Earth and its accompanying cloud cover from adistance of more than i9,OOD nautical miles above the earth's surface.With the assistance of the Air Force Geophysical Laboratory's (AFGL's)Satellite Meteorology Branch, we were able to acquire the GOES imagery,with a resolution of 2 km, for the time period involving the outbreak ofconvection which occurred over the Northeastern U.S. on July 21, 1983.
A sequence of visible satellite images encompassing the time intervalbetween 11:00 a.m. and 4:30 p.m. (EDT) on July 21 are ahown in Figures 3-6
through 3-17 respectively. At 11:00 a.m., Figure 3-6 shows most of New
England cloud free with the exception of northern and eastern Maine andnortheastern Vermont. Temperatures continued to climb in the cloud free
areas. The convective activity at this time appeared well to the north ofLake Ontario and also in south-central Quebec Province. Also, a convectivearea showed up well, over the waters to the south of Cape Cod. This areaof convection in the Atlantic posed no threat to New England. By 11:30
a.m. some of the clouds began to dissipate over Maine, and the convectionto the north of Lake Ontario moved southeastward. By noon (Fig. 3-8), the "
satellite imagery showed the early development of clouds over the hills ofVermont, New York dnd western Massachusetts. One hour later (Fig. 3-10),the convective clouds from Canada began to spread into up-state New York
and northern Vermont. By 1:30, convective clouds developed throughout much
of New York state and the northern half of Vermont. This area of convec-tion developed into strong thunderstorm cells and moved southeastward,affecting western Massachusetts by mid-afternoon (approximately 3:30 p.m.(Fig. 3-15)). By late afternoon (Fig. 3-17), these thunderstormsapproached southern Ngew England. At this time (4:30 p.m.), the surface
cold front was in a position stretching northeast to southwest throughcentral New England.
D. Mesonet Data
The mesonet data for the thirteen stations transmitting on July 21 and22 have been plotted and are presented in Figures 3-19 through 3-31. Asdiscussed in Chapter 11, the data were avetaged for 2.5 minutes out of
every 3, giving 20 data points per hour. Figure 3-18 is a map showing the Srelative locations of the mesonet stations and their 3-letter identifiers.The other stations in the network that are not included were either not yetset up to transmit data or their transmissions were faulty and neverreceived by the satellite.
26
- . . . . . - . - . - . .. . . . i - i . • --. . . .

Il
Fig. 3-6: VISIBLE SATELLITE NACE -21 JULY 83. 11:00 A.M. (1500 G471)
Fig. 3-7: VISIBLE SATELLITE 14AGE 21 JULY 93, 11;3U A.M. (1530 C T)
Fig. 3-8: VISIBLC SATFULL1IF I'IACE -21 JULY 83, 12 N4oo (11,00 GK:
27

Fig. 3-9: VIS13LE SATELLITE 14AGE -21 JULY 83. 12:30 P.M1. (1630 G-41)
Fig. 3-10: VISIBLE ShTELLITE IM~AGE -21 JULY 83, l-.00 P.M1. (1700 GI{1)
A. 11Fig. 3-11: V I S 1BLF S ATU LIT E I -A E 2 21 JU:L Y 8 3, 1:3 0 P..m. (17 30 CKT
28

Fig. 3-12: VISIBLE SATELLITE IMAGE 21U JULY 83, 2-00 P.M. '(1800 C4T)
Fig. 3-13: VISIBL . SATELLITE IMAGE - 21 JULY 83, 2:30 P.M. (1830 CKT)
Fig. 3-14: VISIBLE SATELLITE IMAGE 21 Itl- P 3, 3:90 P.M. (190'o C.7)
29

II
Fig. 3-16: VISIBLE SATELLITE IMAGE -21 JULY 83, 3:0 P.M. (930 GMfT)
aA
Fig. 3-1: VISIBLE SATELLITE IMAGE- 21 TLY 83. 4.0 P.M. (2033 GilT)
30D

1. Explanation of Figures
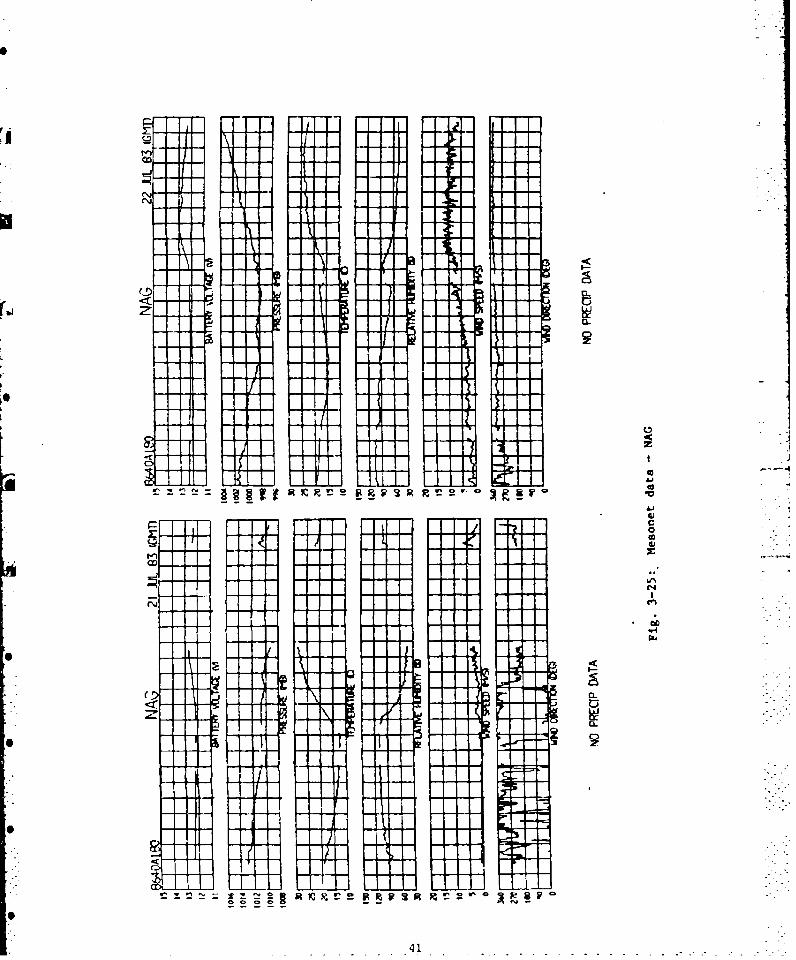
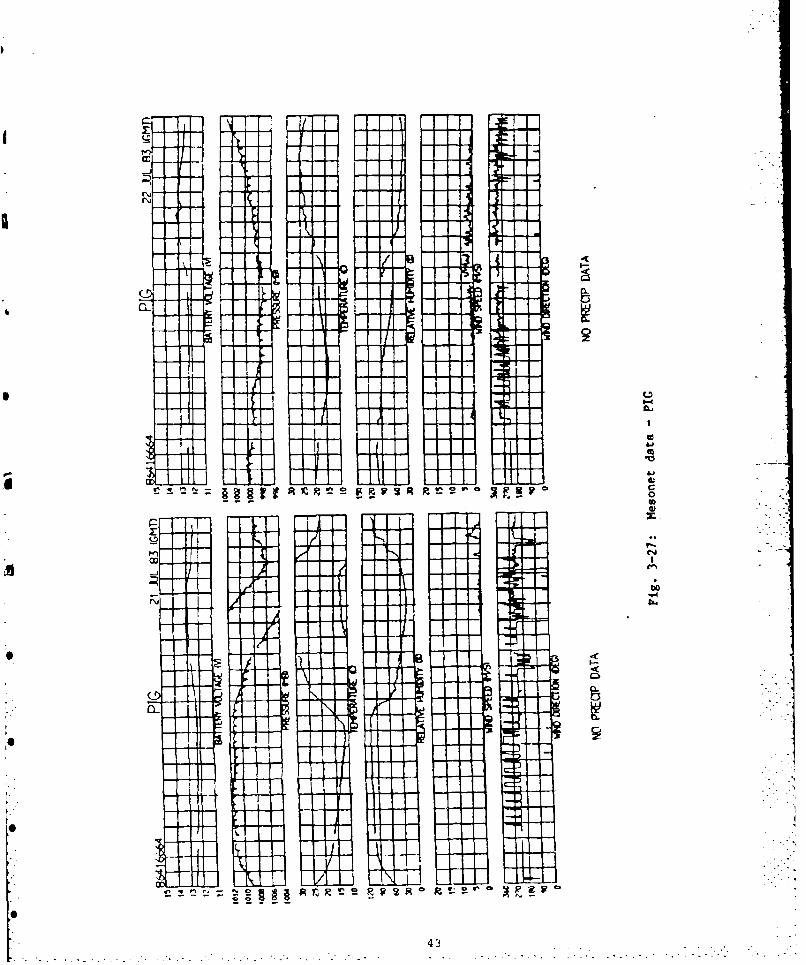
Each figure coneists of two plots, one for each day. The time isGreenwich Mean Time (subtract 4 hours for EDT). Each grid space in thehorizontal direction represents one hour. The vertical units are labelleddifferently for each variable. The name of the variable and the units that
apply to the label are printed under the individual graphs. Since there isnot always enough space to plot the full range of a particular variable, wehave used a "wrap around" scale. Thus, when the trace goes off the bottomof the scale it reappears at the top. The scale from then on should beinterpreted so that the top most line is equal to the lowest labelled line,and the lower lines are still lower by increments equal to those originallyset. In figure 3-19 the pressure on 21 July wraps around at 1008 millibarsand falls to just below 1002 millibars between 2000 and 2100 hours. Thecurve can also wrap around by going off the top of the scale as it doeswith the temperature in that same figure. Notice that the temperature atAFC on 21 July peaked at about 33 degrees C.
The top of each graph is labelled with the three letter identifier forthat station. The date is printed at the right and the satellite transmissionidentification code is printed at the left. The variables presented arebattery volLage, pressure in millibars, temperature in degrees Celsius,relative humidity in percent, wind speed in metetrs per second and winddirectiok in degrees with north at 0 and east at 90 degrees.
2. Features of the Data
There are four main features of this 48 hour period to look for in themesonet data:
FEATURE EDT GMT
1. Wind shift from south to west-southwest 7-9 am 11-13, 21 July
2. Thunderstorm moved thi-ough network 6-7 pm 22-23, 21 July
3. Cold front passed through network 10 pm-uid. 2-4, 22 July
4. Low developed and deepened off coast 8 am-noon 12-14, 22 July
The first feature is manifested simply by a shift in the wind directionfrom 180 to about 250 degrees. The thunderstorm moving through a networkis evidenced by the sharp rise and gradual fall in pressure, and a peak inthe wind speed trace. The cold frontal passage is indicated by a continuedfall followed by a levelling out in the pressure field and a shift in winddirection from 270 to 315 degrees. Instead of immediately beginning torise again as the pressure will often do after the passage of a cold front,it continued to gradually uecrease under the influence of the surface low
31

pressure area off-shore. This low is also indicated by the strong increasein wind speed, the shift in wind direction from 315 to 355 degrees, theincrease in relative humidity and a drop in the already unseasonably cooltemperatures.
3. Discussion of Individual Station Data
AFC - Figure 3-19 - This station was probably the most reliable source ofdata and still, three transmissions were missed on 21 July. The 30minutes of data preceeding the thunderstorm passage are missing butthe decline in pressure and wind spced are visible. Notice that thewinds were a steady 10-12 m/s (25 mph) from 11 am to 4 pm on the 22ndwhen the winds were from due north.
LAW - Figure 3-20 - This station has perhaps the clearest signatures of allfour significant weather features, even though the anemometer wasreading only about half of what it should have been. Notice thesharp spike in the pressure and wind speed associated with the thun-derstorm passage. Also notice that after the cold frontal passagethe pressure actually did begin to rise but began to fall rapidly
thereafter under the influence of the coastal low.
CON - Figure 3-21 - This station had so many problems it is difficult totell how much, If any, of the data is valid. However, features 2 - 4do appear to be present. The spurious apikes in the pressure and
wind direction fields occur exactly at the time of transmission butare otherwise unexplained. This anemometer, like that at LAW, isalso reading too low, but when it does read above 2 m/s the winddirection appears to return to normal. The spikes in the temperaturefield are due to the erroneous addition or subtraction of 256 digitalcounts to the data average, but this also occurs only at transmissiontimes and only when the temperature is above about 25 degrees C.
DUD - Figure 3-22 - This station exhibited many of the same problems as CONdid. While a total of only three transmissions are missing, two ofthem occurred during the interesting part of the data. Ther.i samethree transmissions are missing in quite a few of the stations'reports (2200 GMT on 21 July and 330, 1300 GMT on 22 July).
VER - Figure 3-23 - This station's data was also fairly reliable for mostof the summer. In this figure as well, two significant datatransmissions are missing. Notice how the battery voltage risesduring the peak sunlight hours when the solar panel output is thegreatest.
NUB - Figure 3-24 - This station had quite a few missed transmissions and abad w!id speed sensor, but otherwise the data was fairly good. Asusual, Lhe data lost was for the most meteorologically interesti gt ime s.
32
" ' _ '

S
NAG - Figure 3-25 - A large amount of data was lost due to a faultytransmitter on 21 July from about noon to 6 pm EDT. Notice, however,that the thunderstorm signature was just visible and the featuresoccurring on July 22 were recorded.
JWL - Figure 3-26 - This station, like NAG, also lost data during theevening hours of the 21st. The scalloped pressure trace is stillunexplained, except to notice that the dips occur at the transmittimes. This szation perhaps best captured the sudden 9 am (13 GMT,22 July) drop in temperature and increase in relative humidity whenthe wind shifted around to the north as the low pressure area movedoff-shore.
PIG - Figure 3-27 - This station exhJbited many of the same problems men-tioned for the other stations. The anemometer was reading far toolow, and was perhaps being mechanically prevented from turningfreely. The wind direction data for this station also looks verysuspicious.
VAL - Figure 3-28 - The most obvious problem with this station was the 0
barometric pressure which varied wildly between extreme limits. Noneof the pressure data are meaningful. Quite a few transmissions weremissed, some of them at significant times. The temperature and rela-tive humidity data do appear to have spurious spikes and largevariations that are probably unreal.
GGG - Figure 3-29 - Although this station transm!.tted data fairly reliably,it did exhibit many of the same problems that the other stations did.
FSK - Figure 3-30 - This station had a faulty transmitter which managed towork about 2 or 3 times each day. The data that did get reported arebapically meaningless.
AWD - Figure 3-31 - No data at all were transmitted on the 21st of July forthis station. On the 22nd some data of questionable value wastransmitted.
3
33 S

"F SK'HEM
'GGG
"AG "VAL "CLK "P'G
'DUD
CON flSX 'LAU
• 'REF JUL NUB
"LFF L
'KEN 'AFC "KAT
' "ARF
"UER p j,
DRP
Fig. 3-18: Map of weather stations showing relative locations and 3-letter
P identifying names. Refer to Fig. 2-3 for geographical loca-
tion.
34
S

I it 211 1 1 1
Ps -rT6
a-j
z 14F0
co__
U-,
hiS
W' W 1N W91
-A II
-JA
f V4
00
*P R
360
-- A-
I Li
I L)
co0
A E
37,

I T
II
I.4
-1 0
CURE
38w

F- -A
-IL

-TJ
CL
~~no
400
I Srlc
I 1
Fc.,J
441

-- c
I rI
1:0
424
el
4NjW-
TITU
~~~Z4 -LN lnn
a:AT

4
444

D
V 9
~' L tiL 45

(4-1
I -0
U-46

r'.j
II
a-w

E. Doppler Radar Data
Doppler weather radar data was collected during the day and earlyevening on 21 July 1983 with the MIT radar. The storm situation shown inFig. 3-32 occurred at (a.) 6:51 pm EDT and (b.) 7:00 pm, approximately 20and 30 minutes, respectively, after the passage of the thunderstorm("feature 2" in the mesonet data, discussed in section D). The timedisplayed in the figure is Eastern Standard Time, five hours behindGreenwich Ma Time.
There is a cursor or marker in the lower part of each figure betweenthe first and second range rings. The location in both spherical andCartesian coordinates of the cursor, relative to the radar, is given in thelower right corner of the figure3. "X" refers to kilometers east, "Y" kmnorth, "Z km up, "R" km range, "A" degrees azimuth, and "E" elevationangle, also in degrees, of the cursor at its displayed location. Noticehow the stnrm cell near the cursor moved in the 9 minutes between snapshots(the cursor is in the same position in both Figs. 3-32 (a.) and (b.); theheight is different because the data from slightly different elevationangles are presented). The storm motion was primarily from west to eastwith a small component of motion from south to north.
The bright areas of high reflectivity represent the heavy rainfallareas. The storm that Is between Hanscom Field and the MIT radar (sitesidentified in Fig. 3-32 (c') is basically the same cell that came throughthe weather station network half an hour earlier.
SF. Damage Reports*
In Massachusetts the areas strongest hit by the thunderstorms on .July 21, 1983 were the communities which bordered New Hampshire. However,the rest of Massachusetts was not exempt from the effects of this severeweather. Reports first came in from communities in the western part of thestate at about 4:45 (EDT). Some of these western Massachusetts counties(S. Anherst, Hadley, Spencer and East Brookfield) reported funnel cloudsightings. There were also reports of several large trees being snappedoff and others that were twisted out of the ground.
Prompted by the reports of funnel clouds in these counties, a tornadowarning was issued in Worcester county, but there were no confirmed reportsof any tcrnadoes. Now, further to the east during the late afternoon andearly evening hours, wind gusts were estimated to have reached 70-80 MPH inthe Dracut, Methuen, Leominster and Haverhill communities. These windsblew down many trees and trec limbs which caused injuries to several per-sins. Automobile windshields which were smashed by the falling tree limbswtre reported in Lea. nster and Dracut. Power was knocked out in the area,including all of Yaverhfl], and the roof was blown off a country club inMethuen. In Salisbury, between 6:00 and 6:30 EDT, thunderstorm winds whichgusted up to an estimated 70-80 MPH ripped through the campground at thestare reservation over-turning two trailers and leveling about 30 tents.Six persons were injured by flying debris.
*Damage reports were taken out of the July 1983 issue of "Storm Data" which
is published by the National Oceanic and Atmospheric Administration and iscompiled from information received at the National Climatic Data Center.
48
- -.. . -- .-.•." - . .- .-- •
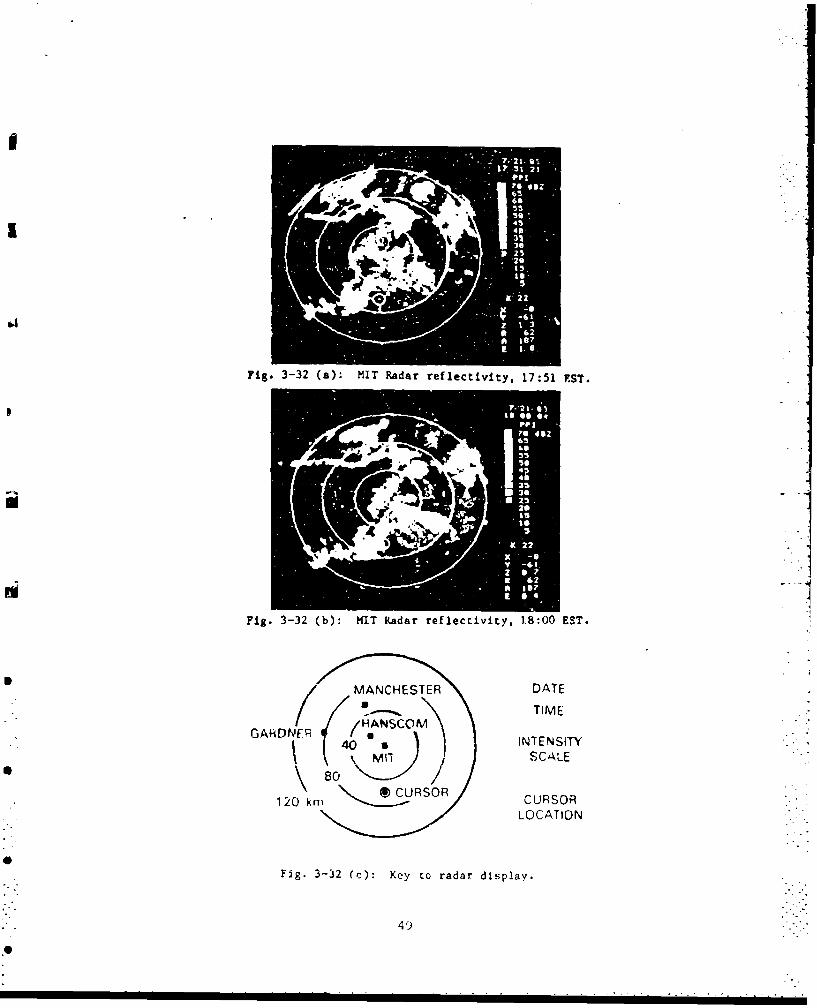
Fig. 3-32 (a): MIT Radar reflectivity, 17:51 PST.
TIM
\ I SCALE
LOATO
08
Fig. 3-32 (c): Key to radar display.
49

IV. CONCLUSIONS
A. Upgrading Mesonet Equipment
The primary objectives of operating a mesonet of automatic weatherstations as part of a Doppler radar data collection experiment are: I) to . *.provide confirmation of low altitude wind shear events detected in the
Doppler data and 2) to provide an indication of otherwise undetected wind
shear eventsi In order to achieve these objectives, measurements must be
made that are consistent with the spatial and temporal scales of micro-
bursts, the smallest and shortest lived of the known hazardous wind ohears.These objectives also obviously require that the equipment be operationalat least 95% of the time. Unfortunately, meeting these objectives will
require a rather costly upgrade of the mesonet equipment.
1. Temporal Resolution
The importance of fine temporal resoltuion in measuring microbursts
is illustrated in Fig. 4-1, which depicts the wind speed trace of a micro-
burst that occurred at Stapleton International Airport during the JointAirport Weather Studies (JAWS) experiment in May of 1982. Both the actual
one minute averaged data collected by their Station 4 and simulated three
minute averaged data, similar to that we collected during our experiment,are shown. By lengthening the averaging period, the maximum winds detectedwere reduced by 20% in the most favorable case (when they fell exactly in
the middle of the 3 minute period). Also, fluctuations in the wind speedhave been completely erased, and the transition from low to high winds
appears smooth and steady rather than impulsive. Thus, one minute averages
are the moat "coarse" surface wind measurements that are acceptable. Asdiscussed in Chapter II, our electronic equipment is suitable only for
averaging periods greater than two minutes. We therefore conclude that thisequipment is inadequate for continued use in measuring microbirst wind shear.
2. Operational Reliability
Meeting the-objectives of detecting and confirming wind shear events
will require operationally reliable equipment and, if possible, very littlepost real-time processing. Unfortunately, these are features that thesummer 1983 mesonet system lacked.
Of the 23 stations operating during July and August only 5 were opera-
tional 95% or more of the time. The problems that plagued the other sta-tions ranged from still unexplained intermittancies, to corrosion on themotherboard due to exposure and age, to manufacturer specified modifica-tions that were never made in the Handar Data Collection Platform, to
spikes in the data of stations programmed to transmit at times that wereinteger multiples of the averaging interval. Some of the problems were
fixed but required a technician's attention on a nearly full-time basis.
Fixing other problems would have required hardware modifications.
50

-
cu NA -o_CL 41
LU 1u I
.4 4c,
0' 60
0- 4J
(n -
CC,
- - -F-I -4
- 51

The data relayed by satellite consieted of digital counto for eachsensor plus two higher order bits which determined the additive constant of0, 256, 512, or 768. The sum was scaled and offset, plus multiplied by afraction which compensated for the difference between the actual averaginginto.rval and that set on the motherboard, as part of the conversion toengineering units. While this conversion was fairly straightforward withthe aid of a computer, the user could not instantly see that a problem had
occurred by simply glancing at the transmitted data.
When considering system reliability, the methods of data collection
and archival mst also be examined. During the summer of 1983 we exploredtwo options: 1) dissemination of the data via 1200 baud telephone com-munications with the NOAA-NESDIS Data Collection Service, and 2) receptionof the data on 1600 bpi magnetic tape, collected and recorded by a privatecorporation with their own GOES ground station. The latter proved to benearly 100% reliable and required no Lincoln staff member's attention but
was expensive while the former required our daily attention and provided an
incomplete data set due to NESDIS system crashes and downtime but wasotherwise free of charge.
In conclusion, the poor reliability of the electronic equipment andthe NESDIS data collection system prevented a large part of the desired
data from being obtained.
-
0!
1
522
| .. :i- '

V. RECOMMENDATIONS
A. Equipment Upgrades
The mechanical structure which supports the electronics and sensors isvery well designed and should continue to be used. The sensors themselvesare reliable and should also continue to be used. The Data Collectionflatforms would have to be sent back to the manufacturer to have all of themodifications made to bring them up to date before they could be usedagain. Even if this were done, since these particular DCPs must be usedwith an electronics package, extensive refurbishment or replacement of themotherboards would also have to take place.
We recommend that new Data Collection Platforms be purchased thatwill eliminate the need for a separate motherboard, perform the calcula-tions internally to convert the data to engineering units before trans-mission, allow one minute averages, use an approved binary transmissioncode that will allow us to send three times as such data per transmission,and will report the DCP status with each transmission. We also recommendsoliciting bids from private firms for the job of downlinking and archivingour data.
Although the sensors themselves are still good, we further recomendthat the calibration of the sensors be handled by technicians at LincolnLaboratory. This is the only way that we can assure the quality ofcalibration necessary for our successful data collection.
B. Future Measurements
By June of 1984 we will have assembled a Doppler weather radar testbed _that will be taken first to Olive Branch, Mississippi (just southeast ofMemphis, TN) and then to other sites in approximately 6 month intervals, tozollect data on thunderstorms and severe low altitude wind shear. Thisdata will be of use in learning to automatically detect and warn theaviation community against weather hazards. The refurbished weather sta-tions will accompany the testbed to make similtaneous measurements of thesurface meteorological variables during thunderstorms. They will serve asa principal data source for assessing the low altitude wind shear detectionperformance of the radar.
53
- - - - - - -- - -

REFERENCES
1. Wilson, J. and R. Roberts, 1983: Evaluation of Doppler radar for air-port wind shear detection. Preprints, Twenty-first Conference onRadar Meteorology, Edmonton, Alberta, 616-623.
2. Fujita, T. T., 1983: Analysis of storm-cell hazards to aviation asrelated to terminal Doppler radar siting and update rate. SMRPResearch Paper No. 204, University of Chicago.
3. Fujita, T. T., 1983: Microburst wind shear at New OrleansInternational Airport, Kenner, Louisiana on July 9, 1982. SKRPResearch Paper 199, University of Chicago.
54

APPENDIX A
Summary of Weather Events and Collected Data
During the Summer Storm Project of 1983, data for twelve various stormcases were collected. Table A-1 lists the dates on which the data wascollected as well as the weather situation that affected the local areawithin a 60 km radius of MrT In Cambridge. Meteorological information con-cerning each case was sought. Table A-2 shows the status of the meteorolo-gical data collection. This data set included: 1) Weather Summaries - ashort discussion of the weather situation; 2) Hourly Surface Reports;3) Upper-Level Meteorological Charts; 4) Radiosondes - measurements of
pressur., temperature and humidity in the vertical and 5) Satellite Imagery.Not mentioned in Table A-2 is that radar data (reflectivity, doppler velo-city and spectrum width) was also collected for each case during this pro-ject interval.
55
0 . -

TABLE A-i
ASSOCIATED LOCAL WEATHERDATE SYNOPTIC SITUATION WITHIN 60 KM OF MIT
14 June 83 Hot and humid air-flow Scattered T-storms
15 June 83 Hot and humid air-flow Scattered T-storms
5 July 83 Cold front advancing T-storms (some heavy)from the vest
9 July 83 Cold front advancing Mainly showersfrom the north
18 July 83 Very hot and humid Isolated heavy T-stormair-flow (LLWS verified)II
21 July 83 Strong frontal zone Heavy T-storma (hail reported)approaching from north-west
24 July 83 Surface trough approaching Rain and rain showersfrom the west
1 Aug 83 Warm and very humid air-flow Heavy T-storma (movingfollowing warm frontal eastward to be in areapassage by early evening)
4 Aug 83 a.m. Warm and very moist Intense T-atorm trackedsouthwesterly air-flow eastward passing south of
Boston (hail reported)
p.m. Very warm and humid air-flow Heavy T-storms movedeastward from south-centralMass. passing over Boston
6 Aug 83 Very hot and humid air-flow Scattered convective activityduring mid-late afterroon
12 Aug 83 Wintertime like pattern - Rainy and windylow pressure moves eastward
skirting the southern coast
of Wew England
56
' , l i i " " " " .. . i .. . , ." " ... . . .. . " i " "

0
TABLE A-2
Weather Hourly SFC Upper-Level SatelliteDate Summary Reports Charts Radiosondes Imagery
14 June 83 C C C NC A 0
15 June 83 C NC C C A
5 July 83 C C C C A S
9 July 83 C C C C NA
18 July 83 C NC C C A
21 July 83 C C C C A
24 July 83 C C C C NA
1 Aug 83 C C C C A
4 Aug 83 C C C C A
6 Aug 83 C C C C NA
12 Aug 83 C NC C C A
C - Complete
NC - Not Complete
A - Available
NA - Not Available
Hourly SFC reports cover regions of Northeast U.S. and Southeast Canada
57

APPENDIX B
0- I
Data Requests
In. support of our investigations for the FAA, we have collected andwill continue to collect Doppler weather radar data, Instrumented aircraftdata, and surface meteorological data during rain and thunderstorms. Insome cases we have also archived NWS hourly surface data and GOES visibleand IR data. We realize that our data sets are useful for meteorologicaland other scientific investigations and we welcome any requests for them.We do, however, ask that you do the following:
1. Request the data by contacting one of us at (617)863-5500
Marilyn Wolfson x3409John DiStefano x3452Barbara Consalves x3416
S
2. Prrvide blank magnetic tapes on which we can record your data.Data format descriptions will be provided.
3. Acknowledge the source of the data in any published reports byincluding an appropriate version of the following statement:
"The data used in this report was provided by the KITLincoln Laboratory under sponsorship from the FederalAviation Administration."
4. Provide us with one copy of your publication.
Please do not hesitate to contact us if you have any problems or questionsin using the data.
58
!