Embed Size (px)
Citation preview
An automatic system to test Li-ion batteries
and ultracapacitors for vehicular applications
MIRKO MARRACCI, BERNARDO TELLINI
Department of Energy and Systems Engineering
University of Pisa, Fac. Of Engineering
L.go L. Lazzarino n. 1, 56122 Pisa
ITALY
[email protected], [email protected]
Abstract: - In this paper we present an automatic system to test Li-ion batteries and ultracapacitors. The main
goal of the system is to compare performances of different storage systems during real operating conditions in
order to make possible a fair comparison.
Key-Words: - Li-ion batteries, ultracapacitors, measurement system, hybrid vehicles.
1 Introduction Li-ion batteries and ultracapacitors are commonly
used storage systems that can find application in
different fields like, for example, electric, hybrid,
and fuel cell vehicles [1]-[6]. The common
judgment on these two devices is that
ultracapacitors are more “power oriented”, while
batteries are more “energy oriented”; these terms are
used to indicate that the device operates more
efficiently with relative short (power oriented) or
long (energy oriented) charge or discharge times
respectively.
In some important applications, like hybrid vehicles,
the energy storage system is required to deliver or
absorb electric power in short intervals of time,
typically a few seconds or tens of seconds; therefore they need to have different characteristics from
batteries for pure-electric vehicles, that are
discharged in tens of minutes or hours; in this case
very-high power Li-ion batteries and ultracapacitors
can be both suitable for this kind of application.
Ragone plots [7] are commonly used for
performance comparison of various energy storing
devices; these plots report the values of energy
density (Wh/kg) versus power density (W/kg)
defining for each device family the specific
application fields. However these plots are not
rigorous, but give only trends: when reporting
individual device characteristics into family plots
often a single point per device is used.
Instead, it can be very useful to evaluate the
characteristic curve for these devices through
experimental tests, reporting energy density vs
power density, in relation to the discharge time.
Furthermore, to make a fair, useful comparison
between different storage systems, they must be
subjected to the same stress; in particular, their
specific power must be assessed using the same
discharge duration.
In this paper an automatic system to make a
comparison between a commercial ultracapacitor
and a commercial very-high power battery is
presented. The system can reproduce actual work
operating conditions that devices could find during
the normal use in hybrid vehicles.
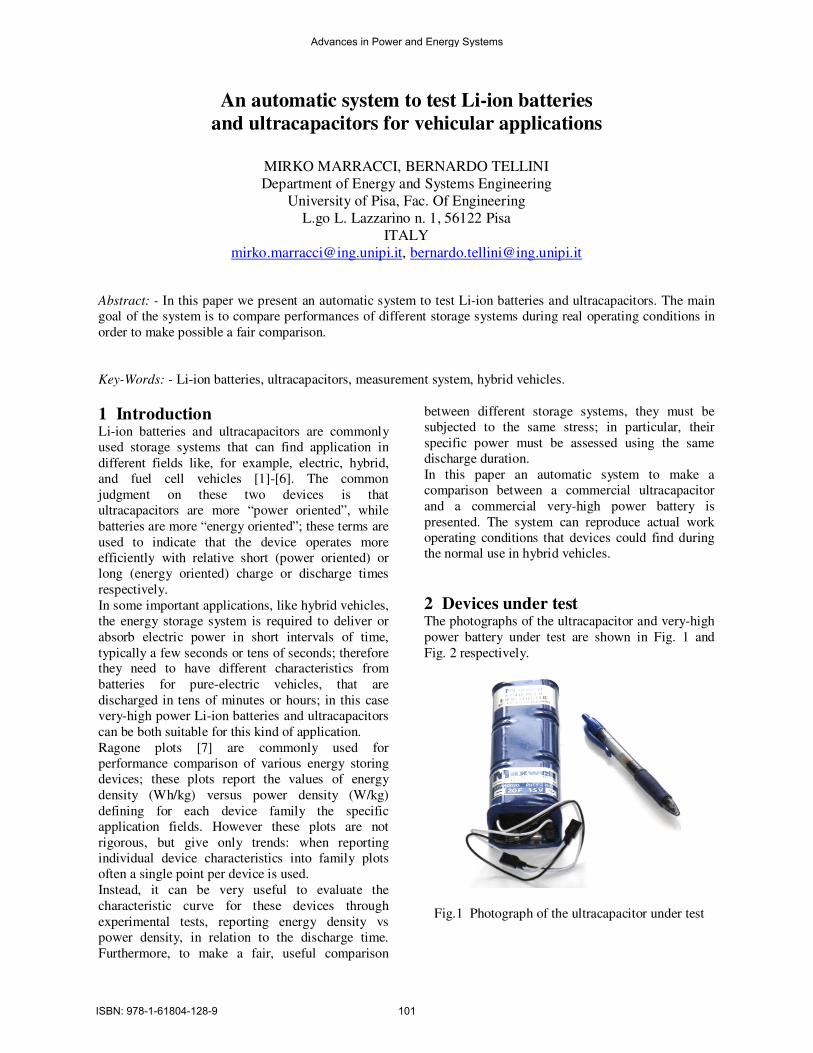
2 Devices under test The photographs of the ultracapacitor and very-high
power battery under test are shown in Fig. 1 and
Fig. 2 respectively.
Fig.1 Photograph of the ultracapacitor under test
Advances in Power and Energy Systems
ISBN: 978-1-61804-128-9 101
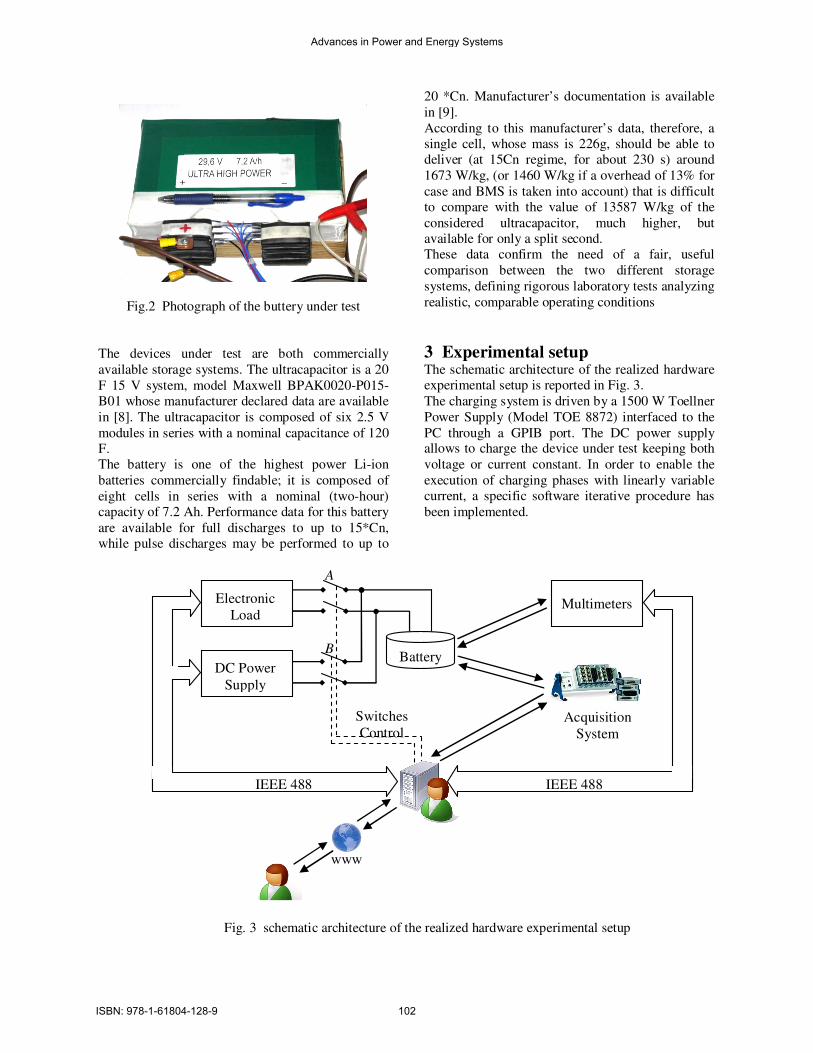
Fig.2 Photograph of the buttery under test
The devices under test are both commercially
available storage systems. The ultracapacitor is a 20
F 15 V system, model Maxwell BPAK0020-P015-
B01 whose manufacturer declared data are available
in [8]. The ultracapacitor is composed of six 2.5 V
modules in series with a nominal capacitance of 120
F.
The battery is one of the highest power Li-ion
batteries commercially findable; it is composed of
eight cells in series with a nominal (two-hour)
capacity of 7.2 Ah. Performance data for this battery
are available for full discharges to up to 15*Cn,
while pulse discharges may be performed to up to
20 *Cn. Manufacturer’s documentation is available
in [9].
According to this manufacturer’s data, therefore, a
single cell, whose mass is 226g, should be able to
deliver (at 15Cn regime, for about 230 s) around
1673 W/kg, (or 1460 W/kg if a overhead of 13% for
case and BMS is taken into account) that is difficult
to compare with the value of 13587 W/kg of the
considered ultracapacitor, much higher, but
available for only a split second.
These data confirm the need of a fair, useful
comparison between the two different storage
systems, defining rigorous laboratory tests analyzing
realistic, comparable operating conditions
3 Experimental setup The schematic architecture of the realized hardware
experimental setup is reported in Fig. 3.
The charging system is driven by a 1500 W Toellner
Power Supply (Model TOE 8872) interfaced to the
PC through a GPIB port. The DC power supply allows to charge the device under test keeping both
voltage or current constant. In order to enable the
execution of charging phases with linearly variable
current, a specific software iterative procedure has
been implemented.
Multimeters
Acquisition
System
Electronic
Load
Battery DC Power
Supply
Switches
Control
IEEE 488 IEEE 488
www
A
B
Fig. 3 schematic architecture of the realized hardware experimental setup
Advances in Power and Energy Systems
ISBN: 978-1-61804-128-9 102
The discharging system is driven by a 6000 W
Zentro-Elektrik Electronic Load (Mod-el EL 6000).
The device allows to discharge the equipment under
test in constant current mode (I-Mode), constant
voltage mode (U-Mode), constant power mode (P-
Mode) or constant conductance mode (G-Mode) and
is fully remote controlled via GPIB standard
interface. Also in this case, in order to enable the
execution of discharging phases with linearly
variable current, a specific software iterative
procedure has been implemented.
The connection of the DC power supply or the
electronic load is driven by two switches (A and B
in Fig. 3) controlled via the implemented software
by means of digital signals. When the switch A is
closed the system is in a discharge phase and the
electronic load is controlled while, when the switch
B is closed the system is in a charge phase and the
DC power supply is controlled. Otherwise, when
both A and B switches are open the system is in a
pause phase.
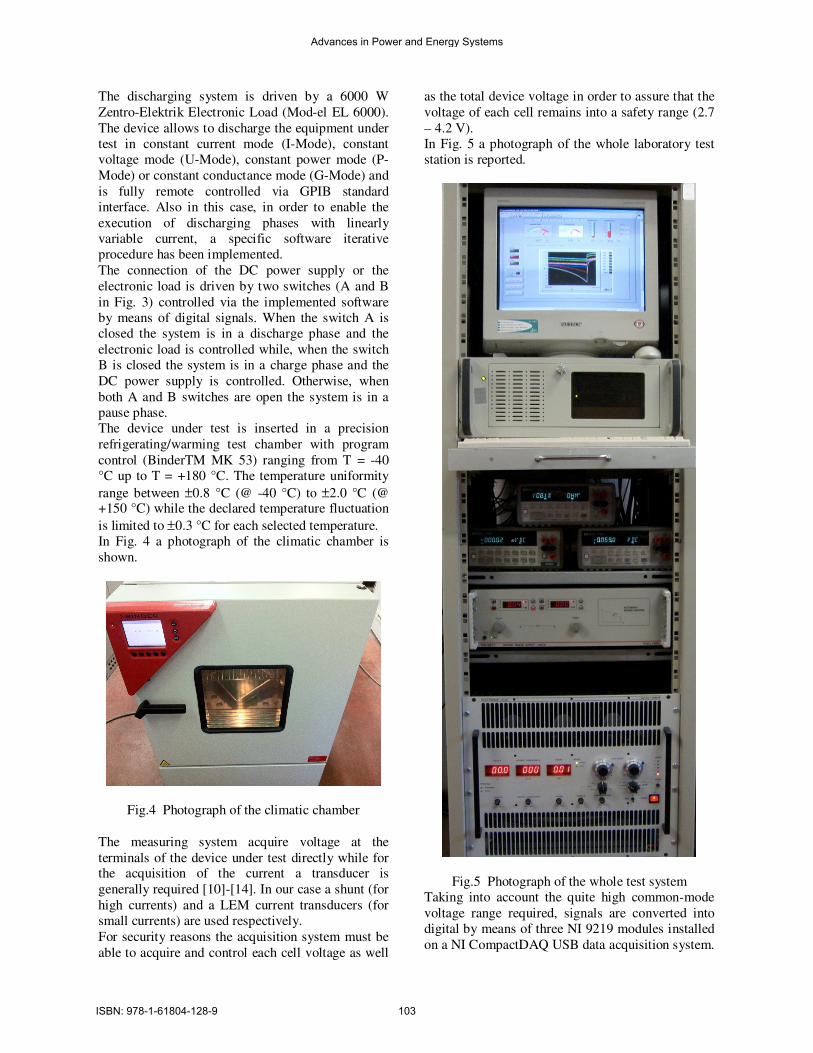
The device under test is inserted in a precision
refrigerating/warming test chamber with program
control (BinderTM MK 53) ranging from T = -40
°C up to T = +180 °C. The temperature uniformity
range between ±0.8 °C (@ -40 °C) to ±2.0 °C (@ +150 °C) while the declared temperature fluctuation
is limited to ±0.3 °C for each selected temperature.
In Fig. 4 a photograph of the climatic chamber is
shown.
Fig.4 Photograph of the climatic chamber
The measuring system acquire voltage at the
terminals of the device under test directly while for the acquisition of the current a transducer is
generally required [10]-[14]. In our case a shunt (for
high currents) and a LEM current transducers (for
small currents) are used respectively.
For security reasons the acquisition system must be
able to acquire and control each cell voltage as well
as the total device voltage in order to assure that the
voltage of each cell remains into a safety range (2.7
– 4.2 V).
In Fig. 5 a photograph of the whole laboratory test
station is reported.
Fig.5 Photograph of the whole test system
Taking into account the quite high common-mode
voltage range required, signals are converted into
digital by means of three NI 9219 modules installed
on a NI CompactDAQ USB data acquisition system.
Advances in Power and Energy Systems
ISBN: 978-1-61804-128-9 103
Each module features 4 simultaneous sampling
universal channels that can measure several signals
from sensors; measurement ranges differ for each
type of measurement and include up to ± 60 V for
voltage and ± 25 mA for current, with 250 Vrms
channel-to-channel isolation and 24-bit resolution;
in this way the system can acquire simultaneously
each cell voltage as well as the total voltage across
and the current through the device under test.
The acquisition system measures the ambient and
device temperature by means of two RTD (PT100)
transducers. Acquired signals can be used both to
control the ambient temperature (when the device is
inserted into the climatic chambers) or to generate
an alarm signal and stop the test when the device
temperature reach a prearranged value.
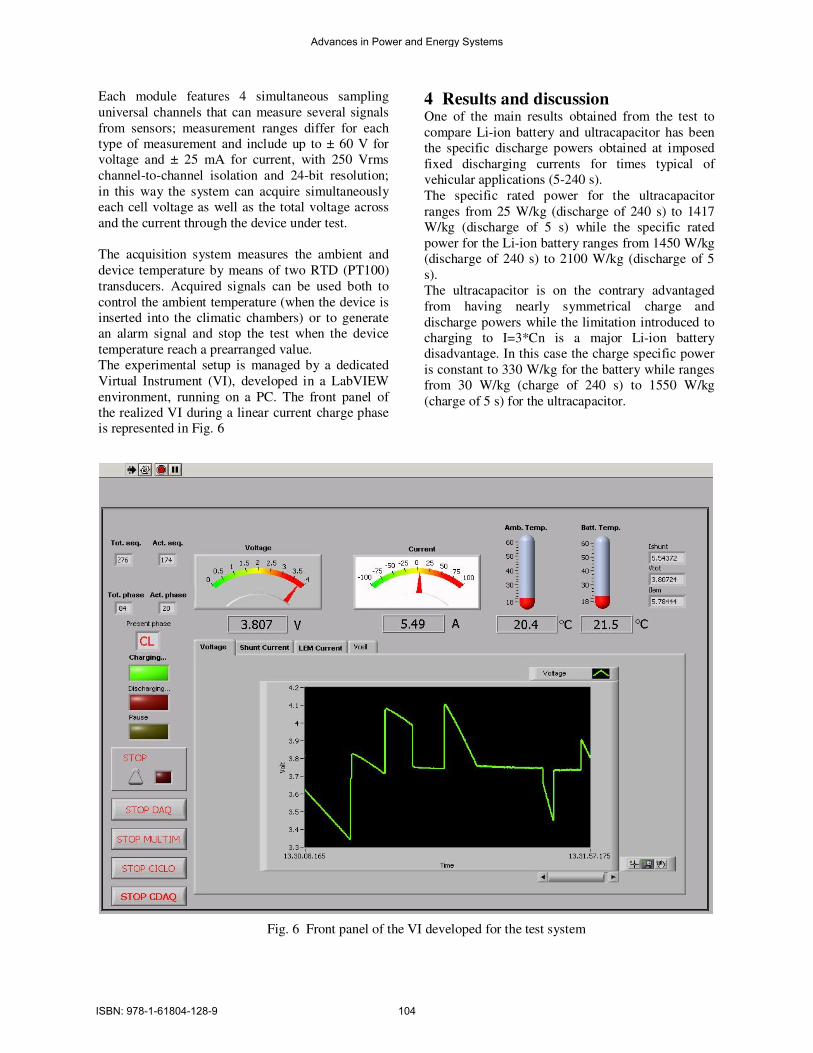
The experimental setup is managed by a dedicated
Virtual Instrument (VI), developed in a LabVIEW
environment, running on a PC. The front panel of
the realized VI during a linear current charge phase
is represented in Fig. 6
4 Results and discussion One of the main results obtained from the test to
compare Li-ion battery and ultracapacitor has been
the specific discharge powers obtained at imposed
fixed discharging currents for times typical of
vehicular applications (5-240 s).
The specific rated power for the ultracapacitor
ranges from 25 W/kg (discharge of 240 s) to 1417
W/kg (discharge of 5 s) while the specific rated
power for the Li-ion battery ranges from 1450 W/kg
(discharge of 240 s) to 2100 W/kg (discharge of 5
s).
The ultracapacitor is on the contrary advantaged
from having nearly symmetrical charge and
discharge powers while the limitation introduced to
charging to I=3*Cn is a major Li-ion battery
disadvantage. In this case the charge specific power
is constant to 330 W/kg for the battery while ranges
from 30 W/kg (charge of 240 s) to 1550 W/kg
(charge of 5 s) for the ultracapacitor.
Fig. 6 Front panel of the VI developed for the test system
Advances in Power and Energy Systems
ISBN: 978-1-61804-128-9 104
In order to make a deep comparison between
commercial ultracapacitor and very-high power
battery, reproducing actual work operating
conditions that devices could find during, for
example, the normal use in hybrid vehicles, a test of
the two systems using the New European Driving
Cycle (NEDC) [15] is currently in progress.
The New European Driving Cycle is a driving cycle
consisting of four repeated urban driving cycles
(ECE-15) and an Extra-Urban driving cycle, or
EUDC. The NEDC is supposed to represent the
typical usage of a car in Europe.
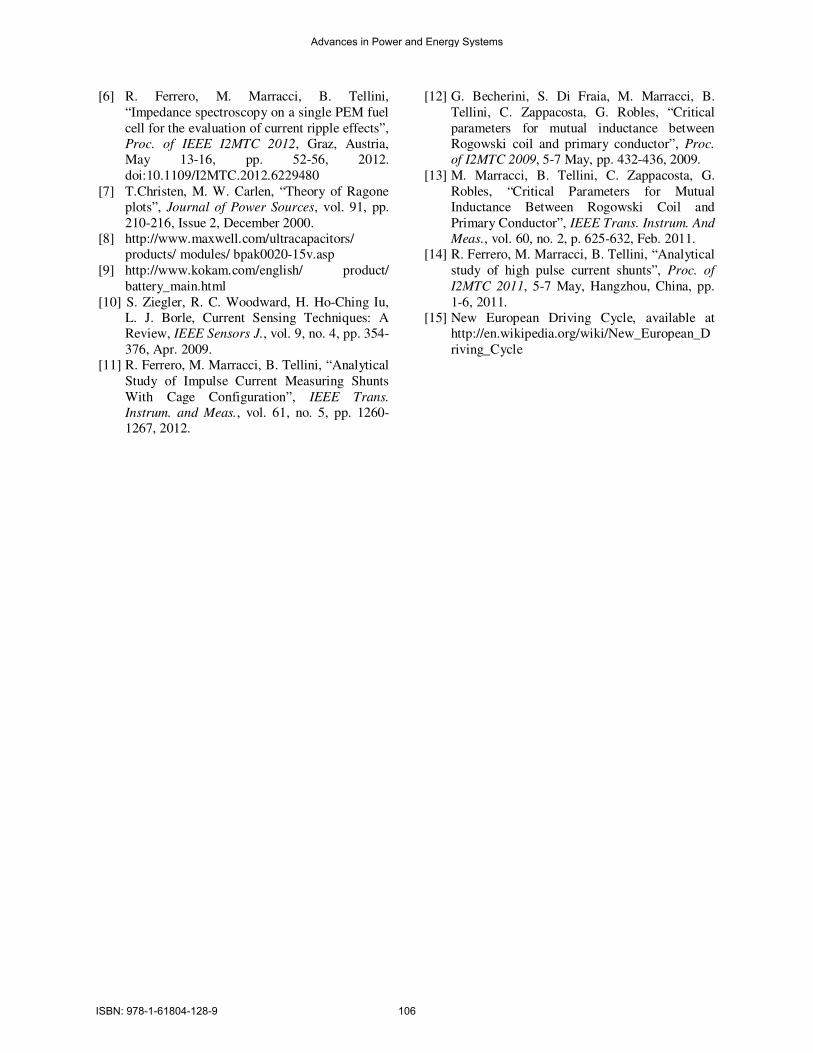
Analyzing the main drive train power fluxes for a
series hybrid vehicle performing a NEDC cycle, we
found the typical current profile required from
Rechargeable Energy Storage System (RESS) that is
represented in the following Fig. 7.
0 200 400 600 800 1000 1200-50
0
50
25
-25
Time (s)
Cu
rren
t (A
)
Fig.7 Current profile of the storage system for a
series hybrid vehicle performing a NEDC cycle.
This complex current profile reproduced in Fig. 7
can be used to analyze the storage system behavior
during a realistic stress condition. For safety
reasons, during the battery tests, the current profile
has been obtained reducing peaks of discharge and charge current of nearly 6*Cn; This limitation does
not constraint markedly vehicle operation and keep
temperatures in a perfectly acceptable range.
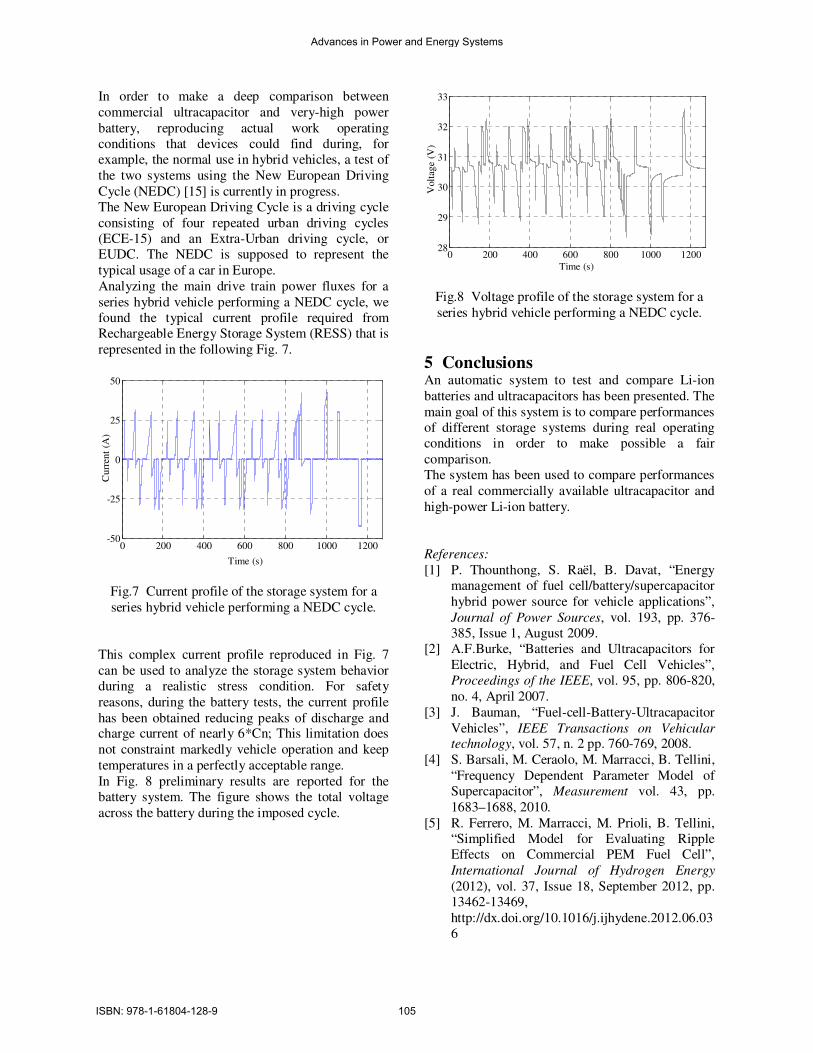
In Fig. 8 preliminary results are reported for the
battery system. The figure shows the total voltage
across the battery during the imposed cycle.
0 200 400 600 800 1000 120028
29
30
31
32
33
Time (s)
Volt
age
(V)
Fig.8 Voltage profile of the storage system for a
series hybrid vehicle performing a NEDC cycle.
5 Conclusions An automatic system to test and compare Li-ion
batteries and ultracapacitors has been presented. The
main goal of this system is to compare performances
of different storage systems during real operating
conditions in order to make possible a fair
comparison.
The system has been used to compare performances
of a real commercially available ultracapacitor and
high-power Li-ion battery.
References:
[1] P. Thounthong, S. Raël, B. Davat, “Energy
management of fuel cell/battery/supercapacitor
hybrid power source for vehicle applications”,
Journal of Power Sources, vol. 193, pp. 376-
385, Issue 1, August 2009.
[2] A.F.Burke, “Batteries and Ultracapacitors for
Electric, Hybrid, and Fuel Cell Vehicles”,
Proceedings of the IEEE, vol. 95, pp. 806-820,
no. 4, April 2007.
[3] J. Bauman, “Fuel-cell-Battery-Ultracapacitor
Vehicles”, IEEE Transactions on Vehicular technology, vol. 57, n. 2 pp. 760-769, 2008.
[4] S. Barsali, M. Ceraolo, M. Marracci, B. Tellini,
“Frequency Dependent Parameter Model of
Supercapacitor”, Measurement vol. 43, pp.
1683–1688, 2010.
[5] R. Ferrero, M. Marracci, M. Prioli, B. Tellini,
“Simplified Model for Evaluating Ripple
Effects on Commercial PEM Fuel Cell”,
International Journal of Hydrogen Energy
(2012), vol. 37, Issue 18, September 2012, pp.
13462-13469,
http://dx.doi.org/10.1016/j.ijhydene.2012.06.03
6
Advances in Power and Energy Systems
ISBN: 978-1-61804-128-9 105
[6] R. Ferrero, M. Marracci, B. Tellini,
“Impedance spectroscopy on a single PEM fuel
cell for the evaluation of current ripple effects”,
Proc. of IEEE I2MTC 2012, Graz, Austria,
May 13-16, pp. 52-56, 2012.
doi:10.1109/I2MTC.2012.6229480
[7] T.Christen, M. W. Carlen, “Theory of Ragone
plots”, Journal of Power Sources, vol. 91, pp.
210-216, Issue 2, December 2000.
[8] http://www.maxwell.com/ultracapacitors/
products/ modules/ bpak0020-15v.asp
[9] http://www.kokam.com/english/ product/
battery_main.html
[10] S. Ziegler, R. C. Woodward, H. Ho-Ching Iu,
L. J. Borle, Current Sensing Techniques: A
Review, IEEE Sensors J., vol. 9, no. 4, pp. 354-
376, Apr. 2009.
[11] R. Ferrero, M. Marracci, B. Tellini, “Analytical
Study of Impulse Current Measuring Shunts
With Cage Configuration”, IEEE Trans.
Instrum. and Meas., vol. 61, no. 5, pp. 1260-
1267, 2012.
[12] G. Becherini, S. Di Fraia, M. Marracci, B.
Tellini, C. Zappacosta, G. Robles, “Critical
parameters for mutual inductance between
Rogowski coil and primary conductor”, Proc.
of I2MTC 2009, 5-7 May, pp. 432-436, 2009.
[13] M. Marracci, B. Tellini, C. Zappacosta, G.
Robles, “Critical Parameters for Mutual
Inductance Between Rogowski Coil and
Primary Conductor”, IEEE Trans. Instrum. And
Meas., vol. 60, no. 2, p. 625-632, Feb. 2011.
[14] R. Ferrero, M. Marracci, B. Tellini, “Analytical
study of high pulse current shunts”, Proc. of
I2MTC 2011, 5-7 May, Hangzhou, China, pp.
1-6, 2011.
[15] New European Driving Cycle, available at
http://en.wikipedia.org/wiki/New_European_D
riving_Cycle
Advances in Power and Energy Systems
ISBN: 978-1-61804-128-9 106