Embed Size (px)
Citation preview
Organic Geochemistry 142 (2020) 103995
Contents lists available at ScienceDirect
Organic Geochemistry
journal homepage: www.elsevier .com/locate /orggeochem
An automated solid phase extraction procedure for lipid biomarkerpurification and stable isotope analysis
https://doi.org/10.1016/j.orggeochem.2020.1039950146-6380/� 2020 The Authors. Published by Elsevier Ltd.This is an open access article under the CC BY license (http://creativecommons.org/licenses/by/4.0/).
⇑ Corresponding author.E-mail address: [email protected] (O. Rach).
Oliver Rach a,⇑, Xennophone Hadeen a,b, Dirk Sachse a
aGFZ – German Research Centre for Geosciences, Section 4.6, Geomorphology, Organic Surface Geochemistry Lab, Telegrafenberg, 14473 Potsdam, Germanyb School of Earth and Environmental Science, James Cook University, Cairns, Queensland, Australia
a r t i c l e i n f o a b s t r a c t
Article history:Received 28 October 2019Received in revised form 19 February 2020Accepted 21 February 2020Available online 25 February 2020
Keywords:Compound separationFatty acidsn-AlkanesHydrocarbonStable hydrogen isotopes
Effective recovery and high purity of lipid biomarkers are essential for compound-specific stable isotopeanalysis in a variety of fields ranging from hydrocarbon research, paleoclimatology, food and drug anal-ysis and medicine. Solid-phase extraction (SPE) is the most common method for purifying organic com-pounds from complex mixtures. SPE constitutes the most labor-intensive part of laboratory work oftenlimiting the number of samples that can be analyzed. Reliable, easy-to-use, automated methods couldincrease sample throughput as well as reproducibility. Here we introduce such a method using aGilson ASPEC GX-271 system and test the separation quality, reproducibility, and efficiency in compar-ison to a classical manual SPE lipid purification procedure. Using multiple extractions of the same naturalsoil sample we show that the automated SPE is comparable in overall quality and slightly superior inreproducibility to a manual SPE. We demonstrate that stable hydrogen isotope measurements of n-alkanes purified using an automated SPE extraction showed significantly lower standard errors.Furthermore, the unattended operation of the system eases the purification of large sample sets.Generally, the automated SPE using the Gilson ASPEC GX-271 for lipid biomarker separation providesqualitatively and quantitatively accurate and reproducible results with more efficient purification ofcompounds than the manual method.� 2020 The Authors. Published by Elsevier Ltd. This is an open access article under theCCBY license (http://
creativecommons.org/licenses/by/4.0/).
1. Introduction
Effective recovery and reliable lipid biomarker identification, aswell as quantification, is the essential work step in disciplinesranging from hydrocarbon exploration, forensics, food control,pharmaceutical analysis to paleoclimatology. Environmentalsamples, such as plant and animal products, soils and sediments,contain a broad spectrum of different organic molecules. Reliablegas- or liquid chromatographic analysis of these compounds oftenrequires separation into different fractions of similar polarity. Aclassical and often used separation method is solid-phase extrac-tion (SPE) (Zelles and Bai, 1993; Stout et al., 2001; Poole, 2003;Telepchak et al., 2004; Sessions, 2006; Xu and Lee, 2008;Hoffmann et al., 2013), which has become a valuable sample purifi-cation step in modern organic geochemistry (Sessions, 2006; Vogtset al., 2009; McInerney et al., 2011; Romero and Feakins, 2011;Atwood and Sachs, 2012; Ladd and Sachs, 2012; Wohlfarth et al.,2018). In particular, the trend towards temporally and spatially
highly resolved compound-specific stable isotope datasets in pale-oenvironmental analysis (Rach et al., 2014; Gamarra et al., 2016;Nelson et al., 2017; Curtin et al., 2019; Feakins et al., 2019; Zhouet al., 2019) requires baseline separated peaks within the chro-matograms (i.e. no co-elution of different compounds) to avoidmisinterpretations (Wang and Sessions, 2008).
The classic method for compound purification is solid-phaseextraction (SPE). Typically, a sample extract is applied to a station-ary phase (a solid sorbent in a column, often silica gel) which isthen rinsed with a mobile phase (a solvent dissolving the organiccompounds of interest from the extract) (Telepchak et al., 2004).By rinsing the column with solvents of increasing polarity (some-times referred to as ‘normal phase’), separation is achieved as morepolar molecules go into solution and elute stepwise from the col-umn, where they can be collected. This method is well establishedbut remains often a largely manual task. Even in today’s laborato-ries with increasing automation the number of samples is limited.A few automated approaches exist with specialized equipment (i.e.Medium Pressure Liquid Chromatography systems (MPLC) (Radkeet al., 1980), or in industrial applications of SPE (drug purification,environmental trace analysis), but these have limitations. They
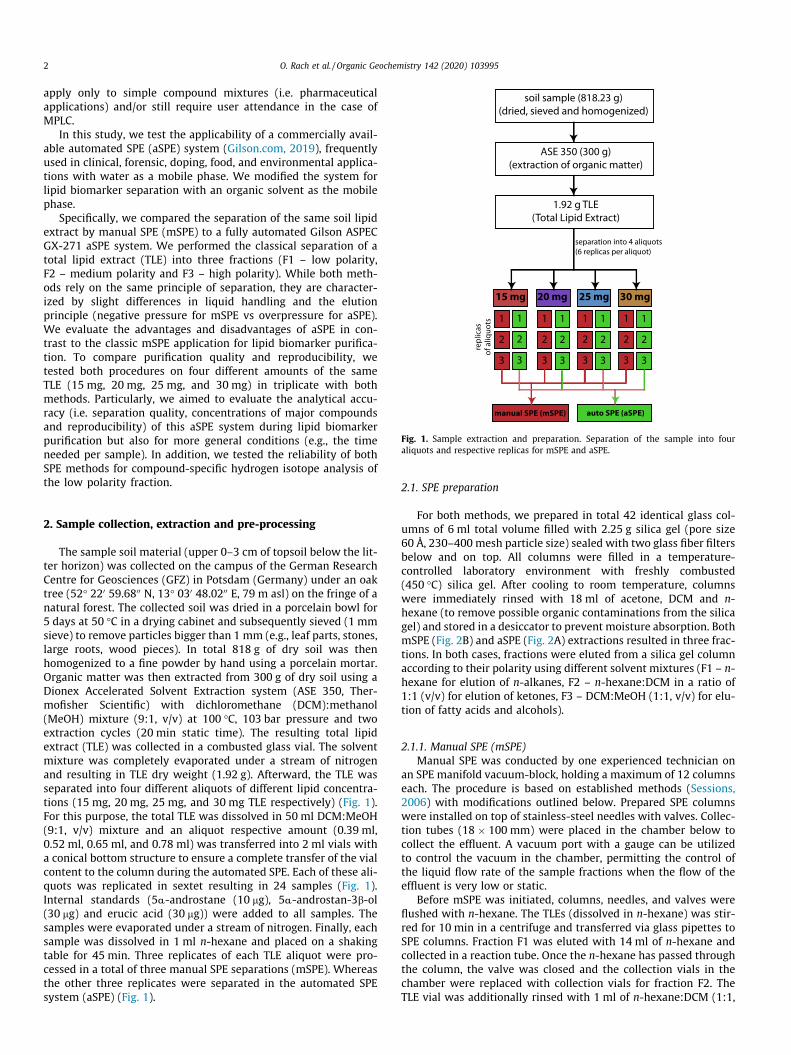
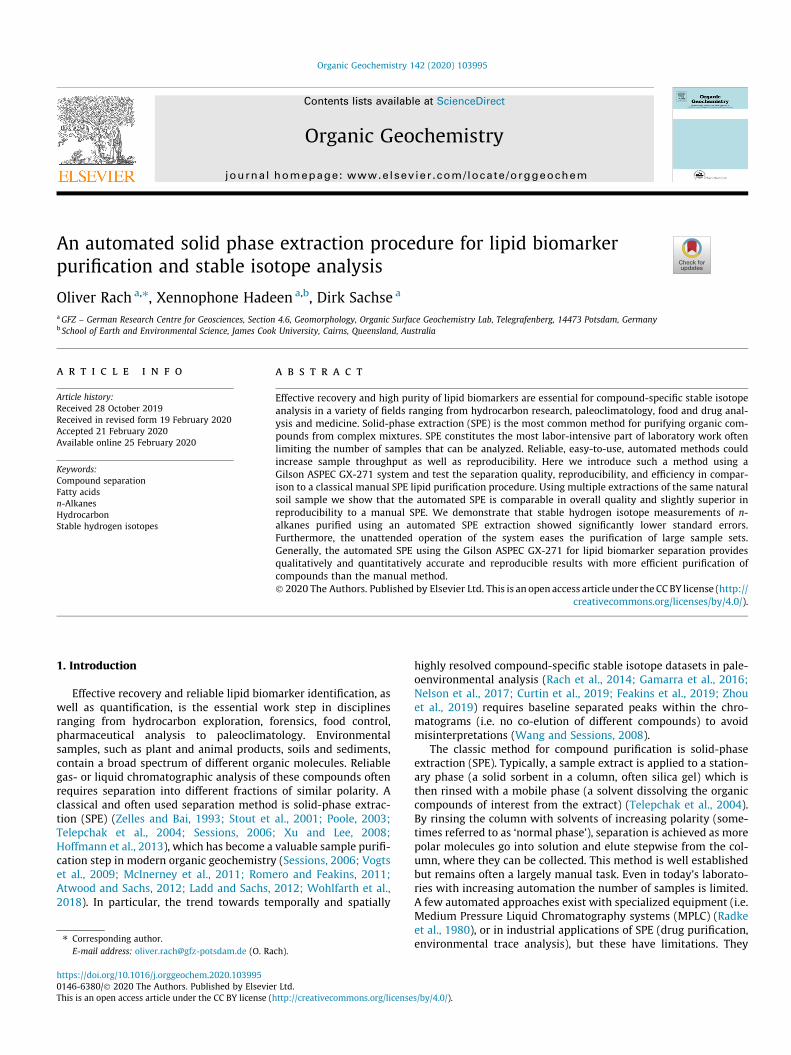
Fig. 1. Sample extraction and preparation. Separation of the sample into fouraliquots and respective replicas for mSPE and aSPE.
2 O. Rach et al. / Organic Geochemistry 142 (2020) 103995
apply only to simple compound mixtures (i.e. pharmaceuticalapplications) and/or still require user attendance in the case ofMPLC.
In this study, we test the applicability of a commercially avail-able automated SPE (aSPE) system (Gilson.com, 2019), frequentlyused in clinical, forensic, doping, food, and environmental applica-tions with water as a mobile phase. We modified the system forlipid biomarker separation with an organic solvent as the mobilephase.
Specifically, we compared the separation of the same soil lipidextract by manual SPE (mSPE) to a fully automated Gilson ASPECGX-271 aSPE system. We performed the classical separation of atotal lipid extract (TLE) into three fractions (F1 – low polarity,F2 – medium polarity and F3 – high polarity). While both meth-ods rely on the same principle of separation, they are character-ized by slight differences in liquid handling and the elutionprinciple (negative pressure for mSPE vs overpressure for aSPE).We evaluate the advantages and disadvantages of aSPE in con-trast to the classic mSPE application for lipid biomarker purifica-tion. To compare purification quality and reproducibility, wetested both procedures on four different amounts of the sameTLE (15 mg, 20 mg, 25 mg, and 30 mg) in triplicate with bothmethods. Particularly, we aimed to evaluate the analytical accu-racy (i.e. separation quality, concentrations of major compoundsand reproducibility) of this aSPE system during lipid biomarkerpurification but also for more general conditions (e.g., the timeneeded per sample). In addition, we tested the reliability of bothSPE methods for compound-specific hydrogen isotope analysis ofthe low polarity fraction.
2. Sample collection, extraction and pre-processing
The sample soil material (upper 0–3 cm of topsoil below the lit-ter horizon) was collected on the campus of the German ResearchCentre for Geosciences (GFZ) in Potsdam (Germany) under an oaktree (52� 220 59.6800 N, 13� 030 48.0200 E, 79 m asl) on the fringe of anatural forest. The collected soil was dried in a porcelain bowl for5 days at 50 �C in a drying cabinet and subsequently sieved (1 mmsieve) to remove particles bigger than 1 mm (e.g., leaf parts, stones,large roots, wood pieces). In total 818 g of dry soil was thenhomogenized to a fine powder by hand using a porcelain mortar.Organic matter was then extracted from 300 g of dry soil using aDionex Accelerated Solvent Extraction system (ASE 350, Ther-mofisher Scientific) with dichloromethane (DCM):methanol(MeOH) mixture (9:1, v/v) at 100 �C, 103 bar pressure and twoextraction cycles (20 min static time). The resulting total lipidextract (TLE) was collected in a combusted glass vial. The solventmixture was completely evaporated under a stream of nitrogenand resulting in TLE dry weight (1.92 g). Afterward, the TLE wasseparated into four different aliquots of different lipid concentra-tions (15 mg, 20 mg, 25 mg, and 30 mg TLE respectively) (Fig. 1).For this purpose, the total TLE was dissolved in 50 ml DCM:MeOH(9:1, v/v) mixture and an aliquot respective amount (0.39 ml,0.52 ml, 0.65 ml, and 0.78 ml) was transferred into 2 ml vials witha conical bottom structure to ensure a complete transfer of the vialcontent to the column during the automated SPE. Each of these ali-quots was replicated in sextet resulting in 24 samples (Fig. 1).Internal standards (5⍺-androstane (10 mg), 5⍺-androstan-3b-ol(30 mg) and erucic acid (30 mg)) were added to all samples. Thesamples were evaporated under a stream of nitrogen. Finally, eachsample was dissolved in 1 ml n-hexane and placed on a shakingtable for 45 min. Three replicates of each TLE aliquot were pro-cessed in a total of three manual SPE separations (mSPE). Whereasthe other three replicates were separated in the automated SPEsystem (aSPE) (Fig. 1).
2.1. SPE preparation
For both methods, we prepared in total 42 identical glass col-umns of 6 ml total volume filled with 2.25 g silica gel (pore size60 Å, 230–400 mesh particle size) sealed with two glass fiber filtersbelow and on top. All columns were filled in a temperature-controlled laboratory environment with freshly combusted(450 �C) silica gel. After cooling to room temperature, columnswere immediately rinsed with 18 ml of acetone, DCM and n-hexane (to remove possible organic contaminations from the silicagel) and stored in a desiccator to prevent moisture absorption. BothmSPE (Fig. 2B) and aSPE (Fig. 2A) extractions resulted in three frac-tions. In both cases, fractions were eluted from a silica gel columnaccording to their polarity using different solvent mixtures (F1 – n-hexane for elution of n-alkanes, F2 – n-hexane:DCM in a ratio of1:1 (v/v) for elution of ketones, F3 – DCM:MeOH (1:1, v/v) for elu-tion of fatty acids and alcohols).
2.1.1. Manual SPE (mSPE)Manual SPE was conducted by one experienced technician on
an SPE manifold vacuum-block, holding a maximum of 12 columnseach. The procedure is based on established methods (Sessions,2006) with modifications outlined below. Prepared SPE columnswere installed on top of stainless-steel needles with valves. Collec-tion tubes (18 � 100 mm) were placed in the chamber below tocollect the effluent. A vacuum port with a gauge can be utilizedto control the vacuum in the chamber, permitting the control ofthe liquid flow rate of the sample fractions when the flow of theeffluent is very low or static.
Before mSPE was initiated, columns, needles, and valves wereflushed with n-hexane. The TLEs (dissolved in n-hexane) was stir-red for 10 min in a centrifuge and transferred via glass pipettes toSPE columns. Fraction F1 was eluted with 14 ml of n-hexane andcollected in a reaction tube. Once the n-hexane has passed throughthe column, the valve was closed and the collection vials in thechamber were replaced with collection vials for fraction F2. TheTLE vial was additionally rinsed with 1 ml of n-hexane:DCM (1:1,
Solvent reservoir
Liquid pump
ASPEC GX-271
Autosampler
Mobile racks with columns
Sample rack with samples
Solvent mixing tubes
Rinse pumpCollection racks with tubes
A
BColumns
Valves
Vacuum block with
collection tubes
aSPE
mSPE
Fig. 2. Setup of compared SPE methods. (A) aSPE, (B) mSPE.
O. Rach et al. / Organic Geochemistry 142 (2020) 103995 3
v/v) mixture which was also transferred to the SPE column, toensure that higher polarity molecules that may not have been dis-solved in the initial n-hexane step are recovered. In the followingstep, 13 ml of n-hexane:DCM (1:1) mixture was used for the elu-tion of fraction F2 from the column. Subsequently, the collectionvials were replaced, the TLE vial was rinsed again with 1 ml mix-ture of the next eluent (DCM:methanol (1:1, v/v)) and 13 ml of aDCM:methanol (1:1, v/v) mixture was applied for elution and col-lection of fraction F3.
mSPE was conducted in triplicate with the same four samples(15 mg TLE, 20 mg TLE, 25 mg TLE, 30 mg TLE) and one blank col-umn for assessing reproducibility. Processing time for mSPE in thisconfiguration depends on the experience of the user and sampletype. In our case, the meantime for a 4-sample run (+1 blank col-umn) with 3 fractions eluted per sample was 62 min.
2.1.2. Automated SPE (aSPE)For aSPE we used an Aspec GX-271 system (Gilson, Inc.) in com-
bination with a two-syringe liquid pump (verity 4260) and oneadditional peristaltic pump (for outside needle rinse). The systemis controlled by Trilution LH software (Gilson, Inc). The liquidpump is connected to two 2.5 l reservoir bottles of n-hexane andDCM. The Aspec GX-271 bed layout consists of in total nine mod-ules: one four-bottle rack for 650 ml glass bottles (item code (ic):123 GX-271), three collection racks (ic: collect 376), three mobileracks (ic: DEC 376 mobile rack), one tube rack for 44 tubes (size:18 � 100 mm) (ic: 22) and one vial rack for 60 vials (size: 2 ml)(ic: 330).
We used a commercially available system of the Aspec GX-271platform with slight custom modifications to the collection andmobile racks for an application with organic solvents. The diameterand depth of the tube positions on the collection racks wereslightly increased to support larger 18 � 100 mm collection vials(standard: 15 � 85 mm) to increase the total collection volumeper fraction. Also, the holes which hold the columns within themobile racks were slightly widened in diameter to fit 6 ml glasscolumns (standard: plastic columns). Additionally, the standardplastic column plugs (pressure caps) were replaced by self-designed and produced solvent-resistant PTFE caps to avoid possi-ble sample contamination during elution.
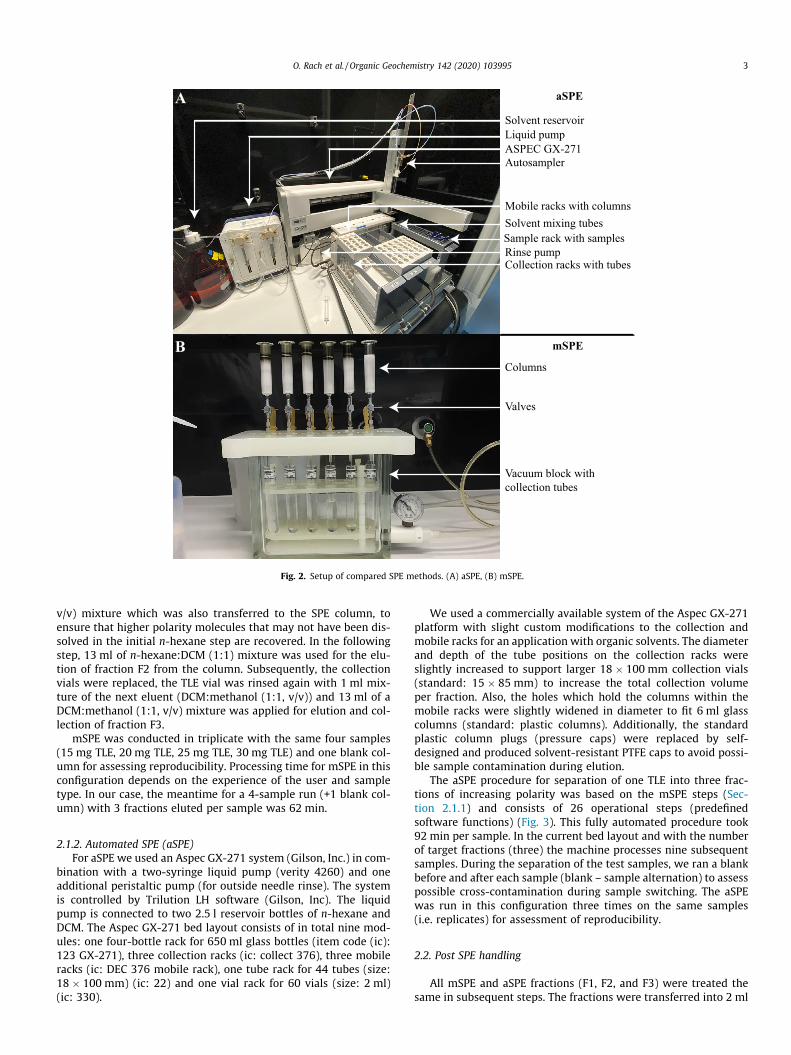
The aSPE procedure for separation of one TLE into three frac-tions of increasing polarity was based on the mSPE steps (Sec-tion 2.1.1) and consists of 26 operational steps (predefinedsoftware functions) (Fig. 3). This fully automated procedure took92 min per sample. In the current bed layout and with the numberof target fractions (three) the machine processes nine subsequentsamples. During the separation of the test samples, we ran a blankbefore and after each sample (blank – sample alternation) to assesspossible cross-contamination during sample switching. The aSPEwas run in this configuration three times on the same samples(i.e. replicates) for assessment of reproducibility.
2.2. Post SPE handling
All mSPE and aSPE fractions (F1, F2, and F3) were treated thesame in subsequent steps. The fractions were transferred into 2 ml
Fig. 3. aSPE functional workflow including a detailed description of work steps and functions during aSPE.
4 O. Rach et al. / Organic Geochemistry 142 (2020) 103995
vials and dissolved in 400 ml of solvent (F1 in n-hexane, F2 and F3 inDCM). F3 was derivatized using 50 ml of BSTFA before analysis. Forcompound identification and quantification, all samples wereanalyzed in triplicate on an Agilent 7890 gas chromatograph (GC)coupled to a flame ionization detector (FID) and Agilent 5975single-quad mass spectrometer (MS). The GC was equipped with a30 m Agilent DB-5MS UI column (0.25 mm film thickness, 25 mmdiameter). Additionally, three replicates of external standards(5⍺-androstane (10 mg), 5⍺-androstan-3b-ol (30 mg) and erucic acid(30 mg)) weremeasured in 400 ml of solvent for a reliable compound
quantification of alkanes, aldehydes, ketones and fatty acids (FA).The resulting peak areas of all three replicate measurements of theexternal standards, as well as the samples, were used to calculatea mean area and used for compound quantification. Sample resultswere normalized to their initial TLE weight and are reported asmg/g TLE with the corresponding standard error of the mean (SE).
Compound-specific stable hydrogen isotope measurements(d2H) were conducted on n-alkanes from the F1 fractions using aTrace GC 1310 (ThermoFisher Scientific) connected to Delta V plusIsotope Ratio Mass Spectrometer (IRMS) (ThermoFisher Scientific).
O. Rach et al. / Organic Geochemistry 142 (2020) 103995 5
The GC was equipped with an Agilent DB-5MS UI column (0.25 mmfilm thickness, 25 mm diameter). n-Alkane d2H values were deter-mined by duplicate measurements. An n-alkane standard-mix A6(n-C16 to n-C30) with known d2H values obtained from A. Schim-melmann (Indiana University) was measured before and after thesamples and used for correction and transfer to the VSMOW scale.During the 2-days measurement period the H3+ factor was stableat 3.09 ± 0.02 mV.
2.3. Statistical processing
Significance of differences was tested through the t-test andrespective p-values (95% confidence interval) were calculatedusing Aabel software. For determination of the respective errorranges of compound amounts and isotope values, the standarddeviation (SD), as well as the standard error of the mean (SE), werecalculated. Error ranges in the text and figures show the standarderror of the mean from replicate measurements. Since this studycompares mainly differences between mean values of three repli-cate measurements from two different purification methods it isappropriate to show error ranges as the standard error of the meaninstead of the standard deviation. For comparison, in Tables 1 and 2we also present the standard deviations. The error range of concen-trations is considered until 0.01 mg/g (10 ng/g). Errors below0.01 mg/g (10 ng/g) are stated as ± 0.00 mg/g.
3. Results
3.1. Manual SPE (mSPE)
One blank column was produced in each of the three mSPEextraction runs. No compounds were detected in the blankfractions.
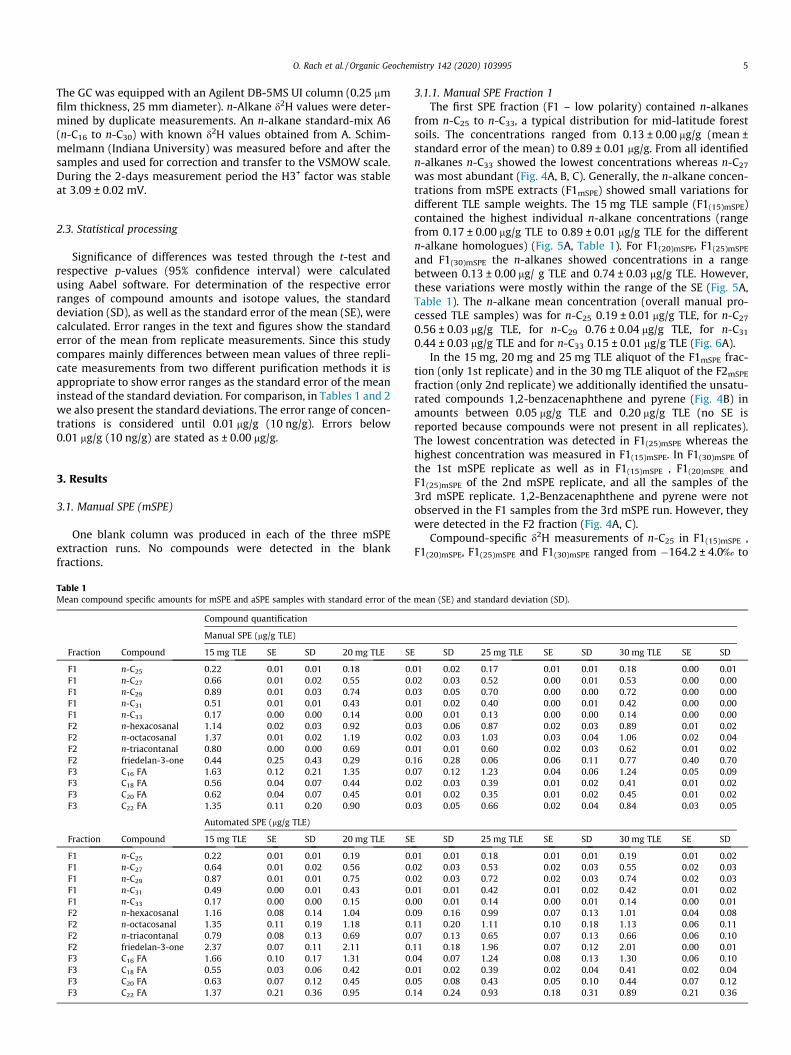
Table 1Mean compound specific amounts for mSPE and aSPE samples with standard error of the
Compound quantification
Manual SPE (mg/g TLE)
Fraction Compound 15 mg TLE SE SD 20 mg TLE SE
F1 n-C25 0.22 0.01 0.01 0.18 0.F1 n-C27 0.66 0.01 0.02 0.55 0.F1 n-C29 0.89 0.01 0.03 0.74 0.F1 n-C31 0.51 0.01 0.01 0.43 0.F1 n-C33 0.17 0.00 0.00 0.14 0.F2 n-hexacosanal 1.14 0.02 0.03 0.92 0.F2 n-octacosanal 1.37 0.01 0.02 1.19 0.F2 n-triacontanal 0.80 0.00 0.00 0.69 0.F2 friedelan-3-one 0.44 0.25 0.43 0.29 0.F3 C16 FA 1.63 0.12 0.21 1.35 0.F3 C18 FA 0.56 0.04 0.07 0.44 0.F3 C20 FA 0.62 0.04 0.07 0.45 0.F3 C22 FA 1.35 0.11 0.20 0.90 0.
Automated SPE (mg/g TLE)
Fraction Compound 15 mg TLE SE SD 20 mg TLE SE
F1 n-C25 0.22 0.01 0.01 0.19 0.F1 n-C27 0.64 0.01 0.02 0.56 0.F1 n-C29 0.87 0.01 0.01 0.75 0.F1 n-C31 0.49 0.00 0.01 0.43 0.F1 n-C33 0.17 0.00 0.00 0.15 0.F2 n-hexacosanal 1.16 0.08 0.14 1.04 0.F2 n-octacosanal 1.35 0.11 0.19 1.18 0.F2 n-triacontanal 0.79 0.08 0.13 0.69 0.F2 friedelan-3-one 2.37 0.07 0.11 2.11 0.F3 C16 FA 1.66 0.10 0.17 1.31 0.F3 C18 FA 0.55 0.03 0.06 0.42 0.F3 C20 FA 0.63 0.07 0.12 0.45 0.F3 C22 FA 1.37 0.21 0.36 0.95 0.
3.1.1. Manual SPE Fraction 1The first SPE fraction (F1 – low polarity) contained n-alkanes
from n-C25 to n-C33, a typical distribution for mid-latitude forestsoils. The concentrations ranged from 0.13 ± 0.00 mg/g (mean ±standard error of the mean) to 0.89 ± 0.01 mg/g. From all identifiedn-alkanes n-C33 showed the lowest concentrations whereas n-C27
was most abundant (Fig. 4A, B, C). Generally, the n-alkane concen-trations from mSPE extracts (F1mSPE) showed small variations fordifferent TLE sample weights. The 15 mg TLE sample (F1(15)mSPE)contained the highest individual n-alkane concentrations (rangefrom 0.17 ± 0.00 mg/g TLE to 0.89 ± 0.01 mg/g TLE for the differentn-alkane homologues) (Fig. 5A, Table 1). For F1(20)mSPE, F1(25)mSPE
and F1(30)mSPE the n-alkanes showed concentrations in a rangebetween 0.13 ± 0.00 mg/ g TLE and 0.74 ± 0.03 mg/g TLE. However,these variations were mostly within the range of the SE (Fig. 5A,Table 1). The n-alkane mean concentration (overall manual pro-cessed TLE samples) was for n-C25 0.19 ± 0.01 mg/g TLE, for n-C27
0.56 ± 0.03 mg/g TLE, for n-C29 0.76 ± 0.04 mg/g TLE, for n-C31
0.44 ± 0.03 mg/g TLE and for n-C33 0.15 ± 0.01 mg/g TLE (Fig. 6A).In the 15 mg, 20 mg and 25 mg TLE aliquot of the F1mSPE frac-
tion (only 1st replicate) and in the 30 mg TLE aliquot of the F2mSPE
fraction (only 2nd replicate) we additionally identified the unsatu-rated compounds 1,2-benzacenaphthene and pyrene (Fig. 4B) inamounts between 0.05 mg/g TLE and 0.20 mg/g TLE (no SE isreported because compounds were not present in all replicates).The lowest concentration was detected in F1(25)mSPE whereas thehighest concentration was measured in F1(15)mSPE. In F1(30)mSPE ofthe 1st mSPE replicate as well as in F1(15)mSPE , F1(20)mSPE andF1(25)mSPE of the 2nd mSPE replicate, and all the samples of the3rd mSPE replicate. 1,2-Benzacenaphthene and pyrene were notobserved in the F1 samples from the 3rd mSPE run. However, theywere detected in the F2 fraction (Fig. 4A, C).
Compound-specific d2H measurements of n-C25 in F1(15)mSPE ,F1(20)mSPE, F1(25)mSPE and F1(30)mSPE ranged from �164.2 ± 4.0‰ to
mean (SE) and standard deviation (SD).
SD 25 mg TLE SE SD 30 mg TLE SE SD
01 0.02 0.17 0.01 0.01 0.18 0.00 0.0102 0.03 0.52 0.00 0.01 0.53 0.00 0.0003 0.05 0.70 0.00 0.00 0.72 0.00 0.0001 0.02 0.40 0.00 0.01 0.42 0.00 0.0000 0.01 0.13 0.00 0.00 0.14 0.00 0.0003 0.06 0.87 0.02 0.03 0.89 0.01 0.0202 0.03 1.03 0.03 0.04 1.06 0.02 0.0401 0.01 0.60 0.02 0.03 0.62 0.01 0.0216 0.28 0.06 0.06 0.11 0.77 0.40 0.7007 0.12 1.23 0.04 0.06 1.24 0.05 0.0902 0.03 0.39 0.01 0.02 0.41 0.01 0.0201 0.02 0.35 0.01 0.02 0.45 0.01 0.0203 0.05 0.66 0.02 0.04 0.84 0.03 0.05
SD 25 mg TLE SE SD 30 mg TLE SE SD
01 0.01 0.18 0.01 0.01 0.19 0.01 0.0202 0.03 0.53 0.02 0.03 0.55 0.02 0.0302 0.03 0.72 0.02 0.03 0.74 0.02 0.0301 0.01 0.42 0.01 0.02 0.42 0.01 0.0200 0.01 0.14 0.00 0.01 0.14 0.00 0.0109 0.16 0.99 0.07 0.13 1.01 0.04 0.0811 0.20 1.11 0.10 0.18 1.13 0.06 0.1107 0.13 0.65 0.07 0.13 0.66 0.06 0.1011 0.18 1.96 0.07 0.12 2.01 0.00 0.0104 0.07 1.24 0.08 0.13 1.30 0.06 0.1001 0.02 0.39 0.02 0.04 0.41 0.02 0.0405 0.08 0.43 0.05 0.10 0.44 0.07 0.1214 0.24 0.93 0.18 0.31 0.89 0.21 0.36
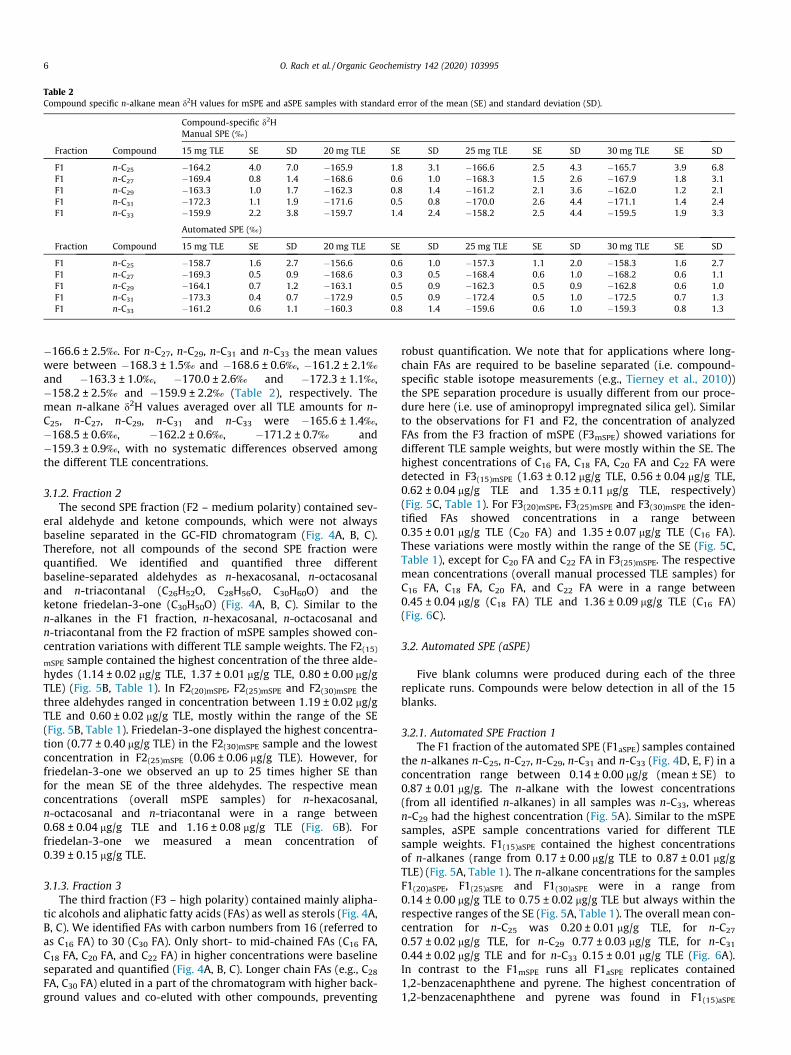
Table 2Compound specific n-alkane mean d2H values for mSPE and aSPE samples with standard error of the mean (SE) and standard deviation (SD).
Compound-specific d2HManual SPE (‰)
Fraction Compound 15 mg TLE SE SD 20 mg TLE SE SD 25 mg TLE SE SD 30 mg TLE SE SD
F1 n-C25 �164.2 4.0 7.0 �165.9 1.8 3.1 �166.6 2.5 4.3 �165.7 3.9 6.8F1 n-C27 �169.4 0.8 1.4 �168.6 0.6 1.0 �168.3 1.5 2.6 �167.9 1.8 3.1F1 n-C29 �163.3 1.0 1.7 �162.3 0.8 1.4 �161.2 2.1 3.6 �162.0 1.2 2.1F1 n-C31 �172.3 1.1 1.9 �171.6 0.5 0.8 �170.0 2.6 4.4 �171.1 1.4 2.4F1 n-C33 �159.9 2.2 3.8 �159.7 1.4 2.4 �158.2 2.5 4.4 �159.5 1.9 3.3
Automated SPE (‰)
Fraction Compound 15 mg TLE SE SD 20 mg TLE SE SD 25 mg TLE SE SD 30 mg TLE SE SD
F1 n-C25 �158.7 1.6 2.7 �156.6 0.6 1.0 �157.3 1.1 2.0 �158.3 1.6 2.7F1 n-C27 �169.3 0.5 0.9 �168.6 0.3 0.5 �168.4 0.6 1.0 �168.2 0.6 1.1F1 n-C29 �164.1 0.7 1.2 �163.1 0.5 0.9 �162.3 0.5 0.9 �162.8 0.6 1.0F1 n-C31 �173.3 0.4 0.7 �172.9 0.5 0.9 �172.4 0.5 1.0 �172.5 0.7 1.3F1 n-C33 �161.2 0.6 1.1 �160.3 0.8 1.4 �159.6 0.6 1.0 �159.3 0.8 1.3
6 O. Rach et al. / Organic Geochemistry 142 (2020) 103995
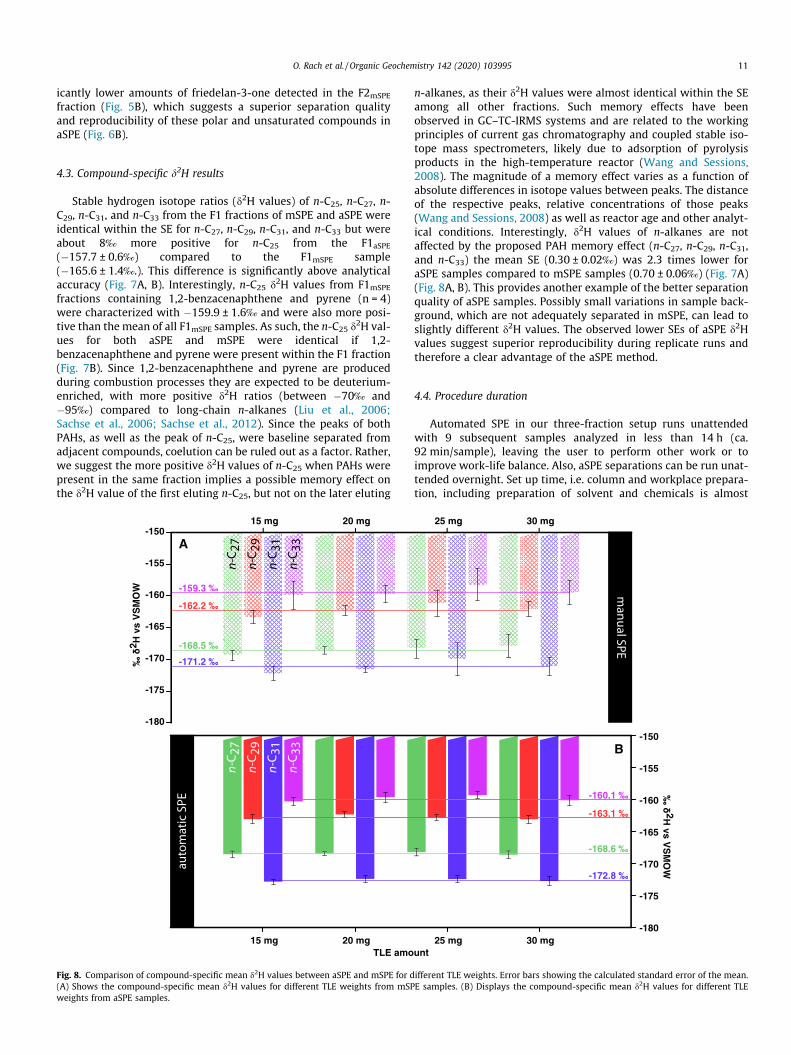
�166.6 ± 2.5‰. For n-C27, n-C29, n-C31 and n-C33 the mean valueswere between �168.3 ± 1.5‰ and �168.6 ± 0.6‰, �161.2 ± 2.1‰and �163.3 ± 1.0‰, �170.0 ± 2.6‰ and �172.3 ± 1.1‰,�158.2 ± 2.5‰ and �159.9 ± 2.2‰ (Table 2), respectively. Themean n-alkane d2H values averaged over all TLE amounts for n-C25, n-C27, n-C29, n-C31 and n-C33 were �165.6 ± 1.4‰,�168.5 ± 0.6‰, �162.2 ± 0.6‰, �171.2 ± 0.7‰ and�159.3 ± 0.9‰, with no systematic differences observed amongthe different TLE concentrations.
3.1.2. Fraction 2The second SPE fraction (F2 – medium polarity) contained sev-
eral aldehyde and ketone compounds, which were not alwaysbaseline separated in the GC-FID chromatogram (Fig. 4A, B, C).Therefore, not all compounds of the second SPE fraction werequantified. We identified and quantified three differentbaseline-separated aldehydes as n-hexacosanal, n-octacosanaland n-triacontanal (C26H52O, C28H56O, C30H60O) and theketone friedelan-3-one (C30H50O) (Fig. 4A, B, C). Similar to then-alkanes in the F1 fraction, n-hexacosanal, n-octacosanal andn-triacontanal from the F2 fraction of mSPE samples showed con-centration variations with different TLE sample weights. The F2(15)
mSPE sample contained the highest concentration of the three alde-hydes (1.14 ± 0.02 mg/g TLE, 1.37 ± 0.01 mg/g TLE, 0.80 ± 0.00 mg/gTLE) (Fig. 5B, Table 1). In F2(20)mSPE, F2(25)mSPE and F2(30)mSPE thethree aldehydes ranged in concentration between 1.19 ± 0.02 mg/gTLE and 0.60 ± 0.02 mg/g TLE, mostly within the range of the SE(Fig. 5B, Table 1). Friedelan-3-one displayed the highest concentra-tion (0.77 ± 0.40 mg/g TLE) in the F2(30)mSPE sample and the lowestconcentration in F2(25)mSPE (0.06 ± 0.06 mg/g TLE). However, forfriedelan-3-one we observed an up to 25 times higher SE thanfor the mean SE of the three aldehydes. The respective meanconcentrations (overall mSPE samples) for n-hexacosanal,n-octacosanal and n-triacontanal were in a range between0.68 ± 0.04 mg/g TLE and 1.16 ± 0.08 mg/g TLE (Fig. 6B). Forfriedelan-3-one we measured a mean concentration of0.39 ± 0.15 mg/g TLE.
3.1.3. Fraction 3The third fraction (F3 – high polarity) contained mainly alipha-
tic alcohols and aliphatic fatty acids (FAs) as well as sterols (Fig. 4A,B, C). We identified FAs with carbon numbers from 16 (referred toas C16 FA) to 30 (C30 FA). Only short- to mid-chained FAs (C16 FA,C18 FA, C20 FA, and C22 FA) in higher concentrations were baselineseparated and quantified (Fig. 4A, B, C). Longer chain FAs (e.g., C28
FA, C30 FA) eluted in a part of the chromatogram with higher back-ground values and co-eluted with other compounds, preventing
robust quantification. We note that for applications where long-chain FAs are required to be baseline separated (i.e. compound-specific stable isotope measurements (e.g., Tierney et al., 2010))the SPE separation procedure is usually different from our proce-dure here (i.e. use of aminopropyl impregnated silica gel). Similarto the observations for F1 and F2, the concentration of analyzedFAs from the F3 fraction of mSPE (F3mSPE) showed variations fordifferent TLE sample weights, but were mostly within the SE. Thehighest concentrations of C16 FA, C18 FA, C20 FA and C22 FA weredetected in F3(15)mSPE (1.63 ± 0.12 mg/g TLE, 0.56 ± 0.04 mg/g TLE,0.62 ± 0.04 mg/g TLE and 1.35 ± 0.11 mg/g TLE, respectively)(Fig. 5C, Table 1). For F3(20)mSPE, F3(25)mSPE and F3(30)mSPE the iden-tified FAs showed concentrations in a range between0.35 ± 0.01 mg/g TLE (C20 FA) and 1.35 ± 0.07 mg/g TLE (C16 FA).These variations were mostly within the range of the SE (Fig. 5C,Table 1), except for C20 FA and C22 FA in F3(25)mSPE. The respectivemean concentrations (overall manual processed TLE samples) forC16 FA, C18 FA, C20 FA, and C22 FA were in a range between0.45 ± 0.04 mg/g (C18 FA) TLE and 1.36 ± 0.09 mg/g TLE (C16 FA)(Fig. 6C).
3.2. Automated SPE (aSPE)
Five blank columns were produced during each of the threereplicate runs. Compounds were below detection in all of the 15blanks.
3.2.1. Automated SPE Fraction 1The F1 fraction of the automated SPE (F1aSPE) samples contained
the n-alkanes n-C25, n-C27, n-C29, n-C31 and n-C33 (Fig. 4D, E, F) in aconcentration range between 0.14 ± 0.00 mg/g (mean ± SE) to0.87 ± 0.01 mg/g. The n-alkane with the lowest concentrations(from all identified n-alkanes) in all samples was n-C33, whereasn-C29 had the highest concentration (Fig. 5A). Similar to the mSPEsamples, aSPE sample concentrations varied for different TLEsample weights. F1(15)aSPE contained the highest concentrationsof n-alkanes (range from 0.17 ± 0.00 mg/g TLE to 0.87 ± 0.01 mg/gTLE) (Fig. 5A, Table 1). The n-alkane concentrations for the samplesF1(20)aSPE, F1(25)aSPE and F1(30)aSPE were in a range from0.14 ± 0.00 mg/g TLE to 0.75 ± 0.02 mg/g TLE but always within therespective ranges of the SE (Fig. 5A, Table 1). The overall mean con-centration for n-C25 was 0.20 ± 0.01 mg/g TLE, for n-C27
0.57 ± 0.02 mg/g TLE, for n-C29 0.77 ± 0.03 mg/g TLE, for n-C31
0.44 ± 0.02 mg/g TLE and for n-C33 0.15 ± 0.01 mg/g TLE (Fig. 6A).In contrast to the F1mSPE runs all F1aSPE replicates contained1,2-benzacenaphthene and pyrene. The highest concentration of1,2-benzacenaphthene and pyrene was found in F1(15)aSPE
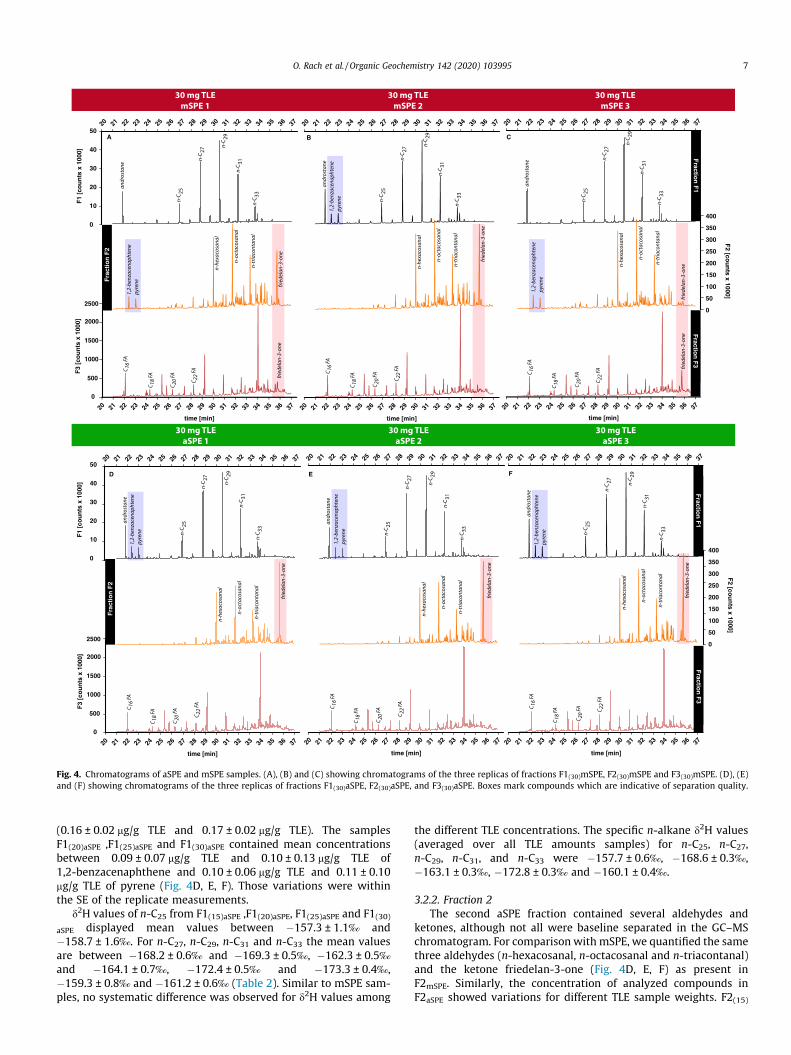
Fig. 4. Chromatograms of aSPE and mSPE samples. (A), (B) and (C) showing chromatograms of the three replicas of fractions F1(30)mSPE, F2(30)mSPE and F3(30)mSPE. (D), (E)and (F) showing chromatograms of the three replicas of fractions F1(30)aSPE, F2(30)aSPE, and F3(30)aSPE. Boxes mark compounds which are indicative of separation quality.
O. Rach et al. / Organic Geochemistry 142 (2020) 103995 7
(0.16 ± 0.02 mg/g TLE and 0.17 ± 0.02 mg/g TLE). The samplesF1(20)aSPE ,F1(25)aSPE and F1(30)aSPE contained mean concentrationsbetween 0.09 ± 0.07 mg/g TLE and 0.10 ± 0.13 mg/g TLE of1,2-benzacenaphthene and 0.10 ± 0.06 mg/g TLE and 0.11 ± 0.10mg/g TLE of pyrene (Fig. 4D, E, F). Those variations were withinthe SE of the replicate measurements.
d2H values of n-C25 from F1(15)aSPE ,F1(20)aSPE, F1(25)aSPE and F1(30)
aSPE displayed mean values between �157.3 ± 1.1‰ and�158.7 ± 1.6‰. For n-C27, n-C29, n-C31 and n-C33 the mean valuesare between �168.2 ± 0.6‰ and �169.3 ± 0.5‰, �162.3 ± 0.5‰and �164.1 ± 0.7‰, �172.4 ± 0.5‰ and �173.3 ± 0.4‰,�159.3 ± 0.8‰ and �161.2 ± 0.6‰ (Table 2). Similar to mSPE sam-ples, no systematic difference was observed for d2H values among
the different TLE concentrations. The specific n-alkane d2H values(averaged over all TLE amounts samples) for n-C25, n-C27,n-C29, n-C31, and n-C33 were �157.7 ± 0.6‰, �168.6 ± 0.3‰,�163.1 ± 0.3‰, �172.8 ± 0.3‰ and �160.1 ± 0.4‰.
3.2.2. Fraction 2The second aSPE fraction contained several aldehydes and
ketones, although not all were baseline separated in the GC–MSchromatogram. For comparison with mSPE, we quantified the samethree aldehydes (n-hexacosanal, n-octacosanal and n-triacontanal)and the ketone friedelan-3-one (Fig. 4D, E, F) as present inF2mSPE. Similarly, the concentration of analyzed compounds inF2aSPE showed variations for different TLE sample weights. F2(15)
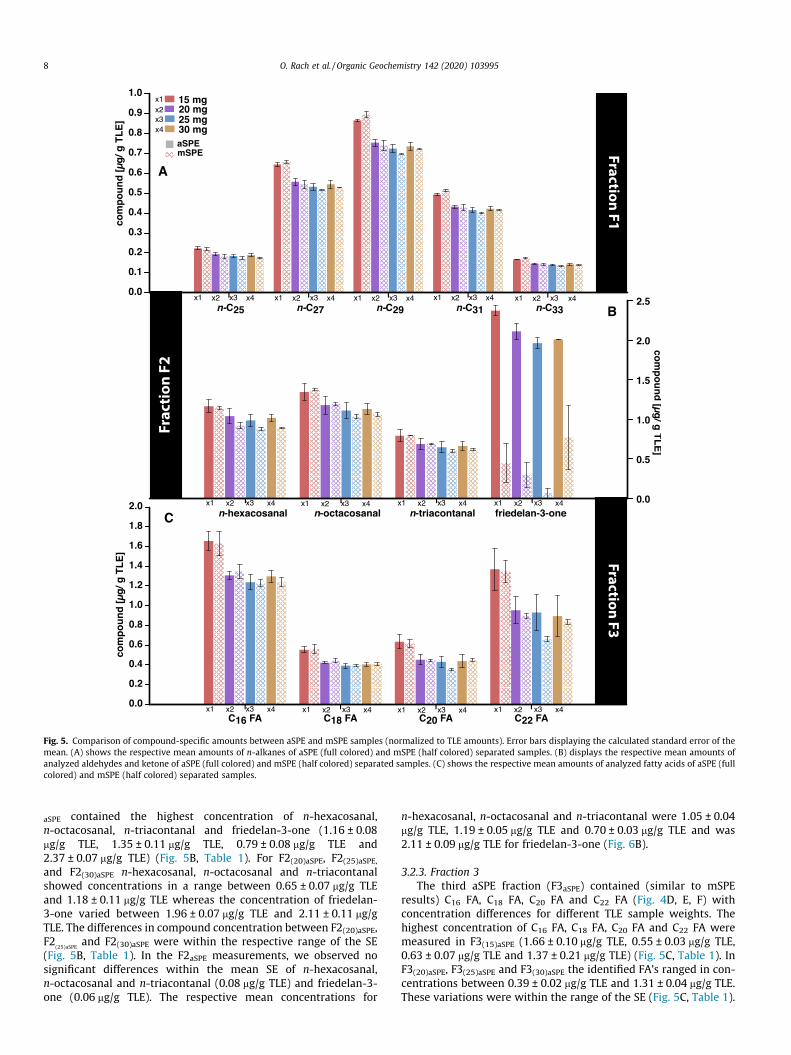
Fig. 5. Comparison of compound-specific amounts between aSPE and mSPE samples (normalized to TLE amounts). Error bars displaying the calculated standard error of themean. (A) shows the respective mean amounts of n-alkanes of aSPE (full colored) and mSPE (half colored) separated samples. (B) displays the respective mean amounts ofanalyzed aldehydes and ketone of aSPE (full colored) and mSPE (half colored) separated samples. (C) shows the respective mean amounts of analyzed fatty acids of aSPE (fullcolored) and mSPE (half colored) separated samples.
8 O. Rach et al. / Organic Geochemistry 142 (2020) 103995
aSPE contained the highest concentration of n-hexacosanal,n-octacosanal, n-triacontanal and friedelan-3-one (1.16 ± 0.08mg/g TLE, 1.35 ± 0.11 mg/g TLE, 0.79 ± 0.08 mg/g TLE and2.37 ± 0.07 mg/g TLE) (Fig. 5B, Table 1). For F2(20)aSPE, F2(25)aSPE,and F2(30)aSPE n-hexacosanal, n-octacosanal and n-triacontanalshowed concentrations in a range between 0.65 ± 0.07 mg/g TLEand 1.18 ± 0.11 mg/g TLE whereas the concentration of friedelan-3-one varied between 1.96 ± 0.07 mg/g TLE and 2.11 ± 0.11 mg/gTLE. The differences in compound concentration between F2(20)aSPE,F2
(25)aSPEand F2(30)aSPE were within the respective range of the SE
(Fig. 5B, Table 1). In the F2aSPE measurements, we observed nosignificant differences within the mean SE of n-hexacosanal,n-octacosanal and n-triacontanal (0.08 mg/g TLE) and friedelan-3-one (0.06 mg/g TLE). The respective mean concentrations for
n-hexacosanal, n-octacosanal and n-triacontanal were 1.05 ± 0.04mg/g TLE, 1.19 ± 0.05 mg/g TLE and 0.70 ± 0.03 mg/g TLE and was2.11 ± 0.09 mg/g TLE for friedelan-3-one (Fig. 6B).
3.2.3. Fraction 3The third aSPE fraction (F3aSPE) contained (similar to mSPE
results) C16 FA, C18 FA, C20 FA and C22 FA (Fig. 4D, E, F) withconcentration differences for different TLE sample weights. Thehighest concentration of C16 FA, C18 FA, C20 FA and C22 FA weremeasured in F3(15)aSPE (1.66 ± 0.10 mg/g TLE, 0.55 ± 0.03 mg/g TLE,0.63 ± 0.07 mg/g TLE and 1.37 ± 0.21 mg/g TLE) (Fig. 5C, Table 1). InF3(20)aSPE, F3(25)aSPE and F3(30)aSPE the identified FA’s ranged in con-centrations between 0.39 ± 0.02 mg/g TLE and 1.31 ± 0.04 mg/g TLE.These variations were within the range of the SE (Fig. 5C, Table 1).
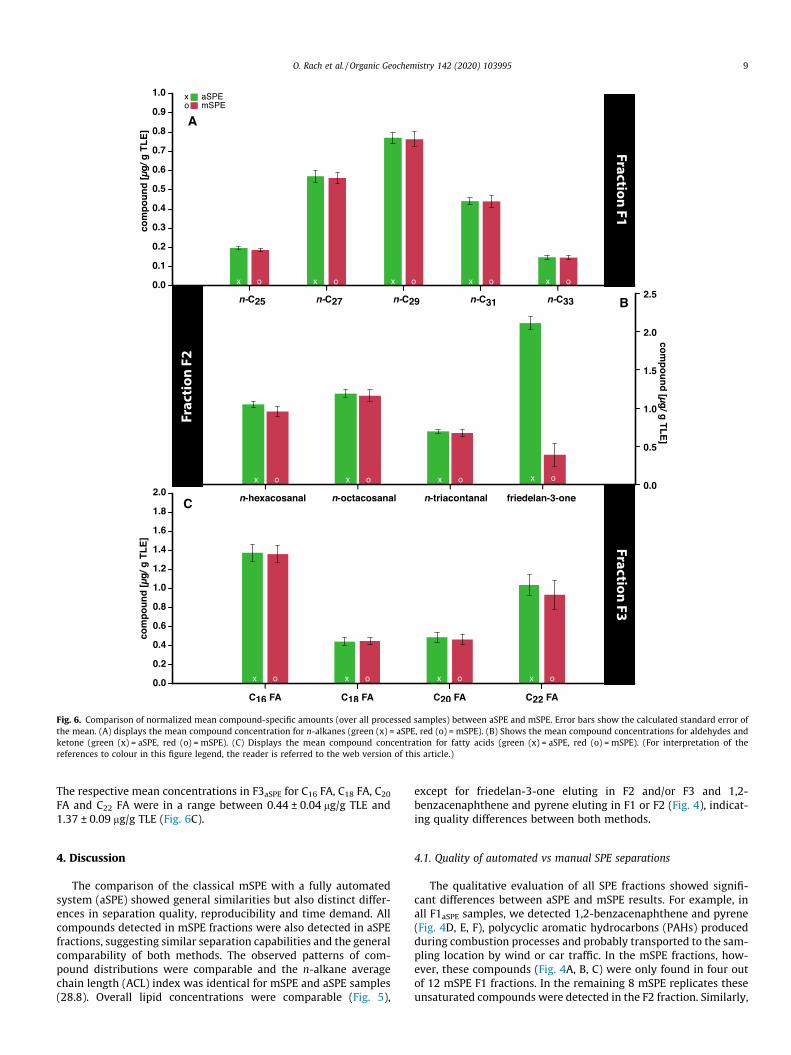
Fig. 6. Comparison of normalized mean compound-specific amounts (over all processed samples) between aSPE and mSPE. Error bars show the calculated standard error ofthe mean. (A) displays the mean compound concentration for n-alkanes (green (x) = aSPE, red (o) = mSPE). (B) Shows the mean compound concentrations for aldehydes andketone (green (x) = aSPE, red (o) = mSPE). (C) Displays the mean compound concentration for fatty acids (green (x) = aSPE, red (o) = mSPE). (For interpretation of thereferences to colour in this figure legend, the reader is referred to the web version of this article.)
O. Rach et al. / Organic Geochemistry 142 (2020) 103995 9
The respective mean concentrations in F3aSPE for C16 FA, C18 FA, C20
FA and C22 FA were in a range between 0.44 ± 0.04 mg/g TLE and1.37 ± 0.09 mg/g TLE (Fig. 6C).
4. Discussion
The comparison of the classical mSPE with a fully automatedsystem (aSPE) showed general similarities but also distinct differ-ences in separation quality, reproducibility and time demand. Allcompounds detected in mSPE fractions were also detected in aSPEfractions, suggesting similar separation capabilities and the generalcomparability of both methods. The observed patterns of com-pound distributions were comparable and the n-alkane averagechain length (ACL) index was identical for mSPE and aSPE samples(28.8). Overall lipid concentrations were comparable (Fig. 5),
except for friedelan-3-one eluting in F2 and/or F3 and 1,2-benzacenaphthene and pyrene eluting in F1 or F2 (Fig. 4), indicat-ing quality differences between both methods.
4.1. Quality of automated vs manual SPE separations
The qualitative evaluation of all SPE fractions showed signifi-cant differences between aSPE and mSPE results. For example, inall F1aSPE samples, we detected 1,2-benzacenaphthene and pyrene(Fig. 4D, E, F), polycyclic aromatic hydrocarbons (PAHs) producedduring combustion processes and probably transported to the sam-pling location by wind or car traffic. In the mSPE fractions, how-ever, these compounds (Fig. 4A, B, C) were only found in four outof 12 mSPE F1 fractions. In the remaining 8 mSPE replicates theseunsaturated compounds were detected in the F2 fraction. Similarly,
10 O. Rach et al. / Organic Geochemistry 142 (2020) 103995
friedelan-3-one was detected in variable amounts in the mSPE F2and F3 fraction (Figs. 4, 5), indicating inconsistent separation intothe two more polar fractions. On the contrary, friedelan-3-oneeluted exclusively and in consistent concentrations in the F2 frac-tion of the aSPE, providing evidence for the superior reproducibil-ity of aSPE separations. Likely, inhomogeneities in the (manuallypacked) silica gel columns are better compensated by the con-trolled constant solvent flow of the aSPE compared to primarygravity-driven solvent flow in manual SPE. In summary, while dif-ferences in n-alkane distributions were not detected between bothmethods, aSPE did show a better reproducibility concerning themore polar compounds friedelan-3-one, 1,2-benzacenaphthene,and pyrene.
4.2. Quantitative differences between aSPE and mSPE
We observed only small differences in compound concentra-tions in a direct comparison between aSPE and mSPE, most ofwhich were not larger than the standard error of the replicateextractions. However, for both methods, we detected some varia-tions in compound output as a function of initial TLE weights.
When comparing the n-alkane concentrations (TLE normalizedamounts) of F1aSPE and F1mSPE we observed a small but signifi-cantly higher concentration (p-value less than 0.05, confidenceinterval always: 95%) for the 15 mg TLE sample than for all otherextracts (Fig. 5A). The F1(15)mSPE fraction contained 0.10 ± 0.02 mg/g TLE and F1(15)aSPE 0.07 ± 0.02 mg/g TLE more n-alkanes (summedconcentration of all quantified n-alkanes, mean value of threereplicates respectively) than the 20 mg, 25 mg, and 30 mg TLEsamples. For the 20 mg, 25 mg and 30 mg TLE samples the quanti-
-180
-175
-170
-165
-160
-155
-150
2 H v
s V
SM
OW
n-C25 n-C27 n-C29
compound (n-a
n-C 2
5
aSPE
mSP
E
a ba: mean ALL mSPE
b: only mSPE withPAHs in 1st fraction
c: mean ALL aSPE
d: only mSPE withoutPAHs in 1st fraction
A
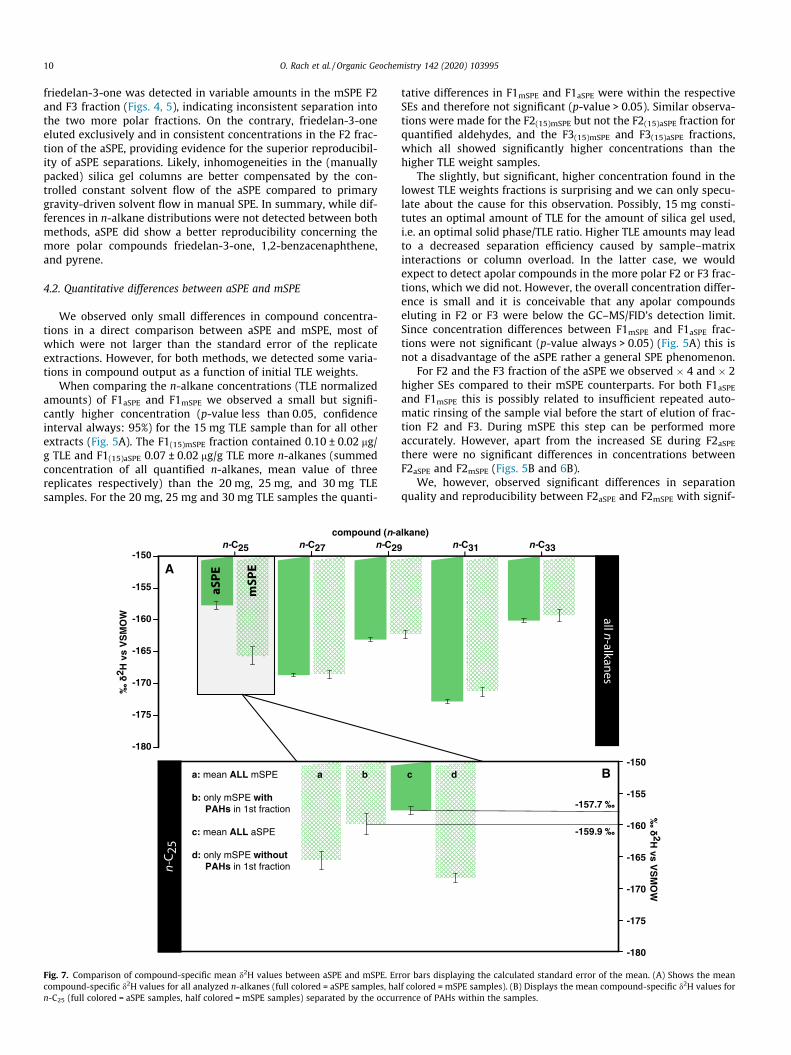
Fig. 7. Comparison of compound-specific mean d2H values between aSPE and mSPE. Ercompound-specific d2H values for all analyzed n-alkanes (full colored = aSPE samples, han-C25 (full colored = aSPE samples, half colored = mSPE samples) separated by the occur
tative differences in F1mSPE and F1aSPE were within the respectiveSEs and therefore not significant (p-value > 0.05). Similar observa-tions were made for the F2(15)mSPE but not the F2(15)aSPE fraction forquantified aldehydes, and the F3(15)mSPE and F3(15)aSPE fractions,which all showed significantly higher concentrations than thehigher TLE weight samples.
The slightly, but significant, higher concentration found in thelowest TLE weights fractions is surprising and we can only specu-late about the cause for this observation. Possibly, 15 mg consti-tutes an optimal amount of TLE for the amount of silica gel used,i.e. an optimal solid phase/TLE ratio. Higher TLE amounts may leadto a decreased separation efficiency caused by sample–matrixinteractions or column overload. In the latter case, we wouldexpect to detect apolar compounds in the more polar F2 or F3 frac-tions, which we did not. However, the overall concentration differ-ence is small and it is conceivable that any apolar compoundseluting in F2 or F3 were below the GC–MS/FID’s detection limit.Since concentration differences between F1mSPE and F1aSPE frac-tions were not significant (p-value always > 0.05) (Fig. 5A) this isnot a disadvantage of the aSPE rather a general SPE phenomenon.
For F2 and the F3 fraction of the aSPE we observed � 4 and � 2higher SEs compared to their mSPE counterparts. For both F1aSPE
and F1mSPE this is possibly related to insufficient repeated auto-matic rinsing of the sample vial before the start of elution of frac-tion F2 and F3. During mSPE this step can be performed moreaccurately. However, apart from the increased SE during F2aSPE
there were no significant differences in concentrations betweenF2aSPE and F2mSPE (Figs. 5B and 6B).
We, however, observed significant differences in separationquality and reproducibility between F2aSPE and F2mSPE with signif-
n-C31 n-C33
lkane)
-180
-175
-170
-165
-160
-155
-150
all n-alkanes
c d
-159.9 ‰
-157.7 ‰
B
2H vs V
SM
OW
ror bars displaying the calculated standard error of the mean. (A) Shows the meanlf colored = mSPE samples). (B) Displays the mean compound-specific d2H values forrence of PAHs within the samples.
O. Rach et al. / Organic Geochemistry 142 (2020) 103995 11
icantly lower amounts of friedelan-3-one detected in the F2mSPE
fraction (Fig. 5B), which suggests a superior separation qualityand reproducibility of these polar and unsaturated compounds inaSPE (Fig. 6B).
4.3. Compound-specific d2H results
Stable hydrogen isotope ratios (d2H values) of n-C25, n-C27, n-C29, n-C31, and n-C33 from the F1 fractions of mSPE and aSPE wereidentical within the SE for n-C27, n-C29, n-C31, and n-C33 but wereabout 8‰ more positive for n-C25 from the F1aSPE(�157.7 ± 0.6‰) compared to the F1mSPE sample(�165.6 ± 1.4‰.). This difference is significantly above analyticalaccuracy (Fig. 7A, B). Interestingly, n-C25 d2H values from F1mSPE
fractions containing 1,2-benzacenaphthene and pyrene (n = 4)were characterized with �159.9 ± 1.6‰ and were also more posi-tive than the mean of all F1mSPE samples. As such, the n-C25 d
2H val-ues for both aSPE and mSPE were identical if 1,2-benzacenaphthene and pyrene were present within the F1 fraction(Fig. 7B). Since 1,2-benzacenaphthene and pyrene are producedduring combustion processes they are expected to be deuterium-enriched, with more positive d2H ratios (between �70‰ and�95‰) compared to long-chain n-alkanes (Liu et al., 2006;Sachse et al., 2006; Sachse et al., 2012). Since the peaks of bothPAHs, as well as the peak of n-C25, were baseline separated fromadjacent compounds, coelution can be ruled out as a factor. Rather,we suggest the more positive d2H values of n-C25 when PAHs werepresent in the same fraction implies a possible memory effect onthe d2H value of the first eluting n-C25, but not on the later eluting
-180
-175
-170
-165
-160
-155
-15015 mg 20 mg
15 mg 20 mgTLE amo
-159.3 ‰
-162.2 ‰
-168.5 ‰
-171.2 ‰
auto
mat
ic S
PE
n-C 2
7n-
C 29
n-C 3
1n-
C 33
n-C 2
7n-
C 29
n-C 3
1n-
C 33A
2 H v
s V
SM
OW
Fig. 8. Comparison of compound-specific mean d2H values between aSPE and mSPE for d(A) Shows the compound-specific mean d2H values for different TLE weights from mSPweights from aSPE samples.
n-alkanes, as their d2H values were almost identical within the SEamong all other fractions. Such memory effects have beenobserved in GC–TC-IRMS systems and are related to the workingprinciples of current gas chromatography and coupled stable iso-tope mass spectrometers, likely due to adsorption of pyrolysisproducts in the high-temperature reactor (Wang and Sessions,2008). The magnitude of a memory effect varies as a function ofabsolute differences in isotope values between peaks. The distanceof the respective peaks, relative concentrations of those peaks(Wang and Sessions, 2008) as well as reactor age and other analyt-ical conditions. Interestingly, d2H values of n-alkanes are notaffected by the proposed PAH memory effect (n-C27, n-C29, n-C31,and n-C33) the mean SE (0.30 ± 0.02‰) was 2.3 times lower foraSPE samples compared to mSPE samples (0.70 ± 0.06‰) (Fig. 7A)(Fig. 8A, B). This provides another example of the better separationquality of aSPE samples. Possibly small variations in sample back-ground, which are not adequately separated in mSPE, can lead toslightly different d2H values. The observed lower SEs of aSPE d2Hvalues suggest superior reproducibility during replicate runs andtherefore a clear advantage of the aSPE method.
4.4. Procedure duration
Automated SPE in our three-fraction setup runs unattendedwith 9 subsequent samples analyzed in less than 14 h (ca.92 min/sample), leaving the user to perform other work or toimprove work-life balance. Also, aSPE separations can be run unat-tended overnight. Set up time, i.e. column and workplace prepara-tion, including preparation of solvent and chemicals is almost
25 mg 30 mg
-180
-175
-170
-165
-160
-155
-150
25 mg 30 mgunt
-160.1 ‰
-163.1 ‰
-168.6 ‰
-172.8 ‰
manual SPE
B
2H vs V
SM
OW
ifferent TLE weights. Error bars showing the calculated standard error of the mean.E samples. (B) Displays the compound-specific mean d2H values for different TLE
12 O. Rach et al. / Organic Geochemistry 142 (2020) 103995
identical for aSPE and mSPE. The manual separation procedure offour samples into three fractions (done by a trained and experi-enced technician) can be completed in one hour but requires con-stant personnel attendance during the procedure.
5. Conclusions
We present a new fully automated solid phase (aSPE)extraction-based purification procedure for lipid biomarkers usingthe Gilson ASPEC GX-271. We compare its separation quality,reproducibility, quantitative aspects and efficiency to a classicalmanual lipid purification procedure (mSPE) commonly used inorganic geochemical laboratories. Both methods deliver high-quality separation, but we find significant advantages for aSPE inseparation quality, reproducibility and use of time. We found a sig-nificantly improved separation quality for aSPE over mSPE, with aconsistent and reproducible separation of compounds into thethree fractions. In contrast, during mSPE runs some compounds(like 1,2-benzacenaphthene, pyrene and friedelan-3-one) elutedinto different fractions during replicate separations. Additionally,compound-specific (n-alkane) d2H measurements on those sam-ples showed significantly lower standard errors of aSPE samples,likely due to a better compound separation. We found no signifi-cant differences in the distribution or concentration of lipidsbetween aSPE and mSPE.
In general, both methods showed slightly higher compoundconcentrations for lower concentrations of TLEs, probably relatedto an overload of the SPE column for sample amounts � 20 mg.The efficiency between the manual and automated approach,which can be expressed in time per sample, can only be comparedwith limitations. Manual SPE allows the processing of several sam-ples in parallel while aSPE (in our setup) processes only one sampleat a time. Therefore, for mSPE the general output of samples pertime unit is higher but this is compensated by the fact that aSPEcan be performed unattended (for example overnight). The generalweighting of these aspects is surely individual and application-specific, but the significantly better separation quality, theresulting lower standard error of d2H values of aSPE separatedcompounds, as well as reproducibility, the unattended and simpleoperation of an aSPE make it attractive for applicationsand labs where high lipid biomarker separation output is needed(i.e. temporal high-resolution lipid biomarker studies).
Declaration of Competing Interest
The authors declare that they have no known competing finan-cial interests or personal relationships that could have appearedto influence the work reported in this paper.
Acknowledgements
This study was supported by an ERC Consolidator grant (STEEP-clim, Grant agreement No. 647035) to Dirk Sachse. We thank thereviewers for their helpful comments.
Associate Editor—Elizabeth Minor
References
Atwood, A.R., Sachs, J.P., 2012. Purification of dinosterol from complex mixtures ofsedimentary lipids for hydrogen isotope analysis. Organic Geochemistry 48, 37–46.
Curtin, L., D’Andrea, W.J., Balascio, N., Pugsley, G., de Wet, G., Bradley, R., 2019.Holocene and last interglacial climate of the Faroe Islands from sedimentaryplant wax hydrogen and carbon isotopes. Quaternary Science Reviews 223,105930.
Feakins, S.J., Wu, M.S., Ponton, C., Tierney, J.E., 2019. Biomarkers reveal abruptswitches in hydroclimate during the last glacial in southern California. Earthand Planetary Science Letters 515, 164–172.
Gamarra, B., Sachse, D., Kahmen, A., 2016. Effects of leaf water evaporative 2H-enrichment and biosynthetic fractionation on leaf wax n-alkane d2H values inC3 and C4 grasses. Plant, Cell & Environment 39, 2390–2403.
Gilson.com, 2019. https://de.gilson.com/DEDE/gx-271-aspec-dual-4260-with-z-drive.html.
Hoffmann, B., Kahmen, A., Cernusak, L.A., Arndt, S.K., Sachse, D., 2013. Abundanceand distribution of leaf wax n-alkanes in leaves of Acacia and Eucalyptus treesalong a strong humidity gradient in northern Australia. Organic Geochemistry62, 62–67.
Ladd, S.N., Sachs, J.P., 2012. Inverse relationship between salinity and n-alkane dDvalues in the mangrove Avicennia marina. Organic Geochemistry 48, 25–36.
Liu, W.G., Yang, H., Li, L.W., 2006. Hydrogen isotopic compositions of n-alkanes fromterrestrial plants correlate with their ecological life forms. Oecologia 150, 330–338.
McInerney, F.A., Helliker, B.R., Freeman, K.H., 2011. Hydrogen isotope ratios of leafwax n-alkanes in grasses are insensitive to transpiration. Geochimica etCosmochimica Acta 75, 541–554.
Nelson, D.B., Knohl, A., Sachse, D., Schefuß, E., Kahmen, A., 2017. Sources andabundances of leaf waxes in aerosols in central Europe. Geochimica etCosmochimica Acta 198, 299–314.
Poole, C.F., 2003. New trends in solid-phase extraction. TrAC Trends in AnalyticalChemistry 22, 362–373.
Rach, O., Brauer, A., Wilkes, H., Sachse, D., 2014. Delayed hydrological response toGreenland cooling at the onset of the Younger Dryas in western Europe. NatureGeoscience 7, 109–112.
Radke, M., Willsch, H., Welte, D.H., 1980. Preparative hydrocarbon group typedetermination by automated medium pressure liquid chromatography.Analytical Chemistry 52, 406–411.
Romero, I.C., Feakins, S.J., 2011. Spatial gradients in plant leaf wax D/H across acoastal salt marsh in southern California. Organic Geochemistry 42, 618–629.
Sachse, D., Billault, I., Bowen, G.J., Chikaraishi, Y., Dawson, T.E., Feakins, S.J.,Freeman, K.H., Magill, C.R., McInerney, F.A., van der Meer, M.T.J., Polissar, P.,Robins, R.J., Sachs, J.P., Schmidt, H.-L., Sessions, A.L., White, J.W.C., West, J.B.,Kahmen, A., 2012. Molecular paleohydrology: Interpreting the hydrogen-isotopic composition of lipid biomarkers from photosynthesizing organisms.Annual Review of Earth and Planetary Sciences 40, 221–249.
Sachse, D., Radke, J., Gleixner, G., 2006. dD values of individual n-alkanes fromterrestrial plants along a climatic gradient – Implications for the sedimentarybiomarker record. Organic Geochemistry 37, 469–483.
Sessions, A.L., 2006. Seasonal changes in D/H fractionation accompanying lipidbiosynthesis in Spartina alterniflora. Geochimica et Cosmochimica Acta 70,2153–2162.
Stout, P.R., Horn, C.K., Klette, K.L., 2001. Solid-phase extraction and GC–MS analysisof THC-COOH method optimized for a high-throughput forensic drug-testinglaboratory. Journal of Analytical Toxicology 25, 550–554.
Telepchak, M.J., August, T.F., Chaney, G.C., 2004. Forensic and Clinical Applicationsof Solid Phase Extraction. Humana Press, Totowa, NJ, USA.
Tierney, J.E., Oppo, D.W., Rosenthal, Y., Russell, J.M., Linsley, B.K., 2010. Coordinatedhydrological regimes in the Indo-Pacific region during the past two millennia.Paleoceanography 25, PA1102.
Vogts, A., Moossen, H., Rommerskirchen, F., Rullkötter, J., 2009. Distributionpatterns and stable carbon isotopic composition of alkanes and alkan-1-olsfrom plant waxes of African rain forest and savanna C3 species. OrganicGeochemistry 40, 1037–1054.
Wang, Y., Sessions, A.L., 2008. Memory effects in compound-specific D/H analysis bygas chromatography/pyrolysis/isotope-ratio mass spectrometry. AnalyticalChemistry 80, 9162–9170.
Wohlfarth, B., Luoto, T.P., Muschitiello, F., Väliranta, M., Björck, S., Davies, S.M.,Kylander, M., Ljung, K., Reimer, P.J., Smittenberg, R.H., 2018. Climate andenvironment in southwest Sweden 15.5–11.3 cal. ka BP. Boreas 47, 687–710.
Xu, L., Lee, H.K., 2008. Novel approach to microwave-assisted extraction and micro-solid-phase extraction from soil using graphite fibers as sorbent. Journal ofChromatography A 1192, 203–207.
Zelles, L., Bai, Q.Y., 1993. Fractionation of fatty acids derived from soil lipids by solidphase extraction and their quantitative analysis by GC-MS. Soil Biology andBiochemistry 25, 495–507.
Zhou, J., Wu, J., Ma, L., Abuduwaili, J., 2019. Late Quaternary environmental changerecord in biomarker lipid compositions of Lake Ebinur sediments, northwesternChina. International Journal of Earth Sciences 108, 2361–2371.