Embed Size (px)
Citation preview

State Auditor’s Office reports are available on the Internet at http://www.sao.texas.gov/.
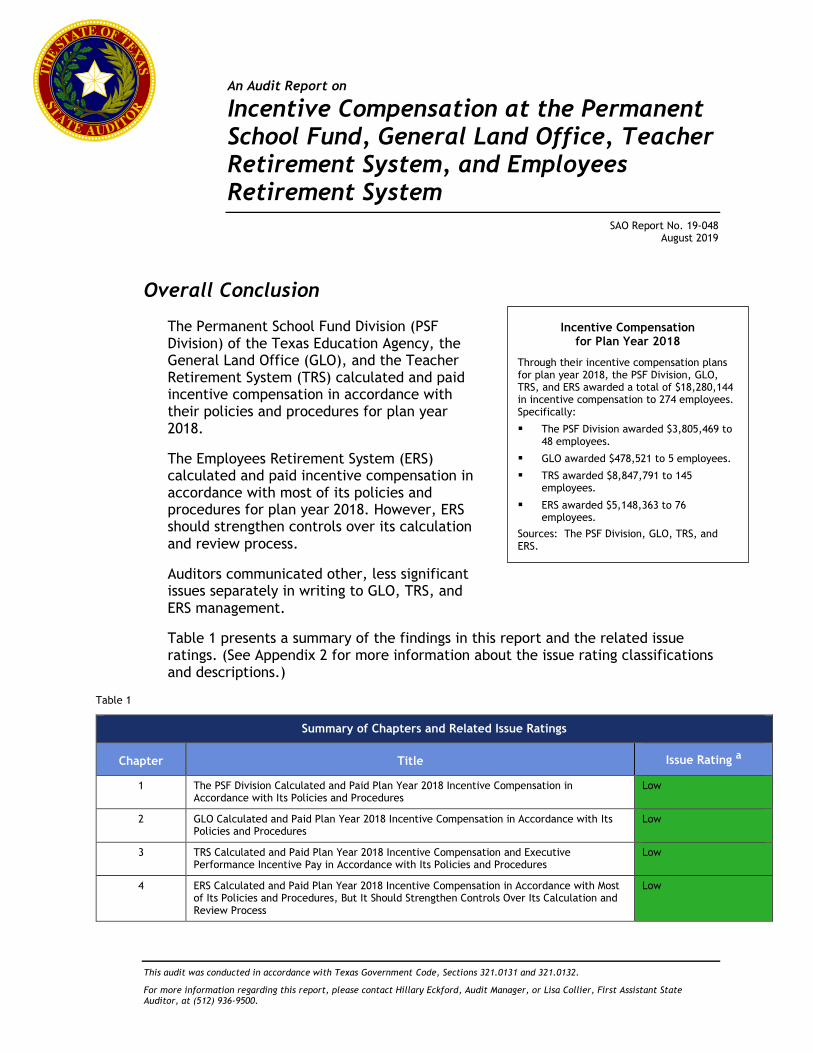
An Audit Report on
Incentive Compensation at the Permanent School Fund,
General Land Office, Teacher Retirement System,
and Employees Retirement System
August 2019 Report No. 19-048
An Audit Report on
Incentive Compensation at the Permanent School Fund, General Land Office, Teacher Retirement System, and Employees Retirement System
SAO Report No. 19-048 August 2019
This audit was conducted in accordance with Texas Government Code, Sections 321.0131 and 321.0132.
For more information regarding this report, please contact Hillary Eckford, Audit Manager, or Lisa Collier, First Assistant State Auditor, at (512) 936-9500.
Overall Conclusion
The Permanent School Fund Division (PSF Division) of the Texas Education Agency, the General Land Office (GLO), and the Teacher Retirement System (TRS) calculated and paid incentive compensation in accordance with their policies and procedures for plan year 2018.
The Employees Retirement System (ERS) calculated and paid incentive compensation in accordance with most of its policies and procedures for plan year 2018. However, ERS should strengthen controls over its calculation and review process.
Auditors communicated other, less significant issues separately in writing to GLO, TRS, and ERS management.
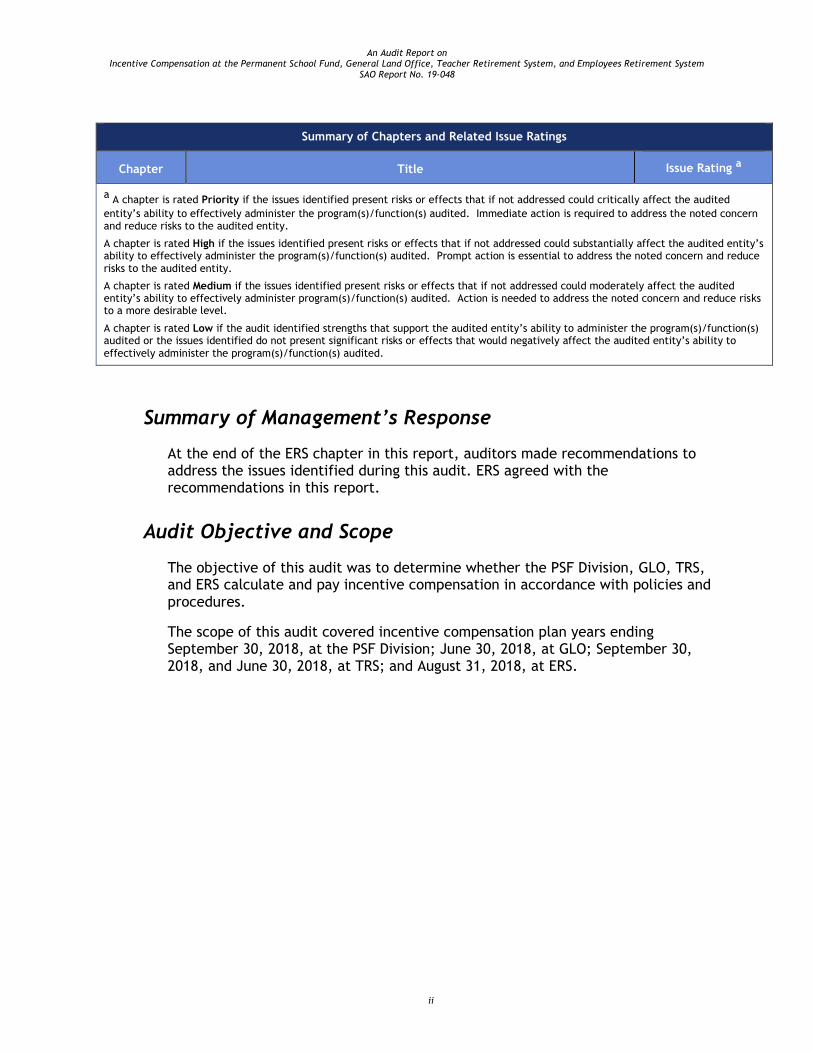
Table 1 presents a summary of the findings in this report and the related issue ratings. (See Appendix 2 for more information about the issue rating classifications and descriptions.)
Table 1
Summary of Chapters and Related Issue Ratings
Chapter Title Issue Rating a
1 The PSF Division Calculated and Paid Plan Year 2018 Incentive Compensation in Accordance with Its Policies and Procedures
Low
2 GLO Calculated and Paid Plan Year 2018 Incentive Compensation in Accordance with Its Policies and Procedures
Low
3 TRS Calculated and Paid Plan Year 2018 Incentive Compensation and Executive Performance Incentive Pay in Accordance with Its Policies and Procedures
Low
4 ERS Calculated and Paid Plan Year 2018 Incentive Compensation in Accordance with Most of Its Policies and Procedures, But It Should Strengthen Controls Over Its Calculation and Review Process
Low
Incentive Compensation for Plan Year 2018
Through their incentive compensation plans for plan year 2018, the PSF Division, GLO, TRS, and ERS awarded a total of $18,280,144 in incentive compensation to 274 employees. Specifically:
The PSF Division awarded $3,805,469 to 48 employees.
GLO awarded $478,521 to 5 employees.
TRS awarded $8,847,791 to 145 employees.
ERS awarded $5,148,363 to 76 employees.
Sources: The PSF Division, GLO, TRS, and ERS.
An Audit Report on Incentive Compensation at the Permanent School Fund, General Land Office, Teacher Retirement System, and Employees Retirement System
SAO Report No. 19-048
ii
Summary of Chapters and Related Issue Ratings
Chapter Title Issue Rating a
a A chapter is rated Priority if the issues identified present risks or effects that if not addressed could critically affect the audited
entity’s ability to effectively administer the program(s)/function(s) audited. Immediate action is required to address the noted concern and reduce risks to the audited entity.
A chapter is rated High if the issues identified present risks or effects that if not addressed could substantially affect the audited entity’s ability to effectively administer the program(s)/function(s) audited. Prompt action is essential to address the noted concern and reduce
risks to the audited entity.
A chapter is rated Medium if the issues identified present risks or effects that if not addressed could moderately affect the audited entity’s ability to effectively administer program(s)/function(s) audited. Action is needed to address the noted concern and reduce risks to a more desirable level.
A chapter is rated Low if the audit identified strengths that support the audited entity’s ability to administer the program(s)/function(s) audited or the issues identified do not present significant risks or effects that would negatively affect the audited entity’s ability to
effectively administer the program(s)/function(s) audited.
Summary of Management’s Response
At the end of the ERS chapter in this report, auditors made recommendations to address the issues identified during this audit. ERS agreed with the recommendations in this report.
Audit Objective and Scope
The objective of this audit was to determine whether the PSF Division, GLO, TRS, and ERS calculate and pay incentive compensation in accordance with policies and procedures.
The scope of this audit covered incentive compensation plan years ending September 30, 2018, at the PSF Division; June 30, 2018, at GLO; September 30, 2018, and June 30, 2018, at TRS; and August 31, 2018, at ERS.

Contents
Detailed Results
Chapter 1 The PSF Division Calculated and Paid Plan Year 2018 Incentive Compensation in Accordance with Its Policies and Procedures ........................................................ 1
Chapter 2 GLO Calculated and Paid Plan Year 2018 Incentive Compensation in Accordance with Its Policies and Procedures ............................................................. 3
Chapter 3 TRS Calculated and Paid Plan Year 2018 Incentive Compensation and Executive Performance Incentive Pay in Accordance with Its Policies and Procedures ................... 5
Chapter 4 ERS Calculated and Paid Plan Year 2018 Incentive Compensation in Accordance with Most of Its Policies and Procedures, But It Should Strengthen Controls Over Its Calculation and Review Process ................................. 9
Appendices
Appendix 1 Objective, Scope, and Methodology .............................. 14
Appendix 2 Issue Rating Classifications and Descriptions .................... 18
Appendix 3 Related State Auditor’s Office Work ............................. 19

An Audit Report on Incentive Compensation at the Permanent School Fund, General Land Office, Teacher Retirement System, and Employees Retirement System
SAO Report No. 19-048 August 2019
Page 1
Detailed Results
Chapter 1
The PSF Division Calculated and Paid Plan Year 2018 Incentive Compensation in Accordance with Its Policies and Procedures
The Permanent School Fund Division (PSF Division) of the Texas Education Agency calculated and paid incentive compensation for its plan year ending September 30, 2018, in accordance with its policies and procedures.
The PSF Division awarded a total of $3,805,469 in incentive compensation to 48 employees. The PSF Division awarded the most incentive compensation to its chief investment officer, who was awarded $297,574 payable during a three-year period. That $297,574 represented 7.8 percent of the $3,805,469 in total incentive compensation that PSF Division awarded.
The PSF Division calculates incentive compensation based on an employee’s achievement of performance goals related to total fund performance and the performance of the employee’s assigned asset classes, as applicable. With the exception of the performance of certain asset classes, both fund and asset class performance are calculated based on three-year rolling historical performance data. The PSF Division calculates incentive compensation awards using investment performance data reported on gross-of-fees basis (see text box for more information on gross-of-fees and net-of-fees).
The PSF Division awards incentive compensation if the performance of the total fund or the individual asset classes, as applicable, exceeds selected benchmarks. Total fund investment performance exceeded the target benchmark by 0.57 percent (57 basis points) (see text box for additional information on basis points) for the three-year period from October 1, 2015, to September 30, 2018.
The PSF Division pays incentive compensation awards for a plan year over a three-year installment schedule. Specifically, for most
employees, the PSF Division pays 50 percent of an incentive compensation
1 The risk related to the issues discussed in Chapter 1 is rated as Low because the audit identified strengths that support the audited entity’s ability to administer the program(s)/function(s) audited or the issues identified do not present significant risks or effects that would negatively affect the audited entity’s ability to effectively administer the program(s)/function(s) audited.
Chapter 1 Rating:
Low 1
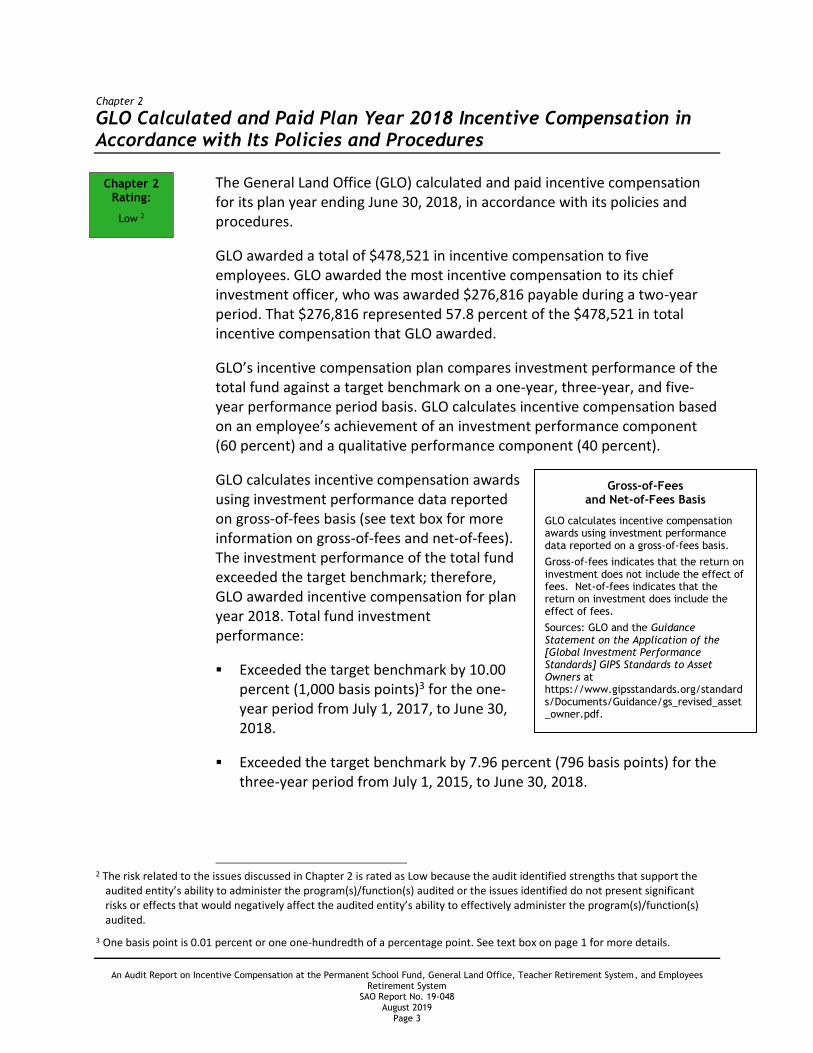
Gross-of-Fees and Net-of-Fees Basis
The PSF Division calculates incentive compensation awards using investment performance data reported on a gross-of-fees basis.
Gross-of-fees indicates that the return on investment does not include the effect of fees. Net-of-fees indicates that the return on investment does include the effect of fees.
Sources: The PSF Division and the Guidance Statement on the Application of the [Global Investment Performance Standards] GIPS Standards to Asset Owners (https://www.gipsstandards.org/standards/Documents/Guidance/gs_revised_asset_owner.pdf ).
Basis Points
One basis point is 0.01 percent or one one-hundredth of a percentage point.
Source: Morningstar, Inc. Web site at
http://www.morningstar.com/InvGlossary/basis_point_definiti
on_what_is.aspx.

An Audit Report on Incentive Compensation at the Permanent School Fund, General Land Office, Teacher Retirement System, and Employees Retirement System
SAO Report No. 19-048 August 2019
Page 2
award after the performance period for the current plan year, 25 percent of that award after the next plan year, and 25 percent of that award after the third plan year. As a result, an employee may receive an incentive award payment that consists of partial awards from three plan years.
Table 2 presents the positions eligible to earn incentive compensation according to the PSF Division’s incentive compensation plan, as well as the incentive compensation award, or award range, for each eligible position for plan year 2018.
Table 2
PSF Division Incentive Compensation Awards for Plan Year 2018
Eligible Position Incentive Compensation Award or Award Range a
Chief Investment Officer $297,574
Deputy Chief Investment Officer and Director of Fixed Income $247,382
Director of Private Markets $218,632
Director of Equities $217,534
Deputy Executive Administrator $203,417
Director of Global Risk Control Strategies $29,480 to $181,314
Portfolio Manager I - IV/Risk Manager $61,204 to $128,674
Director I - V $51,822 to $75,500
General Counsel V $54,859
Systems Analyst I - VII $16,185 to $53,160
Attorney I - VI $49,147
Investment Analyst I - IV $10,581 to $46,965
Business Analyst I - IV $40,511
Financial Analyst I - IV $16,253 to $33,603
Manager I - V $29,080
Accountant I - VII $20,409
Staff Services Officer I-V $11,379
Program Specialist I - VII Position was vacant
Executive Assistant I - III Position was vacant
a Award range applies to multiple employees in an eligible position.
Source: The PSF Division.
Management’s Response
We wish to thank the SAO for the thorough and professional management of this audit.
An Audit Report on Incentive Compensation at the Permanent School Fund, General Land Office, Teacher Retirement System, and Employees Retirement System
SAO Report No. 19-048 August 2019
Page 3
Chapter 2
GLO Calculated and Paid Plan Year 2018 Incentive Compensation in Accordance with Its Policies and Procedures
The General Land Office (GLO) calculated and paid incentive compensation for its plan year ending June 30, 2018, in accordance with its policies and procedures.
GLO awarded a total of $478,521 in incentive compensation to five employees. GLO awarded the most incentive compensation to its chief investment officer, who was awarded $276,816 payable during a two-year period. That $276,816 represented 57.8 percent of the $478,521 in total incentive compensation that GLO awarded.
GLO’s incentive compensation plan compares investment performance of the total fund against a target benchmark on a one-year, three-year, and five-year performance period basis. GLO calculates incentive compensation based on an employee’s achievement of an investment performance component (60 percent) and a qualitative performance component (40 percent).
GLO calculates incentive compensation awards using investment performance data reported on gross-of-fees basis (see text box for more information on gross-of-fees and net-of-fees). The investment performance of the total fund exceeded the target benchmark; therefore, GLO awarded incentive compensation for plan year 2018. Total fund investment performance:
Exceeded the target benchmark by 10.00percent (1,000 basis points)3 for the one-year period from July 1, 2017, to June 30,2018.
Exceeded the target benchmark by 7.96 percent (796 basis points) for thethree-year period from July 1, 2015, to June 30, 2018.
2 The risk related to the issues discussed in Chapter 2 is rated as Low because the audit identified strengths that support the audited entity’s ability to administer the program(s)/function(s) audited or the issues identified do not present significant risks or effects that would negatively affect the audited entity’s ability to effectively administer the program(s)/function(s) audited.
3 One basis point is 0.01 percent or one one-hundredth of a percentage point. See text box on page 1 for more details.
Chapter 2 Rating:
Low 2
Gross-of-Fees and Net-of-Fees Basis
GLO calculates incentive compensation awards using investment performance data reported on a gross-of-fees basis.
Gross-of-fees indicates that the return on investment does not include the effect of fees. Net-of-fees indicates that the return on investment does include the effect of fees.
Sources: GLO and the Guidance Statement on the Application of the [Global Investment Performance Standards] GIPS Standards to Asset Owners at https://www.gipsstandards.org/standards/Documents/Guidance/gs_revised_asset_owner.pdf.
An Audit Report on Incentive Compensation at the Permanent School Fund, General Land Office, Teacher Retirement System, and Employees Retirement System
SAO Report No. 19-048 August 2019
Page 4
Exceeded the target benchmark by 6.75 percent (675 basis points) for the five-year period from July 1, 2013, to June 30, 2018.
GLO pays incentive compensation awards for a plan year over a two-year installment schedule. Specifically, the plan pays 50 percent of an incentive compensation award after the performance period for the current plan year, and the remaining 50 percent of that award on the anniversary of the first payment. As a result, an employee may receive an incentive award payment that consists of partial awards from two plan years.
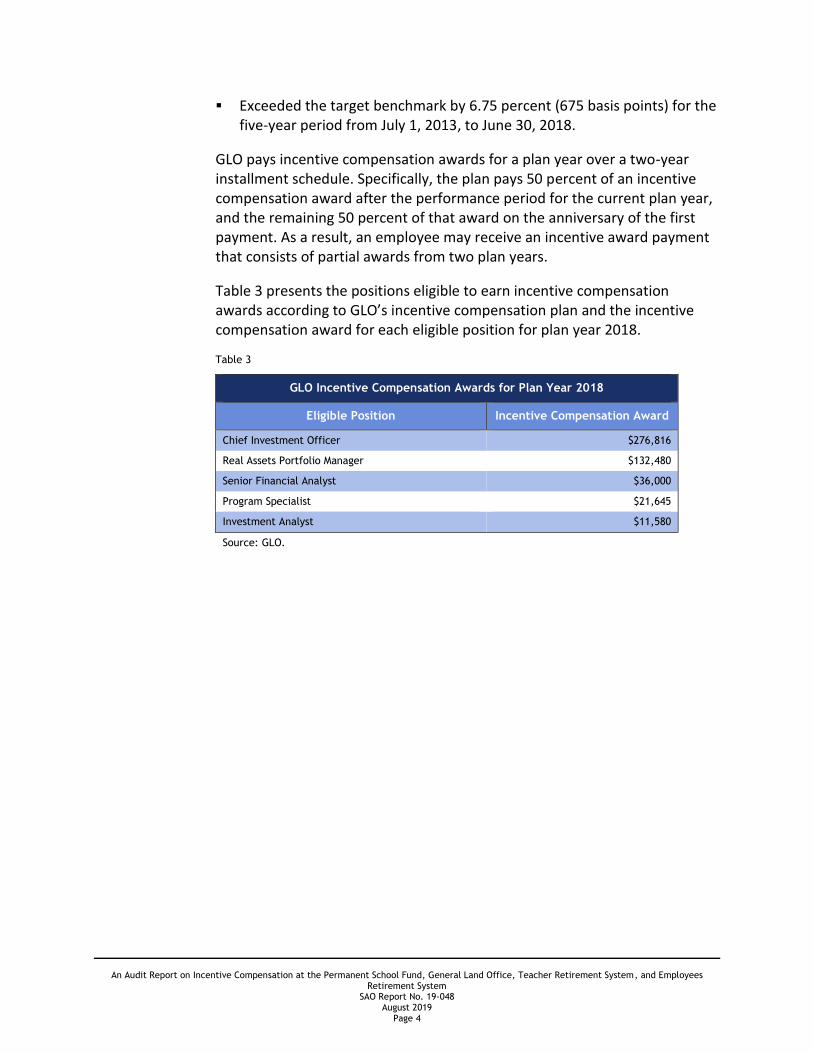
Table 3 presents the positions eligible to earn incentive compensation awards according to GLO’s incentive compensation plan and the incentive compensation award for each eligible position for plan year 2018.
Table 3
GLO Incentive Compensation Awards for Plan Year 2018
Eligible Position Incentive Compensation Award
Chief Investment Officer $276,816
Real Assets Portfolio Manager $132,480
Senior Financial Analyst $36,000
Program Specialist $21,645
Investment Analyst $11,580
Source: GLO.
An Audit Report on Incentive Compensation at the Permanent School Fund, General Land Office, Teacher Retirement System, and Employees Retirement System
SAO Report No. 19-048 August 2019
Page 5
Chapter 3
TRS Calculated and Paid Plan Year 2018 Incentive Compensation and Executive Performance Incentive Pay in Accordance with Its Policies and Procedures
Incentive Compensation Plan
The Teacher Retirement System (TRS) calculated and paid incentive compensation for its plan year ending September 30, 2018, in accordance with its policies and procedures.
TRS awarded a total of $8,745,710 in incentive compensation to 144 employees (excluding $102,081 awarded to the executive director as part of the separate executive performance incentive pay plan). TRS awarded the most incentive compensation to a senior managing director, who was awarded $294,006 payable during a two-year period. That $294,006 represented 3.4 percent of $8,745,710 in total incentive compensation that TRS awarded.
TRS awards incentive compensation based on an employee’s achievement of investment performance and qualitative performance components. The investment performance component consists of two categories: (1) performance measured against established benchmarks (50 percent) and (2) performance measured against selected peer groups (30 percent). The qualitative performance component (20 percent) measures an employee’s performance in a variety of areas, such as interpersonal relationship skills, accountability, and teamwork.
TRS’s plan measures investment performance for both the benchmark and peer group categories on a one-year (33 percent) and three-year (67 percent) performance period basis. TRS awards incentive compensation if investment performance exceeds selected benchmarks or peer group performance for the one-year or three-year performance periods.
TRS calculates incentive compensation awards using investment performance data reported on a net-of-fees basis for performance measured against established benchmarks and a blend of both gross-of-fees and net-of-
4 The risk related to the issues discussed in Chapter 3 is rated as Low because the audit identified strengths that support the
audited entity’s ability to administer the program(s)/function(s) audited or the issues identified do not present significant risks or effects that would negatively affect the audited entity’s ability to effectively administer the program(s)/function(s) audited.
Chapter 3 Rating:
Low 4

An Audit Report on Incentive Compensation at the Permanent School Fund, General Land Office, Teacher Retirement System, and Employees Retirement System
SAO Report No. 19-048 August 2019
Page 6
fees for performance measured against selected peer groups depending on the asset class (see text box for more information on gross-of-fees and net-of-fees). The total fund investment performance:
Exceeded the target benchmark by 0.61 percent (61 basis points)5 for the one-year period from October 1, 2017, to September 30, 2018.
Exceeded the target benchmark by 0.64 percent (64 basis points) for the three-year period from October 1, 2015, to September 30, 2018.
Moreover, TRS pays incentive compensation awards for a plan year over a two-year installment schedule. Specifically, TRS pays 50 percent of an incentive compensation award after the performance period for the current plan year, and it pays the remaining 50 percent of that award on the anniversary of the first payment. As a result, an employee may receive an incentive award payment that consists of partial awards from two plan years.
Table 4 on the next page presents the positions eligible to earn incentive compensation according to TRS’s incentive compensation plan and the incentive compensation award, or award range, for each eligible position for plan year 2018.
5 One basis point is 0.01 percent or one one-hundredth of a percentage point. See text box on page 1 for more details.
Gross-of-Fees and Net-of-Fees Basis
TRS calculates incentive compensation awards using investment performance data reported on a net-of-fees and gross-of-fees basis.
Gross-of-fees indicates that the return on investment does not include the effect of fees. Net-of-fees indicates that the return on investment does include the effect of fees.
Sources: TRS and the Guidance Statement on the Application of the [Global Investment Performance Standards] GIPS Standards to Asset Owners at https://www.gipsstandards.org/standards/Documents/Guidan
ce/gs_revised_asset_owner.pdf

An Audit Report on Incentive Compensation at the Permanent School Fund, General Land Office, Teacher Retirement System, and Employees Retirement System
SAO Report No. 19-048 August 2019
Page 7
Table 4
Source: TRS.
Executive Performance Incentive Pay Plan
TRS calculated and paid executive incentive compensation for its plan years ending June 30, 2018 (leadership award), and September 30, 2018 (investment oversight award), in accordance with its executive performance incentive pay plan (executive plan).
The executive director’s award for plan year 2018 was composed of a leadership award of $49,117 and an investment oversight award of $52,964, for a total award of $102,081 in incentive compensation. The TRS executive director was the only executive plan participant for the plan year.
Leadership Award. TRS awards executive incentive compensation for the leadership component based on an eligible participant’s total evaluation, which comprises four main qualitative performance categories, each representing 25 percent. Those qualitative performance categories are (1) member satisfaction, (2) leadership effectiveness, (3) operational effectiveness, and (4) employee engagement.
TRS Incentive Compensation Awards for Plan Year 2018
Eligible Position Incentive Compensation Award or Award Range a
Senior Managing Director $117,955 to $294,006
Senior Director $75,143 to $240,627
Chief Investment Officer $232,939
Deputy Chief Investment Officer $220,499
Managing Director $180,522 to $217,389
Director $89,589 to $149,996
Senior Investment Manager $17,776 to $149,006
Investment Manager $33,331 to $129,168
Senior Associate $9,116 to $87,107
Associate $6,246 to $38,945
Senior Analyst $3,582 to $25,386
Analyst $5,268 to $14,986
Junior Analyst $5,465
Administrative Assistant $1,233 to $2,092
a Award range applies to multiple employees in an eligible position.

An Audit Report on Incentive Compensation at the Permanent School Fund, General Land Office, Teacher Retirement System, and Employees Retirement System
SAO Report No. 19-048 August 2019
Page 8
Investment Oversight Award. For the 2018 executive plan, in addition to the leadership component, the TRS board of trustees added an investment oversight performance award, which is based on the one-year and three-year investment performance of the total fund.
TRS pays executive incentive compensation separately for each component over a two-year installment schedule. For both components, TRS pays 50 percent of an incentive compensation award the first year and it pays the remaining 50 percent of that award on the first anniversary of the first payment.
An Audit Report on Incentive Compensation at the Permanent School Fund, General Land Office, Teacher Retirement System, and Employees Retirement System
SAO Report No. 19-048 August 2019
Page 9
Chapter 4
ERS Calculated and Paid Plan Year 2018 Incentive Compensation in Accordance with Most of its Policies and Procedures, But It Should Strengthen Controls Over Its Calculation and Review Process
The Employees Retirement System (ERS) calculated and paid incentive compensation for its plan year ending August 31, 2018, in accordance with most of its policies and procedures. However, ERS should strengthen controls over its calculation and review process to ensure that it uses accurate performance data in its calculations. ERS should also develop and implement a process to consistently communicate and document the approval of changes it makes to its performance calculation methodologies.
ERS awarded a total of $5,148,363 in incentive compensation to 76 employees. ERS awarded the most incentive compensation to its chief investment officer, who was awarded $361,297 payable during a three-year period. That $361,297 represented 7.0 percent of the $5,148,363 in total incentive compensation that ERS awarded. In addition, members of the ERS board of trustees approved the executive director to participate in the incentive compensation plan for plan year 2018.
Award Calculation and Payment
ERS calculated and paid its incentive compensation awards in accordance with most of its policies and procedures. However, for certain performance goals, ERS did not consistently ensure that the quantitative performance data inputs used in its incentive compensation award calculations were accurate. Specifically, an inaccurate value in the calculation of internal expenses resulted in an overstatement of total relative trust fund investment performance and the subsequent over-award to 61 employees totaling $1,879. A separate error occurred when ERS calculated performance for an employee using the performance returns for a different employee, resulting in an under-award to that employee of $1,935. ERS used inaccurate values in calculations for other performance goals; however, those errors did not affect the amount of incentive compensation awarded.
ERS did not detect the errors discussed above in its reviews because its review process did not include an adequate review of the accuracy of performance calculations and the reliability of source data.
6 The risk related to the issues discussed in Chapter 4 is rated as Low because the audit identified strengths that support the
audited entity’s ability to administer the program(s)/function(s) audited or the issues identified do not present significant risks or effects that would negatively affect the audited entity’s ability to effectively administer the program(s)/function(s) audited.
Chapter 4 Rating:
Low 6

An Audit Report on Incentive Compensation at the Permanent School Fund, General Land Office, Teacher Retirement System, and Employees Retirement System
SAO Report No. 19-048 August 2019
Page 10
Performance Calculation Methodologies
ERS’s incentive compensation plan for the plan year ending August 31, 2018, which was approved by members of the ERS board of trustees, included brief descriptions of ERS’s performance calculation methodologies. For performance goals related to certain alternative investments, ERS also communicated detailed calculation methodologies to executive management and obtained a documented approval in a separate memo.
However, for other performance goals, ERS revised the methodology it used to calculate performance from the prior plan year without communicating or obtaining documented approval for those changes from ERS’s executive management. While not required by ERS’s policies and procedures, a process to consistently communicate and document approval of significant performance calculation methodology changes would strengthen governance over ERS’s administration of its incentive compensation plan.
The methodology changes discussed above increased total incentive compensation awarded to 7 employees by $22,744 and decreased total incentive compensation awarded to 2 employees by $1,788.
Policies and Procedures
For plan year 2018, ERS changed its process for calculating incentive compensation by developing a database to calculate and track incentive compensation awards and payments and making changes in the personnel responsible for the administration of ERS’s incentive compensation plan. As a result, certain incentive compensation policies and procedures were still in draft form as of April 2019 or needed updating to reflect ERS’s current processes. Using outdated or draft policies and procedures increases the risk of awarding and paying inaccurate incentive compensation.
Plan Information
ERS awards incentive compensation based on an employee’s achievement of qualitative and quantitative performance goals. The qualitative performance goal represents 25 percent of the employee’s overall participant goals. The quantitative performance goals represent the remaining 75 percent of that employee’s overall participant goals, with a minimum of 25 percent of the overall participant goals to be evaluated based on relative trust fund performance.
For the executive director, the overall participant goals consist of a quantitative component (50 percent) based on relative trust fund performance and a qualitative component (50 percent) reflecting performance in overall agency leadership, management, communications,

An Audit Report on Incentive Compensation at the Permanent School Fund, General Land Office, Teacher Retirement System, and Employees Retirement System
SAO Report No. 19-048 August 2019
Page 11
policy matters, staff development, and the implementation of agency strategic initiatives.
ERS calculates incentive compensation awards using investment performance data reported on a net-of-fees basis (see text box for more information on gross-of-fees and net-of-fees). ERS calculates the investment performance goals based on (1) an employee’s achievement of benchmarks related to the relative trust fund performance and (2) the performance of the employee’s assigned asset classes, individual portfolios, or individual research coverage for one-year, three-year, and five-year periods, depending on the employee’s length of service. The total relative trust fund investment performance:
Exceeded the target benchmark by 1.63 percent (163 basis points)7 for the one-year period from September 1, 2017, to August 31, 2018.
Exceeded the target benchmark by 0.27 percent (27 basis points) for the three-year period from September 1, 2015, to August 31, 2018.
Exceeded the target benchmark by 0.38 percent (38 basis points) for the five-year period from September 1, 2013, to August 31, 2018.
ERS pays incentive compensation awards for a plan year over a three-year installment schedule. For most employees, ERS pays 50 percent of an incentive compensation award after the performance period for the current plan year, 25 percent of that award after the next plan year, and 25 percent of that award after the third plan year. As a result, an employee may receive an incentive award payment that consists of partial awards from three plan years.8
Table 5 on the next page presents the positions eligible to earn incentive compensation according to ERS’s incentive compensation plan and the incentive compensation award, or award range, for each eligible position for plan year 2018.
7 One basis point is 0.01 percent or one one-hundredth of a percentage point. See text box on page 1 for more details.
8 For investment operations specialists, ERS pays 50 percent of an incentive compensation award after the performance period for the current plan year, and it pays the remaining 50 percent of that award after the next plan year. For investment administrative support staff, ERS pays 100 percent of an incentive compensation award after the performance period for the current plan year.
Gross-of-Fees and Net-of-Fees Basis
ERS calculates incentive compensation awards using investment performance data reported on a net-of-fees basis.
Gross-of-fees indicates that the return on investment does not include the effect of fees. Net-of-fees indicates that the return on investment does include the effect of fees.
Sources: ERS and the Guidance Statement on the Application of the [Global Investment Performance Standards] GIPS Standards to Asset Owners at https://www.gipsstandards.org/standards/Documents/Guidanc
e/gs_revised_asset_owner.pdf.

An Audit Report on Incentive Compensation at the Permanent School Fund, General Land Office, Teacher Retirement System, and Employees Retirement System
SAO Report No. 19-048 August 2019
Page 12
Table 5
ERS Incentive Compensation Awards for Plan Year 2018
Eligible Position Incentive Compensation Award or
Award Range a
Chief Investment Officer $361,297
Asset Class Portfolio Managers/Directors $105,386 to $243,376
Executive Director $232,070
Deputy Chief Investment Officer $147,983
General Counsel $141,118
Supervising Portfolio Manager $86,982 to $137,791
Investment and Securities, Attorney $106,841 to $117,011
Portfolio Manager I - V $27,055 to $108,942
Chief Trader I - II $71,307
Director of Investment Services $71,127
Investment Analyst III - IV $22,054 to $63,735
Risk Management and Applied Research Portfolio Manager
$59,041
Trader I - II $43,740
Investment Analyst I - II $2,331 to $23,110
Financial Analyst I-IV (Investment Operations Specialist)
$5,137 to $20,114
Investment Administrative Support $971 to $3,250
Investment and Securities, Paralegal Position was vacant
a Award range applies to multiple employees in an eligible position.
Source: ERS.
Recommendations
ERS should:
Strengthen controls over its incentive compensation calculation and review process to include a review of the accuracy of performance calculations and reliability of source data.
Develop and implement a process to communicate and document the approval of changes it makes to its performance calculation methodologies.
Update its incentive compensation policies and procedures to reflect its current processes.

An Audit Report on Incentive Compensation at the Permanent School Fund, General Land Office, Teacher Retirement System, and Employees Retirement System
SAO Report No. 19-048 August 2019
Page 13
Management’s Response
ERS agrees with the recommendation to strengthen controls over the incentive compensation calculation and review process.
ERS will continue to enhance its controls and review processes to help ensure that payment amounts are accurate and align with the plan policies and procedures. Efforts to implement appropriate reviews and approvals into the process have begun. These improvements continue the progress management has made in recent years to strengthen controls around the ICP process.
Human Resources is working with the ICP program staff to finalize the updated and comprehensive procedural document for the ICP guidelines, the ICP database and the ICP procedures. We believe that identifying the key controls and control activities, enhancing the ICP Timeline and Task List, as well as establishing procedural checklists that include reviews and reconciling to the data source is beneficial and will afford a more efficient process for administering the plan.
In accordance to ERS’ Incentive Compensation Plan policy, the clawback provision will be exercised to recoup the overpayment(s) identified. In addition, ERS will process an incentive award payment adjustment for the understated award amount.
Responsible Position: Director of Human Resources
Implementation Date: December 1, 2019

An Audit Report on Incentive Compensation at the Permanent School Fund, General Land Office, Teacher Retirement System, and Employees Retirement System
SAO Report No. 19-048 August 2019
Page 14
Appendices
Appendix 1
Objective, Scope, and Methodology
Objective
The objective of this audit was to determine whether the Permanent School Fund (PSF Division) of the Texas Education Agency, the General Land Office (GLO), the Teacher Retirement System (TRS), and the Employees Retirement System (ERS) calculate and pay incentive compensation in accordance with policies and procedures.
Scope
The scope of this audit covered incentive compensation plan years ending September 30, 2018, at the PSF Division; June 30, 2018 at GLO; September 30, 2018, and June 30, 2018, at TRS, and August 31, 2018, at ERS.
Methodology
The audit methodology included collecting information and documentation from the audited agencies; reviewing incentive compensation plans, policies, procedures, and other guidance related to incentive compensations; and analyzing and evaluating data and the results of tests.
Auditors tested sample items to determine whether selected recipients were eligible to receive incentive compensation payments, payment calculation data inputs were correct, payment calculations were correct based on the terms of the incentive compensation plans, and payment amounts distributed to recipients were properly recorded and matched amounts calculated for each recipient.
Auditors reviewed incentive compensation plans, calculations, personnel files, payroll data, and externally calculated fund performance results to determine whether the audited agencies calculated and paid incentive compensation in accordance with their policies and procedures. Auditors also reviewed agreed-upon procedures to determine whether procedures performed were effective, including whether the agencies addressed all findings. Additionally, auditors tested access controls over the spreadsheets and data that the audited agencies used to calculate incentive compensation except at the PSF Division and GLO.

An Audit Report on Incentive Compensation at the Permanent School Fund, General Land Office, Teacher Retirement System, and Employees Retirement System
SAO Report No. 19-048 August 2019
Page 15
Data Reliability and Completeness
Auditors assessed the reliability of the incentive compensation award data used in this audit by tracing the data to supporting documentation and by reviewing access to the data. Auditors verified the completeness of the incentive compensation award data by comparing pay calculation information in the incentive compensation award spreadsheets the audited agencies used to calculate payments to payment data in the Uniform Statewide Accounting System and the Uniform Statewide Payroll/Personnel System. Auditors determined that the incentive compensation award data was sufficiently reliable for the purposes of this audit.
Sampling Methodology
Auditors selected risk-based samples of incentive compensation awards for testing for the PSF Division, TRS, and ERS incentive compensation plans. The sample items were not necessarily representative of the population; therefore, it would not be appropriate to project the test results to those populations.
Auditors tested the entire population of incentive compensation awards for the GLO incentive compensation plan and the TRS executive performance incentive pay plan.
Information collected and reviewed included the following:
Incentive compensation plan documentation at the PSF Division, GLO, TRS, and ERS.
TRS and ERS boards of trustees meeting minutes.
Incentive compensation payment calculation spreadsheets for incentive compensation plan years ending September 30, 2018, at the PSF Division; June 30, 2018, at GLO; September 30, 2018, and June 30, 2018, at TRS; and August 31, 2018, at ERS.
Incentive compensation recipients’ personnel files.
Payroll data related to incentive compensation recipients.
Investment performance reports from custodian banks.
Procedures and tests conducted included the following:
Interviewed management and key personnel at the PSF Division, GLO, TRS, and ERS.

An Audit Report on Incentive Compensation at the Permanent School Fund, General Land Office, Teacher Retirement System, and Employees Retirement System
SAO Report No. 19-048 August 2019
Page 16
Tested and recalculated recipients’ incentive compensation awards for incentive compensation plan years ending September 30, 2018, at the PSF Division; and June 30, 2018, at GLO; September 30, 2018, and June 30, 2018, at TRS; and August 31, 2018, at ERS.
Verified that incentive compensation award payments matched award calculations.
Reviewed and tested compliance with the audited agencies’ policies and procedures.
Reviewed access controls over the spreadsheets and data that TRS and ERS used to calculate incentive compensation.
Reviewed agreed-upon procedures of the audited agencies.
Criteria used included the following:
Section 44, Article III, Texas Constitution and related statutes.
Rider 13, page III-37, and Rider 20, page III-10, General Appropriations Act (85th Legislature).
Texas attorney general opinions related to incentive compensation.
The PSF Division’s Performance Incentive Pay Plan, effective October 1, 2017.
The PSF Division’s Investment Procedures Manual, amended June 2017.
GLO’s Performance Incentive Pay Plan, effective July 1, 2017.
GLO’s Investment Performance Plan Procedures.
TRS’s Performance Plan, effective October 1, 2017.
TRS’s Executive Performance Incentive Pay Plan, effective July 1, 2017, for the leadership performance period and October 1, 2017, for the investment oversight performance period.
TRS’s Executive Performance Plan: Policy/Procedures.
ERS’s Incentive Compensation Plan for Key Investment Professionals and Leadership Employees, effective September 1, 2017.
ERS’s Incentive Compensation Plan Procedure Reference – Human Resources.

An Audit Report on Incentive Compensation at the Permanent School Fund, General Land Office, Teacher Retirement System, and Employees Retirement System
SAO Report No. 19-048 August 2019
Page 17
ERS’s Analyst Attribution Returns Procedure.
Project Information
Audit fieldwork was conducted from April 2019 through July 2019. We conducted this performance audit in accordance with generally accepted government auditing standards. Those standards require that we plan and perform the audit to obtain sufficient, appropriate evidence to provide a reasonable basis for our findings and conclusions based on our audit objectives. We believe that the evidence obtained provides a reasonable basis for our findings and conclusions based on our audit objectives.
The following members of the State Auditor’s staff performed the audit:
Morgan Burandt, CPA (Project Manager)
Sonya Tao, CFE (Assistant Project Manager)
Adam Ryan
Daniel A. Thu
Ann E. Karnes, CPA (Quality Control Reviewer)
Hillary Eckford, CIA, CFE (Audit Manager)
An Audit Report on Incentive Compensation at the Permanent School Fund, General Land Office, Teacher Retirement System, and Employees Retirement System
SAO Report No. 19-048 August 2019
Page 18
Appendix 2
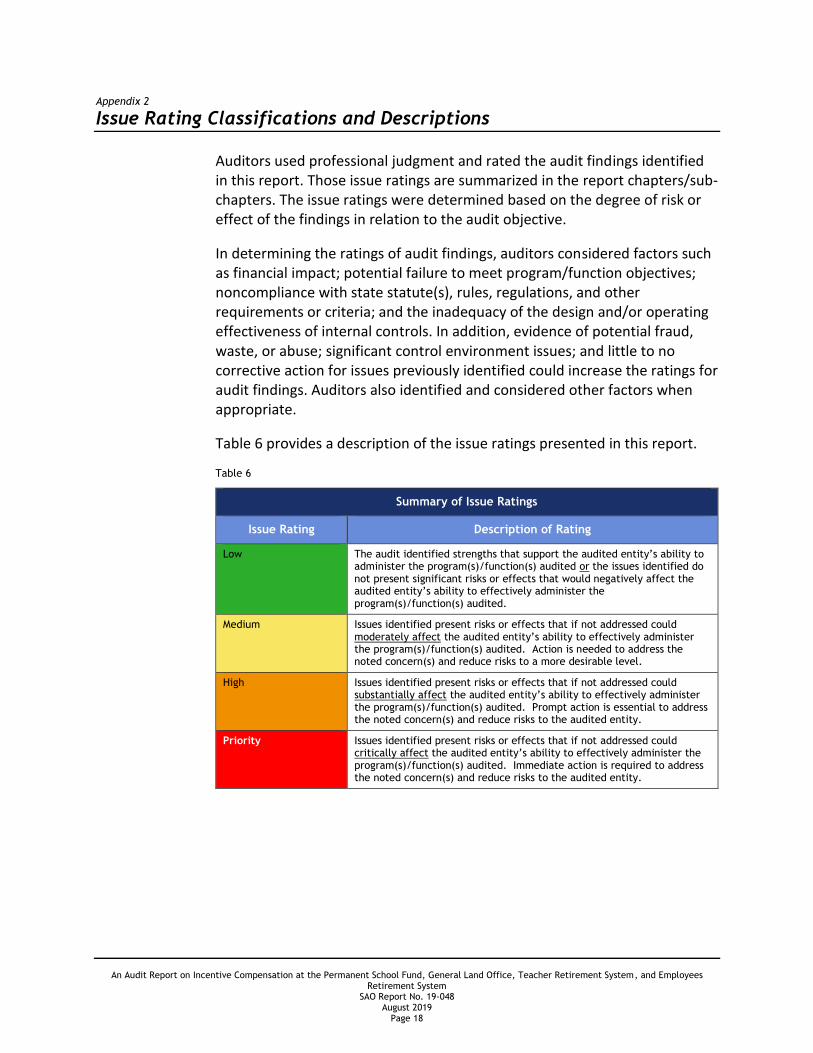
Issue Rating Classifications and Descriptions
Auditors used professional judgment and rated the audit findings identified in this report. Those issue ratings are summarized in the report chapters/sub-chapters. The issue ratings were determined based on the degree of risk or effect of the findings in relation to the audit objective.
In determining the ratings of audit findings, auditors considered factors such as financial impact; potential failure to meet program/function objectives; noncompliance with state statute(s), rules, regulations, and other requirements or criteria; and the inadequacy of the design and/or operating effectiveness of internal controls. In addition, evidence of potential fraud, waste, or abuse; significant control environment issues; and little to no corrective action for issues previously identified could increase the ratings for audit findings. Auditors also identified and considered other factors when appropriate.
Table 6 provides a description of the issue ratings presented in this report.
Table 6
Summary of Issue Ratings
Issue Rating Description of Rating
Low The audit identified strengths that support the audited entity’s ability to administer the program(s)/function(s) audited or the issues identified do not present significant risks or effects that would negatively affect the audited entity’s ability to effectively administer the program(s)/function(s) audited.
Medium Issues identified present risks or effects that if not addressed could moderately affect the audited entity’s ability to effectively administer the program(s)/function(s) audited. Action is needed to address the noted concern(s) and reduce risks to a more desirable level.
High Issues identified present risks or effects that if not addressed could substantially affect the audited entity’s ability to effectively administer the program(s)/function(s) audited. Prompt action is essential to address the noted concern(s) and reduce risks to the audited entity.
Priority Issues identified present risks or effects that if not addressed could critically affect the audited entity’s ability to effectively administer the program(s)/function(s) audited. Immediate action is required to address the noted concern(s) and reduce risks to the audited entity.
An Audit Report on Incentive Compensation at the Permanent School Fund, General Land Office, Teacher Retirement System, and Employees Retirement System
SAO Report No. 19-048 August 2019
Page 19
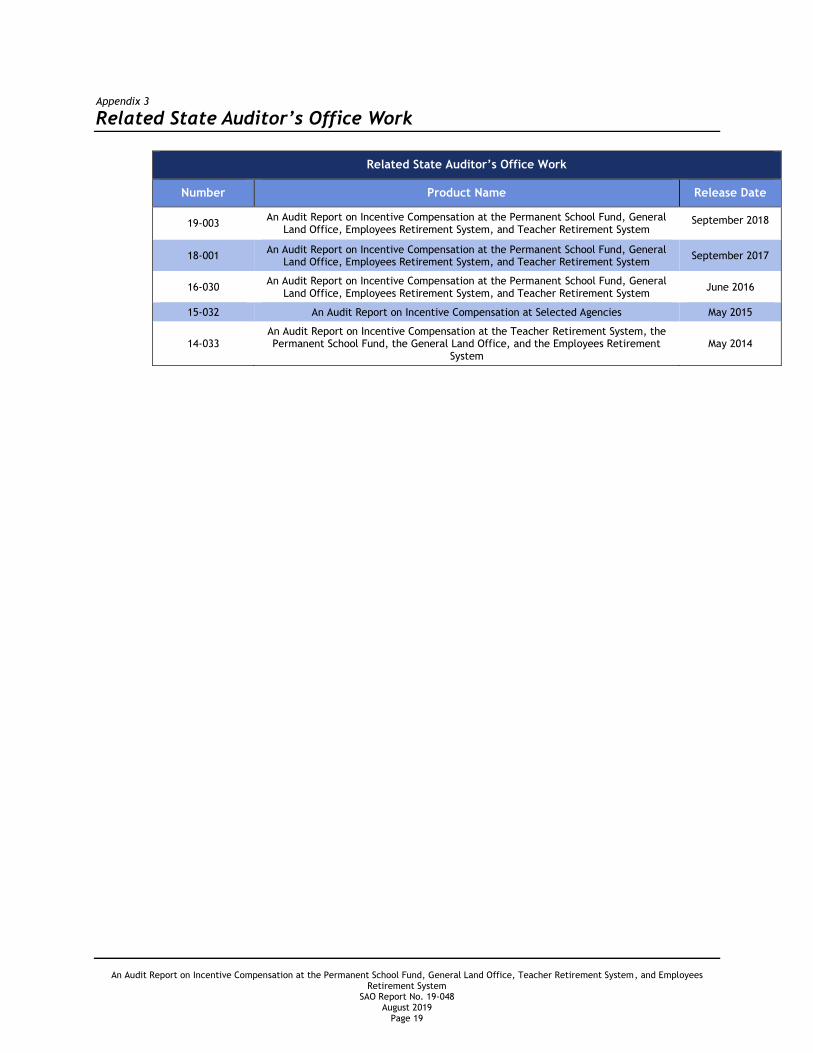
Appendix 3
Related State Auditor’s Office Work
Related State Auditor’s Office Work
Number Product Name Release Date
19-003 An Audit Report on Incentive Compensation at the Permanent School Fund, General
Land Office, Employees Retirement System, and Teacher Retirement System September 2018
18-001 An Audit Report on Incentive Compensation at the Permanent School Fund, General
Land Office, Employees Retirement System, and Teacher Retirement System September 2017
16-030 An Audit Report on Incentive Compensation at the Permanent School Fund, General
Land Office, Employees Retirement System, and Teacher Retirement System June 2016
15-032 An Audit Report on Incentive Compensation at Selected Agencies May 2015
14-033 An Audit Report on Incentive Compensation at the Teacher Retirement System, the Permanent School Fund, the General Land Office, and the Employees Retirement
System May 2014

Copies of this report have been distributed to the following:
Legislative Audit Committee The Honorable Dan Patrick, Lieutenant Governor, Joint Chair The Honorable Dennis Bonnen, Speaker of the House, Joint Chair The Honorable Jane Nelson, Senate Finance Committee The Honorable Robert Nichols, Member, Texas Senate The Honorable John Zerwas, House Appropriations Committee The Honorable Dustin Burrows, House Ways and Means Committee
Office of the Governor The Honorable Greg Abbott, Governor
Employees Retirement System Members of the Employees Retirement System Board of Trustees
Mr. I. Craig Hester, Chair Ms. Ilesa Daniels, Vice Chair Mr. Doug Danzeiser Dr. James Kee Ms. Catherine Melvin
Mr. Porter Wilson, Executive Director
General Land Office The Honorable George P. Bush, Land Commissioner and Chairman of the
School Land Board Members of the School Land Board
Mr. Gilbert Burciaga Mr. Scott Rohrman

Permanent School Fund Members of the State Board of Education
Ms. Donna Bahorich, Chair Mr. Marty Rowley, Vice Chair Mr. Ruben Cortez Jr., Secretary Mr. Lawrence A. Allen Jr. Ms. Barbara Cargill Ms. Aicha Davis Dr. Keven Ellis Ms. Patricia Hardy Ms. Pam Little Mr. Tom Maynard Ms. Sue Melton-Malone Mr. Ken Mercer Ms. Georgina Pérez Ms. Marisa B. Perez-Diaz Mr. Matt Robinson
Mr. Mike Morath, Commissioner of Education
Teacher Retirement System Members of the Teacher Retirement System Board of Trustees
Mr. Jarvis V. Hollingsworth, Chair Ms. Dolores Ramirez, Vice Chair Mr. Joe Colonnetta Mr. David Corpus Mr. John Elliott Dr. Greg Gibson Mr. Christopher Moss Mr. James Nance Ms. Nanette Sissney
Mr. Brian Guthrie, Executive Director

This document is not copyrighted. Readers may make additional copies of this report as needed. In addition, most State Auditor’s Office reports may be downloaded from our Web site: www.sao.texas.gov. In compliance with the Americans with Disabilities Act, this document may also be requested in alternative formats. To do so, contact our report request line at (512) 936-9500 (Voice), (512) 936-9400 (FAX), 1-800-RELAY-TX (TDD), or visit the Robert E. Johnson Building, 1501 North Congress Avenue, Suite 4.224, Austin, Texas 78701. The State Auditor’s Office is an equal opportunity employer and does not discriminate on the basis of race, color, religion, sex, national origin, age, or disability in employment or in the provision of services, programs, or activities. To report waste, fraud, or abuse in state government call the SAO Hotline: 1-800-TX-AUDIT.