Embed Size (px)
Citation preview
An attractor modelling approach to predicting system stability in barrier estuaries
E.J. McLean a and J.B. Hinwood b
a School of Earth and Environmental Sciences, University of Wollongong, Wollongong, NSW b Department of Mechanical and Aerospace Engineering, Monash University,Clayton, Melbourne, Victoria
Email: [email protected]
Abstract: An attractor modelling approach has been shown (Hinwood and McLean, 2015) to simulate the long term evolution and stability of barrier estuary entrances. From this a classification of estuaries, based on the stability of the entrance, may be made. For individual estuaries this modelling approach can be used to investigate system instability under different climate scenarios. Climate change will result in changed river flows and increased sea levels. These changes will affect the behaviour of barrier estuaries, which are frequently vulnerable to entrance instability or closure. To determine the effects of climate change on the entrance stability, extensive sets of simulations were made using a simple model of the estuary entrance dynamics.
The model used is based on a two-cell representation of the hydrodynamics and sediment transport in the entrance constriction. The attractors are found by running the model until a limit state is attained, usually about 2,000 tide cycles, for several thousand sets of initial conditions of non-dimensional river flow, Q, and entrance depth, h. The results of the modeling are shown on an "attractor map", which is a plot of Q against the final value of h. The map also shows the attractors, which are lines depicting the states to which the estuary evolves under the assumed conditions of tide, river flow and coastal sediment supply. For entrances where Q is less than a critical value, relatively small changes in river flow or sediment supply can push the estuary into the catchment of the river flow attractor and effectively close the entrance until a higher river flow or erosive wave condition scours the entrance.
The Snowy River Estuary is used as an application where we have previous 3D modelling results for similar scenarios. In this paper we use the attractor map to determine the effects of changes in the entrance stability and estuary regime for the pre and post Snowy Mountains Scheme plus predicted climate change scenarios that lead to changes in river flow and/or mean sea level for the years 2035 and 2100. The analyses show that the predicted rise in mean sea level is likely to reduce the stability of the entrances. The predicted reduction in catchment flow is likely to have a small impact on the stability of estuary entrance with the main effect being the rise in sea level which leads to an increase in marine sediment being supplied to the entrance. The attractor approach is shown to provide additional information on the response of an estuary to a range of conditions and can provide guidance on the selection of specific cases for detailed study.
The Pre-SMS entrance condition is shown to have been essentially stable but the removal of the upper catchment by the Snowy Mountains Scheme has increased the vulnerability of the entrance to closure. The effects of reductions in catchment flows predicted under climate change appear to have been exacerbated by expected increases in inter-tidal area in the estuary through sea level rise, which will lead to an increase in the influx of marine sand to the entrance. Thus, over the period up to 2100 the entrance will stay well within the vulnerable zone.
Attractor modelling has been shown as a useful tool to represent the entrance state and potential trajectory of barrier estuaries with a significant river inflow. The construction of an attractor map for an estuary can provide the basis for management decisions where periodic entrance constriction impacts on the amenity and function of the estuary. Attractor modelling can contribute strongly to the development of a Decision Support Structure that includes projected estuary state, expanding on the reactive measures possible when only monitoring methods are available.
Keywords: Barrier estuary, attractors, modelling
21st International Congress on Modelling and Simulation, Gold Coast, Australia, 29 Nov to 4 Dec 2015 www.mssanz.org.au/modsim2015
1338

McLean & Hinwood, An attractor modelling approach to predicting system stability in barrier estuaries
1. INTRODUCTION
The barrier, or bar-built estuary occurs widely in temperate latitudes, typically on the coasts of drier countries such as Australia, South Africa, Spain and Argentina where rivers may be small and have highly variable flows (Cooper, 2001, Haines, et al., 2005). They usually comprise a tidal body of water partially enclosed by a barrier at the seaward end and linked to the ocean by a constricted inlet. The tidal basin may receive flow from one or more rivers and tides in the basin are strongly influenced by the entrance constriction, which, in turn, is significantly influenced by flows and sediment supply from both the river and the ocean. The entrance dimensions control the tidal, salinity and water quality regimes within the estuary and, hence, the likely future trajectory towards a stable opening or closure. Where entrances are prone to severe restriction and periodic closure they are often the subject of management measures to reinstate flows into and out of the estuary. An entrance tending to closure will impede or prevent navigation, and will reduce water exchange with the sea, reducing water quality. If the entrance is nearly closed, these effects will be exacerbated with significant effects on water quality, and the mean water level in the estuary will be raised, drowning low-lying assets such as access roads and sewer outfalls. Planning and funding remedial works usually requires a significant lead-time and the trajectory and timing of entrance restriction would provide useful information for managers, facilitating the construction of a decision support system for entrance management. Monitoring of entrance condition can provide some information but prediction of future entrance states requires a modelling approach, specific to the individual estuary.
An attractor modelling approach has been shown to be an effective method of studying the stability of complex systems (Thompson and Stewart, 1986), and has been applied by Hinwood and McLean (2015) to simulate the stability of barrier estuary entrances. From this a classification of estuaries may be made. For individual estuaries this modelling approach can be used to investigate system instability under different climate change scenarios and increasing sea levels. These changes will affect the behaviour of barrier estuaries, increasing vulnerability to entrance instability or closure.
In this paper we use an attractor modelling approach (HydSed) to characterize the non-linear dynamics of a barrier estuary entrance and construct an attractor map to determine the effects of changes in the entrance stability and estuary regime for several climate change scenarios that lead to changes in river flow and/or mean sea level. Extensive sets of simulations are made using a simple model of the estuary entrance dynamics. The Snowy River Estuary is used as an application where we have previous 3D modelling results for similar scenarios. The flow regime of the Snowy River has been dramatically altered by the construction of the dams and water diversions of the Snowy Mountains Scheme (SMS), which was completed in 1965. The changes from pre-SMS to post-SMS are simulated.
2. FORMULATION OF THE HYDSED MODEL
The model used is based on a two-cell representation of the hydrodynamics and sediment transport in the entrance constriction. The hydrodynamic processes that drive the system are the ocean tide and the catchment inflows. Sediment processes modelled are transports of sediment to or from the ocean and to or from the tidal basin by the currents, and scour or deposition in the entrance channel. The attractors are found by running the model until a limit state is attained, usually about 2,000 tide cycles, for several thousand sets of initial conditions of non-dimensional river flow, Q, and entrance depth, h. The results of the modelling are shown on an "attractor map", which is a plot of Q against the final value of h. The map also shows the attractors, which are lines depicting the states to which the estuary evolves under the assumed conditions of tide, river flow and coastal sediment supply. For entrances where Q is less than a critical value, relatively small changes in river flow or sediment supply can push the estuary into the catchment of the river flow attractor and effectively close the entrance until a higher river flow or erosive wave condition scours the entrance.
The deposition and scour in the entrance channel have been simulated based on the one-dimensional equations. The dominant source of sediment is from coastal sources, comprising longshore and onshore movement of sand under wave action. The sand supply is represented in the model by the concentration of sand in the incoming flood-tide water. Sediment supplied by the river is represented as a sediment concentration within the tidal basin. Equations (1 and 2) comprise the hydrodynamic module of HydSed and Eq. (3 and 4) the sediment module.
* *** * * *
* * *( )
8 2( ) o
u uu f K gu u y y
L Lt h y
∂ −= − − −∂ +
(1)
1339

McLean & Hinwood, An attractor modelling approach to predicting system stability in barrier estuaries
******
*
)( QuhyBdt
dyAb ++−= (2)
−
= 1
2
*
**
cu
umC (3)
( ) ****
*
*
Cuhyt
hL Δ+=
∂∂
(4)
ebbfor
floodfor***
***
b
o
CCC
CCC
−=Δ
−=Δ (5)
The variables and parameters are defined as follows: x* distance from the sea Ab plan area of the basin B* entrance channel breadth C* sediment concentration exiting the inlet section (may be flood or ebb directed depending on tide) Cb sediment concentration in the tidal basin Co sediment concentration of incoming ocean water, computed from representative longshore transport K loss coefficient of the entrance L the length of the entrance channel Q* river inflow T tidal period f bed friction factor g acceleration of gravity h* bed depth of inlet channel below ocean MWL m an empirical constant for rate of sediment pick up t* time
*cu threshold velocity for both pick up and deposition
y* basin waterlevel relative to ocean MWL *oy ocean water level relative to MWL
Non-dimensional variables:
B = B*/ao, C=C*/Co, oa
hh
*
= , obaA
TQQ *= ,
T
tt
*
= , bA
TBuu
4*= ,
oa
yy
*
= , o
oo a
yy
*
=
Equation (1) is the equation of motion for the water in the entrance channel and Equation (2) is the continuity equation. Features of the hydrodynamic module that differentiate it from earlier work include the non-linear loss terms, the retention of both frictional and form loss resistances and, in the continuity equation, the depth-dependent entrance area, ( )* * *B h y+ , and river inflow.
Equation (3) determines the sediment concentration of the water in the channel, C, using an approximation to the du Boys formula (Hager, 2005). The sediment concentration of the flow leaving the entrance channel corresponds to the maximum transport capacity of the flow. These concentrations are then used in the sediment mass balance, Equation (4), to determine the new bed elevation.
The equations have been written in non-dimensional form, then simulated in the time domain using an efficient finite difference scheme in Mathworks MATLAB. The state of the estuary entrance at any time is specified in terms of the variables (y, h, u, C). All of the other parameters are held constant during each model run. Thus a set of model runs applies strictly to only one estuary. Typical values of the parameters for SE Australian barrier estuaries are given in Hinwood and McLean (2015); this data set enables one set of model runs to generate typical solutions for this group of estuaries.
Both hydrodynamic and sediment modules have been checked individually against previous validated models and then in the HydSed Model against field data (Hinwood et al., 2012; Hinwood and McLean, 2014). The
1340

McLean & Hinwood, An attractor modelling approach to predicting system stability in barrier estuaries
simplification of keeping tide and river inflow constant has been tested and shown to have little effect on the attractors (Baldwin et al., 2011).
2.1. Application of the model
To apply the HydSed model to produce an attractor map, a set of runs is made for a sufficiently long duration that a final steady state or limit cycle is reached. Each run is started with a different state, defined by the pair of values (h0, Q). Within each run, Q is held constant and the non-dimensional depth, h, evolves through scour and deposition. The usual end point is a limit cycle with some scour on the ebb tide, balanced by deposition on the flood tide. During this limit cycle, each of the dependent variables, y, h, u and C undergoes a periodic variation. The cycle may be shown as time series plots or as phase plane plots. The variation of h over the limit cycle is generally very small compared with its possible range and so the cyclic variations are generally neglected and an averaged value of h is used to define the attractors.
The end points of the model runs group into narrow bands or lines, termed attractors and are shown on Figure 1. Hinwood et al. (2012) identified two types of attractor. An attractor that occurred under almost all flow conditions and showed only weak dependence on the river flow they called the Tidal Attractor. They showed that this attractor corresponded to the empirical relationship between entrance area and tidal prism found by O'Brien (1931, 1969). The second attractor represented a new equilibrium state for low river flows, in which the bed of the entrance was near or above mean sea level and tidal action was limited to a period near the time of high water. This attractor was termed the River Flow Attractor because of the key role of the river flow in maintaining the entrance by increasing the ebb-tide velocities, despite the river flow being small. Between the two attractors lies the "watershed" that delimits the areas of attraction “catchments” to each of the Attractors. For considerations of navigation, tidal action and water exchange, an estuary in the River Flow Attractor state is effectively closed.
Figure 1. Attractor map showing "equilibrium states" of an estuary entrance; Snowy River Estuary Post-SMS.
The entrance states that are vulnerable to closure may be defined in a practical way as Q < Qs and h < h1, and as shown on Figure 1. Here h1 is the non-dimensional depth of the Tidal Attractor when Q=0 and has been used to approximate the attractor depth for 0 ≤ Q ≤ Qs.
3. THE SNOWY RIVER ESTUARY
The Snowy River begins in the Great Dividing Range in south-eastern New South Wales, flowing southward before entering eastern Bass Strait. Figure 2 shows the estuarine configuration. The total catchment of the Snowy River is approximately 13,700 km2 (Hinwood & McLean, 1999). The smaller Brodribb River joins the Snowy River in its estuarine reach. A Holocene barrier encloses a coastal lagoon system with a semi- permanent tidal entrance through the barrier near the small township of Marlo. The location and dimensions of the entrance are a function of the interaction between catchment inflows, tidal flows and the coastal processes.
The entrance configuration is one of the main variables controlling the hydrodynamics of the estuary. The estuary entrance regulates the degree to which marine and coastal processes can influence the estuarine
1341

McLean & Hinwood, An attractor modelling approach to predicting system stability in barrier estuaries
circulation and salt distribution (McLean and Hinwood, 2015). Over the longer term the variables affecting entrance configuration are expected to be modified in association with climate and sea level changes predicted for this region. Decrease in catchment rainfall will reduce flows and rising sea level will alter estuary lagoon capacity through the flooding of low-lying land adjacent to the present lagoon boundaries.
Figure 2. The Snowy River Estuary.
4. MODEL SCENARIOS AND RESULTS
The scenarios modelled are specified in Table 1. They comprise the average pre-SMS conditions and two cases post-SMS: the 30 year average 1980-2010 and the 2000-2010 drought years. The Pre SMS scenario includes the natural flow regime which included the upper catchment of the Snowy River which was diverted under the SMS and no longer contributes to the estuary. Examination of the long term flow statistics derived a representative median flow of 3728 ML/d for the combined Snowy and Brodribb River inflows. The median flow for the Post-SMS (current regime) of 967 ML/d has been derived from the period 1980 to 2010. The 2035 median flows have been held at the current level, while lagoonal area is considered to increase slightly under sea level increase (CSIRO and Bureau of Meteorology, 2015). The 2100 median flow reflects a 3.8% reduction on present levels and has been extracted from CSIRO and Bureau of Meteorology (2015) for their median emissions scenario SRF4.5. The simplified assumption that the percentage flow reduction will be the same as the predicted rainfall reduction has been made. Table 1. Summary of Modelling Values and Resulting Entrance States. Quantity Units Pre-SMS Post-SMS Post-SMS Changed MSL only Changed MSL & Q*
1980-2010 2000-10 2035 2100 2035 2100Qs from attractor plot 0.233 0.233 0.233 0.233 0.233 0.233 0.233Ab km^2 9.0 9.0 9.0 12.0 21.8 12.0 21.8ao m 0.5 0.5 0.5 0.5 0.5 0.5 0.5Qs* m^3/s 23.5 23.5 23.5 31.4 56.8 31.4 56.8 River inflow for Q=Qs
ML/d 2029 2029 2029 2711 4912 2711 4912
Estuary stateQm* ML/d 3728 967 714 967 967 967 930Qm 0.428 0.111 0.082 0.083 0.046 0.083 0.044 Q for Qr=median flowState stable unstable unstable unstable unstable! unstable unstable!
4.1. The attractor map for the Snowy River Estuary
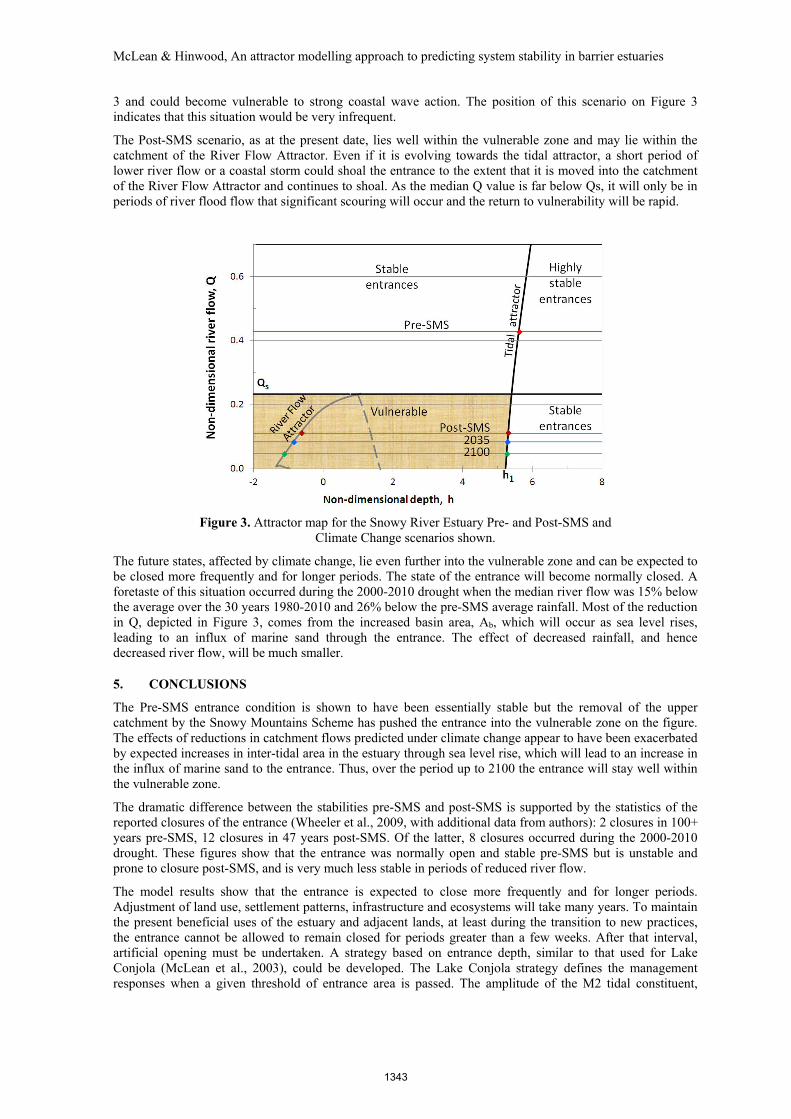
The results of the model simulations are shown on the attractor map of Figure 3. The depth of the estuary entrance under each scenario will evolve towards one of the attractors. For the Pre-SMS median flow scenario, the only attractor is the tidal attractor and represents a highly stable entrance. Of course, with the natural variation of river flow, in a prolonged drought the Pre-SMS estuary would move downward on Figure
1342
McLean & Hinwood, An attractor modelling approach to predicting system stability in barrier estuaries
3 and could become vulnerable to strong coastal wave action. The position of this scenario on Figure 3 indicates that this situation would be very infrequent.
The Post-SMS scenario, as at the present date, lies well within the vulnerable zone and may lie within the catchment of the River Flow Attractor. Even if it is evolving towards the tidal attractor, a short period of lower river flow or a coastal storm could shoal the entrance to the extent that it is moved into the catchment of the River Flow Attractor and continues to shoal. As the median Q value is far below Qs, it will only be in periods of river flood flow that significant scouring will occur and the return to vulnerability will be rapid.
Figure 3. Attractor map for the Snowy River Estuary Pre- and Post-SMS and Climate Change scenarios shown.
The future states, affected by climate change, lie even further into the vulnerable zone and can be expected to be closed more frequently and for longer periods. The state of the entrance will become normally closed. A foretaste of this situation occurred during the 2000-2010 drought when the median river flow was 15% below the average over the 30 years 1980-2010 and 26% below the pre-SMS average rainfall. Most of the reduction in Q, depicted in Figure 3, comes from the increased basin area, Ab, which will occur as sea level rises, leading to an influx of marine sand through the entrance. The effect of decreased rainfall, and hence decreased river flow, will be much smaller.
5. CONCLUSIONS
The Pre-SMS entrance condition is shown to have been essentially stable but the removal of the upper catchment by the Snowy Mountains Scheme has pushed the entrance into the vulnerable zone on the figure. The effects of reductions in catchment flows predicted under climate change appear to have been exacerbated by expected increases in inter-tidal area in the estuary through sea level rise, which will lead to an increase in the influx of marine sand to the entrance. Thus, over the period up to 2100 the entrance will stay well within the vulnerable zone.
The dramatic difference between the stabilities pre-SMS and post-SMS is supported by the statistics of the reported closures of the entrance (Wheeler et al., 2009, with additional data from authors): 2 closures in 100+ years pre-SMS, 12 closures in 47 years post-SMS. Of the latter, 8 closures occurred during the 2000-2010 drought. These figures show that the entrance was normally open and stable pre-SMS but is unstable and prone to closure post-SMS, and is very much less stable in periods of reduced river flow.
The model results show that the entrance is expected to close more frequently and for longer periods. Adjustment of land use, settlement patterns, infrastructure and ecosystems will take many years. To maintain the present beneficial uses of the estuary and adjacent lands, at least during the transition to new practices, the entrance cannot be allowed to remain closed for periods greater than a few weeks. After that interval, artificial opening must be undertaken. A strategy based on entrance depth, similar to that used for Lake Conjola (McLean et al., 2003), could be developed. The Lake Conjola strategy defines the management responses when a given threshold of entrance area is passed. The amplitude of the M2 tidal constituent,
1343

McLean & Hinwood, An attractor modelling approach to predicting system stability in barrier estuaries
calculated using a moving window is used as a surrogate for entrance area. Responses are, in order of decreasing area: no action//monitor closely//activate management plan//possible closure//imminent closure.
Attractor modelling has been shown as a useful tool to represent the entrance state and potential trajectory of barrier estuaries with a significant river inflow. The construction of an attractor map for an estuary can provide the basis for management decisions where periodic entrance constriction impacts on the amenity and function of the estuary. Attractor modelling can contribute strongly to the development of a Decision Support Structure that includes projected estuary state, expanding on the reactive measures possible when only monitoring methods are available.
ACKNOWLEDGEMENTS
The application of the attractor modelling to the Snowy River was partly supported by a research grant from the NSW Office of Water under the Snowy River Increased Flows program (SRIF).
REFERENCES
Baldwin, S., Hinwood, J.B. and McLean, E.J. (2011). Attractors for the entrance state of a tidal estuary in the presence of a multi-harmonic tide, Proc. 34th IAHR Congress, Brisbane, June 2011.
CSIRO and Bureau of Meteorology (2015). Climate Change in Australia Information for Australia’s Natural Resource Management Regions: Technical Report, CSIRO and Bureau of Meteorology, Canberra.
Cooper, J.A.G. (2001). Geomorphological variability among microtidal estuaries from the wave-dominated South African coast. Geomorphology 40, 99–122.
Hager, W.H. (2005). Du Boys and sediment transport, J. Hydraulic Research, 43(3) 227-233.
Haines, P.E., Tomlinson, R.B. and Thom, B.G. (2005). Morphometric assessment of intermittently open/closed coastal lagoons in New South Wales, Australia. Estuary, Coastal Shelf Sci. 67, 321-332.
Hinwood, J.B. and McLean, E.J. (1999). The Snowy River: a mature barrier estuary. Proceedings of the Royal Society of Victoria, Vol. 111 (2) pp 215-228.
Hinwood, J.B., McLean, E.J. and Wilson, B.C. (2012). Non-linear dynamics and attractors for the entrance state of a tidal estuary. Coastal Engineering, 61,20-26.
Hinwood, J.B. and McLean, E.J. (2014). Entrance changes in the Snowy River estuary in response to environmental flow releases. Australian Journal of Civil Engineering, Vol 12(1), Special issue on Coasts and Oceans, the Institution of Engineers Australia, 2014.
Hinwood, J.B. and McLean, E.J. (2015). Predicting the dynamics of intermittently closed/open estuaries using attractors, Coastal Engineering, 99: 64-72.
McLean, E.J. and Hinwood, J.B. (2015). Response of the Snowy River Estuary to two environmental flows, Proceedings of the Royal Society of Victoria, 125 (1), to appear.
McLean,E.J., McPherson, B.L. & Hinwood,J.B. (2003). A Decision Support Tool for prioritising remediation works in a catchment/estuarine bay system., MODSIM 2003 Congress, July 2003, Townsville, pp 548-553.
O’Brien, M. P. (1931). Estuary tidal prisms related to entrance areas. Civil Engineering, 1, 738-9.
O'Brien, M. P. (1969). Equilibrium flow areas of inlets on sandy coasts. J. Waterways Harbors Div., Amer. Soc. Civil Eng. 95, 43-52.
Thompson, J. and Stewart, H. (1986). Nonlinear Dynamics and Chaos. John Wiley and Sons, Chichester.Wheeler, P.J., Nguyen, Thi T., Peterson, J. and Gordon-Brown, L. (2009). Morphological change at the Snowy River ocean entrance, Victoria, Australia (1851–2008), Australian Geographer, 40(1), 1-28, DOI: 10.1080/00049180802656945
1344