Embed Size (px)
Citation preview
An association study between catalase -262C�T genepolymorphism, sodium-lithium countertrasport activity, insulinresistance, blood lipid parameters and their response to atorvastatin,in Greek dyslipidaemic patients and normolipidaemic controls
MARIA KOSMIDOU1, APOSTOLOS I. HATZITOLIOS1, DIMITRA MOLYVA2,
NIKOLAOS RAIKOS3, CHRISTOS SAVOPOULOS1, NIKI DAFERERA2,
VASSILEIOS KOKKAS2, & ANTONIS GOULAS2
11st Propedeutic Clinic, AHEPA University Hospital, 21st Department of Pharmacology, and 3Department of Forensic
Toxicology, Aristotle University Medical School, Thessaloniki 54124, Greece
(Received 12 November 2008; Accepted 27 January 2009)
AbstractThis study attempted to examine the effect of a functional catalase gene polymorphism, CAT-262C�T, on sodium-lithiumcountertransport (Na-Li CT) activity, insulin resistance determined as the homeostasis model assessment index (HOMA-IR), blood lipid parameters (cholesterol, triglycerides, low density lipoprotein cholesterol, high density lipoproteincholesterol, apolipoprotein B, apolipoprotein A-I) and their response to atorvastatin, in previously characterized Greekdyslipidaemic patients and normolipidaemic controls. Putative associations were examined by running univariate analyseswith a general linear model, using age, sex, smoking and hypertension as covariates. While no statistically significantassociations were detected between the CAT -262C�T polymorphism and either baseline values or their modulation byatorvastatin in the patient group, HOMA-IR values were significantly ( p�0.028) lower among CAT -262CC controlscompared to their T allele carrier counterparts. A trend towards higher plasma triglyceride values among CAT -262CCgenotypes was also detected, in both dyslipidaemic patients and normolipidaemic controls.
Keywords: Sodium-lithium countertransport, insulin resistance, blood lipids, catalase gene polymorphism, atorvastatin.
Introduction
Erythrocyte sodium-lithium countertransport activ-
ity (Na-Li CT), assayed in vitro, has been positively
associated with essential hypertension, dyslipidae-
mia, insulin resistance and diabetic neuropathy [1].
The mechanism(s) underlying these associations
remain largely unknown, as Na-Li CT has so far
eluded structural and genetic characterization,
despite intense efforts to the opposite [2]. By virtue
of its location on the erythrocyte membrane, Na-Li
CT is constantly exposed to an oxygen-rich environ-
ment and to the modifying interactions associated
with it. Reports that Na-Li CT kinetics are affected
by thiol alkylating agents [3], apolipoprotein E
genotype [4] and, possibly, glutathione S transferase
(GST) polymorphisms [5] are in line with a probable
physiological role of oxidative stress in modulating
Na-Li CT activity and could provide a molecular
explanation, at least in part, as to the associationof
the latter with the clinical conditions mentioned
above. We have recently shown that treatment of
dyslipidaemic patients with atorvastatin resulted in
significant reduction of erythrocyte Na-Li CT activ-
ity [6]. This reduction was independent of atorvas-
tatin’s lipid lowering activity and was only correlated
with a decrease in the patients’ insulin resistance [6].
Correspondence: Antonis Goulas, 1st Department of Pharmacology, Medical School, Aristotle University of Thessaloniki, 54124, Greece.Tel: �30-2310-280475. Fax: �30-2310-999303. Email: [email protected]
ISSN 1071-5762 print/ISSN 1029-2470 online # 2009 Informa UK Ltd.
DOI: 10.1080/10715760902783293
Free Radical Research, April 2009; 43(4): 385�389
Free
Rad
ic R
es D
ownl
oade
d fr
om in
form
ahea
lthca
re.c
om b
y U
nive
rsita
ets-
und
Lan
desb
iblio
thek
Due
ssel
dorf
on
08/2
9/13
For
pers
onal
use
onl
y.
Human catalase is a homotetramer, heme-con
taining enzyme which catalyses the breakdown of
H2O2 to H2O and O2. Catalase is highly active in
erythrocytes [7], attesting to its importance for the
antioxidative defense of these cells. CAT -262C�T
(rs1001179) is a common polymorphism located in
the promoter region of the human catalase gene,
affecting the binding of nuclear proteins as well as the
basal gene expression of catalase in various cells in
culture [8]. The T allele has been associated with
higher levels of the enzyme in blood, but, curiously
enough, with lower catalase activity in erythrocytes
[9�12]. The same polymorphism has been associated
with diabetic neuropathy in type 1 diabetic Russian
patients [13] but not with susceptibility to type 1
diabetes [14]. On the other hand, blood catalase
deficiency has been associated with diabetes in a
number of studies [15,16] and so has Na-Li CT [17].
There are no reports that we are aware of on the
association of CAT -262C�T polymorphism with
either Na-Li CT or insulin resistance, although dos
Santos et al. [18] examined recently the possibility of
an association of the same polymorphism with
diabetic complications in Brazilian patients of Cau-
casian origin with type 2 diabetes (T2D) and
concluded that there is no effect. Data on the effect
of CAT -262C�T on blood lipid parameters are
similarly scarce; with the exception of a single*negative*report from Hungary involving, again,
T2D patients [19], no other reference was found in
the literature.
In this report we describe a retrospective study of
the effect of the CAT -262C�T polymorphism on
basal Na-Li CT activity, insulin resistance and blood
lipid parameters, as well as on their change following
a 12 week-long treatment with atorvastatin [6], in a
small cohort of previously characterized Greek dysli-
pidaemic patients and normolipidaemic controls.
Materials and methods
A total of 54 Greek nationals of Greek descent,
residing in northern Greece, were included in this
study. All of them were examined in the outpatient
clinic of the 1st Propedeutic Clinic of AHEPA
University Hospital, Thessaloniki, from November
2004 to May 2006 and diagnosed with primary
dyslipidaemia [plasma cholesterol (CHOL)�6.22
mmol/l, low density lipoprotein cholesterol (LDL-
C)�4.14 mmol/l, triglycerides (TG)B2.82 mmol/l].
Almost half of these patients also suffered from mild
essential hypertension (140 mmHg5S.B.P.B160
mmHg, 90 mmHg5D.B.P.B100 mmHg). Further
details regarding diagnosis, inclusion and exclusion
criteria have been published elsewhere [6,20]. Treat-
ment with atorvastatin consisted of 20 mg of
the drug, p.o., once daily, for 12 weeks. A small
group of 25 normolipidaemic, mainly spousal control
individuals was also included in this study.
Demographic and laboratory characteristics are
presented in Table I. The principles of the Declara-
tion of Helsinki were strictly adhered to in this study.
Informed consent was obtained by all individuals
included.
Na-Li CT activity was measured according to the
original method developed by Canessa et al. [21],
which determines Li� efflux from isolated erythro-
cytes in Na�-free and Na�-rich medium. Insulin
resistance was determined by calculating the home-
ostasis model assessment index [HOMA-IR�fasting
insulin (mU/l)�fasting glucose (mmol/l)/22.5].
Plasma CHOL, HDL-C and TG levels were
determined by conventional enzymatic methods in a
Hitachi 912 analyser. LDL-C was calculated accord-
ing to the Friedewald et al. [22] equation. Apolipo-
protein A-I (ApoA-I) and apolipoprotein B (apoB)
were determined by immunoturbidometric methods
(Turbiquant†, TurbiTime System, Dade Behring,
Newark, DE).
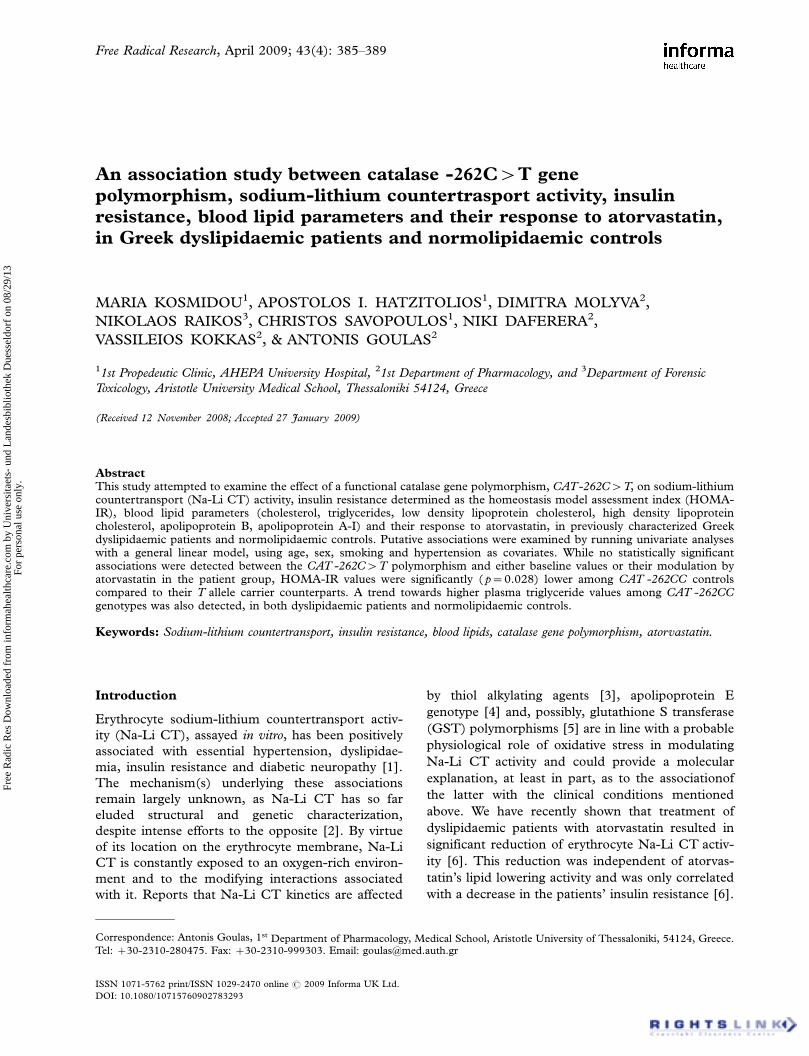
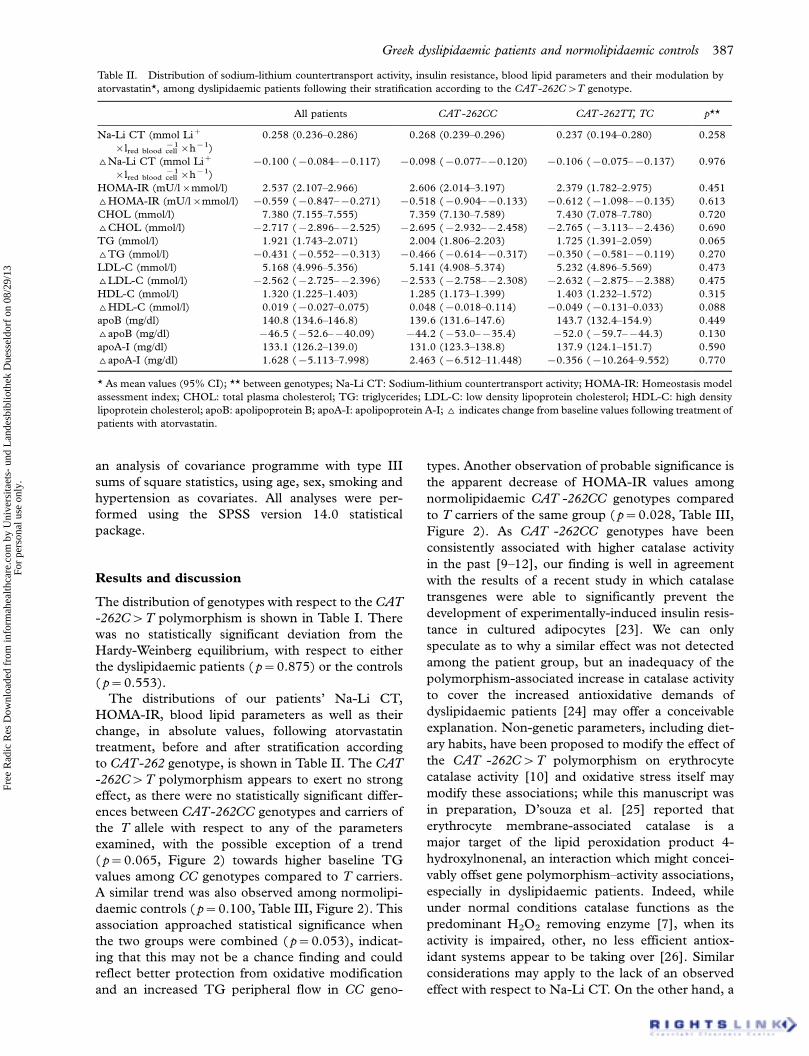
Genomic DNA was isolated from peripheral blood
leukocytes using a commercial DNA extraction kit
(PureGene†, Gentra Systems, Plymouth, MN). CAT
-262C�T genotyping was performed with a touched-
down PCR method, followed by Sma I digestion of
the amplified genomic DNA (Figure 1), as previously
described [8].
Associations of CAT -262C�T with Na-Li CT
activity, insulin resistance, blood lipid parameters and
their modulation by atorvastatin were examined with
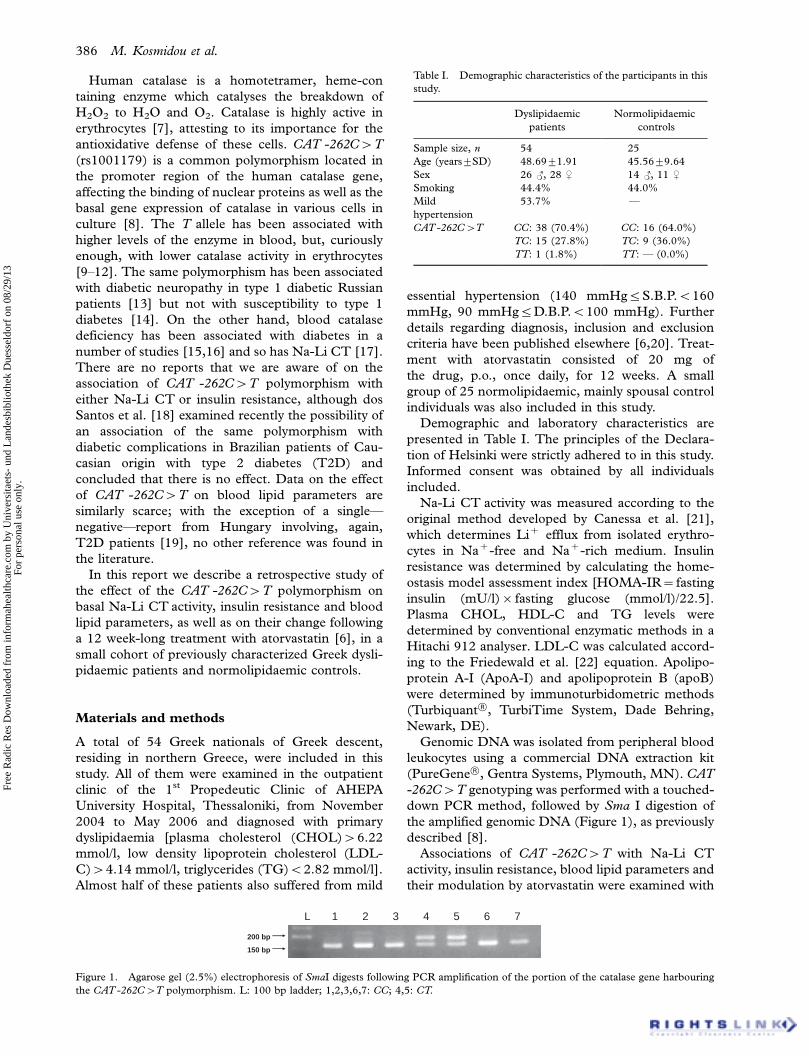
Table I. Demographic characteristics of the participants in this
study.
Dyslipidaemic
patients
Normolipidaemic
controls
Sample size, n 54 25
Age (years9SD) 48.6991.91 45.5699.64
Sex 26 �, 28 � 14 �, 11 �Smoking 44.4% 44.0%
Mild
hypertension
53.7% *
CAT -262C�T CC: 38 (70.4%) CC: 16 (64.0%)
TC: 15 (27.8%) TC: 9 (36.0%)
TT: 1 (1.8%) TT: * (0.0%)
L 1 2 3 4 5 6 7
200 bp
150 bp
Figure 1. Agarose gel (2.5%) electrophoresis of SmaI digests following PCR amplification of the portion of the catalase gene harbouring
the CAT -262C�T polymorphism. L: 100 bp ladder; 1,2,3,6,7: CC; 4,5: CT.
386 M. Kosmidou et al.
Free
Rad
ic R
es D
ownl
oade
d fr
om in
form
ahea
lthca
re.c
om b
y U
nive
rsita
ets-
und
Lan
desb
iblio
thek
Due
ssel
dorf
on
08/2
9/13
For
pers
onal
use
onl
y.
an analysis of covariance programme with type III
sums of square statistics, using age, sex, smoking and
hypertension as covariates. All analyses were per-
formed using the SPSS version 14.0 statistical
package.
Results and discussion
The distribution of genotypes with respect to the CAT
-262C�T polymorphism is shown in Table I. There
was no statistically significant deviation from the
Hardy-Weinberg equilibrium, with respect to either
the dyslipidaemic patients ( p�0.875) or the controls
( p�0.553).
The distributions of our patients’ Na-Li CT,
HOMA-IR, blood lipid parameters as well as their
change, in absolute values, following atorvastatin
treatment, before and after stratification according
to CAT-262 genotype, is shown in Table II. The CAT
-262C�T polymorphism appears to exert no strong
effect, as there were no statistically significant differ-
ences between CAT-262CC genotypes and carriers of
the T allele with respect to any of the parameters
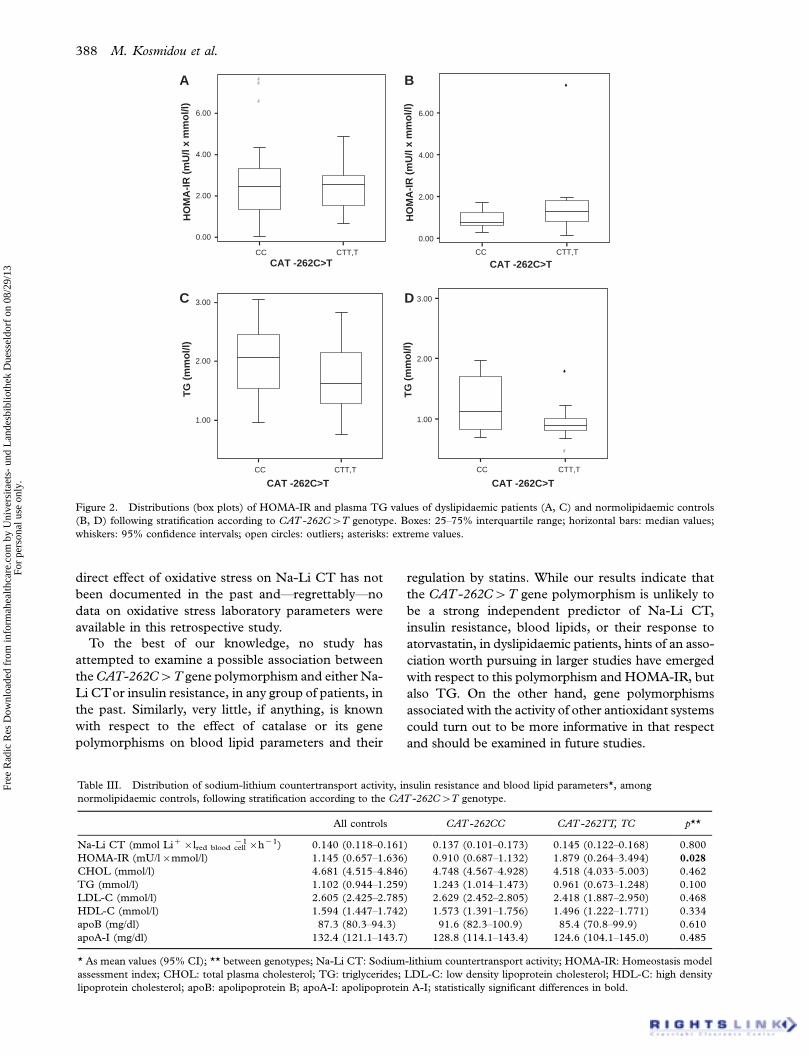
examined, with the possible exception of a trend
( p�0.065, Figure 2) towards higher baseline TG
values among CC genotypes compared to T carriers.
A similar trend was also observed among normolipi-
daemic controls ( p�0.100, Table III, Figure 2). This
association approached statistical significance when
the two groups were combined ( p�0.053), indicat-
ing that this may not be a chance finding and could
reflect better protection from oxidative modification
and an increased TG peripheral flow in CC geno-
types. Another observation of probable significance is
the apparent decrease of HOMA-IR values among
normolipidaemic CAT -262CC genotypes compared
to T carriers of the same group ( p�0.028, Table III,
Figure 2). As CAT -262CC genotypes have been
consistently associated with higher catalase activity
in the past [9�12], our finding is well in agreement
with the results of a recent study in which catalase
transgenes were able to significantly prevent the
development of experimentally-induced insulin resis-
tance in cultured adipocytes [23]. We can only
speculate as to why a similar effect was not detected
among the patient group, but an inadequacy of the
polymorphism-associated increase in catalase activity
to cover the increased antioxidative demands of
dyslipidaemic patients [24] may offer a conceivable
explanation. Non-genetic parameters, including diet-
ary habits, have been proposed to modify the effect of
the CAT -262C�T polymorphism on erythrocyte
catalase activity [10] and oxidative stress itself may
modify these associations; while this manuscript was
in preparation, D’souza et al. [25] reported that
erythrocyte membrane-associated catalase is a
major target of the lipid peroxidation product 4-
hydroxylnonenal, an interaction which might concei-
vably offset gene polymorphism�activity associations,
especially in dyslipidaemic patients. Indeed, while
under normal conditions catalase functions as the
predominant H2O2 removing enzyme [7], when its
activity is impaired, other, no less efficient antiox-
idant systems appear to be taking over [26]. Similar
considerations may apply to the lack of an observed
effect with respect to Na-Li CT. On the other hand, a
Table II. Distribution of sodium-lithium countertransport activity, insulin resistance, blood lipid parameters and their modulation by
atorvastatin*, among dyslipidaemic patients following their stratification according to the CAT -262C�T genotype.
All patients CAT -262CC CAT -262TT, TC p**
Na-Li CT (mmol Li�
�lred blood cell�1�h�1)
0.258 (0.236�0.286) 0.268 (0.239�0.296) 0.237 (0.194�0.280) 0.258
^Na-Li CT (mmol Li�
�lred blood cell�1�h�1)
�0.100 (�0.084��0.117) �0.098 (�0.077��0.120) �0.106 (�0.075��0.137) 0.976
HOMA-IR (mU/l�mmol/l) 2.537 (2.107�2.966) 2.606 (2.014�3.197) 2.379 (1.782�2.975) 0.451
^HOMA-IR (mU/l�mmol/l) �0.559 (�0.847��0.271) �0.518 (�0.904��0.133) �0.612 (�1.098��0.135) 0.613
CHOL (mmol/l) 7.380 (7.155�7.555) 7.359 (7.130�7.589) 7.430 (7.078�7.780) 0.720
^CHOL (mmol/l) �2.717 (�2.896��2.525) �2.695 (�2.932��2.458) �2.765 (�3.113��2.436) 0.690
TG (mmol/l) 1.921 (1.743�2.071) 2.004 (1.806�2.203) 1.725 (1.391�2.059) 0.065
^TG (mmol/l) �0.431 (�0.552��0.313) �0.466 (�0.614��0.317) �0.350 (�0.581��0.119) 0.270
LDL-C (mmol/l) 5.168 (4.996�5.356) 5.141 (4.908�5.374) 5.232 (4.896�5.569) 0.473
^LDL-C (mmol/l) �2.562 (�2.725��2.396) �2.533 (�2.758��2.308) �2.632 (�2.875��2.388) 0.475
HDL-C (mmol/l) 1.320 (1.225�1.403) 1.285 (1.173�1.399) 1.403 (1.232�1.572) 0.315
^HDL-C (mmol/l) 0.019 (�0.027�0.075) 0.048 (�0.018�0.114) �0.049 (�0.131�0.033) 0.088
apoB (mg/dl) 140.8 (134.6�146.8) 139.6 (131.6�147.6) 143.7 (132.4�154.9) 0.449
^apoB (mg/dl) �46.5 (�52.6��40.09) �44.2 (�53.0��35.4) �52.0 (�59.7��44.3) 0.130
apoA-I (mg/dl) 133.1 (126.2�139.0) 131.0 (123.3�138.8) 137.9 (124.1�151.7) 0.590
^apoA-I (mg/dl) 1.628 (�5.113�7.998) 2.463 (�6.512�11.448) �0.356 (�10.264�9.552) 0.770
* As mean values (95% CI); ** between genotypes; Na-Li CT: Sodium-lithium countertransport activity; HOMA-IR: Homeostasis model
assessment index; CHOL: total plasma cholesterol; TG: triglycerides; LDL-C: low density lipoprotein cholesterol; HDL-C: high density
lipoprotein cholesterol; apoB: apolipoprotein B; apoA-I: apolipoprotein A-I; ^ indicates change from baseline values following treatment of
patients with atorvastatin.
Greek dyslipidaemic patients and normolipidaemic controls 387
Free
Rad
ic R
es D
ownl
oade
d fr
om in
form
ahea
lthca
re.c
om b
y U
nive
rsita
ets-
und
Lan
desb
iblio
thek
Due
ssel
dorf
on
08/2
9/13
For
pers
onal
use
onl
y.
direct effect of oxidative stress on Na-Li CT has not
been documented in the past and*regrettably*no
data on oxidative stress laboratory parameters were
available in this retrospective study.
To the best of our knowledge, no study has
attempted to examine a possible association between
the CAT-262C�T gene polymorphism and either Na-
Li CTor insulin resistance, in any group of patients, in
the past. Similarly, very little, if anything, is known
with respect to the effect of catalase or its gene
polymorphisms on blood lipid parameters and their
regulation by statins. While our results indicate that
the CAT -262C�T gene polymorphism is unlikely to
be a strong independent predictor of Na-Li CT,
insulin resistance, blood lipids, or their response to
atorvastatin, in dyslipidaemic patients, hints of an asso-
ciation worth pursuing in larger studies have emerged
with respect to this polymorphism and HOMA-IR, but
also TG. On the other hand, gene polymorphisms
associated with the activity of other antioxidant systems
could turn out to be more informative in that respect
and should be examined in future studies.
CTT,TCC CTT,TCC
CAT -262C>T
0.00
2.00
4.00
6.00
CAT -262C>T
0.00
2.00
4.00
6.00
HO
MA
-IR
(m
U/l
x m
mo
l/l)
HO
MA
-IR
(m
U/l
x m
mo
l/l)
CTT,TCC
CAT -262C>T
1.00
2.00
3.00
TG
(m
mo
l/l)
CTT,TCC
CAT -262C>T
1.00
2.00
3.00
TG
(m
mo
l/l)
A B
C D
Figure 2. Distributions (box plots) of HOMA-IR and plasma TG values of dyslipidaemic patients (A, C) and normolipidaemic controls
(B, D) following stratification according to CAT -262C�T genotype. Boxes: 25�75% interquartile range; horizontal bars: median values;
whiskers: 95% confidence intervals; open circles: outliers; asterisks: extreme values.
Table III. Distribution of sodium-lithium countertransport activity, insulin resistance and blood lipid parameters*, among
normolipidaemic controls, following stratification according to the CAT -262C�T genotype.
All controls CAT -262CC CAT -262TT, TC p**
Na-Li CT (mmol Li��lred blood cell�1�h�1) 0.140 (0.118�0.161) 0.137 (0.101�0.173) 0.145 (0.122�0.168) 0.800
HOMA-IR (mU/l�mmol/l) 1.145 (0.657�1.636) 0.910 (0.687�1.132) 1.879 (0.264�3.494) 0.028
CHOL (mmol/l) 4.681 (4.515�4.846) 4.748 (4.567�4.928) 4.518 (4.033�5.003) 0.462
TG (mmol/l) 1.102 (0.944�1.259) 1.243 (1.014�1.473) 0.961 (0.673�1.248) 0.100
LDL-C (mmol/l) 2.605 (2.425�2.785) 2.629 (2.452�2.805) 2.418 (1.887�2.950) 0.468
HDL-C (mmol/l) 1.594 (1.447�1.742) 1.573 (1.391�1.756) 1.496 (1.222�1.771) 0.334
apoB (mg/dl) 87.3 (80.3�94.3) 91.6 (82.3�100.9) 85.4 (70.8�99.9) 0.610
apoA-I (mg/dl) 132.4 (121.1�143.7) 128.8 (114.1�143.4) 124.6 (104.1�145.0) 0.485
* As mean values (95% CI); ** between genotypes; Na-Li CT: Sodium-lithium countertransport activity; HOMA-IR: Homeostasis model
assessment index; CHOL: total plasma cholesterol; TG: triglycerides; LDL-C: low density lipoprotein cholesterol; HDL-C: high density
lipoprotein cholesterol; apoB: apolipoprotein B; apoA-I: apolipoprotein A-I; statistically significant differences in bold.
388 M. Kosmidou et al.
Free
Rad
ic R
es D
ownl
oade
d fr
om in
form
ahea
lthca
re.c
om b
y U
nive
rsita
ets-
und
Lan
desb
iblio
thek
Due
ssel
dorf
on
08/2
9/13
For
pers
onal
use
onl
y.
Declaration of interest: The authors report no
conflicts of interest. The authors alone are responsible
for the content and writing of the paper.
References
[1] West IC, Rutherford PA, Thomas TH. Sodium-lithium
countertransport: physiology and function J Hypertens 1998;
16:3�13.
[2] Morisson AC, Boerwinkle E, Turner ST, Ferrell RE. Regional
association-based fine-mapping for sodium-lithium counter-
transport on chromosome 10. Am J Hypertens 2008;21:
117�121.
[3] Mead P, Wilkinson R, Thomas TH. Thiol protein defect in
sodium-lithium countertransport in subset of essential hyper-
tension. Hypertension 1999;34:1275�1280.
[4] Wierzbicki AS, Hardman TC, Cheung J, Lambert-Hammill
M, Patel S, Morrish Z, Lumb PJ, Lant AF. The apolipopro-
tein E2 allele modulates activity and maximal velocity of
the sodium-lithium countertransporter. Am J Hypertens
2002;15:633�637.
[5] Goulas A, Kosmidou M, Hatzitolios AI, Raikos N, Molyva D,
Savopoulos C, Giannopoulos S, Fidani L. An association
study of sodium-lithium countertransport activity with glu-
tathione S transferase (GST) T1 and GST M1 null poly-
morphisms in Greek dyslipidaemic patients and controls. Clin
Chem Lab Med 2008;46:306�310.
[6] Kosmidou MS, Hatzitolios AI, Adamidou A, Giannopoulos
S, Raikos N, Parharidis G, Milionis HJ. Effects of atorvastatin
on red-blood cell Na�/Li� countertransport in hyperlipi-
demic patients with and without hypertension. Am J Hyper-
tens 2008;21:303�309.
[7] Mueller S, Riedel HD, Stremmel W. Direct evidence for
catalase as the predominant H2O2-removing enzyme in
human erythrocytes. Blood 1997;90:4973�4978.
[8] Forsberg L, Lyrenas L, de Faire U, Morgenstern R. A
common functional C-T substitution polymorphism in the
promoter region of the human catalase gene influences
transcription factor binding, reporter gene transcription and
is correlated to blood catalase levels. Free Radic Biol Med
2001;30:500�505.
[9] Ahn J, Nowell S, McCann SE, Yu J, Carter L, Lang NP,
Kadlubar FF, Ratnasinghe LD, Ambrosone CB. Associations
between catalase phenotype and genotype: modification by
epidemiologic factors. Cancer Epidemiol Biomarkers Prev
2006;15:1217�1222.
[10] Bastaki M, Huen K, Manzanillo P, Chande N, Chen C,
Balmes JR, Tager IB, Holland N. Genotype-activity relation-
ship for Mn-superoxide dismutase, glutathione peroxidase 1
and catalase in humans. Pharmacogenet Genomics
2006;16:279�286.
[11] Perianayagam MC, Liangos O, Kolyada AY, Wald R,
MacKinnon RW, Li L, Rao M, Balakrishnan VS, Bonventre
JV, Pereira BJ, Jaber BL. NADPH oxidase p22phox and
catalase gene variants are associated with biomarkers of
oxidative stress and adverse outcomes in acute renal failure.
J Am Soc Nephrol 2007;18:255�263.
[12] Nadif R, Mintz M, Jedlicka A, Bertrand J-P, Kleeberger SR,
Kauffmann F. Association of CAT polymorphisms with
catalase activity and exposure to environmental oxidative
stimuli. Free Radic Res 2005;39:1345�1350.
[13] Chistiakov DA, Zotova EV, Savostanov KV, Bursa TR,
Galeev IV, Strokov IA, Nosikov VV. The 262T�C promoter
polymorphism of the catalase gene is associated with diabetic
neuropathy in type 1 diabetic Russian patients. Diabetes
Metab 2006;32:63�68.
[14] Pask R, Cooper JD, Walker NM, Nutland S, Hutchings J,
Dunger DB, Nejentsev S, Todd JA. No evidence for a major
effect of two common polymorphisms of the catalase gene in
type 1 diabetes susceptibility. Diabetes Metab Res Rev
2006;22:356�360.
[15] Goth L, Lenkey A, Bigler WN. Blood catalase deficiency and
diabetes in Hungary. Diabetes Care 2001;10:1839�1840.
[16] Tarnai I, Csordas M, Sukei E, Shemirani AH, Kaplar M,
G(th L. Effect of C111T polymorphism in exon 9 of the
catalase gene on blood catalase activity in different types of
diabetes mellitus. Free Radic Res 2007;41:806�811.
[17] Vaccaro O, Cuomo V, Trevisan M, Cirillo M, Panarelli W,
Laurenzi M, Mancini M, Riccardi G, Gubbio Study Research
Group. Enhanced Na-Li countertransport: a marker of
inherited susceptibility to type 2 diabetes. Int J Epidemiol
2005;34:1123�1128.
[18] Dos Santos KG, Canani LH, Gross JL, Tschiedel B, Pires
Souto KE, Roisenberg I. The catalase -262C/T promoter
polymorphism and diabetic complications in Caucasians with
type 2 diabetes. Dis Markers 2006;22:355�359.
[19] Szelestei T, Bahring S, Wagner Z, Aydin A, Molnar GA,
Kocsis B, Nagy J, Wittmann I. Serum levels of L-arginine
analogues and gluathione peroxidase and catalase gene
variants in Type 2 diabetes mellitus patients. Diabet Med
2005;22:356�357.
[20] Goulas A, Kosmidou M, Hatzitolios AI, Molyva D, Fidani L,
Giannopoulos S, Mirtsou V. Glutathione S-transferase null
and cholesteryl ester transfer protein TaqI B polymorphisms
and lipid response to atorvastatin in Greek dyslipidaemic
patients. Basic Clin Pharmacol Toxicol 2008;102:559�562.
[21] Canessa M, Adragna N, Solomon H, Connolly T, Tosteson
D. Increased sodium-lithium countertransport in red cells of
patients with essential hypertension. N Engl J Med
1980;302:772�776.
[22] Friedewald WT, Levy RI, Fredrickson DS. Estimation of the
concentration of low-density lipoprotein cholesterol in
plasma, without use of the preparative ultracentrifuge. Clin
Chem 1972;18:499�502.
[23] Houstis N, Rosen ED, Lander ES. Reactive oxygen species
have a causal role in multiple forms of insulin resistance.
Nature 2006;440:944�948.
[24] Keaney JF Jr, Larson MG, Vasan RS. Obesity and systemic
oxidative stress: clinical corelates of oxidative stress in the
Framingham study. Arterioscler Thromb Vasc Biol 2003;
23:434�439.
[25] D’souza A, Kurien BT, Rodgers A, Shenoi J, Kurono S,
Matsumoto H, Hensley K, Nath SK, Scofield RH. Detection
of catalase as a major protein target of the lipid peroxidation
product 4-HNE and the lack of its genetic association as a risk
factor in SLE. BMC 2008;Med Genet 9:62.
[26] Ho YS, Xiong Y, Ma W, Spector A, Ho DS. Mice lacking
catalase develop normally but show differential sensitivity to
oxidant tissue injury. J Biol Chem 2004;279:32804�32812.
This paper was first published online on iFirst on 9 March
2009.
Greek dyslipidaemic patients and normolipidaemic controls 389
Free
Rad
ic R
es D
ownl
oade
d fr
om in
form
ahea
lthca
re.c
om b
y U
nive
rsita
ets-
und
Lan
desb
iblio
thek
Due
ssel
dorf
on
08/2
9/13
For
pers
onal
use
onl
y.