Embed Size (px)
Citation preview

Adolfo Morrone (Istat) and Katherine Scrivens (OECD)
22nd November, 2011
IARIW Conference, Paris
An asset-based approach to
measuring vulnerability in OECD
countries
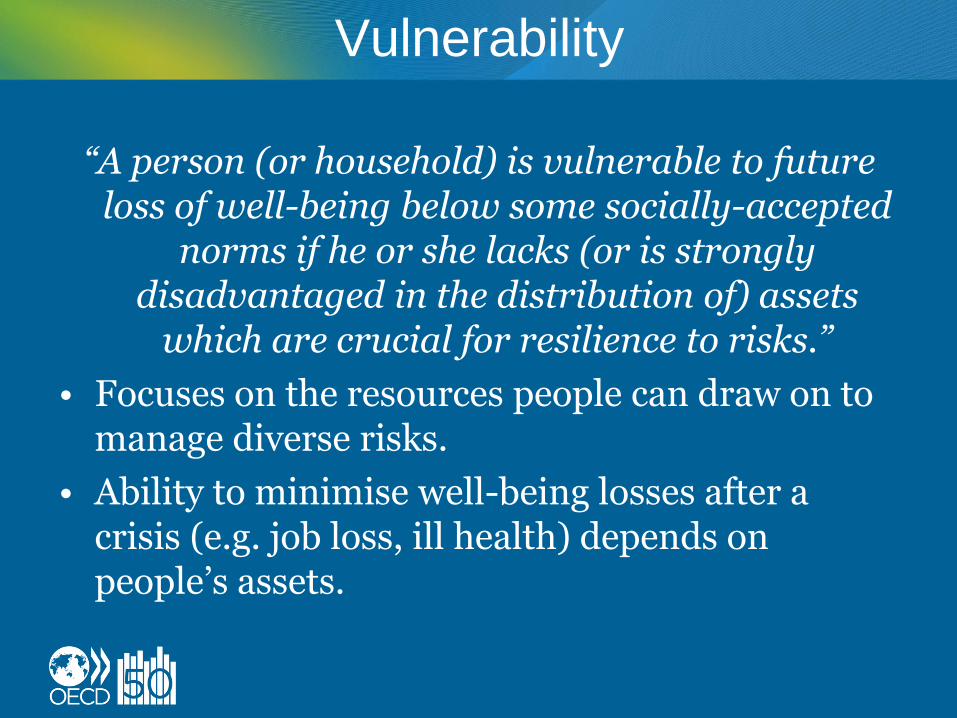
Vulnerability
“A person (or household) is vulnerable to future loss of well-being below some socially-accepted
norms if he or she lacks (or is strongly disadvantaged in the distribution of) assets
which are crucial for resilience to risks.”
• Focuses on the resources people can draw on to manage diverse risks.
• Ability to minimise well-being losses after a crisis (e.g. job loss, ill health) depends on people’s assets.
The asset-based approach
• Assets considered in a broad sense.
• Tangible and intangible stocks of wealth used by households/individuals to generate well-being:
– Economic capital
– Human capital
– Social capital
– Collective assets
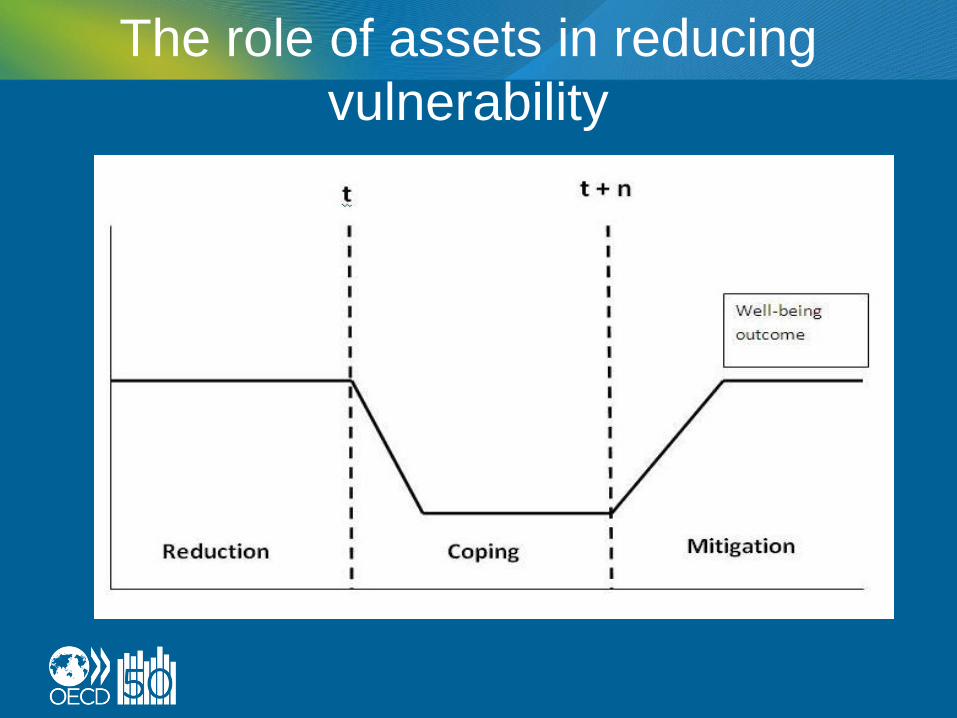
The role of assets in reducing
vulnerability

Economic capital
• Focusing on stocks, not flows, so looking at net worth and asset ownership rather than income measures
Z
Z NW
Asset frontier
Standard incomefrontier
Asset-pooronly
Income pooronly
Asset and income poor
Y
Source: Brandolini et al., 2010
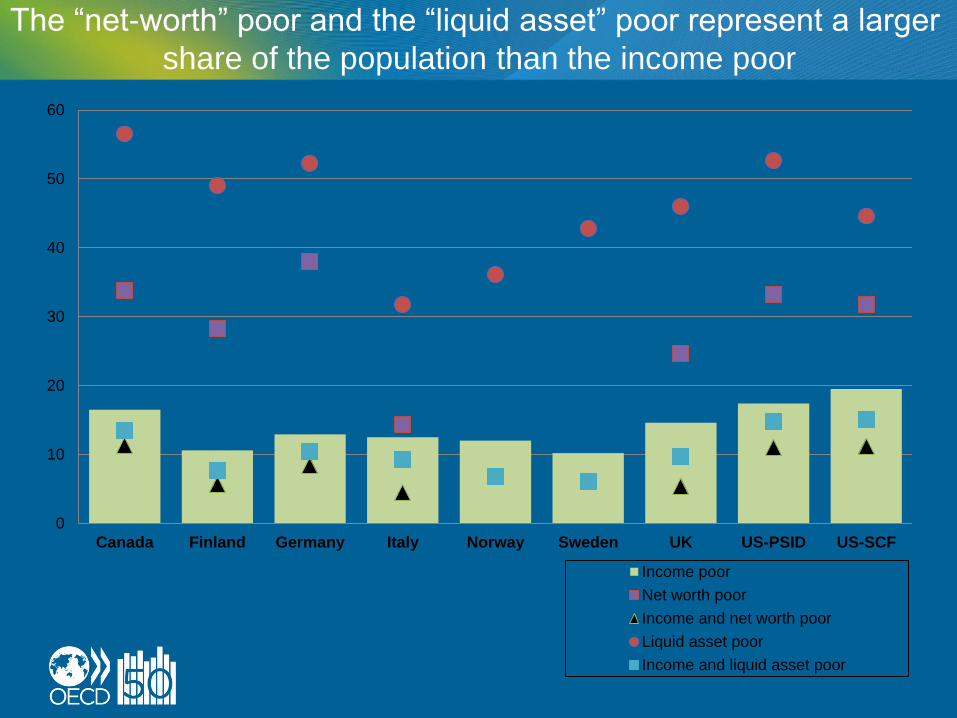
The “net-worth” poor and the “liquid asset” poor represent a larger
share of the population than the income poor
0
10
20
30
40
50
60
Canada Finland Germany Italy Norway Sweden UK US-PSID US-SCF
Income poor
Net worth poor
Income and net worth poor
Liquid asset poor
Income and liquid asset poor
Measuring economic capital stocks
• Ideal indicators: Net Worth and Liquid Assets, available from the LWS, however there are drawbacks to this approach.
• Next best: Subjective Illiquidity, Home Ownership from EU-SILC.

Home ownership reduces risk of material
deprivation
26,5
9,58,2
4,2
48,6
9,8
13,9
7,9
61,1
14,315,7
13,4
46,9
18,916,8
9,8
0
10
20
30
40
50
60
70
Inability to face unexpectedexpenses
Inability to keep home adquatelywarm
Inability to afford a health diet Arrears on utility bills
Owner not paying a morgage
Tenant at market rate
Rented at reduced rate
Free of use

Comparing subjective illiquidity and objective
indicators of poverty in EU countries
0
10
20
30
40
50
60
70
Subjective illiquidity Income poverty
Net worth poverty Liquid asset poverty
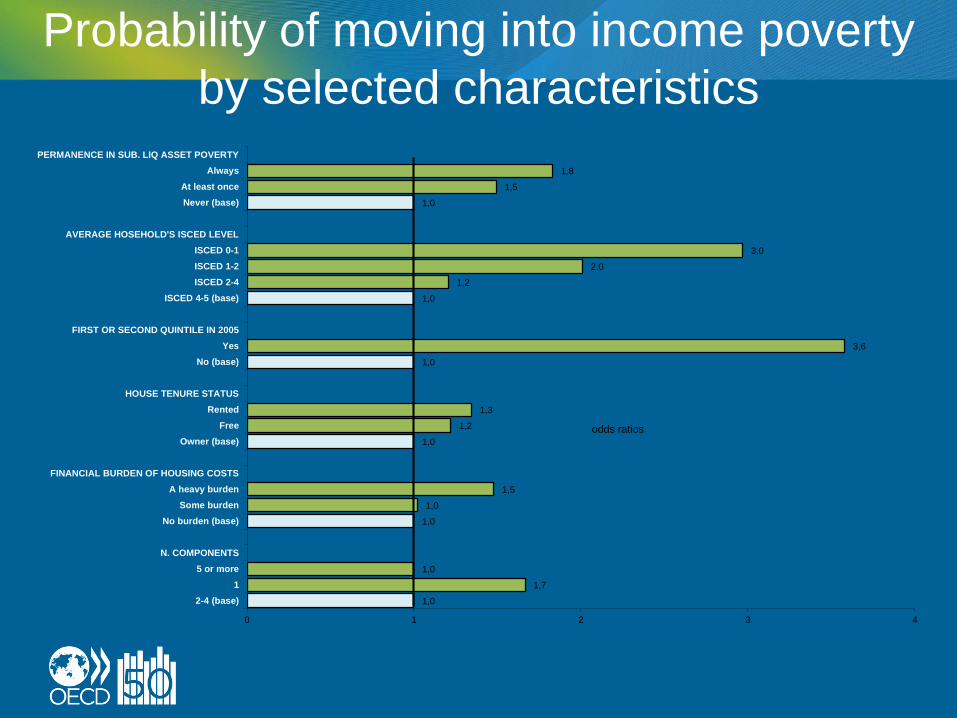
Probability of moving into income poverty
by selected characteristics
1,0
1,7
1,0
1,0
1,0
1,5
1,0
1,2
1,3
1,0
3,6
1,0
1,2
2,0
3,0
1,0
1,5
1,8
0 1 2 3 4
2-4 (base)
1
5 or more
N. COMPONENTS
No burden (base)
Some burden
A heavy burden
FINANCIAL BURDEN OF HOUSING COSTS
Owner (base)
Free
Rented
HOUSE TENURE STATUS
No (base)
Yes
FIRST OR SECOND QUINTILE IN 2005
ISCED 4-5 (base)
ISCED 2-4
ISCED 1-2
ISCED 0-1
AVERAGE HOSEHOLD'S ISCED LEVEL
Never (base)
At least once
Always
PERMANENCE IN SUB. LIQ ASSET POVERTY
odds ratios

Human capital
OECD definition: “knowledge, skills, competencies and attributes embodied in individuals that facilitate the creation of personal, social and economic well-being”.
Encompasses:
– Education
– Skills (cognitive and non-cognitive)
– Health (mental and physical)
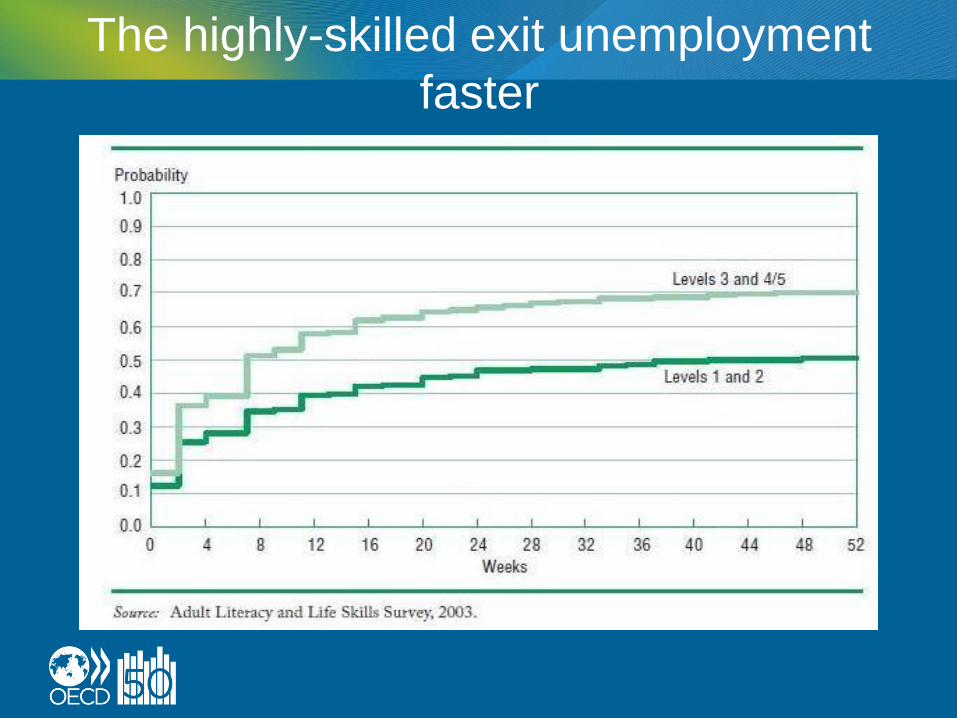
The highly-skilled exit unemployment
faster

Measuring human capital – educational
attainment
Early school leavers in Europe, 2009 % of 18-24 yr-olds, less than upper secondary education and not in education or
training.
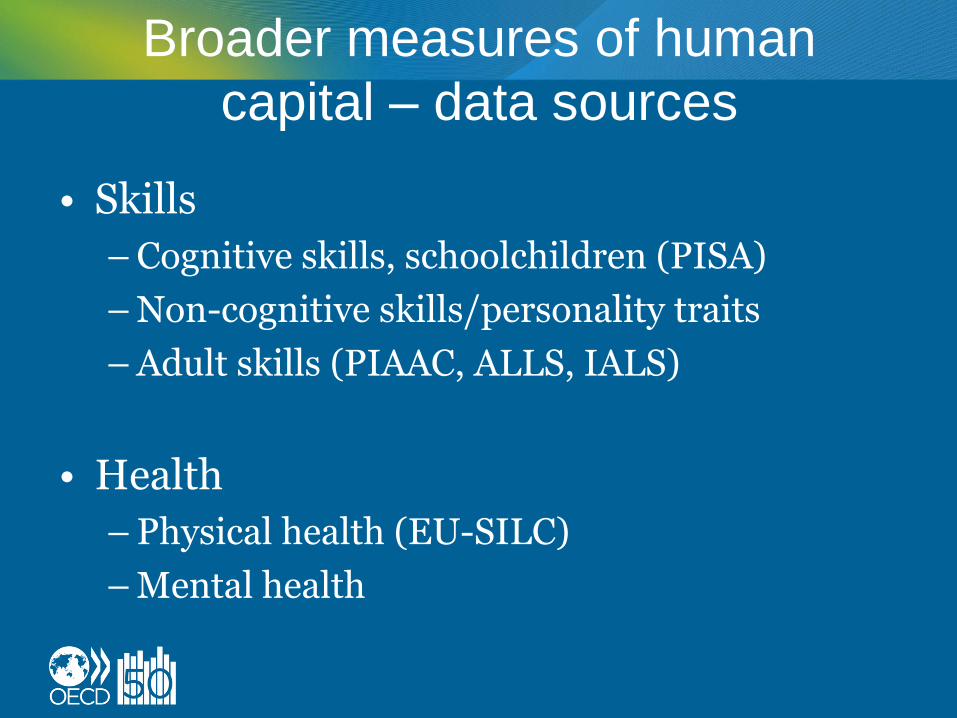
Broader measures of human
capital – data sources
• Skills
– Cognitive skills, schoolchildren (PISA)
– Non-cognitive skills/personality traits
– Adult skills (PIAAC, ALLS, IALS)
• Health
– Physical health (EU-SILC)
– Mental health
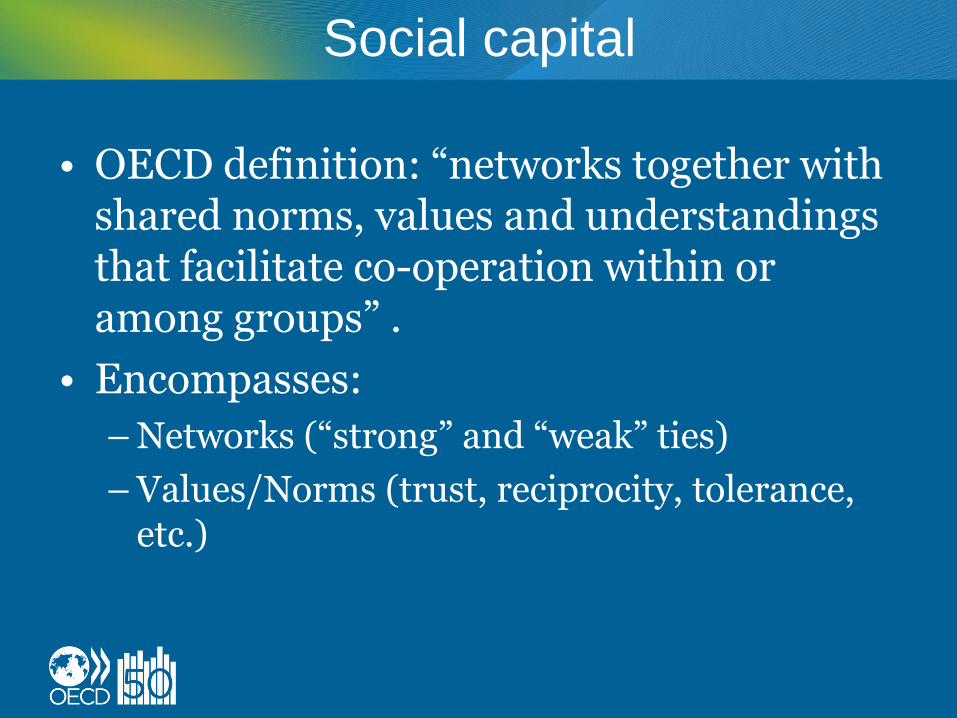
Social capital
• OECD definition: “networks together with shared norms, values and understandings that facilitate co-operation within or among groups” .
• Encompasses:
– Networks (“strong” and “weak” ties)
– Values/Norms (trust, reciprocity, tolerance, etc.)
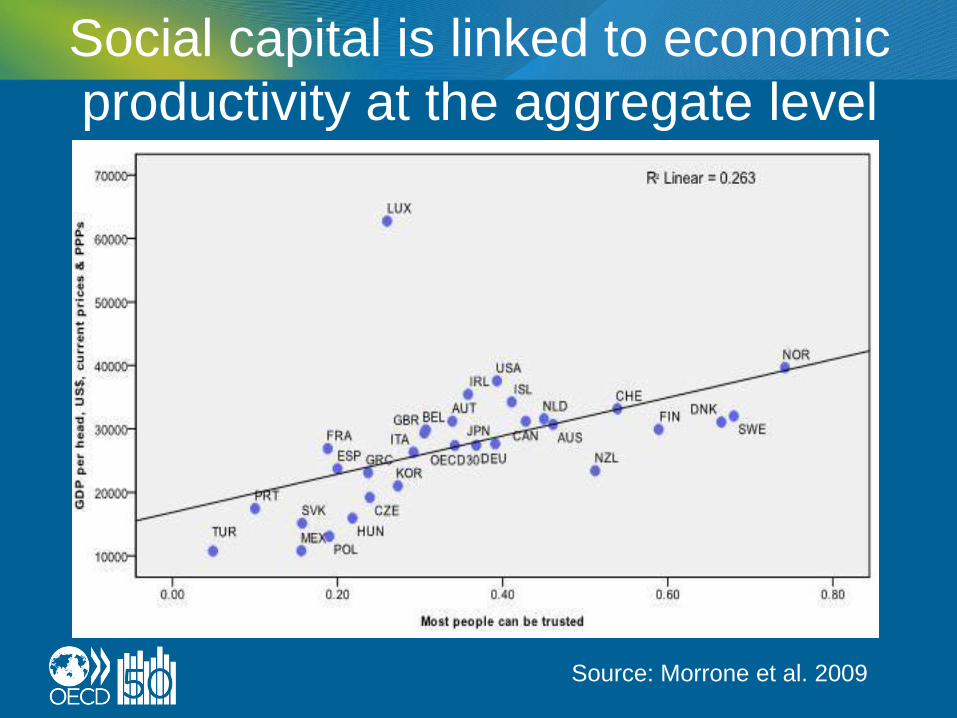
Social capital is linked to economic
productivity at the aggregate level
Source: Morrone et al. 2009
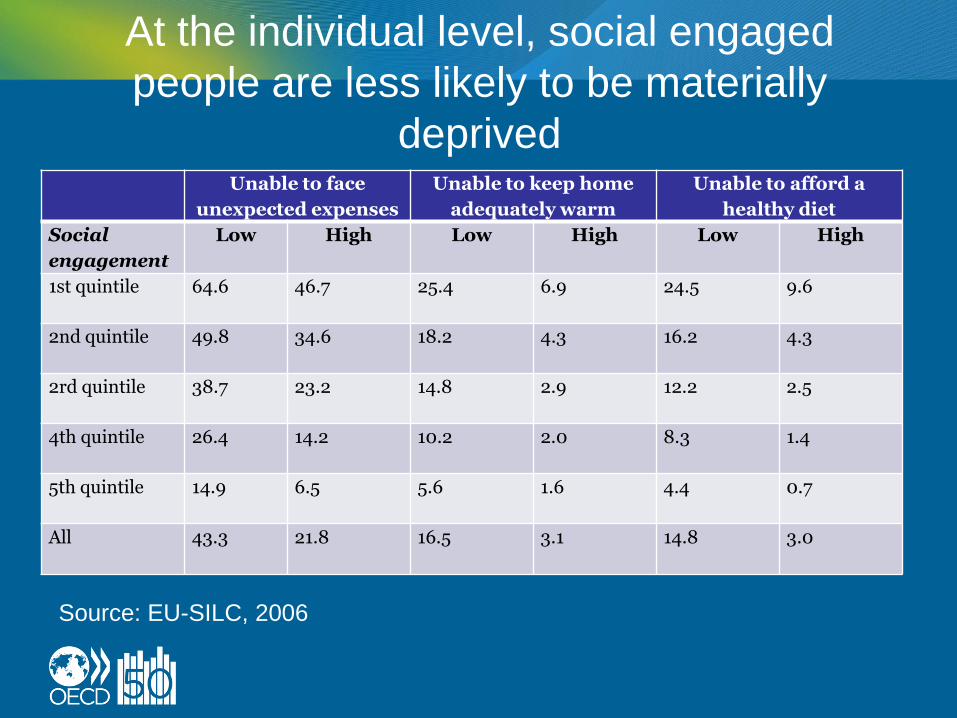
At the individual level, social engaged
people are less likely to be materially
deprived Unable to face
unexpected expenses
Unable to keep home
adequately warm
Unable to afford a
healthy diet
Social
engagement
Low High Low High Low High
1st quintile 64.6 46.7 25.4 6.9 24.5 9.6
2nd quintile 49.8 34.6 18.2 4.3 16.2 4.3
2rd quintile 38.7 23.2 14.8 2.9 12.2 2.5
4th quintile 26.4 14.2 10.2 2.0 8.3 1.4
5th quintile 14.9 6.5 5.6 1.6 4.4 0.7
All 43.3 21.8 16.5 3.1 14.8 3.0
Source: EU-SILC, 2006

Measuring social capital –
perceived social network support
Source: EU-SILC, 2006

Measuring social capital -
challenges
• Ongoing data collection needed.
• Geographic data, at municipal/community/neighbourhood level needed.
• More research needed on:
– Direction of causality
– Relationship between social contact and transitioning out of adverse situation.
Collective assets
• Public goods available “to all”
– Universal
– Targeted
– Local
• Report focuses on state-provided resources such as healthcare, education, and social assistance.
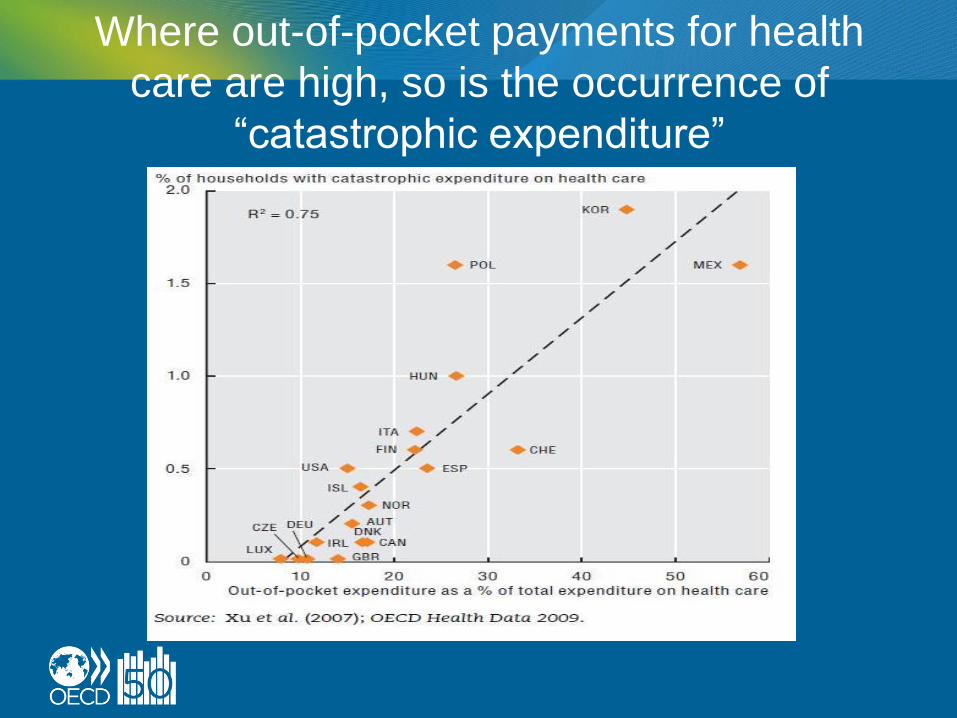
Where out-of-pocket payments for health
care are high, so is the occurrence of
“catastrophic expenditure”
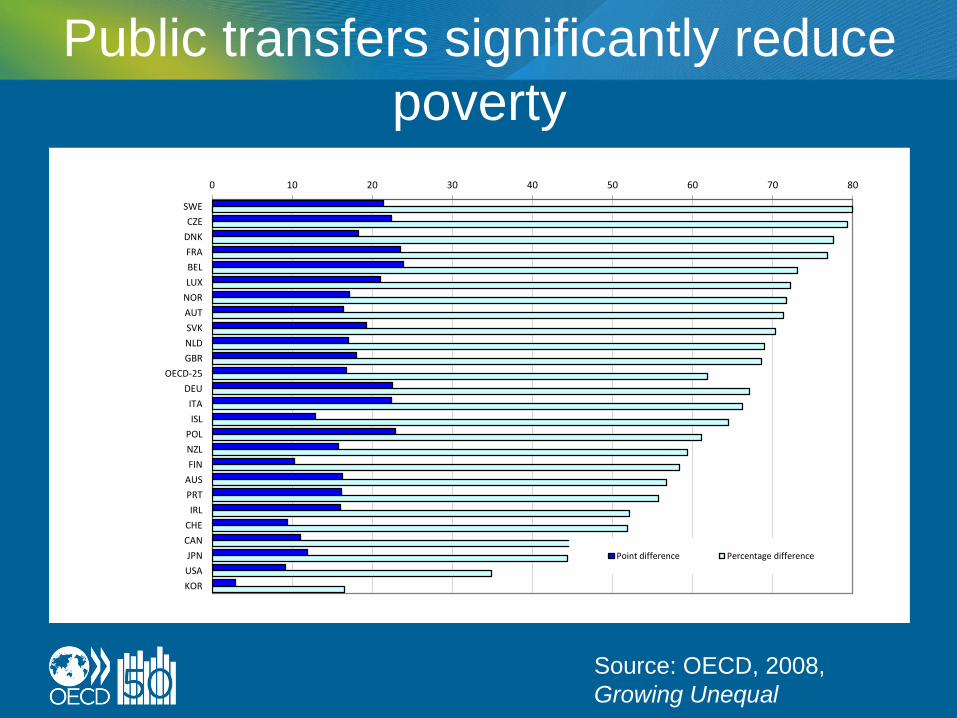
Public transfers significantly reduce
poverty
0 10 20 30 40 50 60 70 80
SWE
CZE
DNK
FRA
BEL
LUX
NOR
AUT
SVK
NLD
GBR
OECD-25
DEU
ITA
ISL
POL
NZL
FIN
AUS
PRT
IRL
CHE
CAN
JPN
USA
KOR
Point difference Percentage difference
Source: OECD, 2008,
Growing Unequal
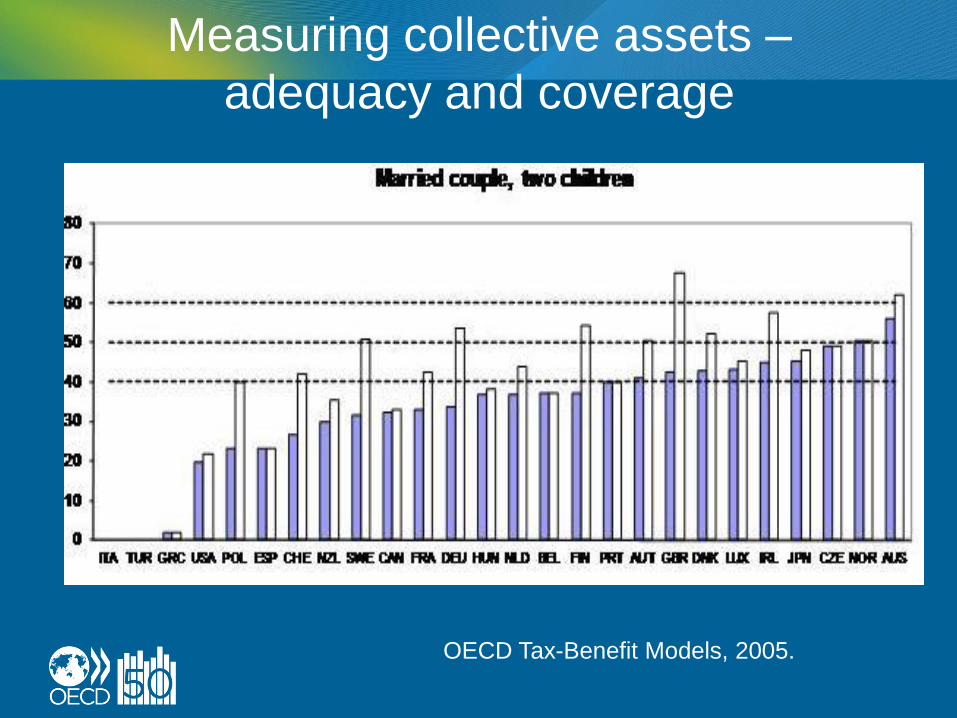
Measuring collective assets –
adequacy and coverage
OECD Tax-Benefit Models, 2005.

Access to local services –
difficulty accessing public transport
Source: EU-SILC, 2007.

Measuring collective assets –
the way ahead
• Measures of coverage are useful, but need better measures of effectiveness of public services and systems
• However, this lies at the very heart of social policy analysis – an ambitious goal.
• EU-SILC data on access to local services can provide a first step to identifying vulnerable populations.

Measuring multi-dimensional vulnerability
• The most vulnerable are those who lack assets in more than one area.
• Need to identify/develop surveys collecting data on multiple asset types.
• EU-SILC provides a first step.
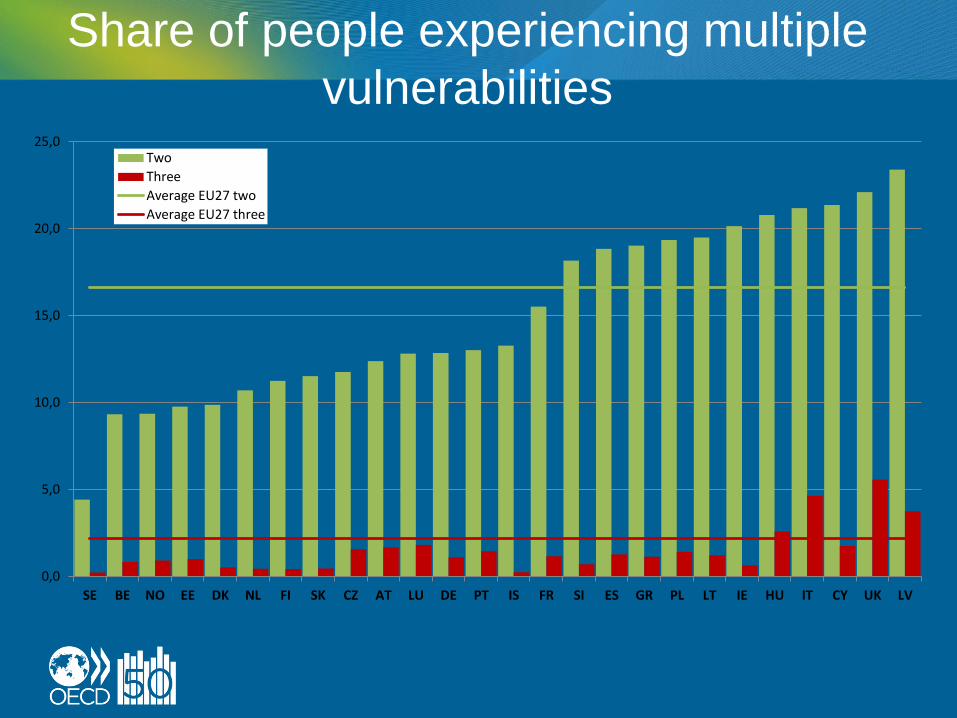
Share of people experiencing multiple
vulnerabilities
0,0
5,0
10,0
15,0
20,0
25,0
SE BE NO EE DK NL FI SK CZ AT LU DE PT IS FR SI ES GR PL LT IE HU IT CY UK LV
Two
Three
Average EU27 two
Average EU27 three
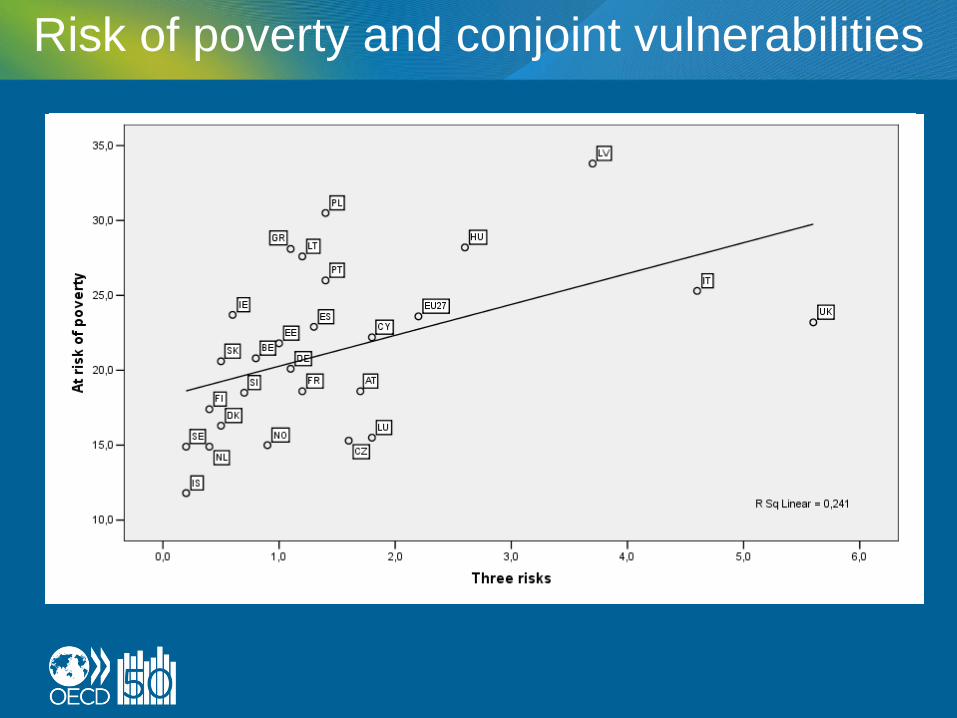
Risk of poverty and conjoint vulnerabilities
The challenge ahead
• Vulnerability is a function of accessibility to all types of capital.
• It would be critical to look at the overlap between the populations with low economic capital, low human capital, low social capital, and poor access to collective assets.
• Information on ownership and access to each of the types of assets could be collected using EU-SILC or, in alternative, techniques to link micro records from different surveys
• Work needed to have a better understanding of appropriate thresholds. Here many choices could be seen as arbitrary, and vulnerability may be better understood as a continuum.