Embed Size (px)
Citation preview
An Assessment Study on White Spaces in MalawiUsing Affordable Tools
M. ZennaroE. Pietrosemoli
Telecommunications/ICT4D LaboratoryThe Abdus Salam International Centre
for Theoretical PhysicsTrieste, Italy
JSP. MlathoM. ThodiC. Mikeka
Physics DepartmentChancellor College Campus
University of MalawiZomba, Malawi
Abstract—For rural areas, wireless is the only viable alter-native for providing affordable telecommunications services. Onelimiting factor to the growth of wireless broadband penetration isthe lack of available spectrum. White Spaces broadband uses gapsin spectrum bands that have been reserved for TV broadcasts.These frequencies offer significant capacity to help alleviatepressures on existing wireless networks and allow connectivityin remote areas due to their good propagation capabilities.This paper describes an assessment study on TV White Spacesavailability in Malawi using affordable tools. The conclusion ofthe study is that 1) it is possible to assess the spectrum usageusing low cost equipment 2) ample spectrum for TV White Spacesdeployment is available in Malawi.
I. INTRODUCTION
TV White Spaces have received a lot of attention inthe last decade [1]. They offer a solution to the spectrumcrunch that has resulted from the explosive growth of wirelesstechnologies. While the focus of most researchers has beenin protecting the incumbent user of the spectrum, the TVbroadcasters, from the possible interference caused by thenew entrants [2], we believe that rural areas in DevelopingCountries are ripe for the deployment of white spaces radiosthat can be used to provide Community Network services andInternet access. The reason is that TV broadcasters never hadan economic incentive to serve sparsely populate areas withseveral concurrent TV channels as is the case in urbaspetheUHF TV speowrum is mostly fallen in these regions and readyto be put to good use. On the other hand, the recent decision ofthe FCC (Federal Communication Commission) in the US toallow the nationwide deployment of TV band devices [3], hasprovided the incentive for several manufactures [4] to investin the production of equipment capable of providing two waydigital communications at a reasonable throughput operatingin the 470 MHz to 690 MHz band.
The remaining obstacle to make use of these frequenciesfor Internet connectivity is to persuade the regulators in De-veloping Countries of the benefits for rural populations. Thesefrequencies have much better propagation characteristics andtherefore offer better coverage with fewer base stations, in aneconomically viable way even in sparsely populated areas.
To this end, the measurement of the spectrum is a powerfulalbeit, up to now, expensive tool to convince the regulators.
We present the use of inexpensive spectrum analyzers
coupled with laptops and the software required to performspectrum measurement and visualize the data in a convenientway for highlighting the availability of spectrum holes, withexamples of measurements taken in both urban and rural areasin Malawi.
II. SPECTRUM MONITORING
Recently spectrum occupancy has become topical as thequest for efficient access to the spectrum continues. This isevidenced by empirical measurements of the radio environmentin a bid to ascertain the spectrum usage by different wirelessservices [5]. A number of occupancy measurement campaignsefforts where initially carried out in USA using disconeantennas, spectrum analyzers and a laptop [6-8]. These occu-pancy measurements showed information only about Americanspectrum regulation and utilization.
The efforts soon spread to Europe. A spectrum occupancymeasurements was conducted in the frequency range from 75MHz to 3 GHz in an outdoor environment in urban Barcelona,Spain [9]. Furthermore [10] takes a survey of Spectrum uti-lization in Europe and reports three major campaigns namelyin the suburb of the city of Brno in the Czech Republic and inthe suburb and the city of Paris in France during years 2008and 2009 respectively.
In Asia, researchers in Singapore [11] measured a 24hour spectrum usage in 12 weekdays in the band 80 MHz-5850 MHz. The authors conclude from their measurementsthat their work is preliminary in its nature and future longterm studies need to be performed to determine any potentialsecondary usage on those channels that have low or no activeutilization. The Malaysian efforts are reported in [12] with afocus on the 470-498 MHz band in an outdoor environmentof a suburban area in Johor Bahru. In China, measurementshave been focussed in the range 694-806 MHz [13] in theChengdu area. In Vietnam [14], the frequency bands rangingfrom 20 MHz to 3000 MHz in Ho Chi Minh City and LongAn province have been measured, while in Japan [15] threeparticular locations of Kanto area spanning the 90 Mhz-3 GHzband were monitored. There have been other efforts in Qatar[16].
In Africa, measurements have been carried out in SouthAfrica [17] using the Meraka Cognitive Radio Platform
(MCRP) developed using the Universal Software Radio Pe-ripheral hardware and the GNU Radio software. The authorspresent early results in rural and urban Southern Africa indi-cating that there are substantial white spaces available in bothrural and urban areas for digital dividend.
The majority of these researches reach a common conclu-sion on the necessity for further occupancy measurements atdifferent locations over varied times. This thus motivates theneed for more occupancy measurement. On concluding theirinvestigations, the authors in [14] affirm that the challengesof their campaign is not only cost (equipment) but also time(deployment) where multiple locations are to be measured toobtain local spectral pattern usage.
III. AFFORDABLE TOOLS FOR SPECTRUM MONITORING
Monitoring the RF spectrum requires a spectrum analyzer.Commercial high-end spectrum analyzers are expensive (inthe order of many thousand dollars) and bulky, and are nottypically available in university labs in Developing Countries.Recently an affordable and easy to use device has becomeavailable, to analyze the frequency band between 240 MHz and960 MHz, which encompasses the higher part of the TV band.This device is called RF Explorer [18] and sells for around100$. The RF Explorer displays full frequency spectrum inthe band, including carrier and modulated shape, and showsSpread Spectrum activity if that exist. There are some otherdevices of reasonable cost in the market which offers some ofthese features in an USB dongle, but they are restricted to theISM bands and do not cover TV frequencies. RF Explorer isfully functional as an independent unit and does not require aPC to be used.
The software provided with the RF Explorer is not suitedfor the type of measurements we planned. There are bothWindows and a Mac clients, free to use, but they are based ona GUI. We decided to automatize the measurement process bywriting a script that sets the start and stop frequencies and thensaves the measurement results as text files. In this way we canproduce graphs and easily analyze the results. We included aGPS in the system so we know exactly where and when themeasurements were carried out.
IV. MEASUREMENTS IN MALAWI
Malawi is a landlocked country in southeast Africa. Malawiis over 118,000 km2 with an estimated population of morethan 14,900,000. It is among the world’s least-developedcountries. The economy is heavily based in agriculture, witha largely rural population. Internet access is limited by highcost and lack of infrastructure. According to InternationalTelecommunications Union statistics for 2009, approximately4.7 percent of the country’s inhabitants used the Internet [19].
A. Measurement Sites
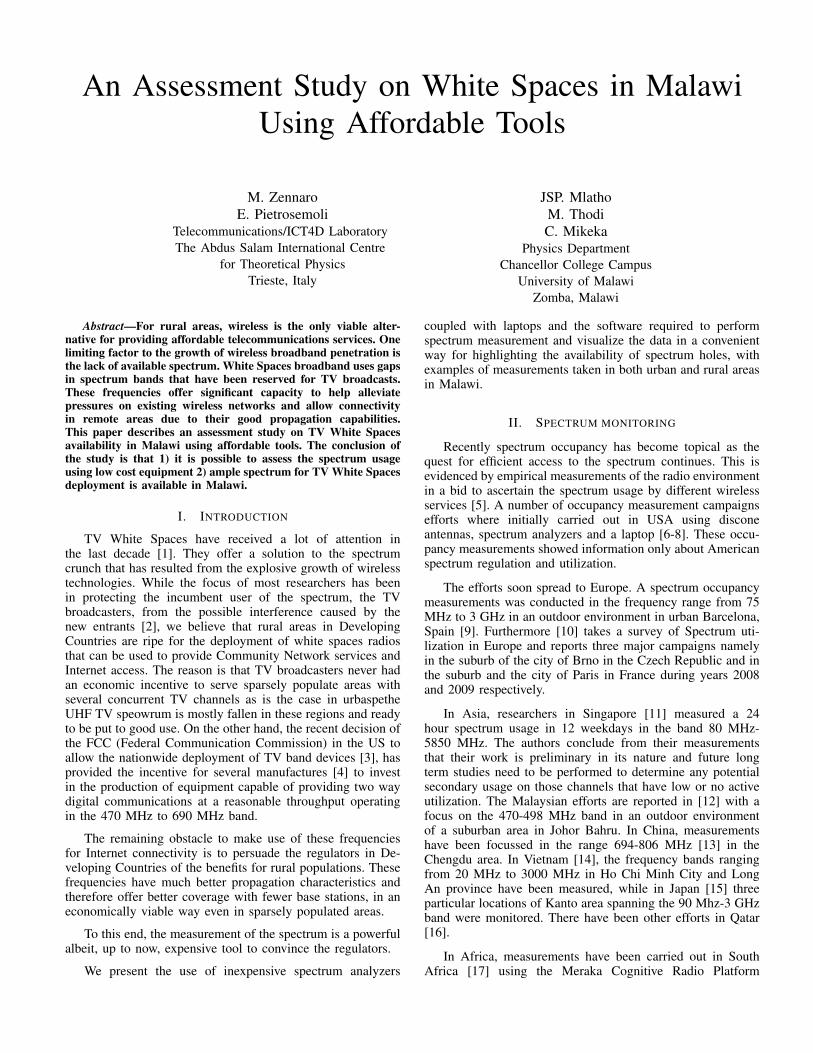
The measurements were first performed around ChancellorCollege Campus, and later in four selected rural areas ofinterest in Zomba and one urban area in Blantyre city. Thelocations of these sites are shown on Table 1 and Figure 1shows the selected sites on a map.
Measurements were carried out in several spatially dis-tributed locations with different population density, namely;
TABLE I. SITES IN MALAWI
Site Name Location Latitude LongitudeChanco LT Sub-Urban -15.38820114 35.3377872Namiwawa Urban -15.77635384 34.97527684Jali Trade Center Rural -15.482136 35.447648Makoka Rural -15.5167 35.2167MagomeroCommunity College Rural -15.57694502 35.18616848Thondwe Rural -15.5 35.235
Fig. 1. Measured Sites in Blantyre and Zomba.
urban, sub-urban and rural. For the urban location, a lowdensity location called Namiwawa was chosen in Malawi’scommercial city of Blantyre. For the sub-urban, ChancellorCollege Lecture Theatre 2 in the City of Zomba was chosen.For the rural, remote sites from Zomba city namely; Jali,Magomero, Makoka and Thondwe were selected. The selectioncriteria for the rural sites were based on the presence of nearbypublic infrastructure like hospitals, schools, market or police.
B. Methodology
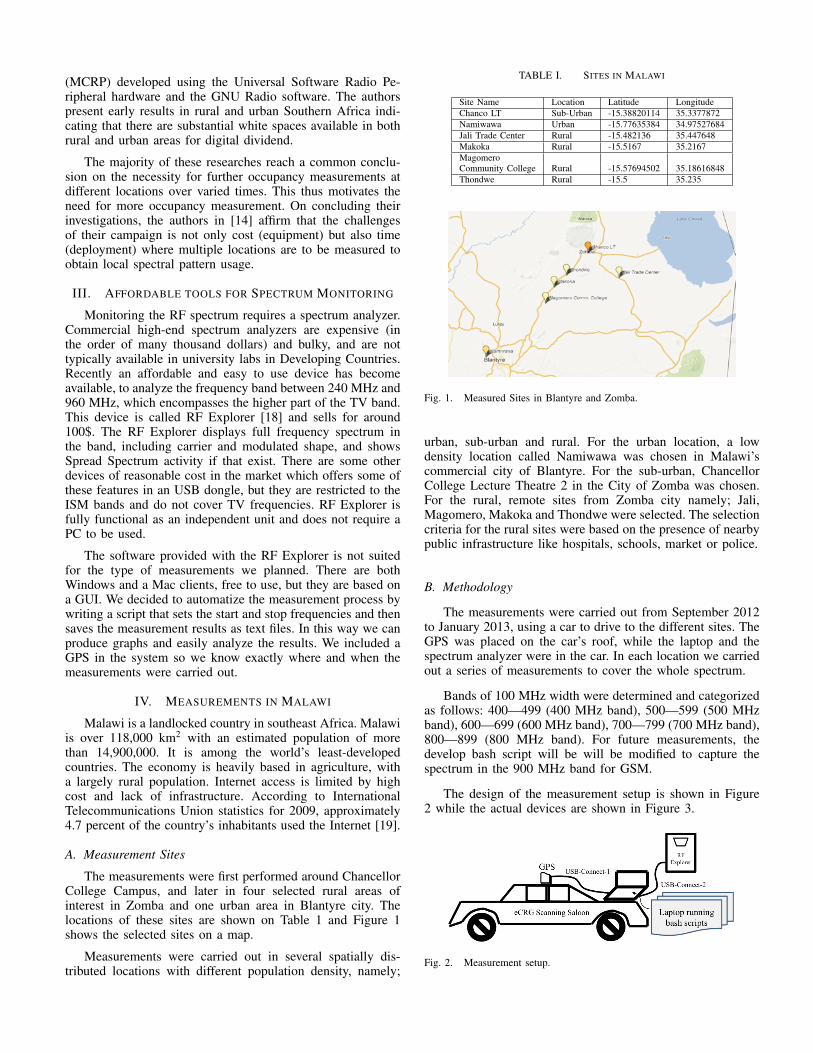
The measurements were carried out from September 2012to January 2013, using a car to drive to the different sites. TheGPS was placed on the car’s roof, while the laptop and thespectrum analyzer were in the car. In each location we carriedout a series of measurements to cover the whole spectrum.
Bands of 100 MHz width were determined and categorizedas follows: 400—499 (400 MHz band), 500—599 (500 MHzband), 600—699 (600 MHz band), 700—799 (700 MHz band),800—899 (800 MHz band). For future measurements, thedevelop bash script will be will be modified to capture thespectrum in the 900 MHz band for GSM.
The design of the measurement setup is shown in Figure2 while the actual devices are shown in Figure 3.
Fig. 2. Measurement setup.
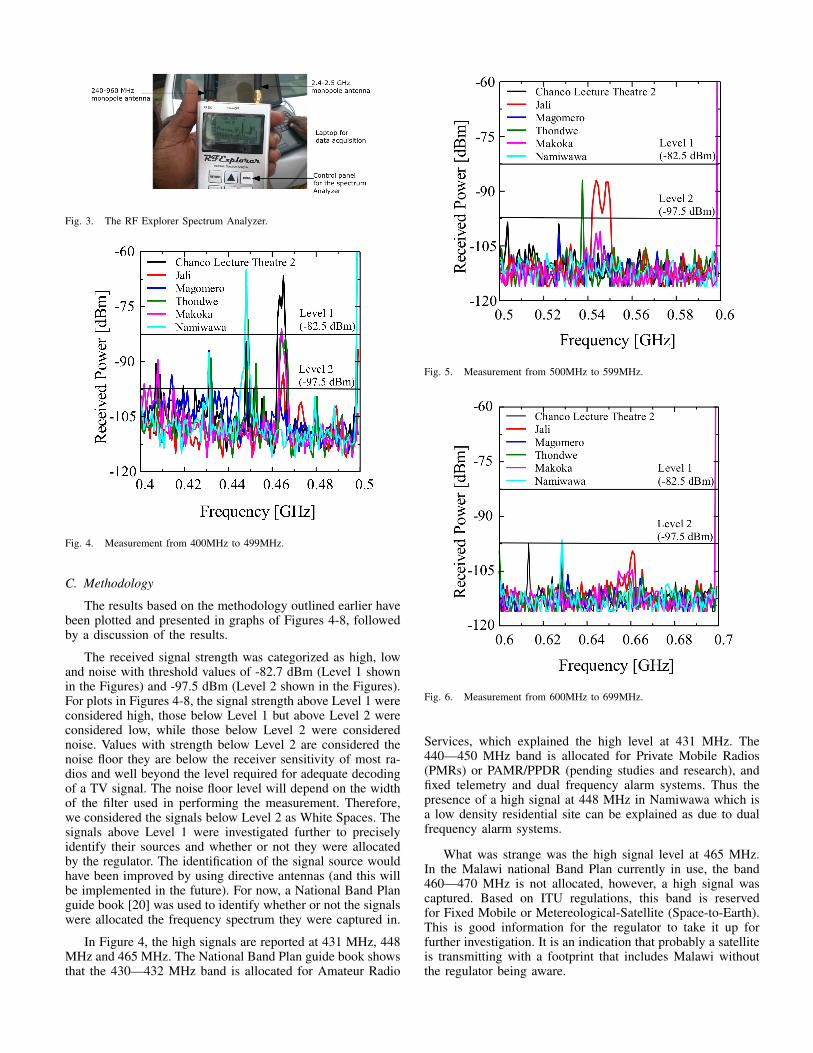
Fig. 3. The RF Explorer Spectrum Analyzer.
Fig. 4. Measurement from 400MHz to 499MHz.
C. Methodology
The results based on the methodology outlined earlier havebeen plotted and presented in graphs of Figures 4-8, followedby a discussion of the results.
The received signal strength was categorized as high, lowand noise with threshold values of -82.7 dBm (Level 1 shownin the Figures) and -97.5 dBm (Level 2 shown in the Figures).For plots in Figures 4-8, the signal strength above Level 1 wereconsidered high, those below Level 1 but above Level 2 wereconsidered low, while those below Level 2 were considerednoise. Values with strength below Level 2 are considered thenoise floor they are below the receiver sensitivity of most ra-dios and well beyond the level required for adequate decodingof a TV signal. The noise floor level will depend on the widthof the filter used in performing the measurement. Therefore,we considered the signals below Level 2 as White Spaces. Thesignals above Level 1 were investigated further to preciselyidentify their sources and whether or not they were allocatedby the regulator. The identification of the signal source wouldhave been improved by using directive antennas (and this willbe implemented in the future). For now, a National Band Planguide book [20] was used to identify whether or not the signalswere allocated the frequency spectrum they were captured in.
In Figure 4, the high signals are reported at 431 MHz, 448MHz and 465 MHz. The National Band Plan guide book showsthat the 430—432 MHz band is allocated for Amateur Radio
Fig. 5. Measurement from 500MHz to 599MHz.
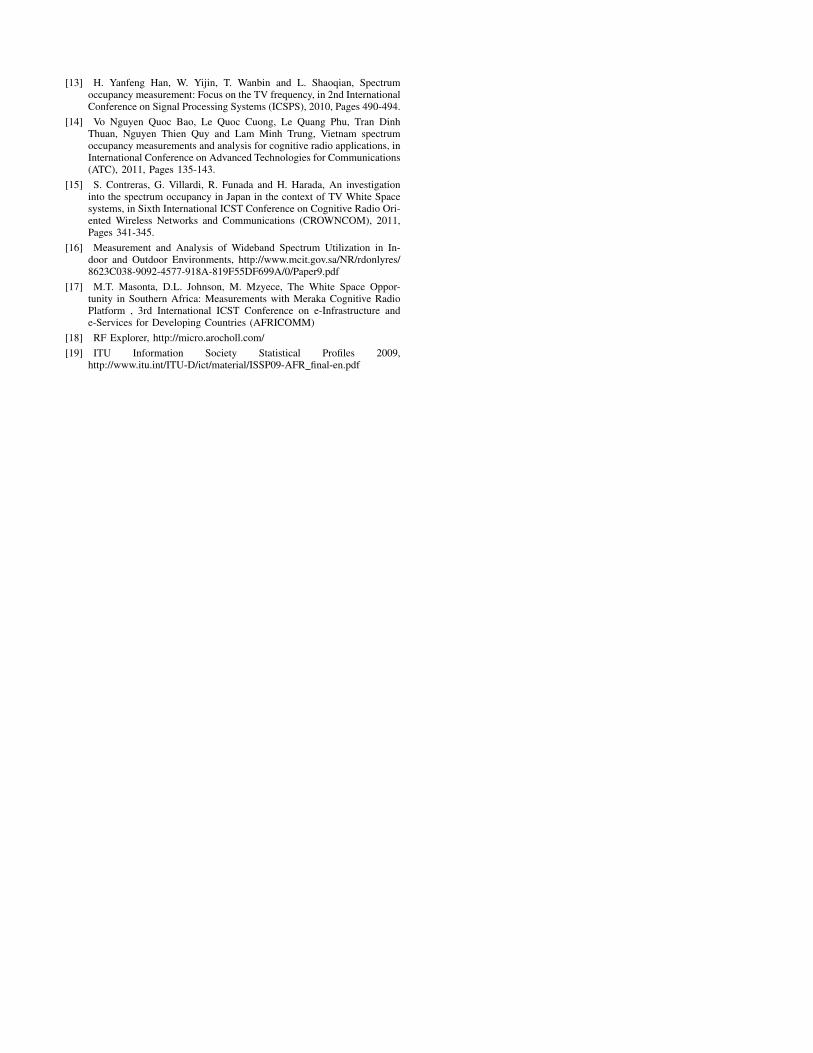
Fig. 6. Measurement from 600MHz to 699MHz.
Services, which explained the high level at 431 MHz. The440—450 MHz band is allocated for Private Mobile Radios(PMRs) or PAMR/PPDR (pending studies and research), andfixed telemetry and dual frequency alarm systems. Thus thepresence of a high signal at 448 MHz in Namiwawa which isa low density residential site can be explained as due to dualfrequency alarm systems.
What was strange was the high signal level at 465 MHz.In the Malawi national Band Plan currently in use, the band460—470 MHz is not allocated, however, a high signal wascaptured. Based on ITU regulations, this band is reservedfor Fixed Mobile or Metereological-Satellite (Space-to-Earth).This is good information for the regulator to take it up forfurther investigation. It is an indication that probably a satelliteis transmitting with a footprint that includes Malawi withoutthe regulator being aware.
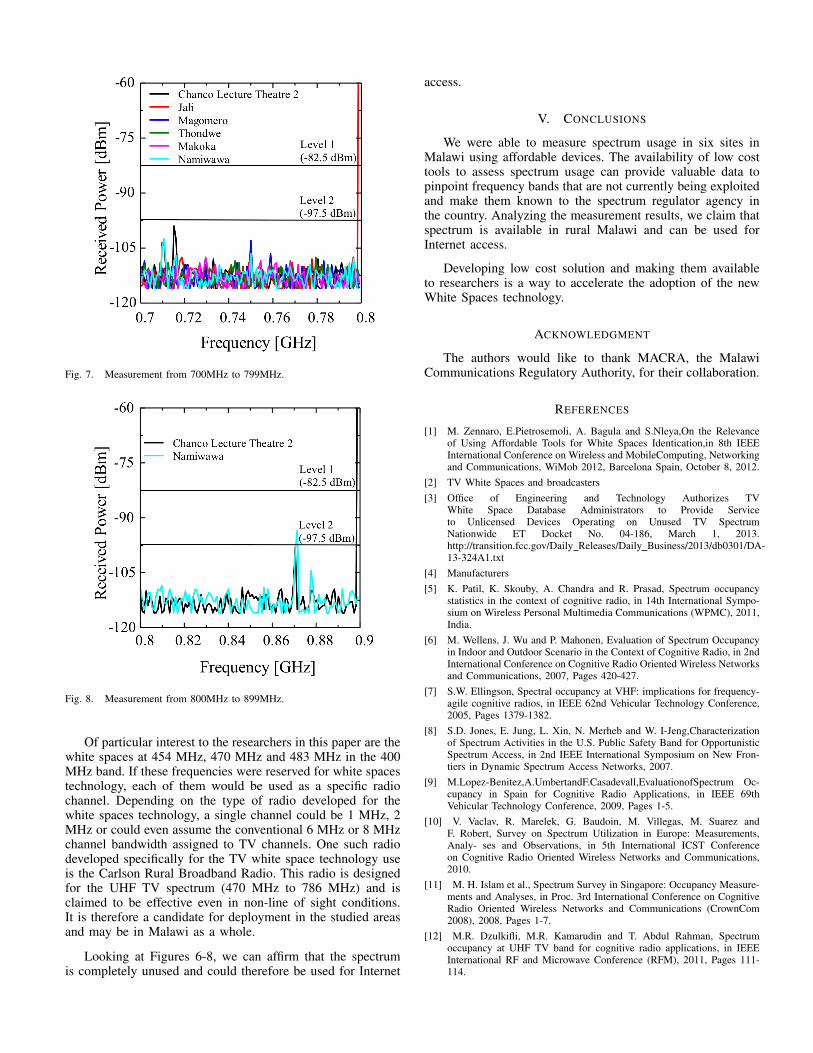
Fig. 7. Measurement from 700MHz to 799MHz.
Fig. 8. Measurement from 800MHz to 899MHz.
Of particular interest to the researchers in this paper are thewhite spaces at 454 MHz, 470 MHz and 483 MHz in the 400MHz band. If these frequencies were reserved for white spacestechnology, each of them would be used as a specific radiochannel. Depending on the type of radio developed for thewhite spaces technology, a single channel could be 1 MHz, 2MHz or could even assume the conventional 6 MHz or 8 MHzchannel bandwidth assigned to TV channels. One such radiodeveloped specifically for the TV white space technology useis the Carlson Rural Broadband Radio. This radio is designedfor the UHF TV spectrum (470 MHz to 786 MHz) and isclaimed to be effective even in non-line of sight conditions.It is therefore a candidate for deployment in the studied areasand may be in Malawi as a whole.
Looking at Figures 6-8, we can affirm that the spectrumis completely unused and could therefore be used for Internet
access.
V. CONCLUSIONS
We were able to measure spectrum usage in six sites inMalawi using affordable devices. The availability of low costtools to assess spectrum usage can provide valuable data topinpoint frequency bands that are not currently being exploitedand make them known to the spectrum regulator agency inthe country. Analyzing the measurement results, we claim thatspectrum is available in rural Malawi and can be used forInternet access.
Developing low cost solution and making them availableto researchers is a way to accelerate the adoption of the newWhite Spaces technology.
ACKNOWLEDGMENT
The authors would like to thank MACRA, the MalawiCommunications Regulatory Authority, for their collaboration.
REFERENCES
[1] M. Zennaro, E.Pietrosemoli, A. Bagula and S.Nleya,On the Relevanceof Using Affordable Tools for White Spaces Identication,in 8th IEEEInternational Conference on Wireless and MobileComputing, Networkingand Communications, WiMob 2012, Barcelona Spain, October 8, 2012.
[2] TV White Spaces and broadcasters[3] Office of Engineering and Technology Authorizes TV
White Space Database Administrators to Provide Serviceto Unlicensed Devices Operating on Unused TV SpectrumNationwide ET Docket No. 04-186, March 1, 2013.http://transition.fcc.gov/Daily Releases/Daily Business/2013/db0301/DA-13-324A1.txt
[4] Manufacturers[5] K. Patil, K. Skouby, A. Chandra and R. Prasad, Spectrum occupancy
statistics in the context of cognitive radio, in 14th International Sympo-sium on Wireless Personal Multimedia Communications (WPMC), 2011,India.
[6] M. Wellens, J. Wu and P. Mahonen, Evaluation of Spectrum Occupancyin Indoor and Outdoor Scenario in the Context of Cognitive Radio, in 2ndInternational Conference on Cognitive Radio Oriented Wireless Networksand Communications, 2007, Pages 420-427.
[7] S.W. Ellingson, Spectral occupancy at VHF: implications for frequency-agile cognitive radios, in IEEE 62nd Vehicular Technology Conference,2005, Pages 1379-1382.
[8] S.D. Jones, E. Jung, L. Xin, N. Merheb and W. I-Jeng,Characterizationof Spectrum Activities in the U.S. Public Safety Band for OpportunisticSpectrum Access, in 2nd IEEE International Symposium on New Fron-tiers in Dynamic Spectrum Access Networks, 2007.
[9] M.Lopez-Benitez,A.UmbertandF.Casadevall,EvaluationofSpectrum Oc-cupancy in Spain for Cognitive Radio Applications, in IEEE 69thVehicular Technology Conference, 2009, Pages 1-5.
[10] V. Vaclav, R. Marelek, G. Baudoin, M. Villegas, M. Suarez andF. Robert, Survey on Spectrum Utilization in Europe: Measurements,Analy- ses and Observations, in 5th International ICST Conferenceon Cognitive Radio Oriented Wireless Networks and Communications,2010.
[11] M. H. Islam et al., Spectrum Survey in Singapore: Occupancy Measure-ments and Analyses, in Proc. 3rd International Conference on CognitiveRadio Oriented Wireless Networks and Communications (CrownCom2008), 2008, Pages 1-7.
[12] M.R. Dzulkifli, M.R. Kamarudin and T. Abdul Rahman, Spectrumoccupancy at UHF TV band for cognitive radio applications, in IEEEInternational RF and Microwave Conference (RFM), 2011, Pages 111-114.
[13] H. Yanfeng Han, W. Yijin, T. Wanbin and L. Shaoqian, Spectrumoccupancy measurement: Focus on the TV frequency, in 2nd InternationalConference on Signal Processing Systems (ICSPS), 2010, Pages 490-494.
[14] Vo Nguyen Quoc Bao, Le Quoc Cuong, Le Quang Phu, Tran DinhThuan, Nguyen Thien Quy and Lam Minh Trung, Vietnam spectrumoccupancy measurements and analysis for cognitive radio applications, inInternational Conference on Advanced Technologies for Communications(ATC), 2011, Pages 135-143.
[15] S. Contreras, G. Villardi, R. Funada and H. Harada, An investigationinto the spectrum occupancy in Japan in the context of TV White Spacesystems, in Sixth International ICST Conference on Cognitive Radio Ori-ented Wireless Networks and Communications (CROWNCOM), 2011,Pages 341-345.
[16] Measurement and Analysis of Wideband Spectrum Utilization in In-door and Outdoor Environments, http://www.mcit.gov.sa/NR/rdonlyres/8623C038-9092-4577-918A-819F55DF699A/0/Paper9.pdf
[17] M.T. Masonta, D.L. Johnson, M. Mzyece, The White Space Oppor-tunity in Southern Africa: Measurements with Meraka Cognitive RadioPlatform , 3rd International ICST Conference on e-Infrastructure ande-Services for Developing Countries (AFRICOMM)
[18] RF Explorer, http://micro.arocholl.com/[19] ITU Information Society Statistical Profiles 2009,
http://www.itu.int/ITU-D/ict/material/ISSP09-AFR final-en.pdf