Embed Size (px)
Citation preview
An Assessment of U(VI) Adsorption at Multiple Scales
by
Vijay Anand Loganathan
A dissertation submitted to the Graduate Faculty of
Auburn University
in partial fulfillment of the
requirements for the Degree of
Doctor of Philosophy
Auburn, Alabama
December 13, 2010
Keywords: Adsorption, Uranium, Scaling, Surface Complexation Modeling,
Iron oxide-coated sand, Biochar
Copyright 2010 by Vijay Anand Loganathan
Approved by
Mark O. Barnett, Chair, Professor of Civil Engineering
T. Prabhakar Clement, Professor of Civil Engineering
Yucheng Feng, Associate Professor of Agronomy and Soils
Ahjeong Son, Assistant Professor of Civil Engineering
ii
Abstract
Iron (III) (oxyhydr)oxide coatings on soils and sediments are one of the most
important factors in controlling the adsorption and transport of U(VI) in the subsurface.
In this study, iron-coated sands were prepared via two common protocols, a precipitation
method, where Fe was precipitated directly onto the sand in a single step, and an
adsorption method, where pure goethite was prepared in the first step and then adsorbed
onto the sand in a second step (Chapter 2). The coated sands from both the systems were
characterized using scanning electron microscopy, energy dispersive spectroscopy, x-ray
diffraction, and selective Fe extraction. Although neither of the methods produced a
completely crystalline Fe coating, the precipitation method produced sands with larger
portions of amorphous Fe than the adsorption method, with the fraction of amorphous Fe
decreasing with increasing Fe content.
U(VI) adsorption isotherms and pH adsorption edges were measured on three
coated sands with Fe contents ranging from 0.04 to 0.3% (Chapter 3). Experimentally,
the adsorption of U(VI) onto the three sands was more comparable when normalized to
surface area than when normalized to Fe content. A surface complexation model,
although originally developed for U(VI) adsorption onto amorphous Fe oxide, captured
the differences in adsorption when adjusted for the surface area of the coated sand.
One of the most perplexing and yet unresolved problems is the discrepancy
observed between batch derived and column derived adsorption capacities. Several
studies indicate the existence of the above phenomena, especially when U(VI) has been
iii
used as an adsorbate. One of the goals of this study was to understand the causatives of
the above problem using both natural heterogeneous geomedia and a homogeneous
synthetic adsorbent (Chapter 4). The uncontaminated natural geomedia was obtained
from the Oak Ridge Reservation (OR) and the synthetic media, iron oxide-coated sand
(IOCS), was meticulously prepared in the laboratory.
The OR soil and IOCS were used to perform adsorption experiments with U(VI)
as a solute in both batch and column modes. In the case of batch scale, adsorption
experiments were conducted by varying the solid-to-solution ratio (SSR) over an order of
magnitude at a fixed pH. The results indicated that the adsorption isotherms were scalable
in iron oxide-coated sand system but not in OR soil system. Based on our theoretical
analysis, and also supported by recent literature, the observed phenomenon occurring in
natural soils could be due to a competing solute (e.g. Phosphate) that could affect the
speciation of surface complexes by forming ternary species with U(VI). Hence, our study
underscores the serious implications of transferring adsorption data obtained from
experiments performed at different scales. Although the interactions of U(VI) and Fe-
coated sands were used as representative adsorbate and adsorbent, the general principles
may be applicable to other adsorbate-adsorbent systems as well.
The ever increasing growth of biorefineries is expected to produce huge amounts
of lignocellulosic biochar as a byproduct. The hydrothermal carbonization (HTC) process
to produce biochar from lignocellulosic biomass is getting more attention due to its
inherent advantage of using wet biomass. In the present study, biochar was produced
from switchgrass at 300°C in subcritical water (Chapter 5). The physiochemical
properties indicated that biochar could serve as an excellent adsorbent to remove uranium
iv
from groundwater. A batch adsorption experiment at the natural pH (~ 3.8) of biochar
indicated an H-type isotherm with a maximum sorption capacity of 2 mg/g. The
adsorption process was highly dependent on the pH of the system. An increase towards
circumneutral pH resulted in the maximum U(VI) adsorption of ca. 4 mg g-1
. The results
indicated a strong relationship between the speciation of U(VI) and its adsorption onto
biochar. Our study demonstrates that biochar could be used as an effective adsorbent
medium for U(VI). Overall, the biochar produced via HTC is environmentally benign,
carbon neutral, and efficient in removing U(VI) from groundwater.

v
Abstract (Tamil)
ெபாழி: மண/பவகளி மதான அயசான நிலதி
உபரபி அட"ய#(VI) $றறி&ச ம'(# கடத ஆகியவ'ைற
த+,மானி-.# /-கிய காரணியாக விள.கிற. இ2த ஆ3வி ம4ணி
ம அயைத படலமாக ச இர45 ெவ7ேவ( ெசய/ைறக9
ைகயாளெப'றன. அைவயாவன /ைறேய (அ) ம4 ம அயைத
ேநரயாக வ +<பயெச3த ம'(# (ஆ) =ய ேகாயிைத தயா"தபி
அயதிைன அத ம $றறியெச3த ஆ.# (உபி">-2). இ7வி?
/ைறைமக9 வழியாக># ேம'படல# அைமயெப'ற ம4களி
ப4பிய$க9 மினிய A4ெப?-கி, ச-திவளைத சிதறைவ ெச3B#
நிறமாைலயிய, ஊ5கதி, அைலவைள>, ம'(# ேத,>/ைறயி
அயதிைன பி"த ஆகிய /ைறகளி அறியபடன. இ7வி?
/ைறகDேம /'றிE# பளி.(>9ள அயசிைன உ?வா-கவிைல.
ஆயிF#, வ +<ப> /ைறைய- காE# $றறி&ச /ைற ெப?மள>
உ?வ'ற அயடனான ம4ைண உ'பதி ெச3த. ேமE# அயதி
உ9ள +5 அளைவ அதிக"-.# ேபா உ?வ'ற அயபவதி விகித#
.ைறவைத காண/கிற.

vi
G( ெவ7ேவ( உ9ள +5 அள>களி (0.04 - 0.3 விH-கா5) அயI
ேம'ெகா9ளபட மணலான (IOCS), அட"ய#(VI) $றறி&ச ெவப
பவ# ம'(# அமிலதைம வர$க9 ஆகிய
ேசாதைனகD-.ப5தெப'றன (உபி"> - 3). ஆ3வி அபைடயி
ேநா-.ைகயி அட"ய#(VI) $றறி&ச ஆன அயதி
உ9ள +டளவிைன விட># ம4ணி ேம'பரபிைன- ெகா45
ெபாப5# ேபா ஒபிட எளிதாயி?பைத- காண /கிற.
ஒசிேய'ற# ெப'ற, உ?வ'ற அயதி அட"ய#(VI) $றறி&ச
தைமைய அறிய ஏ'கனேவ உ?வா-கபட பர$ சி-க'ேச,ைவ மாதி"
வவைமபா, த'ேபாைதய ஆ3வி காணப5# மணலி பரபி'.#
$றறி&ச திறதி'.# உ9ள ஒ'(ைமைய எளிதி விள-க /கிற.
இ7வைக ஆ3வி Nதனமாக># த+,> காணபட /யாததாக>#
நிைலெப'றி?ப யாெதனி, ெதா.தி ம'(# நிர /ைறகளி
$றறி&ச திறனி காணப5# ேவ(பாேடயா.#. அட"ய#(VI)-ஐ
$றறி&Iப5ெபா?ளாக பயப5ைகயி இ7வா( ேவ(பா5
உ9ளைத பல ஆ3> />க9 க45ண,29ளன. இ2த ஆரா3சியி
/-கிய ேநா-கமான ேம'Pறிய சி-கலிைன இ?ேவ(
Gலெபா?கைள- (பைம-P(9ள இய'ைக ம4 ம'(#
ஒ?ைம-P(9ள ெசய'ைக உறி&சி) ெகா45 சி-கலி காரணகைள

vii
ெதளி>பட அறிவேத (ேநா-.க உபி"> - 4). ஓ- "R "ச,ேவஷ(OR)-
லி?2 ெகாணரபட, அட"ய#(VI)அ'ற இய'ைக ம4, ம'(# மிக
Aபமான /ைறயி ஆ3>-Pடதி தயா"-கபட அயசிடம4
ஆகியைவ ேம'Pறிய ஆ3வி பயப5தபடன.
அட"ய#(VI)ஐ கைரயமாக- ெகா45 ெதா.தி ம'(# நிர
/ைறகளி OR ம'(# IOCS-களி $றறி&ச திற ஆயபட.
அமிலதைமைய நிைலயாக># தி4ம கைரச விகிதாசாரதிைன ஒ?
தசம அள> வைரயிலான மாறிலியாக># ெகா45 ெதா.தி /ைற
$றறி&ச ேசாதைனக9 ேம'ெகா9ளபடன. IOCS மணலின
$றறி&ச ெவப பவமான OR மணலிைன- காE# மடகிட
பட-Pயதாக உ9ளைத />க9 Gல# அறிய இயE#.
அட"ய#(VI)ஆன மணEட சி-க'ேச,ைவயாக இன# T# அேத
ேவைளயி ம'(ெமா? கைரயட (எ.கா. நாEயிரகத+/றி
மிUடT) /#ைமேச,ைவ Gல# இன# Tதேல, இய'ைக
மணலிட# காணப5# $றறி&ச ேவ(பா5கD-. காரணெமன க?த
இட/45 எபதைன இ2த ஆ3> ம5மிறி ஏைனய அ4ைம-கால
ஆ3>கD# வலிB(கிறன. ஆைகயினா, $றறி&ச திறைன
கண-கி5#ேபாH ஒ? மடகி ெச3யபடைத- ெகா45 ம'ெறா?
மடகி'கான திறைன நி(வ இயலா எபதைன இ. Iட
viii
வி?#$கிேறா#. இ7வா3வான அட"ய#(VI)ஐ
$றறி&Iப5ெபா?ளாக># அயசிட மணலிைன $றறி&சியாக>#
/னி(தி ெச3யப?பிF# ஏைனய $றறி&Iப5ெபா?9-
$றறி&சி அைம$கD-.# இ2த ெசய'பா5க9 ெபாவானேத.
வள,2 வ?# எ4ணி-ைகயிலான உயி"Iதிக"$ நிைலயக9
ெப?மளவி மரநா, உயி"ப'பதிைன (Biochar) உபெபா?ளாக ெவளிவி5#
எ( எதி,பா,-கப5கிற. உயி"திணிவிலி?2 உயி"ப'ப# தயா"-.#
ந+,சா,2த ெவபவிய' க"யமா-க (HTC) /ைறயான ஈரமான
உயி"திணிைவ பயப5கிறதாதலா மி-க நைமகைள பய-.#.
இ. ேம'ெகா9ளபட ஆ3வி 300 சதம அளைவ (degree C) ெவ2ந+"
ஒ?வைக ேகாைர$லிலி?2 (switchgrass) உயி"ப'ப# தயா"-கபட
(ேநா-.க உபி"> - 5). நிலத ந+"லி?2 அட"யதிைன $றறிய
ேதைவயான தைமக9 உயி"ப'பதி உ9ளெதன அதனி இய-ேவதி
ப4$க9 உண,கிறன. ஏறதாழ 3.8 அமிலதைம ெகா4ட
உயி"ப'பதிைன பயப5தி ெதா.தி /ைற $றறி&ச ேசாதைன
ெச3யபட. அதிகபயாக 2 mg g-1 உறி&ச திறF9ள H-ரக ெவப
பமக9 க4டறியபடன. ேமE# இ7வாறான உறி&ச திற
அைமபி அமிலதைமயிைன ெப?மளவி சா,2தி?ப
ெத"யவ29ள. ந+"ைன ஒத அமிலதைம .றியைன

ix
ெந?.ைகயி அதி-கபயான அட"ய#(VI) (ஏறதாழ 4 mg g-1)
$றறியப5வைத காண இயE#. அட"ய#(VI) இன# TதE-.#
உயி"ப'பதி $றறிதிறF-.# இைடேய வEமி-க உற> இ?பதைன
இ7வா3> />க9 ெத"வி-கிறன. உயி"ப'பமான அட"ய#(VI)இைன
திற#பட $றறிB# ஊடக# எபைத ேம'Pறிய ேசாதைனக9
ெதளி>ப5கிறன. ந+,சா,2த ெவபவிய' க"யமா-க /ைறயி
உ'பதி ெச3யபட உயி"ப'ப# YழியE-. இைய2ததாக>#, க"ய
/ைனப'ற#, நிலத ந+"லி?2 அட"ய#(VI)ஐ மி.தியாக ந+-.#
திறF9ளதாக># அைமயெப'( விள.கிற.
x
Acknowledgments
I would like to express my sincere gratitude to my advisor Dr. Mark O. Barnett,
for his guidance and continued support throughout my dissertation work. It would have
been impossible for me to complete this work without his advice. I would like to express
my sincere thanks to Dr. T. Prabhakar Clement, for without his support, my goal of
pursuing higher education at the United Sates would have been a much harder task.
I would like to whole-heartedly acknowledge the support of my committee
members, Dr. Yucheng Feng and Dr. Ahjeong Son, for their willingness to be a part this
work. Their suggestions greatly helped improve this dissertation. My sincere thanks to
Dr. Anne Gordon, for readily accepting my request to be the outside reader. I would
always remain thankful for her support in helping me get a graduate teaching
assistantship in the Department of Chemistry during the last year of my research work. A
mere acknowledgement in few sentences would definitely not suffice for the efforts and
support given by my family members all through my life, especially in this undertaking.
Also, I would like to express my sincere appreciation to all my friends for their constant
support in this endeavor. Especially, I would like to appreciate Mr. Mahendran
Balasubramanian and Mr. Karthikeyan Balasubramanian for their quality translation of
the dissertation’s abstract in Tamil language.
I would like to extend my acknowledgment to all the people, especially my
teachers, who inspired and helped me to pursue higher studies. A subset of them includes
Dr. Nagabhushana Rao, Dr. Jacob Dane, Dr. Albrecht Schmitt, and Dr. Usha Natesan. I
xi
would also like to thank Dr. Jeffrey Fergus, Dr. John Gordon for spending their valuable
time in providing insightful suggestions.
My sincere thanks to Dr. Sandeep Kumar’s whose support and understanding
helped in carrying-out a collaborative study. Also, I would like to extend my thanks to Dr.
Ram B. Gupta and his research group for their support in the above collaboration. I
would like to express my gratitude to Dr. Zhao and Dr. Michael Miller for offering their
laboratory equipment and facilities, respectively. I greatly appreciate Mr. Jinling Zhung
for being an ever-helpful laboratory supervisor, and Ms. Sherry Smith for her help with
administrative support. Also, I would like to thank Mr. Roy Howard, Mr. Thomas
Carrington, Mr. William Wills, and Mr. Allen Screws for their training and support.
I greatly appreciate all the various funding sources that helped me to carry-out
this research work. The funding sources include Office of Science (BER), U.S.
Department of Energy Grant No. DE-FGO2-06ER64213, Sustainable Water Resources
Research Center of Korea’s 21st Century Frontier Research Program via Seoul National
University, Department of Civil Engineering via the start up Grant support of Dr. T.
Prabhakar Clement, Department of Civil Engineering’s Graduate Teaching Assistantship,
Dr. Barnett’s research grant with Office of Science (BER), U.S. Department of Energy.
My special thanks to Dr. Vince Cammarata, Mr. Steve Swann, and Ms. Lynn Walker in
Department of Chemistry and Biochemistry for supporting me with the graduate teaching
assistantship for the last four semesters that allowed me to finish my research as planned.
Finally, I would like to thank all the office personnel in Graduate School, and the Office
of International Education that always welcomed me and made my stay and study in
Auburn a memorable one to cherish, overall.
xii
Table of Contents
Abstract ............................................................................................................................... ii
Abstract (Tamil)...................................................................................................................v
Acknowledgments............................................................................................................... x
List of Figures ................................................................................................................... xv
List of Tables ................................................................................................................... xix
1. Introduction and Objectives.............................................................................................1
1.1 Background ........................................................................................................1
1.2 Fundamental U(VI) Reactions ...........................................................................2
1.3 Precipitation-Dissolution and Redox Reactions ................................................8
1.4 Surface Complexation Modeling .......................................................................9
1.5 Scaling..............................................................................................................14
1.6 Research Objectives.........................................................................................15
1.7 Organization of the Dissertation ......................................................................16
1.8 References........................................................................................................17
2. Synthesis and Characterization of Iron Oxide-Coated Sand..........................................22
2.1 Introduction......................................................................................................22
2.2 Materials and Methods.....................................................................................23
2.3 Results and Discussion ....................................................................................28
2.4 Summary and Conclusions ..............................................................................38
xiii
2.5 References........................................................................................................39
3. Scaling of Adsorption in Batch Systems: U(VI) Experiments and Modeling ...............42
3.1 Introduction......................................................................................................42
3.2 Materials and Methods.....................................................................................44
3.3 Results and Discussion ....................................................................................49
3.4 Summary and Conclusions ..............................................................................61
3.5 References........................................................................................................62
4. Understanding the Adsorption Discrepancies between Batch and Column Scenarios..66
4.1 Introduction......................................................................................................66
4.2 Materials and Methods.....................................................................................68
4.3 Results and Discussion ....................................................................................70
4.4 Summary and Conclusion ................................................................................81
4.5 References........................................................................................................81
5. An Assessment of U(VI) Removal from Groundwater using Biochar Produced
from Hydrothermal Carbonization.................................................................................84
5.1 Introduction......................................................................................................84
5.2 Experimental Section .......................................................................................89
5.3 Product Characterization..................................................................................89
5.4 Adsorption Studies...........................................................................................91
5.5 Results and Discussion ....................................................................................93
5.6 Summary and Conclusion ..............................................................................110
5.7 References......................................................................................................111
6. Summary, Implications, and Recommendations .........................................................118
6.1 Summary........................................................................................................118

xiv
6.2 Implications and Recommendations ..............................................................121
xv
List of Figures
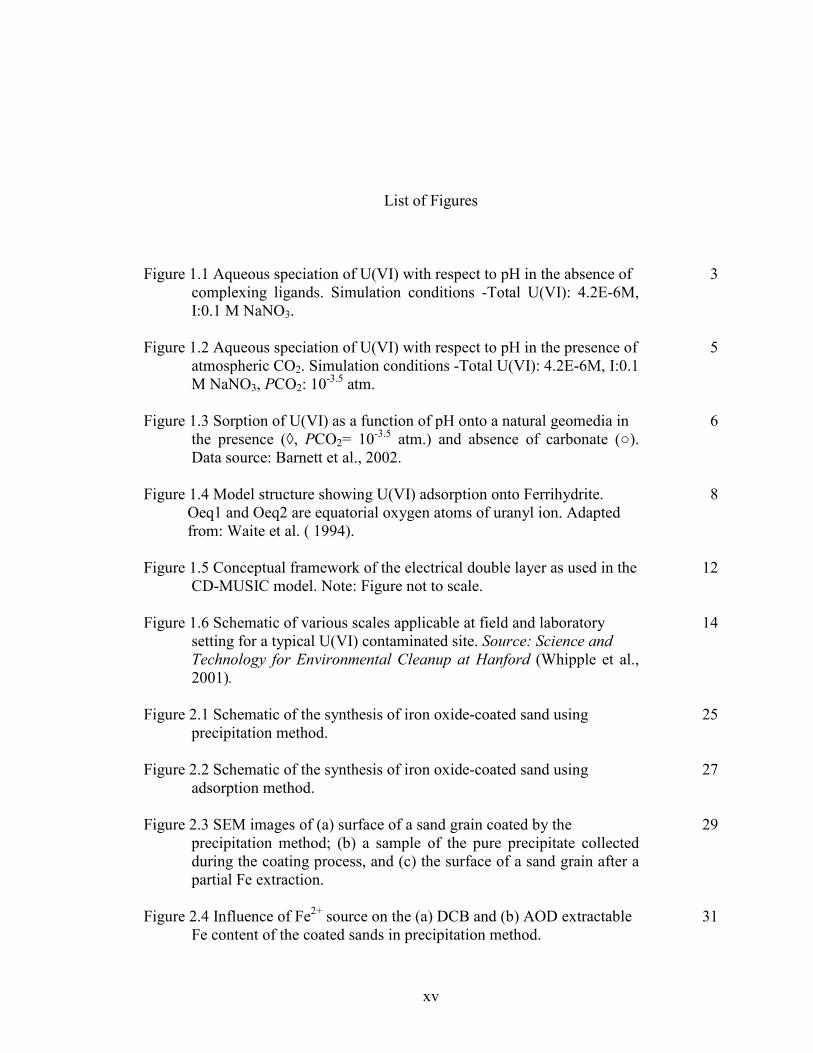
Figure 1.1 Aqueous speciation of U(VI) with respect to pH in the absence of
complexing ligands. Simulation conditions -Total U(VI): 4.2E-6M,
I:0.1 M NaNO3.
3
Figure 1.2 Aqueous speciation of U(VI) with respect to pH in the presence of
atmospheric CO2. Simulation conditions -Total U(VI): 4.2E-6M, I:0.1
M NaNO3, PCO2: 10-3.5
atm.
5
Figure 1.3 Sorption of U(VI) as a function of pH onto a natural geomedia in
the presence (◊, PCO2= 10-3.5
atm.) and absence of carbonate ().
Data source: Barnett et al., 2002.
6
Figure 1.4 Model structure showing U(VI) adsorption onto Ferrihydrite.
Oeq1 and Oeq2 are equatorial oxygen atoms of uranyl ion. Adapted
from: Waite et al. ( 1994).
8
Figure 1.5 Conceptual framework of the electrical double layer as used in the
CD-MUSIC model. Note: Figure not to scale.
12
Figure 1.6 Schematic of various scales applicable at field and laboratory
setting for a typical U(VI) contaminated site. Source: Science and
Technology for Environmental Cleanup at Hanford (Whipple et al.,
2001).
14
Figure 2.1 Schematic of the synthesis of iron oxide-coated sand using
precipitation method.
25
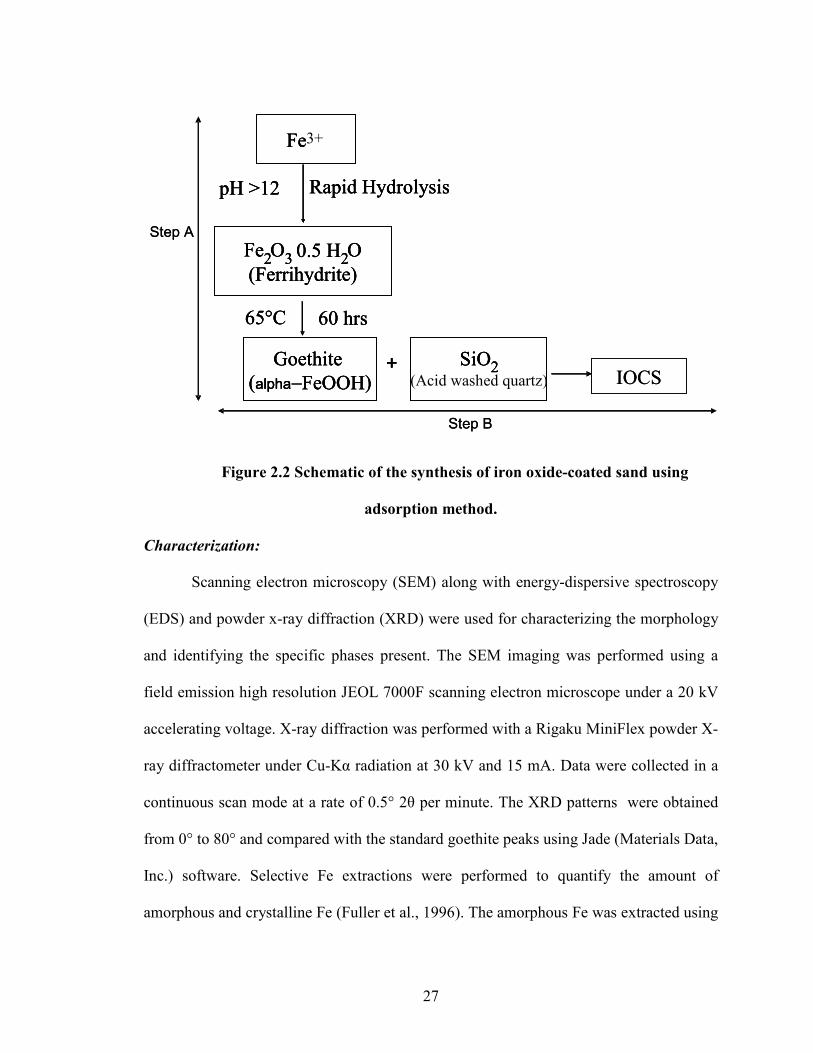
Figure 2.2 Schematic of the synthesis of iron oxide-coated sand using
adsorption method.
27
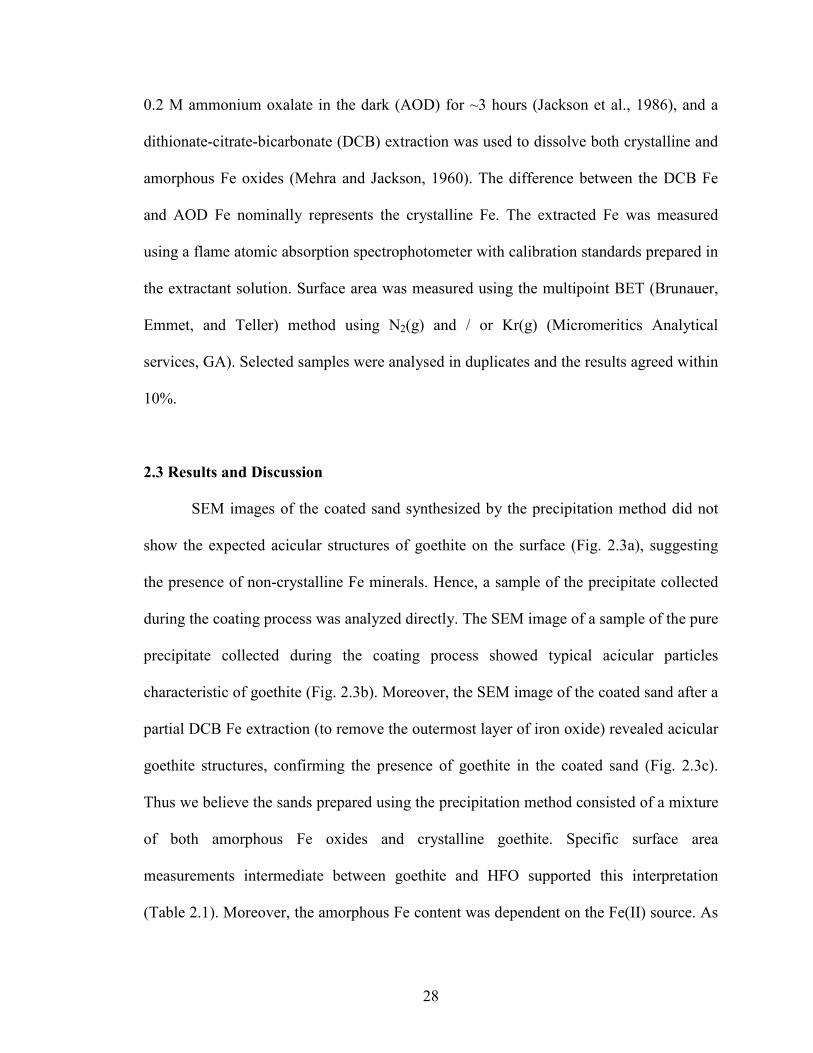
Figure 2.3 SEM images of (a) surface of a sand grain coated by the
precipitation method; (b) a sample of the pure precipitate collected
during the coating process, and (c) the surface of a sand grain after a
partial Fe extraction.
29
Figure 2.4 Influence of Fe2+
source on the (a) DCB and (b) AOD extractable
Fe content of the coated sands in precipitation method.
31
xvi
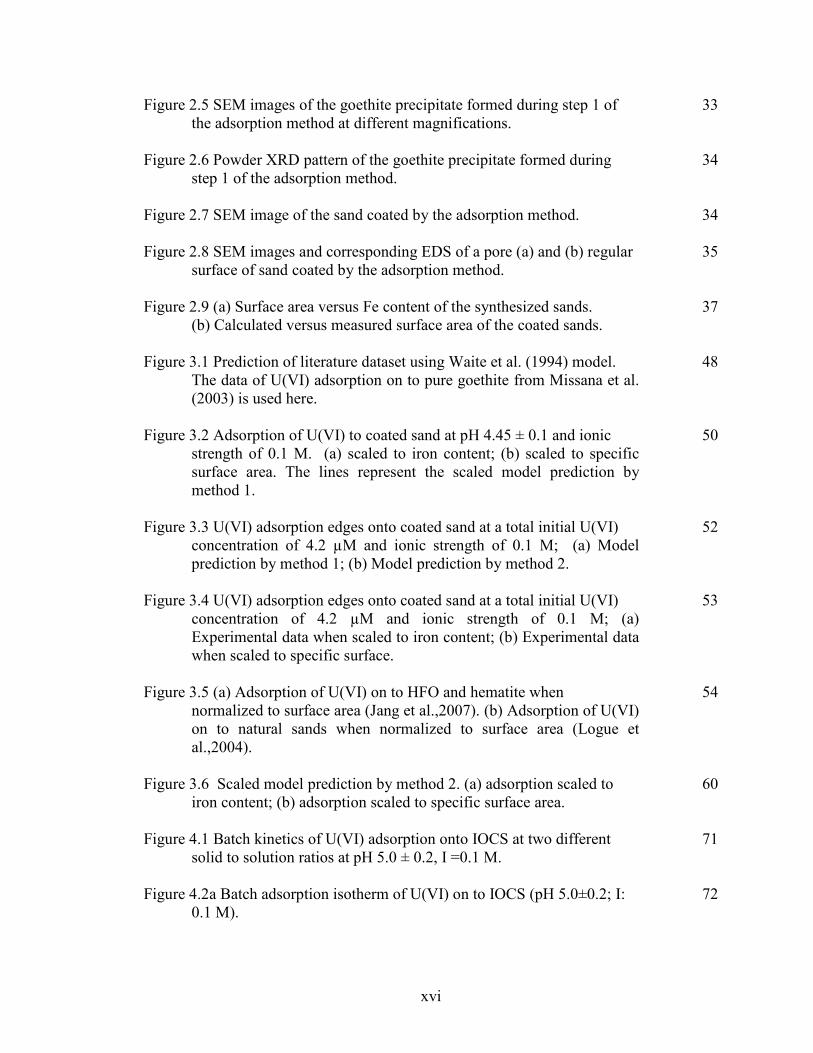
Figure 2.5 SEM images of the goethite precipitate formed during step 1 of
the adsorption method at different magnifications.
33
Figure 2.6 Powder XRD pattern of the goethite precipitate formed during
step 1 of the adsorption method.
34
Figure 2.7 SEM image of the sand coated by the adsorption method.
34
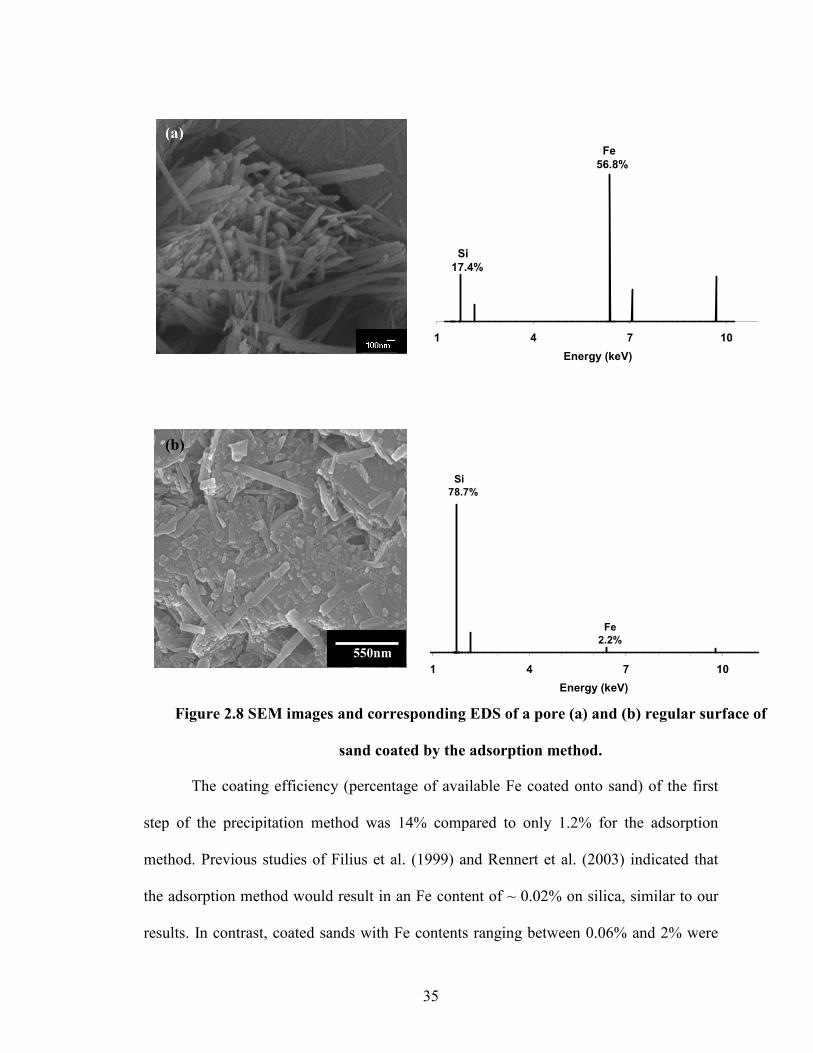
Figure 2.8 SEM images and corresponding EDS of a pore (a) and (b) regular
surface of sand coated by the adsorption method.
35
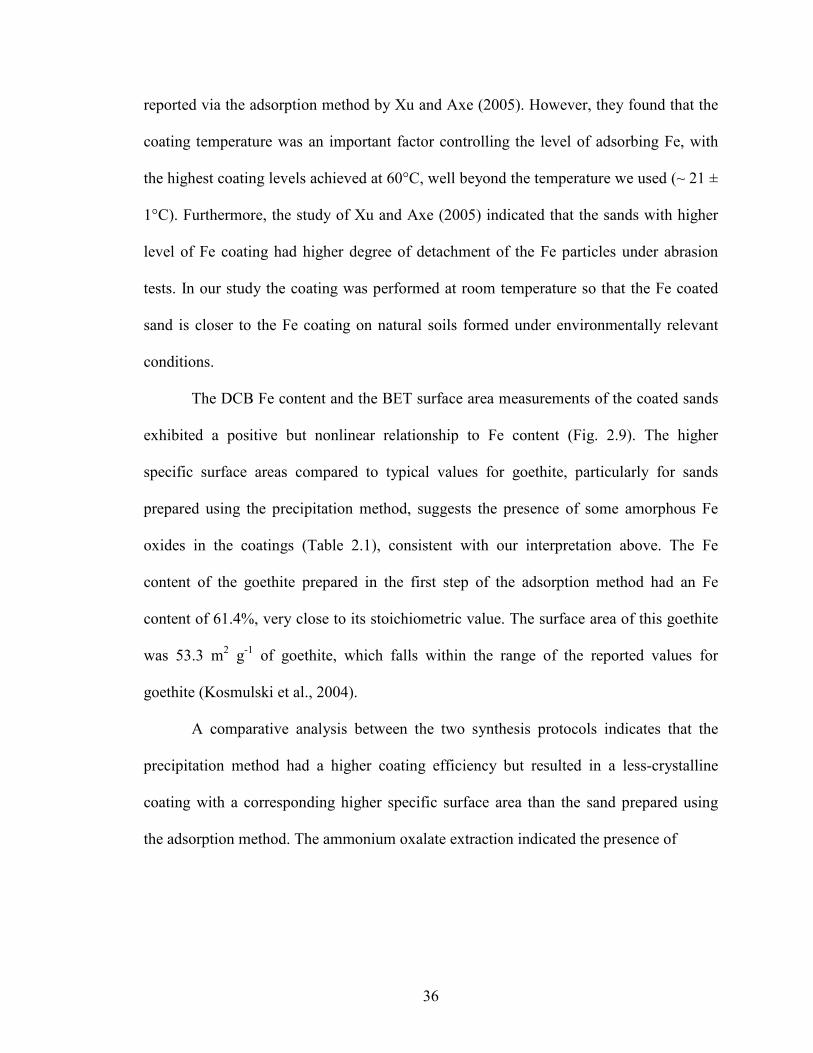
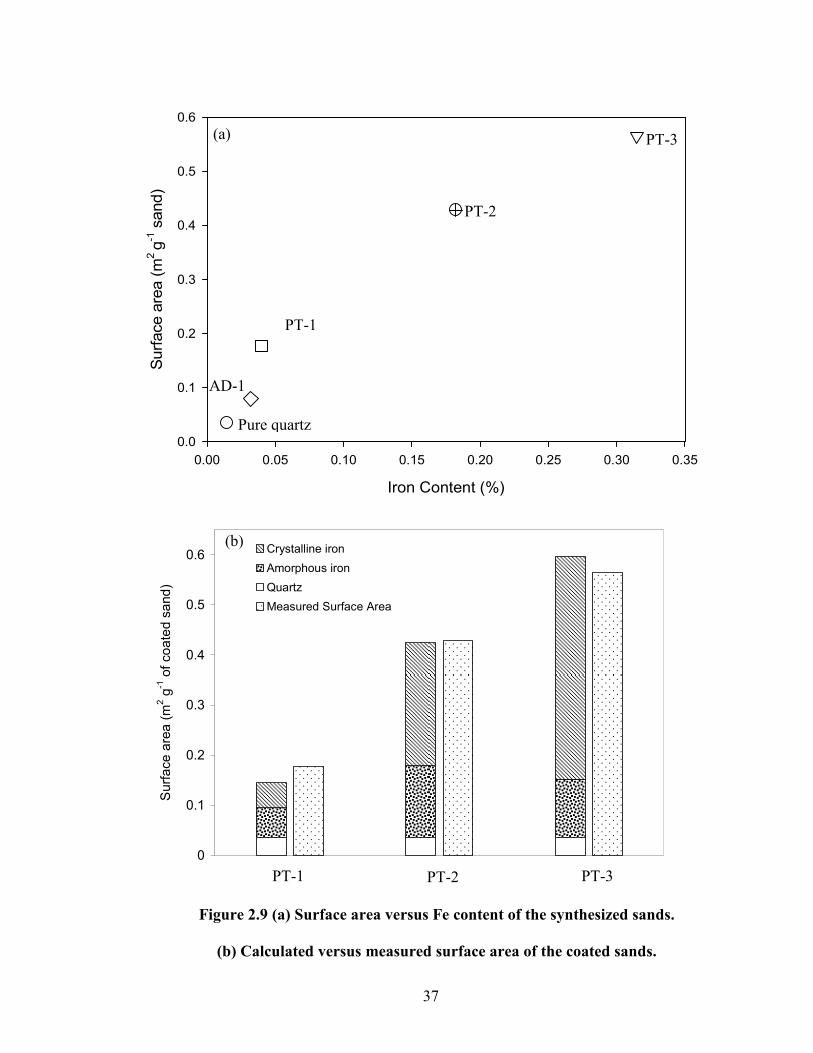
Figure 2.9 (a) Surface area versus Fe content of the synthesized sands.
(b) Calculated versus measured surface area of the coated sands.
37
Figure 3.1 Prediction of literature dataset using Waite et al. (1994) model.
The data of U(VI) adsorption on to pure goethite from Missana et al.
(2003) is used here.
48
Figure 3.2 Adsorption of U(VI) to coated sand at pH 4.45 ± 0.1 and ionic
strength of 0.1 M. (a) scaled to iron content; (b) scaled to specific
surface area. The lines represent the scaled model prediction by
method 1.
50
Figure 3.3 U(VI) adsorption edges onto coated sand at a total initial U(VI)
concentration of 4.2 µM and ionic strength of 0.1 M; (a) Model
prediction by method 1; (b) Model prediction by method 2.
52
Figure 3.4 U(VI) adsorption edges onto coated sand at a total initial U(VI)
concentration of 4.2 µM and ionic strength of 0.1 M; (a)
Experimental data when scaled to iron content; (b) Experimental data
when scaled to specific surface.
53
Figure 3.5 (a) Adsorption of U(VI) on to HFO and hematite when
normalized to surface area (Jang et al.,2007). (b) Adsorption of U(VI)
on to natural sands when normalized to surface area (Logue et
al.,2004).
54
Figure 3.6 Scaled model prediction by method 2. (a) adsorption scaled to
iron content; (b) adsorption scaled to specific surface area.
60
Figure 4.1 Batch kinetics of U(VI) adsorption onto IOCS at two different
solid to solution ratios at pH 5.0 ± 0.2, I =0.1 M.
71
Figure 4.2a Batch adsorption isotherm of U(VI) on to IOCS (pH 5.0±0.2; I:
0.1 M).
72
xvii
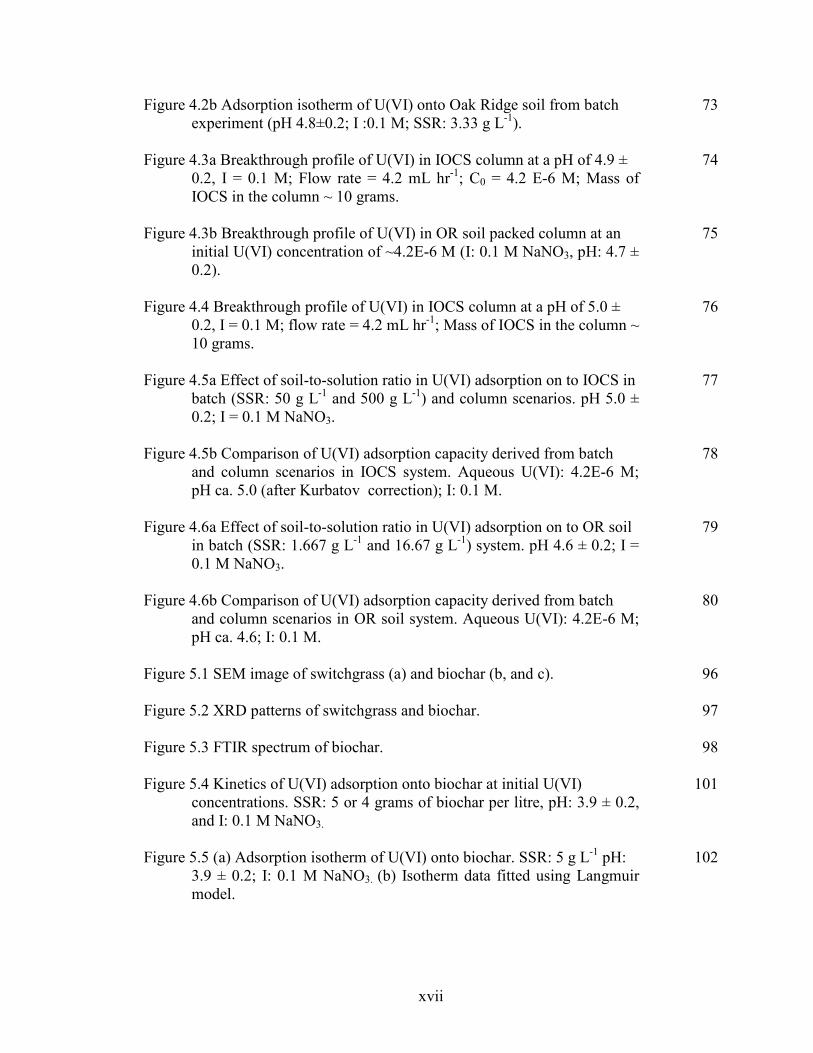
Figure 4.2b Adsorption isotherm of U(VI) onto Oak Ridge soil from batch
experiment (pH 4.8±0.2; I :0.1 M; SSR: 3.33 g L-1
).
73
Figure 4.3a Breakthrough profile of U(VI) in IOCS column at a pH of 4.9 ±
0.2, I = 0.1 M; Flow rate = 4.2 mL hr-1
; C0 = 4.2 E-6 M; Mass of
IOCS in the column ~ 10 grams.
74
Figure 4.3b Breakthrough profile of U(VI) in OR soil packed column at an
initial U(VI) concentration of ~4.2E-6 M (I: 0.1 M NaNO3, pH: 4.7 ±
0.2).
75
Figure 4.4 Breakthrough profile of U(VI) in IOCS column at a pH of 5.0 ±
0.2, I = 0.1 M; flow rate = 4.2 mL hr-1
; Mass of IOCS in the column ~
10 grams.
76
Figure 4.5a Effect of soil-to-solution ratio in U(VI) adsorption on to IOCS in
batch (SSR: 50 g L-1
and 500 g L-1
) and column scenarios. pH 5.0 ±
0.2; I = 0.1 M NaNO3.
77
Figure 4.5b Comparison of U(VI) adsorption capacity derived from batch
and column scenarios in IOCS system. Aqueous U(VI): 4.2E-6 M;
pH ca. 5.0 (after Kurbatov correction); I: 0.1 M.
78
Figure 4.6a Effect of soil-to-solution ratio in U(VI) adsorption on to OR soil
in batch (SSR: 1.667 g L-1
and 16.67 g L-1
) system. pH 4.6 ± 0.2; I =
0.1 M NaNO3.
79
Figure 4.6b Comparison of U(VI) adsorption capacity derived from batch
and column scenarios in OR soil system. Aqueous U(VI): 4.2E-6 M;
pH ca. 4.6; I: 0.1 M.
80
Figure 5.1 SEM image of switchgrass (a) and biochar (b, and c).
96
Figure 5.2 XRD patterns of switchgrass and biochar.
97
Figure 5.3 FTIR spectrum of biochar.
98
Figure 5.4 Kinetics of U(VI) adsorption onto biochar at initial U(VI)
concentrations. SSR: 5 or 4 grams of biochar per litre, pH: 3.9 ± 0.2,
and I: 0.1 M NaNO3.
101
Figure 5.5 (a) Adsorption isotherm of U(VI) onto biochar. SSR: 5 g L-1
pH:
3.9 ± 0.2; I: 0.1 M NaNO3. (b) Isotherm data fitted using Langmuir
model.
102
xviii
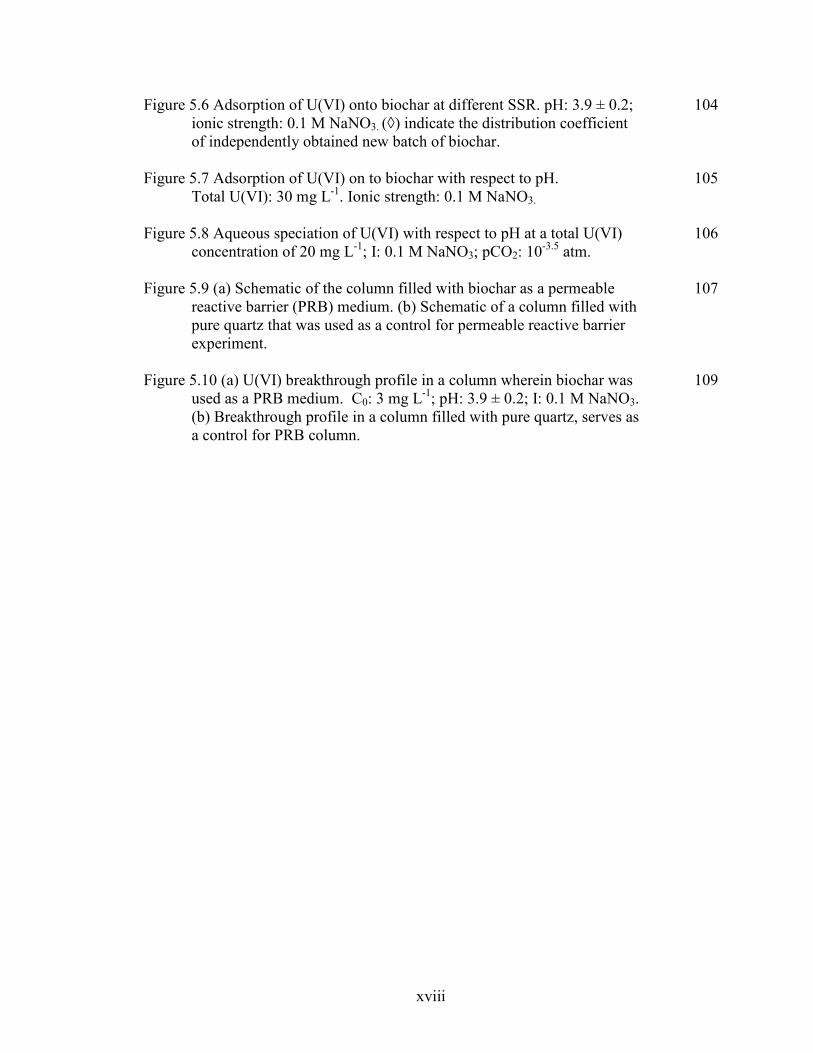
Figure 5.6 Adsorption of U(VI) onto biochar at different SSR. pH: 3.9 ± 0.2;
ionic strength: 0.1 M NaNO3. (◊) indicate the distribution coefficient
of independently obtained new batch of biochar.
104
Figure 5.7 Adsorption of U(VI) on to biochar with respect to pH.
Total U(VI): 30 mg L-1
. Ionic strength: 0.1 M NaNO3.
105
Figure 5.8 Aqueous speciation of U(VI) with respect to pH at a total U(VI)
concentration of 20 mg L-1
; I: 0.1 M NaNO3; pCO2: 10-3.5
atm.
106
Figure 5.9 (a) Schematic of the column filled with biochar as a permeable
reactive barrier (PRB) medium. (b) Schematic of a column filled with
pure quartz that was used as a control for permeable reactive barrier
experiment.
107
Figure 5.10 (a) U(VI) breakthrough profile in a column wherein biochar was
used as a PRB medium. C0: 3 mg L-1
; pH: 3.9 ± 0.2; I: 0.1 M NaNO3.
(b) Breakthrough profile in a column filled with pure quartz, serves as
a control for PRB column.
109
xix
List of Tables
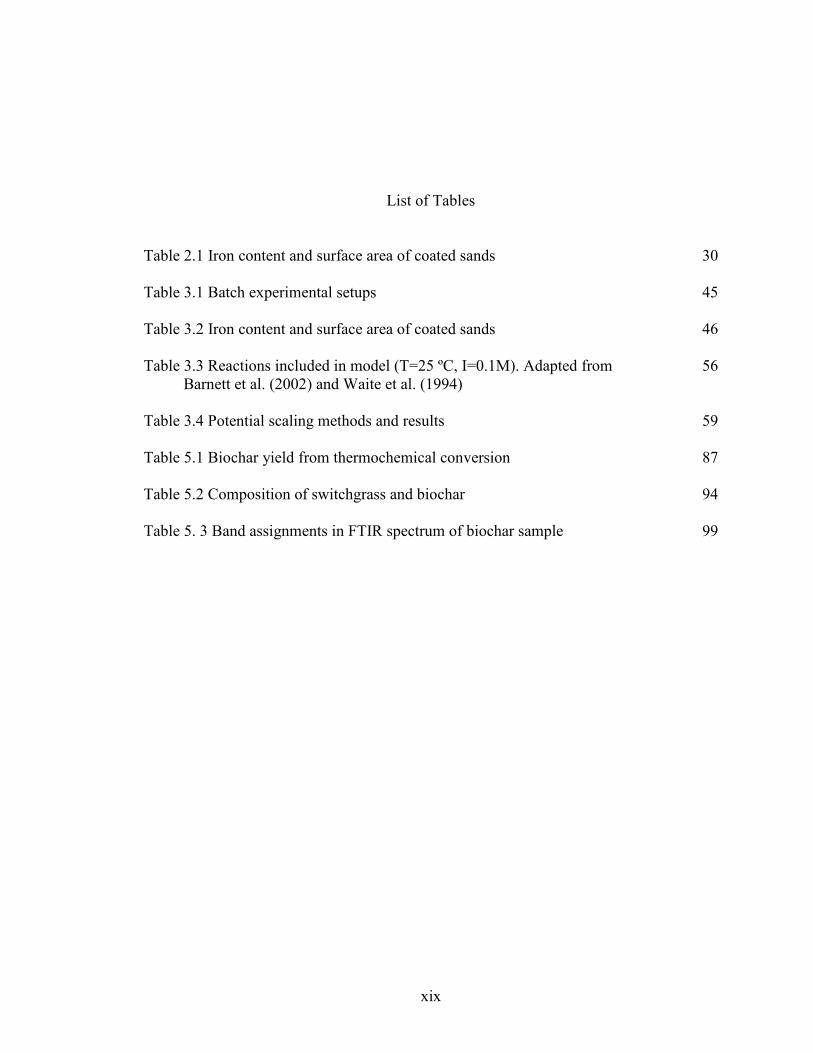
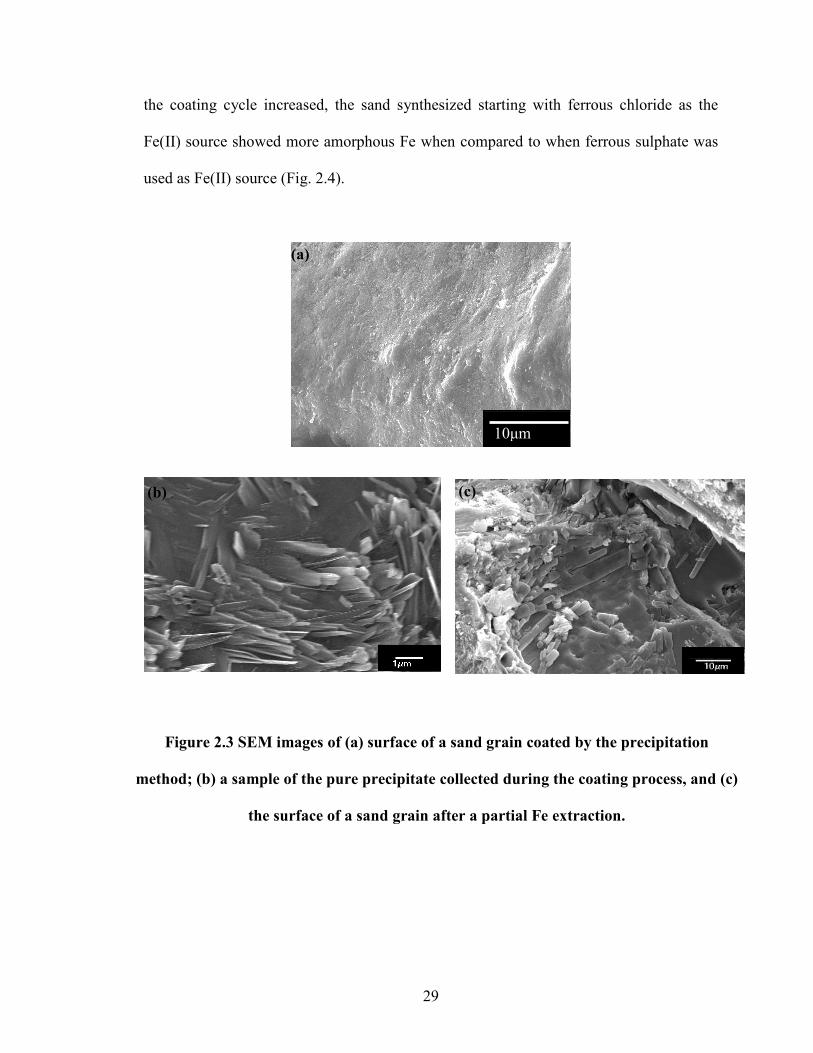
Table 2.1 Iron content and surface area of coated sands
30
Table 3.1 Batch experimental setups
45
Table 3.2 Iron content and surface area of coated sands
46
Table 3.3 Reactions included in model (T=25 ºC, I=0.1M). Adapted from
Barnett et al. (2002) and Waite et al. (1994)
56
Table 3.4 Potential scaling methods and results
59
Table 5.1 Biochar yield from thermochemical conversion
87
Table 5.2 Composition of switchgrass and biochar
94
Table 5. 3 Band assignments in FTIR spectrum of biochar sample 99
1
1. Introduction and Objectives
1.1 Background
The element uranium, represented by the chemical symbol U, is the heaviest
element found naturally on earth. With an atomic number of 92, natural uranium exists in
three isotopes, that include U-234, U-235, and U-238. It is estimated that the earth’s crust
contains about 2.4 ppm of U (Kaltsoyannis and Scott, 1999). The major sources of
uranium includes uraninite (U3O8), coffinite (USiO4), and carnotite
(K2(UO2)2(VO4)2.3H2O). Of the three natural isotopes of uranium, about 99.27% exists in
the form of U-238. The less abundant (0.72%) U-235 is fissile and hence can be exploited
to produce energy or to make nuclear weapons. Hence, the uranium used for the above
processes needs to be enriched in U-235 to carry out continuous fission. An enrichment
of U-235 to about 5% is used in nuclear reactors for producing energy, whereas ~90%
enrichment in U-235 is required to make weapons. In the early 1940’s, uranium was
heavily used in the nuclear weapons program and energy production. Ever since, the vast
use of uranium has left a legacy of contaminants in the subsurface environment especially
at most of the U.S. Department of Energy sites (Gee et al., 2007). The processes of
uranium extraction from ores, uranium enrichment for energy and weapons production,
and the eventual disposal of spent nuclear fuel results in large amount uranium wastes. In
the United States, the uranium containing wastes contained/disposed of at Department of
Energy sites are of serious concern to the environment both because of their quantity and
2
the nearby environment (e.g. adjoining water bodies). Hence an understanding of the
subsurface speciation of uranium is pivotal to assess the fate of uranium in the
environment. The speciation of uranium and its mobility in the subsurface is determined
by some of the common subsurface interactions of U with the geomedia such as sorption-
desorption, precipitation-dissolution, redox reaction etc.
1.2 Fundamental U(VI) Reactions
Although uranium can exist in four different valence states (+3, +4, +5, +6), the
tetravalent and hexavalent forms of uranium are the predominant species encountered in
subsurface anoxic and oxic environments, respectively (Clark et al., 1995). Both the
tetravalent and hexavalent forms of uranium are commonly found as dioxo linkages,
UO2, and UO22+, respectively. The uranyl cation species (UO2
2+) has a linear structure
that contains two oxygen atoms in its axial position, with each oxygen atom forming a
double bond with the central uranium atom (Kaltsoyannis and Scott, 1999). The higher
solubility of U(VI) when compared to U(IV) in the presence of oxygen in the subsurface
makes U(VI) the most prevalent form of U in groundwater. The sorption of U(VI) in the
subsurface is dominated by its interaction with soil minerals, especially metal oxides and
oxyhydroxides of Fe, Al, etc., (Hsi and Langmuir, 1987, Schmeide et al., 2000, Davis et
al., 2004). The sorption of U is determined by its speciation and is highly sensitive to the
pH of the subsurface environment (Waite et al., 1994).
3
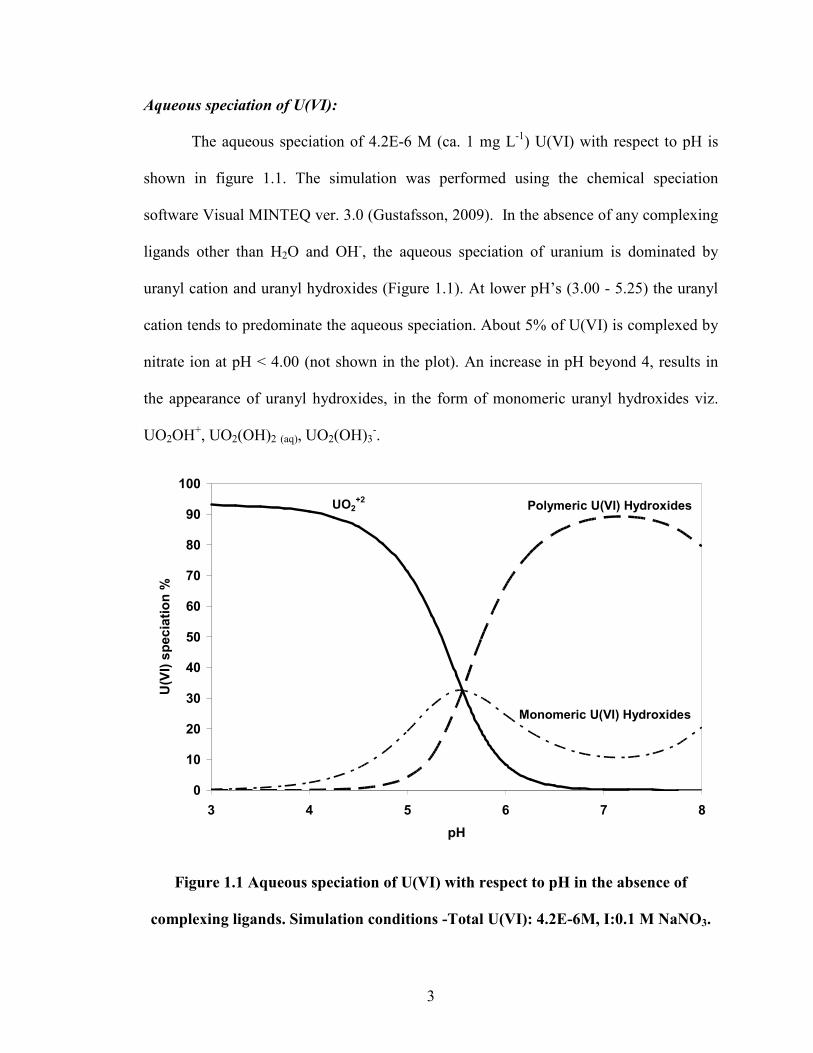
Aqueous speciation of U(VI):
The aqueous speciation of 4.2E-6 M (ca. 1 mg L-1) U(VI) with respect to pH is
shown in figure 1.1. The simulation was performed using the chemical speciation
software Visual MINTEQ ver. 3.0 (Gustafsson, 2009). In the absence of any complexing
ligands other than H2O and OH-, the aqueous speciation of uranium is dominated by
uranyl cation and uranyl hydroxides (Figure 1.1). At lower pH’s (3.00 - 5.25) the uranyl
cation tends to predominate the aqueous speciation. About 5% of U(VI) is complexed by
nitrate ion at pH < 4.00 (not shown in the plot). An increase in pH beyond 4, results in
the appearance of uranyl hydroxides, in the form of monomeric uranyl hydroxides viz.
UO2OH+, UO2(OH)2 (aq), UO2(OH)3-.
0
10
20
30
40
50
60
70
80
90
100
3 4 5 6 7 8
pH
U(V
I) s
pecia
tion %
UO2+2
Monomeric U(VI) Hydroxides
Polymeric U(VI) Hydroxides
Figure 1.1 Aqueous speciation of U(VI) with respect to pH in the absence of
complexing ligands. Simulation conditions -Total U(VI): 4.2E-6M, I:0.1 M NaNO3.
4
A further increase in pH (5.00 – 7.00) favors the formation of polymeric uranyl
hydroxide species viz. (UO2)2(OH)22+, (UO2)2OH3+, (UO2)3(OH)5+, (UO2)3(OH)4
2+,
(UO2)4(OH)7+, (UO2)3(OH)7-, (UO2)3(OH)4
2+. The reversal in the trend of polymeric
uranyl hydroxides beyond pH 7.25 was due to the appearance of uranyl hydroxide anion
in the form of monomeric UO2(OH)3-.
Uranium is a “Hard” Lewis acid and readily forms aqueous complexes with
“Hard” Lewis bases (F-, CO32-, SO4
2- etc.). The most common aqueous U(VI)-Carbonate
reactions are as follows (Phillippi et al., 2007):
*2 0
2 2 3 2 3UO H CO UO CO 2H+ ++ ++ ++ ++ ↔ ++ ↔ ++ ↔ ++ ↔ + (1.1)
* ( )2 2
2 2 3 2 3 2UO 2H CO UO CO 4H+ − ++ − ++ − ++ − ++ ↔ ++ ↔ ++ ↔ ++ ↔ + (1.2)
* ( )2 4
2 2 3 2 3 3UO 3H CO UO CO 6H+ − ++ − ++ − ++ − ++ ↔ ++ ↔ ++ ↔ ++ ↔ + (1.3)
* ( ) ( )2
2 2 2 3 2 2 3 32UO 3H O H CO UO CO OH 5H+ − ++ − ++ − ++ − ++ + ↔ ++ + ↔ ++ + ↔ ++ + ↔ + (1.4)
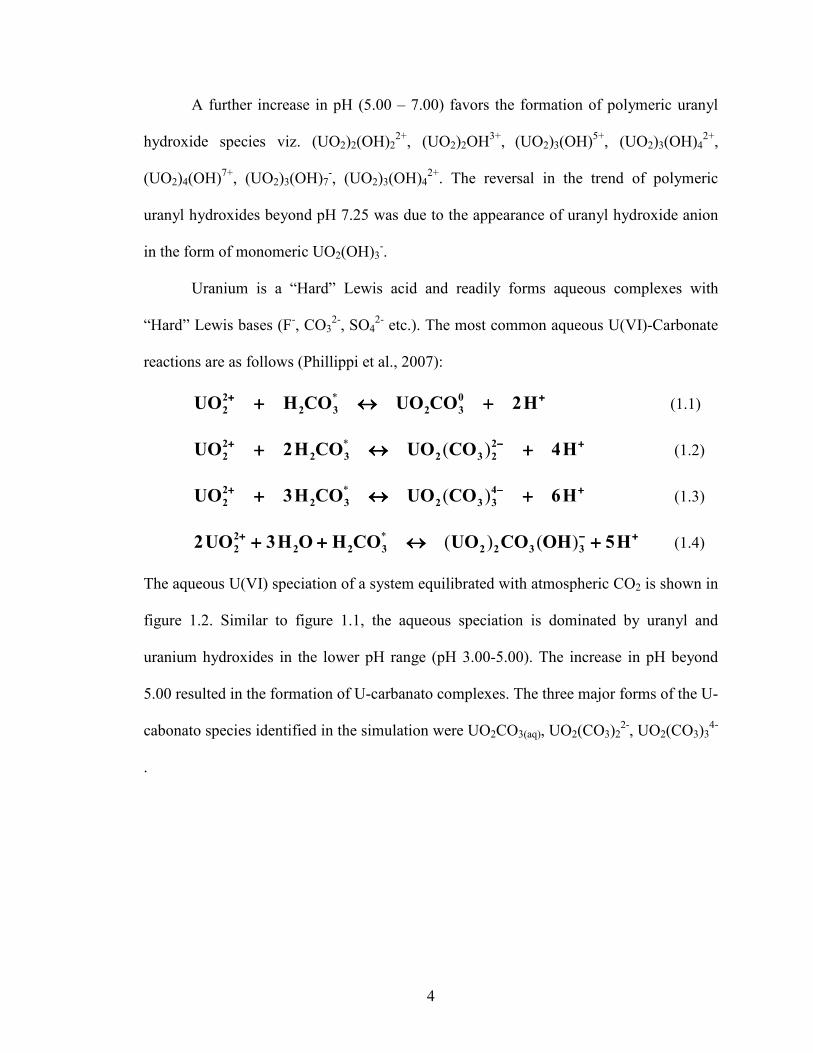
The aqueous U(VI) speciation of a system equilibrated with atmospheric CO2 is shown in
figure 1.2. Similar to figure 1.1, the aqueous speciation is dominated by uranyl and
uranium hydroxides in the lower pH range (pH 3.00-5.00). The increase in pH beyond
5.00 resulted in the formation of U-carbanato complexes. The three major forms of the U-
cabonato species identified in the simulation were UO2CO3(aq), UO2(CO3)22-, UO2(CO3)3
4-
.
5
0
10
20
30
40
50
60
70
80
90
100
3 4 5 6 7 8
pH
U(V
I) s
pecia
tion %
UO2+2
U(VI) Hydroxides
U(VI)-Carbonato
Complexes
Figure 1.2 Aqueous speciation of U(VI) with respect to pH in the presence of
atmospheric CO2. Simulation conditions -Total U(VI): 4.2E-6M, I:0.1 M NaNO3,
PCO2: 10-3.5
atm.
Adsorption of U(VI) onto geomedia:
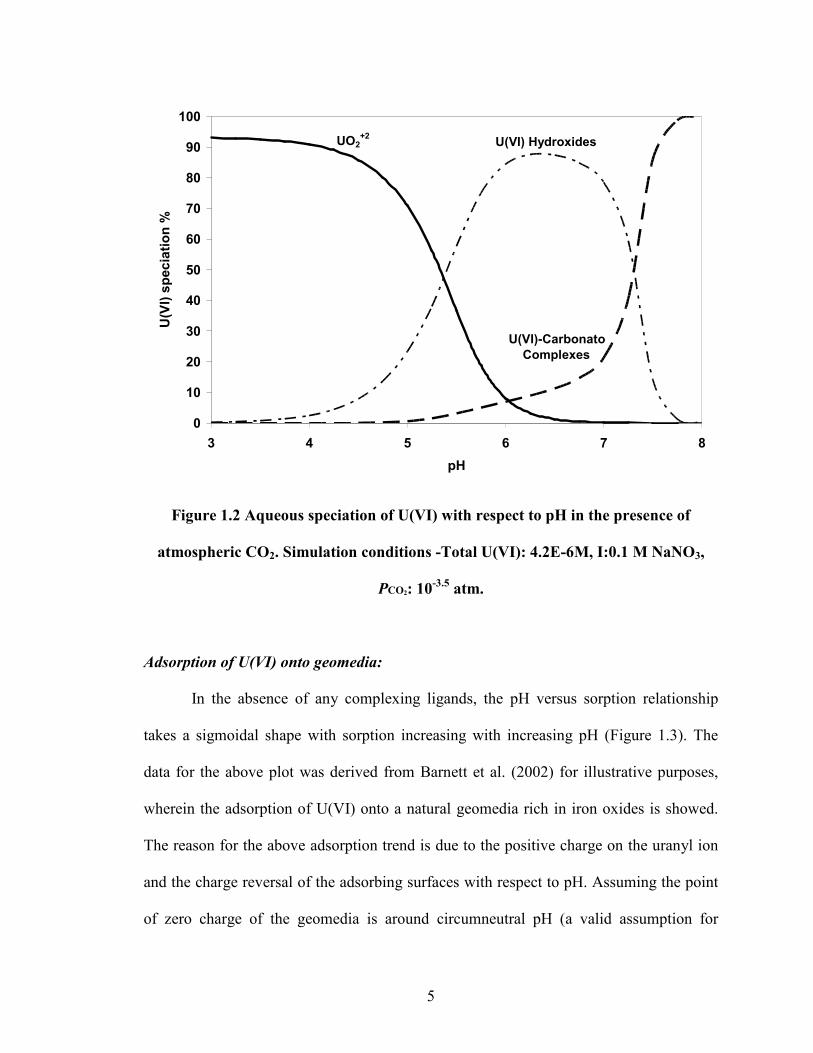
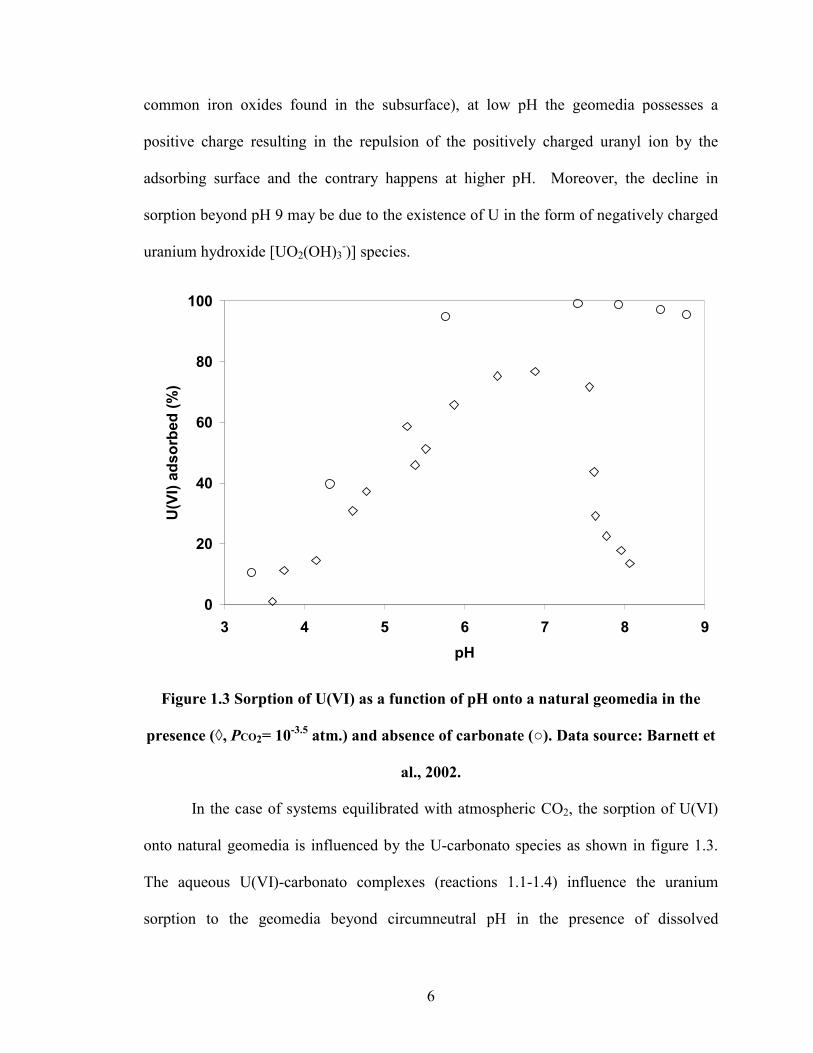
In the absence of any complexing ligands, the pH versus sorption relationship
takes a sigmoidal shape with sorption increasing with increasing pH (Figure 1.3). The
data for the above plot was derived from Barnett et al. (2002) for illustrative purposes,
wherein the adsorption of U(VI) onto a natural geomedia rich in iron oxides is showed.
The reason for the above adsorption trend is due to the positive charge on the uranyl ion
and the charge reversal of the adsorbing surfaces with respect to pH. Assuming the point
of zero charge of the geomedia is around circumneutral pH (a valid assumption for
6
common iron oxides found in the subsurface), at low pH the geomedia possesses a
positive charge resulting in the repulsion of the positively charged uranyl ion by the
adsorbing surface and the contrary happens at higher pH. Moreover, the decline in
sorption beyond pH 9 may be due to the existence of U in the form of negatively charged
uranium hydroxide [UO2(OH)3-)] species.
0
20
40
60
80
100
3 4 5 6 7 8 9
pH
U(V
I) a
dsorb
ed (%
)
Figure 1.3 Sorption of U(VI) as a function of pH onto a natural geomedia in the
presence (◊, PCO2= 10-3.5
atm.) and absence of carbonate (). Data source: Barnett et
al., 2002.
In the case of systems equilibrated with atmospheric CO2, the sorption of U(VI)
onto natural geomedia is influenced by the U-carbonato species as shown in figure 1.3.
The aqueous U(VI)-carbonato complexes (reactions 1.1-1.4) influence the uranium
sorption to the geomedia beyond circumneutral pH in the presence of dissolved
7
carbonates. When compared to the system without carbonate, carbonate-containing
systems indicate a decrease in the sorption of U(VI) beyond pH 7.00 which is caused due
to the formation of aqueous uranium-carbanato complexes. Apart from carbonates, the
presence of other halides (e.g. fluoride), humic acids from natural organic matter
(Lenhart and Honeyman, 1999), and alkaline earth metals like Ca2+, Mg2+ in the
subsurface could form aqueous complexes with U(VI). These aqueous complexes were
shown to be one of the major causes for the mobility of U(VI) in the subsurface and its
far-field transport (Clark et al., 1995; Fox et al., 2006).
As mentioned before, the sorption of U(VI) to geomedia is dominated by the
presence of metal oxides and oxyhydroxides. Moreover, these adsorption reactions are
conceptualized as surface complexation reactions (reactions 1.5 and 1.6) wherein the
aqueous U is complexed by the oxides present on the surface of the geomedia. For
example, in the case of U adsorption to Fe-oxides in carbonate-containing systems, the
following reactions are considered (Phillippi et al., 2007):
( )2 0
s 2 s 2 22 Fe OH UO Fe O UO 2H+ ++ ++ ++ +> + ↔ > +> + ↔ > +> + ↔ > +> + ↔ > + (1.5)
* ( )2 2
s 2 2 3 s 2 2 32 Fe OH UO H CO Fe O UO CO 4H+ − ++ − ++ − ++ − +> + + ↔ > +> + + ↔ > +> + + ↔ > +> + + ↔ > + (1.6)
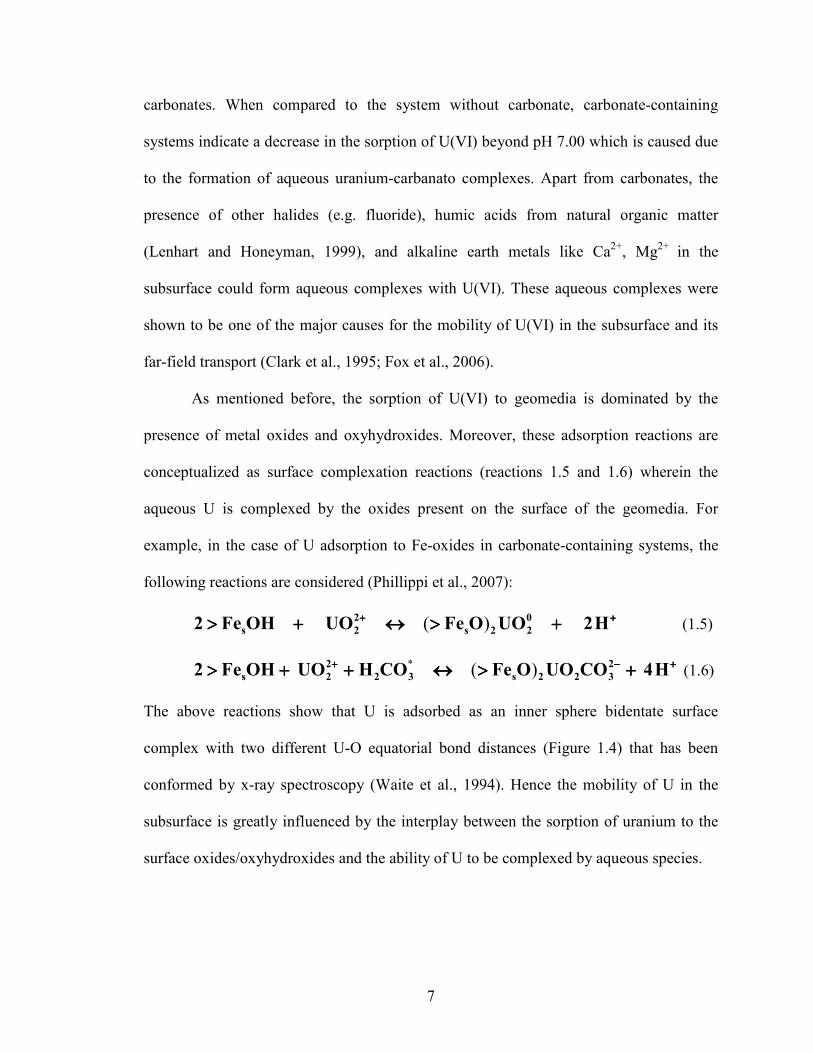
The above reactions show that U is adsorbed as an inner sphere bidentate surface
complex with two different U-O equatorial bond distances (Figure 1.4) that has been
conformed by x-ray spectroscopy (Waite et al., 1994). Hence the mobility of U in the
subsurface is greatly influenced by the interplay between the sorption of uranium to the
surface oxides/oxyhydroxides and the ability of U to be complexed by aqueous species.
8
Figure 1.4 Model structure showing U(VI) adsorption onto Ferrihydrite. Oeq1 and
Oeq2 are equatorial oxygen atoms of uranyl ion. Adapted from: Waite et al. (1994).
1.3 Precipitation-Dissolution and Redox Reactions
The precipitation-dissolution reactions and the redox reactions of uranium in the
subsurface are strongly coupled. Both the reactions are additionally significant since the
major remediation strategies to control the mobility of uranium are based on these
processes. The solubility of U(IV) in the form of uraninite (UO2) is lesser than U(VI) and
hence U(IV) is the preferred pathway to immobilize U in most subsurface U remediation
strategies. The above process can be triggered by both abiotic or by biotic (microbially
mediated) means. In the subsurface environment, the abiotic process of U(VI) to U(IV)
reduction is coupled with the Fe(II) to Fe(III) oxidation reaction as follows (Zielinski and
Meier, 1988):
The above redox reaction was generally shown to occur on Fe2+ minerals or Fe2+
adsorbed onto other mineral surfaces and not by aqueous Fe2+ (Fendorf and Hansel,
UO22+
Fe
Oeq2
Oeq1
Oeq1
Oeq1 Oeq2
UO22+ + 2Fe2+ UO2 + 2Fe3+ (1.7)
9
2002). On the contrary, the reaction can also be mediated by common dissimilatory metal
reducing bacteria and sulfate reducing bacteria in the subsurface. In the microbially
mediated process, the concentration of Fe2+ and the form of Fe oxides/oxyhydroxides
(crystalline or amorphous) dictates the stability of biogenic UO2 precipitates (Ginder
Vogel., 2008). Moreover the presence of NO3-, Ca2+ and CO3
2- favors the oxidation of
U(IV) to U(VI) and could potentially influence the precipitation process.
Since the dynamic chemical environment in the subsurface favors the oxidized
species of U, the solubility of U(VI) is of higher importance. The solubility of U(VI) in
aqueous solution is controlled by the uranyl oxide hydrates [e.g. schoepite
(UO2(OH)2.2H2O)] which is a function of pH (Giammar and Hering, 2001). Apart from
the redox control on uranium precipitation, the reaction between U(VI) and phosphate
results in autunite (X1-2 [(UO2)(PO4)]2-1.nH2O], where X is a monovalent or a divalent
cation), and under aerobic conditions, is used as a reactive barrier strategy to control
U(VI) mobility (Wellman et al., 2007). Although the above precipitation reactions are
useful reactions for U immobilization, the precipitate of U(VI) with Fe oxides show the
formation of U-Fe colloids that could enhance U mobilization (Duff et al., 2002).
1.4 Surface Complexation Modeling
Since the semi-empirical isotherm models viz. Linear, Freundlich, Langmuir etc.
fail to describe the adsorption of a solute onto the sorbent under changing chemical
conditions (pH, co-solutes, ionic strength etc.), the concept of surface complexation
models (SCM) was formulated (Goldberg and Criscenti, 2008). The SCM approach aids
in bridging the macroscopic contaminant transport processes to the molecular level
10
physico-chemical interactions of the contaminant with the subsurface material. Some of
the earlier approaches used in SCM includes constant capacitance model, diffuse double
layer model, triple layer model. These models differ in their conceptualization of charge
versus potential relationships of the electrical double layer. One of the major concepts
introduced to the field of surface complexation modeling in 1990’s was the CD-MUSIC
(charge distribution- multisite complexation) approach. The multisite concept precedes
the charge distribution concept both of which continue to evolve under the CD-MUSIC
framework to model adsorption processes (Hiemstra et al., 1989a,b; Hiemstra et al.,
1996). In the CD-MUSIC approach the molecular level structural details of the adsorbing
surfaces and the interacting aqueous phase ions are incorporated. Until 1990, the charge-
potential relationship was the only primary factor that used to differentiate the
conceptualizations of the electrical double layer (constant capacitance, diffuse double
layer, triple layer etc.). The concept of structure-charge-potential relationship was
introduced in the form of CD and MUSIC approaches.
Multisite complexation:
The multisite concept was based on the bond-valence theory proposed by the late
Nobel laureate Linus Pauling. Using bond-valence theory, the strength of the electrostatic
bond of surface groups (O, OH etc.) is calculated as follows: s = z / CN, wherein s =
bond-valence, z = charge of the metal, CN = coordination number (Pauling, 1929). For
example, in the case of goethite, the bond valence is +3/6 = +0.5, wherein ‘+3’ is the
charge of Fe in goethite, with Fe being octahedrally coordinated to six oxygen atoms.
Each oxygen atom in the bulk goethite is coordinated to three Fe atoms. Hence, in the
case of goethite, the surface oxygen that forms the sorption interface, could have three
11
different types of Fe sites (≡Fe, ≡Fe2, ≡Fe3). But the appropriate sites were found to be
the following four surface site types: ≡FeOH-0.5, ≡FeOH2+0.5, ≡Fe3OH+0.5, ≡Fe3O
-0.5,
based on the protonation characteristics of goethite in the environmentally relevant pH
range of 3-10 (Venema et al., 1996). The same procedure can be used for other metal
oxide surfaces as well. Thus, the rationale for the inclusion of multiple site types in
CDMUSIC instead of the typical three sites used by other modeling approaches (≡FeO-,
≡FeOH, ≡FeOH2+) was justified. In the case of goethite, a single protonation constant
was used for both (Fe and Fe3) site types based on the one pKa approach. One of the
major advantages of the 1-pKa approach is that it allows obtaining the protonation
constant independently using the point of zero charge measurement instead of following a
fitting exercise.
The multisite concept was implemented using the three plane model (TPM) that
contains the 0, β, and d planes (Figure 1.5). The TPM consist of mineral surface, the
Stern layer and the diffuse layer. The surface contains protonated or deprotonated, O or
OH species that carries the residual charge. The Stern layer includes the inner (β) and
outer (d) Helmholz planes with capacitances of C1, and C2, respectively. The value of
the inner Helmholz plane (C1) is derived based on the inner-sphere surface complex
formation of the solute with the surface sites. In the case of the outer Helmholz plane, a
typical value of 0.2 F m-2 was used. But recently, this value has been modified to 1 F m-2
since the previous value of 0.2 F m-2 indicated an overestimation of the distance of H2O
molecule from the surface (van Riemsdijk and Hiemstra, 2006). The Stern layer was
followed by the diffuse layer that contains the charge neutralizing outer-sphere
electrolyte ion complexes ions that eventually terminates at the bulk solution interface. In
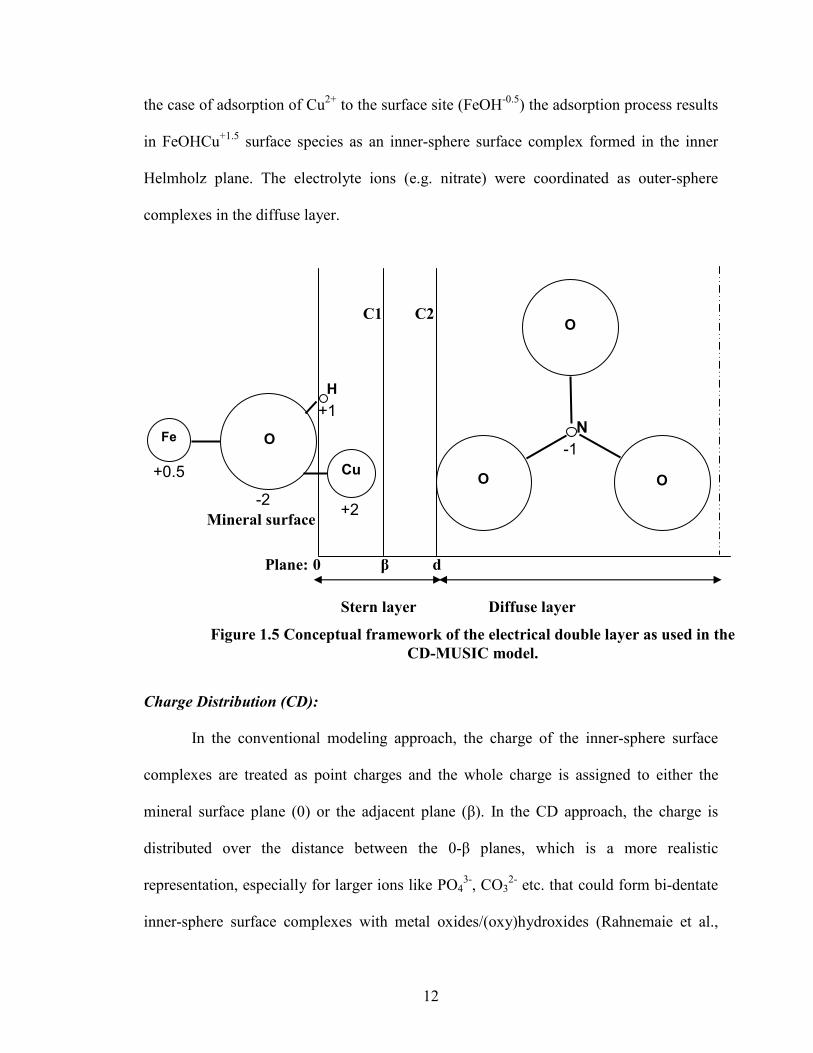
12
the case of adsorption of Cu2+ to the surface site (FeOH-0.5) the adsorption process results
in FeOHCu+1.5 surface species as an inner-sphere surface complex formed in the inner
Helmholz plane. The electrolyte ions (e.g. nitrate) were coordinated as outer-sphere
complexes in the diffuse layer.
Charge Distribution (CD):
In the conventional modeling approach, the charge of the inner-sphere surface
complexes are treated as point charges and the whole charge is assigned to either the
mineral surface plane (0) or the adjacent plane (β). In the CD approach, the charge is
distributed over the distance between the 0-β planes, which is a more realistic
representation, especially for larger ions like PO43-, CO3
2- etc. that could form bi-dentate
inner-sphere surface complexes with metal oxides/(oxy)hydroxides (Rahnemaie et al.,
Fe O
+0.5 -2
+1
Cu
+2
H
O
O O
N
-1
C1 C2
Stern layer Diffuse layer
Figure 1.5 Conceptual framework of the electrical double layer as used in the
CD-MUSIC model.
Plane: 0 β d
Mineral surface
13
2006). Moreover, the aqueous complexes of certain electrolyte ions can also influence the
surface charge at very high ionic strength (>0.5 M). To accommodate these effects, the
concept of charge distribution has been used and the value is calculated based on charge
neutralization as explained in Rahnemaie et al. (2006).
Application of the CD-MUSIC Model:
The adsorption of most of the metal ions (Th, U, Pu, Np etc.,) on to the surface of
metal oxides/(oxy)hydroxides (Goethite, Hematite, Gibbsite, Rutile) is highly influenced
by pH. The pH versus adsorption curves of these metals typically indicate a sigmoidal
profile with adsorption increasing with pH. The CD-MUSIC model can explain this
surface charging behavior by correlating it to the protons bound/desorbed by the surface
sites. A review of the literature indicates that the CD-MUSIC model can simulate the
adsorption of a suite of environmentally relevant anions (PO43-, CO3
2-, SO42-), and trace
metals (Cd, Co, Cu, Ni, Pd, Zn, U etc.) onto metal oxides/(oxy)hydroxide surfaces, in
both single solute, and competitive multi-solute systems [e.g. As/HCO3- interaction with
goethite] (Geelhoed et al., 1997; Ponthieu et al., 2006; Stachowicz et al., 2007;
Gustafsson et al., 2009). Above all, the information obtained from the model has
contributed to a better characterization of surface species. For example, the carbonate
species adsorption was previously believed to be monodentate, whereas the CD-MUSIC
approach predicted it to be a bidentate inner-sphere complex (Hiemstra et al., 2004).
Later spectroscopic (EXAFS) data of the above system supports the CD-MUSIC
prediction of the carbonate surface species (Bargar et al., 2005).
14
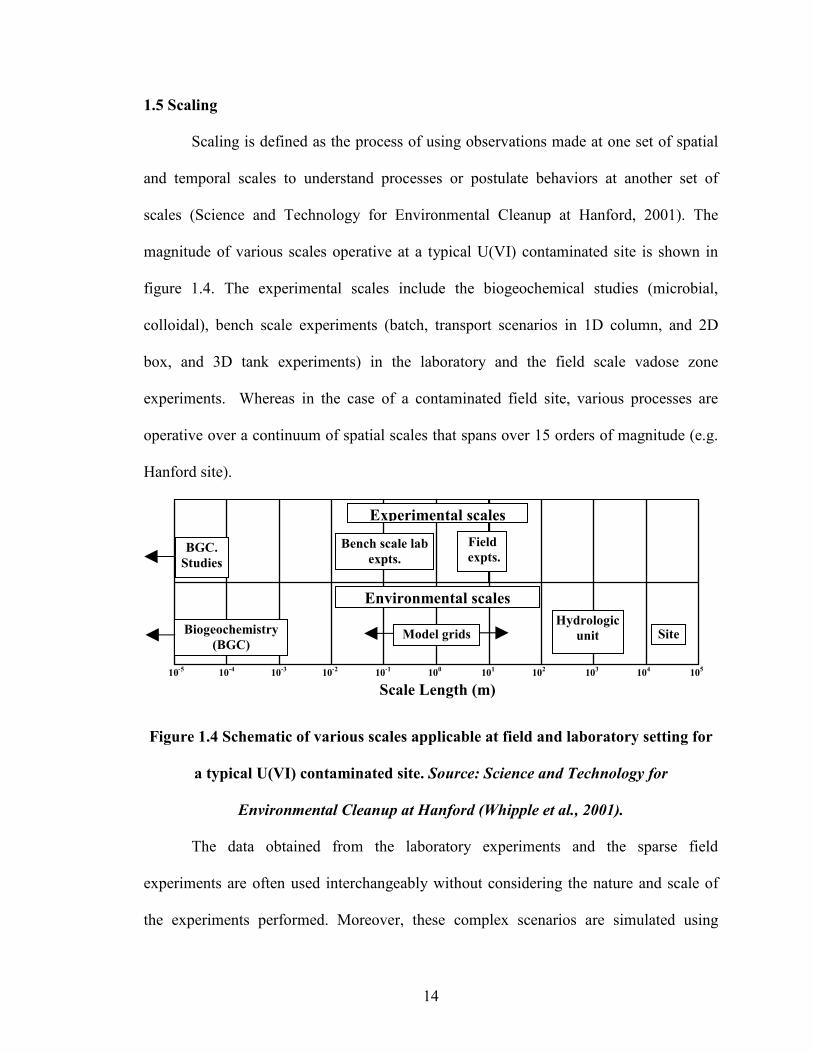
1.5 Scaling
Scaling is defined as the process of using observations made at one set of spatial
and temporal scales to understand processes or postulate behaviors at another set of
scales (Science and Technology for Environmental Cleanup at Hanford, 2001). The
magnitude of various scales operative at a typical U(VI) contaminated site is shown in
figure 1.4. The experimental scales include the biogeochemical studies (microbial,
colloidal), bench scale experiments (batch, transport scenarios in 1D column, and 2D
box, and 3D tank experiments) in the laboratory and the field scale vadose zone
experiments. Whereas in the case of a contaminated field site, various processes are
operative over a continuum of spatial scales that spans over 15 orders of magnitude (e.g.
Hanford site).
Figure 1.4 Schematic of various scales applicable at field and laboratory setting for
a typical U(VI) contaminated site. Source: Science and Technology for
Environmental Cleanup at Hanford (Whipple et al., 2001).
The data obtained from the laboratory experiments and the sparse field
experiments are often used interchangeably without considering the nature and scale of
the experiments performed. Moreover, these complex scenarios are simulated using
10-5 10
-4 10
-3 10
-2 10
-1 10
0 10
1 10
2 10
3 10
4 10
5
Environmental scales
Site Biogeochemistry
(BGC)
Hydrologic
unit Model grids
BGC.
Studies
Bench scale lab
expts.
Experimental scales
Field
expts.
Scale Length (m)
15
computational models that often use the assumption of physical and chemical
homogeneity over three orders of magnitude.
1.6 Research Objectives
The primary objective of this research is to focus on the scaling of adsorption
reactions using uranium and Fe oxide-coated sand as a model system. The rationale for
the research objectives and the tasks associated with them were approached as outlined
below:
• Rationale: Natural media is highly heterogeneous and could contain pre-sorbed
contaminants that might influence adsorption.
Task 1: Synthesize and characterize Fe oxide-coated sand and use it as a model
system to perform U(VI) adsorption experiments.
• Rationale: Understanding the adsorption of U(VI) onto coated sands is an important
step towards developing scalable reaction models that can ultimately describe and
predict the fate and transport of U(VI) in the subsurface.
Task 2: Design and perform batch adsorption experiments and identify the key
scaling parameters.
Task 3: Implement the scaling procedure in surface complexation models and predict
experimental results.
• Rationale: The scaling discrepancy observed in simple systems (centimeter/meter
scale) in the laboratory should be addressed before solving large scale field transport
problems (kilometer/mile scale).
16
Task 4: Perform batch adsorption and 1D-transport experiments using a model system
and scale the sorption parameters.
Task 5: Transfer the knowledge obtained from the model system to a heterogeneous
natural geomedia.
1.7 Organization of the Dissertation
A brief introduction leading towards the objectives is given in Chapter 1. In Chapter
2, the synthesis protocols of iron oxide-coated sand and its characterization procedure is
discussed in detail. Chapter 3 describes the experimental and predictive modeling
approaches for U(VI) adsorption onto iron oxide-coated sand in batch systems. Chapter 4
details the experimental and predictive modeling approaches for U(VI) adsorption onto
iron oxide-coated sand in 1D transport conditions. In Chapter 5, the use of
hydrothermally obtained biochar for U(VI) remediation is discussed. This was a
collaborative work performed along with Mr. Sandeep Kumar, Department of Chemical
Engineering. Lastly, the summary of all the chapters, the implication and
recommendations of this study are given in Chapter 6.
Chapters 2 and 3 are extended versions of the paper published previously by the
author in Applied Geochemistry (Loganathan et al., 2009), which is reprinted in part here.
Chapter 4 is a draft manuscript to be submitted for publication. Chapter 5 has been
submitted for publication.
17
1.8 References
Bargar JR, Kubicki JD, Reitmeyer R, Davis JA. ATR-FTIR spectroscopic
characterization of coexisting carbonate surface complexes on hematite. Geochim
Cosmochim Acta 2005; 69: 1527-1542.
Barnett, M.O., Jardine, P.M. and Brooks, S.C., 2002. U(VI) adsorption to heterogeneous
subsurface media: Application of a surface complexation model. Environ. Sci.
Technol. 36, 937-942.
Bickmore BR, Rosso KM, Mitchell SC, 2006. Is there hope for multisite complexation
modeling? In: Johannes Lutzenkirchen (Ed.), Surface complexation modeling.
Elsevier, The Netherlands. pp. 269-283.
Clark, D.L., Hobart, D.E., Neu, M.P., 1995. Actinide carbonate complexes and their
importance in actinide environmental chemistry. Chem. Rev. 95, 25-48.
Davis, J.A., Meece, D.E., Kohler, M., Curtis, G.P., 2004. Approaches to surface
complexation modeling of uranium (VI) adsorption on aquifer sediments.
Geochim. Cosmochim. Acta 68, 3621-3641.
Duff MC, Coughlin JU, Hunter DB., 2002. Uranium co-precipitation with iron oxide
minerals. Geochim Cosmochim Acta 66: 3533-3547. Fendorf, S., Hansel, C.M.,
2002. Operative pathways of chromate and uranyl reduction within soils and
sediments. In: Zhang, P.C. and Brady, P.V. (Ed.), Geochemistry of soil
radionuclides. pp111-130.
Fox PM, Davis JA, Zachara JM., 2006. The effect of calcium on aqueous uranium(VI)
speciation and adsorption to ferrihydrite and quartz. Geochim Cosmochim Acta
70: 1379-1387.
18
Gee, G.W., Oostrom, M., Freshley, M.D., Rockhold, M.L., Zachara, J.M., 2007. Hanford
site vadose zone studies: An overview. Vadose Zone J. 6, 899-905.
Geelhoed JS, Hiemstra T, VanRiemsdijk WH. Phosphate and sulfate adsorption on
goethite: Single anion and competitive adsorption. Geochim Cosmochim Acta
1997; 61: 2389-2396.
Giammar, D.E., Hering, J.G., 2001. Time scales for sorption-desorption and surface
precipitation of uranyl on goethite. Environ. Sci. Technol. 35, 3332-3337.
Ginder-Vogel, M., Fendorf, S., 2008. Biogeochemical uranium redox transformations:
Potential oxidants of uraninite. In: Barnett, M.O. and Kent, D.B. (Ed.),
Adsorption of metals by geomedia II: Variables, mechanism, and model
applications. 293-320.
Goldberg, S., and Criscenti, L.J., 2008. Modeling adsorption of metals and metalloids by
soil components. In: Violntem A., Hunag, P.M., and Gadd, G.M. (Ed.),
Biophysico-chemical processes of heavy metals and metalloids in soil
environments. 215-264.
Gustafsson JP, Dassman E, Backstrom M. Towards a consistent geochemical model for
prediction of uranium(VI) removal from groundwater by ferrihydrite. Appl
Geochem 2009; 24: 454-462.
J.P. Gustafsson, Visual MINTEQ, v.3.0, http://www.lwr.kth.se/English/OurSoftware/
vminteq. Retrieved: 6/2010.
Hiemstra T, Dewit JCM, van Riemsdijk WH. Multisite Proton Adsorption Modeling at
the Solid-Solution Interface of (Hydr)Oxides - a New Approach .2. Application to
Various Important (Hydr)Oxides. J Colloid Interface Sci 1989a; 133: 105-117.
19
Hiemstra T, van Riemsdijk WH, Bolt GH. Multisite Proton Adsorption Modeling at the
Solid-Solution Interface of (Hydr)Oxides - a New Approach .1. Model
Description and Evaluation of Intrinsic Reaction Constants. J Colloid Interface
Sci 1989b; 133: 91-104.
Hiemstra T, van Riemsdijk WH. A surface structural approach to ion adsorption: The
charge distribution (CD) model. J Colloid Interface Sci 1996; 179: 488-508.
Hiemstra T, Rahnemaie R, van Riemsdijk WH. Surface complexation of carbonate on
goethite: IR spectroscopy, structure and charge distribution. J Colloid Interface
Sci 2004; 278: 282-290.
Hsi, C.K.D., Langmuir, D., 1985. Adsorption of uranyl onto ferric oxyhydroxides -
application of the surface complexation site-binding model. Geochim.
Cosmochim. Acta 49, 1931-1941.
Kaltsoyannis, N, Scott, P, 1999. The f elements. Oxford science publication.
Pauling L. The principles determining the structure of complex ionic crystals. J. Am.
Chem. Soc. 1929; 51: 1010-1026.
Phillippi, J.M., Loganathan, V.A., McIndoe, M.J., Barnett, M.O., T.P. Clement, E.E.
Roden. 2007. Theoretical solid/solution ratio effects on adsorption and transport:
Uranium(VI) and carbonate. Soil Sci. Soc. Am. J. 71, 329-335.
Ponthieu M, Juillot F, Hiemstra T, van Riemsdijk WH, Benedetti MF. Metal ion binding
to iron oxides. Geochim Cosmochim Acta 2006; 70: 2679-2698.
Rahnemaie R, Hiemstra T, van Riemsdijk WH. A new surface structural approach to ion
adsorption: Tracing the location of electrolyte ions. J Colloid Interface Sci 2006;
293: 312-321.
20
Schmeide K, Pompe S, Bubner M, Heise KH, Bernhard G, Nitsche H.,
2000.Uranium(VI) sorption onto phyllite and selected minerals in the presence of
humic acid. Radiochim. Acta. 723-728.
Science and Technology for Environmental Cleanup at Hanford. 2001. Committee on the
Review of the Hanford Site's Environmental Remediation Science and
Technology Plan, Board on Radioactive Waste Management, National Research
Council.185-193.
Stachowicz M, Hiemstra T, Van Riemsdijk WH. Arsenic-bicarbonate interaction on
goethite particles. Environ Sci Technol 2007; 41: 5620-5625.
van Riemsdijk WH and Hiemstra T, 2006. The CD-MUSIC model as a framework for
interpreting ion adsorption on metal (hydr)oxide surfaces. In: Johannes
Lutzenkirchen (Ed.), Surface complexation modeling. Elsevier, The Netherlands.
pp. 251-268.
Venema P, Hiemstra T, van Riemsdijk WH. Comparison of different site binding models
for cation sorption: Description of pH dependency, salt dependency, and cation-
proton exchange. J Colloid Interface Sci 1996; 181: 45-59.
Waite, T.D., Davis, J.A., Payne, T.E., Waychunas, G.A., Xu, N., 1994. Uranium(VI)
adsorption to ferrihydrite - application of a surface complexation model.
Geochim. Cosmochim. Acta 58, 5465-5478.
Waite, T.D., Davis, J.A., Fenton, B.R. and Payne, T.E., 2000. Approaches to modelling
uranium(VI) adsorption on natural mineral assemblages. Radiochim. Acta 88,
687-693.
21
Wellman DM, Pierce EM, Valenta MM., 2007. Efficacy of soluble sodium
tripolyphosphate amendments for the in-situ immobilisation of uranium. Environ
Chem. 4: 293-300.
Whipple, C.G., D.W. Berman, S.B. Clark, J.C. Fountain, L.W. Gelhar, L.C. Green, R.O.
Hall, E.E. Herricks, B.D. Honeyman, S. Levy, J.K. Mitchell, L.T. Silver, L.
Smith, and D.A. Stonestrom, Science and Technology for Environmental Cleanup
at Hanford, National Academy Press, 2001. Review of the Hanford Site's
Environmental Remediation Science and Technology Plan, Board on Radioactive
Waste Management, National Research Council.185-193.
Zielinski, R.A., and Meier, A.L., 1988. The association of uranium with organic matter in
Holocene peat: an experimental leaching study. Appl. Geochem.3, 631-643.
22
2. Synthesis and Characterization of Iron Oxide-Coated Sand
2.1 Introduction
Iron (III) (oxyhydr)oxide coatings on soils and sediments are one of the most
important factors in controlling the adsorption and transport of U(VI) in the subsurface
(Um et al., 2007; Davis et al., 2004; Barnett et al., 2002). Various forms of Fe(III) oxides
occur in nature and can be broadly classified into crystalline (e.g. goethite, hematite) and
amorphous forms (e.g. hydrous ferric oxide, ferrihydrite). Amorphous and crystalline Fe
oxides differ significantly in their structure and properties. Crystalline Fe oxides exhibit
lower specific surface area and microporosity compared to the non-crystalline,
amorphous Fe oxides (Schwertmann and Cornell, 2000). Though much work has been
reported on the interaction of U(VI) with pure Fe oxides (Bruno et al., 1995; Giammar
and Hering, 2001; Hsi and Langmuir, 1985; Waite et al., 1994), fewer reports are
available in which Fe oxide-coated media was used as the adsorbent. At U(VI)-
contaminated sites, Fe oxides often appear as coatings on other geomedia rather than
discrete minerals (Davis et al., 2004; Payne et al., 1994; Um et al., 2007). However, Fe-
oxide coatings exhibit different adsorption properties than pure Fe oxides (Xu and Axe,
2005).
The purpose of this chapter, which has been published in part in Loganathan et al.
(2009), is to assess the various synthesis protocols to produce iron oxide-coated sands
that could be used as a surrogate to natural geomedia found in U(VI) contaminated sites.
23
Two different methods have typically been used for the synthesis of Fe-coated sand, the
precipitation method and the adsorption method (Xu and Axe, 2005; Schwertmann and
Cornell, 2000; Scheidegger et al., 1993). In the precipitation method, sometimes called
the homogenous method, sand is initially mixed with soluble Fe(II). Reaction conditions
favorable for goethite (α-FeOOH) precipitation are then maintained, and goethite
particles are in principle coated onto the sand as the Fe precipitates. The adsorption
method is a two-step process, in which pure goethite is synthesized in the first step and
the coating occurs in the second step, where the goethite prepared in the first step is
adsorbed onto the surface of the sand. This method of coating sand is also referred to as
the heterogeneous suspension method (Scheidegger et al., 1993). The coated sands
obtained from both of these methods have been used as surrogates for subsurface
materials to study trace metal or anion adsorption (Gabriel et al., 1998; Meeussen et al.,
1996; Roden et al., 2000; Xu and Axe, 2005). Previous studies indicate that the reactive
transport processes can be successfully modeled using known amount of sand and iron
oxide in the system irrespective of the coating method (Scheidegger et al., 1994;
Meeussen et al., 1999; Cheng et al., 2004).
2.2 Materials and Methods
Synthesis of iron oxide-coated sand:
All chemicals used were certified analytical grade and obtained from Fisher
Scientific (Pittsburgh, PA) unless otherwise noted. Iron oxide-coated sand was
synthesized using two common protocols, the precipitation method and the adsorption
method. Pure medium-sized crystalline white quartz (confirmed by X-ray diffraction)
24
obtained from Sigma-Aldrich, MO, with a particle size ranging between 0.210 and 0.297
mm, was chosen as the substrate. In addition to being a common subsurface mineral,
quartz was chosen as the substrate because at the coating pH of 7, quartz carries a
negative charge whereas goethite carries a positive charge (Scheidegger et al., 1993),
resulting in a stronger binding between the two minerals.
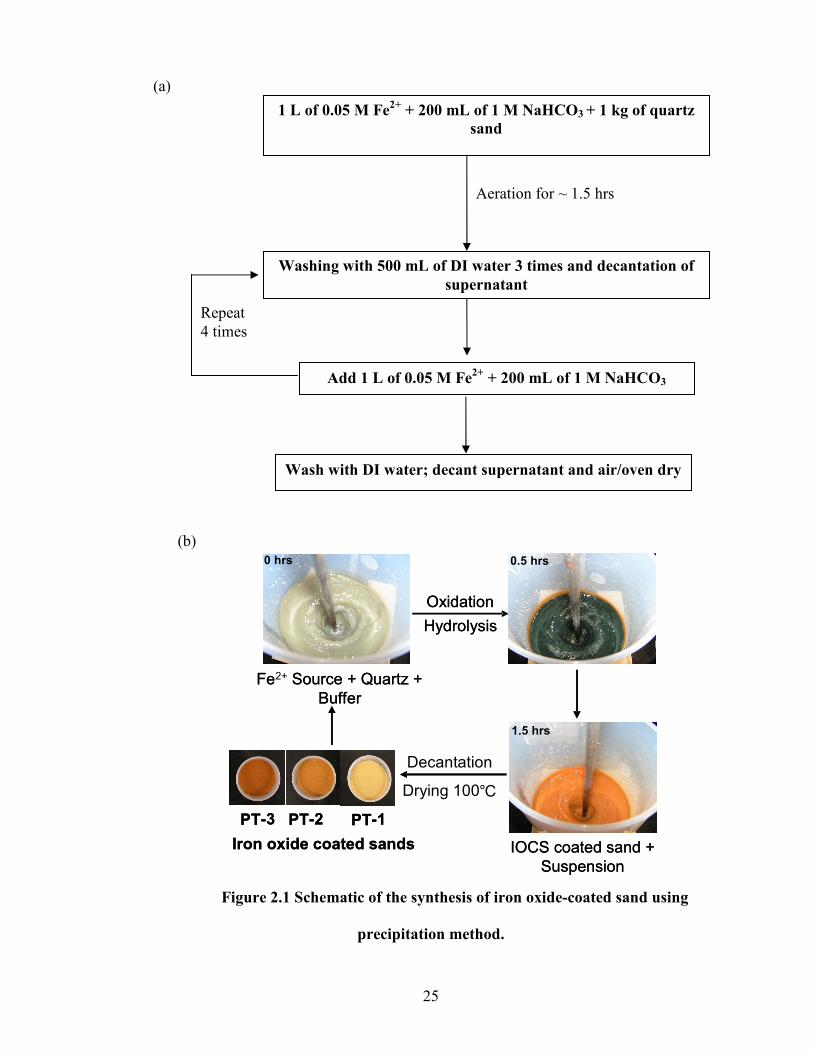
The schematic of the precipitation method is given in figure 2.1. In this method, 1
kg of sand was added to 0.05 M of Fe(II) source (ferrous chloride or ferrous sulphate) in
1 M sodium bicarbonate buffered at pH 7 (Schwertmann and Cornell, 2000).
Atmospheric oxygen was vigorously added to the system using a jumbo stirrer. Under
these conditions, the Fe(II) was oxidized to Fe(III), which was marked by a series of
color changes before finally forming a reddish-brown coating (Fig. 2.1). After 1.5 hours
of mixing, the coated sand was washed using deionized water (18.2 MΩ.cm). The
supernatant was analyzed for conductivity using an ion chromatograph and the washing
was continued until the conductivity of the supernatant reached the DI water
conductivity. The sands were then oven dried at 110°C for 24 hours. The precipitation
method was repeated sequentially to produce three coated sands (PT–1, PT–2, and PT–3)
with increasing Fe content (0.04 – 0.32%). A batch experiment was performed at pH 3 to
check for the residual Fe(II) adsorption on the coated sand. At the end of 24 hour
equilibration period, samples were analyzed using flame atomic absorption
spectrophotometer and no residual Fe(II) was observed in the solution.
25
Figure 2.1 Schematic of the synthesis of iron oxide-coated sand using
precipitation method.
1 L of 0.05 M Fe2+
+ 200 mL of 1 M NaHCO3 + 1 kg of quartz
sand
Washing with 500 mL of DI water 3 times and decantation of
supernatant
Add 1 L of 0.05 M Fe2+
+ 200 mL of 1 M NaHCO3
Wash with DI water; decant supernatant and air/oven dry
Repeat 4 times
Aeration for ~ 1.5 hrs
(a)
(b)
IOCS coated sand +
Suspension
0 hrs 0.5 hrs
1.5 hrs
Fe Source + Quartz +
Buffer
Oxidation
Hydrolysis
PT - 1 PT - 2 PT - 3
Iron oxide coated sands
Decantation
Drying 100 ° C
IOCS coated sand +
Suspension
0 hrs 0.5 hrs
1.5 hrs
Fe 2+ Source + Quartz +
Buffer
Oxidation
Hydrolysis
PT - 1 PT - 2 PT - 3
Iron oxide coated sands
26
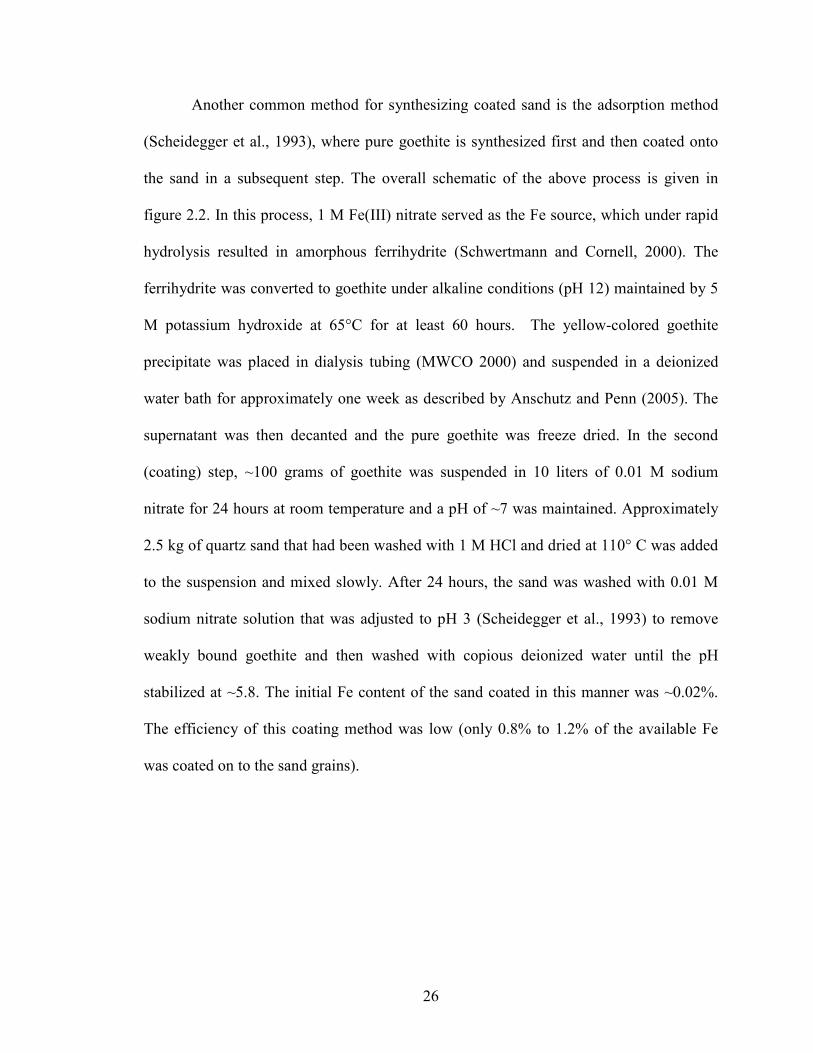
Another common method for synthesizing coated sand is the adsorption method
(Scheidegger et al., 1993), where pure goethite is synthesized first and then coated onto
the sand in a subsequent step. The overall schematic of the above process is given in
figure 2.2. In this process, 1 M Fe(III) nitrate served as the Fe source, which under rapid
hydrolysis resulted in amorphous ferrihydrite (Schwertmann and Cornell, 2000). The
ferrihydrite was converted to goethite under alkaline conditions (pH 12) maintained by 5
M potassium hydroxide at 65°C for at least 60 hours. The yellow-colored goethite
precipitate was placed in dialysis tubing (MWCO 2000) and suspended in a deionized
water bath for approximately one week as described by Anschutz and Penn (2005). The
supernatant was then decanted and the pure goethite was freeze dried. In the second
(coating) step, ~100 grams of goethite was suspended in 10 liters of 0.01 M sodium
nitrate for 24 hours at room temperature and a pH of ~7 was maintained. Approximately
2.5 kg of quartz sand that had been washed with 1 M HCl and dried at 110° C was added
to the suspension and mixed slowly. After 24 hours, the sand was washed with 0.01 M
sodium nitrate solution that was adjusted to pH 3 (Scheidegger et al., 1993) to remove
weakly bound goethite and then washed with copious deionized water until the pH
stabilized at ~5.8. The initial Fe content of the sand coated in this manner was ~0.02%.
The efficiency of this coating method was low (only 0.8% to 1.2% of the available Fe
was coated on to the sand grains).
27
Figure 2.2 Schematic of the synthesis of iron oxide-coated sand using
adsorption method.
Characterization:
Scanning electron microscopy (SEM) along with energy-dispersive spectroscopy
(EDS) and powder x-ray diffraction (XRD) were used for characterizing the morphology
and identifying the specific phases present. The SEM imaging was performed using a
field emission high resolution JEOL 7000F scanning electron microscope under a 20 kV
accelerating voltage. X-ray diffraction was performed with a Rigaku MiniFlex powder X-
ray diffractometer under Cu-Kα radiation at 30 kV and 15 mA. Data were collected in a
continuous scan mode at a rate of 0.5° 2θ per minute. The XRD patterns were obtained
from 0° to 80° and compared with the standard goethite peaks using Jade (Materials Data,
Inc.) software. Selective Fe extractions were performed to quantify the amount of
amorphous and crystalline Fe (Fuller et al., 1996). The amorphous Fe was extracted using
IOCS
Fe 3+
Rapid HydrolysispH >12
Fe 2 O 3 0.5 H 2 O
(Ferrihydrite)
65 ° C 60 hrs
Goethite
( alpha – FeOOH )
SiO 2 (Acid washed quartz)
+
Step A
Step B
IOCS
Fe
Rapid HydrolysispH >12
Fe 2 O 3 0.5 H 2 O
(Ferrihydrite)
65 ° C 60 hrs
Goethite
( alpha – FeOOH )
SiO 2 +
Fe
Rapid HydrolysispH >12
Fe 2 O 3 0.5 H 2 O
(Ferrihydrite)
65 ° C 60 hrs
Goethite
( alpha – FeOOH )
SiO 2 +
Step A
Step B
28
0.2 M ammonium oxalate in the dark (AOD) for ~3 hours (Jackson et al., 1986), and a
dithionate-citrate-bicarbonate (DCB) extraction was used to dissolve both crystalline and
amorphous Fe oxides (Mehra and Jackson, 1960). The difference between the DCB Fe
and AOD Fe nominally represents the crystalline Fe. The extracted Fe was measured
using a flame atomic absorption spectrophotometer with calibration standards prepared in
the extractant solution. Surface area was measured using the multipoint BET (Brunauer,
Emmet, and Teller) method using N2(g) and / or Kr(g) (Micromeritics Analytical
services, GA). Selected samples were analysed in duplicates and the results agreed within
10%.
2.3 Results and Discussion
SEM images of the coated sand synthesized by the precipitation method did not
show the expected acicular structures of goethite on the surface (Fig. 2.3a), suggesting
the presence of non-crystalline Fe minerals. Hence, a sample of the precipitate collected
during the coating process was analyzed directly. The SEM image of a sample of the pure
precipitate collected during the coating process showed typical acicular particles
characteristic of goethite (Fig. 2.3b). Moreover, the SEM image of the coated sand after a
partial DCB Fe extraction (to remove the outermost layer of iron oxide) revealed acicular
goethite structures, confirming the presence of goethite in the coated sand (Fig. 2.3c).
Thus we believe the sands prepared using the precipitation method consisted of a mixture
of both amorphous Fe oxides and crystalline goethite. Specific surface area
measurements intermediate between goethite and HFO supported this interpretation
(Table 2.1). Moreover, the amorphous Fe content was dependent on the Fe(II) source. As
29
the coating cycle increased, the sand synthesized starting with ferrous chloride as the
Fe(II) source showed more amorphous Fe when compared to when ferrous sulphate was
used as Fe(II) source (Fig. 2.4).
(c)
Figure 2.3 SEM images of (a) surface of a sand grain coated by the precipitation
method; (b) a sample of the pure precipitate collected during the coating process, and (c)
the surface of a sand grain after a partial Fe extraction.
10µm
(b) (c)
(c)
(a)
30
Table 2.1 Iron content and surface area of coated sands
System DCB Fe content AOD Fe content Surface Area Surface Area
(% of sand) (% of sand) m2 g-1 of FeOOH m2 g-1 of Fe a
AD–1 0.021 ± 0.001 0.0030 ± 0.0003 95.5 152
PT–1 0.040 ± 0.001 0.0063 ± 0.0001 223.1 355
PT–2 0.182 ± 0.005 0.0151 ± 0.0003 135.8 216
PT–3 0.315 ± 0.007 0.0123 ± 0.0003 105.6 168
Quartz n/a n/a n/a n/a
Goethite 61.4 ± 0.9 (62.8b) 3.40 ± 0.08 53.3 84.8
a. Ignoring surface area of quartz
b. Theoretical value
AD represents coated sand synthesized using adsorption method
PT represents coated sand synthesized using precipitation method
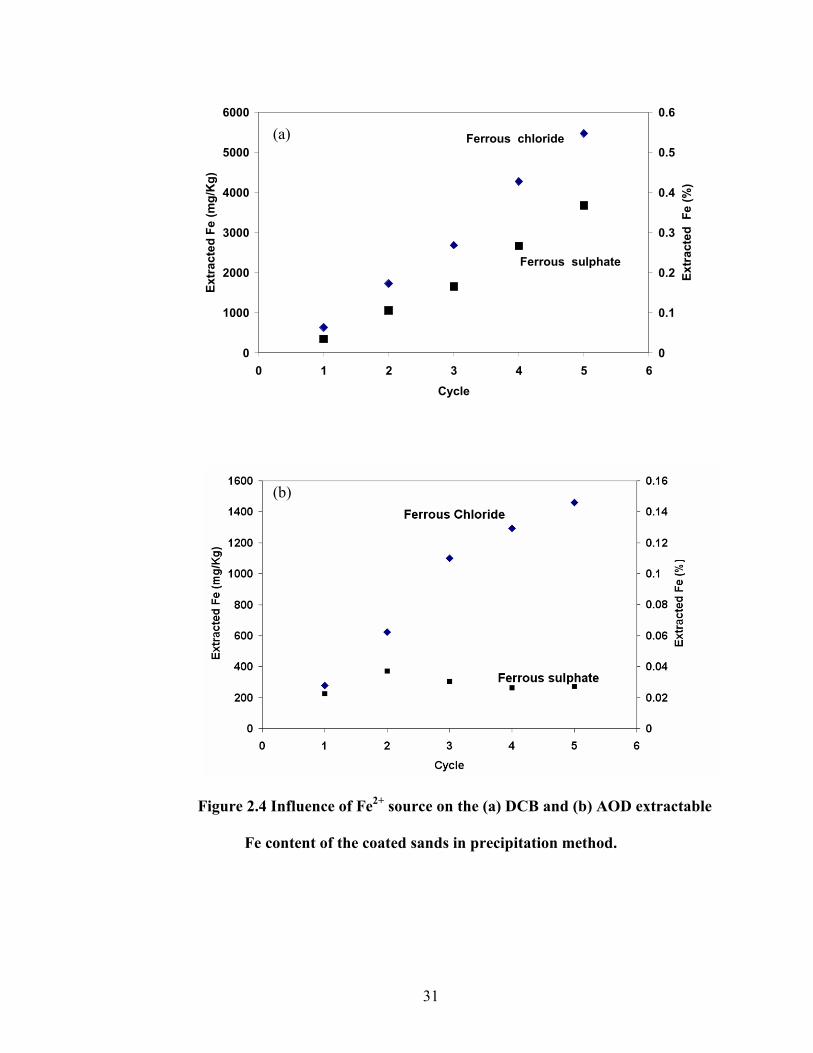
31
Figure 2.4 Influence of Fe2+
source on the (a) DCB and (b) AOD extractable
Fe content of the coated sands in precipitation method.
0
1000
2000
3000
4000
5000
6000
0 1 2 3 4 5 6
Cycle
Extracte
d F
e (m
g/K
g)
0
0.1
0.2
0.3
0.4
0.5
0.6
Extracte
d Fe (%
)
Ferrous chloride
Ferrous sulphate
(a)
(b)
32
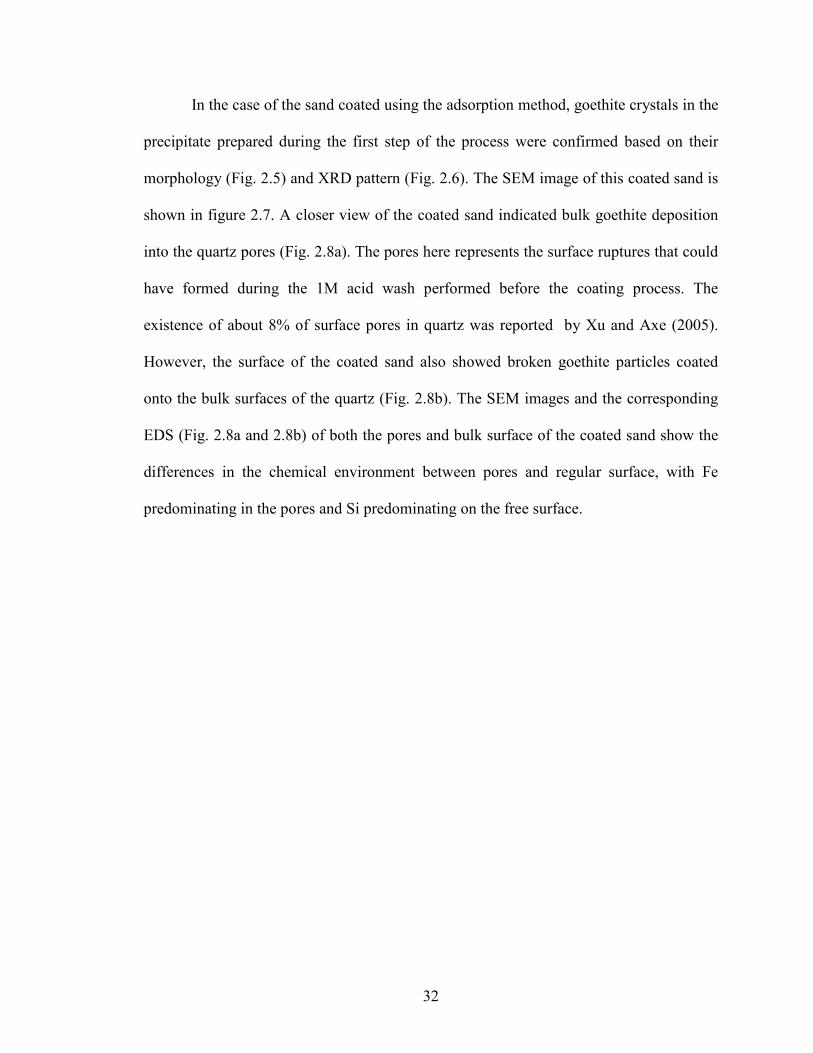
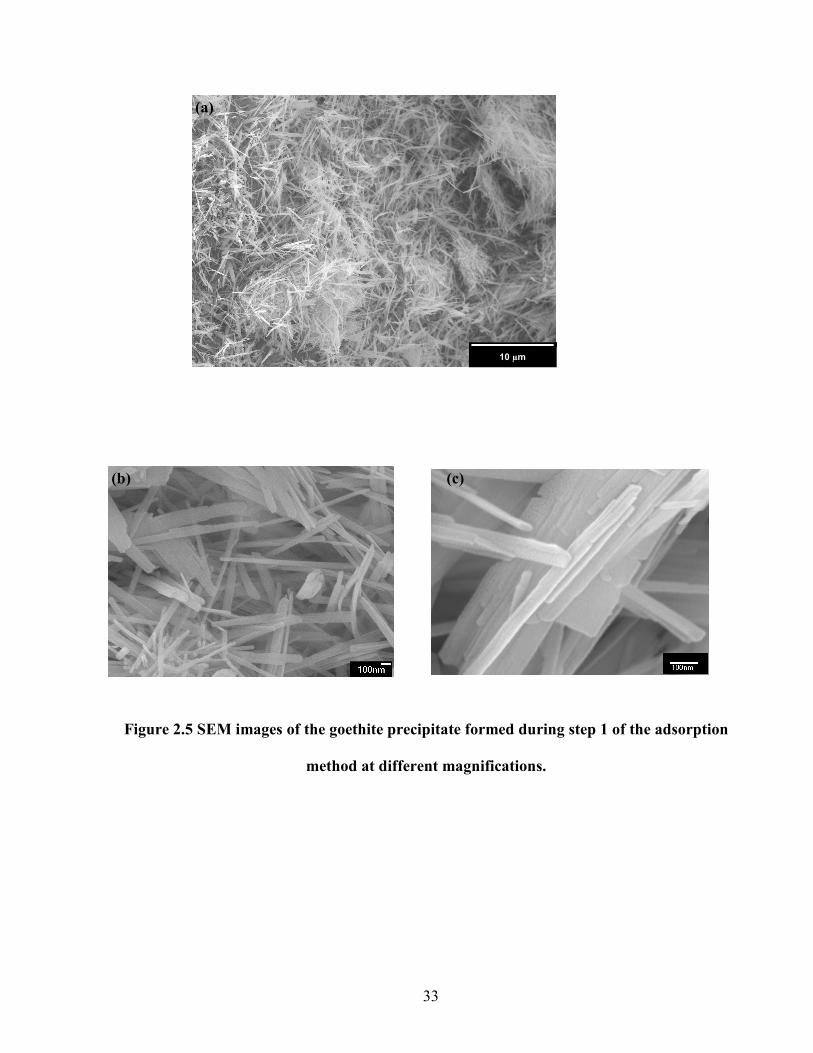
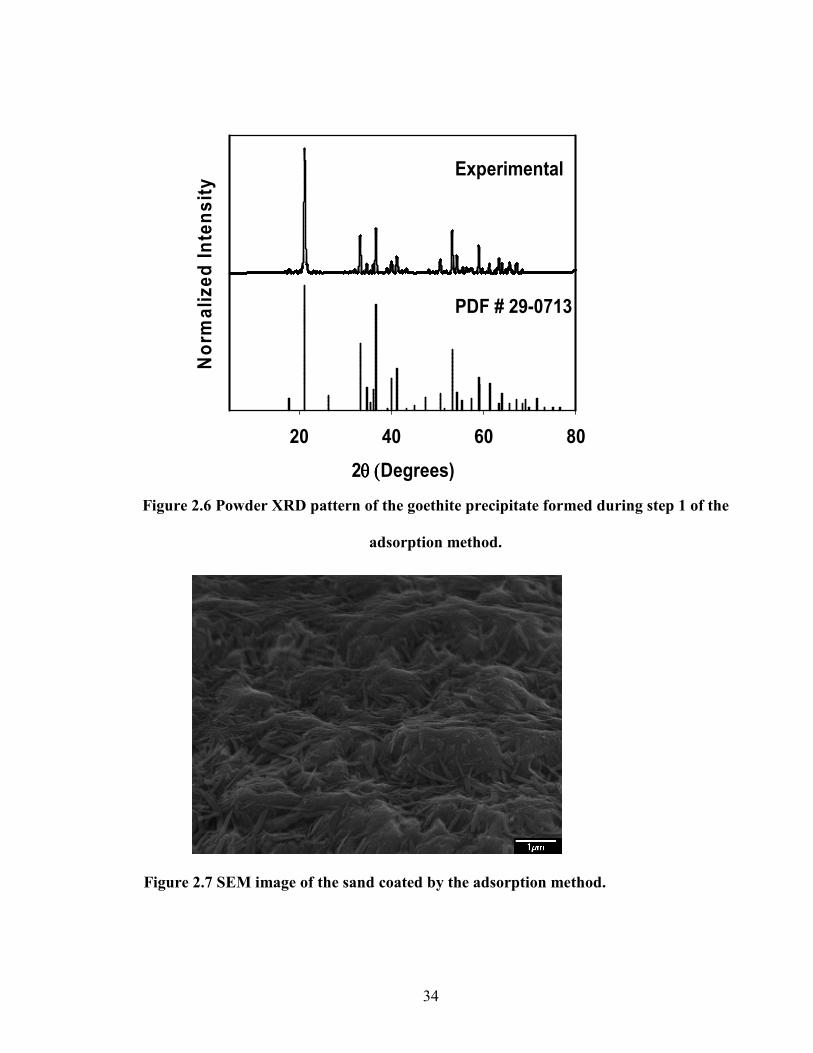
In the case of the sand coated using the adsorption method, goethite crystals in the
precipitate prepared during the first step of the process were confirmed based on their
morphology (Fig. 2.5) and XRD pattern (Fig. 2.6). The SEM image of this coated sand is
shown in figure 2.7. A closer view of the coated sand indicated bulk goethite deposition
into the quartz pores (Fig. 2.8a). The pores here represents the surface ruptures that could
have formed during the 1M acid wash performed before the coating process. The
existence of about 8% of surface pores in quartz was reported by Xu and Axe (2005).
However, the surface of the coated sand also showed broken goethite particles coated
onto the bulk surfaces of the quartz (Fig. 2.8b). The SEM images and the corresponding
EDS (Fig. 2.8a and 2.8b) of both the pores and bulk surface of the coated sand show the
differences in the chemical environment between pores and regular surface, with Fe
predominating in the pores and Si predominating on the free surface.
33
10 µm
(a)
(b)
Figure 2.5 SEM images of the goethite precipitate formed during step 1 of the adsorption
method at different magnifications.
(c)
34
2θ (θ (θ (θ (Degrees)
20 40 60 80
Norm
alized Inte
nsity
PDF # 29-0713
Experimental
Figure 2.7 SEM image of the sand coated by the adsorption method.
Figure 2.6 Powder XRD pattern of the goethite precipitate formed during step 1 of the
adsorption method.
35
1 4 7 10
Energy (keV)
Si
17.4%
Fe
56.8%
1 4 7 10
Energy (keV)
Si
78.7%
Fe
2.2%
The coating efficiency (percentage of available Fe coated onto sand) of the first
step of the precipitation method was 14% compared to only 1.2% for the adsorption
method. Previous studies of Filius et al. (1999) and Rennert et al. (2003) indicated that
the adsorption method would result in an Fe content of ~ 0.02% on silica, similar to our
results. In contrast, coated sands with Fe contents ranging between 0.06% and 2% were
Figure 2.8 SEM images and corresponding EDS of a pore (a) and (b) regular surface of
sand coated by the adsorption method.
550nm
(b)
(a)
36
reported via the adsorption method by Xu and Axe (2005). However, they found that the
coating temperature was an important factor controlling the level of adsorbing Fe, with
the highest coating levels achieved at 60°C, well beyond the temperature we used (~ 21 ±
1°C). Furthermore, the study of Xu and Axe (2005) indicated that the sands with higher
level of Fe coating had higher degree of detachment of the Fe particles under abrasion
tests. In our study the coating was performed at room temperature so that the Fe coated
sand is closer to the Fe coating on natural soils formed under environmentally relevant
conditions.
The DCB Fe content and the BET surface area measurements of the coated sands
exhibited a positive but nonlinear relationship to Fe content (Fig. 2.9). The higher
specific surface areas compared to typical values for goethite, particularly for sands
prepared using the precipitation method, suggests the presence of some amorphous Fe
oxides in the coatings (Table 2.1), consistent with our interpretation above. The Fe
content of the goethite prepared in the first step of the adsorption method had an Fe
content of 61.4%, very close to its stoichiometric value. The surface area of this goethite
was 53.3 m2 g-1 of goethite, which falls within the range of the reported values for
goethite (Kosmulski et al., 2004).
A comparative analysis between the two synthesis protocols indicates that the
precipitation method had a higher coating efficiency but resulted in a less-crystalline
coating with a corresponding higher specific surface area than the sand prepared using
the adsorption method. The ammonium oxalate extraction indicated the presence of
37
Iron Content (%)
0.00 0.05 0.10 0.15 0.20 0.25 0.30 0.35
Surface area (m
2 g
-1 sand)
0.0
0.1
0.2
0.3
0.4
0.5
0.6
0
0.1
0.2
0.3
0.4
0.5
0.6
Surface area (m
2 g
-1 of coated sand)
Crystalline iron
Amorphous iron
Quartz
Measured Surface Area
Figure 2.9 (a) Surface area versus Fe content of the synthesized sands.
(b) Calculated versus measured surface area of the coated sands.
Pure quartz
AD-1
PT-1
PT-2
PT-3 (a)
(b)
PT-1 PT-2 PT-3
38
amorphous Fe in PT sands (4% – 16%), with the crystallinity of the Fe increasing with Fe
content (Table 2.1). A theoretical calculation was made assuming a specific surface area
for crystalline goethite (90 m2 g-1) and amorphous HFO (600 m2 g-1) (Kosmulski et al.,
2004; Weng et al., 2001; Dzombak and Morel, 1990). The theoretical estimation agreed
with the measured surface area within 25% (Fig. 2.9b). The coated sand prepared using
the adsorption method was expected to be essentially completely crystalline, as pure
goethite prepared in the initial step (Fig. 2.5) was used in the subsequent coating step.
However, the AOD measurements also indicate ~15% amorphous Fe in AD-1 (Table 2.1)
as well. As a final point of comparison between the two methods, the adsorption was
more time consuming (15-20 days minimum) when compared to the precipitation method
(2-3 days). Both the ease of preparation of IOCS and the ability to manipulate the iron
oxide coating by controlling the Fe source favored choosing sands prepared via
precipitation method to perform adsorption studies with U(VI) subsequently.
2.4 Summary and Conclusion
Iron-coated sands were prepared via two common protocols, a precipitation
method, where Fe was precipitated directly onto the sand in a single step, and an
adsorption method, where pure goethite was prepared in the first step and then adsorbed
onto the sand in a second step. Although neither of the methods produced a completely
crystalline Fe coating, the precipitation method produced sands with larger portions of
amorphous Fe than the adsorption method, with the fraction of amorphous Fe decreasing
with increasing Fe content. Despite producing a less crystalline Fe coating, however, the
39
precipitation method was a more efficient and less time consuming method of preparing
Fe coated sand.
2.5 References
Anschutz, A.J., Penn, R.L., 2005. Reduction of crystalline iron(III) oxyhydroxides using
hydroquinone: Influence of phase and particle size. Geochem. Trans. 6, 60-66.
Barnett, M.O., Jardine, P.M. and Brooks, S.C., 2002. U(VI) adsorption to heterogeneous
subsurface media: Application of a surface complexation model. Environ. Sci.
Technol. 36, 937-942.
Bruno, J., Depablo, J., Duro, L., Figuerola, E., 1995. Experimental-study and modeling of
the U(VI)-Fe(OH)3 surface precipitation coprecipitation equilibria. Geochim.
Cosmochim. Acta 59, 4113-4123.
Cheng, T., Barnett, M.O., Roden, E.E., Zhuang, J.L., 2004. Effects of phosphate on
uranium (VI) adsorption to goethite-coated sand. Environ. Sci. Technol. 38, 6059-
6065.
Davis, J.A., Meece, D.E., Kohler, M., Curtis, G.P., 2004. Approaches to surface
complexation modeling of uranium (VI) adsorption on aquifer sediments.
Geochim. Cosmochim. Acta 68, 3621-3641.
Filius, J.D., Meeussen, J.C.L., Van Riemsdijk, W.H., 1999. Transport of malonate in a
goethite-silica sand system. Colloids Surf., A 151, 245-253.
Gabriel, U., Gaudet, J.P., Spadini, L., Charlet. L., 1998. Reactive transport of uranyl in a
goethite column: An experimental and modelling study. Chem. Geol. 151, 107-
128.
40
Giammar, D.E., Hering, J.G., 2001. Time scales for sorption-desorption and surface
precipitation of uranyl on goethite. Environ. Sci. Technol. 35, 3332-3337.
Hsi, C.K.D., Langmuir, D., 1985. Adsorption of uranyl onto ferric oxyhydroxides -
application of the surface complexation site-binding model. Geochim.
Cosmochim. Acta 49, 1931-1941.
Jackson M.L., Lim C.H., Zelazny L.W., 1986. Oxides, hydroxides, and aluminisilicates.
In Klute A. (Ed.), Methods of soil analysis. Part I. 2nd ed. Madison, WI. ASA and
SSA, pp113-119.
Kosmulski, M., Durand-Vidal, S., Maczka, E., Rosenholm, J.B., 2004. Morphology of
synthetic goethite particles. J. Colloid Interface Sci. 271, 261-269.
Loganathan VA, Barnett MO, Clement TP, Kanel SR., 2009. Scaling of Adsorption
Reactions: U(VI) Experiments and Modeling. Applied Geochem. 24, 2051-2060.
Meeussen, J.C.L., Kleikemper, J., Scheidegger, A., Borkovec, M., Paterson, E., Van
Riemsdijk, W.H., Sparks, D.L., 1999. Multicomponent transport of sulfate in a
goethite-silica sand system at variable pH and ionic strength. Environ. Sci.
Technol. 33, 3443-3450.
Meeussen, J.C.L., Scheidegger, A., Hiemstra, T., Van Riemsdijk, W.H., Borkovec, M.,
1996. Predicting multicomponent adsorption and transport of fluoride at variable
pH in a goethite-silica sand system. Environ. Sci. Technol. 30, 481-488.
Mehra, O.P., Jackson, M.L., 1960. Iron oxide removal from soils and clays by dithionite-
citrate system buffered with sodium bicarbonate. Clays Clay Miner. 7, 317–327.
Payne, T.E., Davis, J.A., Waite, T.D., 1994. Uranium retention by weathered schists - the
role of iron minerals. Radiochim. Acta 66-7, 297-303.
41
Rennert, T., Mansfeldt, T., Totsche, K.U., Greef, K., 2003. Sorption and transport of
iron-cyanide complexes in goethite-coated sand. Soil Sci. Soc. Am. J. 67, 756-
764.
Roden, E.E., Urrutia, M.M., Mann, C.J. 2000. Bacterial reductive dissolution of
crystalline Fe(III) oxide in continuous-flow column reactors. Appl. Environ.
Microbiol. 66, 1062-1065.
Scheidegger, A., Borkovec, M., Sticher H., 1993. Coating of silica sand with goethite -
preparation and analytical identification. Geoderma 58, 43-65.
Scheidegger, A., Burgisser, C.S., Borkovec, M., Sticher,H., Meeussen, H., Van
Riemsdijk,W., 1994. Convective-Transport of Acids and Bases in Porous-Media.
Water Resour. Res. 30, 2937-2944.
Schwertmann,U., Cornell, R.M., 2000. Iron Oxides in the Laboratory,. Wiley-VCH,
Weinheim. pp. 67-92.
Waite, T.D., Davis, J.A., Payne, T.E., Waychunas, G.A., Xu, N., 1994. Uranium(VI)
adsorption to ferrihydrite - application of a surface complexation model.
Geochim. Cosmochim. Acta 58, 5465-5478.
Weng, L., Temminghoff, E.J.M., Van Riemsdijk, W.H. 2001. Contribution of individual
sorbents to the control of heavy metal activity in sandy soil. Environ. Sci.
Technol. 35, 4436-4443.
Um, W.R.J.S., Christopher F. Brown, George V. Last. 2007. U(VI) adsorption on aquifer
sediments at the Hanford site. J. Contam. Hydrol. 93, 255-269.
Xu, Y., Axe, L., 2005. Synthesis and characterization of iron oxide-coated silica and its
effect on metal adsorption. J. Colloid Interface Sci. 282, 11-19.
42
3. Scaling of Adsorption Reactions in Batch systems: U(VI) Experiments and
Modeling
3.1 Introduction
Scaling is defined as the process of using observations made at one set of spatial
and temporal scales to understand processes or postulate behaviors at another set of
scales (Whipple et al., 2001). The experimental scales include the micrometer scale
biogeochemical studies (microbial, colloidal), bench scale experiment adsorption studies
(batch, transport scenarios in 1D column, 2D box, and 3D tank experiments), and more
rarely field-scale vadose zone experiments. More often the data obtained from these
experiments are used for predicting the long-term scenarios without considering their
scale and the inherent limitations. The classic case of using a constant distribution
coefficient obtained from batch experiments in transport models is a typical example.
Hence, it is important to address the scaling issues observed in simple systems operative
at centimeter/meter scale in the laboratory before solving the large-scale field transport
problems that ranges in kilometer/mile scales.
Prikryl et al. (2001) showed experimental evidence of U(VI) adsorption onto
silicate mineral mixtures that scaled to surface area. Similarly, Jang et al. (2007)
developed a surface complexation model for U(VI) adsorption onto HFO and showed that
the same model could describe the adsorption onto pure Fe oxide minerals like hematite
if adjusted for the specific surface area of the minerals. However, the above studies did
43
not show the application of scaling principles onto Fe oxide-coated media that are
common in the environment.
Surface complexation models (SCM) have frequently been used to describe the
adsorption of U(VI) to Fe oxides. A number of different models have proven capable of
adequately simulating the adsorption of U(VI) onto a particular Fe oxide under a range of
conditions (Cheng et al., 2004; Hsi and Langmuir, 1985; Jang et al., 2007; Waite et al.,
1994). However, our review indicates that there is no unique set of parameters or surface
complexation reactions that can describe the adsorption processes of U(VI) to a specific
Fe oxide. Mathur and Dzombak (2006) have compiled an extensive database for metal
and anion adsorption onto goethite and found similar intrinsic surface complexation
constants for hydrous ferric oxide (HFO) and goethite. Hence, they suggested that
adsorption onto different Fe oxides would be similar provided that the site density and
surface area, which are typically higher for HFO than for goethite, were taken into
account.
The study of Xu and Axe (2005) shows that surface area normalized adsorption of
nickel onto pure goethite and goethite-coated sand could be different indicating that pure
minerals and media coated with these minerals can behave quite differently. Accordingly,
we focus on U(VI) interactions with laboratory-synthesized Fe oxide-coated sand under
well-controlled conditions as an intermediate between pure Fe oxides and Fe-containing
soils and sediments. As opposed to natural geomedia, Fe-coated sands synthesized in the
laboratory under well-controlled conditions avoid other materials and species [e.g., pre-
adsorbed phosphate (Bostick et al., 2002)] that can influence adsorption. Understanding
the adsorption of U(VI) onto coated sands is an important step towards developing
44
scalable reaction models that can ultimately describe and predict the fate and transport of
U(VI) in the subsurface.
In this study, we hypothesize that the adsorption of U(VI) to Fe coated sand is
predominantly a surface-area driven process as opposed to an Fe content-driven process.
To test our hypothesis, we synthesized and characterized Fe coated sands and conducted
U(VI) adsorption experiments under well-controlled conditions. The experimental data
describing the interaction of Fe coated sand with U(VI) were tested by two different
scaling approaches using SCM to verify our hypothesis.
3.2 Materials and Methods
Batch adsorption experiments:
Both isotherm and pH adsorption edge experiments were performed to identify
the critical parameters involved in scaling U(VI) adsorption to the coated sands (Table
3.1). The experiments were conducted with three coated sands prepared using the
precipitation method (PT–1, PT–2, and PT–3, see Chapter 2), which were sequentially
coated to obtain increasing levels of Fe content (0.04%, 0.18%, and 0.32%, respectively).
The measured surface areas of these coated sands are shown in Table 3.2. Since the
coated sand from the adsorption method (AD-1, Chapter 2) had a low specific surface
area (due to the lower, more crystalline Fe content), the surface area of quartz contributed
significantly to the overall surface area. To keep the influence of quartz on U(VI) to a
minimum, we chose the coated sand from the precipitation method to perform the scaling
experiments. Batch adsorption isotherms were measured at relatively low pH (~4.5) in
order to maintain a stable pH without the use of pH buffers and to minimize the influence
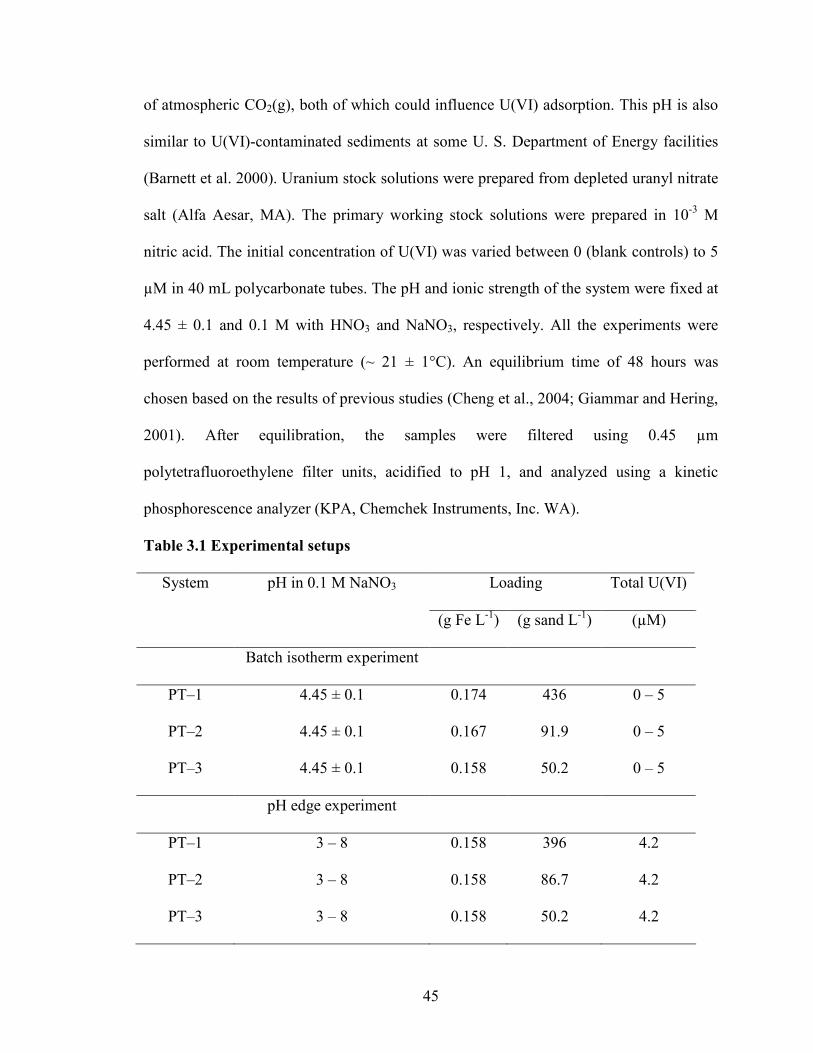
45
of atmospheric CO2(g), both of which could influence U(VI) adsorption. This pH is also
similar to U(VI)-contaminated sediments at some U. S. Department of Energy facilities
(Barnett et al. 2000). Uranium stock solutions were prepared from depleted uranyl nitrate
salt (Alfa Aesar, MA). The primary working stock solutions were prepared in 10-3 M
nitric acid. The initial concentration of U(VI) was varied between 0 (blank controls) to 5
µM in 40 mL polycarbonate tubes. The pH and ionic strength of the system were fixed at
4.45 ± 0.1 and 0.1 M with HNO3 and NaNO3, respectively. All the experiments were
performed at room temperature (~ 21 ± 1°C). An equilibrium time of 48 hours was
chosen based on the results of previous studies (Cheng et al., 2004; Giammar and Hering,
2001). After equilibration, the samples were filtered using 0.45 µm
polytetrafluoroethylene filter units, acidified to pH 1, and analyzed using a kinetic
phosphorescence analyzer (KPA, Chemchek Instruments, Inc. WA).
Table 3.1 Experimental setups
System pH in 0.1 M NaNO3 Loading Total U(VI)
(g Fe L-1) (g sand L-1) (µM)
Batch isotherm experiment
PT–1 4.45 ± 0.1 0.174 436 0 – 5
PT–2 4.45 ± 0.1 0.167 91.9 0 – 5
PT–3 4.45 ± 0.1 0.158 50.2 0 – 5
pH edge experiment
PT–1 3 – 8 0.158 396 4.2
PT–2 3 – 8 0.158 86.7 4.2
PT–3 3 – 8 0.158 50.2 4.2
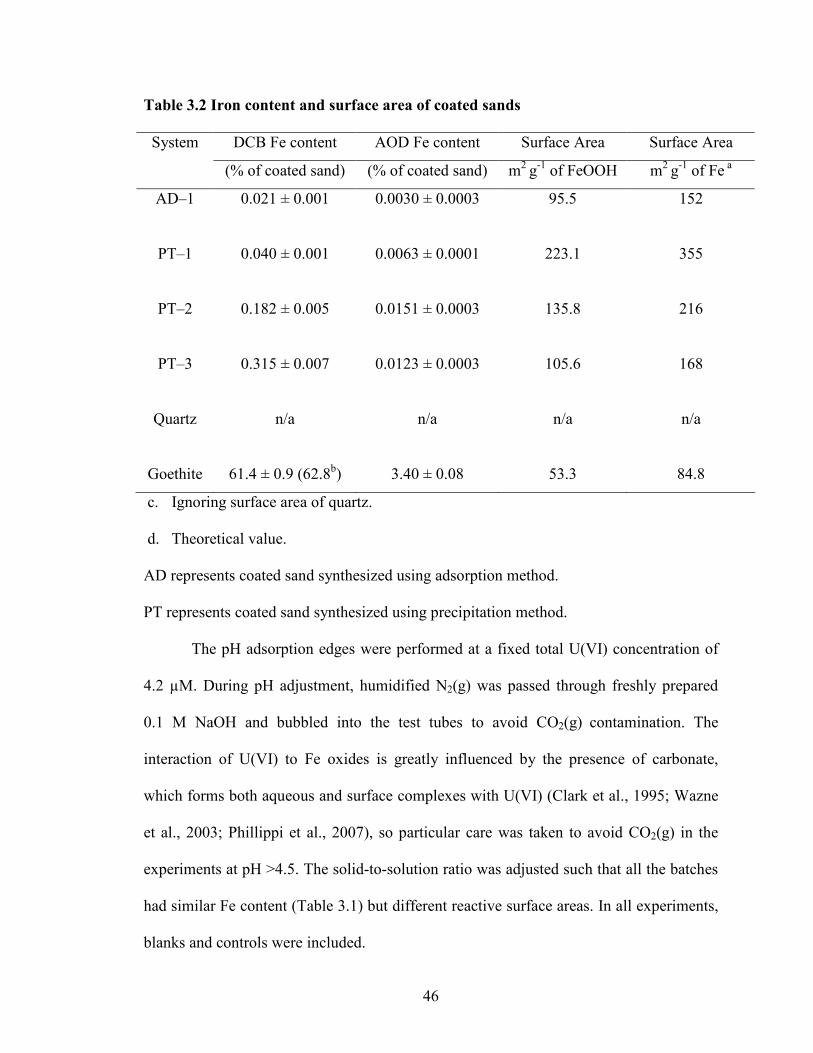
46
Table 3.2 Iron content and surface area of coated sands
System DCB Fe content AOD Fe content Surface Area Surface Area
(% of coated sand) (% of coated sand) m2 g-1 of FeOOH m2 g-1 of Fe a
AD–1 0.021 ± 0.001 0.0030 ± 0.0003 95.5 152
PT–1 0.040 ± 0.001 0.0063 ± 0.0001 223.1 355
PT–2 0.182 ± 0.005 0.0151 ± 0.0003 135.8 216
PT–3 0.315 ± 0.007 0.0123 ± 0.0003 105.6 168
Quartz n/a n/a n/a n/a
Goethite 61.4 ± 0.9 (62.8b) 3.40 ± 0.08 53.3 84.8
c. Ignoring surface area of quartz.
d. Theoretical value.
AD represents coated sand synthesized using adsorption method.
PT represents coated sand synthesized using precipitation method.
The pH adsorption edges were performed at a fixed total U(VI) concentration of
4.2 µM. During pH adjustment, humidified N2(g) was passed through freshly prepared
0.1 M NaOH and bubbled into the test tubes to avoid CO2(g) contamination. The
interaction of U(VI) to Fe oxides is greatly influenced by the presence of carbonate,
which forms both aqueous and surface complexes with U(VI) (Clark et al., 1995; Wazne
et al., 2003; Phillippi et al., 2007), so particular care was taken to avoid CO2(g) in the
experiments at pH >4.5. The solid-to-solution ratio was adjusted such that all the batches
had similar Fe content (Table 3.1) but different reactive surface areas. In all experiments,
blanks and controls were included.
47
Modeling:
Although there are other U(VI) surface complexation models for goethite
(Missana et al., 2003; Van Geen et al., 1994; Villalabos et al., 2001), Waite et al’s (1994)
model has successfully been used to describe the adsorption behavior of U(VI) onto both
amorphous and crystalline Fe oxides (Romero-Gonzalez et al., 2007). Moreover, the
model was previously tested on systems that used natural Fe-coated media as the
adsorbent (Logue et al., 2004; Barnett et al., 2002). A preliminary analysis of several
different surface complexation models revealed that the model of Waite et al. (1994) was
best able to predict our results over the entire data range. The exercise included using
Waite et al’s (1994) model to predict literature data sets that used U(VI) adsorption onto
goethite (Fig. 3.1). Based on spectroscopic evidence, Waite et al. (1994) reported that
U(VI) adsorbed to ferrihydrite as an inner-sphere, bidentate surface complex with two
different U-O equatorial bond distances. A similar coordination environment for U(VI)
interacting with goethite was subsequently confirmed by Moyes et al. (2000). Based on
these studies, Waite et al’s (1994) model was chosen for our study.
The bidentate surface complex reaction of U(VI) adsorption onto ferrihydrite
involves one mole of uranyl cation occupying two surface sites as shown in the reaction
below.
++ +⟩>
>=+
>
>HUO
FeO
FeOUO
FeOH
FeOH22
22 (3.1)
Whereas the stability constant is proportional to first order of the surface site (reaction
3.2).
]][[
]][)[(22
2022
FeOHUO
HUOFeOK
>>
= +
+
(3.2)
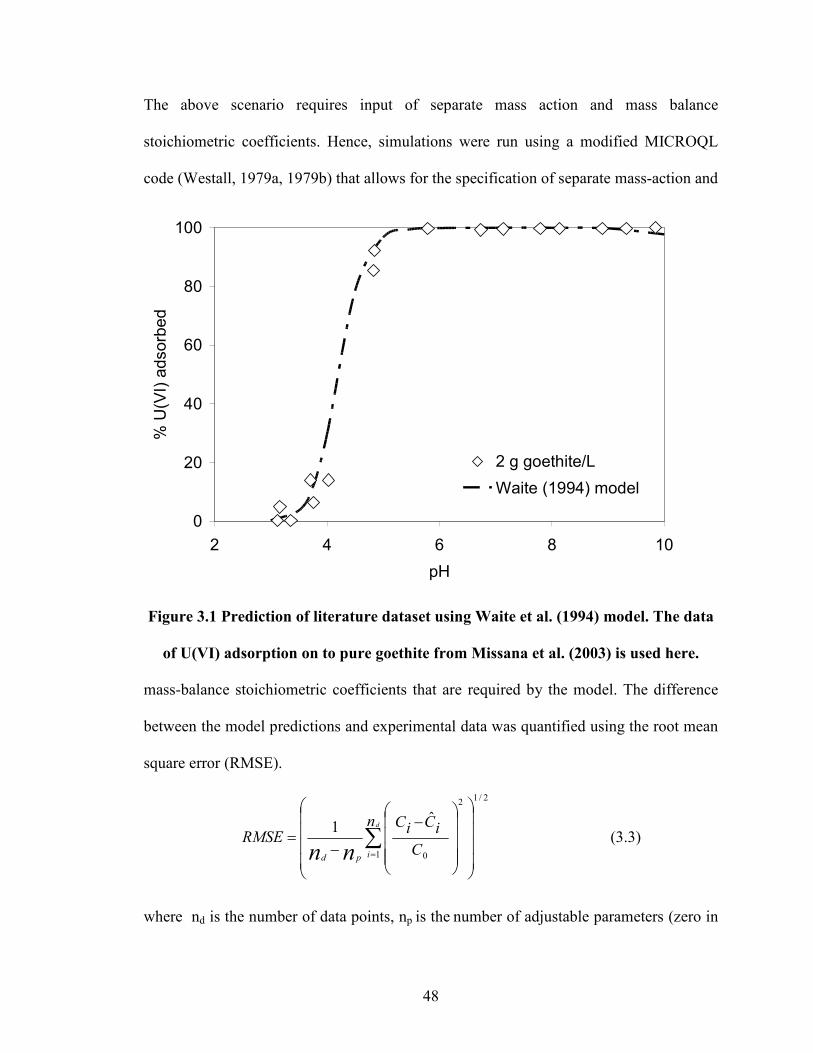
48
The above scenario requires input of separate mass action and mass balance
stoichiometric coefficients. Hence, simulations were run using a modified MICROQL
code (Westall, 1979a, 1979b) that allows for the specification of separate mass-action and
Figure 3.1 Prediction of literature dataset using Waite et al. (1994) model. The data
of U(VI) adsorption on to pure goethite from Missana et al. (2003) is used here.
mass-balance stoichiometric coefficients that are required by the model. The difference
between the model predictions and experimental data was quantified using the root mean
square error (RMSE).
2/1
1
2
0
ˆ1
−
−= ∑
=
n
C
iCiCRMSE
d
ipd nn (3.3)
where nd is the number of data points, np is the number of adjustable parameters (zero in
0
20
40
60
80
100
2 4 6 8 10
pH
% U(V
I) adsorbed
2 g goethite/L
Waite (1994) model
49
this case as the model was used in a purely predictive mode), i is an index, C and C are
the measured and predicted aqueous equilibrium concentration (mol L-1) at a total (solid
+ aqueous) concentration of C0 (mol L-1), respectively.
3.3 Results and Discussion
Experimental adsorption results:
The adsorption isotherms of the sands coated by the precipitation method are
shown in Figure 3.2. Differences in the adsorption isotherms were observed, even after
the U(VI) adsorption was normalized to Fe content (Fig. 3.2a). Sand PT–1 had
approximately eight times less Fe than PT–3, but approximately twice the surface area
per mole of Fe. As a result, the adsorption of U(VI) per mole of Fe was highest to PT-1
and lowest to PT-3. However, when the adsorption was scaled based on surface area
rather than Fe content, very similar isotherms were obtained (Fig. 3.2b). Scaling based on
surface area rather than Fe content minimizes the differences in surface area-driven
adsorption between crystalline and amorphous Fe oxides.
The relative adsorption of U(VI) as a function of pH also varied between the
sands (Fig. 3.3a). Note that by varying the mass of sand, the total Fe content of each
experimental system was the same (0.158 g L-1). As the U(VI) and Fe content of each
system were approximately the same, if adsorption was governed solely by the Fe
content, the percentage of U(VI) adsorbed in each system at a given pH should be the
same (i.e., the curves in Fig. 3.3a should overlap).
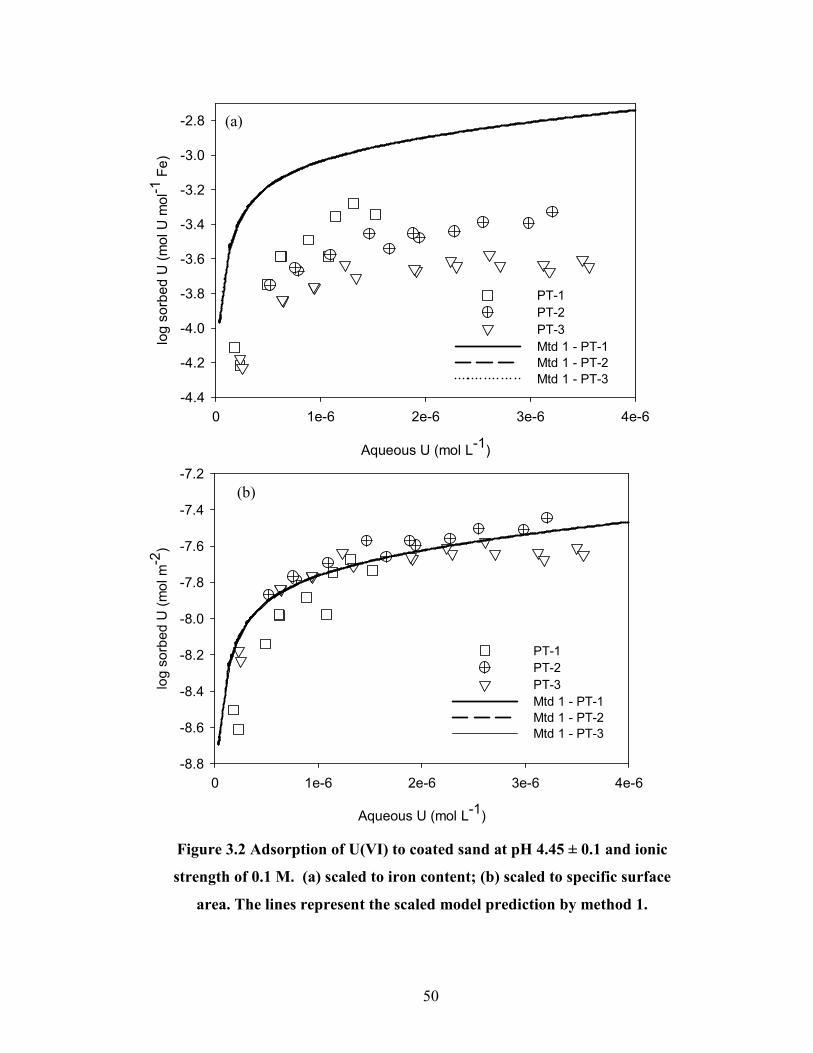
50
Aqueous U (mol L-1)
0 1e-6 2e-6 3e-6 4e-6
log sorbed U
(mol U m
ol-1 Fe)
-4.4
-4.2
-4.0
-3.8
-3.6
-3.4
-3.2
-3.0
-2.8
PT-1
PT-2
PT-3
Mtd 1 - PT-1
Mtd 1 - PT-2
Mtd 1 - PT-3
Aqueous U (mol L-1)
0 1e-6 2e-6 3e-6 4e-6
log sorbed U
(mol m-2)
-8.8
-8.6
-8.4
-8.2
-8.0
-7.8
-7.6
-7.4
-7.2
PT-1
PT-2
PT-3
Mtd 1 - PT-1
Mtd 1 - PT-2
Mtd 1 - PT-3
(a)
(b)
Figure 3.2 Adsorption of U(VI) to coated sand at pH 4.45 ± 0.1 and ionic
strength of 0.1 M. (a) scaled to iron content; (b) scaled to specific surface
area. The lines represent the scaled model prediction by method 1.
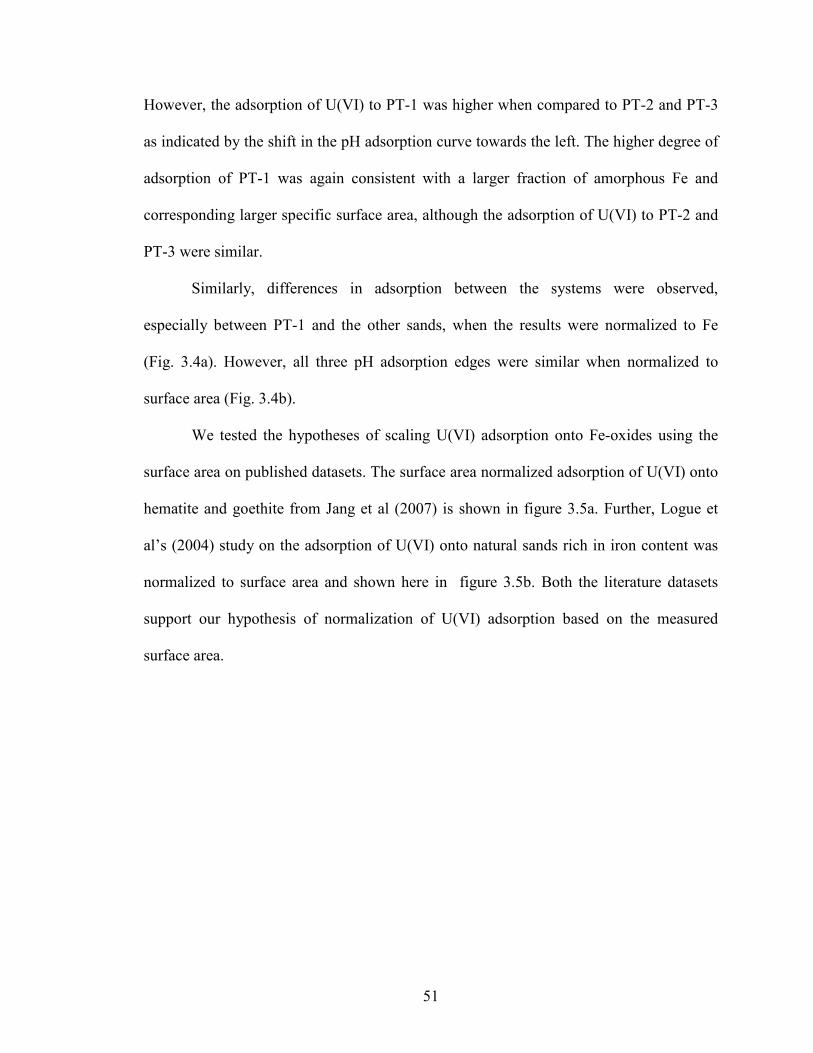
51
However, the adsorption of U(VI) to PT-1 was higher when compared to PT-2 and PT-3
as indicated by the shift in the pH adsorption curve towards the left. The higher degree of
adsorption of PT-1 was again consistent with a larger fraction of amorphous Fe and
corresponding larger specific surface area, although the adsorption of U(VI) to PT-2 and
PT-3 were similar.
Similarly, differences in adsorption between the systems were observed,
especially between PT-1 and the other sands, when the results were normalized to Fe
(Fig. 3.4a). However, all three pH adsorption edges were similar when normalized to
surface area (Fig. 3.4b).
We tested the hypotheses of scaling U(VI) adsorption onto Fe-oxides using the
surface area on published datasets. The surface area normalized adsorption of U(VI) onto
hematite and goethite from Jang et al (2007) is shown in figure 3.5a. Further, Logue et
al’s (2004) study on the adsorption of U(VI) onto natural sands rich in iron content was
normalized to surface area and shown here in figure 3.5b. Both the literature datasets
support our hypothesis of normalization of U(VI) adsorption based on the measured
surface area.
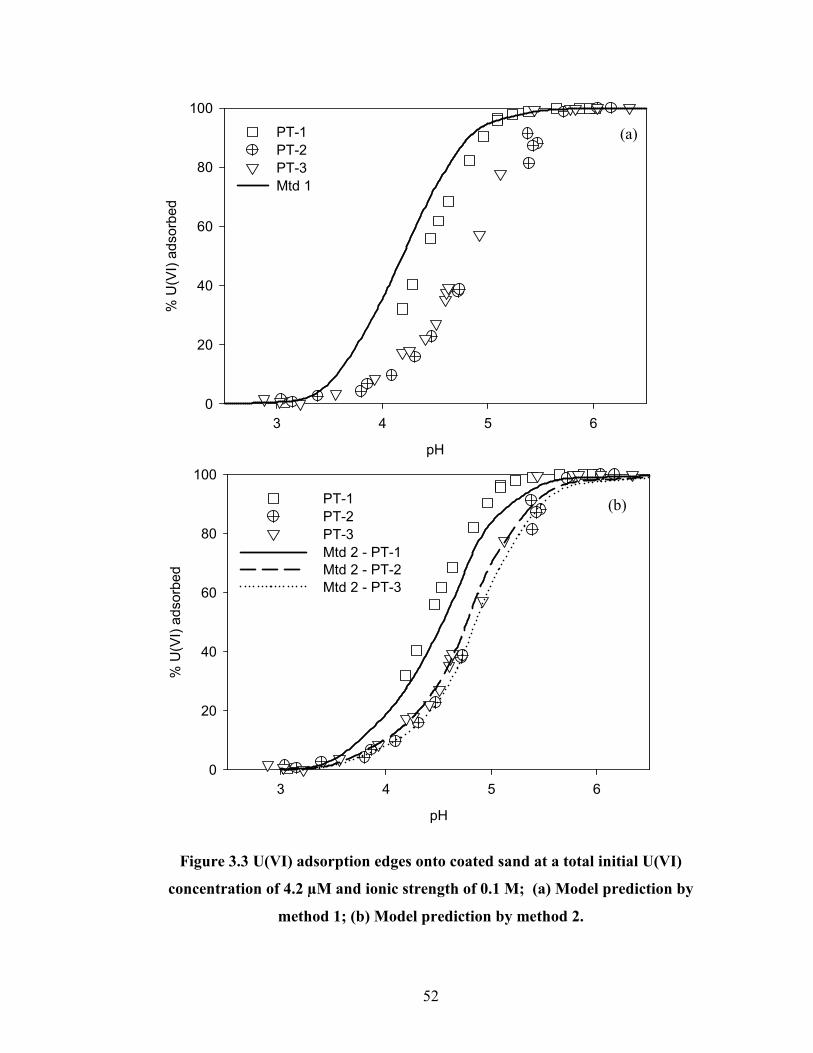
52
pH
3 4 5 6
% U
(VI) adsorbed
0
20
40
60
80
100
PT-1
PT-2
PT-3
Mtd 1
pH
3 4 5 6
% U(V
I) adsorbed
0
20
40
60
80
100
PT-1
PT-2
PT-3
Mtd 2 - PT-1
Mtd 2 - PT-2
Mtd 2 - PT-3
(a)
(b)
Figure 3.3 U(VI) adsorption edges onto coated sand at a total initial U(VI)
concentration of 4.2 µM and ionic strength of 0.1 M; (a) Model prediction by
method 1; (b) Model prediction by method 2.
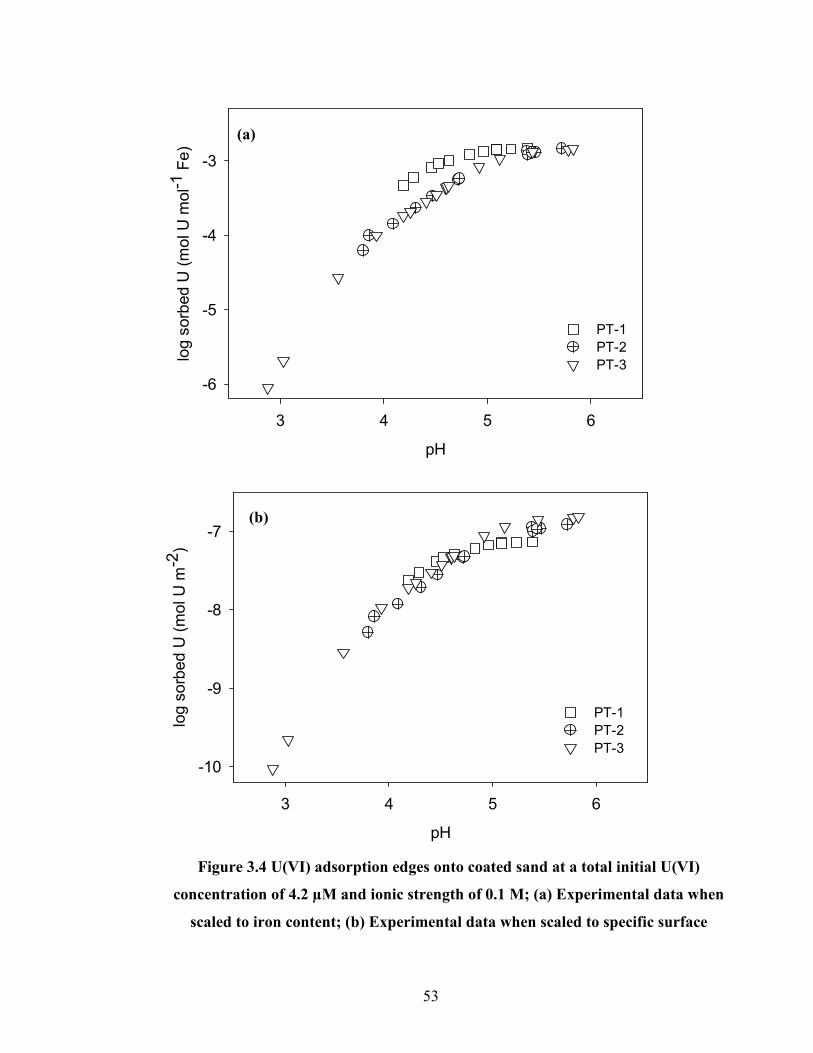
53
pH
3 4 5 6
log sorbed U (mol U m
ol-1 Fe)
-6
-5
-4
-3
PT-1
PT-2
PT-3
pH
3 4 5 6
log sorbed U (mol U m
-2)
-10
-9
-8
-7
PT-1
PT-2
PT-3
(a)
(b)
Figure 3.4 U(VI) adsorption edges onto coated sand at a total initial U(VI)
concentration of 4.2 µM and ionic strength of 0.1 M; (a) Experimental data when
scaled to iron content; (b) Experimental data when scaled to specific surface
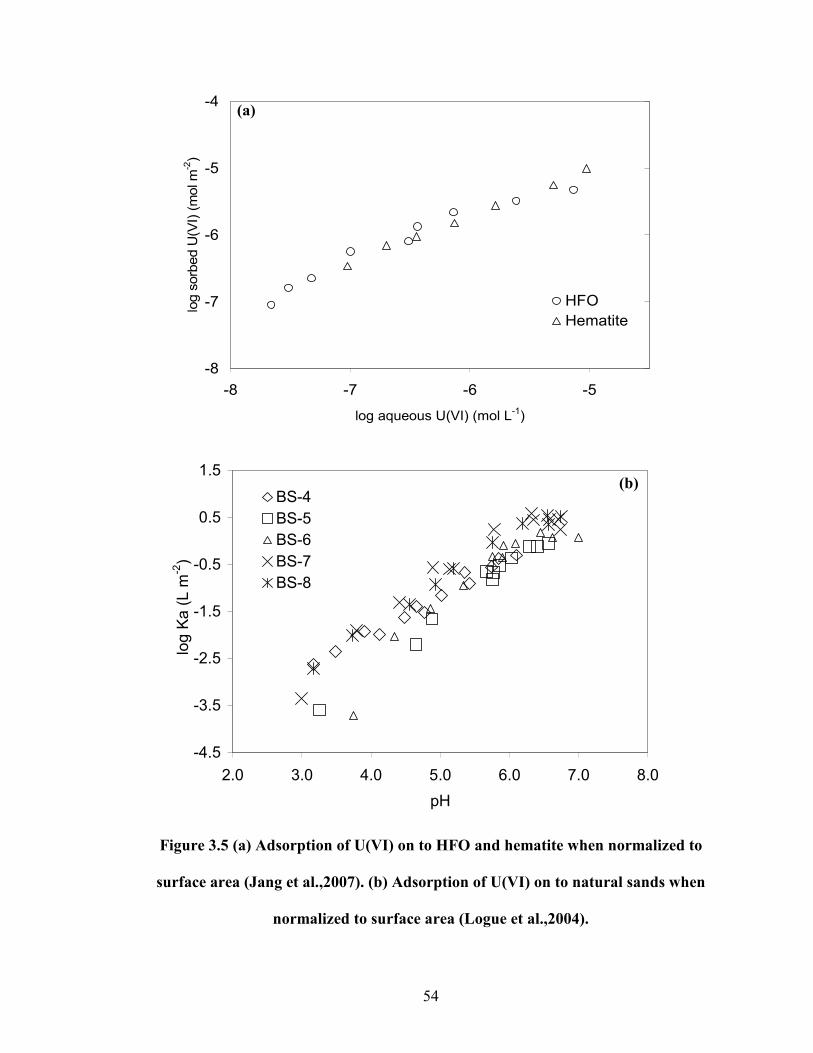
54
Figure 3.5 (a) Adsorption of U(VI) on to HFO and hematite when normalized to
surface area (Jang et al.,2007). (b) Adsorption of U(VI) on to natural sands when
normalized to surface area (Logue et al.,2004).
-4.5
-3.5
-2.5
-1.5
-0.5
0.5
1.5
2.0 3.0 4.0 5.0 6.0 7.0 8.0
pH
log Ka (L m
-2)
BS-4
BS-5
BS-6
BS-7
BS-8
-8
-7
-6
-5
-4
-8 -7 -6 -5
log aqueous U(VI) (mol L-1)
log sorbed U(VI) (mol m
-2)
HFO
Hematite
(b)
(a)
55
Modeling:
The diffuse double layer model developed by Waite et al. (1994) was used in a
predictive mode to model our data. The reactions and constants used in the model are
given in Table 3.3. The model was developed from U(VI) adsorption data on HFO with a
nominal specific surface area of 600 m2 g-1 and assumes adsorption of U(VI) onto two
types of sites (strong and weak). The ratio of weak sites to strong sites specified in the
model is ca. 485 with the site density being 0.8732 mole of weak sites per mole of Fe and
0.0018 mole of strong sites per mole of Fe. As the model was developed for amorphous
HFO, it serves as a test of our hypotheses that adsorption of U(VI) to both amorphous
and crystalline Fe oxides is approximately the same after correcting for surface area.
Using the reported site density, specific surface area, molecular mass of HFO, and
Avogadro’s number, the surface site density was calculated to be 2.03 x 10⁻² and 9.86
sites per nm2 for strong and weak sites, respectively. The site density of pure goethite
could range between 2.6 – 16.8 sites/nm2 (Davis and Kent, 1990). A total site density of
10 sites per square nanometer was suggested by Hayes et al. (1991) for goethite based on
potentiometric titration data supporting our hypothesis. For Fe oxide coated sand that
contains both crystalline and amorphous Fe minerals, using the same intrinsic surface
complexation constants was supported by similar intrinsic surface complexation
constants for both amorphous (HFO) and crystalline (goethite) Fe oxides reported by
Mathur and Dzombak (2006).
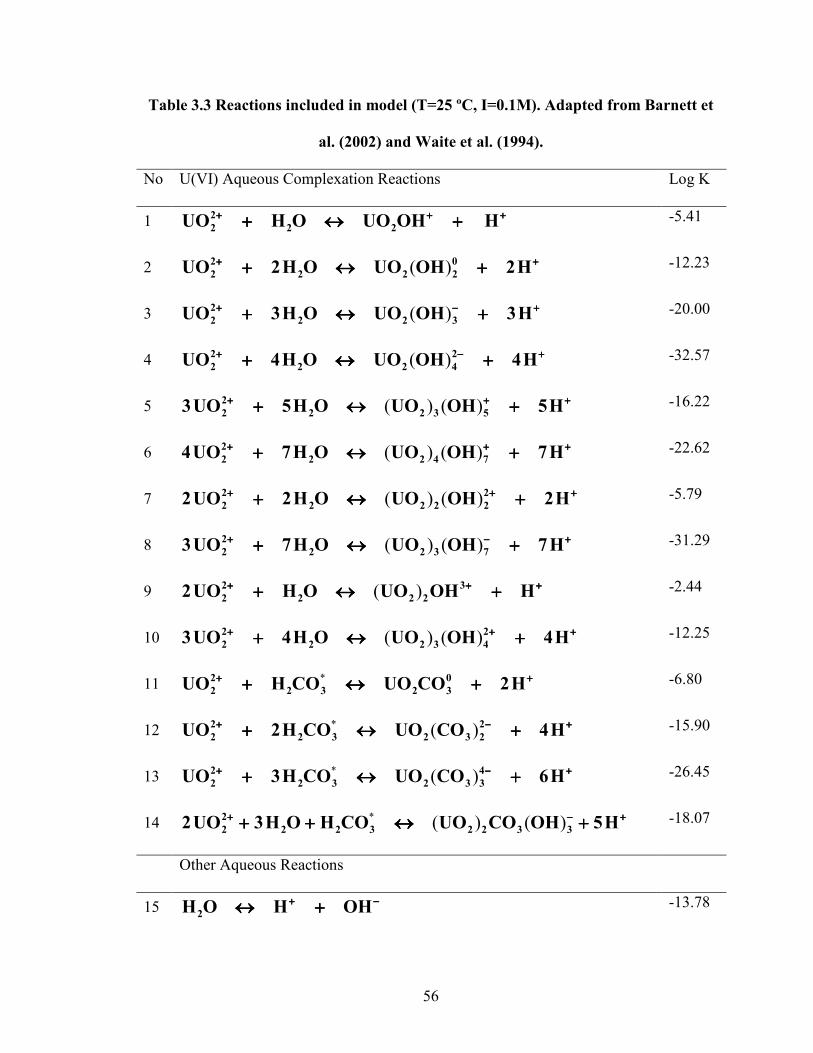
56
Table 3.3 Reactions included in model (T=25 ºC, I=0.1M). Adapted from Barnett et
al. (2002) and Waite et al. (1994).
No U(VI) Aqueous Complexation Reactions Log K
1 2
2 2 2UO H O UO OH H+ + ++ + ++ + ++ + ++ ↔ ++ ↔ ++ ↔ ++ ↔ + -5.41
2 ( )2 0
2 2 2 2UO 2H O UO OH 2H+ ++ ++ ++ ++ ↔ ++ ↔ ++ ↔ ++ ↔ + -12.23
3 ( )2
2 2 2 3UO 3H O UO OH 3H+ − ++ − ++ − ++ − ++ ↔ ++ ↔ ++ ↔ ++ ↔ + -20.00
4 ( )2 2
2 2 2 4UO 4H O UO OH 4H+ − ++ − ++ − ++ − ++ ↔ ++ ↔ ++ ↔ ++ ↔ + -32.57
5 ( ) ( )2
2 2 2 3 53UO 5H O UO OH 5H+ + ++ + ++ + ++ + ++ ↔ ++ ↔ ++ ↔ ++ ↔ + -16.22
6 ( ) ( )2
2 2 2 4 74UO 7H O UO OH 7H+ + ++ + ++ + ++ + ++ ↔ ++ ↔ ++ ↔ ++ ↔ + -22.62
7 ( ) ( )2 2
2 2 2 2 22UO 2H O UO OH 2H+ + ++ + ++ + ++ + ++ ↔ ++ ↔ ++ ↔ ++ ↔ + -5.79
8 ( ) ( )2
2 2 2 3 73UO 7H O UO OH 7H+ − ++ − ++ − ++ − ++ ↔ ++ ↔ ++ ↔ ++ ↔ + -31.29
9 ( )2 3
2 2 2 22UO H O UO OH H+ + ++ + ++ + ++ + ++ ↔ ++ ↔ ++ ↔ ++ ↔ + -2.44
10 ( ) ( )2 2
2 2 2 3 43UO 4H O UO OH 4H+ + ++ + ++ + ++ + ++ ↔ ++ ↔ ++ ↔ ++ ↔ + -12.25
11 *2 0
2 2 3 2 3UO H CO UO CO 2H+ ++ ++ ++ ++ ↔ ++ ↔ ++ ↔ ++ ↔ + -6.80
12 * ( )2 2
2 2 3 2 3 2UO 2H CO UO CO 4H+ − ++ − ++ − ++ − ++ ↔ ++ ↔ ++ ↔ ++ ↔ + -15.90
13 * ( )2 4
2 2 3 2 3 3UO 3H CO UO CO 6H+ − ++ − ++ − ++ − ++ ↔ ++ ↔ ++ ↔ ++ ↔ + -26.45
14 * ( ) ( )2
2 2 2 3 2 2 3 32UO 3H O H CO UO CO OH 5H+ − ++ − ++ − ++ − ++ + ↔ ++ + ↔ ++ + ↔ ++ + ↔ + -18.07
Other Aqueous Reactions
15 2H O H OH+ −+ −+ −+ −↔ +↔ +↔ +↔ +
-13.78
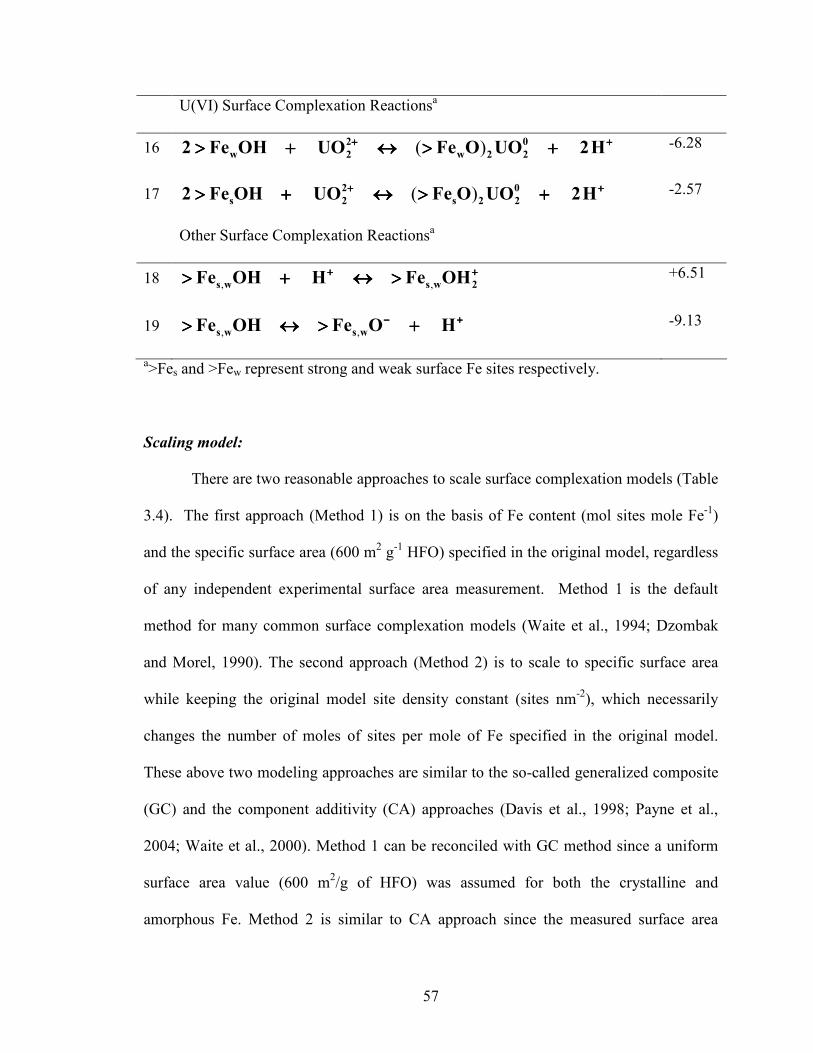
57
U(VI) Surface Complexation Reactionsa
16 ( )2 0
w 2 w 2 22 Fe OH UO Fe O UO 2H+ ++ ++ ++ +> + ↔ > +> + ↔ > +> + ↔ > +> + ↔ > + -6.28
17 ( )2 0
s 2 s 2 22 Fe OH UO Fe O UO 2H+ ++ ++ ++ +> + ↔ > +> + ↔ > +> + ↔ > +> + ↔ > + -2.57
Other Surface Complexation Reactionsa
18 , ,s w s w 2Fe OH H Fe OH+ ++ ++ ++ +> + ↔ >> + ↔ >> + ↔ >> + ↔ >
+6.51
19 , ,s w s wFe OH Fe O H− +− +− +− +> ↔ > +> ↔ > +> ↔ > +> ↔ > +
-9.13
a>Fes and >Few represent strong and weak surface Fe sites respectively.
Scaling model:
There are two reasonable approaches to scale surface complexation models (Table
3.4). The first approach (Method 1) is on the basis of Fe content (mol sites mole Fe-1)
and the specific surface area (600 m2 g-1 HFO) specified in the original model, regardless
of any independent experimental surface area measurement. Method 1 is the default
method for many common surface complexation models (Waite et al., 1994; Dzombak
and Morel, 1990). The second approach (Method 2) is to scale to specific surface area
while keeping the original model site density constant (sites nm-2), which necessarily
changes the number of moles of sites per mole of Fe specified in the original model.
These above two modeling approaches are similar to the so-called generalized composite
(GC) and the component additivity (CA) approaches (Davis et al., 1998; Payne et al.,
2004; Waite et al., 2000). Method 1 can be reconciled with GC method since a uniform
surface area value (600 m2/g of HFO) was assumed for both the crystalline and
amorphous Fe. Method 2 is similar to CA approach since the measured surface area
58
(theoretically shown to be the summation of crystalline and amorphous surface areas)
was used. Moreover, method 2 assumes similar site density for both the crystalline and
amorphous Fe.
We examined the two methods of scaling surface complexation models for sands
PT-1, PT-2, and PT-3, and examples of each method are detailed in Table 3.4. The model
predictions for the experimental isotherm data are shown in Figures 3.2 and 3.6. Using
the default scaling approach prescribed in the original model (Method 1), the model over-
predicted U(VI) adsorption on a per mole Fe basis (Fig. 3.2a), which is consistent with
the lower, independently measured specific surface area than used in the original model.
Although the model over-predicted the adsorption on a per mole Fe basis, when the
results were expressed on a per m2 basis, the model and data agreed quite well (Fig.
3.2b).
When scaled on the basis of the measured surface area rather than the Fe content
alone (Method 2) the model was able to predict the results on both a per mole Fe (Fig.
3.6a) and per m2 (Fig. 7b) basis within an RMSE of 11%. In this approach, the model
was scaled based on the independently measured specific surface area and the site density
specified in the original model (2.03 x 10⁻² and 9.86 sites per nm2 for strong and weak
sites, respectively), and the results were considerably better than Method 1. In addition,
scaling Method 2 was also superior to Method 1 when predicting the pH adsorption edges
as indicated by the RMSE in Table 3.4. In the case of the pH adsorption edges (Fig. 3.3a),
the scaled model (Method 2) correctly predicted the shift towards higher adsorption for
the system with higher surface area as observed in the experimental data (Fig. 3.3b).
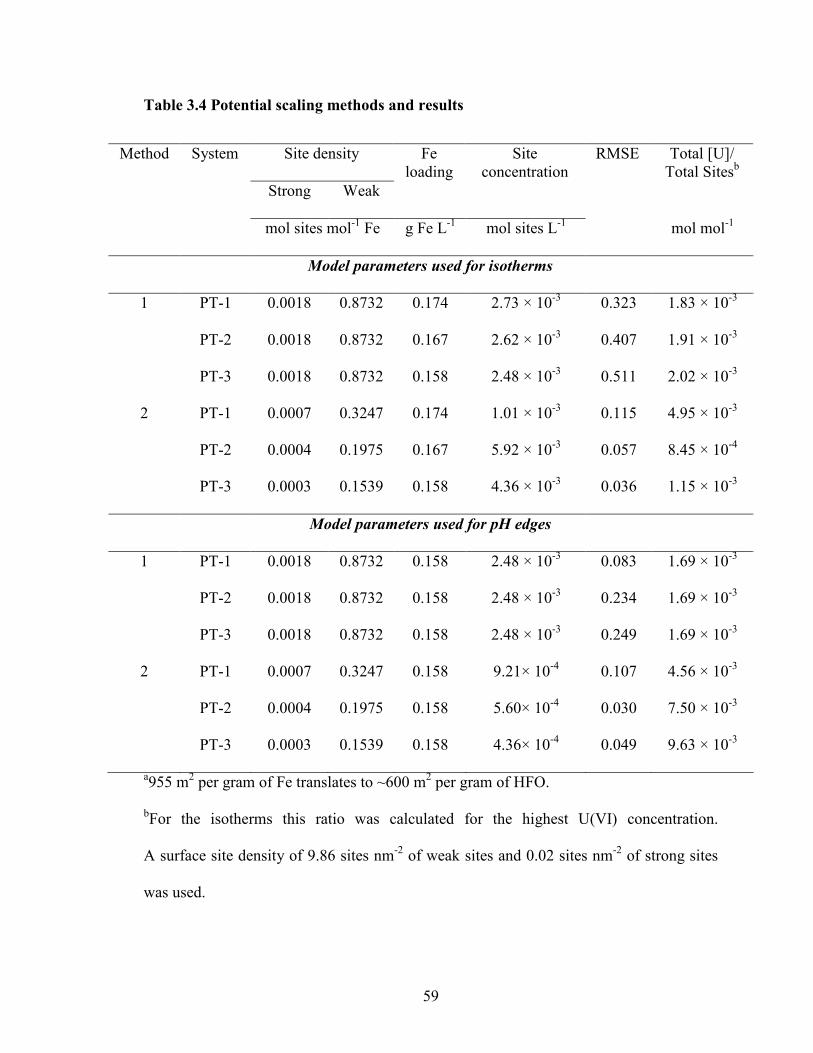
59
Table 3.4 Potential scaling methods and results
a955 m2 per gram of Fe translates to ~600 m2 per gram of HFO.
bFor the isotherms this ratio was calculated for the highest U(VI) concentration.
A surface site density of 9.86 sites nm-2 of weak sites and 0.02 sites nm-2 of strong sites
was used.
Method System Site density Fe loading
Site concentration
RMSE Total [U]/ Total Sitesb
Strong Weak
mol sites mol-1 Fe g Fe L-1 mol sites L-1 mol mol-1
Model parameters used for isotherms
1 PT-1 0.0018 0.8732 0.174 2.73 × 10⁻³ 0.323 1.83 × 10⁻³
PT-2 0.0018 0.8732 0.167 2.62 × 10⁻³ 0.407 1.91 × 10⁻³
PT-3 0.0018 0.8732 0.158 2.48 × 10⁻³ 0.511 2.02 × 10⁻³
2 PT-1 0.0007 0.3247 0.174 1.01 × 10⁻³ 0.115 4.95 × 10⁻³
PT-2 0.0004 0.1975 0.167 5.92 × 10⁻³ 0.057 8.45 × 10⁻⁴
PT-3 0.0003 0.1539 0.158 4.36 × 10⁻³ 0.036 1.15 × 10⁻³
Model parameters used for pH edges
1 PT-1 0.0018 0.8732 0.158 2.48 × 10⁻³ 0.083 1.69 × 10⁻³
PT-2 0.0018 0.8732 0.158 2.48 × 10⁻³ 0.234 1.69 × 10⁻³
PT-3 0.0018 0.8732 0.158 2.48 × 10⁻³ 0.249 1.69 × 10⁻³
2 PT-1 0.0007 0.3247 0.158 9.21× 10⁻⁴ 0.107 4.56 × 10⁻³
PT-2 0.0004 0.1975 0.158 5.60× 10⁻⁴ 0.030 7.50 × 10⁻³
PT-3 0.0003 0.1539 0.158 4.36× 10⁻⁴ 0.049 9.63 × 10⁻³
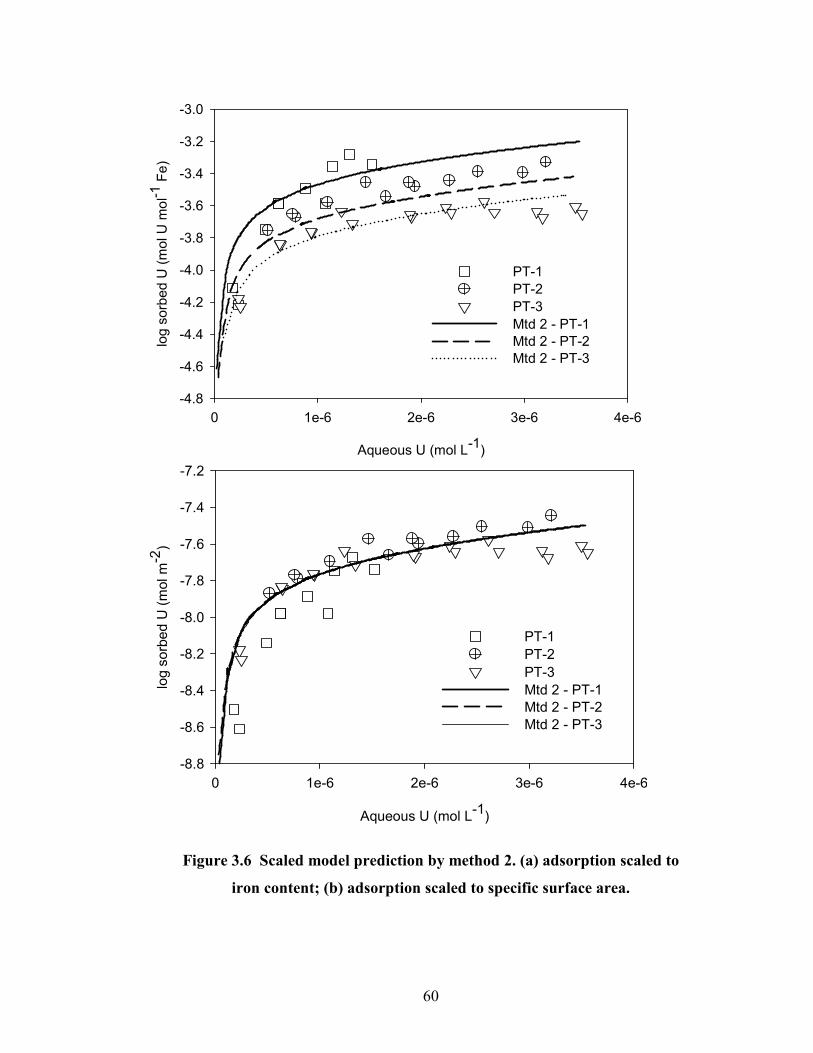
60
Aqueous U (mol L-1)
0 1e-6 2e-6 3e-6 4e-6
log sorbed U
(mol U m
ol-1 Fe)
-4.8
-4.6
-4.4
-4.2
-4.0
-3.8
-3.6
-3.4
-3.2
-3.0
PT-1
PT-2
PT-3
Mtd 2 - PT-1
Mtd 2 - PT-2
Mtd 2 - PT-3
Aqueous U (mol L-1)
0 1e-6 2e-6 3e-6 4e-6
log sorbed U
(mol m-2)
-8.8
-8.6
-8.4
-8.2
-8.0
-7.8
-7.6
-7.4
-7.2
PT-1
PT-2
PT-3
Mtd 2 - PT-1
Mtd 2 - PT-2
Mtd 2 - PT-3
Figure 3.6 Scaled model prediction by method 2. (a) adsorption scaled to
iron content; (b) adsorption scaled to specific surface area.
61
These results illustrate salient principles of adsorption scaling, as several common surface
complexation models are parameterized only on a per molar Fe basis. Our findings show
that U(VI) adsorption on Fe coated sand system representative of natural porous media
scales better with surface area than Fe content alone. Moreover, the scaling processes can
be predicted within the paradigm of surface complexation models.
3.4 Summary and Conclusions
U(VI) adsorption isotherms and pH adsorption edges were measured on three
coated sands with Fe contents ranging from 0.04 to 0.3%. Experimentally, the adsorption
of U(VI) onto the three sands was more comparable when normalized to surface area than
when normalized to Fe content. We also examined the ability of several surface
complexation models to predict our adsorption data. Although several different models
could predict our data with a reasonable degree of accuracy, the model of Waite et al.
(1994) predicted the complete range of data better than the other models we tested. As
the model was developed for amorphous HFO, it also served as a test of our hypotheses
that adsorption of U(VI) to both amorphous and crystalline Fe oxides is approximately
the same after correcting for surface area.
Two different methods of scaling adsorption models were examined, an Fe
content based method and a surface area based method. Consistent with the experimental
data, scaling the adsorption model on the basis of surface area was the best approach.
These findings are significant because many common surface complexation models are
parameterized on the basis of Fe content rather than surface area. Finally, although the
interactions of U(VI) and Fe coated sands were used as representative adsorbate and
62
adsorbent, the general principles may be applicable to other adsorbate-adsorbent systems
as well.
3.5 References
Barnett, M.O., Jardine, P.M., Brooks, S.C., Selim, H.M., 2000. Adsorption and transport
of uranium(VI) in subsurface media. Soil Sci. Soc. Am. J. 64, 908-917.
Barnett, M.O., Jardine, P.M. and Brooks, S.C., 2002. U(VI) adsorption to heterogeneous
subsurface media: Application of a surface complexation model. Environ. Sci.
Technol. 36, 937-942.
Bostick, B. C., Fendorf, S. E., Barnett, M. O., Jardine, P. M., Brooks, S. C., 2002. Uranyl
surface complexes formed on subsurface media from DOE facilities. Soil Sci.
Soc. Am. J. 66, 99-108.
Cheng, T., Barnett, M.O., Roden, E.E., Zhuang, J.L., 2004. Effects of phosphate on
uranium (VI) adsorption to goethite-coated sand. Environ. Sci. Technol. 38, 6059-
6065.
Clark, D.L., Hobart, D.E., Neu, M.P., 1995. Actinide carbonate complexes and their
importance in actinide environmental chemistry. Chem. Rev. 95, 25-48.
Davis, J.A., Kent, D.B., 1990. Surface complexation modeling in aqueous geochemistry.
In: Hochella, M.F., White, A.F. (Ed.), Reviews in Mineralogy, 23, Mineralogical
Society of America. pp. 177-260.
Davis, J.A., Coston, J.A., Kent, D.B., Fuller, C.C., 1998. Application of the surface
complexation concept to complex mineral assemblages. Environ. Sci. Technol.
32, 2820-2828.
63
Dzombak, D.A., Morel, F.M.M, 1990. Surface complexation modeling: Hydrous Ferric
Oxide. John Wiley & Sons.
Giammar, D.E., Hering, J.G., 2001. Time scales for sorption-desorption and surface
precipitation of uranyl on goethite. Environ. Sci. Technol. 35, 3332-3337.
Hayes, K.F., Redden, G., Ela, W., Leckie, J.O., 1991. Surface complexation models an
evaluation of model parameter-estimation using FITEQL and oxide mineral
titration data. J. Colloid Interface Sci.142, 448-469.
Hsi, C.K.D., Langmuir, D., 1985. Adsorption of uranyl onto ferric oxyhydroxides -
application of the surface complexation site-binding model. Geochim.
Cosmochim. Acta 49, 1931-1941.
Jang, J.H., Dempsey, B.A., Burgos, W.D., 2007. A model-based evaluation of sorptive
reactivities of hydrous ferric oxide and hematite for U(VI). Environ. Sci. Technol.
41, 4305-4310.
Logue, B.A., Smith, R.W., Westall. J.C., 2004. U(VI) adsorption on natural iron-coated
sands: Comparison of approaches for modeling adsorption on heterogeneous
environmental materials. Appl. Geochem.19, 1937-1951.
Mathur S.S., Dzombak, D.A., 2006. Surface complexation modeling: Goethite, In:
Johannes Lutzenkirchen (Ed.), Surface complexation modeling. Elsevier, The
Netherlands. pp. 443-468.
Missana, T., Garcia-Gutierrez, M., Maffiotte, C., 2003. Experimental and modeling study
of the uranium (VI) sorption on goethite. J. Colloid Interface Sci. 260, 291-301.
Moyes, L.N., Parkman, R.H., Charnock, J.M., Vaughan, D.J., Livens, F.R., Hughes, C.R.
Braithwaite, A., 2000. Uranium uptake from aqueous solution by interaction with
64
goethite, lepidocrocite, muscovite, and mackinawite: An x-ray absorption
spectroscopy study. Environ. Sci. Technol. 34, 1062-1068.
Payne, T.E., Davis, J.A., Ochs, M., Olin, M. and Tweed, C.J., 2004. Uranium adsorption on
weathered schist - intercomparison of modelling approaches. Radiochim. Acta 9-11, 651-
661.
Phillippi, J.M., Loganathan, V.A., McIndoe, M.J., Barnett, M.O., T.P. Clement, E.E.
Roden. 2007. Theoretical solid/solution ratio effects on adsorption and transport:
Uranium(VI) and carbonate. Soil Sci. Soc. Am. J. 71, 329-335.
Prikryl, J.D., Jain, A., Turner, D.R., Pabalan, R.T., 2001. Uranium(VI) sorption behavior
on silicate mineral mixtures. J. Contam. Hydrol. 47, 241-253.
Romero-Gonzalez, M.R., Cheng, T., Barnett, M.O., Roden, E.E., 2007. Surface
complexation modeling of the effects of phosphate on uranium(VI) adsorption.
Radiochim. Acta 95:251-259.
Van Geen, A., Robertson, A.P. Leckie, J.O., 1994. Complexation of carbonate species at
the goethite surface - implications for adsorption of metal-ions in natural-waters.
Geochim. Cosmochim. Acta 58, 2073-2086.
Villalobos, M., Trotz, M.A., Leckie, J.O., 2001. Surface complexation modeling of
carbonate effects on the adsorption of Cr(VI), Pb(II), and U(VI) on goethite.
Environ. Sci. Technol. 35, 3849-3856.
Waite, T.D., Davis, J.A., Payne, T.E., Waychunas, G.A., Xu, N., 1994. Uranium(VI)
adsorption to ferrihydrite - application of a surface complexation model.
Geochim. Cosmochim. Acta 58, 5465-5478.
Waite, T.D., Davis, J.A., Fenton, B.R. and Payne, T.E., 2000. Approaches to modelling
uranium(VI) adsorption on natural mineral assemblages. Radiochim. Acta 88, 687-693.
65
Wazne, M., Korfiatis, G.P., Meng, X.G., 2003. Carbonate effects on hexavalent uranium
adsorption by iron oxyhydroxide. Environ. Sci. Technol. 37, 3619-3624.
Westall, J.C., 1979. MICROQL. I. A chemical equilibrium program in BASIC, Technical
Report. Swiss Federal Institute of Technology, EAWAG, Dubendorf,
Switzerland.
Westall, J.C., 1979. MICROQL. II. Computation of adsorption equilibria in BASIC,
Technical Report. Swiss Federal Institute of Technology, EAWAG, Dubendorf,
Switzerland.
Whipple, C.G., D.W. Berman, S.B. Clark, J.C. Fountain, L.W. Gelhar, L.C. Green, R.O.
Hall, E.E. Herricks, B.D. Honeyman, S. Levy, J.K. Mitchell, L.T. Silver, L.
Smith, and D.A. Stonestrom, Science and Technology for Environmental Cleanup
at Hanford, National Academy Press, 2001. Review of the Hanford Site's
Environmental Remediation Science and Technology Plan, Board on Radioactive
Waste Management, National Research Council.185-193.
Xu, Y., Axe, L., 2005. Synthesis and characterization of iron oxide-coated silica and its
effect on metal adsorption. J. Colloid Interface Sci. 282, 11-19.
66
4. Understanding the Adsorption Discrepancies between Batch and Column
Scenarios
4.1 Introduction
In the early 1940’s, the naturally occurring radioactive element, uranium, was
heavily used in the nuclear weapons program and energy production. Ever since, the vast
use of uranium has left a legacy of contaminants in the subsurface environment,
especially at most of the U.S. Department of Energy (DOE) sites (Gee et al., 2007).
Mainly, U is in the tetravalent (IV) or hexavalent (VI) state in the subsurface. The
solubility of U(IV) is very low when compared to U(VI) and hence it is less mobile.
Furthermore, the presence of oxic groundwater readily favors the conversion of U(IV) to
U(VI), making U(VI) the most important form of uranium in groundwater.
Previous studies indicate that the sorption of U(VI) at contaminated sites occurs
mainly onto metal oxides/oxy hydroxides. In particular, Fe(III) oxides/oxy hydroxides are
found to be the dominant U adsorbing phase of geomedia (Um et al., 2007; Davis et al.,
2004; Barnett et al., 2002). Various forms of Fe(III) oxides occur in nature and can be
broadly classified into crystalline (e.g., goethite, hematite) and amorphous forms (e.g.,
hydrous ferric oxide, ferrihydrite). Crystalline Fe oxides exhibit lower specific surface
area and microporosity compared to the non-crystalline, amorphous Fe oxides
(Schwertmann and Cornell, 2000). At U(VI)-contaminated sites, Fe oxides often appear
as coatings on other geomedia rather than discrete minerals (Davis et al., 2004; Payne et
al., 1994; Um et al., 2007). In order to predict the field-scale transport of U(VI), its
67
adsorption processes should be understood and be able to be scaled. Ultimately, this
would also aid in the design of effective remediation strategies.
The critical parameter that describes the sorption of a contaminant to geomedia is
typically obtained by performing batch sorption isotherms and is referred to as the
distribution coefficient (Kd). Often, the simple laboratory-determined Kd fails to describe
the field scale transport of contaminants (Relyea at al., 1980). Since the chemical
conditions of the subsurface environment have a drastic influence on Kd, [e.g. a 0.5 unit
change in pH can cause about 50% difference in the sorption of U(VI) onto geomedia
(Barnett et al., 2000)], simple models of sorption (linear, Freundlich, Langmuir) may be
replaced by surface complexation models (SCM). In the case of U(VI) adsorption to Fe
oxides, a number of different SCM have proven capable of adequately simulating
adsorption under a range of conditions (Cheng et al., 2004; Hsi and Langmuir, 1985; Jang
et al., 2007; Waite et al., 1994).
More often, the adsorption of a solute onto the sorbent (either natural or laboratory
synthesized) is quantified using batch scale experiments, which are then used to predict
field-scale transport scenarios. One of the most perplexing and yet unresolved problems
is the discrepancy observed between batch-derived and column-derived adsorption
capacities. Even studies performed using pure mineral media/model sorbents showed
such differences in sorption capacity. For example, Kohler et al. (1996) and Gabriel et al.
(1998) reported batch-column discrepancies in U(VI) sorption onto pure quartz and
goethite-coated sand, respectively. The issue could have serious implications when batch-
measured sorption coefficients are used to estimate the retardation factor for field-scale
U(VI) reactive transport.
68
The focus of this study is to understand the causes of the above problem using both a
homogeneous synthetic adsorbent and a natural heterogeneous geomedia. The
uncontaminated natural geomedia (designated OR) was acquired from Oak Ridge
Reservation in East Tennessee, which is one of the primary DOE sites that is
contaminated with U(VI). The OR soil used here is uncontaminated with respect to
U(VI). The synthetic media, iron oxide-coated sand (IOCS), was prepared in the
laboratory using the method described in Loganathan et al. (2009).
The two major objectives of this study were:
(i) To scale the adsorption reactions using U(VI) and iron oxide-coated sand as a model
system.
(ii) To find the probable causes for the reported sorption discrepancies between the batch
and column scales using both natural and synthetic media.
4. 2 Materials and Methods
Sorbate and sorbent:
U(VI) in the form of uranyl nitrate salt was used as the solute. The adsorbents
used in this study were laboratory synthesized iron oxide-coated sand (IOCS) and Oak
Ridge reservation soil. The IOCS was prepared using pure white quartz as a substrate
onto which goethite (FeOOH) was coated using the precipitation method. The details of
the coating protocol are discussed elsewhere (Loganathan et al., 2009). The iron content
of the synthetic media thus obtained was measured using the dithionate-citrate-
bicarbonate (DCB) method (Mehra and Jackson, 1960) and it is 0.431 ± 0.010 mg Fe g-1
of sand . The BET surface area of the sand was 0.107 m2 g-1 as measured using N2 gas.
69
Accounting for the surface area of quartz, the surface area of the coated sand on an Fe
basis was calculated to be 164 m2 g-1 Fe. The DCB Fe content of the OR soil was 24.6 ±
4.2 mg Fe g-1 of soil. The organic matter in OR soil was reported to be ca. 0.55 g kg-1
(Barnett et al., 2000). The extraction of phosphate from OR soil was performed using the
Mehlich-1 method as outlined in Beck at al. (2004). Briefly, approximately 2 grams of
OR soil was mixed with 0.0125M H2SO4 and 0.05M HCl for about 2 hours. At the end of
the extraction phase, samples were centrifuged and filtered using 0.45 µm
polytetrafluoroethylene filter units. The filtered samples were analyzed using ICP-OES.
Batch experiments:
Batch kinetic and isotherm experiments in IOCS were performed at two solid-to-solution
ratios (SSR), 50 and 500 g L-1. The ionic strength was fixed at 0.1 M using NaNO3 and
the experiments were performed at pH 5.0±0.2. In the case of OR soil, batch experiments
were performed at low SSR’s (1.67, 3.33, and 16.7 g L-1) because of its higher Fe
content.
1D-transport experiments:
Column experiments were performed in a 15 × 2.5 cm or 10 × 1.0 cm glass column.
Preliminary experiments were performed in an empty column to check the adsorption of
U(VI) to the glass column. In the case of IOCS, column experiments were performed at a
pH of 4.9±0.2, wherein the background ionic strength was maintained at 0.1 M using
NaNO3, which is similar to the batch experimental conditions. In order to derive sorption
isotherms from transport experiments, a multi-step column experiment was designed and
conducted at a fixed pH and varying U(VI) concentration (1.05 – 5.25 µM), wherein
70
IOCS was used as the adsorbent. In the case of OR soil, as the Fe content of the OR soil
is very high (ca. 2.4% Fe) strong sorption to U(VI) was expected. Hence to obtain
breakthrough in a practical time frame, a smaller column (10 cm x 1.0 cm) was used,
which was packed with 2 grams of OR soil. Since the natural pH of the OR soil was ~
4.7, a similar pH condition (4.6-4.8) was maintained in both batch and column
experiments without the use of any external buffers.
4.3 Results and Discussion
Batch experiments:
The adsorption kinetics of U(VI) onto IOCS at two different SSR is shown in
Figure 4.1. In the case of low SSR (50 g L-1) about 20% of the initial U(VI) [4.2 µM ]
was adsorbed within 15 days whereas at high (500 g L-1) SSR about 80% of the initial
U(VI) was adsorbed within 15 days. Based on the kinetic experiments, an equilibrium
time of 3 days was chosen for the batch isotherm experiments. A lesser equilibrium time
of 2 days was found to be sufficient for U(VI) experiments with OR soil (Barnett et al.,
2000). The adsorption of U(VI) on to both IOCS and OR soil followed a typical
Freundlich isotherm (Figs 4.2a and b).
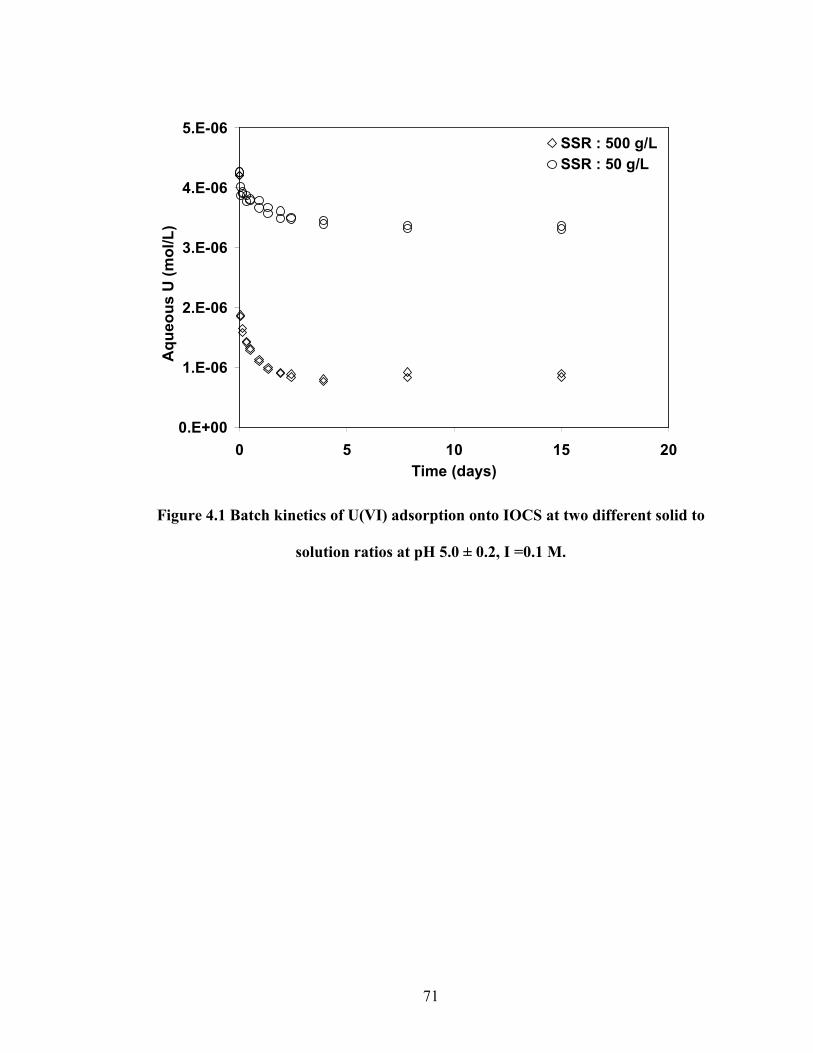
71
0.E+00
1.E-06
2.E-06
3.E-06
4.E-06
5.E-06
0 5 10 15 20
Time (days)
Aqueous U
(m
ol/L)
SSR : 500 g/L
SSR : 50 g/L
Figure 4.1 Batch kinetics of U(VI) adsorption onto IOCS at two different solid to
solution ratios at pH 5.0 ± 0.2, I =0.1 M.
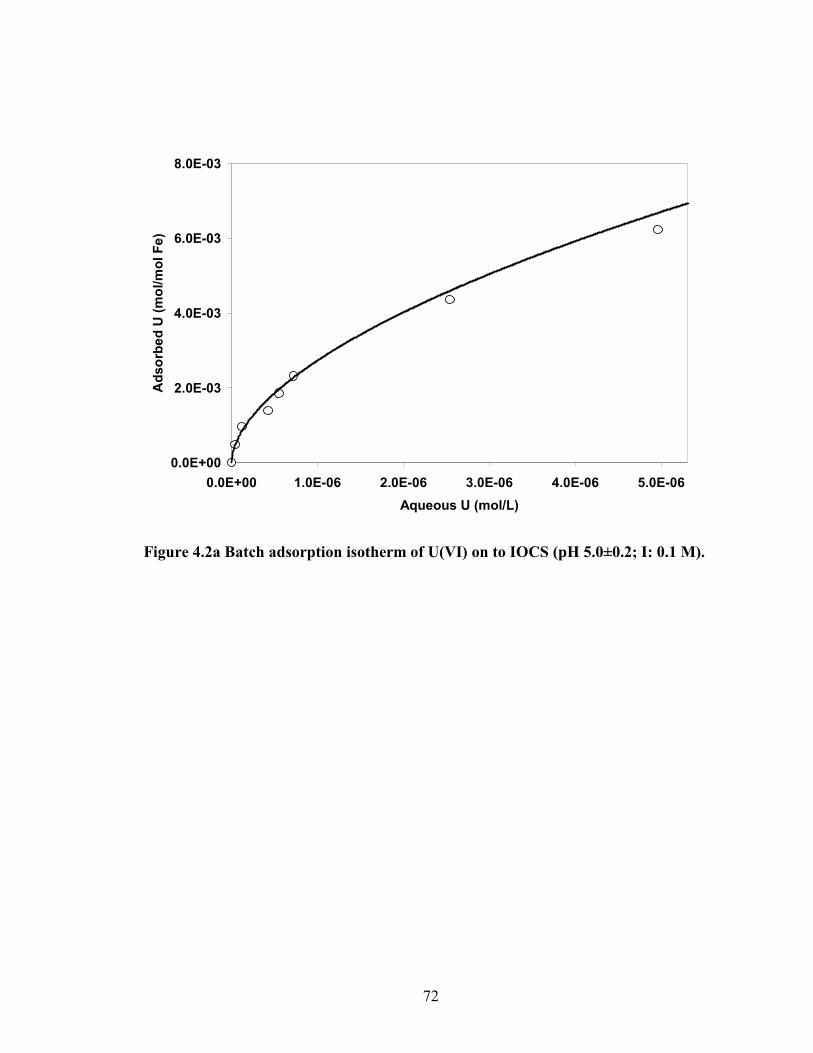
72
0.0E+00
2.0E-03
4.0E-03
6.0E-03
8.0E-03
0.0E+00 1.0E-06 2.0E-06 3.0E-06 4.0E-06 5.0E-06
Aqueous U (mol/L)
Adsorb
ed U
(m
ol/m
ol Fe)
Figure 4.2a Batch adsorption isotherm of U(VI) on to IOCS (pH 5.0±0.2; I: 0.1 M).
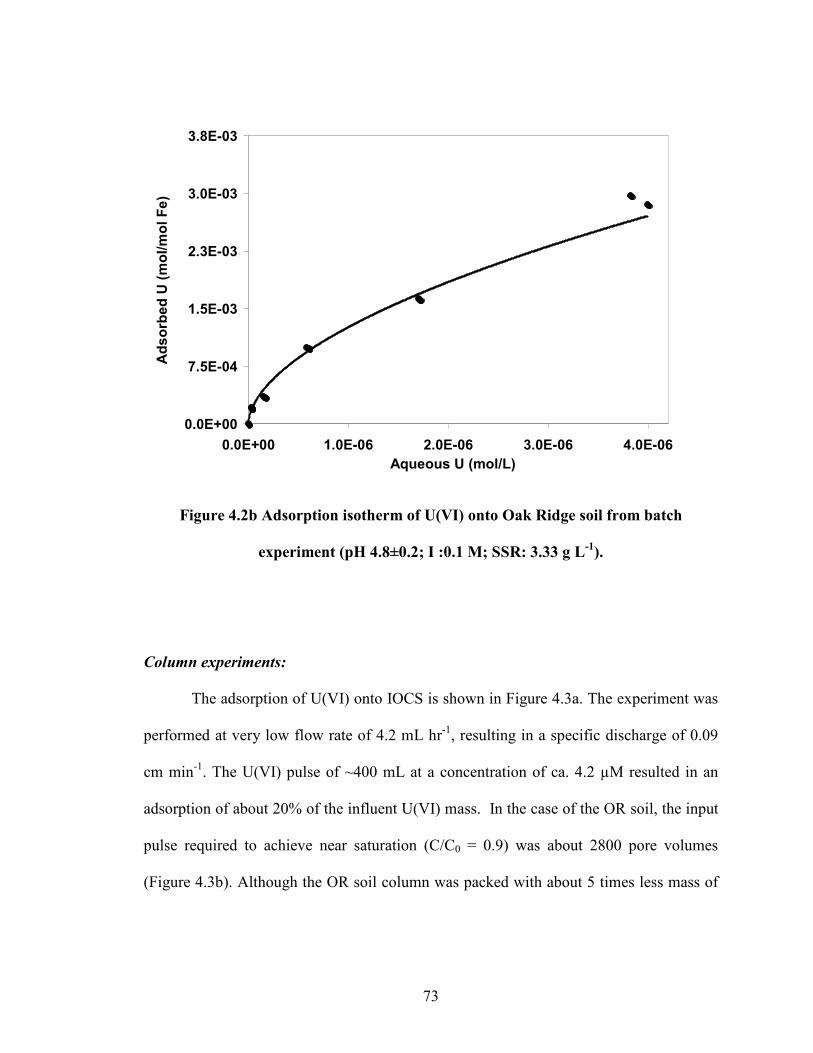
73
0.0E+00
7.5E-04
1.5E-03
2.3E-03
3.0E-03
3.8E-03
0.0E+00 1.0E-06 2.0E-06 3.0E-06 4.0E-06
Aqueous U (mol/L)
Adsorb
ed U
(m
ol/m
ol Fe)
Figure 4.2b Adsorption isotherm of U(VI) onto Oak Ridge soil from batch
experiment (pH 4.8±0.2; I :0.1 M; SSR: 3.33 g L-1
).
Column experiments:
The adsorption of U(VI) onto IOCS is shown in Figure 4.3a. The experiment was
performed at very low flow rate of 4.2 mL hr-1, resulting in a specific discharge of 0.09
cm min-1. The U(VI) pulse of ~400 mL at a concentration of ca. 4.2 µM resulted in an
adsorption of about 20% of the influent U(VI) mass. In the case of the OR soil, the input
pulse required to achieve near saturation (C/C0 = 0.9) was about 2800 pore volumes
(Figure 4.3b). Although the OR soil column was packed with about 5 times less mass of
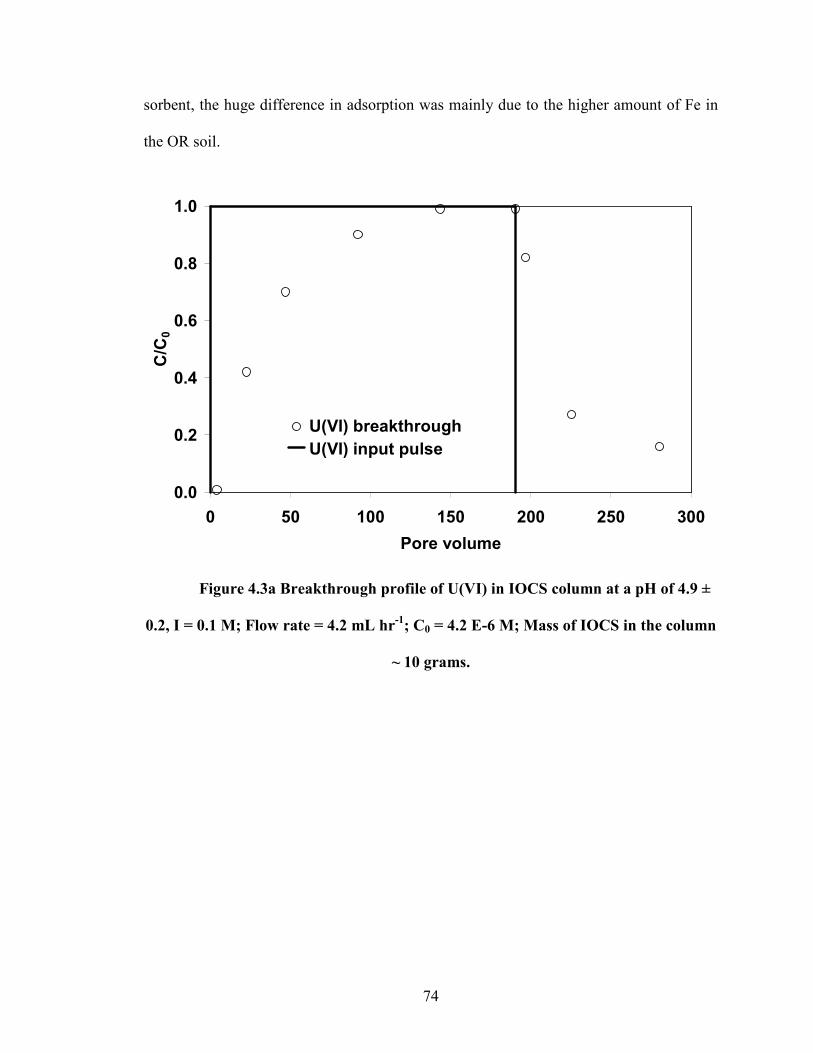
74
sorbent, the huge difference in adsorption was mainly due to the higher amount of Fe in
the OR soil.
0.0
0.2
0.4
0.6
0.8
1.0
0 50 100 150 200 250 300
Pore volume
C/C
0
U(VI) breakthrough
U(VI) input pulse
Figure 4.3a Breakthrough profile of U(VI) in IOCS column at a pH of 4.9 ±
0.2, I = 0.1 M; Flow rate = 4.2 mL hr-1
; C0 = 4.2 E-6 M; Mass of IOCS in the column
~ 10 grams.
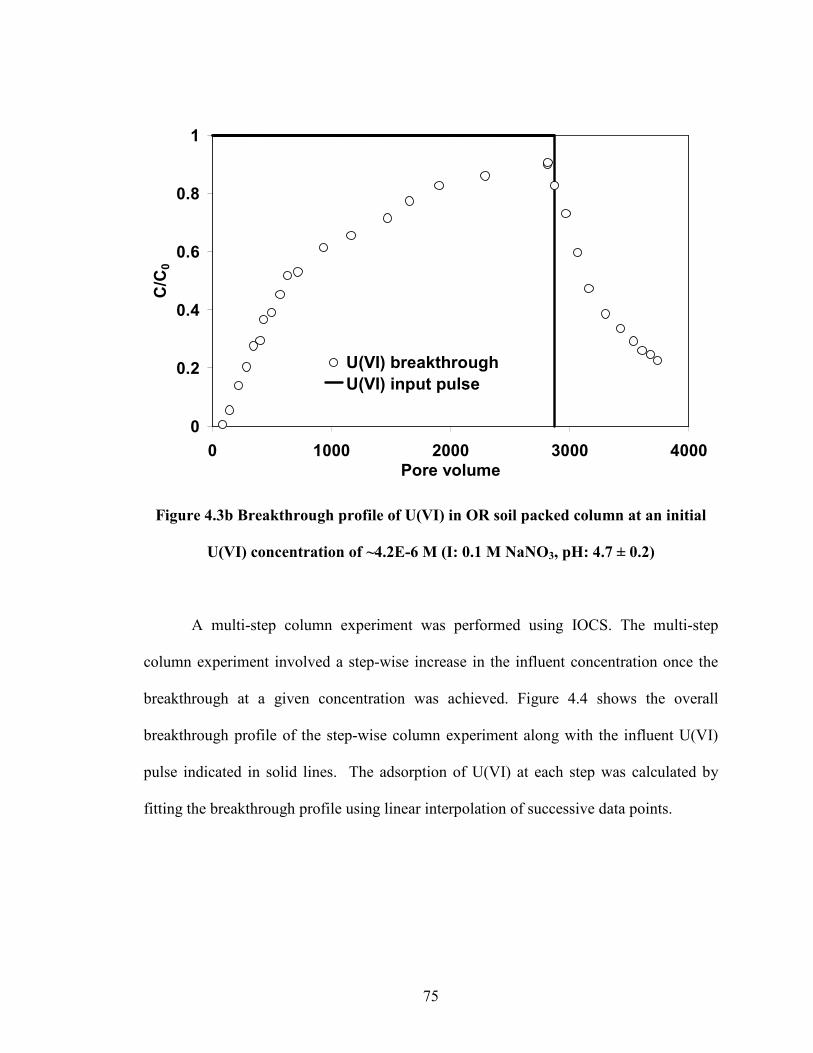
75
0
0.2
0.4
0.6
0.8
1
0 1000 2000 3000 4000
Pore volume
C/C
0
U(VI) breakthrough
U(VI) input pulse
Figure 4.3b Breakthrough profile of U(VI) in OR soil packed column at an initial
U(VI) concentration of ~4.2E-6 M (I: 0.1 M NaNO3, pH: 4.7 ± 0.2)
A multi-step column experiment was performed using IOCS. The multi-step
column experiment involved a step-wise increase in the influent concentration once the
breakthrough at a given concentration was achieved. Figure 4.4 shows the overall
breakthrough profile of the step-wise column experiment along with the influent U(VI)
pulse indicated in solid lines. The adsorption of U(VI) at each step was calculated by
fitting the breakthrough profile using linear interpolation of successive data points.
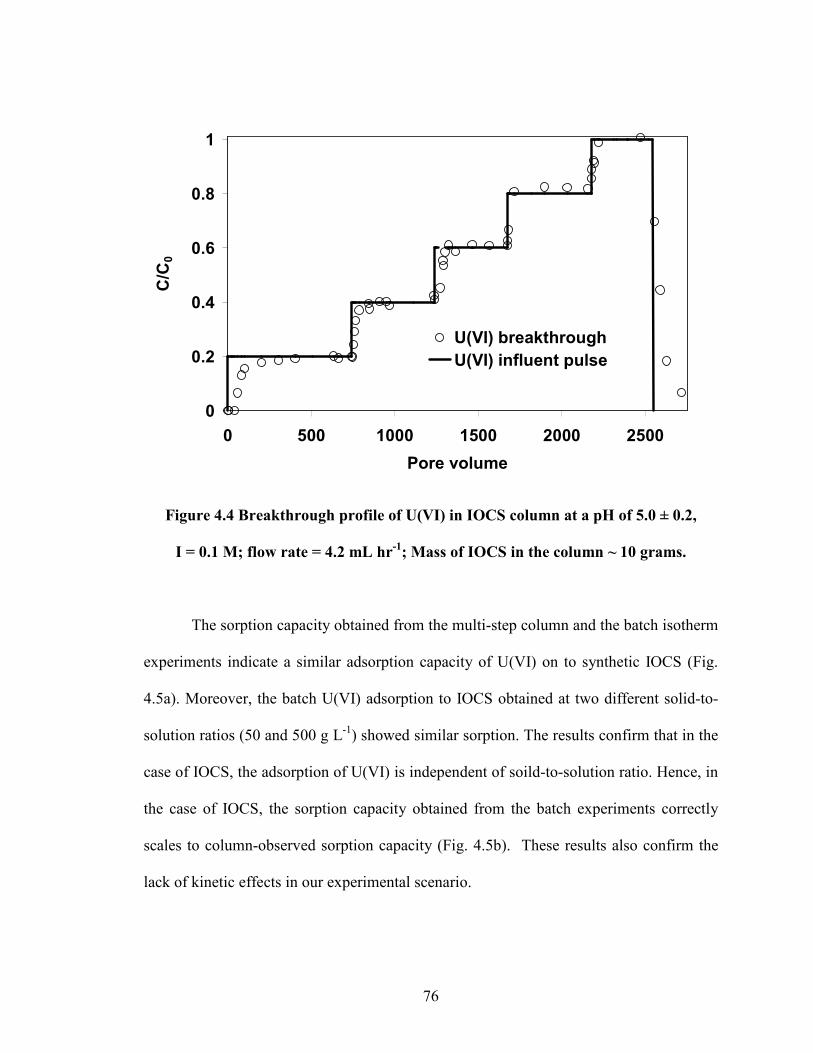
76
0
0.2
0.4
0.6
0.8
1
0 500 1000 1500 2000 2500
Pore volume
C/C
0
U(VI) breakthrough
U(VI) influent pulse
Figure 4.4 Breakthrough profile of U(VI) in IOCS column at a pH of 5.0 ± 0.2,
I = 0.1 M; flow rate = 4.2 mL hr-1
; Mass of IOCS in the column ~ 10 grams.
The sorption capacity obtained from the multi-step column and the batch isotherm
experiments indicate a similar adsorption capacity of U(VI) on to synthetic IOCS (Fig.
4.5a). Moreover, the batch U(VI) adsorption to IOCS obtained at two different solid-to-
solution ratios (50 and 500 g L-1) showed similar sorption. The results confirm that in the
case of IOCS, the adsorption of U(VI) is independent of soild-to-solution ratio. Hence, in
the case of IOCS, the sorption capacity obtained from the batch experiments correctly
scales to column-observed sorption capacity (Fig. 4.5b). These results also confirm the
lack of kinetic effects in our experimental scenario.
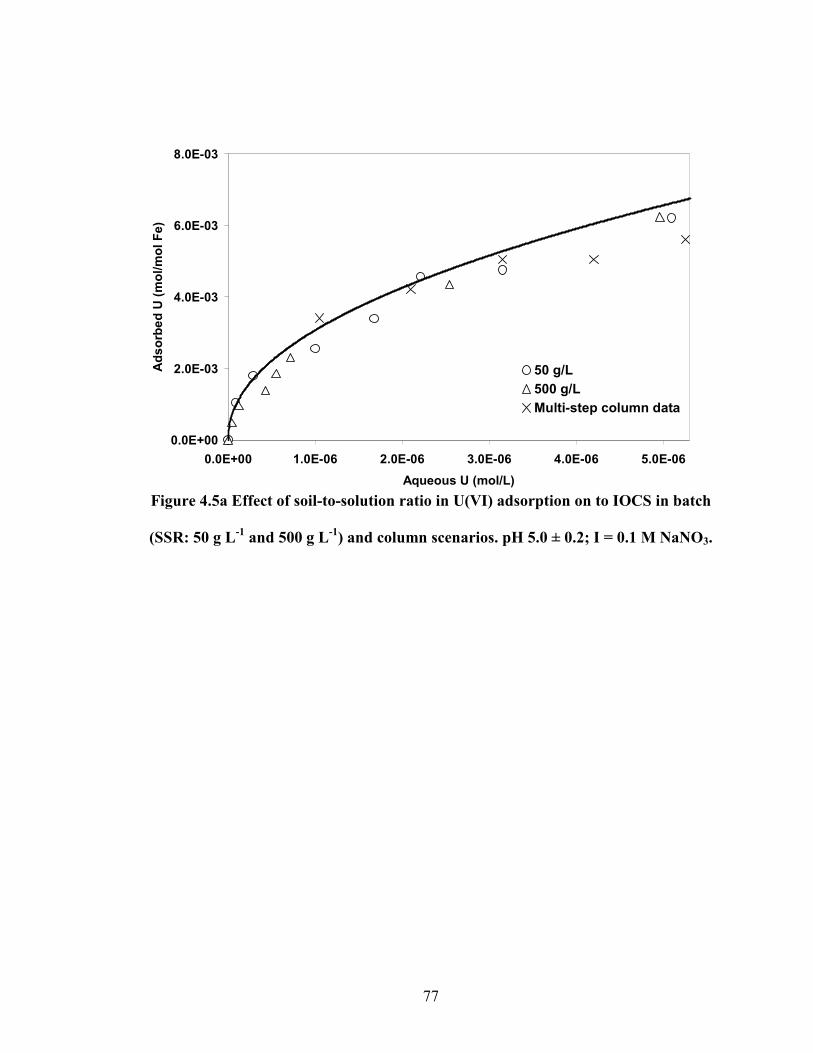
77
0.0E+00
2.0E-03
4.0E-03
6.0E-03
8.0E-03
0.0E+00 1.0E-06 2.0E-06 3.0E-06 4.0E-06 5.0E-06
Aqueous U (mol/L)
Adsorb
ed U
(m
ol/m
ol Fe)
50 g/L
500 g/L
Multi-step column data
Figure 4.5a Effect of soil-to-solution ratio in U(VI) adsorption on to IOCS in batch
(SSR: 50 g L-1
and 500 g L-1
) and column scenarios. pH 5.0 ± 0.2; I = 0.1 M NaNO3.
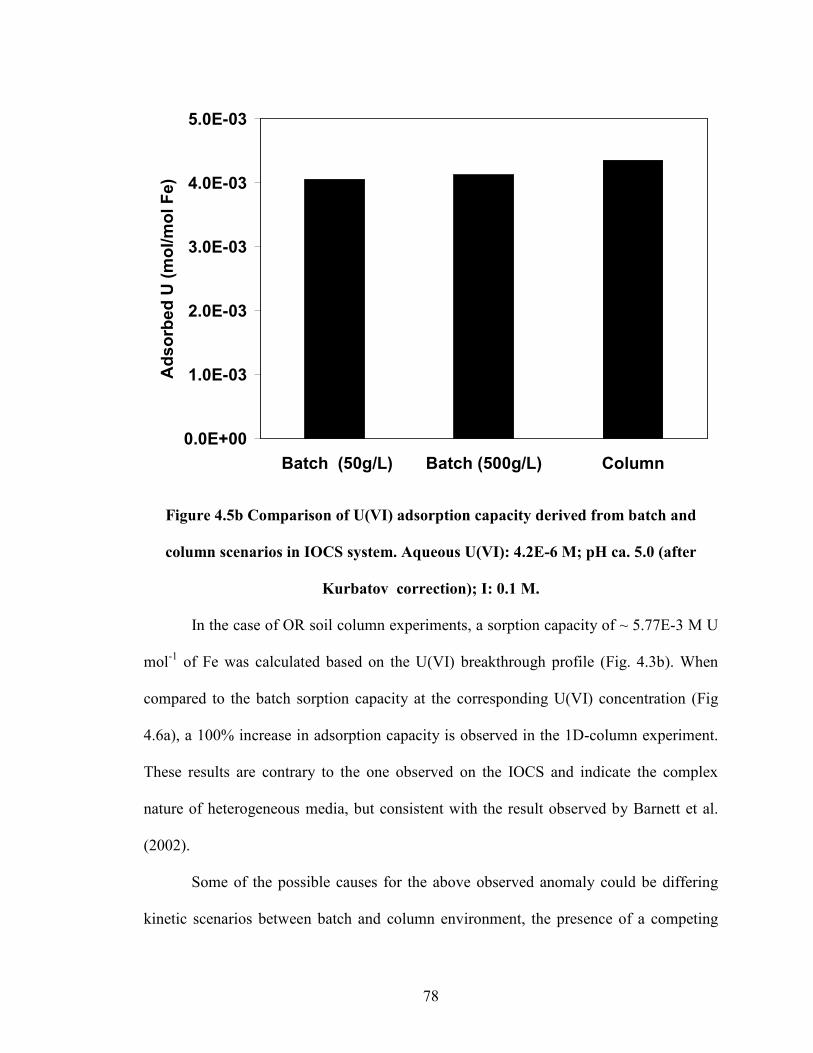
78
0.0E+00
1.0E-03
2.0E-03
3.0E-03
4.0E-03
5.0E-03
Batch (50g/L) Batch (500g/L) Column
Adsorb
ed U
(m
ol/m
ol Fe)
Figure 4.5b Comparison of U(VI) adsorption capacity derived from batch and
column scenarios in IOCS system. Aqueous U(VI): 4.2E-6 M; pH ca. 5.0 (after
Kurbatov correction); I: 0.1 M.
In the case of OR soil column experiments, a sorption capacity of ~ 5.77E-3 M U
mol-1 of Fe was calculated based on the U(VI) breakthrough profile (Fig. 4.3b). When
compared to the batch sorption capacity at the corresponding U(VI) concentration (Fig
4.6a), a 100% increase in adsorption capacity is observed in the 1D-column experiment.
These results are contrary to the one observed on the IOCS and indicate the complex
nature of heterogeneous media, but consistent with the result observed by Barnett et al.
(2002).
Some of the possible causes for the above observed anomaly could be differing
kinetic scenarios between batch and column environment, the presence of a competing
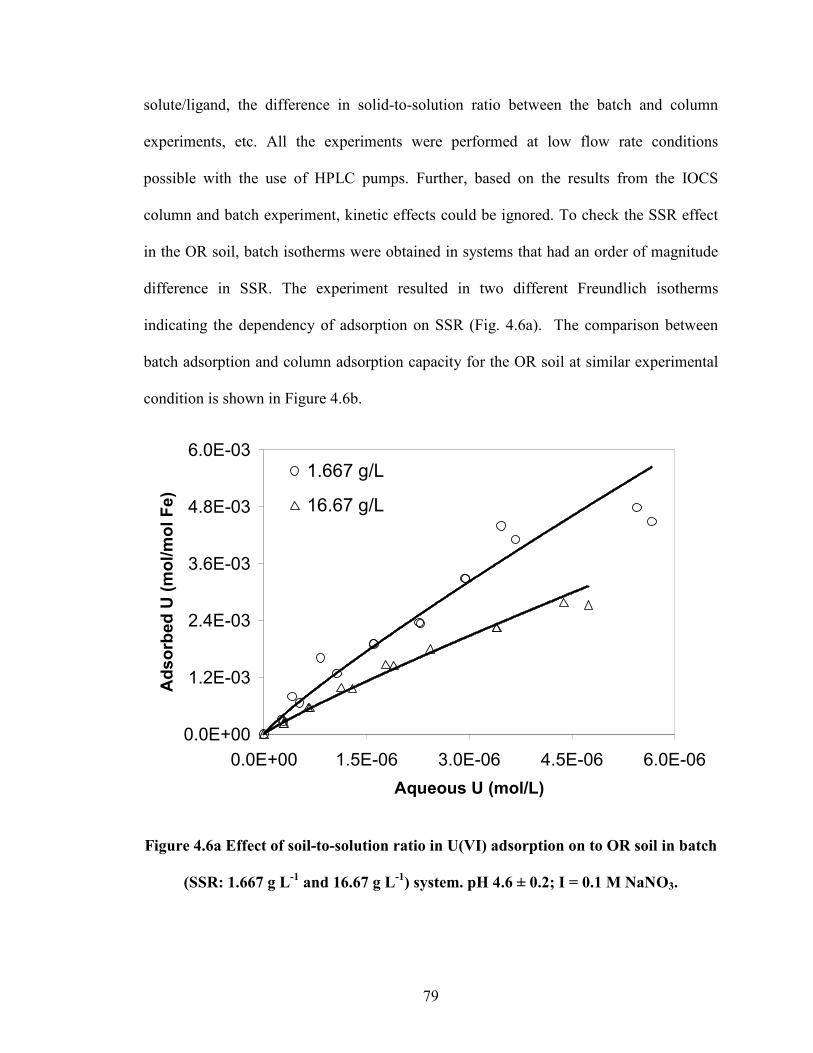
79
solute/ligand, the difference in solid-to-solution ratio between the batch and column
experiments, etc. All the experiments were performed at low flow rate conditions
possible with the use of HPLC pumps. Further, based on the results from the IOCS
column and batch experiment, kinetic effects could be ignored. To check the SSR effect
in the OR soil, batch isotherms were obtained in systems that had an order of magnitude
difference in SSR. The experiment resulted in two different Freundlich isotherms
indicating the dependency of adsorption on SSR (Fig. 4.6a). The comparison between
batch adsorption and column adsorption capacity for the OR soil at similar experimental
condition is shown in Figure 4.6b.
0.0E+00
1.2E-03
2.4E-03
3.6E-03
4.8E-03
6.0E-03
0.0E+00 1.5E-06 3.0E-06 4.5E-06 6.0E-06
Aqueous U (mol/L)
Adsorb
ed U
(m
ol/m
ol Fe)
1.667 g/L
16.67 g/L
Figure 4.6a Effect of soil-to-solution ratio in U(VI) adsorption on to OR soil in batch
(SSR: 1.667 g L-1
and 16.67 g L-1
) system. pH 4.6 ± 0.2; I = 0.1 M NaNO3.
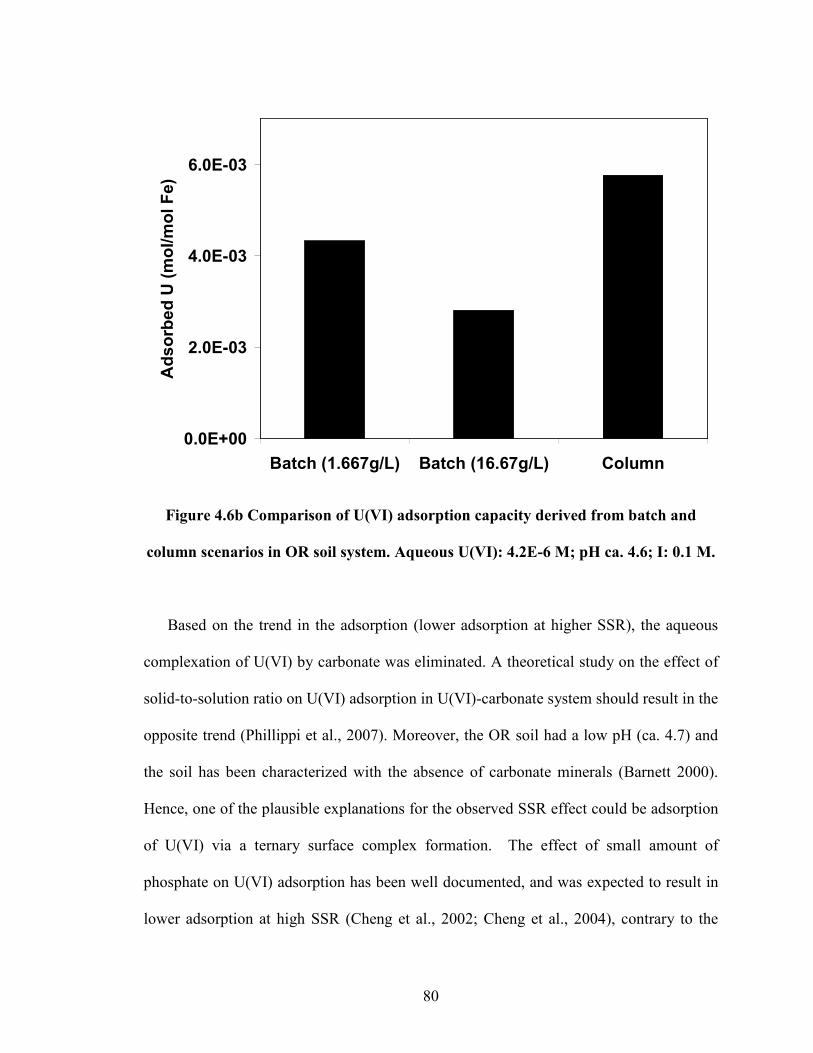
80
0.0E+00
2.0E-03
4.0E-03
6.0E-03
Batch (1.667g/L) Batch (16.67g/L) Column
Adsorb
ed U
(m
ol/m
ol Fe)
Figure 4.6b Comparison of U(VI) adsorption capacity derived from batch and
column scenarios in OR soil system. Aqueous U(VI): 4.2E-6 M; pH ca. 4.6; I: 0.1 M.
Based on the trend in the adsorption (lower adsorption at higher SSR), the aqueous
complexation of U(VI) by carbonate was eliminated. A theoretical study on the effect of
solid-to-solution ratio on U(VI) adsorption in U(VI)-carbonate system should result in the
opposite trend (Phillippi et al., 2007). Moreover, the OR soil had a low pH (ca. 4.7) and
the soil has been characterized with the absence of carbonate minerals (Barnett 2000).
Hence, one of the plausible explanations for the observed SSR effect could be adsorption
of U(VI) via a ternary surface complex formation. The effect of small amount of
phosphate on U(VI) adsorption has been well documented, and was expected to result in
lower adsorption at high SSR (Cheng et al., 2002; Cheng et al., 2004), contrary to the
81
aqueous complexation effect. A Mehlich-1 phosphate extraction from OR soil indicated
the presence of about 2.81E-4 mmol extractable phosphate in OR soil.
4.4 Summary and Conclusion
In this work, the scaling of adsorption capacity in batch and transport modes was
explored in both synthetic adsorbent and natural geomedia. Here we have used a more
homogeneous adsorbent as a control system to decipher the confounding processes that
could influence adsorption in a highly heterogeneous system. In the case of IOCS, the
adsorption capacity observed in the batch experiments was comparable with the
adsorption capacity obtained from the column experiments. But in the case of a natural
geomedia, a marked discrepancy between the batch and column adsorption capacity was
observed. On analysis, the experiments at two differing solid-to-solution ratio resulted in
differing adsorption isotherms in OR soil but not in the IOCS. Based on the trend in the
adsorption of U(VI) with respect to SSR in OR soil, and the evolving body of literature in
this research area, the plausible reason for the observed phenomena could be a solute that
could influence U(VI) adsorption onto Fe oxides via forming a ternary surface complex
(e.g. Phosphate).
4.5 References
Barnett, M.O., P.M. Jardine, S.C. Brooks, and H.M. Selim. 2000. Adsorption and
transport of uranium(VI) in subsurface media. Soil Science Society of America
Journal 64:908-917.
82
Barnett, M.O., P.M. Jardine, and S.C. Brooks. 2002. U(VI) adsorption to heterogeneous
subsurface media: Application of a surface complexation model. Environmental
Science & Technology 36:937-942.
Beck, M.A., L.W. Zelazny, W.L. Daniels, and G.L. Mullins. 2004. Using the Mehlich-1
extract to estimate soil phosphorus saturation for environmental risk assessment.
Soil Science Society of America Journal 68:1762-1771.
Bostick, B. C., S. E. Fendorf, M. O. Barnett, P. M. Jardine and S. C. Brooks. 2002.
Uranyl surface complexes formed on subsurface media from DOE facilities. Soil
Science Society of America Journal 66: 99-108.
Cheng, T., M.O. Barnett, E.E. Roden, and J.L. Zhuang. 2004. Effects of phosphate on
uranium(vi) adsorption to goethite-coated sand. Environmental Science &
Technology 38:6059-6065.
Davis, J.A., D.E. Meece, M. Kohler, and G.P. Curtis. 2004. Approaches to surface
complexation modeling of uranium (VI) adsorption on aquifer sediments.
Geochimica et Cosmochimica Acta 68:3621-3641.
Gabriel, U., J.P. Gaudet, L. Spadini, and L. Charlet. 1998. Reactive transport of uranyl in
a goethite column: An experimental and modelling study. Chemical Geology
151:107-128.
Gee, G. W. Oostrom, M., Freshley, M. D., Rockhold, M. L., Zachara, J. M. 2007.
Hanford site vadose zone studies: An overview. Vadose zone journal. 6: 899-905.
Hsi, C.K.D., and D. Langmuir. 1985. Adsorption of uranyl onto ferric oxyhydroxides -
application of the surface complexation site-binding model. Geochimica et
Cosmochimica Acta 49:1931-1941.
83
Jang, J.H., B.A. Dempsey, and W.D. Burgos. 2007. A model-based evaluation of sorptive
reactivities of hydrous ferric oxide and hematite for U(VI). Environmental
Science & Technology 41:4305-4310.
Kohler, M., Curtis, G. P., Kent, D. B., Davis, J. A. 1996. Experimental investigation and
modeling of uranium(VI) transport under variable chemical conditions. Water
Resour. Res. 32: 3539-3551.
Loganathan VA, Barnett MO, Clement TP, Kanel SR., 2009. Scaling of Adsorption
Reactions: U(VI) Experiments and Modeling. Applied Geochem. 24, 2051-2060.
Payne, T.E., J.A. Davis, and T.D. Waite. 1994. Uranium retention by weathered schists -
the role of iron minerals. Radiochimica Acta 66-7:297-303.
Phillippi, J.M., V.A. Loganathan, M.J. McIndoe, M.O. Barnett, T.P. Clement, and E.E.
Roden. 2007. Theoretical solid/solution ratio effects on adsorption and transport:
Uranium(vi) and carbonate. Soil Science Society of America Journal 71:329-335.
Relyea, J.F., R.J. Serne., D. Rai. 1980. Methods for determining radionuclide retardation
factors: Status report. Pacific Northwest National Laboratory.
Schwertmann,U., and Cornell,R.M., "Iron Oxides in the Laboratory.", pp. 67-92. Wiley-
VCH, Weinheim, 2000.
Um, W., R.J.S., Christopher F. Brown, George V. Last. 2007. U(vi) adsorption on aquifer
sediments at the hanford site. Journal of Contaminant Hydrology 93:255-269.
Waite, T.D., J.A. Davis, T.E. Payne, G.A. Waychunas, and N. Xu. 1994. Uranium(vi)
adsorption to ferrihydrite - Application of a surface complexation model.
Geochimica et Cosmochimica Acta 58:5465-5478.
84
5. An Assessment of U(VI) Removal from Groundwater using Biochar Produced
from Hydrothermal Carbonization
5.1 Introduction
Uranium contamination in groundwater is a serious matter of concern to the U.S.
Department of Energy (DOE) sites where it has been released to the environment or
remains in storage (Davis et al., 2004). Moreover, ground water contamination caused by
radionuclides, in particular uranium, is also a global environmental problem as countries
increasingly move towards cleaner energy sources (Srivastava et al., 2010). Uranium, a
radiotoxic element also possesses risk related to chemical toxicity. Among the various
oxidation states of uranium, IV and VI oxidation states are the most important states in
geological environments (Ervanne, 2003). The chemical toxicity of uranium is
predominantly caused by the highly reactive hexavalent uranyl ions (Vandenhovea et al.,
2006).
In the last few years, biosorption of radionuclides by different raw biomasses such as
cork, rice and tea leaves, straw, coco shaving, coir pith, peat moss, etc. have been
increasingly studied (Parab et al., 2005; Psarevaa et al., 2005). Numerous other materials
such as zeolite (Camacho et al., 2010), hematite (Zeng et al., 2009), diatomite (Aytas et
al., 1999), etc. have also been tested for the same purpose. Activated carbon, a form of
high temperature biochar that has been treated with steam or CO2 to maximize porosity,
are the oldest and most widely used adsorbents (Mellah et al., 2006; Suhas and Carrott,
85
2007). However, this adsorbent is relatively expensive owing to its higher production cost
associated with the activation process (Savovaa et al., 2001b).
Biochar, which is a byproduct of biorefineries, has attracted much attention recently
due to its proven role in environmental management issues. In view of the government
focus on renewable and alternative fuels, the biofuel industry of the US is on a
tremendous growth path. . In fact, Renewable Fuel Standard (RFS) as part of Energy
Independence and Security Act (EISA) of 2007 requires 36 billion gallon per year (BGY)
of biofuels by 2022 (National Biofuels Action Plan, 2008). In this scenario, the
abundantly available lignocellulosic biomasses are being considered as the major biomass
feedstock. Moreover, the billion ton vision report concludes that the land resources of the
US are capable of producing a sustainable supply of biomass (Perlack et al., 2005).
Biomass may be converted to fuels by many different thermochemical processes such
as gasification, pyrolysis, hydrothermal liquefaction/carbonization (Kumar and Gupta,
2009). Biochar, a non-liquefied carbonaceous solid byproduct results from the
thermochemical conversion processes. This carbonaceous material is being extensively
studied for their application as a soil amendment (Laird et al., 2009). Historically, biochar
has been used in soil to enhance plant growth. It also helps in improving soil water
quality by increasing soil retention of nutrients and agrochemicals for plant and crop
utilization. The leaching of nutrients from soil, which is one of the causes of ground
water pollution, is retarded in the presence of biochar (Gaunt and Lehmann, 2008).
The yield of biochar (Table 5.1) mainly depends on the processing condition and
type of biofuels being produced. The properties and composition of biochar change based
86
on the production routes. For example, ash contents are higher in biochar produced from
gasification/pyrolysis routes, whereas hydrothermally produced biochars are richer in
carbonaceous materials. Through HTC, a carbon-rich black solid is obtained from
biomass as an insoluble product in the temperature range of 180-350 ºC (Savovaa et al.,
2001a; Titirici et al., 2007). Furthermore, during the process of biochemical conversion
of biomass for bioethanol production, lignin-rich wet residues are generated which may
be potentially converted to biochar. This is an environmentally friendly process because
of its mere simplicity of using water as the sole reaction medium under pressure and heat,
that leaves no further hazardous chemical waste or by product (Hu et al., 2008). It has
attracted much attention due its versatility to utilize mixed biomass feedstock without any
pretreatment or drying, at a comparatively low temperature (Kumar and Gupta, 2009).
Biochar produced from lignocellulosic biomass has potential to adsorb both
organic pollutants and heavy metals. Studies have been reported on the use of biochar for
removing metal contaminants such as lead, mercury, and arsenic from aqueous solution
(Amuda et al., 2007; Budinova et al., 2006; Kalderis et al., 2008). Biochar derived from
dairy manure was reported to sorb both heavy metals and organics (Cao et al., 2009).
Biochar strongly adsorbs dissolved organic compounds from soil solution and makes
them less bioavailable (Laird et al., 2009; Loganathan et al., 2009). In fact, pyrogenic
organic matters (e.g. biochar, charcoal, soot and activated carbon) have been studied
extensively for their high affinity and capacity for absorbing organic compounds
(Smernik, 2009). As early as 1948, it was reported that the bioavailability of 2,4-
chlorophenoxyacetic acid to sweet potatoes were decreased with the addition of activated
carbon, presumably due to the strong sorption property of this biochar-like material. This
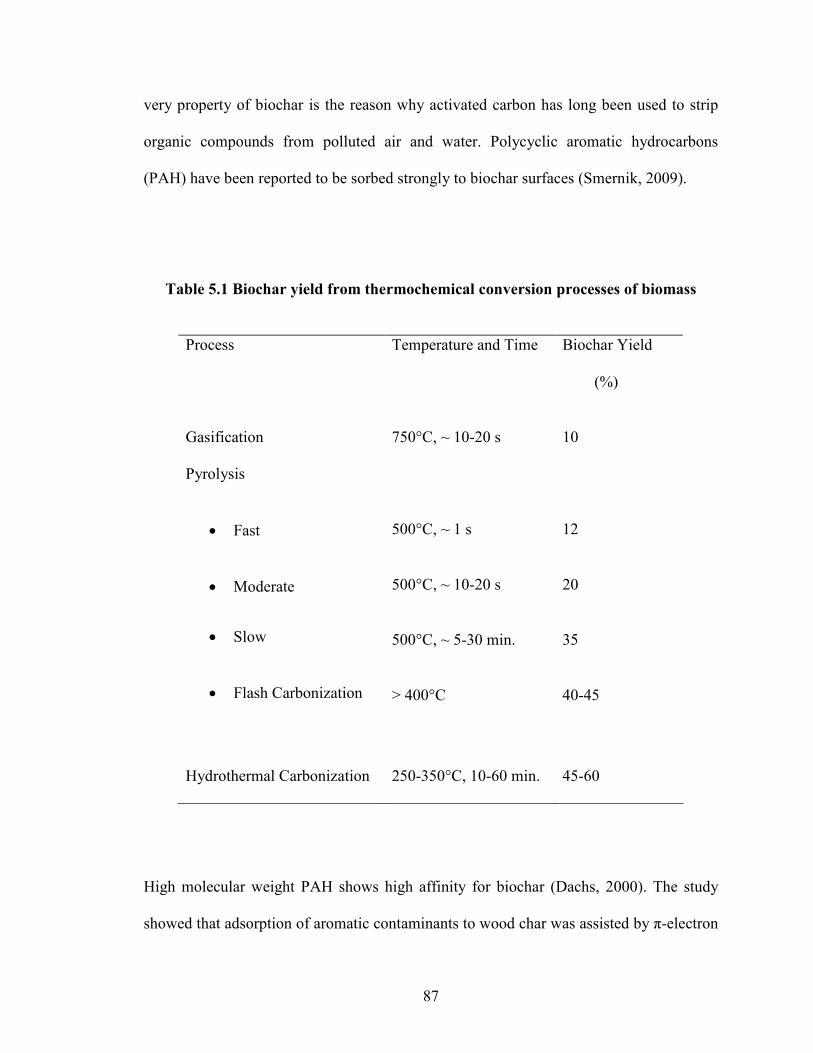
87
very property of biochar is the reason why activated carbon has long been used to strip
organic compounds from polluted air and water. Polycyclic aromatic hydrocarbons
(PAH) have been reported to be sorbed strongly to biochar surfaces (Smernik, 2009).
Table 5.1 Biochar yield from thermochemical conversion processes of biomass
Process Temperature and Time Biochar Yield
(%)
Gasification 750°C, ~ 10-20 s 10
Pyrolysis
• Fast
• Moderate
• Slow
• Flash Carbonization
500°C, ~ 1 s
500°C, ~ 10-20 s
500°C, ~ 5-30 min.
> 400°C
12
20
35
40-45
Hydrothermal Carbonization
250-350°C, 10-60 min.
45-60
High molecular weight PAH shows high affinity for biochar (Dachs, 2000). The study
showed that adsorption of aromatic contaminants to wood char was assisted by π-electron
88
interactions and pore-filling mechanism (Chen and Chen, 2009). Moreover, nonpolar
(naphthalene) and polar (nitrobenzene, m-dinitrobenzene, and 1-naphthol) aromatic
compounds were used to understand the sorption mechanism of biochar produced at
different pyrolytic temperatures (Chen and Chen, 2009; Chen et al., 2008). Biochar is
porous with oxygen functional groups and aromatic surfaces. Because of its high surface-
to-volume ratio and strong affinity to non-polar substances such as PAHs, dioxins, furans
etc. biochar can be a potential sorbent for organic pollutants and pesticides, particularly
planar aromatic compounds (Shrestha et al., 2010; Yu et al., 2009).
Though the scientific literature is replete with the use of biochar as an adsorbent
for environmental pollutants, these studies deal with organic contaminants. Relatively
fewer studies have reported on the use of biochar for removing metal contaminants such
as lead, mercury, and arsenic from aqueous solution (Amuda et al., 2007; Budinova et al.,
2006; Kalderis et al., 2008). Recently, Liu et al. (2010) have characterized the biochar
produced via HTC (at 300ºC) and pyrolysis process (at 700ºC) and compared their
adsorption capacity for copper ions. In this study, we hypothesize that hydrothermally
produced biochar contain oxygen-rich functional groups on the surface and so are
expected to show better affinity towards adsorption of dissolved U(VI). Considering that
U(VI) is one of the major pollutants of concern in many U.S. Department of Energy sites,
and the lack of literature on U(VI)-biochar interaction, a study of this nature is warranted
to provide better alternative remediation technologies.
The major objective of this work was to assess the adsorption of uranium onto
biochar produced from switchgrass, a major energy crop, by HTC. The physical and
chemical characteristics of biochar were examined by X-ray diffraction (XRD), elemental
89
analysis, Fourier transform infra-red spectroscopy (FTIR), and scanning electron
microscopy (SEM) techniques. Our objective was to investigate the use of this
environmentally friendly and benign sorbent for treating uranium contaminated
groundwater. Batch adsorption studies were designed to assess the sorption potential of
biochar for U(VI). The study examines the adsorption kinetics and equilibrium, and the
effect of solid (biochar) loading and pH on U(VI) adsorption. In addition, the feasibility
of biochar as a permeable reactive barrier medium was investigated using column
experiments.
5.2 Experimental Section
Conversion of switchgrass (chopped to 5-10 mm length) to biochar was conducted in
a high-pressure batch reactor in the presence of de-ionized water. The apparatus consisted
of a 500 mL high-temperature, high- pressure metal reactor equipped with proportional-
integral-differential controllers. Biomass and water (7:1) were charged into the reaction
vessel and the reactor temperature was raised to 300° C with a heating rate of 7° C min-1.
After maintaining the temperature at 300° C for 30 minutes under autogeneous pressure
conditions, the reactor was rapidly cooled to ambient conditions using water through a
cooling coil. The product biochar was separated from the liquid after the reaction and
further washed with deionized water. The resulting biochar was air dried and used for
further characterization.
5.3 Product Characterization
Elemental analysis:
90
Both switch grass and biochar samples were dried in a forced-air oven at 60ºC.
About 0.1-0.2 grams of each sample was weighed into tin foil cups and combusted with
an oxygen catalyst at 1150º C. The total carbon was measured by the thermal
conductivity method (Kirsten, 1979) using an Elementar Vario Macro CNS analyzer. For
quantifying macro and micronutrients and metals, approximately 1.0 gram of dried
sample was weighed into ceramic crucibles. The samples were then ashed for 8 hours in a
muffle furnace at 500º C. This was followed by digestion on a hot plate using 1 N HNO3
and 1 N HCl. Finally, the digested samples were filtered into 50 mL volumetric flasks
and brought to volume with deionized water. All samples were analyzed using a Varian
Vista-MPX Axial Spectrometer (Issac and Johnson, 1985). Analysis was set for 2
exposures (repetitions) per sample and the average results were reported.
SEM analysis:
The samples were held onto adhesive carbon tape on an aluminum stub followed
by sputter coating with gold. Surface morphology of the sample was studied using an
environmental scanning electron microscopy system (Zeiss EVO 50).
XRD analysis:
Rigaku Miniflex powder X-ray diffractometer equipped with a Cu Kα1 radiation
source at 30 kV voltages, 15 mA current and a miniflex goniometer was used for the
XRD analysis. Diffraction patterns were collected in the 2θ range of 12-35° at a scan
speed of 1° min-1 and step size of 0.05°.
FTIR analysis:
Infrared spectra (4000-400 cm-1) were recorded using a Nicolet IR100 FTIR
spectrometer that was equipped with a TGS/PE detector and a silicon beam splitter with 1
91
cm-1 resolution. The sample discs were prepared by mixing oven-dried (at 105°C)
samples with spectroscopy-grade KBr in an agate mortar.
BET surface area measurement:
The method of Brunauer, Emmett, and Teller (BET) is commonly used to
determine the total surface area of materials. The BET analysis was carried out using
NOVA 2200e surface area and pore size analyzer (Quantachrome Instruments). Raw
switchgrass and biochar samples were analyzed for multipoint BET surface area using
nitrogen as the adsorbing gas at 77 K. The analysis involved outgassing the switch grass
samples at 105°C for 3 hours and biochar samples at 75°C for 22 hours. In the case of
biochar, the pore volume and pore radius was measured along with surface area. Selected
samples were analyzed in duplicate and the results agreed within 5%.
5.4 Adsorption Studies
Batch adsorption kinetic experiments:
Batch kinetic experiments were performed at two different solid-to-solution ratios
(SSR: 4 and 5 g L-1) and initial U(VI) concentrations (ca. 30 and 10 mg L-1) to estimate
the equilibrium time for the adsorption reaction. The experiments were performed at the
natural pH of biochar (ca. pH 3.9 ± 0.2) in 0.1 M NaNO3. The experiments were carried
out for 72 hours and samples were taken at regular intervals by sacrificing the tubes.
U(VI) was measured using a kinetic phosphorescence analyzer (KPA, Chemchek
Instruments, Inc.) after filtration of the samples through 0.45 µm polytetrafluoroethylene
filter units and acidifying the samples to pH 1.0. The difference between the initial U(VI)
concentration and aqueous U(VI) concentration was attributed to the adsorption of U(VI)
92
onto biochar. Both the experiments had duplicate test tubes for each sampling interval,
blanks [no U(VI)], and controls (no biochar).
Batch adsorption equilibrium experiment:
A batch isotherm experiment was performed at a solid loading of 5 g L-1 and at a
pH of 3.9 ± 0.2. The initial concentration of U(VI) was varied between 5 to 30 mg L-1
and the experiment was conducted in a 0.1 M NaNO3 background solution. Moreover, to
study the effect of solid-to-solution ratio on adsorption, biochar was loaded at 1 g L-1
containing an initial U(VI) concentration of 10 mg L-1. The test tubes were prepared in
duplicates and tumbled for about 34 hours at 25°C, as 34 hours was found to be sufficient
to attain equilibrium from the kinetic experiments. At the end of the equilibrium time,
aqueous samples were filtered and acidified and analyzed as described above. Similar to
the kinetic experiments, the difference between the initial U(VI) concentration and
aqueous U(VI) concentration was attributed to the adsorption of U(VI) onto biochar.
Further, the pH-dependent adsorption of U(VI) on to biochar was also studied by varying
the pH (3-8).
Permeable reactive barrier (PRB) experiment:
Approximately 0.25 g of biochar was packed into a 1.0 cm × 10 cm glass column
as an interlayer of about 0.8 cm depth between two quartz zones of 0.6 cm and 5.4 cm.
The column was initially flushed with the background solution, 0.1 M NaNO3, adjusted
to pH 3.9 ± 0.2 at a flow rate of 4.1 mL hour-1. After a few pore volumes of NaNO3
flushing, U(VI), prepared in 0.1 M NaNO3, and adjusted to pH 3.9 ± 0.2, at an initial
concentration of ca. 3 mg L-1 was flushed through the column. Samples were collected at
regular intervals and the pH was checked frequently. A stable pH of about 3.9 ± 0.2 was
93
maintained in the effluent solution throughout the course of the experiment. At the end of
the biochar site saturation, which was estimated based on the batch experiment results,
the influent solution was changed back to U(VI)-free NaNO3. A control for the permeable
reactive barrier column was simultaneously run wherein the entire column was packed
with pure white quartz with a particle size ranging between 0.210 and 0.297 mm, which
was pre-washed with 0.1 M nitric acid. The experimental protocol for the control column
was similar to the PRB column except for it was fully packed (6.8 cm) with pure quartz.
In the case of the control column, a stable pH of 3.9 ± 0.2 was also maintained in the
effluent solution throughout the course of the experiment. The residence time for the
control column was calculated to be ca. 76.4 min whereas, in the case of PRB column,
the residence for the PRB zone (0.8 cm) was ca. 8.99 min. At the end of the experiments
selected samples were acidified and analyzed for U(VI) in KPA.
5.5 Results and Discussion
The oxygen content in raw switchgrass is typically 40-43 wt% (Berg and Visser,
2001), which was reduced to about 22-23 wt% in biochar. The elemental carbon in
biochar was increased to 70.5 wt% compared to switchgrass that had 44.6 wt% (Table
5.2). Though the ash content did not change significantly, some of the inorganic
compounds (e.g. K, Mg, P, and Na) decreased due to their solubilization in subcritical
water. As result of carbonization process in subcritical water, more than 70 wt% of
oxygen present in switchgrass could be removed and the product biochar became richer
in carbon content. The formation of the carbon-rich solid through the carbonization of
biomass in water medium is the consequence of dehydration, condensation,
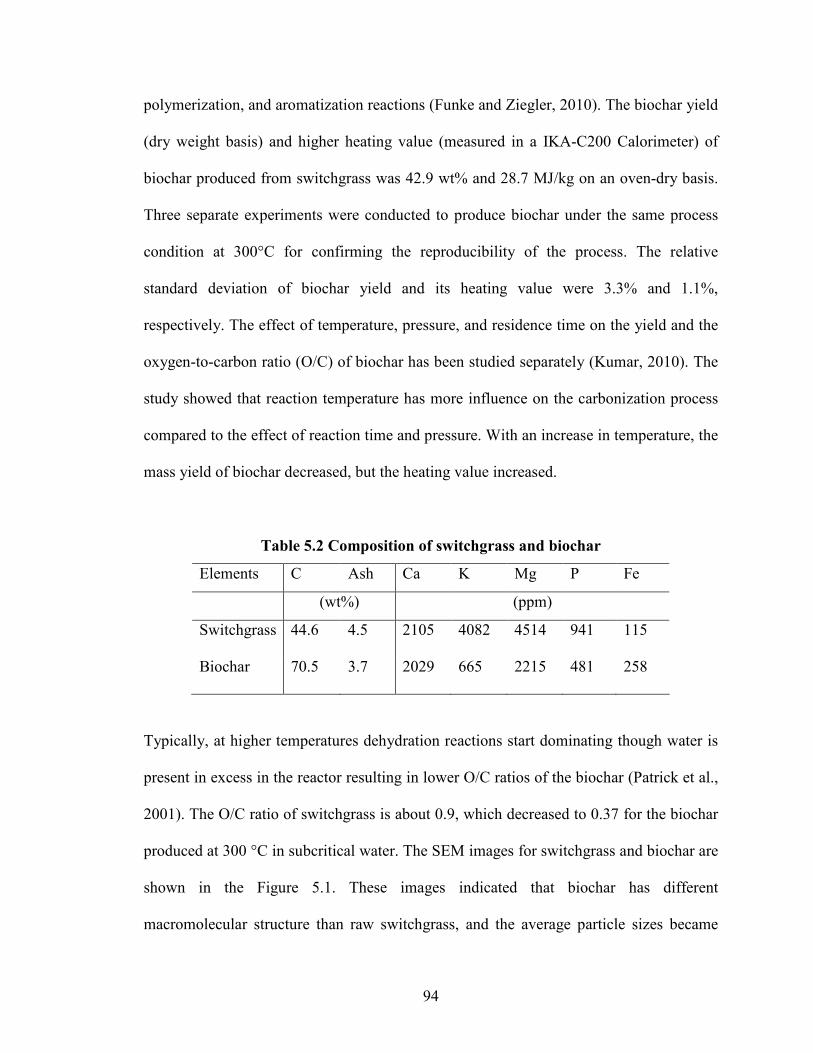
94
polymerization, and aromatization reactions (Funke and Ziegler, 2010). The biochar yield
(dry weight basis) and higher heating value (measured in a IKA-C200 Calorimeter) of
biochar produced from switchgrass was 42.9 wt% and 28.7 MJ/kg on an oven-dry basis.
Three separate experiments were conducted to produce biochar under the same process
condition at 300°C for confirming the reproducibility of the process. The relative
standard deviation of biochar yield and its heating value were 3.3% and 1.1%,
respectively. The effect of temperature, pressure, and residence time on the yield and the
oxygen-to-carbon ratio (O/C) of biochar has been studied separately (Kumar, 2010). The
study showed that reaction temperature has more influence on the carbonization process
compared to the effect of reaction time and pressure. With an increase in temperature, the
mass yield of biochar decreased, but the heating value increased.
Table 5.2 Composition of switchgrass and biochar
Elements C Ash Ca K Mg P Fe
(wt%) (ppm)
Switchgrass 44.6 4.5 2105 4082 4514 941 115
Biochar 70.5 3.7 2029 665 2215 481 258
Typically, at higher temperatures dehydration reactions start dominating though water is
present in excess in the reactor resulting in lower O/C ratios of the biochar (Patrick et al.,
2001). The O/C ratio of switchgrass is about 0.9, which decreased to 0.37 for the biochar
produced at 300 °C in subcritical water. The SEM images for switchgrass and biochar are
shown in the Figure 5.1. These images indicated that biochar has different
macromolecular structure than raw switchgrass, and the average particle sizes became
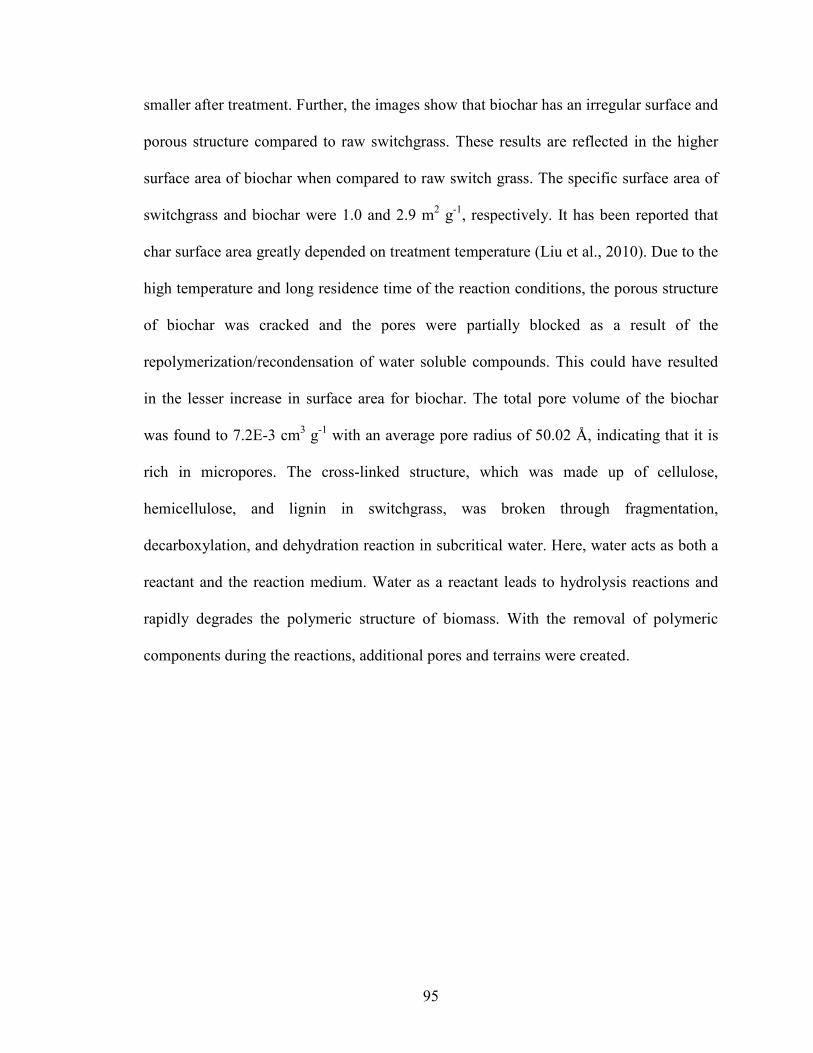
95
smaller after treatment. Further, the images show that biochar has an irregular surface and
porous structure compared to raw switchgrass. These results are reflected in the higher
surface area of biochar when compared to raw switch grass. The specific surface area of
switchgrass and biochar were 1.0 and 2.9 m2 g-1, respectively. It has been reported that
char surface area greatly depended on treatment temperature (Liu et al., 2010). Due to the
high temperature and long residence time of the reaction conditions, the porous structure
of biochar was cracked and the pores were partially blocked as a result of the
repolymerization/recondensation of water soluble compounds. This could have resulted
in the lesser increase in surface area for biochar. The total pore volume of the biochar
was found to 7.2E-3 cm3 g-1 with an average pore radius of 50.02 Å, indicating that it is
rich in micropores. The cross-linked structure, which was made up of cellulose,
hemicellulose, and lignin in switchgrass, was broken through fragmentation,
decarboxylation, and dehydration reaction in subcritical water. Here, water acts as both a
reactant and the reaction medium. Water as a reactant leads to hydrolysis reactions and
rapidly degrades the polymeric structure of biomass. With the removal of polymeric
components during the reactions, additional pores and terrains were created.
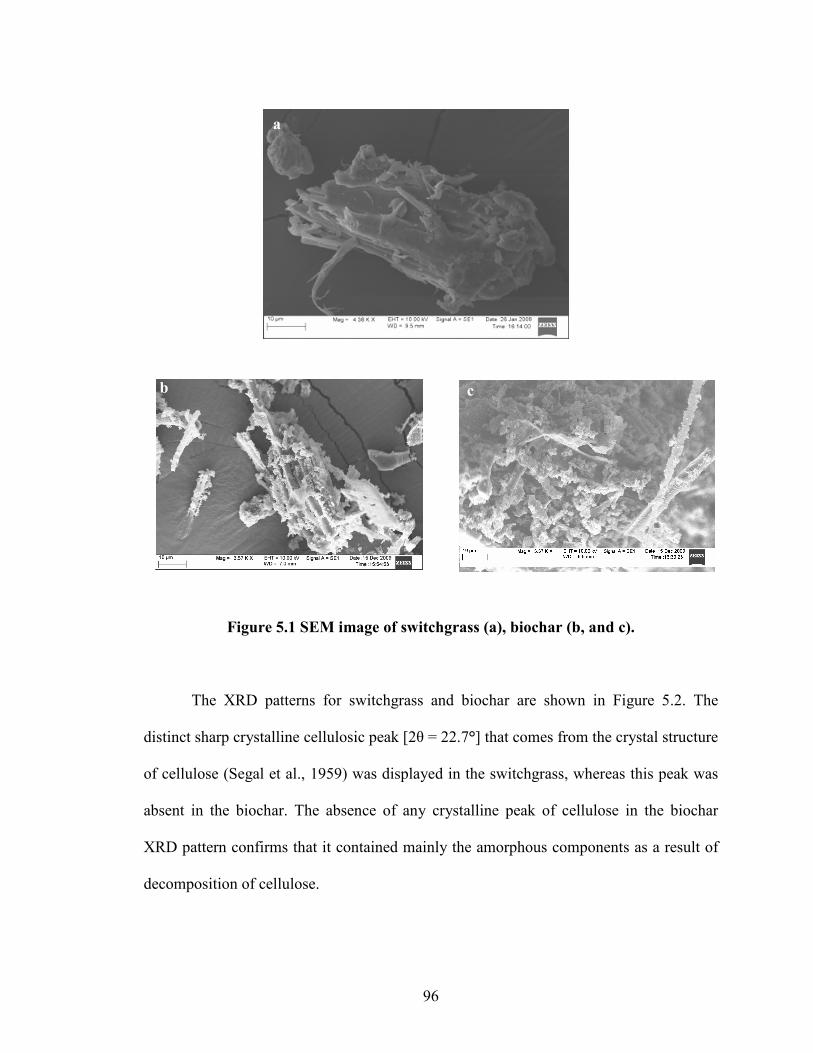
96
Figure 5.1 SEM image of switchgrass (a), biochar (b, and c).
The XRD patterns for switchgrass and biochar are shown in Figure 5.2. The
distinct sharp crystalline cellulosic peak [2θ = 22.7°] that comes from the crystal structure
of cellulose (Segal et al., 1959) was displayed in the switchgrass, whereas this peak was
absent in the biochar. The absence of any crystalline peak of cellulose in the biochar
XRD pattern confirms that it contained mainly the amorphous components as a result of
decomposition of cellulose.
a
c
b c
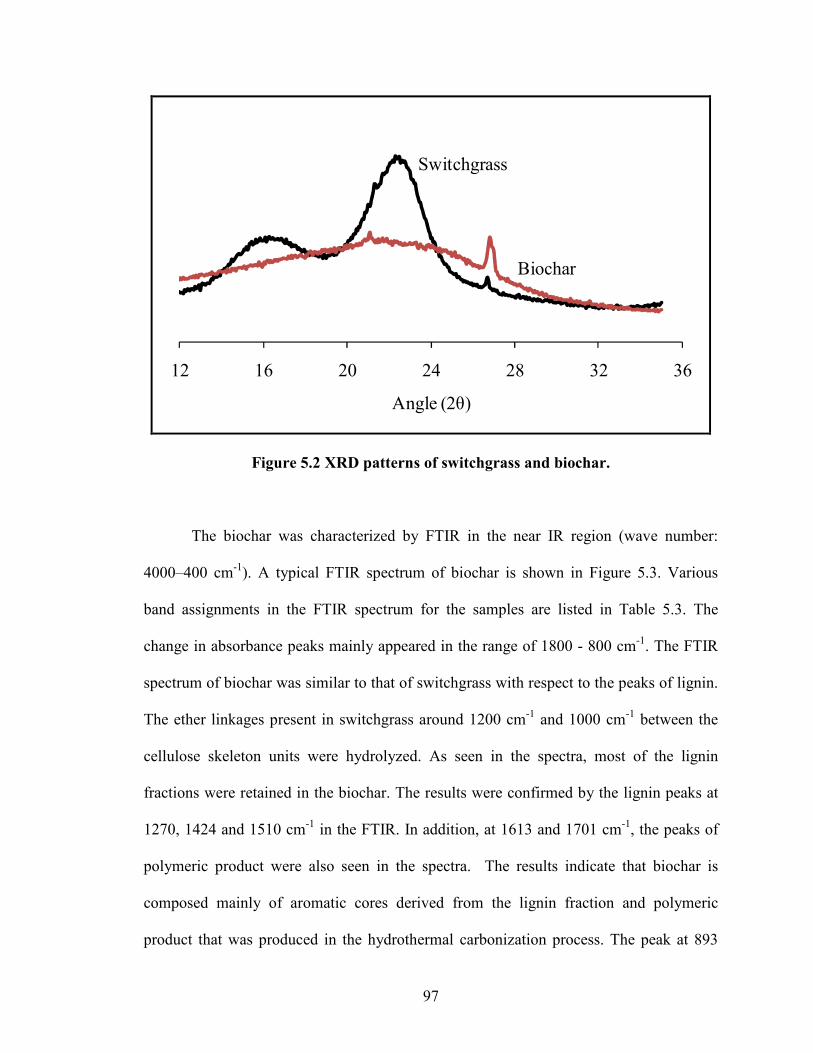
97
12 16 20 24 28 32 36
Angle (2θ)
Biochar
Switchgrass
Figure 5.2 XRD patterns of switchgrass and biochar.
The biochar was characterized by FTIR in the near IR region (wave number:
4000–400 cm-1). A typical FTIR spectrum of biochar is shown in Figure 5.3. Various
band assignments in the FTIR spectrum for the samples are listed in Table 5.3. The
change in absorbance peaks mainly appeared in the range of 1800 - 800 cm-1. The FTIR
spectrum of biochar was similar to that of switchgrass with respect to the peaks of lignin.
The ether linkages present in switchgrass around 1200 cm-1 and 1000 cm-1 between the
cellulose skeleton units were hydrolyzed. As seen in the spectra, most of the lignin
fractions were retained in the biochar. The results were confirmed by the lignin peaks at
1270, 1424 and 1510 cm-1 in the FTIR. In addition, at 1613 and 1701 cm-1, the peaks of
polymeric product were also seen in the spectra. The results indicate that biochar is
composed mainly of aromatic cores derived from the lignin fraction and polymeric
product that was produced in the hydrothermal carbonization process. The peak at 893
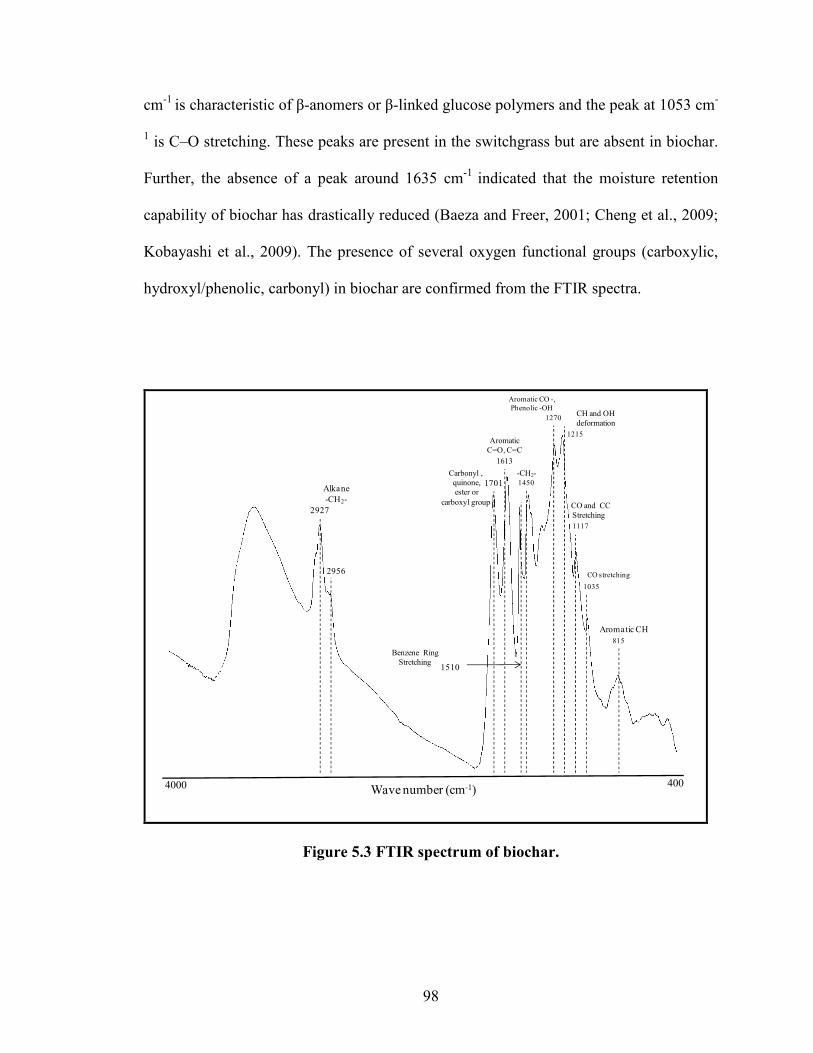
98
cm-1 is characteristic of β-anomers or β-linked glucose polymers and the peak at 1053 cm-
1 is C–O stretching. These peaks are present in the switchgrass but are absent in biochar.
Further, the absence of a peak around 1635 cm-1 indicated that the moisture retention
capability of biochar has drastically reduced (Baeza and Freer, 2001; Cheng et al., 2009;
Kobayashi et al., 2009). The presence of several oxygen functional groups (carboxylic,
hydroxyl/phenolic, carbonyl) in biochar are confirmed from the FTIR spectra.
Alkane-CH2-
2927
2956
1701
1613
AromaticC=O, C=C
1510
Benzene Ring Stretching
1450
1270
Aromatic CO -, Phenolic -OH
1215
1117
1035
815
Aromatic CH
Carbonyl , quinone,ester or
carboxyl group
-CH2-
CH and OH deformation
CO and CCStretching
CO stretching
Wave number (cm-1)4000 400
Figure 5.3 FTIR spectrum of biochar.
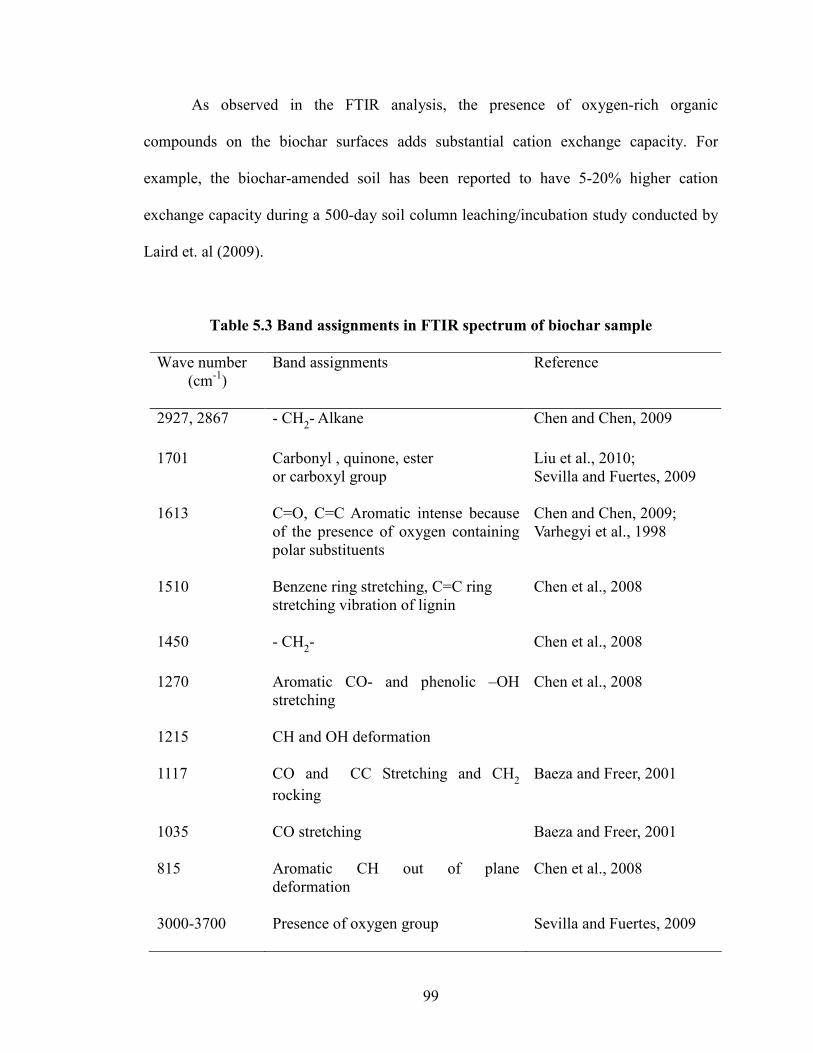
99
As observed in the FTIR analysis, the presence of oxygen-rich organic
compounds on the biochar surfaces adds substantial cation exchange capacity. For
example, the biochar-amended soil has been reported to have 5-20% higher cation
exchange capacity during a 500-day soil column leaching/incubation study conducted by
Laird et. al (2009).
Table 5.3 Band assignments in FTIR spectrum of biochar sample
Wave number (cm-1)
Band assignments Reference
2927, 2867 - CH2- Alkane Chen and Chen, 2009
1701 Carbonyl , quinone, ester or carboxyl group
Liu et al., 2010; Sevilla and Fuertes, 2009
1613 C=O, C=C Aromatic intense because of the presence of oxygen containing polar substituents
Chen and Chen, 2009; Varhegyi et al., 1998
1510 Benzene ring stretching, C=C ring stretching vibration of lignin
Chen et al., 2008
1450 - CH2- Chen et al., 2008
1270 Aromatic CO- and phenolic –OH stretching
Chen et al., 2008
1215 CH and OH deformation
1117 CO and CC Stretching and CH2
rocking
Baeza and Freer, 2001
1035 CO stretching Baeza and Freer, 2001
815 Aromatic CH out of plane deformation
Chen et al., 2008
3000-3700 Presence of oxygen group Sevilla and Fuertes, 2009
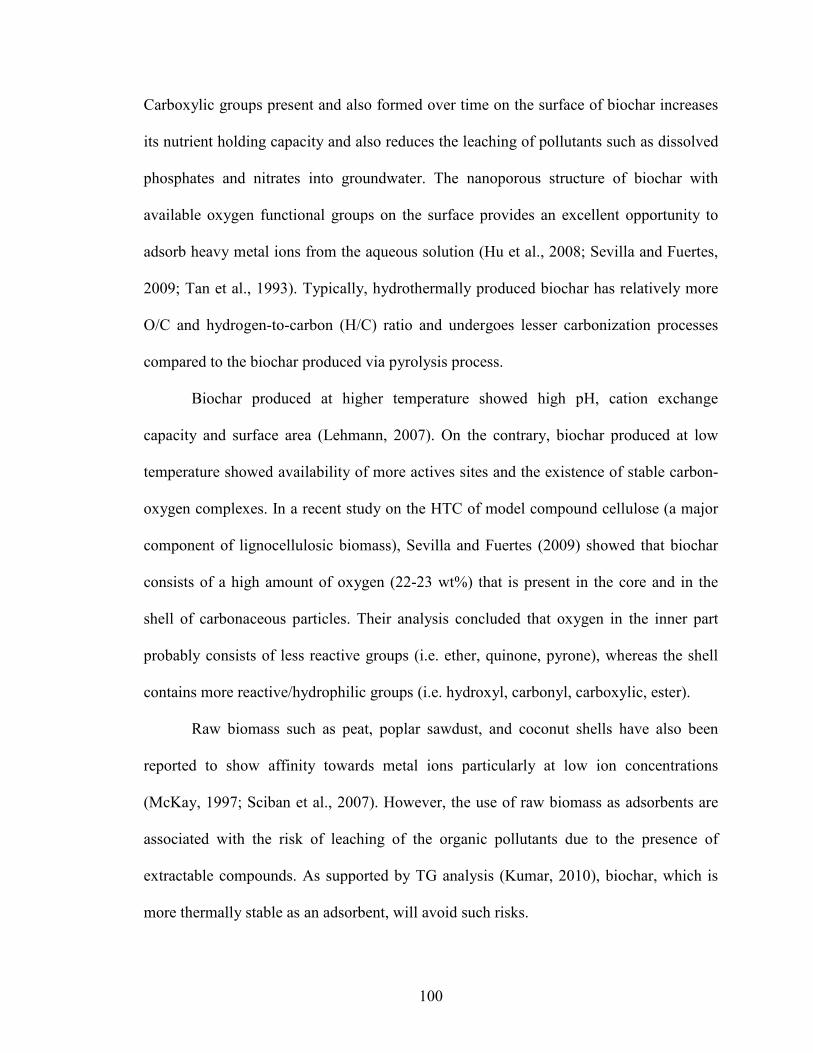
100
Carboxylic groups present and also formed over time on the surface of biochar increases
its nutrient holding capacity and also reduces the leaching of pollutants such as dissolved
phosphates and nitrates into groundwater. The nanoporous structure of biochar with
available oxygen functional groups on the surface provides an excellent opportunity to
adsorb heavy metal ions from the aqueous solution (Hu et al., 2008; Sevilla and Fuertes,
2009; Tan et al., 1993). Typically, hydrothermally produced biochar has relatively more
O/C and hydrogen-to-carbon (H/C) ratio and undergoes lesser carbonization processes
compared to the biochar produced via pyrolysis process.
Biochar produced at higher temperature showed high pH, cation exchange
capacity and surface area (Lehmann, 2007). On the contrary, biochar produced at low
temperature showed availability of more actives sites and the existence of stable carbon-
oxygen complexes. In a recent study on the HTC of model compound cellulose (a major
component of lignocellulosic biomass), Sevilla and Fuertes (2009) showed that biochar
consists of a high amount of oxygen (22-23 wt%) that is present in the core and in the
shell of carbonaceous particles. Their analysis concluded that oxygen in the inner part
probably consists of less reactive groups (i.e. ether, quinone, pyrone), whereas the shell
contains more reactive/hydrophilic groups (i.e. hydroxyl, carbonyl, carboxylic, ester).
Raw biomass such as peat, poplar sawdust, and coconut shells have also been
reported to show affinity towards metal ions particularly at low ion concentrations
(McKay, 1997; Sciban et al., 2007). However, the use of raw biomass as adsorbents are
associated with the risk of leaching of the organic pollutants due to the presence of
extractable compounds. As supported by TG analysis (Kumar, 2010), biochar, which is
more thermally stable as an adsorbent, will avoid such risks.
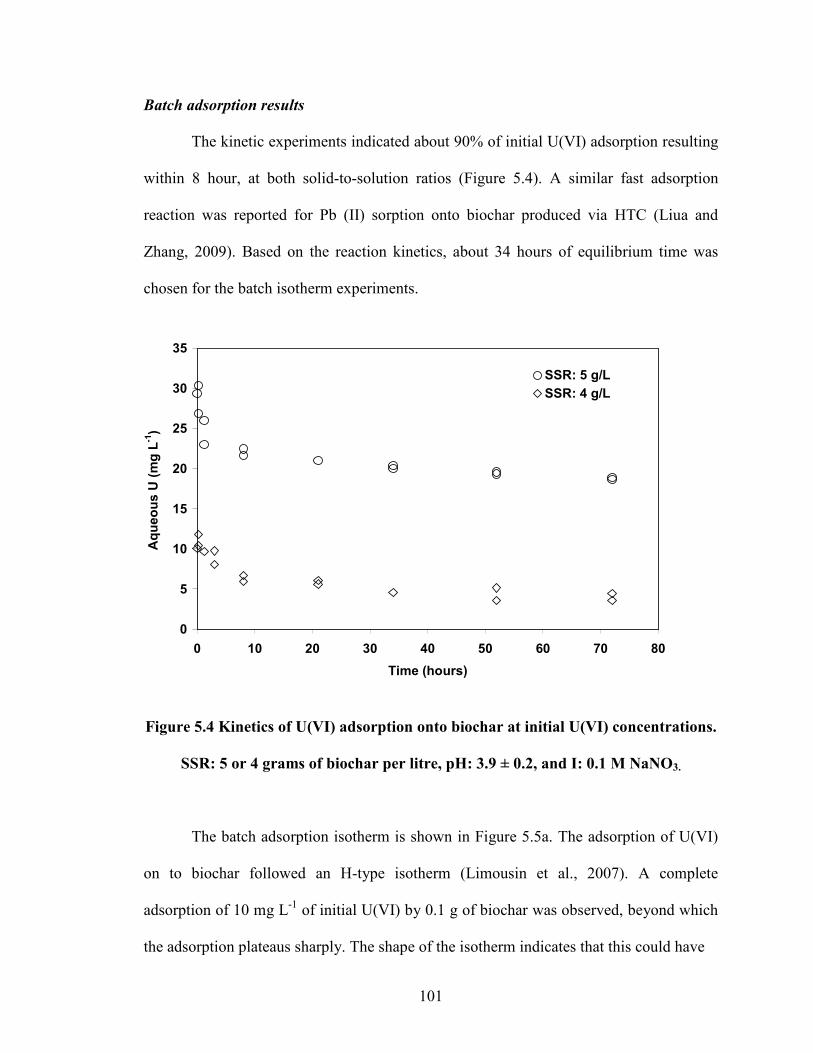
101
Batch adsorption results
The kinetic experiments indicated about 90% of initial U(VI) adsorption resulting
within 8 hour, at both solid-to-solution ratios (Figure 5.4). A similar fast adsorption
reaction was reported for Pb (II) sorption onto biochar produced via HTC (Liua and
Zhang, 2009). Based on the reaction kinetics, about 34 hours of equilibrium time was
chosen for the batch isotherm experiments.
0
5
10
15
20
25
30
35
0 10 20 30 40 50 60 70 80
Time (hours)
Aqueous U
(m
g L
-1)
SSR: 5 g/L
SSR: 4 g/L
Figure 5.4 Kinetics of U(VI) adsorption onto biochar at initial U(VI) concentrations.
SSR: 5 or 4 grams of biochar per litre, pH: 3.9 ± 0.2, and I: 0.1 M NaNO3.
The batch adsorption isotherm is shown in Figure 5.5a. The adsorption of U(VI)
on to biochar followed an H-type isotherm (Limousin et al., 2007). A complete
adsorption of 10 mg L-1 of initial U(VI) by 0.1 g of biochar was observed, beyond which
the adsorption plateaus sharply. The shape of the isotherm indicates that this could have
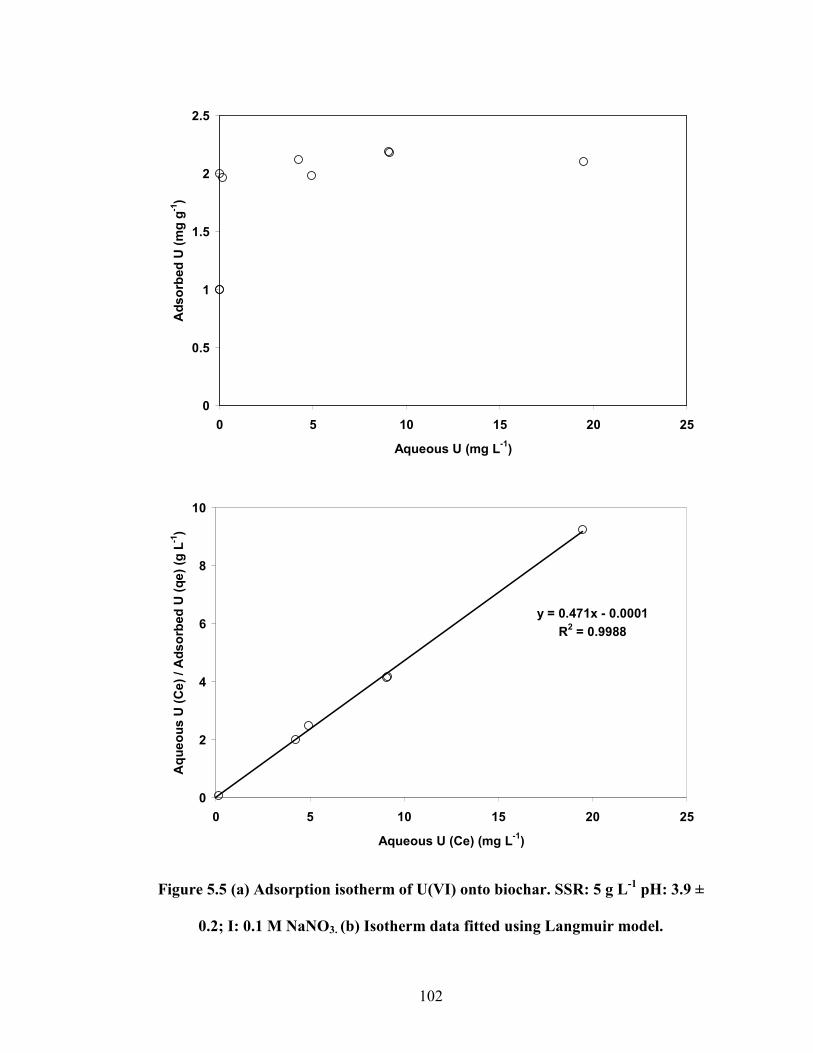
102
0
0.5
1
1.5
2
2.5
0 5 10 15 20 25
Aqueous U (mg L-1)
Adsorb
ed U
(m
g g
-1)
y = 0.471x - 0.0001
R2 = 0.9988
0
2
4
6
8
10
0 5 10 15 20 25
Aqueous U (Ce) (mg L-1)
Aqueous U
(Ce) / Adsorb
ed U
(qe) (g
L-1)
Figure 5.5 (a) Adsorption isotherm of U(VI) onto biochar. SSR: 5 g L-1
pH: 3.9 ±
0.2; I: 0.1 M NaNO3. (b) Isotherm data fitted using Langmuir model.
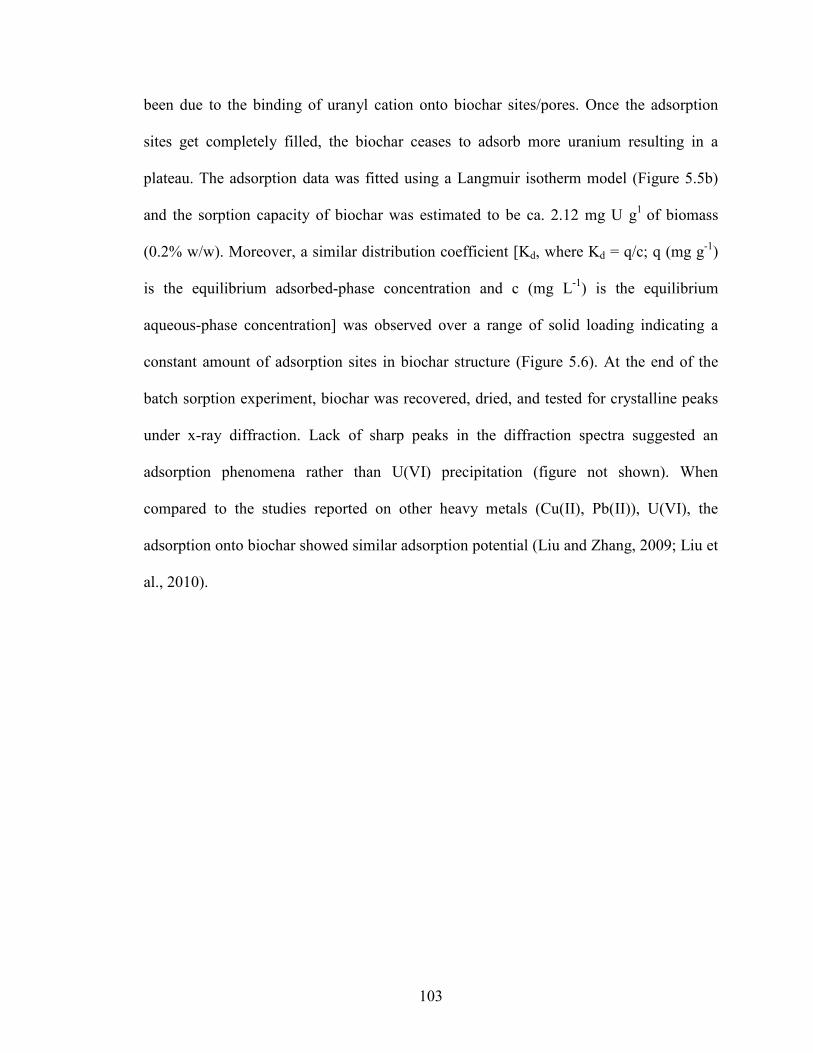
103
been due to the binding of uranyl cation onto biochar sites/pores. Once the adsorption
sites get completely filled, the biochar ceases to adsorb more uranium resulting in a
plateau. The adsorption data was fitted using a Langmuir isotherm model (Figure 5.5b)
and the sorption capacity of biochar was estimated to be ca. 2.12 mg U g1 of biomass
(0.2% w/w). Moreover, a similar distribution coefficient [Kd, where Kd = q/c; q (mg g-1)
is the equilibrium adsorbed-phase concentration and c (mg L-1) is the equilibrium
aqueous-phase concentration] was observed over a range of solid loading indicating a
constant amount of adsorption sites in biochar structure (Figure 5.6). At the end of the
batch sorption experiment, biochar was recovered, dried, and tested for crystalline peaks
under x-ray diffraction. Lack of sharp peaks in the diffraction spectra suggested an
adsorption phenomena rather than U(VI) precipitation (figure not shown). When
compared to the studies reported on other heavy metals (Cu(II), Pb(II)), U(VI), the
adsorption onto biochar showed similar adsorption potential (Liu and Zhang, 2009; Liu et
al., 2010).
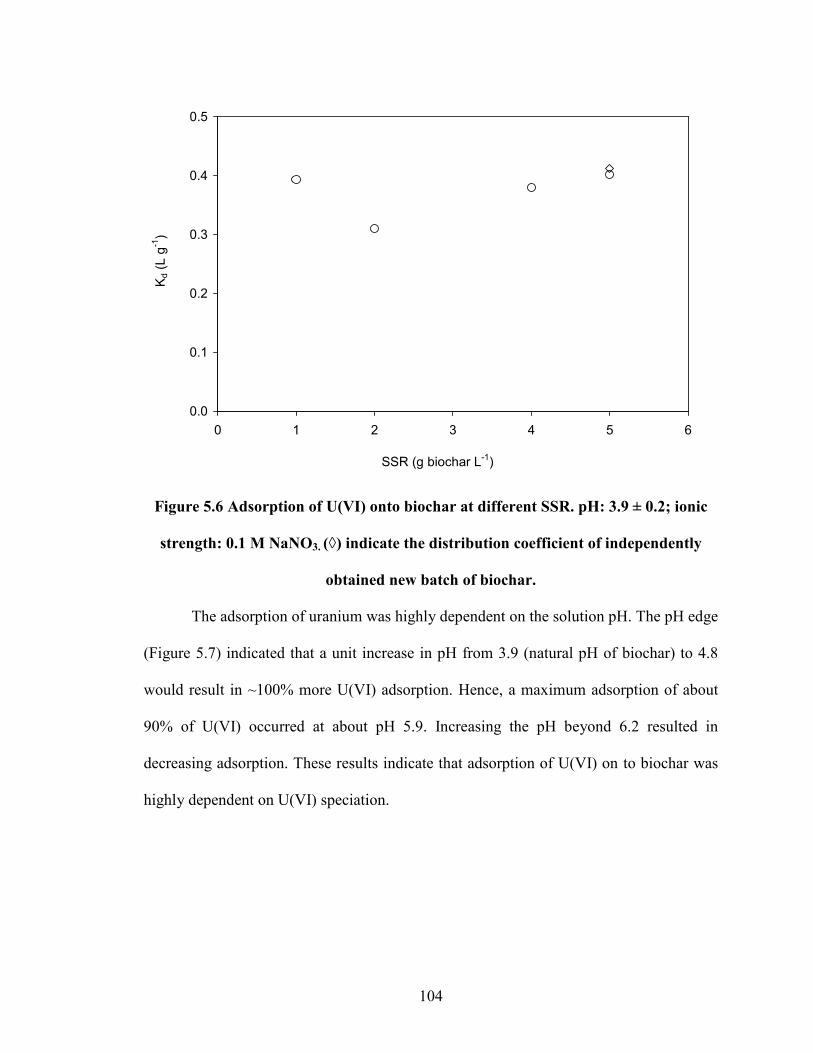
104
0.0
0.1
0.2
0.3
0.4
0.5
0 1 2 3 4 5 6
SSR (g biochar L-1)
Kd (L g
-1)
Figure 5.6 Adsorption of U(VI) onto biochar at different SSR. pH: 3.9 ± 0.2; ionic
strength: 0.1 M NaNO3. (◊) indicate the distribution coefficient of independently
obtained new batch of biochar.
The adsorption of uranium was highly dependent on the solution pH. The pH edge
(Figure 5.7) indicated that a unit increase in pH from 3.9 (natural pH of biochar) to 4.8
would result in ~100% more U(VI) adsorption. Hence, a maximum adsorption of about
90% of U(VI) occurred at about pH 5.9. Increasing the pH beyond 6.2 resulted in
decreasing adsorption. These results indicate that adsorption of U(VI) on to biochar was
highly dependent on U(VI) speciation.
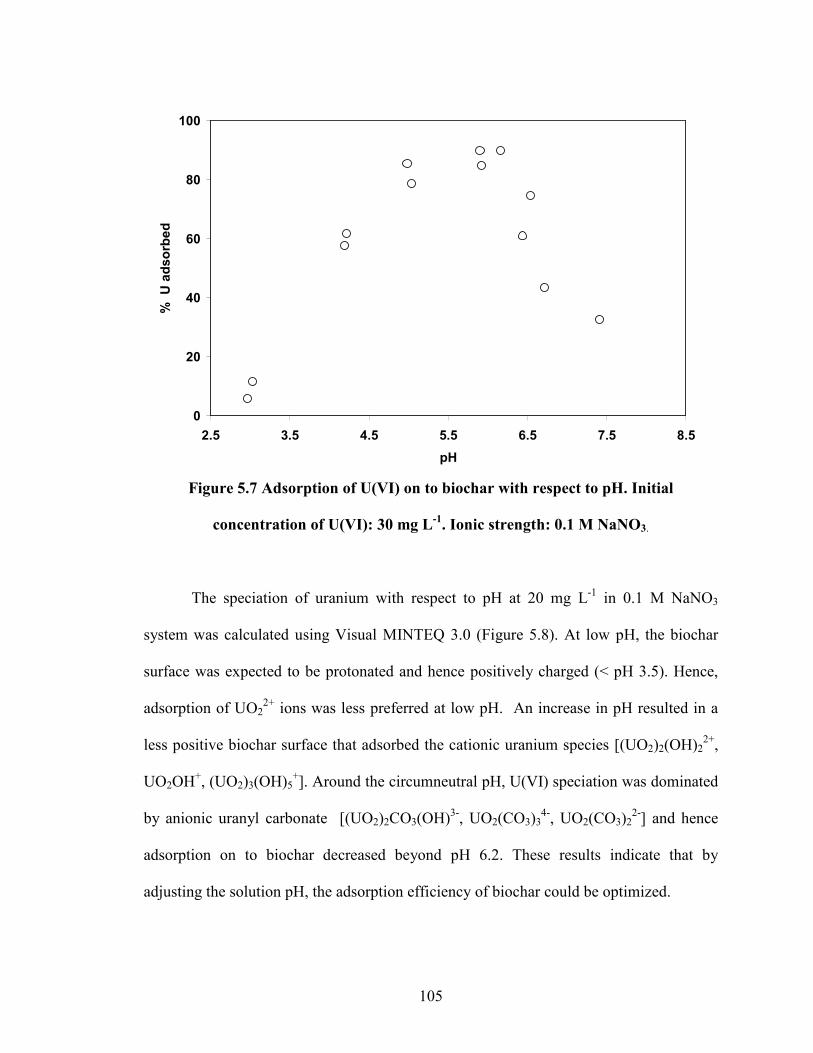
105
0
20
40
60
80
100
2.5 3.5 4.5 5.5 6.5 7.5 8.5
pH
% U a
dsorb
ed
Figure 5.7 Adsorption of U(VI) on to biochar with respect to pH. Initial
concentration of U(VI): 30 mg L-1
. Ionic strength: 0.1 M NaNO3.
The speciation of uranium with respect to pH at 20 mg L-1 in 0.1 M NaNO3
system was calculated using Visual MINTEQ 3.0 (Figure 5.8). At low pH, the biochar
surface was expected to be protonated and hence positively charged (< pH 3.5). Hence,
adsorption of UO22+ ions was less preferred at low pH. An increase in pH resulted in a
less positive biochar surface that adsorbed the cationic uranium species [(UO2)2(OH)22+,
UO2OH+, (UO2)3(OH)5+]. Around the circumneutral pH, U(VI) speciation was dominated
by anionic uranyl carbonate [(UO2)2CO3(OH)3-, UO2(CO3)34-, UO2(CO3)2
2-] and hence
adsorption on to biochar decreased beyond pH 6.2. These results indicate that by
adjusting the solution pH, the adsorption efficiency of biochar could be optimized.
106
0
20
40
60
80
100
2.5 3.5 4.5 5.5 6.5 7.5 8.5
pH
U(V
I) specia
tion (%
)UO2
+2
UO2NO3+
(UO2)2(OH)2+2
(UO2)3(OH)5+
UO2OH+
(UO2)2CO3(OH)3- UO2(CO3)3
4-
UO2(CO3)22-
Figure 5.8 Aqueous speciation of U(VI) with respect to pH at a total U(VI)
concentration of 20 mg L-1
; I: 0.1 M NaNO3; pCO2: 10-3.5
atm.
Column adsorption results
The permeable reactive barrier setup and the corresponding results from the
experiments are shown in Figures 5.9a and b. The U(VI) breakthrough from the PRB
column (Figure 5.10a) indicated a biochar adsorption capacity of 0.52 mg U g-1 of
biochar. When compared to the adsorption of U(VI) onto quartz at similar conditions
(Figure 5.10b), U(VI) adsorbed to biochar was 473 times more, on a per gram basis.
Though the U(VI) adsorption capacity for biochar observed in the PRB column was
about four times less than what was observed in the batch adsorption experiment, it was
still significantly higher than pure quartz.
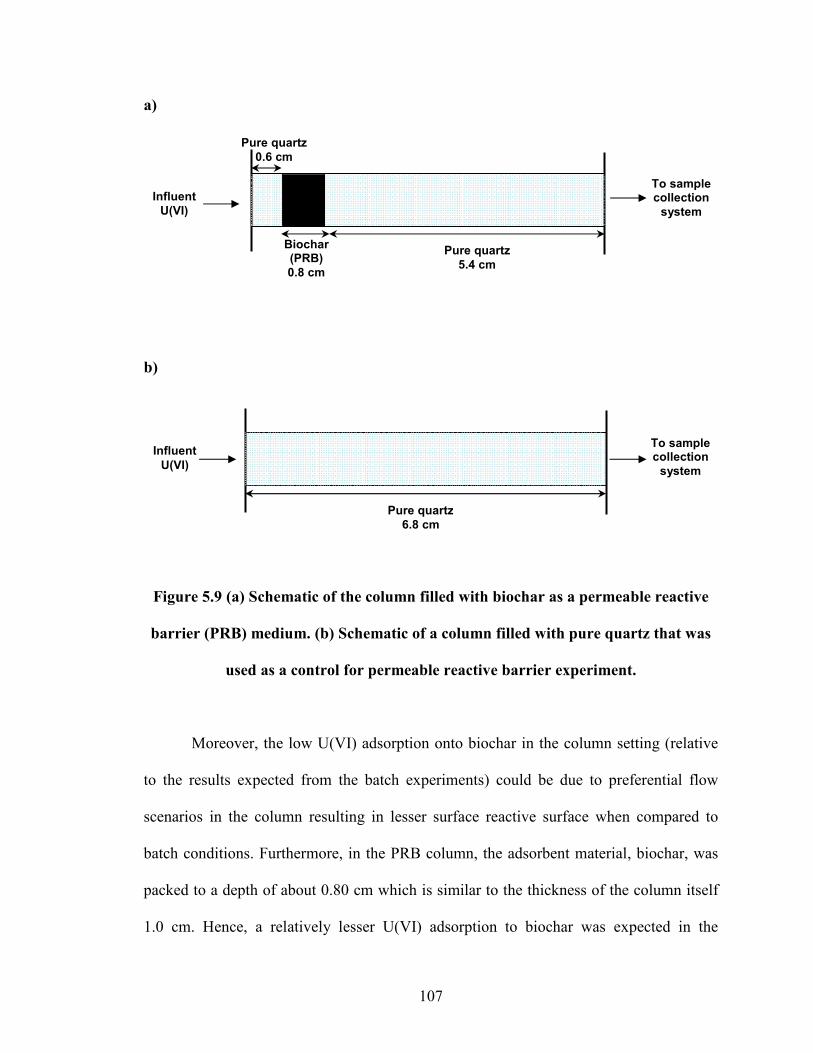
107
a)
b)
Figure 5.9 (a) Schematic of the column filled with biochar as a permeable reactive
barrier (PRB) medium. (b) Schematic of a column filled with pure quartz that was
used as a control for permeable reactive barrier experiment.
Moreover, the low U(VI) adsorption onto biochar in the column setting (relative
to the results expected from the batch experiments) could be due to preferential flow
scenarios in the column resulting in lesser surface reactive surface when compared to
batch conditions. Furthermore, in the PRB column, the adsorbent material, biochar, was
packed to a depth of about 0.80 cm which is similar to the thickness of the column itself
1.0 cm. Hence, a relatively lesser U(VI) adsorption to biochar was expected in the
Pure quartz
0.6 cm
Pure quartz
5.4 cm
Biochar (PRB)
0.8 cm
Influent
U(VI)
To sample collection
system
Pure quartz
6.8 cm
Influent
U(VI)
To sample collection
system
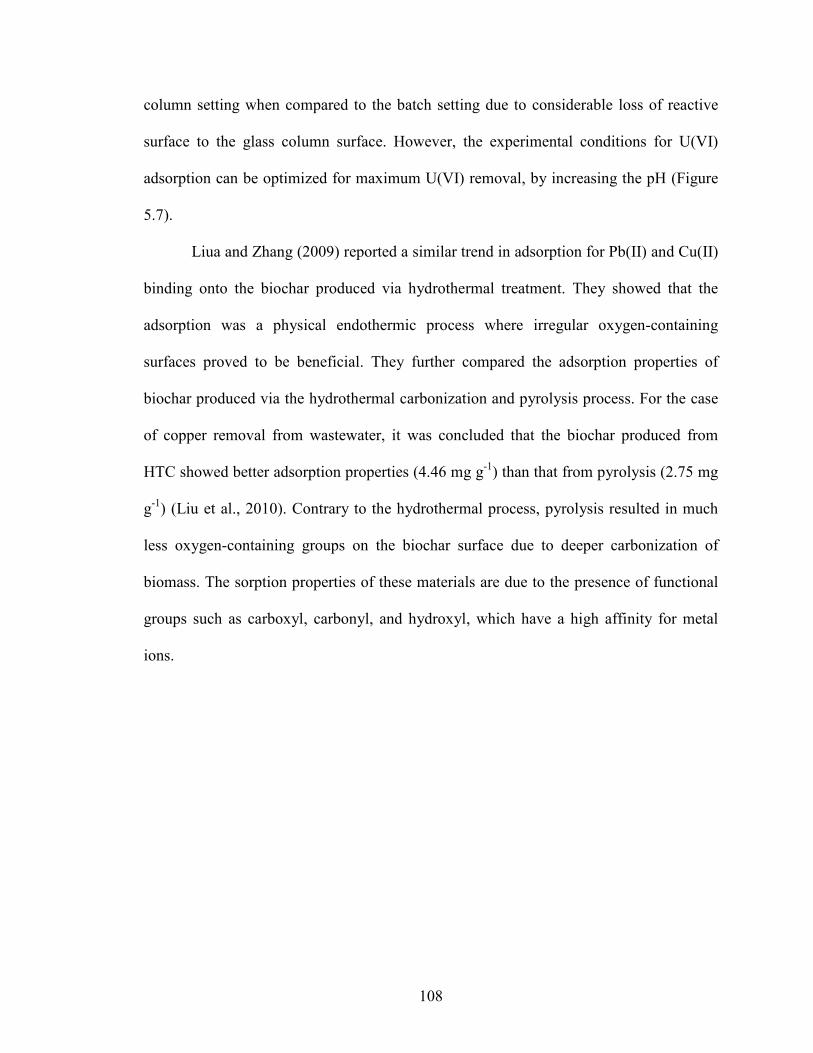
108
column setting when compared to the batch setting due to considerable loss of reactive
surface to the glass column surface. However, the experimental conditions for U(VI)
adsorption can be optimized for maximum U(VI) removal, by increasing the pH (Figure
5.7).
Liua and Zhang (2009) reported a similar trend in adsorption for Pb(II) and Cu(II)
binding onto the biochar produced via hydrothermal treatment. They showed that the
adsorption was a physical endothermic process where irregular oxygen-containing
surfaces proved to be beneficial. They further compared the adsorption properties of
biochar produced via the hydrothermal carbonization and pyrolysis process. For the case
of copper removal from wastewater, it was concluded that the biochar produced from
HTC showed better adsorption properties (4.46 mg g-1) than that from pyrolysis (2.75 mg
g-1) (Liu et al., 2010). Contrary to the hydrothermal process, pyrolysis resulted in much
less oxygen-containing groups on the biochar surface due to deeper carbonization of
biomass. The sorption properties of these materials are due to the presence of functional
groups such as carboxyl, carbonyl, and hydroxyl, which have a high affinity for metal
ions.
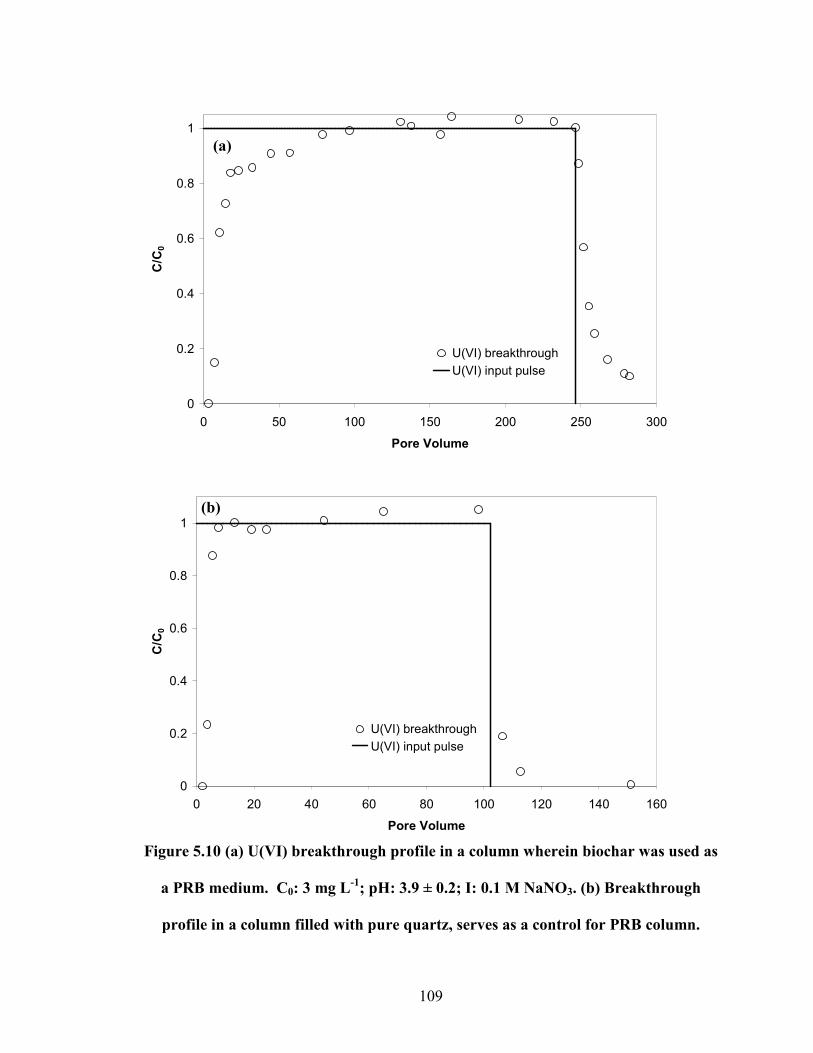
109
0
0.2
0.4
0.6
0.8
1
0 50 100 150 200 250 300
Pore Volume
C/C
0
U(VI) breakthrough
U(VI) input pulse
0
0.2
0.4
0.6
0.8
1
0 20 40 60 80 100 120 140 160
Pore Volume
C/C
0
U(VI) breakthrough
U(VI) input pulse
Figure 5.10 (a) U(VI) breakthrough profile in a column wherein biochar was used as
a PRB medium. C0: 3 mg L-1
; pH: 3.9 ± 0.2; I: 0.1 M NaNO3. (b) Breakthrough
profile in a column filled with pure quartz, serves as a control for PRB column.
(a)
(b)
110
A recent review shows the importance of adsorbent materials (activated carbon, ionic
exchange resins, zero-valent iron, etc.) as a permeable reactive barrier (PRB) to treat
U(VI)-contaminated groundwater (Maria et al., 2009). The results show that biochar
could be considered as a potentially competitive low cost and efficient PRB medium for
U(VI), which also provides the opportunity for long-term storage of carbon in soil
(Shrestha et al., 2010). Besides being free of toxic or carcinogenic compounds, the
carbonaceous material is also water-wettable. In view of the growing biofuels industry, it
is important to add value to the byproduct, biochar, collected at the end of bioenergy
cycle. If not utilized properly, biochar can be an atmospheric pollutant (Shrestha et al.,
2010). The effective use of biochar for contaminant remediation would also enhance the
goal of the green processes. Considering the cost factor, biochar produced via the HTC
process is relatively less energy intensive and can be viewed as a potential low cost
process for obtaining efficient adsorbents. Moreover, when compared to other PRB
medium, for example zero valent iron, biochar is expected to be more stable under
changing redox conditions. When compared to bone char or apatite which sequesters
U(VI) by forming stable uranyl precipitates, biochar entraps U(VI) by sorption
mechanism even at low pH as encountered in many U(VI) contaminated sites (Bostick et
al., 2002). These properties of support its utility as a highly beneficial contaminant
remediation strategy.
5.6 Summary and Conclusion
This study indicates that hydrothermally produced biochar is a porous and
amorphous solid rich in active functional groups (hydroxyl/phenolic, carboxylic, and
111
carbonyl groups). The adsorption of uranium onto biochar is also an attractive alternative
to treat U(VI)-contaminated groundwater. The kinetics of the sorption process was fast
and the extent of adsorption resembles a H-type isotherm. Moreover, the adsorption
capacity is highly dependent on the system pH. A column experiment supported the use
of biochar as a permeable reactive barrier medium. Compared to other remediation
strategies, the feasibility of biochar as U(VI) adsorbent is supported by its
environmentally benign nature. The major advantage of biochar is that it could serve as
an effective and green adsorbent for U(VI) without causing environmental damages.
5.7 References
Amuda, O.S., A.A. Giwa, and I.A. Bello. 2007. Removal of heavy metal from industrial
wastewater using modified activated coconut shell carbon. Biochem. Eng. J.
36:174-181.
Aytas, S., S. Akyil, M.A.A. Aslani, and U. Aytekin. 1999. Removal of uranium from
aqueous solutions by diatomite. J. Radioanal. Nucl. Ch. 240:973-976.
Baeza, J., and J. Freer. 2001. Chemical characterization of wood and its components, p.
275-384, In D. N.-S. Hon and N. Shiraishi, eds. Wood and cellulosic chemistry,
second ed. Marcel Dekker, Inc., New York. Basel.
Berg, D.V.D., and P.D. Visser. Final Report FAIR 5-CT97-3701. 2001 “Switchgrass”.
BTG (Biomass Technology Group), Enschede, The Netherlands. Chapter 7, pp
48-50.
112
Bostick, B.C., S. Fendorf, M.O. Barnett, P.M. Jardine, and S.C. Brooks. 2002. Uranyl
surface complexes formed on subsurface media from DOE facilities. Soil Sci.
Soc. Am. J. 66:99-108.
Budinova, T., E. Ekinci, F. Yardim, A. Grimm, E. Bjornbom, V. Minkova, and M.
Goranova. 2006. Characterization and application of activated carbon produced
by H3PO4 and water vapor activation. Fuel Process. Technol. 87:899–905.
Camacho, L.M., S. Deng, and R.R. Parra. 2010. Uranium removal from groundwater by
natural clinoptilolite zeolite: Effects of pH and initial feed concentration. J
Hazard. Mater. 175:393-398.
Cao, X., L. Ma, B. Gao, and W. Harri. 2009. Dairy-Manure Derived Biochar Effectively
Sorbs Lead and Atrazine. Environ. Sci. Technol. 43:3285-3291.
Chen, B., and Z. Chen. 2009. Sorption of naphthalene and 1-naphthol by biochars of
orange peels with different pyrolytic temperatures. Chemosphere 76:127-133.
Chen, B., D. Zhou, and L. Zhu. 2008. Transitional adsorption and partition of nonpolar
and polar aromatic contaminants by biochars of pine needles with different
pyrolytic temperatures. Environ. Sci. Technol. 42:5137-5143.
Cheng, L., X.P. Ye, R. He, and S. Liu. 2009. Investigation of rapid conversion of
switchgrass in subcritical water. Fuel Process. Technol. 90:301-311.
Dachs, J. 2000. Adsorption onto aerosol soot carbon dominates gas-particle partitioning
of polycyclic aromatic hydrocarbons. Environ. Sci. Technol. 34:3690.
Davis, J.A., D.E. Meece, M. Kohler, and G.P. Curtis. 2004. Approaches to surface
complexation modeling of Uranium(VI) adsorption on aquifer sediments.
Geochim. Cosmochim. Ac. 68:3621-3641.
113
Ervanne, H. 2003. Interferences in uranium oxidation states during dissolution of solid
phases J. Radioanal. Nucl. Ch. 256:497-500.
Funke, A., and F. Ziegler. 2010. Hydrothermal carbonization of biomass: A summary and
discussion of chemical mechanisms for process engineering. Biofuel. Bioprod.
Bior. 4:160-177.
Gaunt, J.L., and J. Lehmann. 2008. Energy balance and emissions associated with
biochar sequestration and pyrolysis bioenergy production. Environ. Sci. Technol.
42:4152-4158.
http://www.biochar-international.org/biochar [Online] (verified February, 2010).
Hu, B., S.-H. Yu, K. Wang, L. Liu, and X.-W. Xu. 2008. Functional carbonaceous
materials from hydrothermal carbonization of biomass: an effective chemical
process. Dalton T. 40: 5414-5423.
Isaac, R.A. and W.C. Johnson, 1985, Elemental Analysis of Plant Tissue by Plasma
Emission Spectroscopy: Collaborative Study. J. Assoc. Off. Anal. Chem. 68(3),
499- 505.
Kalderis, D., D. Koutoulakis, P. Paraskeva, E. Diamadopoulos, E. Otal, J.O. Valle d., and
C. Fernandez-Pereira. 2008. Adsorption of polluting substances on activated
carbons prepared from rice husk and sugarcane bagasse. Chem. Eng. J. 144.
Kirsten,W.J.,1979.Automated Methods for the determination of carbon,hydrogen,
nitrogen,and sulfur,and sulfur alone in organic and inorganic materials.
Anal.Chem.51:1173-1179.
114
Kobayashi, N., N. Okada, A. Hirakawa, T. Sato, J.Kobayashi, S. Hatano, Y. Itaya, and S.
Mori. 2009. Characteristics of solid residues obtained from hot-compressed-water
treatment of woody biomass. Ind. Eng. Chem. Res. 48:373-379.
Kumar,S, 2010. Dissertation on “Hydrothermal Treatment for Biofuels: Lignocellulosic
Biomass to Bioethanol, Biocrude, and Biochar”. Department of Chemical
Engineering, Auburn University, Auburn, AL, USA.
Kumar, S., and R.B. Gupta. 2009. Biocrude Production from Switchgrass using
Subcritical Water. Energ. Fuels 23:5151-5159.
Laird, D.A., R.C. Brown, J.E. Amonette, and J. Lehmann. 2009. Review of the pyrolysis
platform for coproducing bio-oil and biochar. Biofuel. Bioprod. Bior. 3:547-562.
Lehmann, J. 2007. Bio-energy in the black. Front. Ecol. Environ. 5:381-387.
Limousin, G., J.P. Gaudet, L. Charlet, S. Szenknect, V. Barthes, and M. Krimissa. 2007.
Sorption isotherms: A review on physical bases, modeling and measurement.
Appl. Geochem. 22:249-275.
Liu, Z., and F.-S. Zhang. 2009. Removal of lead from water using biochars prepared from
hydrothermal liquefaction of biomass. J. Hazard. Mater. 167:933-939.
Liu, Z., F.-S. Zhang, and J. Wu. 2010. Characterization and application of chars produced
from pinewood pyrolysis and hydrothermal treatment. Fuel 89:510-514.
Liua, Z., and F.-S. Zhang. 2009. Removal of lead from water using biochars prepared
from hydrothermal liquefaction of biomass. J. Hazard. Mater. 167:933-939.
Loganathan, V.A., Y.C. Feng, G.D. Sheng, and T.P. Clement. 2009. Crop-Residue-
Derived Char Influences Sorption, Desorption and Bioavailability of Atrazine in
Soils. Soil. Soc. Am. J. 73:967-974.
115
Maria, G., P.L. Vasile, and C. Igor. 2009. Characterization and remediation of soils
contaminated with uranium. J. Hazard. Mater. 163:475-510.
McKay, J.F.P.G. 1997. Equilibrium parameters for the sorption of copper, cadmium and
zinc ions onto peat. J. Chem. Technol. Biotechnol. 69:309-320.
Mellah, A., S. Chegrouche, and M. Barkat. 2006. The removal of uranium(VI) from
aqueous solutions onto activated carbon: Kinetic and thermodynamic
investigations. J. Colloid Interf. Sci. 296:434-441.
National Biofuels Action Plan, October 2008.
http://www1.eere.energy.gov/biomass/pdfs/nbap.pdf
Parab, H., S. Joshi, N. Shenoy, R. Verma, A. Lali, and M. Sudersanan. 2005. Uranium
removal from aqueous solution by coir pith: equilibrium and kinetic studies.
Bioresour. Technol. 96:1241-1248.
Patrick, H.R., K. Griffith, C.L. Liotta, and C.A. Eckert. 2001. Near critical water: A
benign medium for catalytic reactions. Ind. Eng. Chem. Res. 40:6063-6067.
Perlack, R.D., L.L. Wright, A.F. Turhollow, R.L. Graham, B.J. Strokes, and D.C. Erbach.
2005. Biomass as a feedstock for a bioenergy and bioproducts industry: The
technical feasibility of a billion-ton annual supply. A Joint report sponsored by
U.S. Department of Energy and U.S. Department of Agriculture:78.
Psarevaa, T.S., O.I. Zakutevskyya, N.I. Chubara, V.V. Strelkoa, T.O. Shaposhnikovaa,
J.R. Carvalhob, and M.J.N. Correia. 2005. Uranium sorption on cork biomass.
Colloid Surface A. 252:231-236.
116
Savovaa, D., E. Apakb, E. Ekincib, F. Yardimb, N. Petrova, and T. Budinovaa. 2001a.
Biomass conversion to carbon adsorbents and gas. Biomass Bioenerg. 21:133-
142.
Savovaa, D., E. Apakb, E. Ekinci, F. Yardimb, N. Petrov, T. Budinovaa, M.
Razvigorovaa, and V. Minkovaa. 2001b. Biomass conversion to carbon
adsorbents and gas. Biomass Bioenerg. 21:133-142.
Sciban, M., B. Radetic, Z. Kevresan, and M. Klasnja. 2007. Adsorption of heavy metals
from electroplating wastewater by wood sawdust. Bioresour. Technol. 98:402-
409.
Segal, L., J.J. Creely, A.E. Martin, and C.M. Conrad. 1959. An empirical method for
estimating the degree of crystallinity of native cellulose using the X-ray
diffractometer. Textile Res. J. 29:786-794.
Sevilla, M., and A.B. Fuertes. 2009. The production of carbon materials by hydrothermal
carbonization of cellulose. Carbon 47:2281-2289.
Shrestha, G., S.J. Traina, and C.W. Swanston. 2010. Black carbon's properties and role in
the environment: a comprehensive review. Sustainability 2:294-320.
Smernik, R.J. 2009. Biochar and sorption of organic compounds, p. 289-300, In J.
Lehmann and A. Joseph, eds. Biochar for Environmental Management: Science
and Technology. Earthscan, London.
Spokas, K.A., W.C. Koskinen, J.M. Baker, and D.C. Reicosky. 2009. Impacts of
woodchip biochar additions on greenhouse gas production and
sorption/degradation of two herbicides in a Minnesota soil. Chemosphere 77:574-
581.
117
Srivastava, S., K.C. Bhainsa, and S.F. D’Souza. 2010. Investigation of uranium
accumulation potential and biochemical responses of an aquatic weed Hydrilla
verticillata (L.f.) Royle. Bioresour. Technol. 101:2573-2579.
Suhas, P.J.M.C., and M.M.L.R. Carrott. 2007. Lignin-from natural adsorbent to activated
carbon: A review. Bioresour. Technol. 98:2301-2312.
Tan, W.T., S.T. Ooi, and C.K. Lee. 1993. Removal of Cr(VI) from solution by coconut
husk, palm pressed fibers. Environ. Technol. 14:277–282.
Titirici, M.M., A. Thomas, and M. Antonietti. 2007. Back in the black: hydrothermal
carbonization of plant material as an efficient chemical process to treat the CO2
problem. New J. Chem. 31:787-789.
Vandenhovea, H., A. Cuypersb, M.V. Heesa, G. Koppenc, and J. Wannijna. 2006.
Oxidative stress reactions induced in beans (Phaseolus vulgaris) following
exposure to uranium. Plant Physiol. Bioch. 44:795-805.
Varhegyi, G., P. Szabo, F. Till, B. Zelei, M.J.J. Antal, and X. Dai. 1998. TG, TG-MS,
and FTIR Characterization of high-yield biomass charcoals. Energ. Fuels 12:969-
974.
Yu, X.Y., G.G. Ying, and R.S. Kookana. 2009. Reduced plant uptake of pesticides with
biochar additions to soil. Chemosphere 76:665-671.
Zeng, H., A. Singh, S. Basak, K.-U. Ulrich, M. Sahu, P. Biswas, J.G. Catalano, and D.E.
Giammar. 2009. Nanoscale Size Effects on Uranium (VI) Adsorption to
Hematite. Environ. Sci. Technol. 43:1373-1378.
118
6. Summary, Implications, and Recommendations
This dissertation investigated the scaling of adsorption reactions in systems that
involved uranium as a solute and iron oxide-rich media as the adsorbent. The primary
objectives of this work were: 1) To synthesize and characterize iron oxide-coated sand
(IOCS) and use it as a model system to perform U(VI) adsorption experiments. 2) To
design and perform batch adsorption experiments and identify the key scaling parameters.
3) To implement the scaling procedure in surface complexation models and predict
experimental results. 4) To compare the adsorption parameters between batch and column
transport experiments using a model system and a natural media. 5) To decipher the
causes for the adsorption discrepancies that exist between batch and column experimental
modes. These objectives were addressed with a combination of experiments with
synthetic media (iron oxide-coated sand), natural geomedia (Oak Ridge Reservation soil),
and surface complexation modeling. Moreover, the dissertation assessed the adsorption
properties of biochar obtained via hydrothermal carbonization (HTC) for U(VI)
adsorption. Here, we made one of the first attempts to test the use of carbonized waste as
a permeable reactive barrier material for uranium contaminated sites.
6.1 Summary
In Chapter 2 of the dissertation, the two common protocols to synthesize iron
oxide-coated sand, a precipitation method where Fe was precipitated directly onto the
119
sand in a single step, and an adsorption method where pure goethite was prepared in the
first step and then adsorbed onto the sand in a second step were described in detail.
Although neither of the methods produced a completely crystalline Fe coating, the
precipitation method produced sands with larger portions of amorphous Fe than the
adsorption method, with the fraction of amorphous Fe decreasing with increasing Fe
content. Despite producing a less crystalline Fe coating, however, the precipitation
method was a more efficient and less time-consuming method of preparing IOCS. The
coated sands from both the systems were characterized using scanning electron
microscopy, energy dispersive spectroscopy, X-ray diffraction, and selective Fe
extraction.
In Chapter 3, the adsorption properties of the IOCS were assessed to identify the
key scaling parameters in batch systems. U(VI) adsorption isotherms and pH adsorption
edges were measured on three coated sands with Fe contents ranging from 0.04 to 0.3%.
Experimentally, the adsorption of U(VI) onto the three sands was more comparable when
normalized to surface area than when normalized to Fe content. We also examined the
ability of several surface complexation models to predict our adsorption data. Although
several different models could predict our data with a reasonable degree of accuracy, the
model of Waite et al. (1994) predicted the complete range of data better than the other
models we tested. As the model was developed for amorphous HFO, it also served as a
test of the hypotheses that adsorption of U(VI) to both amorphous and crystalline Fe
oxides is approximately the same after correcting for surface area. Two different methods
of scaling adsorption models were examined, the traditional method wherein the surface
area of the adsorbents were assumed and a hybrid method wherein the measured surface
120
area of the adsorbents were used. Consistent with the experimental data, scaling the
adsorption model on the basis of surface area was the best approach. These findings are
significant because many common surface complexation models are parameterized solely
on the basis of measured Fe content rather than both measured Fe content and measured
surface area.
In Chapter 4, the dissertation addressed one of the most perplexing and yet
unresolved problems of adsorption anomalies that exists between batch and column-
derived distribution coefficients (Kd). Several previous studies have indicated the
existence of these discrepancies, especially when U(VI) has been used as an adsorbate. In
this study, we attempted to understand the causes of the above problem using both natural
heterogeneous geomedia and a homogeneous synthetic adsorbent. The uncontaminated
natural geomedia was obtained from the Oak Ridge Reservation (OR) and the synthetic
media, iron oxide-coated sand (IOCS), was prepared in the laboratory. The OR soil and
IOCS were used to perform adsorption experiments with U(VI) as a solute in both batch
and column modes. Moreover, a multi-step column experiment was conducted to obtain
an adsorption isotherm that could be juxtaposed with the batch adsorption isotherm.
Efforts were made to maintain similar experimental conditions in both batch and column
scenarios. In particular, to eliminate CO2 contamination, all the experiments were
conducted at a pH < 5. The results obtained from the batch and column experiments
indicated a large discrepancy (>100%) in the adsorption capacity of U(VI) onto OR soil.
Whereas, in the case of IOCS, the batch-derived and column-derived isotherm indicated
similar adsorption capacity for U(VI). Further experiments were designed at
understanding the effect of solid-to-solution ratio on U(VI) adsorption in the batch
121
systems involving the adsorbents. The results indicated that the adsorption of U(VI) on to
IOCS was found to be independent of soil-to-solution ratio, whereas the adsorption of
U(VI) onto OR soil was highly dependent on soil-to-solution ratio. When adsorption is
dependent on solid-to-solution ratio, multiple adsorption isotherms could be obtained.
This could lead to the observed batch and column adsorption discrepancy.
In Chapter 5 of the dissertation, one of the first attempts to test the use of
carbonized waste, biochar obtained via HTC, as a permeable reactive barrier material for
U(VI) contaminated sites was probed. In the study, biochar was produced from
switchgrass at 300°C in subcritical water and characterized using X-ray diffraction,
Fourier transform infrared spectroscopy, scanning electron micrcoscopy, and
thermogravimetric analysis. The physiochemical properties indicated that biochar could
serve as an excellent adsorbent to remove uranium from groundwater. A batch adsorption
experiment at the natural pH (~ 3.8) of biochar indicated an H-type isotherm with a
maximum sorption capacity of 2 mg g-1. The adsorption process was highly dependent on
the pH of the system. An increase towards circumneutral pH resulted in the maximum
U(VI) adsorption of ca. 4 mg g-1. The results indicated a strong relationship between the
speciation of U(VI) and its adsorption onto biochar. Our study demonstrated that biochar
could be used as an effective adsorbent medium for U(VI). Overall, the biochar produced
via HTC is environmentally benign, carbon neutral, and efficient in removing U(VI) from
groundwater.
6.2 Implications and recommendations
An assessment of the existing protocols to synthesize iron oxide coated-sand
122
indicated that the sands from precipitation method would produce Fe coated media that
would resemble natural material found at Department of Energy (DOE) sites. It has been
reported that many of the DOE sites contain both crystalline and amorphous forms of
iron oxides. Hence, sands from the precipitation method, which can be manipulated to
produce different levels of iron oxide, can serve as a reasonable surrogate to represent
natural iron oxide-coated geomedia for future studies that would aim at understanding
field scale U(VI) transport. Moreover, our study indicated that a surface complexation
model, although originally developed for U(VI) adsorption onto amorphous Fe oxide, can
be tweaked to capture the differences in adsorption when adjusted for the surface area.
Our results support one of the two methods adopted for modeling the adsorption
processes at some U(VI) contaminated sites, namely the general composite (GC) method.
Since many of U(VI) contaminated sites are rich in Fe-oxide coated geomedia, our
method of using the measured surface area normalized to Fe content could serve as a
reasonable approximation to predict those adsorption processes.
The results from the studies that addressed the batch-column adsorption
discrepancy suggest that the frequently observed adsorption discrepancy between batch
and column setting exists in systems containing highly heterogeneous adsorbents. Since
in the case of heterogeneous adsorbents, reactions that would interfere with a hard metal
like uranium would prevail (e.g., a multitude of sorption surfaces or dissolution of ligands
that would interfere in U(VI) adsorption reaction etc.) that could result in adsorption
being dependent on solid-to-solution ratio. Hence, scaling of adsorption processes that
involves a strongly interacting solute like uranium should be done after thoroughly
assessing the adsorption properties of the natural geomedia at different experimental
123
conditions. Although the interactions of U(VI) and Fe-coated sands were used as
representative adsorbate and adsorbent, the general principles may be applicable to other
adsorbate-adsorbent systems well.
Since the ever increasing growth of biorefineries is expected to produce huge
amounts of lignocellulosic biochar as a byproduct, its application as a permeable reactive
barrier medium would help solve both carbon sequestration and contaminant remediation
issues. The dissertation demonstrated the potential of biochar obtained via HTC as a
uranium adsorbent media. Though our results indicate that biochar obtained via HTC can
be used to adsorb uranium as is, future studies could focus on studying the adsorption
properties of this carbonized media after activation and optimizing the experimental
conditions for U(VI) adsorption.