Embed Size (px)
Citation preview

AN ASSESSMENT OF THE INFLUENCE OF COMBUSTION GENERATED
POLLUTANTS ON THE INDOOR AIR QUALITY OF SELECTED
LABORATORIES IN AHMADU BELLO UNIVERSITY ZARIA
BY
NKELEME IFEANYICHUKWU EMMANUEL
A Thesis Submitted to the School of Post Graduate Studies, Ahmadu Bello
University, Zaria In partial Fulfillment of the requirement for the Award of
Masters Degree in Building Service.
Department Of Building,
Faculty of Environmental Design
Ahmadu Bello University Zaria
May, 2014
2
AN ASSESSMENT OF THE INFLUENCE OF COMBUSTION GENERATED
POLLUTANTS ON THE INDOOR AIR QUALITY OF SELECTED
LABORATORIES IN AHMADU BELLO UNIVERSITY ZARIA
BY
NKELEME IFEANYICHUKWU EMMANUEL
Msc-Env/Design/1395/2011-2012
A Thesis Submitted to the School of Post Graduate Studies, Ahmadu Bello
University, Zaria In partial Fulfillment of the requirement for the Award of
Masters Degree in Building Service.
Department Of Building,
Faculty of Environmental Design
Ahmadu Bello University Zaria
May, 2014
3
DECLARATION
I hereby declare that the Thesis titled “An Assessment of the Influence of
Combustion Generated Pollutants on the Indoor Air Quality of Selected Laboratories in
Ahmadu Bello University Zaria” was performed by me „Nkeleme Ifeanyichukwu
Emmanuel (Msc/Env-Design/1395/2011-2012)‟ under the supervision of Professor I
Mbamali and Dr A M Stanley
The information derived from the literatures has been duly acknowledged in the text and
in a list of references provided. No part of this work has been presented for another
degree or diploma in any institution
……………………………………. ………………………….
Nkeleme Ifeanyichukwu Emmanuel Date

4
CERTIFICATION
This project work entitled “An Assessment Of The Influence Of Combustion Generated
Pollutants On The Indoor Air Quality Of Selected Laboratories In Ahmadu Bello
University Zaria” by Nkeleme Ifeanyichukwu Emmanuel meets the regulation governing
the award of a Masters Degree in Building Services (Msc Building Services) of Ahmadu
Bello University Zaria, and is approved for its contribution to knowledge and literary
presentation.
…………………………................ ………………………….
Prof I Mbamali Date
(Major Supervisor)
………………………………….. ……………………………..
Dr A M Stanley Date
(Minor Supervisor)
…………………………………….. ………………………………
Prof Kabir Bala Date
(Head of Department)

5
DEDICATION
This projected is dedicated to the ALMIGHTY GOD whose infinite mercies have
kept me thus far. Indeed I have come to realize that He alone is the „All Knowing‟, „Ever
Present‟, „Adorable‟, „Awesome God‟, The Epitome, Genesis and the Revelation Of all
Wisdom‟.

6
ACKNOWLEDGEMENT
I want to specially appreciate my able and reputable supervisor Professor I
Mbamali for his fatherly guidance, concern and support all through the course of this
programme. I sincerely want to also appreciate my minor supervisor, Dr Stanley A Myha
who for his support, this thesis is a reality and particularly for making available the
device used for this research, indeed words cannot be enough to appreciate that kind
gesture you showed to me and I pray that just as I found favor before you, God himself
will make you and all your family members find favor before men when you need it
most.
I wish to also use this medium to appreciate the Head of Department Professor
Kabir Bala for all his efforts and support, my sincere prayer is that God will reward you
accordingly.
Posterity will not forgive me if I forget to appreciate the parental support given to
me by Professor G O Okili, who was always by my side through the thick and thin,
indeed I am obliged to always remain grateful to you. To all my lecturers; Professor M
M Garba, Dr Dadu, Dr I.H. Mshelgaru, Dr D. Kado, Mallam A.A Abdulsalam, Mallam
D D Danwata, Malam Khali, Mr. A. A. Dania, Engr Abdulazeez, Engr Iro, Dr Mati, i am
indeed greatful for impacting the right knowledge to me at the course of the course work .
I express my sincere appreciation to my parents Mr. and Mrs F.O.N. NKELEME
for their parental guidance, support and prayers, may God bless you..
Special thanks to my father and adviser in spiritual matters Rev Franklin E
Urakpa I remain grateful.

7
To my immediate family, I sincerely appreciate you all. To my brothers; Engr.V
O Nkeleme, Engr. S.C Nkeleme and Mr. D. O. Nkeleme, for all your encouragement. To
sisters; Mrs. G O Okereke, Mrs J.C. Uwakwe and Mrs J. N. Adieze . I appreciate your
moral supports.
Finally to all my friends and course mates I appreciate your constructive criticism
at the course of the thesis.
8
ABSTRACT
Health threats in a learning environment can jeopardize the entire effort of teaching and
learning. One of such health threats is the presence of hazardous gaseous elements
within the interior either as a result of learning processes or from the external
environment. Combustion is one of the basic process that is employed in the learning and
teaching in the laboratory that leads to the release of some gaseous pollutants that are
hazardous. This research assessed the influence of combustion generated pollutants on
the indoor air quality of selected laboratories in Ahmadu Bello University Zaria, with a
view of: estimating the amount of combustion pollutant generated; assess the impact of
this pollutant on the indoor air as well as recommend measure to be adopted to improve
the indoor air quality of the environment. It was effected, by means of literature review
and field survey entailing the use of an IMR 1400C gas analyzer, a well structured
questionnaire and a checklist. Combustion pollutants were measured and the response
from the questionnaire analyzed using computer software (SPSS). From the result of the
pollutant measured, it is established that CO during combustion exceeded the ASHREA
62 and NAAQS limit of 9ppm reaching up to 45ppm at some points; also oxygen was
observed to be at a critical level of 20.9% and at some point falling below the limit
to20.4%. Similarly, it was established that fatigue is the most prominent symptom of poor
indoor air quality during combustion among other symptoms like; sinus congestion,
headache and sneezing. It was also established that combustion is a major contributor to
poor indoor air quality in laborites especially in the absence of functional fume hoods,
congestion in laboratories and inadequate ventilation system. Hence, It is recommended
that; fume hoods should be well maintained for functionality and installed where it does
not exist like the ‘chemistry lab I’, provision of adequate ventilation systems in the
laboratories and the construction of new laboratories to accommodate the student
enrolled without congestion in the laboratories during combustion.

9
LIST OF TABLES PAGE NO.
Table 2.1: Carboxyhemoglobin levels and related health effects…………………….... 24
Table 2.2: Standards on the use of Fume hoods ……………………………..………….49
Table 2.3 Standards for air recirculation in the laboratory …………………………….. 50
Table 3.1: Technical Data of IMR 1400 Gas Analyzer…………………………..…….. 55
Table 3.2: Number of Sampling Point in the Laboratory for the Pollutants Measurement
.....................................................................................................................…57
Table 4.1: Result of the Combustion Pollutant Measurement in Chemistry Lab I along
with ASHREA Requirement and NAAQS standard…..………….……..….63
Table 4.2 Result of the Combustion Pollutant Measurement SBRS LAB II along with
ASHREA Requirement and NAAQS standard …………………….………64
Table 4.3 Result of the Combustion Pollutant Measurement IN SBRS LAB III along
with ASHREA Requirement and NAAQS standard ………………………. 65
Table 4.4 Result of the Combustion Pollutant Measurement IN CHEMISTRY MULTI-
PURPOSE LAB along with ASHREA Requirement and NAAQS standard
…………………………………………………………………………….…66
Table 4.5 Result of the Combustion Pollutant Measurement PHYSICAL CHEMISTRY
LAB Along With ASHREA Requirement and NAAQS Standard ………… 67
Table 4.6: Result of the Combustion Pollutant Measurement CHEMISTRY MASTERS
STUDENT LAB Along With ASHREA Requirement and NAAQS Standard
………………………………………………………………………………. 68
Table 4.7: Questionnaire administered ………………….……...……………………… 69

10
Table 4.8: Respondents Profile …………..……….…………….…………….……….70
Table 4.9: Frequency of Laboratory Use …………………………..…..…..………….. 71
Table 4.10: Combustion, Heat Source and the Presence of Fume Hood In Laboratories
……………………………………………………………………………... 72
Table 4.11: Combustion and Ventilation in Laboratories ……………………………. 73
Table 4.12: Ranking Of the Health Symptoms of Poor Indoor Air Quality ……..….… 74
Table 4.13: Ranking of the Causes of Poor Indoor Air Quality ……….……….…….. 75
Table 4.14: Ranking of the Remedy to the Poor Indoor Air Quality …………….……. 76
Table 4.15: Result of the Checklist Survey ……………………………………………..78

11
LIST OF APPENDIX PAGE NO.
APPENDIX I – Questionnaire …………………………….……...89
APPENDIX II- Checklist ………………………………………..95
APPENDIX III- Experimental Record Sheet ………………….....97
APPENDIX IV – Plates of Research Area ……………………..…98
12
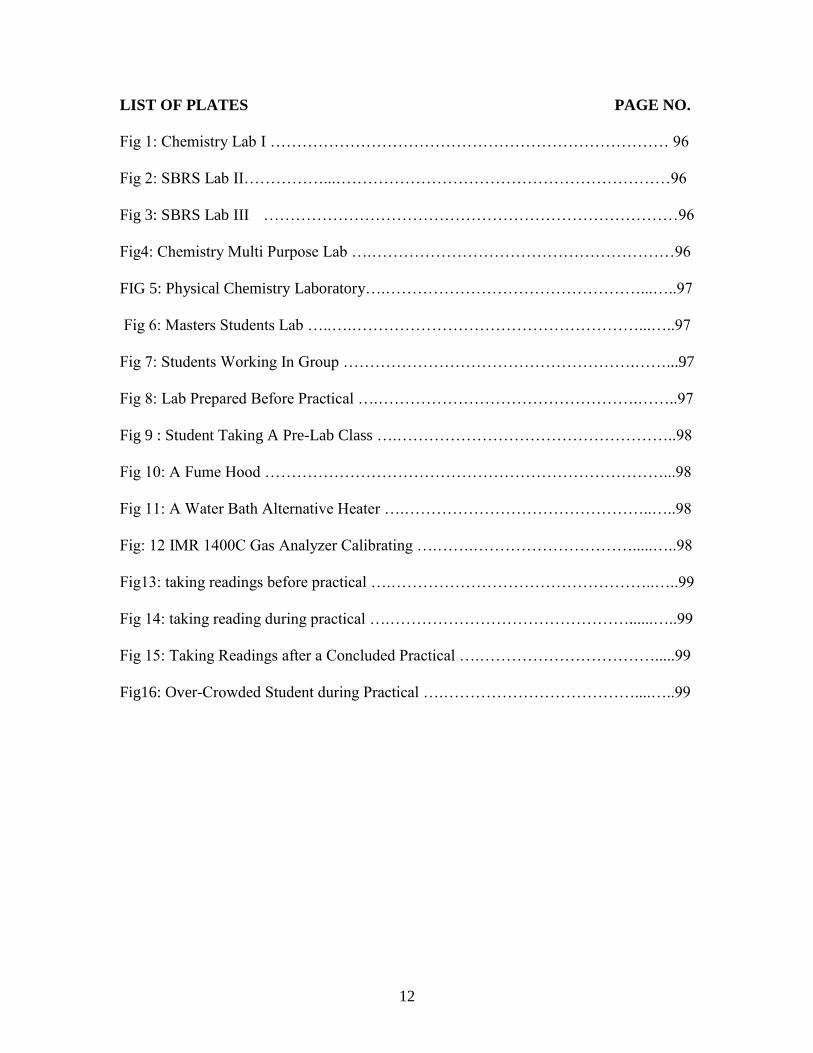
LIST OF PLATES PAGE NO.
Fig 1: Chemistry Lab I ………………………………………………………………… 96
Fig 2: SBRS Lab II……………...………………………………………………………96
Fig 3: SBRS Lab III ……………………………………………………………………96
Fig4: Chemistry Multi Purpose Lab ….…………………………………………………96
FIG 5: Physical Chemistry Laboratory….…………………………………………...…..97
Fig 6: Masters Students Lab …..….………………………………………………...…..97
Fig 7: Students Working In Group ……………………………………………….……...97
Fig 8: Lab Prepared Before Practical ….………………………………………….……..97
Fig 9 : Student Taking A Pre-Lab Class ….……………………………………………..98
Fig 10: A Fume Hood …………………………………………………………………...98
Fig 11: A Water Bath Alternative Heater ….………………………………………..…..98
Fig: 12 IMR 1400C Gas Analyzer Calibrating ….…….………………………….....…..98
Fig13: taking readings before practical ….…………………………………………..…..99
Fig 14: taking reading during practical ….………………………………………......…..99
Fig 15: Taking Readings after a Concluded Practical ….…………………………….....99
Fig16: Over-Crowded Student during Practical ….………………………………....…..99
13
LIST OF ABBREVIATIONS
ANSI - American National Standard Institute
ASHRAE –American Society of Heating, Refrigeration and Air Conditioning Engineers
COSHH- Control of Substance Hazardous To Health Regulations
CPSC- Costumer Product Safety Commission
EPA- Environmental Protection Agency
HVAC – Heating, Ventilation and Air Conditioning System
IAQ- Indoor Air Quality
MMWR- Morbidity and Mortality Weekly Report
NAAQS- National ambient Air Quality Standard
NFPA- National Fire Protection Association
NHMRC- National Health and Medical Research Council
SBRS- School of Basic and Remedial Studies
SPSS- Statistical Package for Social Sciences
WHO- World Health Organization

14
CHAPTER ONE
INTRODUCTION
1.1 BACKGROUND OF STUDY
Interests in the role of air quality in health and disease date back to antiquity.
Hippocrates in his treatise on “Airs, water and places” drew attention to the impact of
polluted air, among other transmission media, on disease burden. For centuries, the
emphasis on pollution associated air problems was mainly placed on outdoor air;
concerns about indoor air quality are fairly recent in comparison (David, 2010).
In the United Kingdom, indoor air quality awareness, as cited by Leslie (2000), was
stimulated by the introduction of the Clean Air Act of 1956. Indoor air quality is
influenced by factors such as building materials, paints, ventilation system, heating
system, carpeting, fabrics, volatile cleaning fluids, solvents, cooking, use of fossil fuel,
personal care products, household pets etc., all of which contribute to the mix of
biological and chemical aerosols in the air Outdoor air source also contribute to the
indoor air milieu (Olopade, 2010).
The National Health and Medical Research Council (NHMRC) (2009), defines indoor
air as air within a building occupied for at least one hour by people of varying states of
health. This can include the office, classroom, transport facility, shopping centre, hospital
and home. Indoor air quality can be defined as the totality of attributes of indoor air that
affect a person's health and well being.
Bioaerosols could be bacteria, viruses, fungi, algae, protozoa, house dust mites, scales
from shed human skin, pets and human. The growth and dispersion of the microbial
component is enhanced by the warm microclimate obtained in efficiently warmed

15
homes, offices and schools. Air-conditioning and ventilation systems can serve as
growth media for bacteria, viruses and moulds, as well as recycling module for dust,
fibers, and allergens (David, 2010).
Indoor air pollution refers to chemical, biological and physical contaminations of
indoor air. (NHMRC, 2009). It may result in adverse health effect. In developing
countries like Nigeria, the main source of indoor air pollution is biomass (e.g wood,
agricultural products) which contains suspended particulate matter like nitrogen oxide
(NO2), sulphur dioxide (SO2), carbon monoxide (CO) formaldehyde and polycyclic
aromatic hydrocarbons (PAHs). However in industrialized countries, in addition to NO2,
CO and formaldehyde, radon, asbestos, mercury, human-made mineral fibers, volatile
organic compounds, allergens, tobacco smoke, bacteria and viruses are the main
contributors to indoor air pollution. (David, 2010).
In the last several years, a growing body of scientific evidence has indicated that the
air within homes and other buildings can be more seriously polluted than the outdoor air
in even the largest and most industrialized cities. Other research indicates that people
spend approximately 90 percent of their time indoors. Thus, for many people, the risks to
health may be greater due to exposure to air pollution indoors than outdoors (Hodgson, et
al. 1986). Health effects from indoor air pollutants may be experienced soon after
exposure or, possibly, years later. Immediate effects may show up after a single exposure
or repeated exposures. These include irritation of the eyes, nose, and throat, headaches,
dizziness, and fatigue. Such immediate effects are usually short-term and treatable.
Sometimes the treatment is simply eliminating the person's exposure to the source of the
pollution, if it can be identified. Symptoms of some diseases, including asthma,

16
hypersensitivity pneumonitis, and humidifier fever, may also show up soon after
exposure to some indoor air pollutants.
The likelihood of immediate reactions to indoor air pollutants depends on several
factors. Age and preexisting medical conditions are two important influences. In other
cases, whether a person reacts to a pollutant depends on individual sensitivity, which
varies tremendously from person to person. Some people can become sensitized to
biological pollutants after repeated exposures, and it appears that some people can
become sensitized to chemical pollutants as well.
The World Health Organization estimates that indoor air pollution is responsible
for roughly 1.6 million deaths each year, from acute lower respiratory infections, chronic
obstructive pulmonary disease, lung cancer, and other diseases. Indoor pollution from
biomass contributes to about 2.6 percent of the global burden of disease, actually kills
more people every year than HIV and maybe even malaria, and yet nobody knows about
it. Thus, “if we can accomplish bringing sensitive or pay attention to this problem, and
use it to influence policy and help people who are poor and would otherwise have no
opportunity to have more efficient stoves, it will be very delighteful.” (Olopade, 2009).
The first-ever country-by-country estimates of the burden of disease due to indoor
air pollution highlight the heavy toll solid fuel use takes on the health and well-being of
people around the world. The countries most affected are Afghanistan, Angola, Benin,
Burkina Faso, Burundi, Cameroon, Chad, the Democratic Republic of the Congo, Eritrea,
Ethiopia, Madagascar, Malawi, Mali, Mauritania, Niger, Pakistan, Rwanda, Senegal,
Sierra Leone, Togo and Uganda. In 11 countries -- Afghanistan, Angola, Bangladesh,

17
Burkina Faso, China, the Democratic Republic of the Congo, Ethiopia, India, Nigeria,
Pakistan and the United Republic of Tanzania -- indoor air pollution is to blame for a
total of 1.2 million deaths a year. Globally, reliance on solid fuels is one of the 10 most
important threats to public health (Gold, 1992).
In an academic environment, laboratories happen to be a major place where
combustion activities are mostly carried out usually in carrying out experiments.
According to the Merriam-Webster, a laboratory was defined as „a room or building
equipped for scientific research, or teaching, or for the manufacture of drugs and
chemicals‟. From the definition it can be established that combustion is one of the basic
process in a laboratory. Thus the question now is: „how save is the indoor air quality of
such laboratories owing to the activities carried out in them?
1.2 STATEMENT OF RESEARCH PROBLEM
Exposure to indoor air pollution from solid fuels has been linked to many
diseases, the health threat posed by this fuel sources and biomass is generated mostly
when they are subjected to combustion. (Olopade, 2009). Combustion activities in the
laboratory produce gases such as; CO, CO2 NO2, and NO, which are poisonous to human
health. The maximum permissible concentration levels of the gases are stated in
ASHRAE Standard 62 and there are no records of existing empirical studies on the actual
concentration levels in the laboratories under study. The study therefore, seeks to
establish the presence and concentration levels of the pollutants in the laboratories due to
combustion activities. In line with this, the following research questions are formulated.

18
i) What is the HVAC status of the laboratories?
ii) Do combustion pollutants exist in the indoor air during combustion in the
laboratories and in what quantity?
iii) Do the combustion pollutant exist in quantities that exceed limits
prescribed by Standards (ASHRAE and NAAQS), for a healthy working
Indoor Air Quality?
iv) The influence of the existence of combustion pollutants on the indoor air
quality?
In answering these questions, some, of the issues relating the influence of combustion
generated pollutant on the indoor air quality of laboratories will be better understood.
1.3 SIGNIFICANCE OF THE STUDY
This research will be of importance to both the staff and students prone to the use of
laboratory because on completion, awareness will be created on the resultant effects of
the combustion activities within the laboratories on the indoor air quality. Thus, the
content of this research work also stands to be beneficial to government agencies like;
Control of Substance Hazardous To Health Regulations (COSHH), World Health
Organization (WHO) and other health organization in their ongoing campaign to create
awareness on the dangerous effects of poor indoor air quality (Olopade, 2010).
In like manner, it will draw the attention of the school authority with factual data on
the need for a healthier working environment for both staff and student.The research will
also help building designers to adhere to the criteria for Heating Ventilation and Air
Condition (HVAC) system in the design of buildings especially in the design of

19
laboratories and also emphasis the need for adequate maintenance of the HVAC system
in buildings.
1.4 AIM AND OBJECTIVES
1.4.1 Aim
The aim of this research is to assess the influence of combustion generated air pollutants
on the indoor air quality of laboratories
1.4.2 Objectives
The objectives are;
i. To study the concept and criteria for ventilations of buildings especially
laboratories
ii. Identify the HVAC system requirement for laboratories.
iii. Estimate the amount of combustion generated air pollutants in the selected
laboratories
iv. To assess the impact of the pollutants on the indoor air quality
v. To recommend measures for improving the indoor air quality in the
laboratories where such pollutants are present.
1.5 METHODOLOGY
In order to achieve the objective of the research work, the following research method
will be adopted:
a) Field Survey: a field survey of the laboratories guided by the use of a checklist
to establish if the laboratory HVAC provisions tallies with the requirement for

20
adequate ventilation for a workplace in accordance with the provisions of the
Control of Substances Hazardous to Health (COSHH) policy of 2002
b) Research Instrument: a well structured questionnaire will be employed and
administered to students and staff to ascertain their perception of the indoor
air quality in the laboratories. The sampling technique to be adopted in the
distribution of the question will be a random sampling technique giving both
staff and student using the laboratories equal opportunity to express their
perceptions
c) Experimentation: the use of an air combustion pollutants detector will be
employed to establish the presence of such pollutants as well as the
percentage existence within the interior.
The combustion pollutants of interest are carbon monoxide CO, nitrogen
dioxide NO2, Sulphur dioxide SO2, nitric oxide NO, formaldehyde HCHO
and carbon dioxide CO2 . The pollutants will be measured with the aid of
IMR 1400 gas analyzer.
The IMR 1400C gas analyzer will be used to measure the pollutant, it is a high
quality combustion gas analyzer using the latest sensor technology; is easy to
use and will measure all the important pollutants of interest in this research
work.

21
1.6 SCOPE AND LIMITATION
1.6.1 Scope
The scope of this research work is confined to the indoor air quality and not the
entire indoor environmental quality. Also the research focuses on just the air pollutants
generated from combustion activities and not to the entire indoor pollutants. The research
also studies only the effects of the combustion pollutants on the indoor air quality of
only some selected wet laboratories (laboratories in the Faculty of Sciences only).
Laboratories in other faculties are not in the study.
1.6.2 Limitation
The experimental value of this research is limited to the accuracy of the IMR
1400C gas analyzer adopted for the measurement of the combustion generated pollutants
in the laboratories. Also, the response of the targeted population will be based on their
perceptions on how the presence of the combustion pollutants appeals to their sense(s).

22
CHAPTER TWO
LITERATURE REVIEW
2.1 THE CONCEPT OF INDOOR AIR QUALITY AND A SCHOOL
ENVIRONMENT
Most people are aware that outdoor air pollution can impact their health, but
indoor air pollution can also have significant and harmful health effects. The U.S.
Environmental Protection Agency (EPA) studies of human exposure to air pollutants
indicate that indoor levels of pollutants may be two to five times and occasionally more
than 100 times higher than outdoor levels. These levels of indoor air pollutants are of
particular concern because most people spend about 90 percent of their time indoors. The
following are the attribute of a good indoor air quality (IAQ) management:
i. Control of airborne pollutants;
ii. Introduction and distribution of adequate outdoor air; and
iii. Maintenance of acceptable temperature and relative humidity.
Good Indoor Air Quality (IAQ) contributes to a favorable environment for students,
performance of teachers and staff, and a sense of comfort, health, and well-being. These
elements combine to assist a school in its core mission educating people (U.S.
Environmental Protection Agency, 2009)

23
2.1.1 Importance of a Good Indoor Air Quality
In recent years, comparative risk studies performed by EPA and its Science
Advisory Board (SAB) have consistently ranked indoor air pollution among the top five
environmental risks to public health (David, 2010). Good IAQ is an important component
of a healthy indoor environment, and can help schools reach their primary goal of
educating people. Failure to prevent or respond promptly to IAQ problems can:
a) Increase long and short-term health problems for students and staff (such as
cough, eye irritation, headache, allergic reactions, and, in raer cases, life-
threatening conditions such as Legionnaire‟s disease, or carbon monoxide
poisoning) can all be cause owing to exposure to combustion pollutants
b) Aggravate asthma and other respiratory illnesses. Nearly 1 in 13 people of school-
age has asthma, the leading cause of school absenteeism due to chronic illness.
There is substantial evidence that indoor environmental exposure to allergens,
such as dust mites, pests, and molds, plays a role in triggering asthma symptoms.
These allergens are common in schools. There is also evidence that exposure to
diesel exhaust from school buses and other vehicles exacerbates asthma and
allergies. These problems can:
i. Impact student attendance, comfort, and performance.
ii. Reduce teacher and staff performance.
iii. Accelerate the deterioration and reduce the efficiency of the school‟s physical
plant and equipment.
iv. Increase potential for school closings or relocation of occupants.

24
v. Strain relationships among school administration, parents, and staff.
vi. Create negative publicity.
vii. Impact community trust.
viii. Create liability problems.
Indoor air problems can be subtle and do not always produce easily recognized
impacts on health, well-being, or the physical plant. Symptoms, such as headache,
fatigue, shortness of breath, sinus congestion, coughing, sneezing, dizziness, nausea, and
irritation of the eye, nose, throat and skin, are not necessarily due to air quality
deficiencies, but may also be caused by other factors poor lighting, stress, noise, and
more. Due to varying sensitivities among school occupants, IAQ problems may affect a
group of people or just one individual. In addition, IAQ problems may affect people in
different ways (U.S. Environmental Protection Agency, 2009)
Individuals that may be particularly susceptible to effects of indoor air contaminants
include, but are not limited to, people with:
i. Asthma, allergies, or chemical sensitivities;
ii. Respiratory diseases;
iii. Suppressed immune systems (due to radiation, chemotherapy, or disease); and
iv. Contact lenses.
Certain groups of people may be particularly vulnerable to exposures of certain
pollutants or pollutants mixtures. For example:
25
i. People with heart disease may be more adversely affected by exposure to carbon
monoxide than healthy individuals. (Gold, 1992).
ii. People exposed to significant levels of nitrogen dioxide are at higher risk for
respiratory infections.
In addition, the developing bodies of people might be more susceptible to
environmental exposures than those of adults. People breathe more air, eat more food,
and drink more liquid in proportion to their body weight than adults. Therefore, air
quality in schools is of particular concern. Proper maintenance of indoor air is more than
a "quality" issue; it encompasses safety and stewardship of your investment in students,
staff, and facilities (U.S. Environmental Protection Agency, 2009)
2.1.2 Unique Aspects of Schools that Call for a Good Indoor Air Quality
Unlike other buildings, managing schools involves the combined responsibility
for public funds and child safety issues. These can instigate strong reactions from
concerned parents and the general community. Many of good Indoor Air Quality that is
unique to schools:
i. Occupants are close together, with the typical school having approximately four
times as many occupants as office buildings for the same amount of floor space.
ii. Budgets are tight, with maintenance often receiving the largest cut during budget
reductions.
iii. The presence of a variety of pollutants sources, including art and science
supplies, industrial and vocational arts, home economic classes, and gyms.

26
iv. A large number of heating, ventilating, and air-conditioning equipment place an
added strain on maintenance staff.
v. Concentrated diesel exhausts exposure due to school buses. (Students, staff, and
vehicles congregate at the same places at the same time of day, increasing
exposure to vehicle emissions.) Long, daily school bus rides may contribute to
elevated exposure to diesel exhaust for many students.
vi. As schools add space, the operation and maintenance of each addition are often
different.
vii. Schools sometimes use rooms, portable classrooms, or buildings that were not
originally designed to service the unique requirements of schools.
2.2 ASHRAE STANDARD 62 SPECIFICATION FOR INDOOR AIR
QUALITY
ASHRAE Standard 62 provides basic equipment and system requirements and
minimum ventilation rates which are expected to result in indoor air quality “acceptable”
to human occupants. The standard is based on the meaning and purpose of the various
provisions and its implementation is intended to help minimize adverse health effects. As
a “peer-generated and -reviewed” standard, it establishes the IAQ-related standard of care
for the design, construction, startup, operation, and maintenance of ventilation systems in
buildings.
27
2.2.1 Fundamentals of Good Indoor Air Quality
Acceptable indoor air quality (IAQ) is typically not achieved by addressing any
one specific building product, system, or procedure. Rather, it is the result of careful
attention to each of the following fundamental elements:
i. contaminant source control
ii. proper ventilation
iii. humidity management
iv. adequate filtration
Careful attention to each of these fundamentals during the design and construction of
the building and HVAC system, followed by proper operation and maintenance
throughout the life of the building, can significantly reduce the risk of IAQ-related
problems. (Samet, 1991).
2.2.2 Contaminant Source Control
Controlling the source of contaminants is fundamental to any IAQ strategy.
Today, microbial contamination, in the form of mold and mildew, is a major indoor
pollutant, but it certainly is not the only source. Indoor contamination can also be in the
form of particles or chemicals.
They may come from building occupants and their activities, be emitted from
furnishings and wall coverings, or be brought into the building with the intake air from
outdoors. Controlling these contaminants at the source is typically a much more cost-

28
effective strategy than filtering or diluting them once they are inside the
building.(Gergan, 1992).
2.2.4 Indoor Sources
Contamination can originate inside the building or be brought in from outdoors.
The most obvious indoor-generated contaminants are those created by the activities of the
building occupants, such as cooking, smoking, photocopying, laser printing, and other
processes.
To address controlling these types of indoor contaminants, ASHRAE Standard 62-2001
states:
“Contaminants from stationary local sources within the space shall be controlled by
collection and removal as close to the source as practical.” (Section 5.6).
“Removal close to the source” refers to local exhaust, but local exhaust is not always
possible, as in the case of volatile organic compounds (VOCs). VOCs are chemicals, such
as formaldehyde, that outgas slowly from manufactured construction materials,
furnishings, and cleaning products. All modern buildings contain VOCs. Low levels of
VOCs originate from many different locations within the building, making local exhaust
at the source difficult. In this situation, dilution with clean outdoor air is typically the
most practical and cost-effective solution (Francisco et‟el. 2010)
Microbial contamination (fungi and bacteria) can also be a major source of
indoor contamination. Microbiological colonies can grow in or on various building
elements and furnishings, including carpets, ceilings, sheetrock walls, and within the
HVAC system.When mold spores and other microbiological particles become airborne,
some building occupants may experience allergic reactions and other health-related

29
effects. Once the mold is established, the air-handling system can distribute the
contaminants and offensive odors throughout the building. Because of the variety of
potential indoor sources of microbial and fungal contamination, source control using
local exhaust also can be difficult.
What can be done to reduce the potential for microbial growth inside buildings?
Proper selection and specification of building materials and HVAC equipment are key
places to start. ASHRAE Standard 62-2001 cites three specific air-handling equipment
characteristics that significantly reduce the likelihood of the HVAC system becoming a
source of microbial contamination: sloped drain pans, cleanable interior surfaces, and
accessibility. ASHRAE Standard 62(2001)
2.3 INDOOR AIR POLLUTION
According to the US Environmental Protection Agency (EPA), indoor air
pollution is defined as, "Chemical, physical, or biological contaminants in indoor air."
While the EPA does not distinguish between types of indoor air pollutants, pollution may
be either short term or long term, and various pollutants cause a number of different
health effects. A number of pollutants can affect indoor air; some more common
pollutants include smoke, asbestos, fossil fuels, cleaning and hobby products, radon,
pesticides and even mold. In addition, outside pollutants may enter a home through
windows, doors, air conditioners and natural ventilation.
2.3.1 Categories of Indoor Air Pollutants
Although there are numerous indoor air pollutants that spread through the home,
the office, schools and other public structures, they typically fall into three basic

30
categories. Particles, gaseous and odor-causing pollutants, and biological contaminants
are the most common indoor air pollutants categories. It's within these that individual
contaminants are first identified and then classified. (Lipsett, 1992).
A Particles
The problem with indoor air pollutants is that most are invisible to the eye. This is
especially true in the case of particle pollutants. Because the eye detects only particles
that are about 30 microns in size, approximately 99 percent of indoor pollutants are
almost undetectable. These particles float about the air in which we live and breathe and
are stirred up by vacuuming, dusting and even walking. Common particle pollutants
include lint, dust, smoke and fibers.
B Gases
Gaseous air pollutants like carbon monoxide can be especially dangerous.
Typically, this type of contamination occurs from the process of combustion. Exposure to
these combustible gases can cause respiratory distress, long-term lung damage and, in
some cases, death. Pollutants sources that produce carbon monoxide include cooking
stoves and other heat sources that use gasoline, kerosene, oil, wood or charcoal. Other
types of gaseous pollutants include fumes from paint, adhesive, cleaning products and
pesticides (Lipsett, 1992).
C Biological
Biological contamination comes from most anything that is derived from living
tissue. Common types of biological pollutants are mold, dust mites, bacteria, pollen, pet
dander, cat saliva and cockroaches. Other things that have the potential to become
dangerous biological pollutants are dried urine from pests and rodents, human colds or
31
viruses and central air-conditioning systems that can breed mold and mildew. These latter
types of biological contaminants can easily become airborne and spread throughout an
entire building (Mudarri, 2007).
D Radon
Radon is another potentially lethal type of indoor air pollutant. Radon, which is a
naturally occurring element formed by the disintegration of radium, enters homes and
other buildings in a variety of ways such as through floor drains, other kinds of drains
and cracks in walls or foundations. According to the American Lung Association, radon
exposure is the second leading cause of lung cancer and may be responsible for thousands
of deaths from lung cancer in the United States each year (Lipsett, 1992).
2.3.2 Causes of Indoor Air Pollution
The following are some of the causes of indoor air pollution along with how they
originate and generated to appear in the forms pr categories identified above:
i. Radon: often found in the bedrock underneath a home and in building material
ii. Environmental tobacco smoke: the combination of smoke coming from the
burning end of a cigarette, pipe or cigar, as well as the smoke exhaled by the
smoker. (David, 2010).
iii. Biological contaminants: bacteria, mold, mildew, viruses, animal dander, dust
mites, cockroaches and pollen. Many of these grow in damp, warm environments
or are brought in from outside.
iv. Combustion: unvented gas space heaters, woodstoves, fireplaces and gas stoves
emit carbon monoxide, nitrogen dioxide and small particles. More than 3 billion

32
people worldwide continue to rely on solid fuels like wood and coal for their
energy needs ( World Health Organization).
v. Household products: paints, varnishes, hobby products and cleaning products all
contain organic chemicals that are released during use and storage
vi. Pesticides: 80 percent of most people's exposure to pesticides happens inside;
measurable levels of up to 12 pesticides have been detected in indoor air (source:
EPA).
The potential for harm from any of these pollutants depends partly on our
individual sensitivity. The elderly, the young and those with compromised immune
systems tend to be more susceptible. Ventilation also plays a role in how these pollutants
harm you. If fresh air frequently circulates throughout the area, the culprits won't have as
much time to accumulate and reach dangerous levels. Going back to the bathtub analogy,
ventilation is like slowly draining out the oily bathtub water and adding clean water in its
place: Eventually, the oil will become less and less of a problem. But if you keep the plug
in and do nothing, you're going to have one nasty bathtub ring. Unfortunately, many
newer, energy-efficient buildings are practically airtight they're like the plugged-up
bathtub.

33
2.4 HEALTH PROBLEM CAUSED BY COMBUSTION PRODUCTS
(STOVES, SPACE HEATERS, FURNACES, FIREPLACES AND BURSEN
BURNERS)
The following are some of the key symptoms that indicates that the indoor air quality
has being affected by combustion activity either within the interior or from the activities
outside the interior: (Olopade, 2009)
i. dizziness or headache
ii. confusion
iii. nausea/emesis
iv. fatigue
v. tachycardia
vi. eye and upper respiratory tract irritation
vii. wheezing/bronchial constriction
viii. persistent cough
ix. elevated blood carboxyhemoglobin levels
x. increased frequency of angina in persons with coronary heart disease
2.4.1 Diagnostic Leads of the Impact of Combustion on the Indoor Air Quality
i. What types of combustion equipment are present, including gas furnaces or water
heaters, stoves, unvented gas or kerosene space heaters, clothes dryers, fireplaces?
Are vented appliances properly vented to the outside?
ii. Are household members exhibiting influenza-like symptoms during the heating
season? Are they complaining of nausea, watery eyes, coughing, headaches?
iii. Is a gas oven or range used as a home heating source?

34
iv. Is the individual aware of odor when a heat source is in use?
v. Is heating equipment in disrepair or misused? When was it last professionally
inspected?
vi. Does structure have an attached or underground garage where motor vehicles may
idle?
vii. Is charcoal being burned indoors in a hibachi, grill, or fireplace?
2.5 BY-PRODUCTS OF COMBUSTION ACTIVITIES AND THEIR HELTH
IMPACT ON THE INDOOR AIR QUALITY
Aside from environmental tobacco smoke, the major combustion pollutants that
may be present at harmful levels in the home or workplace stem chiefly from
malfunctioning heating devices, or inappropriate, inefficient use of such devices.
Incidents are largely seasonal. Another source may be motor vehicle emissions due, for
example, to proximity to a garage (or a loading dock located near air intake vents).A
variety of particulates, acting as additional irritants or, in some cases, carcinogens, may
also be released in the course of combustion. Although faulty venting in office buildings
and other nonresidential structures has resulted in combustion product problems, most
cases involve the home or non-work-related consumer activity. Among possible sources
of contaminants: gas ranges that are malfunctioning or used as heat sources; improperly
fluid or vented fireplaces, furnaces, wood or coal stoves, gas water heaters and gas
clothes dryers; and unvented or otherwise improperly used kerosene or gas space heaters.
(HUD 2005)

35
The gaseous pollutants from combustion sources include some identified as
prominent atmospheric pollutants ; carbon monoxide (CO), nitrogen dioxide (NO2), and
sulfur dioxide (SO2) (Rogge et al, 1993).
2.5.1 Carbon Monoxide (CO)
Carbon-monoxide is an asphyxiant. Carbon monoxide is an odorless, colorless gas
that can cause illness, loss of consciousness, and even death. The most common
symptoms of CO poisoning are headache, dizziness, weakness, nausea, vomiting, chest
pain, and confusion. Unless suspected, CO poisoning can be difficult to diagnose because
the symptoms mimic other illnesses. People who are sleeping or intoxicated can die from
CO poisoning before ever experiencing symptoms. The toxic effects of carbon monoxide
are usually associated with acute exposure. However, low-level exposure to carbon
monoxide may produce long-term effects without producing the typical symptoms
associated with acute exposure (HUD 2005).
An accumulation of this odorless, colorless gas may result in a varied
constellation of symptoms deriving from the compound's affinity for and combination
with hemoglobin, forming carboxyhemoglobin (COHb) and disrupting oxygen transport.
The elderly, the fetus, and persons with cardiovascular and pulmonary diseases are
particularly sensitive to elevated CO levels. Methylene chloride, found in some common
household products, such as paint strippers, can be metabolized to form carbon monoxide
which combines with hemoglobin to form COHb. The following chart shows the
relationship between CO concentrations and COHb levels in blood.
Tissues with the highest oxygen needs -- myocardium, brain, and exercising muscle are
the first affected. Symptoms may mimic influenza and include fatigue, headache,

36
dizziness, nausea and vomiting, cognitive impairment, and tachycardia. Retinal
hemorrhage on funduscopic examination is an important diagnostic sign, but COHb must
be present before this finding can be made, and the diagnosis is not exclusive. Studies
involving controlled exposure have also shown that CO exposure shortens time to the
onset of angina in exercising individuals with ischemic heart disease and decreases
exercise tolerance in those with chronic obstructive pulmonary disease (COPD)
(Gergan,1992).
Note: Since CO poisoning can mimic influenza, the health care provider should be
suspicious when an entire family exhibits such symptoms at the start of the heating
season and symptoms persist with medical treatment and time.
Source: U.S. EPA ,1985
Fig 2.1: Relationship between carbon monoxide (CO) concentrations and
carboxyhemoglobin (COHb) levels in blood
Predicted COHb levels resulting from 1- and 8-hour exposures to carbon monoxide at
rest (10 l/min) and with light exercise (20 l/min) are based on the Coburn-Foster-Kane
equation using the following assumed parameters for nonsmoking adults: altitude = 0 ft;
initial COHb level = 0.5%; Haldane constant = 218; blood volume = 5.5 l; hemoglobin

37
level = 15 g/100ml; lung diffusivity = 30 ml/torr/min; endogenous rate = 0.007 ml/min.
Fig 2.1 gives the COHb level at various percentage with varying degree of exposure,
from the figure above four range of exposure have being indentified, however table 2.1
butresss the explanation by specifying the consequent health implication at various
percentage of COHB level in the body.
Table 2.1: Carboxyhemoglobin levels and related health effects
% COHb in
blood Effects Assocated with this COHb Level
80 Death
60 Loss of consciousness; death if exposure continues
40 Confusion; collapse on exercise
30 Headache; fatigue; impaired judgmental
7-20 Statistically significant decreased maximal oxygen consumption during
strenuous exercise in healthy young men
5-17
Statistically significant diminution of visual perception, manual dexterity,
ability to learn, or performance in complex sensor motor tasks (such as
driving)
5-5.5 Statistically significant decreased maximal oxygen consumption and
exercise time during strenuous exercise in young healthy men
Below 5 No statistically significant vigilance decrements after exposure to CO
2.9-4.5
Statistically significant decreased exercise capacity (i.e., shortened duration
of exercise before onset of pain) in patients with angina pectoris and
increased duration of angina attacks
2.3-4.3 Statistically significant decreased (about 3-7%) work time to exhaustion in
exercising healthy men
Source: U.S. EPA, 1985

38
2.5.2 Nitrogen dioxide (NO)
Nitrogen dioxide act mainly as irritants, affecting the mucosa of the eyes, nose,
throat, and respiratory tract.. Extremely high-dose exposure (as in a building fire) to NO2
may result in pulmonary edema and diffuse lung injury. Continued exposure to high NO2
levels can contribute to the development of acute or chronic bronchitis (Gold, 1992).
The relatively low water solubility of NO2 results in minimal mucous membrane
irritation of the upper airway. The principal site of toxicity is the lower respiratory tract.
Recent studies indicate that low-level NO2 exposure may cause increased bronchial
reactivity in some asthmatics, decreased lung function in patients with chronic
obstructive pulmonary disease, and an increased risk of respiratory infections, especially
in young people.
NO2 is a potential cause of respiratory disease. The NAAQS set by the U.S. EPA
enacted a primary outdoor standard for NO2 of 100 parts per billion (ppb) for a 1-hour
average (EPA 2010). It should be noted that the (National Ambient Air Quality Standard,
2011) is not intended for application to indoor air but is used as a comparative reference
level. The WHO guideline is 110 ppb for a 1-hour average, which applies to both indoor
and outdoor air (WHO 2000). Health Canada has residential indoor air quality guidelines
for a 24-hour average (50 ppb) and for a 1-hour average (250 ppb) (Health Canada 2011).
2.5.3 Sulphur oxides (SO, SO2)
Sulphur oxides are mainly generated during the combustion of fossil fuels. As far
as wood, (containing hardly any sulphur) is concerned; sulphur oxides do not play an
important part. Their occurrence is more important during the combustion of dung.

39
Sulphur, as a component of fuels, occurs primarily in coal, petrol, kerosine and diesel.
SO2 serves among more than 1000 air pollutants as the most important indicator for air
pollution. The existence of sulphur oxide in the air leads to irritations of the mucous
membranes and of the eyes, as well as to chronic bronchitis. Acute SO2-related bronchial
constriction may also occur in people with asthma or as a hypersensitivity reaction. The
high water solubility of SO2 causes it to be extremely irritating to the eyes and upper
respiratory tract, Concentrations above six parts per million produce mucous membrane
irritation. Epidemiologic studies indicate that chronic exposure to SO2 is associated with
increased respiratory symptoms and decrements in pulmonary function. Clinical studies
have found that some asthmatics respond with broncho constriction to even brief
exposure to S02 levels as low as 0.4 parts per million (Gold, 1992).
2.5.4 Formaldehyde
Formaldehyde has been classified as a probable human carcinogen by the EPA.
Urea-formaldehyde foam insulation (UFFI), one source of formaldehyde used in home
construction until the early 1980s, is now seldom installed, but formaldehyde-based
resins are components of finishes, plywood, paneling, fiberboard, and particleboard, all
widely employed in mobile and conventional home construction as building materials
(subflooring, paneling) and as components of furniture and cabinets, permanent press
fabric, draperies, and mattress ticking.
Airborne formaldehyde acts as an irritant to the conjunctiva and upper and lower
respiratory tract. Symptoms are temporary and, depend upon the level and length of
exposure may range from burning or tingling sensations in eyes, nose, and throat to chest
tightness and wheezing. Acute, severe reactions to formaldehyde vapor -- which has a

40
distinctive, pungent odor -- may be associated with hypersensitivity. It is estimated that
10 to 20 percent of the U.S. population, including asthmatics, may have hyperreactive
airways which may make them more susceptible to formaldehyde's effects
2.5.5 Particulate Substances
Many of the particles produced by unvented combustion appliances are ultrafine
particles (i.e., particle diameters of less than 100 nm). Ruiz et al. (2010) measured higher
ultrafine particle concentrations in homes with unvented combustion compared to those
with electric heaters.
Ultrafine particles have recently been linked to health effects such as oxidative damage to
DNA and mortality (Stölzel 2008; Knol et al. 2009; Vinzents et al. 2005). There are
currently no standards or guidelines on ultrafine particles.
2.6 SOME COMMON DISEASES RESULTING FROM POOR INDOOR AIR
QUALITY CONDITION
2.6.1 Tuberculosis
The transmission of airborne infectious diseases is increased where there is poor
indoor air quality. The rising incidence of tuberculosis is at least in part a problem
associated with crowding and inadequate ventilation. Evidence is increasing that
inadequate or inappropriately designed ventilation systems in health care settings or other
crowded conditions with high-risk populations can increase the risk of exposure
(American Lung Association, 1992).
The incidence of tuberculosis began to rise in the mid 1980s, after a steady
decline. The 1989 increase of 4.7 percent to a total of 23,495 cases in the United States

41
was the largest since national reporting of the disease began in 1953, and the number of
cases has continued to increase each year. Fresh air ventilation is an important factor in
contagion control. Such procedures as sputum induction and collection, bronchoscopy,
and aerosolized pentamidine treatments in persons who may be at risk for tuberculosis
(e.g., AIDS patients) should be carried out in negative air pressure areas, with air
exhausted directly to the outside and away from intake sources. Unfortunately, many
health care facilities are not so equipped. Properly installed and maintained ultraviolet
irradiation, particularly of upper air levels in an indoor area, is also a useful means of
disinfection (Zhang, 2005).
2.6.2 Legionnaires' Disease
A disease associated with indoor air contamination is Legionnaires „disease, a
pneumonia that primarily attacks exposed people over 50 years old, especially those who
are immunosuppressed, smoke, or abuse alcohol. Exposure to especially virulent strains
can also cause the disease in other susceptible populations. The case fatality rate is high,
ranging from five to 25 percent. Erythromycin is the most effective treatment. The agent,
Legionella pneumophila, has been found in association with cooling systems, whirlpool
baths, humidifiers, food market vegetable misters, and other sources, including residential
tap water. This bacterium or a closely related strain also causes a self-limited (two- to
five-day), flu-like illness without pneumonia, sometimes called Pontiac Fever, after a
1968 outbreak in that Michigan city (American Lung Association, 1990).

42
2.6.3 Allergic Reactions
A major concern associated with exposure to biological pollutants is allergic
reactions, which range from rhinitis, nasal congestion, conjunctival inflammation, and
urticaria to asthma. Notable triggers for these diseases are allergens derived from house
dust mites; other arthropods, including cockroaches; pets (cats, dogs, birds, rodents);
molds; and protein-containing furnishings, including feathers, kapok, etc. In occupational
settings, more unusual allergens (e.g., bacterial enzymes, algae) have caused asthma
epidemics. Probably most proteins of non-human origin can cause asthma in a subset of
any appropriately exposed population. (Zhang, 2005)
The role of mites as a source of house dust allergens has been known for 20 year. It is
now possible to measure mite allergens in the environment and Age antibody levels in
patients using readily available techniques and standardized protocols. Experts have
proposed provisional standards for levels of mite allergens in dust that lead to
sensitization and symptoms. A risk level where chronic exposure may cause sensitization
is 2µg Der pI (Dermatophagoides pteronysinus allergen I) per gram of dust (or 100 mites
/g or 0.6 mg guanine /g of dust). A risk level for acute asthma in mite-allergic individuals
is 10µg (Der pI) of the allergen per gram of dust (or 500 mites /g of dust).
2.6.4 Hypersensitivity Pneumonitis
Another class of hypersensitivity disease is hypersensitivity pneumonitis, which
may include humidifier fever. Hypersensitivity pneumonitis, also called allergic alveo-
litis, is a granulomatous interstitial lung disease caused by exposure to airborne antigens.
It may affect from one to five percent or more of a specialized population exposed to
appropriate antigens (e.g., farmers and farmers' lung, pigeon breeders and pigeon
43
breeders' disease). Continued antigen exposure may lead to end-stage pulmonary fibrosis.
Hypersensitivity pneumonitis is frequently misdiagnosed as pneumonia of infectious
etiology. The prevalence of hypersensitivity pneumonitis in the general population is
unknown (Gergan, 1992).
Outbreaks of hypersensitivity pneumonitis in office buildings have been traced to
air conditioning and humidification systems contaminated with bacteria and molds. In the
home, hypersensitivity pneumonitis is often caused by contaminated humidifiers or by
pigeon or pet bird antigens. The period of sensitization before a reaction occurs may be as
long as months or even years. An acute symptom, which occurs four to six hours post
exposure and recur on challenge with the offending agent, include cough, dyspnea, chills,
myalgia, fatigue, and high fever. Nodules and nonspecific infiltrates may be noted on
chest films. The white blood cell count is elevated, as is specific to the offending antigen.
Hypersensitivity pneumonitis generally responds to corticosteroids or cessation of
exposure (either keeping symptomatic people out of contaminated environments or
removing the offering agents. (Zhang, 2005)
2.6.5 Humidifier Fever
Humidifier fever is a disease of uncertain etiology. It shares symptoms with
hypersensitivity pneumonitis, but the high attack rate and short-term effects may indicate
that toxins (e.g., bacterial endotoxins) are involved. Onset occurs a few hours after
exposure. It is a flu-like illness marked by fever, headache, chills, myalgia, and malaise
but without prominent pulmonary symptoms. It normally subsides within 24 hours
without residual effects, and a physician is rarely consulted. Humidifier fever has been
related to exposure to amoebae, bacteria, and fungi found in humidifier reservoirs, air

44
conditioners, and aquaria. The attack rate within a workplace may be quite high,
sometimes exceeding 25 percent. (American Thoracic Society, 1990)
Bacterial and fungal organisms can be emitted from impeller (cool mist) and
ultrasonic humidifiers. Mesophilic fungi, thermophilic bacteria, and thermophilic
actinomycetes -- all of which are associated with development of allergic responses have
been isolated from humidifiers built into the forced-air heating system as well as separate
console units. Airborne concentrations of microorganisms are noted during operation and
might be quite high for individuals using ultrasonic or cool mist units. Drying and
chemical disinfection with bleach or 3% hydrogen peroxide solution are effective
remedial measures over a short period, but cannot be considered as reliable maintenance.
Only rigorous, daily, and end-of-season cleaning regimens, coupled with disinfection,
have been shown to be effective. Manual cleaning of contaminated reservoirs can cause
exposure to allergens and pathogens (Hine et‟al, 1993).
2.7 CONCEPT OF UNVENTED COMBUSTION AND ITS HEALTH IMPACT
Unvented combustion heaters use indoor air for combustion and vent the
combustion by-products directly into the room. They usually burn kerosene or natural
gas. Kerosene burning heaters are typically portable and can be moved around where and
when needed. When operated and maintained properly, these systems can be up to 98%
efficient, and introduce little indoor air pollution to the room. However, most building
scientists and indoor air quality professionals do not recommended ventless heaters in
homes where moisture problems exist, or where small people and elderly persons live or
where the heater is likely to be operated for more than 2 hours per day. Under NO
45
circumstances should you ever install vent less heaters in airtight houses, mobile homes,
or trailers (ANSI Z223.1-2006/NFPA 54-2009).
Occupant safety is a major concern when operating an unvented combustion
heater. Poorly made, maintained, or operated units have caused fires and other
combustion-related accidents. Improperly installed or malfunctioning vent less heaters
often introduce carbon monoxide (CO), nitrous oxides (NOx), sulfur dioxide (SO2), and
large amounts of water vapor, and possible consume most of the oxygen in a room.
Depending upon the level of exposure, these pollutants and the lack of oxygen can cause
eye irritation, headaches, dizziness, fatigue, respiratory problems, and possibly death
(MMWR, 1997).
Unvented combustion equipment may be found in almost any occupancy
classification, although some are more common than others. Unvented heaters are
permitted to be installed in most jurisdictions, but prohibitions or restrictions exist in
some locations. All state codes permit the installation of unvented cooking appliances
(ASHRAE, 2012).
The National Fuel Gas Code, ANSI Z223.1/NFPA 54 published jointly by the
National Fire Protection Association (NFPA) and the American Gas Association (AGA),
governs the installation of unvented gas-fired room heaters, but prohibits installation in
certain occupancies, which include residential board and care or health care (ANSI
Z223.1/NFPA 54-2009). The International Fuel Gas Code, published by the International
Code Council (ICC), also governs the installation of unvented gas-fired room heaters but
prohibits installation in assembly, educational, and institutional occupancies (ICC 2012).
NFPA 501, Standard on Manufactured Housing prohibits the installation of unvented
46
room heaters in manufactured housing as part of the construction code (NFPA 501-2010).
Once the manufactured home is sited, unvented gas-fired room heaters can be installed
where allowed by state and local code.
The Life Safety Code (NFPA 101-2012), allows gas-fired room heaters that are in
compliance with ANSI Z223.1/NFPA 54 but prohibits the use of unvented fuel-fired
heating equipment, including kerosene and denatured alcohol, from being used in
educational, day care, rooming/ lodging, hotel/dormitory, apartment, and health care
occupancies. Portable space heating devices are prohibited in detention/correctional
facilities.
Unvented combustion heaters, including propane and natural gas-fired heaters
listed to the Standard for Gas-Fired Room Heaters,Vol. II, Unvented Room Heaters
(ANSI Z21.11.2-2007), and kerosene heaters listed to the Standard for Unvented
Kerosene-Fired Room Heaters and Portable Heaters (UL 647-1993), are most
commonly found in residential occupancies.
Gas-fired room heaters, especially gas log types, are sometimes used in hotel/lodging
common areas and assembly occupancies, such as restaurants, for their aesthetic effect
ASHRAE (2012).)
In commercial building and storage occupancies the use of unvented combustion room
heaters is very rare, although not prohibited by NFPA 101 or the International Fuel Gas
Code (IFGC). Unvented infrared radiant heaters can be found in industrial occupancies,
such as aircraft hangers, repair garages, or similar large open spaces requiring localized
heating for the workers.

47
The Third National Health and Nutrition Examination Survey (NHANES III)
estimated that 13.7 million adults have at some time used an unvented combustion space
heater. Since 1992, use of unvented combustion heaters has increased because in many
states, regulations prohibiting the use of these devices have been rescinded (MMWR
1997).
About 170 people in the United States die every year from carbon monoxide (CO)
produced by non-automotive consumer products. These products include malfunctioning
fuel-burning appliances such as furnaces, gas ranges, water heaters, room heaters, engine-
powered equipment such as portable generators, solid-fuel burning fireplaces, and
charcoal that is burned in homes and other enclosed areas (CPSC 2011b). Since 1984 the
U.S. Consumer Product
Safety Commission (CPSC) staff has collected data on fatal CO poisonings and is not
aware of any documented incident associated with a gas-fired space heater complying
with ANSI Z21.11.2-1982, though such an incident was not precluded (Switzer 2005).
The installation and usage of these appliances have an impact on indoor air quality. When
improperly installed or maintained or misused the potential for harmful emissions being
released into the living space increases (ASHRAE, 2012).
2.8 UNVENTED COMBUSTION EQUIPMENT
The following are some of the unvented combustion equipment and the provision
of use by the ASHRAE Position Document on Unvented Combustion Devices and Indoor
Air Quality (2012)

48
2.8.1 Natural and Propane Gas-Fired Unvented Room and Hearth Heaters
Unvented gas-fired room heaters are designed for permanent installation to a gas
piping system and securely mounted in a fixed position. Various designs include room
heaters (e.g., infrared and blue-flame) and hearth heaters (e.g., gas logs and fireplaces).
These appliances can have single or multiple heating capacities. They can be either
thermostatically or manually controlled.
In the United States, the industry consensus product safety standard covering
unvented gas-fired unvented room heaters and hearth (fireplace) products is the American
National Standard for Gas-Fired Room Heaters, Volume II, Unvented Room Heaters,
ANSI Z21.11.2. Installation codes, such as the National Fuel Gas Code, require gas-fired
unvented space heaters to be listed to the Z21.11.2 standard. The Z21.11.2 standard
applies to newly produced room heaters for permanent connection to the building fuel
supply system. The scope of the standard limits the size and gas input rate to 40,000
Btu/h (11723 W), except for bedroom and bathroom installations, where the input rate
limitation is reduced to 10,000 and 6,000 Btu/h (2931W and 1758 W), respectively.
The Z21.11.2 standard requires these appliances to be equipped with a number of
safety devices including an oxygen depletion safety shutoff device (ODS) that is designed
to shut off the gas supply to the main burner when the oxygen level in the surrounding
atmosphere is reduced to not less than 18%. In addition, each certified heater design is
tested and evaluated for combustion and burner operating characteristics. Laboratory
combustion testing limits the emissions of CO to 0.02% air-free, and NO2 to 0.002% air-
free. In addition, a heater cannot produce CO in excess of 0.025% in a room with no air
49
changes occurring during combustion of the amount of gas necessary to reduce the
oxygen content of the room to 15.1% by volume.
2.8.2 Natural and Propane Gas-Fired Cooking Appliances
Gas-fired residential cooking equipment is inherently unvented. In some cases,
range hoods which are vented to the outside will partially serve the venting function, but
range hoods are installed primarily to vent emissions from the cooking process, e.g.,
smoke, grease, steam, and odors. For this reason, where they are required by code, they
are required for both electric and fuel-fired appliances. It should also be noted that many
range hoods do not vent to the outdoors, but are recirculating hoods which are primarily
intended to remove grease and other large particles from the airstream.
In the United States, the industry consensus product safety standard covering gas-
fired cooking appliances is the American National Standard for Household Cooking Gas
Appliances,
ANSI Z21.1-2010. National, state, and local codes, such as the National Fuel Gas Code
and the U.S. Manufactured Home Construction and Safety Standard, govern the proper
installation of these appliances.
ANSI Z21.1 standard requires that an appliance shall not produce a concentration
of CO in excess of 0.08 percent in an air-free sample of the flue gases when the appliance
is tested in a room having approximately a normal oxygen supply. ASHRAE Standard
62.2 (ASHRAE 2010) includes a requirement for local exhaust in the kitchen, which
should be operated whenever cooking appliances are used to assist in the removal of
smoke and effluents produced by the cooking process.

50
2.8.3 Natural and Propane Gas-Fired Unvented Heaters
A study by Francisco et al. (2010) measured indoor air concentrations in 30
homes that used unvented gas heaters manufactured since 1980. This study found that
20% of homes exceeded the EPA and WHO threshold for an 8-hour average CO level of
9 ppm, primarily when they were used for continuous, extended periods of time. This
usage pattern is contrary to industry recommendations, which state that unvented heaters
should be used as supplemental heaters, not primary heaters or for excessive periods of
time. The study also showed that 80% of units produced NO2 levels greater than the
WHO 1-hour levels. The same number of units also exceeded the EPA outdoor standard
1-hour reference level, though the sampling time of 3–4 days is less than the method of
test duration of 3 years required by the EPA standard. The EPA standard was not
intended for indoor spaces. ANSI Z21.11.2, which requires that appliances comply with a
maximum NO2 level, was based on a 300 ppb level that had been recommended by the
Consumer Products Safety Commission at the time. Francisco et al. found that 60% of
homes met the 300 ppb for a 1-hour average. (It should be noted that the 300 ppb
standard went into effects after most units in the study had been manufactured.)
Francisco et al. also found that regardless of unvented fireplace usage pattern, the
relative humidity rarely exceeded 50% in 30 homes tested in Central Illinois. Francisco et
al. commented that winter humidity levels in Central Illinois are low. Whitmyre and
Pandian (2004) used modeling to show that, given assumptions about usage and house
characteristics, unvented heating appliances did not produce enough moisture to result in
indoor relative humidity levels that promote mold growth in United States DOE Climate
Zones 2–5, and only in about 5% of cases in Climate Zone 1.

51
The potential for moisture concerns in a laboratory is complex. It depends on
sources, local ventilation, and temperature conditions at surfaces, etc. It also depends on
the time of year and the moisture- generating processes undertaken at those times of year.
Gas-fired cooking appliances may be used throughout the year, regardless of background
humidity levels. Gas-fired heating equipment will be used primarily in the winter, when
conditions are dry in many but not all locations.
All of these factors must be taken into account when assessing the potential for
any source, including unvented combustion, to promote moisture conditions of concern.
Hedrick and Krug (1995) measured emissions from unvented gas-fired space heaters that
used different heat transfer technologies. The different device types are intended to
reduce emission rates of one pollutants or another. A blue-flame heater allows the
combustion process to continue to its natural completion. This results in low CO
emissions but the combustion process‟s extended time at high temperature increases NO
and NO2 emissions. A radiant tile heater and a perforated tube heater both impinge the
flame onto surfaces, quenching the combustion. The quenching terminates the production
of NO2, but it also terminates the formation of CO2, resulting in increased CO emissions
relative to the blue-flame heater. A fan-forced heater requires an electrical connection,
which the others do not, but the fan allows the designers to better control the combustion
and reduce emissions. This unit had low emissions of all contaminants, but the unit tested
was only available in Japan, where use of unvented heaters is common.
2.9 VENTILATION CONSIDERATIONS
In addition to fuel, the operation of any combustion system requires the provision
of oxygen and the removal of products of combustion. At a basic level, these processes

52
are required simply to allow combustion to occur. For an unvented combustion appliance,
the provision of oxygen occurs by drawing in room air to the combustion zone, and the
products of combustion are dispersed into the room. Over time, without providing
adequate make-up, combustion, and ventilation air, the oxygen in the room is consumed
and the concentration drops, while products of combustion accumulate with
concentrations increasing. The result is decreasing indoor air quality (Bergmann, 2006).
Ventilation of the room is one means by which this decrease in indoor air quality
can be controlled. Ventilation of the room provides outdoor air, including oxygen, to
replace the oxygen that is consumed. Additionally, ventilation removes air from the
space, including the products of combustion. The indoor air quality in a space containing
an unvented combustion appliance is thus determined by two primary factors: pollutants
emission rates and the ventilation rate. Emission rates are the time-averaged amount of
fuel combustion (fuel input rate × fractional on-time) multiplied by the individual
emission factors for the specific contaminants. Volume of the space is a secondary factor
which affects the indoor air quality level for dynamic (non-steady state) processes, which
includes most real world applications of the factors that affect indoor air quality, in
general, only two are under the control of the user. The on-time of the appliance is
controlled by the user, either directly or through the setting of a thermostatic control. The
ventilation rate is also controllable, in some circumstances and to some extent, by the
user. This control might be through window opening, or through ensuring that a primary
ventilation system is operating. Excessive appliance operation will increase the amount of
contaminants in the space, degrading the air quality. Provision of adequate ventilation
53
will provide air for proper combustion, remove contaminants, and improve air quality
(Bergmann, 2006).
A key component of high quality installation is ensuring that a space has adequate
ventilation and make-up air. If the provision of adequate ventilation is dependent on the
operation of fans, windows, or doors, etc., then it is critical that the user has access to
these and understands their proper use. Failure to provide adequate ventilation can result
in elevated contaminant concentrations and increase the risk of poor indoor air quality,
health impacts, water condensation, and other adverse consequences.
ASHRAE standard 62-1989 describes the Ventilation recommendations as 15 - 20
CFM (cubic feet per minute) per person in offices or classrooms. I.e.) 20 people in a 750
sq. ft. classroom with 10 ft. ceilings = Room is 7,500 cubic feet 20 people x 15 CFM =
300 CFM/ room or 300 x 60 for (1hr) = 18,000 CF/H – 18,000 / 7,500 = 2.4 air
exchanges per hour
(This is the minimum required) 7,500 cubic feet / 300 CFM = 25 people max can occupy
the room
The recommendations for bus garages are 1.5 CFM per square foot of floor area.
This means that a 2,100 square foot of floor area should have an air system capable of
moving air at a rate of 3,150 CFM. (2,100 x 1.5) ASHRAE also notes that in a bus
garage, distribution among people must consider worker location and concentration of
running engines and that stands where engines are run must incorporate systems for
positive engine exhaust withdrawal.
54
2.10 ASHRAE PROVISION FOR THE DESIGN OF THE HVAC SYSTEM OF
A LABORATORY
Heating, Ventilation, and Air-Conditioning Systems for Research Laboratories and
Animal Facilities: Heating, ventilation, and air-conditioning (HVAC) systems for
Research Laboratories shall be designed to maintain the space temperature and humidity
at the required set point. These systems shall automatically adjust, as necessary, to
respond to varying space cooling demands in laboratories and animal facilities. Air-
change rates, temperature and humidity shall be closely monitored and controlled on a
continuous basis. The System shall provide adequate ventilation to remove fumes, odors,
airborne contaminants, and to safely operate fume hoods continuously. They shall be
designed to maintain relative pressure differentials between spaces to prevent of cross
contamination. Space background noise, generated by HVAC systems, shall be
maintained within the levels prescribed within this document. HVAC systems shall be
reliable, redundant and operate without interruption while being efficient to operate, both
in terms of energy consumption and from a maintenance perspective.
2.10.1 Laboratory Ventilation Rates:
Ventilation rate, for research laboratories, is typically driven by three factors: fume
hood demand, cooling loads, and removal of fumes and odors from the laboratory work
area. The minimum outdoor air ventilation rate for laboratory space is 6 air-changes per
hour, regardless of space cooling load. This minimum ventilation rate shall be
maintained at all times. Some laboratories may require significantly higher ventilation
rates to support fume hood demand or to cool dissipated heat from laboratory instruments
and equipment.

55
Air Filtration – Air handling units to serve laboratory spaces shall be provided with
filters up-stream the supply air fans. These filters shall be 30% efficient pre-filters and
95% efficient after-filters. HEPA final filtration shall be provided in AHU to serve
special laboratories where research materials are particularly susceptible to contamination
from external sources. HEPA filtration of the supply air shall only be considered
necessary for critical applications. It is preferred that BSCs, which include HEPA
filtration, be used rather than providing HEPA filtration for the entire room. The A/E
shall confirm with NIH/DTR and NIH/DOHS for the need of HEPA filtration in
laboratories.
a) Air Distribution:
Laboratory spaces shall be designed with special attention to air quality, room
acoustics, supply air temperature, supply air humidity, airflow quantities, air velocity, and
air diffusion and distribution within the space. In addition, space air distribution shall
meet the following requirements:
i) Distribution shall prevent cross contamination between individual spaces, air shall
flow from areas of least contamination to areas of higher contamination potential, i.e.,
from "clean" to "dirty" areas.
ii) Air supply devices shall be located at ceiling level or close to ceiling level if
located on sidewalls. Air distribution and diffusion devices shall be selected to minimize
temperature gradients and air turbulence.
iii) Supply air devices shall be located away from fume hoods and BSC.
iv) Large quantities of supply air can best be delivered through perforated plate air
56
outlets or diffusers designed for large air volumes.
v) Space temperature and humidity shall be consistent in each individual room.
Space temperature shall be monitored in each individual room
vi) Each lab space shall be provided with dedicated temperature controls. This shall
include the used of dedicated air-terminal units for the supply air and the exhaust air.
b) Relative Room Pressurization:
Laboratories shall be designed and air balanced so that air flows into the
laboratory from adjacent (clean) spaces such as: offices, corridors, and non-laboratory
spaces. The control of airflow direction, within research laboratory spaces, helps reduce
the spread of odors, toxic chemicals, and air-borne contaminants as well as protect
personnel from toxic and hazardous substances, and protect the integrity of experiments.
In these facilities, the use of the once-through air-flow principle is based on:
i. Use of 100% outdoor air to provide all the room air to be exhausted through
laboratory spaces and laboratory containment equipment;
ii. Size the exhaust air system to handle the simultaneous operation of all laboratory
spaces and all laboratory containment equipment, and
iii. Directing air flow from low hazard areas to high hazard areas at all times. Air
supplied to the corridor and adjacent clean spaces shall be exhausted through the
laboratory to achieve effective negative pressurization. Construction Documents
shall include a complete start-up and commissioning plan including procedures

57
that address indoor air quality requirements.
Laboratory spaces shall remain at a negative air pressure in relation to corridors
and other non-laboratory spaces. Typically, these systems are designed to maintain 47
L/s (100 cfm) air flow from the corridor into each lab module. Administration areas in
laboratory buildings shall always be positive with respect to corridors and laboratories.
Supply air distribution for corridors shall be sized to offset transfer air to laboratories
while maintaining an overall positive building pressure.
Amount of supply air flow to laboratory spaces is to meet the cooling loads
requirements as well as the exhaust air requirements. Typically, the exhaust airflow
requirements would exceed the cooling loads requirements. In these situations, the
supply air flow would need to be increased to make up the difference between the cooling
air flow and the required exhaust air flow. In cases where the cooling load airflow
requirements exceed the required exhaust air rate requirements, supplemental cooling
units may be required.
c) Laboratory Equipment Cooling Loads:
The central HVAC system shall provide, as a minimum, a cooling capacity for
1,892 W (6,455 BTUH) (sensible heat) for laboratory equipment in a typical 22 m2 (237
ft2) laboratory module or cooling for the actual calculated load, whichever is greater.
The A/E shall make a detailed and complete inventory of all laboratory equipment
scheduled for installation in each space and determine the projected equipment load
requirement using estimated utilization factors. Equipment utilization factors shall be
indicated in the Basis of Design report. The A/E shall evaluate the following rooms used

58
for laboratory support, often having higher than normal cooling loads, as well as evaluate
the use of supplemental cooling units to remove excessive sensible loads affecting these
areas, while maintaining minimum ventilation requirements:
i. Common equipment rooms.
ii. Autoclave rooms.
iii. “Clean” and “dirty” cage wash rooms.
iv. Glassware washing rooms.
v. Darkrooms.
vi. Special function rooms.
vii. Electron microscope.
2.11 HVAC SYSTEMS AS A TOOL IN CONTROLLING INDOOR AIR
QUALITY
The impact of Heating Ventilation and Air Conditioning system on the indoor air
quality has being a controversial issue; however several researches have being conducted
in this aspect, example of such research include. Samfield(1996), reviewed several
literatures on the impact of HVAC system as a tool in controlling Indoor Air quality. The
study review covered 60 references within these years 1988 through 1993. The result of
the review shows that although significant progress has been made in reducing the energy
consumption of HVAC systems, the role of HVAC systems in affecting indoor air

59
pollution is not fully understood. It is apparent that the HVAC systems themselves very
often contribute to the indoor air pollution problem because:
a) Maintenance of the system is poor,
b) The design limitations of the building and the HVAC system have gradually, over
time, been exceeded either through overcrowding or the introduction of new, pollution-
generating sources within the building, and
c) The outdoor air intakes are located near ambient pollution sources. IAQ problems
frequently manifest themselves through Sick Building Syndrome or Building Related
Illness (SBS or BRI). These can cause a loss in employee productivity.
Samfield (1996) also recognized that failure to pay attention to IAQ problems may
result in expensive litigation. The National Institute of Occupational Safety and Health
(NIOSH) in a recent survey determined that in over 50% of the cases where IAQ
problems existed, poor and inadequate ventilation was the problem. In cases where
pollutants emanate from soil gases (e.g., radon), the installation and operation of an
HVAC system can alter the IAQ. Since the entry of soil gas is, to a large extent,
dependent on the pressure differential between the soil and the structure, HVAC system
operation can have a significant effect. Before an HVAC system is designed and
installed, all operations in the building should be thoroughly examined with regard to
potential pollution sources and a determination should be made whether local exhaust
systems (such as hoods) need to be installed at the pollution source. Proper installation of
local exhaust systems may significantly reduce the need for general ventilation.
Two primary types of HVAC systems are in use:
a) constant air volume systems
60
b) Variable air volume (VAV) systems. VAV systems compensate for variations in
heating or cooling load by regulating the volume of air supplied to each zone. Energy
conservation as well as improved controls and equipment have made VAV an
increasingly popular option.
Samfield (1996), also revealed that, The American Society of Heating, Refrigerating
and Air-Conditioning Engineers (ASHRAE) has revised Standard 62-1981, replacing it
with Standard 62-1989. The revised standard now includes an updated and revised IAQ
procedure for which a model has been developed, and equations for calculating the
amount of recirculation needed.
2.12 INDOOR AIR POLLUTION FROM FUEL COMBUSTION
The concept of indoor air pollution has being a contemporary one, which have
stirred up so many research with the general aim of emphasizing the health impact of a
poor indoor air and the identification of the major pollutants of the indoor air. Some of
these researches include:
Saravanan (2004), studies generally the indoor air pollution, from the result of the
research, it was established that the major factors that determine the indoor air quality
are:
i) The nature of outdoor air quality around the building
ii) The ventilation rate with the building
iii) The materials used in the construction of the building ( presence of chemicals)
iv) The activities that go on inside the interior ( cleaning cooking, heating eyc)
v) The use of household chemicals
61
Saravana identified some of the pollutants sources as ; radio activity ( the emissions from
uranium in the soil or rocks on which the houses are built, Voltaic Organic
Compounds(VOC) usually from aliphatic and aromatic compound, chlorinated
compounds with formaldehyde being in many location. The emphasis of the sources of
indoor air pollutants was on the indoor combustion activities. Combustion of fuels such
as oil, gas, kerosene, etc inside a building contributes to the concentration of VOCs and it
is also a source of stable inorganic gases. The common indoor pollutants due to
combustion of fuels are particulate matter, oxides of nitrogen, oxides of sulphur, carbon
monoxide, hydrocarbons and other odor causing chemicals. Saravana concluded by
opining that Indoor air pollution is one of the major problems that we have to solve since
we spend a large part of our life indoors. We should take all necessary precautions to
eliminate or minimize the harmful effects of indoor air pollution.
Smith and Zhang (2005) studies the studied the indoor air pollution form
household fuel combustion, the result of the finding estimated that that air pollution from
solid waste in China is responsible for 420,000 premature death annually with more than
300,000 attributed to the urban outdoor. To help elucidate more fully the extent of hazard
caused by combustion pollutants in China, Smith and Zhang (2005) review nearly 200
publications in china reporting health effect, emission characteristic and/or indoor
concentration associated with solid fuel as well as taking measurement in 122 individual
studies. Based on the measurement, Smith and Zhang were able to summarize that indoor
concentration exceeding health-based standards in many of the house-holds.
In like manner Stanley (2010) assessed the environmental sustainability of electric
power generators for power supply to building with view to devising appropriate control

62
measure for cleaner environment. The assessment was for buildings within Kaduna
metropolis and the approach adopted was both with the use of a well structured
questionnaire and the use of the IMR 1400C combustion gas analyzer. The result of the
research showed that the level of awareness of hazard by generator was high but the level
complains by neighbor was quite low. The research also revealed that the mean
concentration of SO2 and NOx indoor were higher and even hiher than the FEPA limits
(0.01ppm and 0.04-0.06ppm). Also the research revealed that none of the ambient
pollutants at the point source met the WHO and FEPA limits.
The above researches itemize the contribution of various researchers in the
evaluation of the impact of combustion activities on the indoor air quality and as well as
the indoor environmental condition. And at this point it can be seen that combustion is a
major source of pollutants generation in the environment. Thus, this research work seeks
to evaluate the impact of the combustion activities in the laboratories on the indoor air
quality of the laboratories.
2.13 HVAC REQUIREMENT FOR A LABORATORY
Several write ups have being done with regards to the HVAC requirement for a
laboratory; the emphases were on the energy usage common to laboratories as well as the
comfort requirement. According to Lindsay (2010), An HVAC engineer‟s prime
concern when planning or constructing any laboratory building is the safety of the
building‟s occupants. The system must operate to specification and meet appropriate
regulations. To this end, many older laboratories were designed with little regard to
energy efficiency. That‟s no longer true, and designers must account for operating costs
as well as functionality.

63
A typical laboratory building consumes five to ten times more energy than a
typical office building or school. HVAC systems consume almost 70% of a laboratory‟s
energy, according to Labs21, a voluntary partnership program dedicated to improving the
environmental performance of U.S. laboratories. The majority of this HVAC energy
consumption originates from cooling (22%) and ventilation (44%) loads that help the
laboratory function safely (Lindsay, 2010).
The high energy use can be attributed to high outside air requirements, large
internal heat gains from laboratory equipment, and, in many cases, continuous hours of
operation, ( Knol etal, 2009). With a push toward a more energy-efficient laboratory
environment, vendors are developing new technologies or adapting older ones to help
reduce HVAC energy consumption. Lindsay‟s emphasizes was more in the line with
HVAC requirement for laboratories as energy saving measure and not on the adequacy of
indoor air quality for laboratories.
Several standards have specified their requirement in ensuring adequate indoor air
quality especially in the aspect of air circulation and fume hood usage. These standards
were published in the „Laboratory Standard and Guidelines‟ (2002) comprising of various
Standards and their specification for adequate indoor air quality within the laboratory.
The various requirements are given in the Table 2.3;

64
Table 2.2: Standards on the use of Fume hoods
S/N STANDARD REQUIREMENT
1 NEPA45 i) Section 6.4.6 stipulates that Laboratory hood face
velocities and exhaust volumes shall sufficient to
contain contaminants generated within the hood
outside of the laboratory building. The hood shall
provide containment of the possible hazards and
protection for personnel at all times when chemical
are present in the hood‟
ii) Section .6.4.6 stipulates that fume hood containment
can be evaluated using the procedures contained in the
ASHRAE 11, „method of testing performance of
laboratory fume hoods‟. Face velocity of 0.4m/sec
(80ft/min to 10ft/min) generally provide containment
if the hood location requirements and laboratory
ventilation criteria of this standard are met‟
2 ANSI/AIHA i) Section 5.7 each hood shall maintain an average face
velocity of 80-120fpm with no face velocity
measurement more than plus or minus 20% of the
average
ii) „adequate laboratory fume hoods, special purpose
hoods, or other controls shall be used when there is a
likelihood of employee overexposure to air
contaminants generated by a laboratory activity
3 Federal Register-
OSHA
i) Each fume hood should have a continuo monitoring
device to allow convenient confirmation of adequate
hood performance before use
ii) For a prudent practice, it should be ensured that a
continuous monitoring device to allow convenient
confirmation of adequate hood performance before
use
iii) „leave the hood „on‟ when it is not in active use if
toxic substances are stored in it or if it is uncertain
whether adequate general laboratory ventilation will
be maintained when it is „off‟
4 SEFA 1.2
i) Section 5. 2 „A fume hood velocity of 100fpm is
considered acceptable in standard practice. In certain
situation face velocity of up to 125fpm or as low as
75fpm may be acceptable to meet required capture
velocity of the fume hood „
Source: laboratory Standard and Guideline ,2002
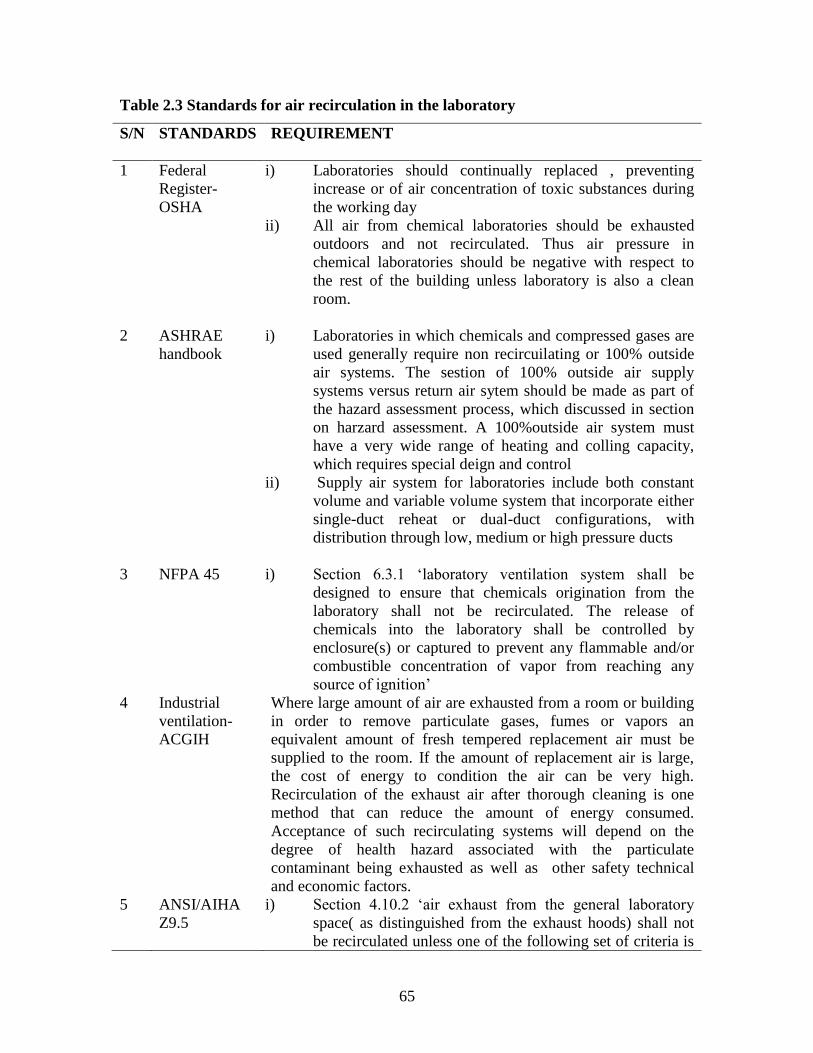
65
Table 2.3 Standards for air recirculation in the laboratory
S/N STANDARDS REQUIREMENT
1 Federal
Register-
OSHA
i) Laboratories should continually replaced , preventing
increase or of air concentration of toxic substances during
the working day
ii) All air from chemical laboratories should be exhausted
outdoors and not recirculated. Thus air pressure in
chemical laboratories should be negative with respect to
the rest of the building unless laboratory is also a clean
room.
2 ASHRAE
handbook
i) Laboratories in which chemicals and compressed gases are
used generally require non recircuilating or 100% outside
air systems. The sestion of 100% outside air supply
systems versus return air sytem should be made as part of
the hazard assessment process, which discussed in section
on harzard assessment. A 100%outside air system must
have a very wide range of heating and colling capacity,
which requires special deign and control
ii) Supply air system for laboratories include both constant
volume and variable volume system that incorporate either
single-duct reheat or dual-duct configurations, with
distribution through low, medium or high pressure ducts
3 NFPA 45 i) Section 6.3.1 „laboratory ventilation system shall be
designed to ensure that chemicals origination from the
laboratory shall not be recirculated. The release of
chemicals into the laboratory shall be controlled by
enclosure(s) or captured to prevent any flammable and/or
combustible concentration of vapor from reaching any
source of ignition‟
4 Industrial
ventilation-
ACGIH
Where large amount of air are exhausted from a room or building
in order to remove particulate gases, fumes or vapors an
equivalent amount of fresh tempered replacement air must be
supplied to the room. If the amount of replacement air is large,
the cost of energy to condition the air can be very high.
Recirculation of the exhaust air after thorough cleaning is one
method that can reduce the amount of energy consumed.
Acceptance of such recirculating systems will depend on the
degree of health hazard associated with the particulate
contaminant being exhausted as well as other safety technical
and economic factors.
5 ANSI/AIHA
Z9.5
i) Section 4.10.2 „air exhaust from the general laboratory
space( as distinguished from the exhaust hoods) shall not
be recirculated unless one of the following set of criteria is
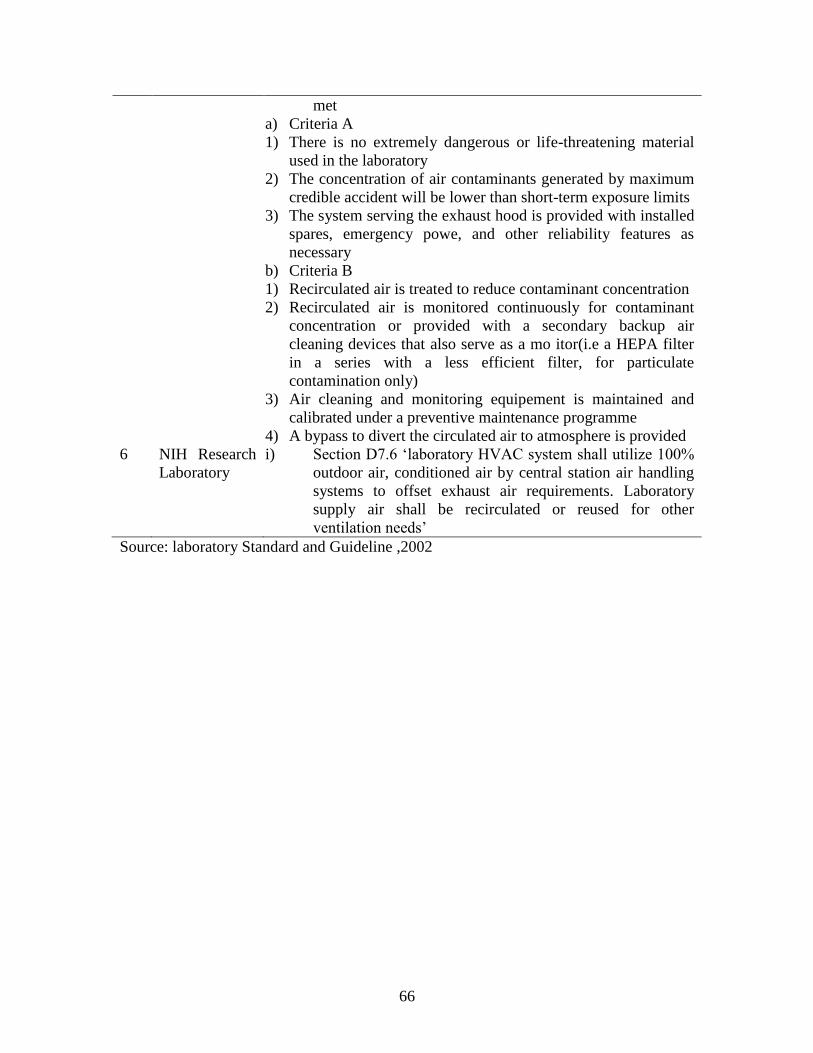
66
met
a) Criteria A
1) There is no extremely dangerous or life-threatening material
used in the laboratory
2) The concentration of air contaminants generated by maximum
credible accident will be lower than short-term exposure limits
3) The system serving the exhaust hood is provided with installed
spares, emergency powe, and other reliability features as
necessary
b) Criteria B
1) Recirculated air is treated to reduce contaminant concentration
2) Recirculated air is monitored continuously for contaminant
concentration or provided with a secondary backup air
cleaning devices that also serve as a mo itor(i.e a HEPA filter
in a series with a less efficient filter, for particulate
contamination only)
3) Air cleaning and monitoring equipement is maintained and
calibrated under a preventive maintenance programme
4) A bypass to divert the circulated air to atmosphere is provided
6 NIH Research
Laboratory
i) Section D7.6 „laboratory HVAC system shall utilize 100%
outdoor air, conditioned air by central station air handling
systems to offset exhaust air requirements. Laboratory
supply air shall be recirculated or reused for other
ventilation needs‟
Source: laboratory Standard and Guideline ,2002
67
CHAPTER THREE
RESEARCH METHODS
The research was pursued through field work involving experimentation and
perception survey. The experimentation entails the use of equipment (a combustion gas
analyzer) to measure quantities of combustion pollutants in the indoor air of selected
laboratories. The perception survey entails the use of structured questionnaire to access
the view of users of the laboratories on the indoor air quality of the laboratories where
combustion takes place. Both the experimentation and perception survey were based on
an in-depth knowledge of the subject area obtained through literature review.
3.1 SELECTION OF LABORATORIES FOR THE STUDY
This study was undertaken in order to establish the effects of combustion pollutants
on the indoor air quality of laboratories, thus the laboratories in the Department of
Chemistry Ahmadu Bello University were adopted for this purpose. The Department of
Chemistry is known for its large number of laboratories of varying capacities and
purposes ranging from teaching to research purposes. These laboratories also have
varying number of Student and teachers using them at the same time. Among the
laboratories of the Departments are:
i) Organic laboratory ( with a capacity of about ten students)
ii) The main teaching laboratory ( with a capacity of over a hundred students per
sitting)
iii) Inorganic laboratory

68
iv) The Master Student laboratory ( with a capacity of about fifty students and two
staff )
v) The Multi-user laboratories ( with a capacity over a hundred students and six
staff)
vi) The School of Basic (SBRS) lab also used by 100level students in the faculty
vii) Physical Chemistry Laboratories (PCL)
However, not all the above itemized laboratories entail chemical processes requiring
combustion activities. The inorganic laboratory for example houses process that does not
require combustion; others however have sufficient combustion activities going on in the
laboratories as the chemical processes are being organized. Thus, for the purpose of this
research work all the above listed laboratories will be studied with the exception of the
organic laboratory.

69
3.2 THE EXPERIMENTAL WORK
The experimental work entails the use of a gas analyzer for the measuring the
combustion pollutant generated in the laboratories under consideration. This section
describes the mode of measurement, the unit of the measurement, a description of gas
analyzer employed for this purpose, the measurement process/procedure, and the
precautions ensured. Hence below is the description of the experimental approach:
3.2.1 Mode of Measurement
The measurement of the combustion generated pollutants was done with the help
of a sensitive gas analyzers, the “IMR 1400C” in order to establish the presence and
amount of the combustion pollutants present in the air during the combustion processes.
The processes of measurement involve:
3.2.1 Description of IMR 1400C Gas Analyzer
The IMR 1400C gas analyzer is a state of the art combustion gas analyzer. It measure
and calculates the amount of the following;
i) oxygen (O2)
ii) carbon monoxide (CO)
iii) Carbon dioxide (CO2)
iv) Oxides of Nitrogen (NOx)
v) Sulfur dioxide (SO2)

70
Source: IMR Environmental Equipment, Inc.,2012)
Fig 3.1 The IMR 1400C Combustion Gas analyzer
The IMR 1400 has the following technical data that expresses its resolution as well as its
degree of accuracy for each gas it measures as given the Table 3.1

71
Table 3.1: Technical Data of IMR 1400 Gas Analyzer
S/
N
PARAMETER PRINCIPL
E
RESOLUTIO
N
ACCURAC
Y
RANGE
1 O2 Oxygen Electro-
chemical
0.1 Vol.% ± 0.2 % 0-20.9Vol.
%
2 CO Carbon monoxide Electro-
chemical
1 ppm Z 0-2,000 ppm
3 CO Carbon monoxide Electro-
chemical
1 ppm Z O-4.000
Vol.%
4 NO Nitric oxide Electro-
chemical
1 ppm Z 0-2,000 ppm
5 NO2 Nitric dioxide Electro-
chemical
1 ppm Z 0- 100 ppm
6 SO2 Sulfur dioxide Electro-
chemical
1 ppm Z 0-4,000 ppm
7 TG Gas temperature NiCr-Ni
thermocoupl
e
1K ± 2 % -4°F..2192°F
-
20°C..1200°
C
8 TA Air temperature. Semiconduct
or
1K ± 0.5 K 4°F..248°F
-
20°C..120°C
9 P Draft Solid state 0.004" H2O
0.01 hPa
± 2 % -
12"H2O/+20
"H2O
-
30hPa/+50h
Pa
10 CO2 Carbon dioxide Calculation 0.1 Vol.% ± 2 % 0- CO2 max
11 Combustion
Efficiency / ETA
Calculation 1% ± 0.5 % 0-99,9 %
12 Losses / qA Calculation 1% ± 0.5 % 0-99,9 %
13 Excess air /
LAMBDA
Calculation 1% ± 2 % 1,0-9,99
14 Soot Filter paper
Other range is available upon request
Z= 0-20% of the measuring range +/-1% of the maximum value
Z= 21-100% of the measuring range +/-5% of the display value
4 sensors are the maximum for the IMR 100PS
Source: IMR Environmental Equipment, Inc,2012

72
3.2.2 Measurement Using the IMR 1400C
The indoor air pollutants from combustion activities were measured with the aid
of the IMR 1400C gas analyzer. The sampling probe was held at 1m height in the
laboratory for 2minutes after the 180 seconds calibration of the analyzer and the quantity
of pollutants present were measured. The maximum and minimum measurements of the
pollutants were recorded. Measurements were carried out for the laboratories (two not
more than three hours before the combustion activity, two during the combustion
activities and the last two not more than three hours after the combustion activity). IMR
Environmental Equipment, Inc.(2012). The same process was repeated for all the
laboratories under study with.
IMR 1400C combustion gas analyzer calibrates in 180second for startup of the
analyzer and for 60seconds for the recalibration for subsequent measurements. These
were to ensure accuracy of the result. Results qualities for the samples were ensured by
repetitive measurement and adherence to the requirement for measurement of the
pollutants before, during and after the combustion activity.
3.2.3 Quantities and Units of Measure for Exposure and Emission Monitoring
Since very small accumulations of the described pollutants are enough to cause
health risks, the concentrations that are to be measured in case of air pollution are also
very small. They are either indicated in volume parts or in mass per volume of air.
Units of volume concentration are expressed in ppm (1 part per million = 0,0001 %). For
mass concentration mg/m³ is used. The value in ppm equals the value in ml/m³.
1 Vol.-% = 10 000 ppm = 10 000 ml/m³
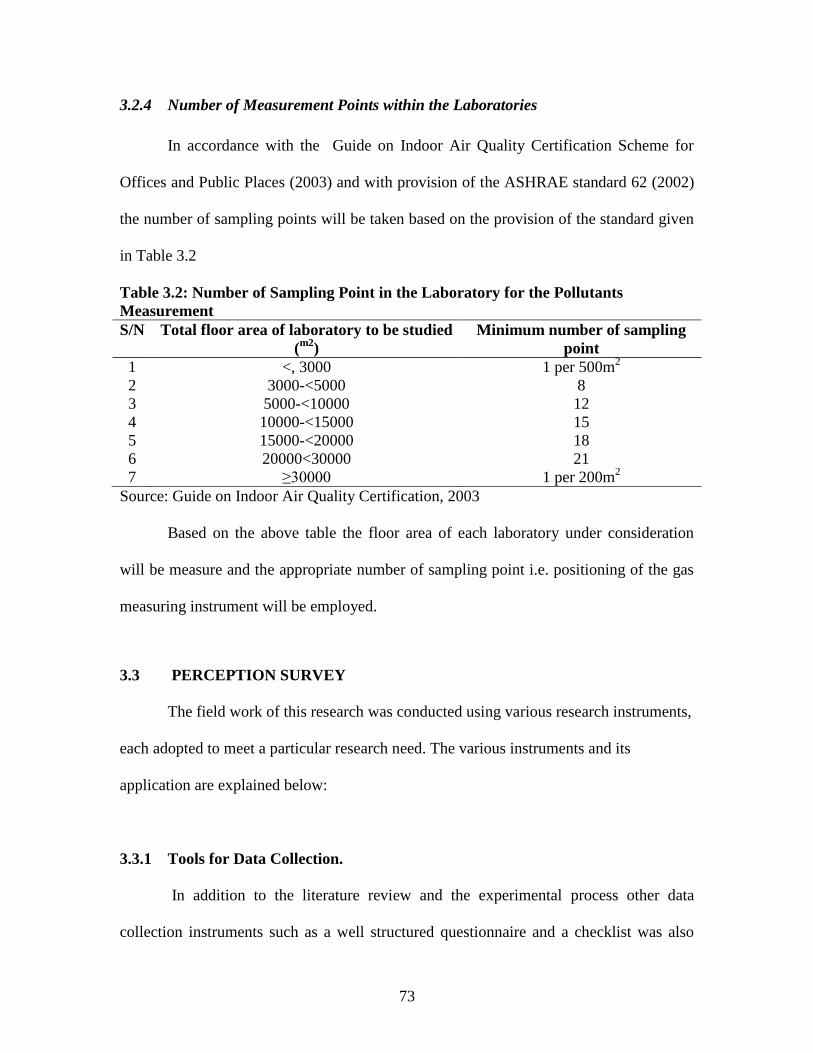
73
3.2.4 Number of Measurement Points within the Laboratories
In accordance with the Guide on Indoor Air Quality Certification Scheme for
Offices and Public Places (2003) and with provision of the ASHRAE standard 62 (2002)
the number of sampling points will be taken based on the provision of the standard given
in Table 3.2
Table 3.2: Number of Sampling Point in the Laboratory for the Pollutants
Measurement
S/N Total floor area of laboratory to be studied
(m2
)
Minimum number of sampling
point
1 <, 3000 1 per 500m2
2 3000-<5000 8
3 5000-<10000 12
4 10000-<15000 15
5 15000-<20000 18
6 20000<30000 21
7 ≥30000 1 per 200m2
Source: Guide on Indoor Air Quality Certification, 2003
Based on the above table the floor area of each laboratory under consideration
will be measure and the appropriate number of sampling point i.e. positioning of the gas
measuring instrument will be employed.
3.3 PERCEPTION SURVEY
The field work of this research was conducted using various research instruments,
each adopted to meet a particular research need. The various instruments and its
application are explained below:
3.3.1 Tools for Data Collection.
In addition to the literature review and the experimental process other data
collection instruments such as a well structured questionnaire and a checklist was also

74
adopted. The details of the sample size and the sampling method using the field survey
are given below:
3.3.1 Questionnaire
The questionnaires were administered to the staff and the students. The questionnaire
sought information in the following aspects pertaining to the effects of the combustion
generated pollutants on the indoor air quality of the laboratories
i. The duration of time spent by staff and students in the laboratory
ii. Observations on indicators of pollution due to combustion activities.
iii. The opinion of the respondents on the measures that can lead to improved indoor
air quality in the laboratories.
With regards to the sampling size in the distribution of the questionnaire, the
sampling size will be determined based on the formula below considering the fact that
the targeted population is unknown. (IWSD, 2003 in Macdonald, 2006)
n= (z2pq)/d
2
Where;
n = the desired sample size
z = the ordinate on the Normal curve corresponding to or the standard
normal deviate, usually any of the following determined based on the „margin
error formula‟
i. A 90% level of confidence has α = 0.10 and critical value of zα/2 = 1.64.
ii. A 95% level of confidence has α = 0.05 and critical value of zα/2 = 1.96.

75
iii. A 99% level of confidence has α = 0.01 and critical value of zα/2 = 2.58.
iv. A 99.5% level of confidence has α = 0.005 and critical value of zα/2 = 2.81.
P = the proportion in the target population estimated to have particular
characteristic (normal between the range of 0.1 - 0.5)
q = 1.0-p
d = degree of accuracy corresponding to the confidence level and Z selected.
For the purpose of this study, a confidence level of 95% will be adopted owing to
the fact that the questionnaire is geared towards evaluating perception of the respondents
to feeling on the indoor air quality.
Consequently, the sample size is determined as thus,
z = 1.96, d = 0.05 where p = 0.9, q =0.1
Hence,
Sample size n = ((1.96)2 x 0.9 x 0.1)/ (0.05)
2 =
Thus the study will administer 138 questionnaires.
The sampling technique adopted for the research was a random sampling owing to
the fact that both the students and staff have their various opinions on their perception to
the indoor air quality of the laboratory before, during and after combustion.
3.3.2 Checklist
The checklist was also prepared to collect all the relevant information of the
laboratories under study. Such information‟s like the presence of the necessary Heating
Ventilation and Air Conditioning System; the presence and functional state of the fume

76
boxes and other related factors like the frequency of maintenance of the HVAC system
that can influence the effects of combustion pollutants on the indoor air quality
3.4 DATA ANALYSIS
The data collected for this study was subjected to various statistical analyses
using the computer based software “Statistical Package of Social Sciences” (SPSS). The
results of the analysis are presented in the forms of table for the purpose of easy
comparism and clear expression of the findings. Relative importance indices (RII) was
also used to rate the health symptoms of the combustion generated pollutants on the
indoor air quality. The Relative Importance Index (RII) was calculated for each document
according to their frequency of use as suggested for use by Memon et al, (2006) and
Othman et al, (2005)
Relative importance index was used in the study to rank the factors relating to the
availability of housing financing funds.
Relative Importance Index (RII)
Where,
∑fx = is the total weight given to each attributes by the respondents.
∑f = is the total number or respondents in the sample.
K = is the highest weight on the likert scale.
Results are classified into three categories as follows (Othman et al, 2005) when;
RII<0.60 -it indicates low frequency in use
0.60≤RII<0.80 -it indicates high frequency in use.
RII≥0.80 –it indicates very high frequency in use.

77
Experimental results are presented in adequate table and with the adequate unit of
measurement for a clear expression of the finding.

78
CHAPTER FOUR
DATA PRESENTATION, ANALYSIS AND DISCUSSION
4.1 EXPERIMENTAL WORK
The combustion generated pollutants were measured in the laboratories prior to
the combustion process, during and after the combustion process for different points or
spots within the laboratory. A total of six (6) laboratories were studied in three session of
experiments and the result of the combustion generated pollutants measured are presented
in Tables 4.1 to Table 4.6 in accordance to the sessions of measurement
4.1.1 Result of the Combustion Pollutant Measurements
Table 4.1: Result of the Combustion Pollutant Measurement in Chemistry Lab I
along with ASHRAE Requirement and NAAQS standard Session Chemistry lab I
Pollutants(
O2 in%
others in
ppm)
Measurement 3hours
Before Combustion
Measurement
During
Combustion
Measurement
3hours After
Combustion
ASHRAE ACCEPTABLE
LIMIT( O2 in% others in
ppm)
A1 A2 A3 B1 B2 B3 C1 C2 C3
1
O2 (%) 20.90 20.9 20.4 20.7 20.7 20.9 20.9 20.8 20.9 ≥ 20.9%
CO 0.0 0.0 0.0 7 13 23 02 03 02 ≤9ppm
NOx 0.0 0.0 0.0 0.0 1.0 2.0 2.0 1.0 0.0 ≤0.053ppm
SO2 0.0 0.0 0.0 0.0 0.0 0.0 0.0 0.0 0.0 ≤ 0.14ppm
CO2 4.2 2.1 1.1 2.1 3.2 4.2 1.0 0 0.0 ≤ 1000ppm
2
O2 (%) 20.9 20.9 20.4 20.7 20.7 20.9 20.9 20.8 20.9 ≥ 20.9%
CO 0 1 06 24 11 11 03 02 07 ≤9ppm
NOx 0 0.0 0.0 0.0 0.0 0.0 0.0 0.0 0.0 ≤0.053ppm
SO2 0.1 0.0 0.1 02 0.0 0.1 0.0 0.0 0.0 ≤ 0.14ppm
CO2 2.1 1.0 3.2 1.0 1.0 2.1 1.0 1.0 1.0 ≤ 1000ppm
3
O2 (%) 20.9 20.9 20.4 20.7 20.7 20.9 20.9 20.8 20.9 ≥ 20.9%
CO 0.0 1.0 0.0 7.0 11.0 13.0 4.0 2.0 0.0 ≤9ppm
NOx 0.0 0.0 0.0 0.0 0.0 0.0 0.0 0.0 0.0 ≤0.053ppm
SO2 0.0 0.0 0.0 0.0 0.0 0.0 0.0 0.0 0.0 ≤ 0.14ppm
CO2 4.2 3.1 1.0 3.2 5.6 3.2 2.1 3.2 1.2 ≤ 1000ppm
Source: Field Survey, (2013)
Where: A1, A2, A3, B1, B2, B3, C1, C2, C3 are all points of measurements while 1, 2, 3
are sessions of experiment.
From Table 4.1, it can be observed that CO often exceeded the permissible limit
especially during the combustion process rising up to (45ppm against the 9ppm limit). It

79
can also be observed that the oxygen levels were at the critical level and at few points
even below the limit, making the tendency of incomplete combustion higher.
Table 4.2: Result of the Combustion Pollutant Measurement SBRS LAB II along
with ASHRAE Requirement and NAAQS standard Session SBRS LAB II
Pollutants(
O2 in%
others in
ppm)
Measurement 3hours
Before Combustion
Measurement
During Combustion
Measurement 3hours
After Combustion
ASHRAE
ACCEPTABLE
LIMIT( O2 in%
others in ppm) A1 A2 A3 B1 B2 B3 C1 C2 C3
1
O2 (%) 20.9 20.9 20.4 20.7 20.7 20.9 20.9 20.8 20.9 ≥ 20.9%
CO 0 0 0 7 13 23 02 03 02 ≤9ppm
NOx 0.0 0.0 0.0 0.0 1.0 2.0 2.0 1.0 0.0 ≤0.053ppm
SO2 0.0 0.0 0.0 0.0 0.0 0.0 0.0 0.0 0.0 ≤ 0.14ppm
CO2 2.1 4.2 2.0 21. 1.0 2.1 1.0 2.3 1.0 ≤ 1000ppm
2
O2 (%) 20.9 20.9 20.4 20.7 20.7 20.9 20.9 20.8 20.9 ≥ 20.9%
CO 0 1 0 33 27 18 07 03 07 ≤9ppm
NOx 0.0 0.0 0.0 0.0 0.0 0.0 0.0 0.0 0.0 ≤0.053ppm
SO2 0.0 0.0 0.0 0.0 0.0 0.0 0.0 0.0 0.0 ≤ 0.14ppm
CO2 2.1 4.2 1.0 2.2 1.0 1.0 2.1 1.0 2.0 ≤ 1000ppm
3
O2 (%) 20.9 20.9 20.4 20.7 20.7 20.9 20.9 20.8 20.9 ≥ 20.9%
CO 0.0 0.0 0.0 0.0 13.0 14.0 11.0 0.0 0.0 ≤9ppm
NOx 0.0 0.0 0.0 0.0 0.0 0.0 0.0 0.0 0.0 ≤0.053ppm
SO2 0.0 0.0 0.0 0.0 0.0 0.0 0.0 0.0 0.0 ≤ 0.14ppm
CO2 2.1 3.2 4.2 2.1 2.3 4.2 2.1 2.1 3.1 ≤ 1000ppm
Source: Field Survey, (2013)
Where: A1, A2, A3, B1, B2, B3, C1, C2, C3 are all points of measurements while 1, 2, 3 are sessions of experiment.
From Table 4.2, it can be observed that the most reoccurring pollutant that
exceeds the limit is CO especially during the combustion process rising up to (45ppm).
The presentation in the table above shows the measurement of the pollutants at three
different points before the combustion activities as well as during and after the
combustion activities. The trend of rise and fall of the amount of the pollutants within the
interior are also presented in the table. These measurements are peculiar to the SBRS lab
II
Table 4.3: Result of the Combustion Pollutant Measurement IN SBRS LAB III along
with ASHRAE Requirement and NAAQS standard Session SBRS LAB III
Pollutants(
O2 in%
others in
ppm)
Measurement 3hours
Before Combustion
Measurement
During Combustion
Measurement 3hours
After Combustion
ASHRAE
ACCEPTABLE
LIMIT( O2 in%
others in ppm) A1 A2 A3 B1 B2 B3 C1 C2 C3
1
O2 (%) 20.9 20.9 20.4 20.7 20.7 20.9 20.9 20.8 20.9 ≥ 20.9%
CO 0 0 0 7 13 23 02 03 02 ≤9ppm
NOx 0.0 0.0 0.0 0.0 1.0 2.0 2.0 1.0 0.0 ≤0.053ppm
SO2 0.0 0.0 0.0 0.0 0.0 0.0 0.0 0.0 0.0 ≤ 0.14ppm
CO2 4.2 3.1 1.0 3.2 5.6 3.2 2.1 3.2 1.2 ≤ 1000ppm
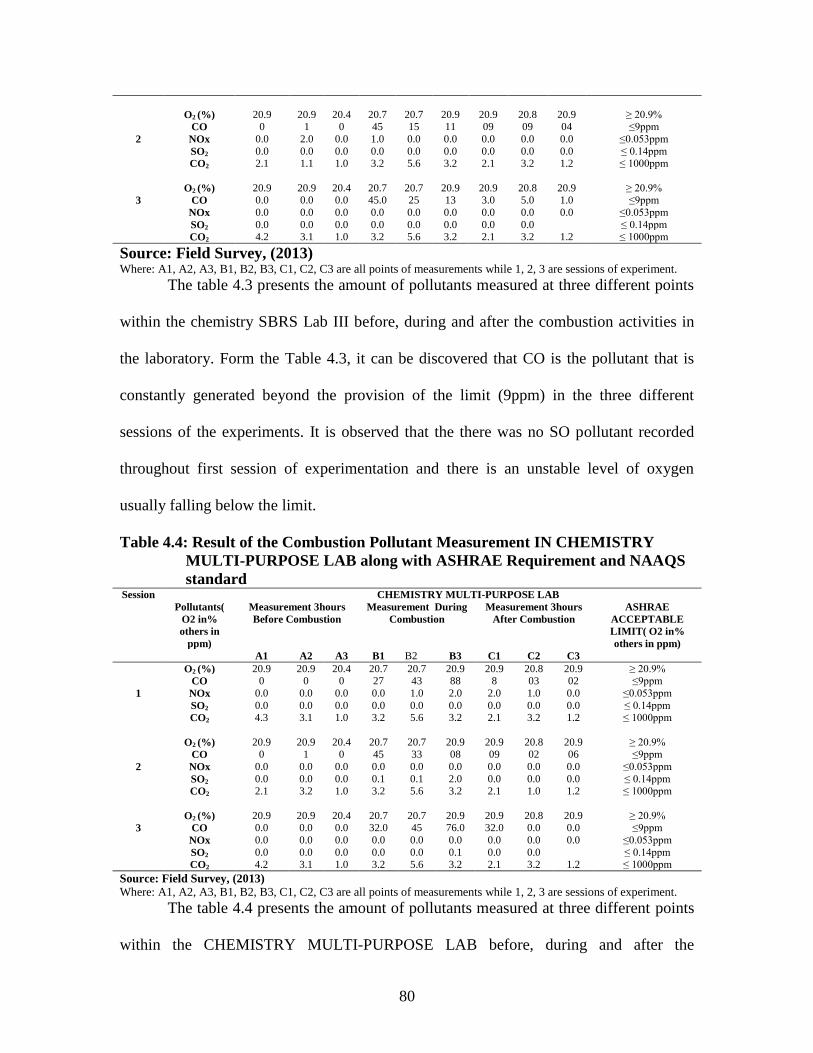
80
2
O2 (%) 20.9 20.9 20.4 20.7 20.7 20.9 20.9 20.8 20.9 ≥ 20.9%
CO 0 1 0 45 15 11 09 09 04 ≤9ppm
NOx 0.0 2.0 0.0 1.0 0.0 0.0 0.0 0.0 0.0 ≤0.053ppm
SO2 0.0 0.0 0.0 0.0 0.0 0.0 0.0 0.0 0.0 ≤ 0.14ppm
CO2 2.1 1.1 1.0 3.2 5.6 3.2 2.1 3.2 1.2 ≤ 1000ppm
3
O2 (%) 20.9 20.9 20.4 20.7 20.7 20.9 20.9 20.8 20.9 ≥ 20.9%
CO 0.0 0.0 0.0 45.0 25 13 3.0 5.0 1.0 ≤9ppm
NOx 0.0 0.0 0.0 0.0 0.0 0.0 0.0 0.0 0.0 ≤0.053ppm
SO2 0.0 0.0 0.0 0.0 0.0 0.0 0.0 0.0 ≤ 0.14ppm
CO2 4.2 3.1 1.0 3.2 5.6 3.2 2.1 3.2 1.2 ≤ 1000ppm
Source: Field Survey, (2013) Where: A1, A2, A3, B1, B2, B3, C1, C2, C3 are all points of measurements while 1, 2, 3 are sessions of experiment.
The table 4.3 presents the amount of pollutants measured at three different points
within the chemistry SBRS Lab III before, during and after the combustion activities in
the laboratory. Form the Table 4.3, it can be discovered that CO is the pollutant that is
constantly generated beyond the provision of the limit (9ppm) in the three different
sessions of the experiments. It is observed that the there was no SO pollutant recorded
throughout first session of experimentation and there is an unstable level of oxygen
usually falling below the limit.
Table 4.4: Result of the Combustion Pollutant Measurement IN CHEMISTRY
MULTI-PURPOSE LAB along with ASHRAE Requirement and NAAQS
standard Session CHEMISTRY MULTI-PURPOSE LAB
Pollutants(
O2 in%
others in
ppm)
Measurement 3hours
Before Combustion
Measurement During
Combustion
Measurement 3hours
After Combustion
ASHRAE
ACCEPTABLE
LIMIT( O2 in%
others in ppm) A1 A2 A3 B1 B2 B3 C1 C2 C3
1
O2 (%) 20.9 20.9 20.4 20.7 20.7 20.9 20.9 20.8 20.9 ≥ 20.9%
CO 0 0 0 27 43 88 8 03 02 ≤9ppm
NOx 0.0 0.0 0.0 0.0 1.0 2.0 2.0 1.0 0.0 ≤0.053ppm
SO2 0.0 0.0 0.0 0.0 0.0 0.0 0.0 0.0 0.0 ≤ 0.14ppm
CO2 4.3 3.1 1.0 3.2 5.6 3.2 2.1 3.2 1.2 ≤ 1000ppm
2
O2 (%) 20.9 20.9 20.4 20.7 20.7 20.9 20.9 20.8 20.9 ≥ 20.9%
CO 0 1 0 45 33 08 09 02 06 ≤9ppm
NOx 0.0 0.0 0.0 0.0 0.0 0.0 0.0 0.0 0.0 ≤0.053ppm
SO2 0.0 0.0 0.0 0.1 0.1 2.0 0.0 0.0 0.0 ≤ 0.14ppm
CO2 2.1 3.2 1.0 3.2 5.6 3.2 2.1 1.0 1.2 ≤ 1000ppm
3
O2 (%) 20.9 20.9 20.4 20.7 20.7 20.9 20.9 20.8 20.9 ≥ 20.9%
CO 0.0 0.0 0.0 32.0 45 76.0 32.0 0.0 0.0 ≤9ppm
NOx 0.0 0.0 0.0 0.0 0.0 0.0 0.0 0.0 0.0 ≤0.053ppm
SO2 0.0 0.0 0.0 0.0 0.0 0.1 0.0 0.0 ≤ 0.14ppm
CO2 4.2 3.1 1.0 3.2 5.6 3.2 2.1 3.2 1.2 ≤ 1000ppm
Source: Field Survey, (2013)
Where: A1, A2, A3, B1, B2, B3, C1, C2, C3 are all points of measurements while 1, 2, 3 are sessions of experiment.
The table 4.4 presents the amount of pollutants measured at three different points
within the CHEMISTRY MULTI-PURPOSE LAB before, during and after the

81
combustion activities in the laboratory. Form the Table 4.4, it can be discovered that CO
is the pollutant that is more generated even at the three different sessions of the
experiments.
Table 4.5: Result of the Combustion Pollutant Measurement PHYSICAL
CHEMISTRY LAB Along With ASHRAE Requirement and NAAQS
Standard Session PHYSICAL CHEMISTRY LAB
Pollutants(
O2 in%
others in
ppm)
Measurement 3hours
Before Combustion
Measurement
During Combustion
Measurement 3hours
After Combustion
ASHRAE
ACCEPTABLE
LIMIT( O2 in%
others in ppm) A1 A2 A3 B1 B2 B3 C1 C2 C3
1
O2 (%) 20.9 20.9 20.4 20.7 20.7 20.9 20.9 20.8 20.9 ≥ 20.9%
CO 0 0 0 7 13 23 02 03 02 ≤9ppm
NOx 0.0 0.0 0.0 0.0 1.0 2.0 2.0 1.0 0.0 ≤0.053ppm
SO2 0.0 0.0 0.0 0.0 0.0 0.0 0.0 0.0 ≤ 0.14ppm
CO2 4.2 3.1 1.0 3.2 5.6 3.2 2.1 3.2 1.2 ≤ 1000ppm
2
O2 (%) 20.9 20.9 20.4 20.7 20.7 20.9 20.9 20.8 20.9 ≥ 20.9%
CO 0 1 0 11 14 36 09 02 07 ≤9ppm
NOx 0.0 0.0 0.0 0.0 1.0 2.0 2.0 1.0 0.0 ≤0.053ppm
SO2 0.0 0.0 0.0 0.0 1.0 0.0 0.0 1.0 0.0 ≤ 0.14ppm
CO2 3.1 3.1 1.0 3.2 5.6 3.2 2.1 3.2 1.2 ≤ 1000ppm
3
O2 (%) 20.9 20.9 20.4 20.7 20.7 20.9 20.9 20.8 20.9 ≥ 20.9%
CO 0.0 0.0 1.0 14.0 38.0 42.0 2.1 3.2 1.2 ≤9ppm
NOx 0.0 0.0 0.0 0.0 0.0 0.0 0.0 0.0 0.0 ≤0.053ppm
SO2 0.0 0.0 0.0 0.0 0.0 0.0 0.0 0.0 ≤ 0.14ppm
CO2 4.2 3.1 1.0 3.2 4.2 3.2 2.1 3.2 1.2 ≤ 1000ppm
Source: Field Survey, (2013)
Where: A1, A2, A3, B1, B2, B3, C1, C2, C3 are all points of measurements while 1, 2,3 are sessions of experiment.
The Table 4.5 presents the amount of pollutants measured at three different points
within the Physical Chemistry laboratory before, during and after the combustion
activities in the laboratory. Form the Table 4.5, it can be discovered that similar to the
other laboratories studied, CO is the pollutant that is frequently generated beyond the
limit provision (9ppm). It can also be observed that the oxygen content as measured was
not consistent throughout the measurement.
Table 4.6: Result of the Combustion Pollutant Measurement CHEMISTRY
MASTERS STUDENT LAB along with ASHRAE Requirement and
NAAQS standard Session Pollutants(
O2 in%
others in
ppm)
CHEMISTRY MASTERS STUDENT LAB
Measurement 3hours
Before Combustion
Measurement
During Combustion
Measurement 3hours
After Combustion
ASHRAE
ACCEPTABLE
LIMIT ( O2 in%
others in ppm) A1 A2 A3 B1 B2 B3 C1 C2 C3
1
O2 (%) 20.9 20.9 20.4 20.7 20.7 20.9 20.9 20.8 20.9 ≥ 20.9%
CO 0 0 0 7 13 23 02 03 02 ≤9ppm
NOx 0.0 0.0 0.0 0.0 1.0 2.0 2.0 1.0 0.0 ≤0.053ppm

82
SO2 0.0 0.0 0.0 0.0 0.0 0.0 0.0 0.0 0.1 ≤ 0.14ppm
CO2 4.2 3.1 1.0 3.2 5.6 3.2 2.1 3.2 1.2 ≤ 1000ppm
2
O2 (%) 20.9 20.9 20.4 20.7 20.7 20.9 20.9 20.8 20.9 ≥ 20.9%
CO 0 1 0 28 23 11 06 02 03 ≤9ppm
NOx 0.0 0.0 0.0 0.2 0.2 0.1 0.0 0.0 0.0 ≤0.053ppm
SO2 0.0 0.0 0.0 0.0 0.1 0.0 0.0 0.0 0.0 ≤ 0.14ppm
CO2 0.0 0.0 0.0 11.0 9.0 13.0 5.0 6.0 4.0 ≤ 1000ppm
3
O2 (%) 20.9 20.9 20.4 20.7 20.7 20.9 20.9 20.8 20.9 ≥ 20.9%
CO 2.1 3.1 2.1 12.0 45.0 32 4.0 2.0 2.0 ≤9ppm
NOx 0.0 0.0 0.0 0.0 0.0 0.0 0.0 0.0 0.0 ≤0.053ppm
SO2 0.0 0.0 0.0 0.0 0.0 0.0 0.0 0.0 0.1 ≤ 0.14ppm
CO2 1.2 2.1 2.1 3.2 4.5 32.7 2.0 4.9 3.2 ≤ 1000ppm
Source: Field Survey, (2013)
Where: A1, A2, A3, B1, B2, B3, C1, C2, C3 are all points of measurements while 1, 2, 3 are sessions of experiment.
The table 4.6 presents the amount of pollutants measured at three different points within
the chemistry masters‟ student laboratory before, during and after the combustion
activities in the laboratory. Also, it was discovered that CO is the pollutant that is more
generated even at the three different sessions of the experiments.
4.2 THE PERCEPTION SURVEY
4.2.1 Questionnaires Survey Result and Analysis
A total of one hundred and forty questionnaires were administered to both the
staff and students in the area of study. The percentages of responses are presented in
Table 4.7 below. Form the table it can be gathered that a total of one hundred and twenty-
seven questions were received adequately filled giving a percentage response of 90.7%.
Table 4.7 Questionnaire administered
Questionnaires Frequency Percentage of (%)
Number returned 115 90.7
Numbers not returned 12 9.3
Total 140 100
Source: Field Survey, (2013)

83
4.2.2 Respondents’ Profile
From the result of the analysis of the respondents opinion conducted, the profile
of the respondents is presented in Table 4.8
Table 4.8 Respondents’ Profile
S/N Variable Option Frequency
(No)
Percentage
(%)
1 Sex: a) Male 86 67.7 b) Female 41 32.3
Total 127 100
2 Status: a) Staff 11 8.7 b) Student 116 91.3
Total 127 100
3 Age(years)
Range:
a) Below 20yrs 22 17.3 b) 21-30yrs 78 61.4 c) 31-40yrs 21 16.5 d) 41yrs and above 6 4.7
Total 127 100
Source: Field Survey, (2013)
From the table above, it can be established that there are more male respondents
(67.7%) than female (23.3%) respondents. Also it can be deduced that the age bracket
with the highest frequency observed was 21-30years, (61.4%) this was followed closely
by the age bracket below 20years (17.3%).
4.2.3 Frequency Of Use Of Laboratory
The relevance of the laboratories was assessed alongside the frequency of use of
the laboratories by the respondents the result of the analysis is presented in the Table 4.9
below:

84
Table 4.9 Frequency of Laboratory Use
S/N Variable Option Frequency Percentage
(%)
1 Use of laboratory: a) Yes 127 100
b) No 0 0
Total 127 100
2 Frequency of laboratory
use:
a) Once a week 22 17.3
b) Twice a week 21 16.5
c) Daily excluding
weekends
76 59.8
d) Daily including week
day
8 6.3
Total 127 100
3 Hours Spent Laboratory
Per Day:
a) 0-2hrs 58 45.7
e) 3-4hrs 35 27.6
f) 5-6hrs 34 26.8
Total 127 100
Source: Field Survey, (2013)
From Table 4.9, it is observed that all the respondents (100%) make use of the
laboratory; however with regards to the frequency of use within the week it is observed
that most of the respondents use the laboratory daily excluding weekends (59.8%). Also
with duration of time spent in the laboratory by the respondents, it is observed that the
time interval with the highest frequency is 0-2hrs corresponding to a percentage of
45.7%.
4.2.4 Combustion in Laboratory and Mode of Heat Generation
Combustion activities in the laboratories; the means of heat generation and the
presence fume hood installation and their functionality was also assess, Table 4.10 below
presents the respondents opinions
Table 4.10 Combustion, Heat Source and the Presence of Fume Hood in
Laboratories
S/N Variable Option Frequency Percentage
(%)

85
1 Combustion In
Laboratories:
a) Yes 94 74.0
b) No 33 26.0
Total 127 100
2 Heat Generating Device
frequently used :
a) Stove 16 12.3
b) Gas burner 89 70.1
c) Hot plates 22 17.3
d) Candle 0 0
Total 127 100
3 Presence Of Functional
Fume Hood:
a) Yes 40 31.5
b) No 27 21.3
c) Not Aware 60 47.2
Total 127 100
Source: Field Survey, (2013)
From Table 4.10, it is observed that majority of the respondents opined that their
work entails combustion (74.0%). Also the major heat generating device frequently used
in the laboratories as opined the respondent is the gas burner (70.1%). With regard to the
presence of a functional fume hood installation, the majority of the respondent were not
aware of the presence of a fume hood and it functional status; this corresponds to a
percentage of 47.2% of the respondents.
4.2.5 Combustion And Ventilation In Laboratories
The perceptions of the respondents were also assessed with regards to the impact
of combustion activities in the laboratory as well as the evaluation of the adequacy of the
ventilation system. Table 4.11 below, presents the result of the assessment
Table 4.11 Combustion and Ventilation in Laboratories S/N Variable Option Frequency Percentage (%)
1 Combustion As A Source Of
Discomfort: a) Yes 117 92.1
b) No 10 7.9
Total 127 100
2 Process That Posses More
Discomfort:
a) Combustion 69 54.3
b) Filtration 0 0
c) Lab cleaning 58 45.7
d) distillation 0 0
Total 127 100
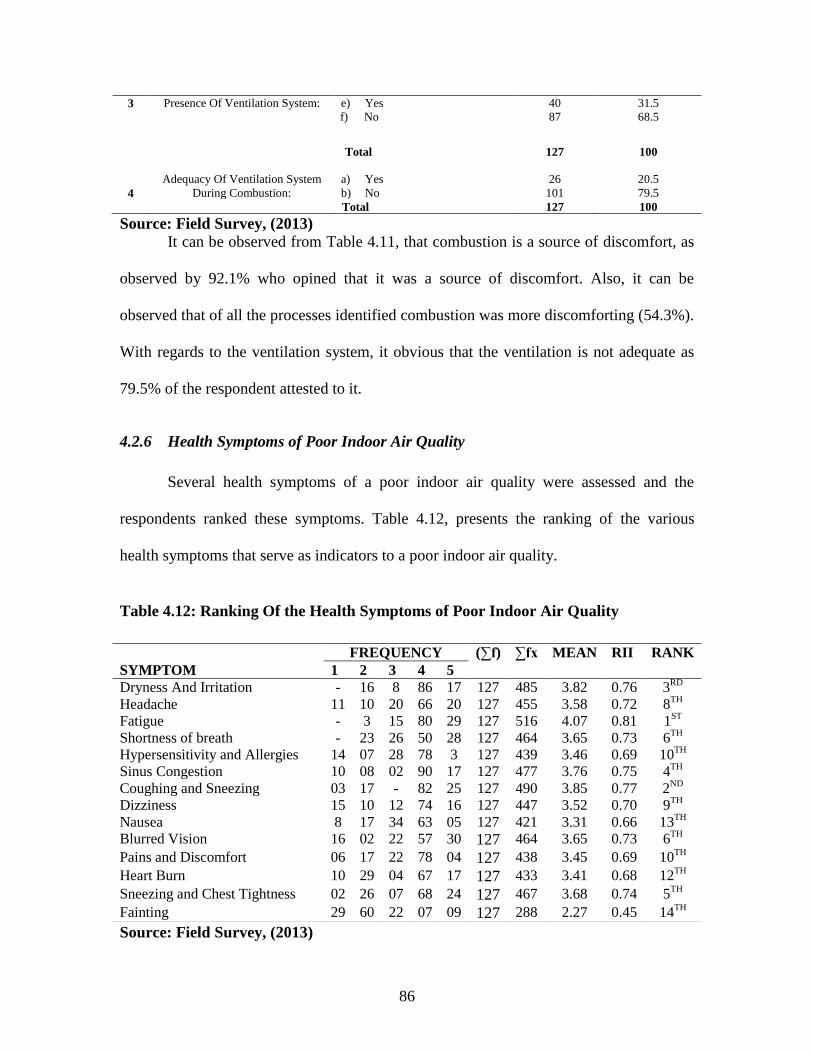
86
3 Presence Of Ventilation System: e) Yes 40 31.5
f) No 87 68.5
Total 127 100
Adequacy Of Ventilation System
During Combustion:
a) Yes 26 20.5
4 b) No 101 79.5
Total 127 100
Source: Field Survey, (2013)
It can be observed from Table 4.11, that combustion is a source of discomfort, as
observed by 92.1% who opined that it was a source of discomfort. Also, it can be
observed that of all the processes identified combustion was more discomforting (54.3%).
With regards to the ventilation system, it obvious that the ventilation is not adequate as
79.5% of the respondent attested to it.
4.2.6 Health Symptoms of Poor Indoor Air Quality
Several health symptoms of a poor indoor air quality were assessed and the
respondents ranked these symptoms. Table 4.12, presents the ranking of the various
health symptoms that serve as indicators to a poor indoor air quality.
Table 4.12: Ranking Of the Health Symptoms of Poor Indoor Air Quality
Source: Field Survey, (2013)
FREQUENCY (∑f) ∑fx MEAN RII RANK
SYMPTOM 1 2 3 4 5
Dryness And Irritation - 16 8 86 17 127 485 3.82 0.76 3RD
Headache 11 10 20 66 20 127 455 3.58 0.72 8TH
Fatigue - 3 15 80 29 127 516 4.07 0.81 1ST
Shortness of breath - 23 26 50 28 127 464 3.65 0.73 6TH
Hypersensitivity and Allergies 14 07 28 78 3 127 439 3.46 0.69 10TH
Sinus Congestion 10 08 02 90 17 127 477 3.76 0.75 4TH
Coughing and Sneezing 03 17 - 82 25 127 490 3.85 0.77 2ND
Dizziness 15 10 12 74 16 127 447 3.52 0.70 9TH
Nausea 8 17 34 63 05 127 421 3.31 0.66 13TH
Blurred Vision 16 02 22 57 30 127 464 3.65 0.73 6TH
Pains and Discomfort 06 17 22 78 04 127 438 3.45 0.69 10TH
Heart Burn 10 29 04 67 17 127 433 3.41 0.68 12TH
Sneezing and Chest Tightness 02 26 07 68 24 127 467 3.68 0.74 5TH
Fainting 29 60 22 07 09 127 288 2.27 0.45 14TH

87
Where: 1 =strongly disagree, 2 = disagree, 3 =undeceived, 4= agree, 5=strongly agree
From Table 4.12, it is observed that the respondents ranked fatigue (with RII=
0.81) was ranked as the most reoccurring health symptom indicating a poor indoor
quality. Also it is observed that only symptoms like fainting and Nausea had a relative
importance index less than 0.6, indicating that they are not a commonly observed
symptom. Also from the mean values, it can be deduced that the value were closer to the
linkert weighting of four (4) an indication that the respondents general opinion agrees
that the symptoms were truly an indication to poor indoor air
4.2.7 HVAC and Combustion Related Factors That Are the Cause for Poor
Indoor Air Quality in Laboratories
The questionnaire also sort the opinion of the respondents with regards to the
Heating Ventilation and Air Conditioning (HVAC) system as well as combustion on how
they contribute to the poor indoor air quality of laboratories. The opinion and ranking of
the respondent are presented in Table 4.13 below

88
Table 4.13: Ranking of the Causes of Poor Indoor Air Quality
FREQUENCY (∑f) ∑fx MEAN RII RANK
CAUSES 1 2 3 4 5
Combustion Activities - - 02 73 52 127 558 4.39 0.89 2ND
Inadequate Ventilation - 10 06 67 44 127 526 4.14 0.83 3RD
Non Functional Fume Hoods 12 13 12 68 22 127 456 3.59 0.72 5TH
Unvented Combustion
Equipment
58 20 13 27 09 127 290 2.29 0.46 9TH
Prolonged And Reoccurring
Combustion
05 20 12 58 30 127 463 3.65 0.73 4TH
Over Crowding In Labs - - 07 40 80 127 581 4.57 0.91 1ST
Faulty Burners 04 40 62 21 - 127 354 2.79 0.56 7TH
Too Humid Air 03 26 70 28 - 127 377 2.97 0.59 6TH
Poor Air Movement - 54 67 06 - 127 333 2.62 0.52 8TH
Source: Field Survey, (2013)
Where: 1= not a cause, 2= not a major cause, 3= barely a cause, 4=a cause, 5=always a
cause
From Table 4.13, it can be observed that overcrowding in labs (RII=0.91) was
ranked the first cause of poor indoor air quality, this followed closely by combustion
activities (RII=0.89). It can also be seen that other factors like: faulty burners, too humid
air and unvented combustion though a factor but was not with intense effect owing to
their relative importance index (RII), which are below 0.6. with regards to the mean, it
can be observed that the values were closer to the weighting four(4) an indication, that
the respondents opinion was that the identified factor are all causes of poor indoor air
quality. The Table also gives a frequency break down on each of the options as chosen by
the respondents.
4.2.8 Remedial Action to Poor Indoor Air Quality In Laboratories
Table 4.14 gives the respondents ranking of the various remedial measures to the
poor indoor air quality identified; it also gives the percentage response per option as well
as the mean and standard deviation as shown below:

89
Table 4.14: Ranking of the Remedy to the Poor Indoor Air Quality
FREQUENCY (∑f) ∑fx MEAN RII RANK
Remedy 1 2 3 4 5
Provision of adequate HVAC
system
07 - 10 32 78 127 555 4.37 0.87 1st
Use and maintenance of
functional fume hoods
14 - 15 40 58 127 509 4.00 0.80 3rd
Adequate air flow during
combustion
- 13 14 28 72 127 540 4.25 0.85 2nd
Use of excellent combustion
equipments
14 - 21 32 60 127 505 3.98 0.79 4th
Orientation of both staff and
student on the danger of poor
indoor air quality
32 - 9 28 58 127 461 3.63 0.73 5th
Source: Field Survey, (2013)
Where: 1 =not Effective, 2= no effect, 3=slightly effective, 4=Effective, 5=very effective
From the Table 4.14, it can be observed that the highest rank remedy to the poor
indoor air quality by the respondents is the provision of adequate Heating Ventilation and
Air Conditioning System( RII= 0.87). also from the mean values, it can be established
that in the general the respondents opined that the identified remedy were all feasible
options as the value of the mean is closer to the likert weighting of four(4).
4.2.9 Checklist Survey
The result of the checklist survey conducted is presented in Table 4.15. It can be
established that most of the laboratory satisfy the condition of the General observation
with the exception of chemistry Lab II and the multipurpose Lab, where moulds were
discovered at the walls and ceilings. Similarly, the ventilation system of the laboratories
where satisfactory with the exception of the chemistry lab II where there exist a wall
barrier to the air intakes and the physical chemistry lab I where there are is exist no
extract duct. It was also discovered that all the laboratories studies do not have air filters
installed in them.

90
Table 4.15 Result of the Checklist Survey S/N Variable Option Remark Exceptions
1 General observation( walls,
ceiling and floors):
a) Free from mould Satisfactory None
b) Flat surface dust free Satisfactory None
c) Diffusers are
unobstructed
Satisfactory None
d) Walls and ceilings
free from mould
Satisfactory Chemistry lab II
and the
multipurpose lab
2 Ventilation System (HVAC) a) Adequate outdoor air
intake
Satisfactory Chemistry lab III
b) Air intake clear off
pollutants
Satisfactory None
c) Cleanliness of duct Satisfactory Physical chemistry
lab I, SBRS lab II
d) Ventilation shut-
down
Not
satisfactory
None
e) Presence of air filter Absent None
3 General Maintenance Design: a) Windows can be
opened
Satisfactory None
b) Presence of odour Satisfactory Masters lab
c) Number of occupants
to size of interior
Interior
over
crowded
None
Humidifier : a) Presence of fan Satisfactory None
4 b) Use of volatile
chemicals for
humidifier
None None
Source: Field Survey, (2013)
4.3 DISCUSSION OF RESULTS
The discussions are based on the result of the analysis of the respondents‟
opinions and the experimental as well as the records gotten from the checklist survey
laboratories under study.
4.3.1 Combustion Generated Pollutants
The study revealed that combustion generated indoor air pollutant in the
laboratory where more of CO and NOx (Table 4.4) the mean value of SO where within
the normal range as specified by the ASHRAE 62 along side with requirement for WHO
and FEMA limits. However the limit for pollutant like CO were above the limit specified
91
by this standard thus making exposure to such gaseous pollutant very hazardous to the
health of both the students and the staff. From the result of the measure (Table 4.1- Table
4.6) it can be discovered that during the combustion activities, the amount of CO
increases far beyond the NAAQS standard of 9ppm for all the labs with the exception of
the Masters lab Where a water bath is used as a source of heat generation as against
others that were purely gas burners. Also from the result it can be established that the
chemistry multi-purpose lab had the highest amount of pollutants owing to the population
of students and the non-functional fume hoods.
Also from the experimental result, it can be established that the oxygen level at
the laboratories were at the critical limit (20.9%) with the value dropping at certain
points. This can account for the incomplete combustion leading to the massive generation
of CO (up to 45ppm) which is far beyond the limit (9ppm)
4.3.2 Profile of Respondents
Table 4.8 shows that there are more male (67.7%) than female (23.3%)
respondents and that the predominant age bracket is 21-30yrs (61.4%). This suggests
early exposure of the youth to potential health hazards and call for attention.
4.3.3 Use of Laboratory, Combustion and Ventilation in Laboratories
The study establishes that the laboratory is a basic requirement for any study
institution (Table 4.9). In line with this, the study also reveals that most laboratory users
have need to spend between about 2-3hours daily excluding weekends as presented in
Table 4.9. The study also established that there are no adequate ventilation in the
laboratories studied especially during combustion processes as shown in Table 4.5.

92
Similarly, the study reveals that the major source of heating generating device in the
laboratories were gas burners and to a large extent the functionality of the fume hoods
were in doubt as most of the respondents cannot attest to their functionality as shown in
Table 4.10. However, the checklist revealed that in the case of scarcity of gas for
combustion process, water bath as shown in the appendix Fig 11 were employed as an
alternative heater.
4.3.4 Health Symptom of a Poor Indoor Air Quality
The study established that fatigue was the most predominant heath symptom of a
poor indoor quality especially due to the presence of combustion pollutants. Also with
reference to the Relative Importance Index (RII) value of fainting and Nausea which was
less than 0.6, it is a clear indication that other health symptoms identified were symptom
of a poor indoor quality with the exception of these two.
4.3.5 Causes of poor indoor air quality and the remedy
The study revealed that in addition to combustion activities being a major cause
of poor indoor air quality, overcrowded arrangement of students in the laboratory is also
a major contributor to the poor indoor air quality as shown in Table 4.13. Other major
causes of poor indoor air quality are: non functional fume hoods, prolonged and
reoccurring combustion activities. However other factors like the humid air were not a
major contributor to the poor indoor air quality in laboratories. With regard to the remedy
to the poor indoor air quality, the study establishes that the following are possible
measures that can be adopted:, the provision of adequate HVAC system, use and
maintenance of functional fume hoods, orientation of staff on the danger of poor indoor

93
air quality to health and also to avoiding overcrowding of student working in the
laboratory. This can also be seen in Table 4.14
4.3.6 HVAC Status of the Laboratories
The study revealed that some of the laboratories (Chemistry Lab II and the
multipurpose) laboratory did not meet the requirement of the Heating Ventilation and Air
conditioning (HVAC) requirement. The result of the checklist survey in Table 4.15 shows
other HVAC requirements and the status of the laboratories studied. Form the table, it can
be observed that the most predominant lapse found in the HVAC systems of the
laboratories are; the absence of cleaning duct, absence and in some cases none functional
fume ducts and absence of air filters. This account for the critical state of oxygen level
identified from the measurements

94
CHAPTER FIVE
5.0 SUMMARY, CONCLUSION AND RECOMMENDATION
5.1 SUMMARY:
The following are the summaries of the findings:
i) Carbon -monoxide (CO) occurring as the major pollutants that exceeds the
ASHRAE and NAAQS standard of 9ppm reaching up to 45ppm at certain points
during combustion activities in the laboratories, with particular reference to
“SBRS lab III” and Chemistry Multi-Purpose lab. Other pollutants like; NOx and
SO2 where observed to be within the limits
ii) Oxygen discovered to be at the critical level of 20.9% based on ASREA and
NAAQS standard and even falling below the limits as low as 20.4% at some
points in the laboratories.
iii) Laboratory is a basic requirement for the teaching and learning processes in the
university this evident from the frequency of use of laboratory( daily excluding
weekends) and the duration of hours spent in the laboratory( 2-4hr) by the
respondent ( staff and student)
iv) Combustion activities is practically unavoidable for teaching and learning
activities, and the major source of heat generation for the combustion activities
were with the use of gas burners except in few cases where there is limited supply
of gas the water bath is used as an alternative heat generating source which also
depends on the type of experiment performed

95
v) Adequate ventilation in some laboratories like; „chemistry SBRS lab II and III‟.
However, other laboratories studied were not well ventilated due to the absence of
fume hoods as in the case of‟ Chemistry Lab I‟ and none functional fume hoods in
the other laboratories.
vi) Combustion among other processes in the laboratory cause more discomfort and
affects the indoor air quality the most
vii) Fatigue is one of the most reoccurring health symptom of poor indoor air quality
due to combustion activities, however other health symptoms are: headache,
dryness and irritation, sinus congestion, blurred vision, sneezing and chest pain.
viii) In addition to combustion activities as a major cause of poor indoor air quality,
some other factors that intensify the effect of combustion activities in reducing the
indoor air quality are: congestion in the laboratories, inadequate ventilation
system and faulty heat generation devices
5.2 CONCLUSION
From the ongoing, the following are concluded:
Of the three major combustion pollutants investigated, Carbon-monoxide (CO)
with mean concentration of (23.67ppm) exceeded the ASHRAE Standard 62 limit of
9.0ppm. oxide of Nitrogen (NOx) and Sulphur-dioxide SO2 were found to be within the
prescribed limits of (0.0053ppm ) and ( 0.14ppm ) respectively.
The absence and none functional state of some Heating Ventilation Air Condition
(HVAC) requirement of a laboratory like; fume hood, air extracts, and adequate air

96
opening, void of obstruction account for the high concentration of the combustion
pollutants during combustion activities in the laboratories studied
Similarly, in adequate HVAC requirement can tantamount to insufficient oxygen,
with particular reference to SBRS lab III, accounting for the critical state of oxygen
during combustion( Oxygen been at 20.9%)
In addition to combustion activities in the absence of adequate HVAC system,
other activities that increase the generation of combustion pollutants in the laboratories
include the use of faulty burners, prolong and reoccurring combustions and congestion in
laboratories due to overpopulation of laboratory users.
The users identified the following symptoms; fatigue, headache, sinus
congestion, coughing and sneezing, dizziness, heart burn, nausea and blurred vision; as
health symptoms of poor indoor air quality resulting from the presence of combustion
pollutants during combustion activities in the laboratories

97
5.2 RECOMMENDATION
The following are recommended:
i) It is also recommended that fume hoods be installed in the laboratories that are
without fume hoods such as the Chemistry Lab I hood. This is to take care of the
gaseous pollutants from combustion activities
ii) Adequate provision and maintenance of the Heating Ventilation and Air
Conditioning (HVAC) system of the laboratories particularly the fume hoods
iii) The school authority as a matter of urgency should try and construct new
laboratories to address the challenges from congestion in the laboratories. This
will also help in accommodating the teaching and learning of the students enrolled
iv) Creation of awareness on the deadly health consequences of individuals exposure
to combustion indoor pollutants among staff and students within the institution
and even in the general public

98
REFRENCES:
American Lung Association (1992). "Indoor Air Pollution Fact Sheet - Combustion
Products". Publication No. 1182C.
American Thoracic Society, (1990) "Report of the ATS Workshop on Environmental
Controls and Lung Disease, Santa Fe, New Mexico, March 24-26, 1988."
American Review of Respiratory Disease; 142:915-39.
ANSI Z223.1-2006/NFPA 54-2009. National Fuel Gas Code. New York, NY: America
National Standards Institute, and Quincy, MA: National Fire Protection
Association.
ANSI Z21.11.2.-2007. ANSI Standard for Gas-Fired Room Heaters, Vol. II, Unvented
Room Heaters. New York, NY: American National Standards Institute.
ANSI Z21.1-2010. Household Cooking Gas Appliances. New York, NY: American
Nationa Standards Institute.
ASHRAE. 1989. Standard 62-1989, Ventilation for Acceptable Indoor Air Quality.
Atlanta:
ASHRAE ASHRAE. 1992. Standard 55-1992, Thermal Environmental Conditions for
Human Occupancy. Atlanta: ASHRAE
ASHRAE. 2004. Standard 55-2004, Thermal Environmental Conditions for Human
Occupancy. Atlanta: ASHRAE
ASHRAE. 2008. Standard 160-2008, Criteria for Moisture Control Design Analysis in
Buildings. Atlanta: ASHRAE
ASHRAE. 2010. Standard 62.2-2010, Ventilation and Acceptable Indoor Air Quality in
Low- Rise Residential Buildings. Atlanta: ASHRAE
CPSC. 2001a. The Inside Story A Guide to Indoor Air Quality. U.S. Consumer Product
Safety Commission, Washington D.C.
http://www.cpsc.gov/CPSCPUB/PUBS/450.html, accessed Jan. 2012.
CPSC. 2001b. Carbon Monoxide Fact Sheet. U.S. Consumer Product Safety
Commission, Washington D.C, 2001.
http://www.cpsc.gov/CPSCPUB/PUBS/466.html, accessed Jan. 2012.
CU. 2005. Unvented Gas Fireplaces Can Go Almost Anywhere. But Are They Safe?
CITY: Consumers Union, Consumer Reports March 2005,
http://www.consumerreports.org/ cro/appliances/heating-cooling-and-
air/fireplaces-gas/gas-fireplaces-306/index.htm, accessed Jan. 2012.
David H M (2010). Building Code and Indoor air quality. U.S Environment Protection
Agency office of Radiation and Indoor Environment Division
Environmental Protection Agency. (2009): EPA 402/K-07/008 www.epa.gov/iaq/schools
retrieved 26th January, 2013
Francisco, P.W., J.R. Gordon, and B.Rose. 2010. Measured Concentrations of
Combustion Gases from the Use of Unvented Gas Fireplaces. Indoor Air
20(5):370-379. Health Canada. 2011. Residential Indoor Air Quality
Guidelines, http://www.hc-sc.gc.ca/ewhsemt/ air/in/res-in/index-eng.php,
accessed Jan 2012.
Gergan, Pj., Weiss, K.B.( 1992) "The Increasing Problem of Asthma in the United
States". American Review of Respiratory Disease.. 146(4): 823-824.
Gold, D.R.( 1992) "Indoor Air Pollution". Clinics in Chest Medicine.. 13(2):215-229.

99
HUD. 2005. Healthy Homes Issues: Carbon Monoxide. Washington DC: U.S.
Department of Housing and Urban Development.
Hine, A et‟al (1993); Indoor Air Quality and Control, PTR Parnetice hall, eaglrwood
cliffs, New Jersey page 74-85
ICC. 2012. ICC International Fuel Gas Code. Washington DC: International Code
Council, Inc.IOM. 2004. Damp Indoor Spaces and Health. Institute of
Medicine, Committee on DampIndoor Spaces, Board on Health Promotion
and Disease Prevention. Washington DC: National Academy of Sciences
Press.
Jarvis D., S. Chinn, C. Luczynska, and P. Burney. 1998. The association of respiratory
symptom and lung function with the use of gas for cooking. Eur Respir J
11: 651-8.
Knol, A. B., et al. 2009. Expert Elicitation on Ultrafine Particles: Likelihood of Health
Effects and Causal Pathways. Particle and Fibre Toxicology 6:19.
Lipsett, M. (1992)."Oxides of Nitrogen and Sulfur." Hazardous Materials Technology;
000:964-69.
MMWR 1997. Use of unvented residential heating appliances – United States, 1988-199.
MMWR 46(51):1221-1224;
(http://www.cdc.gov/mmwr/preview/mmwrhtml/ 00050535.htm, accessed
May, 2008).
Mudarri, D. andW.J. Fisk. 2007. Public Health and Economic Impact of Dampness and
Mold. Indoor Air 17:226-235. NFPA. 2012. NFPA Standard 101-2012,
Life Safety Code. Quincy: National Fire Protection Agency.
NFPA. 2010. NFPA Standard 501-2010, Manufactured Housing. Quincy: National Fire
Protection Agency.
NYSDH. 2000. Supplemental Space Heaters. Albany: New York State Department of
Health, http://www.health.ny.gov/publications/3104.pdf, accessed Jan.
2012.
Olopade S (2010) . Fighting Indoor Air pollution , Global Health, Lung, public health
Rogge W.F. et al. 1993. Sources of fine organic aerosol. 5. Natural gas home appliances.
Environ. Sci. Technol. 27:2736-2744.
Samet, J.M., Spengler,J.D., eds (1991). Indoor Air Pollution - A Health Perspective.
Johns Hopkins University Press. Baltimore, MD..
Stanley, A M. (2010): Air pollutants concentration and noise level from Electric Power
Generators, PHD dissertation. Department of Building A.B.U Zaria.
U.S. Environmental Protection Agency (1987. The Total Exposure Assessment
Methodology (TEAM) Study; Project Summary.. EPA-600-56-87-002.
U.S. Environmental Protection Agency (1991), U.S. Public Health Service, National
Environmental Health Association. "Introduction to Indoor Air Quality: A
Self-Paced Learning Module". EPA-400-3-91-002..
U.S. Environmental Protection Agency (1993). "Review of the National Ambient Air
Quality Standards for Sulfur Oxides: Updated Assessment of Scientific
and Technical Information; Supplement to the 1986 Staff Paper
Addendum.

100
U.S. Environmental Protection Agency. "Building Air Quality: A Guide for Building
Owners and Facility Managers". U.S. Government Printing Office.
Washington, D.C. EPA-055-000-00390-4. December 1991.
U.S. Environmental Protection Agency.(1992) "EPA Indoor Environmental Quality
Survey".. OMB No. 2060-0244.
Zhang J and Smith K R (2005). Indoor Air Pollution from Household Fuel Combustion
In China The 10th International Conference on Indoor Air Quality and
Climate September 4-9, Beijing, China
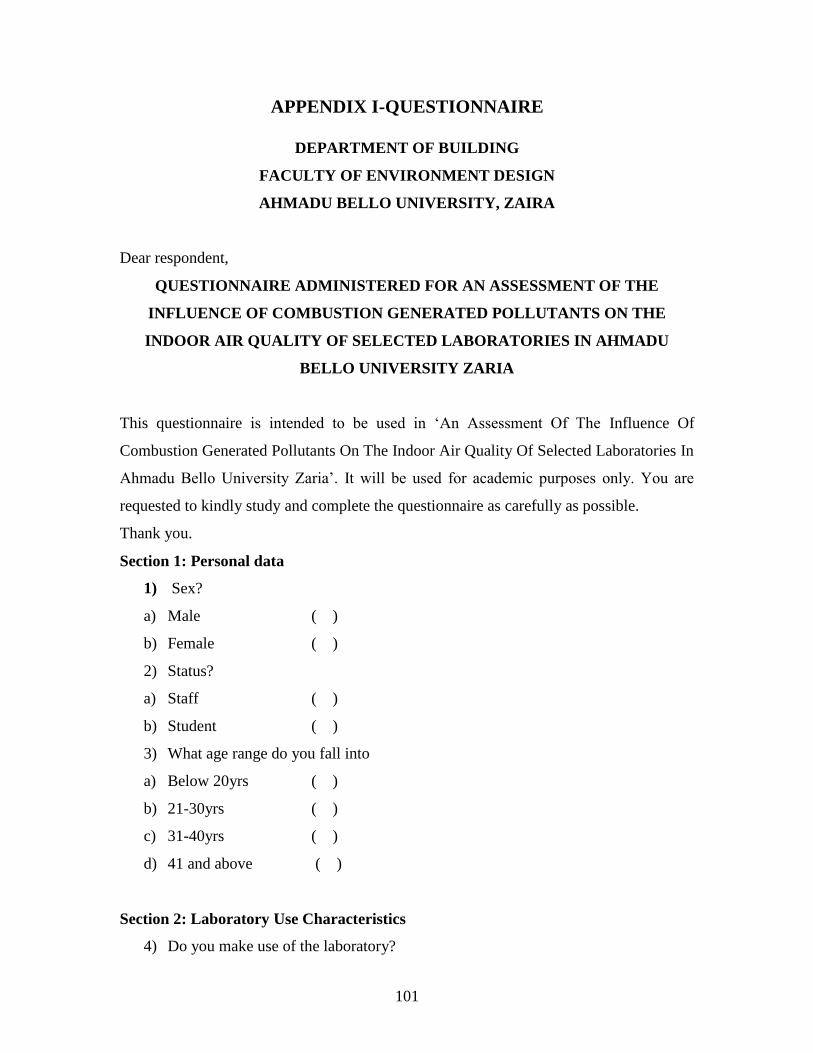
101
APPENDIX I-QUESTIONNAIRE
DEPARTMENT OF BUILDING
FACULTY OF ENVIRONMENT DESIGN
AHMADU BELLO UNIVERSITY, ZAIRA
Dear respondent,
QUESTIONNAIRE ADMINISTERED FOR AN ASSESSMENT OF THE
INFLUENCE OF COMBUSTION GENERATED POLLUTANTS ON THE
INDOOR AIR QUALITY OF SELECTED LABORATORIES IN AHMADU
BELLO UNIVERSITY ZARIA
This questionnaire is intended to be used in „An Assessment Of The Influence Of
Combustion Generated Pollutants On The Indoor Air Quality Of Selected Laboratories In
Ahmadu Bello University Zaria‟. It will be used for academic purposes only. You are
requested to kindly study and complete the questionnaire as carefully as possible.
Thank you.
Section 1: Personal data
1) Sex?
a) Male ( )
b) Female ( )
2) Status?
a) Staff ( )
b) Student ( )
3) What age range do you fall into
a) Below 20yrs ( )
b) 21-30yrs ( )
c) 31-40yrs ( )
d) 41 and above ( )
Section 2: Laboratory Use Characteristics
4) Do you make use of the laboratory?
102
a) Yes
b) No
5) If „No‟, have you ever being in a laboratory where combustion activity is taking
place? if yes proceed to question 6
a) Yes ( )
b) No ( )
6) If No to question five above, proceed to section 3, .How often to you use the
laboratory in a week?
a) Once a week ( )
b) Twice a week ( )
c) Daily including week days ( )
d) Daily including weekends ( )
7) How many hours per day do you spend in the laboratory
a) 0-2hrs ( )
b) 3-4hrs ( )
c) 5-6hrs ( )
d) 7-8hrs ( )
e) 9hrs and above ( )
8) Does you work entail combustion activities
a) Yes ( )
b) No ( )
9) What is the device used in generating the heat for the combustion activity
a) Candle ( )
b) Stoves ( )
c) Gas burners ( )
d) Hot plates ( )
10) Do you have a gas fume hood installed in the laboratory
a) Yes ( )
b) No ( )
11) Are the gas fume hoods functional?
a) Yes ( )

103
b) No ( )
12) Do you experience discomfort in the laboratory during the combustion activities?
a) Yes ( )
b) No ( )
13) During which kind of activity do you experience the discomfort more?
a) combustion process ( )
b) Filtration process ( )
c) Lab cleaning process ( )
d) Distillation ( )
14) Are there ventilation systems provided in the laboratory?
a) Yes ( )
b) No ( )
15) Is the ventilation during the combustion activities appropriate?
a) Yes ( )
b) No ( )
Section 3: Health Symptoms of Poor Indoor Air Quality
16) Do you have any allergies or other health problems that may account for any of
the listed symptoms?
a) Yes ( )
b) No ( )
17) Rank the following as the major symptoms of discomfort due to combustion in
the laboratories (1 to 7). ( 1 –strongly agree, 2 – agree, 3 –undeceive, 4- disagree,
5-Stongly disagree)
s/n Symptoms of poor indoor air quality due to combustion 1 2 3 4 5
a. Dryness and irritation of the eye, nose, throat and skin
b. Headache
c. fatigue
d Shortness of breath
e Hypersensitivity and allergies
f Sinus congestion
g Coughing and sneezing

104
h Dizziness
i Nausea
j Blurred vision
k Pains and discomfort
l Heart burn
m Sneezing and chest tightness
n Fainting
18) On average, how long have combustion process taken, when you notice the
symptoms?
a) Less than 1hour ( )
b) 2-4hrs ( )
c) Greater than 4hrs ( )
d) Greater than one day ( )
19) Have the pain or discomfort caused you to take times off the work
a) Yes ( )
b) No ( )
Section 4: HVAC and combustion related factors that are the causes of discomfort
20) Rank the following activities as a major cause of the discomfort in the laboratory
(1 to 7). (1 – not a cause , 2- not a major cause , 3- barely a cause, 4- a cause, 5-
always a cause )
s/n Measure 1 2 3 4 5
a. Combustion activities
b. Inadequate ventilation in the laboratories
c. None functional fume boxes
d. Unventilated combustion equipments
E Prolonged and reoccurring combustion activities
F Excess students carry combustion activities
beyond the capacity of the number of students
that the laboratory was built for
G Faulty bursen burners leading to the generation
of more fumes
105
H Air too humid
I Too little air movement
21) Do you think prompt attention should be paid to the indoor air quality in
laboratories
a) Yes ( )
b) No ( )
22) If „No‟ state what you think should be done to enhance combustion in the
laboratory and yet not jeopardizing human health? If yes, proceed to the next
section
………………………………………………………………………………………
…………………………………………………………………………………….
Section 5: Remedial Approach to the Discomfort due to poor indoor Air Quality
23) Rank the following activities as a measure of improving the indoor air quality
within the laboratory (1 to 4). (1 very Effective –, 2- Effective, 3- moderately
Effective, 4- not Effective)
s/n Measure 1 2 3 4
a. Provision adequate Heating Ventilation and Air
conditioning system (HVAC)
b. Introduction and maintenance of a functional fume
boxes
c. Ensuring adequate air flow rate especially during
combustion activity
d. The use of excellent combustion equipment that
will reduce the rate of generation of CO
E Orientation of both staff and student on the danger
in carryout combustion without adequate air flow
Thank you for your co-operation

106
APPENDIX II- CHECKLIST
DEPARTMENT OF BUILDING
FACULTY OF ENVIRONMENT DESIGN
AHMADU BELLO UNIVERSITY, ZAIRA
A CHECKLIST ADOPTED FOR AN ASSESSMENT OF THE INFLUENCE OF
COMBUSTION GENERATED POLLUTANTS ON THE INDOOR AIR
QUALITY OF SELECTED LABORATORIES IN AHMADU BELLO
UNIVERSITY ZARIA
INSPECTORS: ………………………………………………………………
LOCATION/ DEPARTMENT: ………………………………….
DATE: ……………………..
( √) Satisfactory/Present/ ok (X) Unsatisfactory, requires attention/absent/ insufficient
S/N GENERAL OBSERVATIONS (Walls, Ceiling and Floors)
1 Wall ceiling, work bench and window are free of mould ( )
2 Indoor plants free of mould and odor ( )
3 Flat surfaces dust free ( )
4 Thermostats in enclosed offices ( )
DIFFUSERS
5 Diffuser are unobstructed ( )
6 Diffuser condition( mould, dirt, duct) ( )
AIR EXHAUST LOUVERS
7 Louvers are unobstructed ( )
8 Louvers condition is clean ( )
POLLUTANTS SOURCES (~3METER FROM WORK
AREAS)
9 Chemical storage/ handling area ( )
10 Position of bursen burners ( )
11 Number of burners per work table ( )
CABON MONOXIDE SOURCES
12 Bursen burners, and other heating appliances ( )
13 Gas fired heating system ( )
14 Free standing gas heaters ( )
15 Other heating devices ( )
CIGAREETTE SMOKE
16 Smoking policy in place enforced ( )
VENTILLATION STSTEM (HVAC)
17 Adequate outdoor air intake ( )
18 Air intake clear of pollution sources ( )
19 Cleanliness of ducts and plenum ( )
20 Ventilation shut-down ( nightly/ weekends) ( )
Intake vent blocked, rusted

107
Exhaust vent blocked, rusted or debris present
21 Presence of air filter ( )
22 Air filter condition ( )
HUMIDIFIERS
23 Pans and wetting media are free of slime ( )
24 Duct are free from moulds ( )
25 Presence of fans ( )
26 Use of volatile chemical for humidifier ( )
AIR CONDITIONING SYSTEMS
27 Condensate trays free of slime ( )
28 Cooling coil free of slime ( )
GENERAL MAINTERNANCE DESIGN ( )
29 Windows can be opened ( )
30 Alterations to ventilation system ( )
31 Number of occupants in area ( )
32 Usage/condition of carpeting ( )
33 Work are repainted ( )
34 Presence of odors ( )

108
APPENDIX III- EXPERIEMENT RECORD SHEET
Sessio
n Of
The
Experi
ment
TYEPE
OF
COMBU
STION
POLLU
TANTS
Lab Name ……………………………………….
Measurement
BEFORE
COMBUSTION
Measurement
DURING
COMBUSTION
Measurement
AFTER
COMBUSTION
AVER
AGE
1ST
POI
NT
2ND
POI
NT
3RD
POI
NT
1ST
POI
NT
2ND
POI
NT
3RD
POI
NT
1ST
POI
NT
2ND
POI
NT
3RD
POI
NT
First
Sessio
n Of
The
Experi
ment
O2 (%)
CO(PP
M)
NOx
SO2
CO2
Secon
d
Sessio
n Of
The
Experi
ment
O2 (%)
CO(PP
M)
NOx
SO2
CO2
Third
Sessio
n Of
The
Experi
ment
O2 (%)
CO(PP
M)
NOx
SO2
CO2

109
APPENDIX IV –PLATES OF RESEARCH AREA
Fig 1: Chemistry Lab I Fig 2: SBRS Lab II

110
Fig 3: SBRS Lab III Fig4: Chemistry Multi Purpose Lab

111
FIG 5: Physical Chemistry Laboratory Fig 6: Masters Students Lab
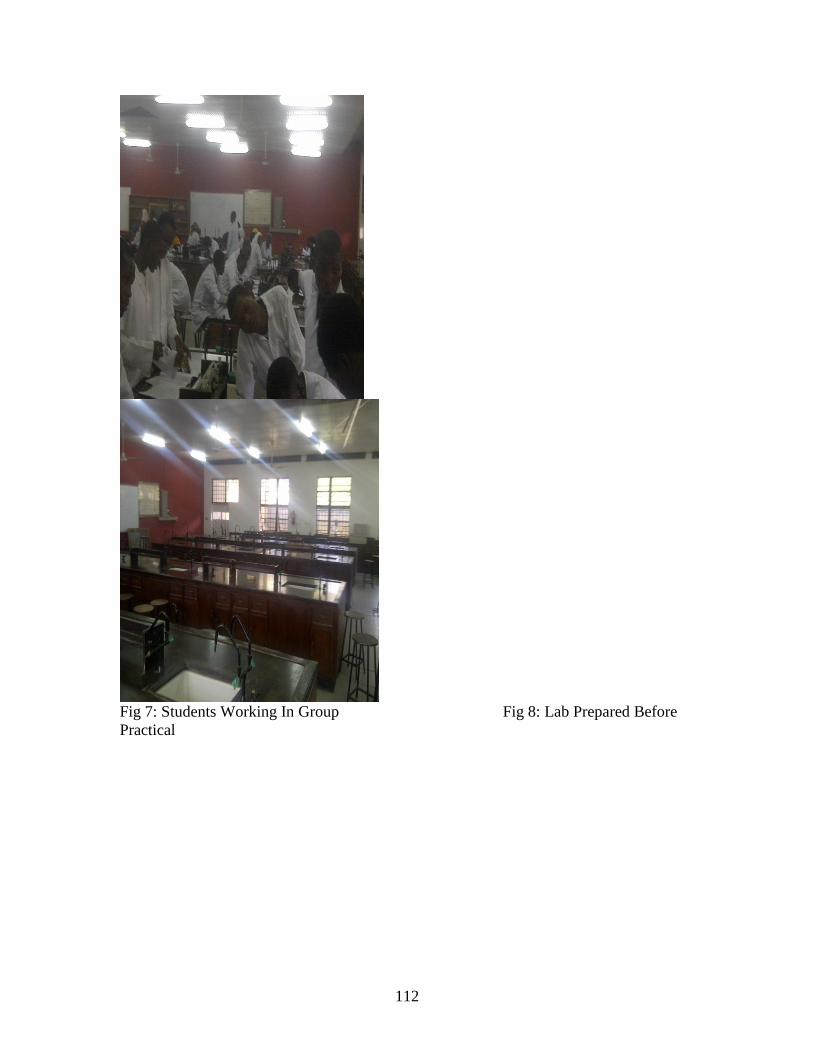
112
Fig 7: Students Working In Group Fig 8: Lab Prepared Before
Practical

113
Fig 9 : Student Taking A Pre-Lab Class Fig 10: A Fume Hood

114
Fig 11: A Water Bath Alternative Heater Fig: 12 IMR 1400C Gas Analyzer
Calibrating

115
Fig13: taking readings before practical fig 14: taking reading during
practical

116
Fig 15: Taking Readings after a Concluded Practical Fig16: Over-Crowded
Student during Practical