Embed Size (px)
Citation preview

Plasma Science and Fusion Center
Massachusetts Institute of Technology Cambridge MA 02139 USA
1MIT Plasma Science & Fusion Center, Cambridge, MA 02139, USA 2Max-Planck Institut für Plasmaphysik, Boltzmannstraße 2, 85748 Garching, Germany 3U. of Toronto Institute for Aerospace Studies, 4925 Dufferin St, Toronto, ON, M3H5T6, Canada 4U.C.S.D. Center for Energy Research 9500 Gilman Dr. La Jolla, CA. 92093, USA 5Forschungszentrum Jülich, 52425 Jülich, Germany 6Sandia Laboratories, P.O. Box 969 / MS 9161, Livermore, CA, 94550-9610, USA 7ITER ORG. Fusion Science and Technology Dept., Cadarache - Building 523 13108 St. Paul-lez-Durance, France 8Sandia Laboratories, Org. 1111, MS 1056 Albuquerque NM 87185, USA 9FOM-Rijnhuizen, Postbus 1207, NL-3430 BE, Nieuwegein, The Netherlands The work of the MIT authors was supported by the U.S. Department of Energy, Grant No. DE-FC02-99ER54512. Reproduction, translation, publication, use and disposal, in whole or in part, by or for the United States government is permitted.
PSFC/RR-10-4
An Assessment of the Current Data
Affecting Tritium Retention and its Use to Project
Towards T Retention in ITER
Lipschultz, B.1, Roth, J.2, Davis, J.W.3, Doerner, R.P.4, Haasz, A.A.3, Kalenbach, A.2, Kirschner, A.5, Kolasinski, R.D.6, Loarte, A.7, Philipps, V.5,
Schmid, K.2, Wampler, W.R.8, Wright, G.M.9, Whyte, D.G.1
April 2010

Page 1
An assessment of the current data affecting tritium retention and its use to
project towards T retention in ITER
B. Lipschultz1, J. Roth
2, J.W. Davis
3, R.P. Doerner
4, A.A. Haasz
3, A. Kallenbach
2, A.
Kirschner5, R.D. Kolasinski
6, A. Loarte
7, V. Philipps
5, K. Schmid
2, W.R. Wampler
8, G.M.
Wright9, D.G. Whyte
1
1MIT Plasma Science & Fusion Center, Cambridge, MA 02139, USA
2Max-Planck Institut für Plasmaphysik, Boltzmannstraße 2, 85748 Garching, Germany
3U. of Toronto Institute for Aerospace Studies, 4925 Dufferin St, Toronto, ON, M3H5T6,
Canada 4U.C.S.D. Center for Energy Research 9500 Gilman Dr. La Jolla, CA. 92093, USA
5Forschungszentrum Jülich, 52425 Jülich, Germany
6Sandia Laboratories, P.O. Box 969 / MS 9161, Livermore, CA, 94550-9610, USA
7ITER ORG. Fusion Science and Technology Dept., Cadarache - Building 523
13108 St. Paul-lez-Durance, France 8Sandia Laboratories, Org. 1111, MS 1056 Albuquerque NM 87185, USA
9FOM-Rijnhuizen, Postbus 1207, NL-3430 BE, Nieuwegein, The Netherlands
This report was prepared as an account of work done by a subcommittee of the ITPA
(International Tokamak Physics Activity) SOL/divertor group. The opinions herein represent
those of only the authors listed and not of the SOL/divertor group in general nor the ITER or
IEA organizations (this work started when ITPA was legally under IEA and has continued
while ITPA is currently operated under the aegis of the ITER legal framework).
The projections to ITER given in this report are a ‘most probable’ outcome based on our
pooled knowledge and compromises on a range of opinions. If one took into account the full
range of possibilities for all physics and materials range of projections to retention in ITER
would be so large as to be useless. Thus any range in the projection for a given material or
situation does not necessarily represent the underlying uncertainty (or error bars) but a
range of conditions that we deem ‘probable’ at this point in time.
Abstract:
While one goal of this study was clearly to construct projections to T retention in ITER
operation a requirement for this work was that it be as transparent as possible, thus allowing
interested readers to understand the foundations (in some cases quite weak) of those
projections. This study examined the assumptions underlying tritium retention in materials
and, based on assessments of applicable data ranges for each parameter, made projections to
ITER. Those projections were done for two limiting cases of main chamber fluxes, low
(1023
/s), and high (1024
/s), as well as for the standard ITER materials of Be first-wall, CFC
strike points, W baffle and dome as well as 3 other cases: all-C, all-W divertor and Be first
wall, and all-W PFCs. In general a fully-C first wall would be most probable to lead to the
highest T retention due to carbon’s characteristic longer distance movement to shadowed
areas (compared to Be) and higher T/C for a given surface temperature. While the standard
Be/C/W materials selection was found to probably lead to lower retention rates than for all-C
PFCs, replacing the CFC strike point region with W appears to lead to a small (far within
uncertainties) reduction in co-deposition due to the relative importance of the main chamber
Be source. The retention in the W sections of the divertor due to implantation will likely be
small compared to that of co-deposition of T with Be or C in all cases. The T retention
projections of this study do show that it is probable that an all W ITER would have the lowest
T retention levels. The uncertainties associated with the predictions of T co-deposition with C

Page 2
or Be lay primarily in the transport physics in the plasma after the Be or C are eroded. In
contrast the uncertainties in T retention in W are mostly in the specification of ion fluxes to
the surfaces and the physics of traps and T transport in the bulk. Retention of T in the bulk
presents a different challenge to T removal than co-deposition on the surface. In all cases
higher surface temperatures should reduce retention.
1. Background on the formation of this panel
As will be discussed later in this report there have been a number of studies aimed at
predicting T retention in ITER based on current knowledge and comparing the effect of
various PFC materials. Such studies have generally been the work of a few individuals and/or
the general emphasis of one national group (e.g. the EU). Most recently efforts in both the US
and EU occurred as part of the review of the ITER physics and engineering design (summer,
fall of 2007). In reviewing that work at the ITPA SOL/divertor meetings it became clear that
there were many differences in assumptions and techniques between the EU and US studies.
It was felt that by bringing those two groups together and providing much more detail about
assumptions and techniques we could potentially provide the general community and ITER
with a broader input and consensus. So this effort aimed to gather a broader database of
relevant information, evaluate its relevance, and use it to project to ITER. In addition, the
meeting was useful from the viewpoint of identifying areas in need of long-term future
research, and areas where short-term investigations could provide much needed information
almost immediately.
The group organized and met at M.I.T. June 23-24, 2008. This report attempts to document
the work presented at that meeting and which occurred over the following 6 months. We
hope it can be read by individuals in the field including ITER staff, and utilized as a reference
source as opposed to a real prediction of what will happen in ITER. Certainly there are large
uncertainties remaining in a number of areas that we hope will be addressed in the future. In
addition, any decisions made on PFC materials usage should include not only the issue of T
retention but also a number of other, perhaps more important operational characteristics (e.g.
dust, PFC lifetime, cost, effects on the core plasma, risks for operation….), as well as what is
required for T removal and recovery.
The structure of this report is the following: Following a brief review of past work in this area
(section 2) we proceed to review in Section 3 the literature of relevant data and derive either
our consensus fit to that data (e.g. retention in W) or make some reasoning to set the limits of
required input for calculations (e.g. conversion of eroded main chamber fluxes to co-
deposition). Based on the information from Section 3 we divided the main chamber and
divertor areas into regions of roughly consistent temperature and fluxes. Section 5 delineates
those fluxes and temperatures followed by the projections to ITER of probable retention for a
number of different material and flux cases (Section 6).
For future reference the names of individuals principally associated with the work described
in each section are listed in the section titles in parentheses. Note that each section will
contain a ‘concerns’ paragraph aimed at emphasizing where work is needed (and thus where
our assumptions and projections are most uncertain).
2. Introduction (Roth)
The choice of plasma facing component (PFC) materials for ITER is strongly dependent on predictions of heat/particle fluxes as well as the role of the material in tritium (T) inventory build-up in the vessel, which must be limited for safety reasons. The in-vessel tritium limit

Page 3
has been defined recently to be 700g tritium1. The restriction of the use of carbon fibre
composites (CFC) to the divertor strike points results both from the attempt to minimize the T
inventory and to optimize the lifetime of the PFCs. The selection of Be for the first-wall was based on the belief that the plasma interaction with the main wall was minimal and, if Be entered the plasma, its effect would be minimal. Tungsten was chosen for areas of the divertor to minimize the amount of carbon in the machine and because the erosion lifetime of beryllium components in these regions would be unacceptably short.
A simple scaling of the tritium inventory to ITER, based on a long term retention fraction of 10% of the injected fuel, as obtained in many today’s devices, leads to a very limited number of discharges (~ 100) before reaching the safety limit (assuming 200 Pam3s-1 of gas injection with a 50-50% mixture of D-T, resulting in 60 g tritium per 400s discharge) 2. However, these results are based on all-C devices and could overestimate the retention in ITER with only a C divertor assuming a Be first-wall leads to less T co-deposition with Be than the equivalent all-C ITER. Moreover, the physical basis for such an extrapolation is rather weak; considering the processes involved, the retention rate should scale as the recycling flux on PFCs rather than as the injected flux, although these are often correlated.
More detailed attempts have been made to estimate the T inventory build up in ITER utilizing methods with different levels of sophistication 3-5. In these evaluations the centre of interest was the plasma interaction with CFC divertor targets and the inventory estimate was based on code calculations for divertor erosion and tritium-carbon co-deposition. Input data for wall and divertor fluxes and flux distribution were taken from the B2/EIRENE model of partially detached ITER plasmas 6. Results were validated to present devices, e.g. to JET detached divertor plasmas 3 resulting in a co-deposition rate for ITER of 7 mgT/s, corresponding to reaching the inventory limit after about 250 discharges. A considerably improved data base for carbon chemical erosion 4 resulted in more than 1200 discharges before reaching 700 g tritium in the divertor.
In a later evaluation 7 the influence of the vessel wall was taken into account using simple
assumptions for a uniform fraction of Be impurity ions in the plasma incident on the divertor.
With 1% Be in the divertor edge plasma a tritium retention rate of 15.9 mg/s resulted, being
dominated by co-deposition with Be, reducing the number of discharges to ~ 100 before
reaching the 700 g limit. Discrepancies especially in describing detached plasma conditions
were large and made extrapolation to the ITER semi-detached plasma regime subject to
considerable uncertainties.
In the most recent by the EU community the results for C and Be were compared with the case of W 8, where ion implantation was assumed as dominant mechanism and the assessment was done on the basis of existing literature data from ion beams and plasma generators. The extrapolation to long exposure times was done using the experimental fluence0.66 power dependence. A rough estimate was made for the additional effect of tritium trapping in n-induced defects in the bulk of W tiles. A similar evaluation of the effect of n-irradiation on the tritium retention in W was performed by the US PWI community 9 yielding similar results.
The main conclusions from the EU community modelling studies of the ITER CFC/W/Be PFC option were that a) co-deposition with eroded carbon from the divertor plates will dominate the tritium inventory (1.25–5 mg/s tritium); b) Tritium co-deposition with eroded Be from the vessel wall is more uncertain due to larger uncertainties in the wall fluxes and uncertainties in the Be transport to the wall or divertor, but could contribute significantly to the total inventory (0.25–1.5 mg/s tritium); c) Implantation of T in the W sections of the divertor was found not to be limiting, although n-irradiation after years of D/T will increase

Page 4
the retention (estimated range: non-linear with fluence, <0.12 mg/s tritium). The effect of n-irradiation is highly uncertain and requires much more experimental and modelling work; d) The EU study of the W divertor/Be first wall option (remove CFC from the strike points), presently foreseen for the activated phase of ITER, reduces the tritium retention, extending the number of discharges until the tritium limit is reached to about 3000.
All the above assessments concentrated on the divertor as dominant source for erosion and co-deposition and put the level of sophistication on the refinement of input data for erosion, sticking coefficients, re-erosion and final co-deposition. In the present assessment an additional route will be evaluated - A direct estimate of the vessel wall erosion and subsequent migration and co-deposition with T at the divertors is made.
3. Assessment of existing data needed for this study
3.1 Main chamber fluxes (Kallenbach, Lipschultz)
Major sources of uncertainty in the estimates of retention are the particle fluxes to the vessel walls. Such fluxes engender erosion (leading to co-deposition if the material is Be or C) as well as directly implanting ions into the material (W). The fluxes also lead to heating of the surfaces which is important in determining the state of the D and T atoms in the PFC material whether implanted or co-deposited. It has been recognized over the past decade or so that there is much stronger cross-field transport in the SOL than thought given that the initial ITER specification was that only charge-exchange neutrals reached those surfaces. The goal of this study was to produce new estimates for time-averaged fluxes to main chamber surfaces in ITER, including ELMs. This information will be used for surface temperature estimates (Section 5 and appendix B) and then T retention estimates (both local and after transport to the divertor).
The details of how SOL profiles are predicted for ITER are given in appendix A.1. The separatrix density and temperature are scaled from a database of existing tokamak data for that region. The resultant empirical prediction is found to be similar to that determined through B2-Eirene modelling. The fluxes to the edge of the grid in the B2-Eirene model lead to wall fluxes of ~ 1x10²³ ions/s. That value is considered to be a lower limit to what will be likely in ITER as there is a large region between the edge of the modelling grid and the first-wall for which, in today’s tokamaks, the transport is thought to be convective. To estimate the convective limit to wall fluxes we pursue two methods: The first analysis is based on ASDEX-Upgrade SOL plasmas and interactions with main chamber surfaces for ITER-like conditions. The second analysis utilizes a model of cross-field ion transport driven by convection to predict the convective velocity at the ITER limiter radius. Those disparate empirical methods gave similar values for the radial ion flux density at the limiter radius, ~1x1024 ions/s. Given the uncertainties we have agreed to use the range 1x10²³ (based on B2-Eirenne) to 1x1024 ion/s (based on this empirical scaling) for the various calculations that follow.
The heat fluxes corresponding to a range in affected first-wall surfaces were also estimated in Appendix A. The power reaching the first wall surfaces (limiters and upper divertor) are very uncertain given the difficulty in determining the ELM characteristics at the first-wall consistent with the current ITER assumption of 1MJ, 20-40 Hz ELMs. A second concern is the splitting of ELM (and non-ELM) power between the upper divertor and the main chamber limiters which is not well documented at this time. With those caveats we have estimated the heat reaching all surfaces outside the lower divertor to be in the range up to 22

Page 5
MW. Based on those heat fluxes we then calculate the surface temperatures at various main chamber locations (Appendix B).
Concerns: More data on SOL profiles at the highest current (and a range in densities) in JET would probably give more confidence in these general wall fluxes. However, the biggest uncertainty probably lies with the fluxes to individual components. We cannot really predict ELM fluxes in general and specifically for the 1 MJ energy limit for ELMs mandated for ITER. Furthermore the 3D nature of the vessel surfaces really requires a 3D calculation to properly understand the variation of particle and heat fluxes, not to mention the local re- and co-deposition of material. The role of neutrals is not well understood as well.
3.2 Erosion rates at first-wall surfaces (Doerner, Roth, Philipps, Whyte)
As discussed in Section 3.1 the eroded first-wall material plays an important role in co-
deposition, both locally (e.g. in tile gaps) and remotely at the inner divertor. At the moment
our current assessment is that the eroded main chamber Be or C can dominate the inner
divertor co-deposition. Given the wall fluxes calculated in the previous section we need
estimates of the wall erosion those fluxes engender as well as how much of that eroded
material is transported to the inner divertor and co-deposits there vs. locally re-deposited (and
potentially co-deposited).
We have assumed a 2% erosion yield for both chemical/physical sputtering erosion of C as
well as sputtering erosion of Be at main chamber surfaces. This value is a compromise for
several reasons. If one relied on TRIM calculations one would have Be erosion yields of ~ 5-
7%. Ion beam experiments do measure yields close to the TRIM calculated values. However,
in plasma devices the sputtering yields are consistently lower than the calculated values. For
example, in PISCES, the sputtering yields are a factor of ~3-5 less than TRIM would
calculate (see 10
). Results from JET also show erosion yields that are ~5x less than TRIM
calculations 11
as well as much larger 12
. We note that the single value for erosion rate is not
consistent with the range in parameters used in other sections. But that was what was used.
For the low flux regions of the main chamber the yields for erosion of C are similar for
chemical (~ 1%) and physical (~ 2%).
Given the above uncertainties we have kept the erosion yield for both C and Be in the main
chamber to be 2%. This has the added advantage of allowing for a better comparison of
retention (both local and remotely at the inner divertor) attributed to each potential main
chamber material. Also, in spite of the different erosion mechanisms, the interactions (ionization rate, penetration depth into the SOL plasma, re-deposition fraction, etc.) of the different eroded materials in the edge plasma are treated identically.
Concerns: As already discussed above there are differences in the datasets in terms of comparison of ion-beam and plasma experiments and tokamaks that can be quite large for Be. Here, as opposed to other sections, there was one value chosen (2% erosion) for Be as opposed to a range. That unfortunately gives the reader the impression that this value is certain, which is incorrect. The error bars around any Be result should be large (not estimated) as they are in addition to any uncertainties in Be migration and co-deposition physics. For carbon erosion the same value was chosen; large uncertainties of this value
remain in view of the dependence of chemical erosion on the local erosion conditions. All of those uncertainties could, and should, be reduced. Furthermore, the local erosion rates at the first wall in existing carbon PFC tokamaks (and for Be in JET) are strongly needed to verify whether in fact the predictions of main chamber erosion based on laboratory data are valid for

Page 6
Figure 3.3.1: Data for global transfer rate of C from
first wall to inner divertor. Data are taken from a
number of references [16-19]
tokamaks. Such information is also needed in conjunction with the uncertainties in the following section having to do with the level of local re- and co-deposition of eroded materials and how it transports around the tokamak and into shadowed areas.
3.3 Conversion of eroded main chamber material to co-deposits -> material migration (Kallenbach, Philipps, Whyte)
The method of estimating this quantity was strictly empirical, under the assumption that main
chamber erosion is the source of C or Be co-deposition at the inner divertor. It ignores
erosion and re-deposition (and retention) at the outer and inner divertor plate. Such processes
are included only in the plasma and impurity transport code model of the divertor (see
Section 6.1b).
Two cases were chosen to cover the range in main chamber ion fluxes described in section
3.1: Low flux (1x10²³
/s) and high flux (1x1024
/s). In the low flux case all the eroded material
is assumed to be transported to the divertors and leads to co-deposition. In the high flux case
we have assumed that 50% of the eroded material is transported to the divertors. To be frank
we have no physics basis for selection of the above fractions of erosion transported to
the divertors. We know that it is not zero as experimental measurements clearly show co-
deposition rates at the inner divertor of similar order to that eroded from the main chamber.
We feel it is unlikely in the high flux case that all the eroded material makes it all the way
around to the inner and outer divertor from main chamber surfaces. That leads to an
compromise value of 50% of eroded material being locally re-deposited. Finally, we have not
properly dealt with what fraction of locally re-deposited material is co-deposited with D/T
atoms (and where).
The net material/impurity eroded from
main chamber surfaces is assumed to
flow along the scrape-off layer field lines
into the divertor, with 80% of the
impurity flux being deposited at the inner
divertor while 20% is deposited at the
outer divertor. This assumption is based
on results from surface analysis of
deposited layers in JET and ASDEX
Upgrade 13-15
. The impurity flux arriving
in the divertor is assumed to follow the
spatial D-T ion flux density distribution
according to B2-Eirene modelling of
ITER (case 1084) 6. We do this for
simplicity as we have very little data on
this subject. And of course we have not
taken into account erosion and
redeposition of the material that reaches
the inner divertor from the erosion sites
in the main chamber nor erosion of
divertor material.
Combining the above assumptions on flow direction and fraction reaching the divertors with
that of the previous sections (first-wall particle fluxes and erosion rates) the following
material arrival rate at the divertors is predicted and will be used for co-deposition studies:

Page 7
Figure 3.4.1: Data for retention of D co-deposited with C, Be and W.
1. High flux case (2% yield, 50% stays at first-wall, 80% to inner divertor)
flux of Be+ to inner divertor = .02*0.5*0.8*1x10
24/s = 8x10
21/s
flux of Be+ to the outer divertor = .02*0.5*0.2*1x10
24/s = 2 x10
21/s
2. Low flux case (2% yield, 0% stays at first-wall, 80% to inner divertor)
flux of Be+ to inner divertor = .02*1.0*0.8*1x10
23/s = 1.6 x10
21/s
flux of Be+ to the outer divertor = .02*1.0*0.2*1x10
23/s = 4 x10
20/s
Note - the above estimates do not include neutral sputtering.
We note that the ERO modelling, shown later, utilizes an assumption of 1% Be in the
incoming ion fluxes to the inner divertor plate (0.1% to the outer divertor plate). The ion
fluxes to those plates, originating from a B2-Eirene model case, were 2.5x1024
/s and 4x1024
/s
for the inner and outer divertor. The resultant Be+ fluxes assumed are then 2.5x10²²
/s and
2.5x10²¹
/s respectively. We consider these to be the equivalent of the ‘high flux case’ from
the empirical scaling.
As a separate method of obtaining the rate of first-wall material reaching the inner divertor we reviewed the literature of material accumulation at the inner divertor derived from post-campaign analysis for carbon PFC first-walls 16-19. The results (Fig. 3.3.1) appear to scale with R or surface area1/2. The projection to ITER leads to a value of ~ 1x10²¹/s although significantly higher and lower values would be consistent with the data. Data from campaign-integrated deposition necessarily integrates over all kinds of plasmas – including Ohmic, low-density, disruptions, ELMs,…. – not constant high-power discharges as assumed for ITER. On that basis the projection of Figure 3.3.1 appears quite consistent with the projection based on the assumptions of the previous sections for the low flux case.
Concerns: The assumptions of this section are in dire need of further support from experimental data. We have made too many assumptions that are ill supported by experimental data or modelling for that matter. Ideally we should have time dependent data for the deposition of C and Be at all main chamber locations and the divertor (+ any sheltered regions in the divertors like a dome) that can be connected back to the corresponding sources at the main chamber and divertor surfaces. In particular we need to obtain a better understanding of what happens to main chamber erosions: What fraction is locally re- and co-deposited? How much transports farther away to surfaces still considered main chamber and at what rate of movement and deposition (and co- vs re-deposition)? What amount is due to neutral sputtering?
3.4 Properties of T retained in co-deposited material (Doerner, Roth, Schmid)

Page 8
The co-deposited tritium retention properties for each of the three first-wall material cases have been assessed. It is well known that the level of hydrogen in co-deposited materials drops with the temperature of the surface during implantation (Figure 3.4.1 8). We note that the effect of raising the temperature after co-deposition has not been well studied and should be the subject of future work. In the case of a tungsten first wall there is very little erosion, and together with low co-deposition fractions (<0.120,21), leads to negligible tritium accumulation due to co-deposits. The situation is much different for co-deposits of T with carbon and beryllium where both the erosion rate and the T concentration in co-deposited surfaces is higher.
The tritium retention properties of the different material co-deposits have been studied 22.
Detailed measurements in PISCES for co-deposition as function of energy, temperature and
impurity flux ratio have led to the following equations:
(D+T)/C = (2.0 x 10⁻²)* En-0.43 * ( (D+T)/ C)0 * e(2268/T
c) [Tc 473K]
(D+T)/C = (2.0 x 10⁻²)* En-0.43 * ( (D+T)/ C)0 * e(2268/473) [Tc 473K] (3.4.1)
(D+T)/Be = (5.82 x 10⁻⁵)* En1.17 * ( (D+T)/ Be)
-0.21 * e(2273 /Tc) (3.4.2) (D+T)/W = (5.13 x 10⁻⁸)* En
1.85 * ( (D+T)/ W)0.4 * e(736 /Tc) (3.4.3)
The equations use the incident particle energy, En, the ratio of the two arriving particle fluxes, D/ X , and the temperature of the co-depositing layer, Tc, to determine the level of tritium
retention in the co-deposit. While not used, the retention in tungsten co-deposits is listed for completeness. Details concerning these equations are presented elsewhere 23.
The co-deposited D-T fraction is calculated using the analytical formula (equation 3.4.1-3)
with the ion impact energy E and the surface temperature, Tsurf, and the impurity flux ratio
( (D+T)/ Be) as input parameters.
The ion impact energy is estimated as 5*Te, with Te taken from the B2-Eirene model for the
divertor. Since the ITER divertor parameters (E, Tsurf) were partly outside the validity range
of the analytical co-deposition formula, (473 < Tsurf< 973 K, 15 < E <100 eV) its
extrapolation had to be specified:
For Tsurf < 473 K in carbon, the value for 473 K was used, in accordance with experimental
trends. For Tsurf > 973 K in carbon, the exponential decay of the co-deposited fraction was
extrapolated. Regarding the impact of energy dependence, the co-deposited fraction for
E=15 eV was used for E<15 eV and the value for E=100 eV was used for E>100 eV.
Concerns: This area appears to be fairly mature and, for the purposes of our work, in pretty good shape. The main concerns are whether the studies that led to the above scaling relations properly cover the right ranges of Be, C and D+T fluxes and their ratios. The question of how varying temperatures after co-deposition affects affects the retained tritium concentrations is presently being addressed and could significantly change the results (e.g. ELMs heating surfaces).
3.5 Implantation of tritium into tungsten (Davis, Doerner, Haasz, Kolasinski, Mayer, Philipps, Roth, Wampler)
In the interest of including a fairly wide range of data we have collected the data from ion
beam experiments 24,25
, linear plasma generators 26-33
and tokamaks 27,34,35
. We have been
more liberal than a previous summary of such data 8 in expanding the energy range to 38-500
eV (staying below the energy of direct trap creation by the implanted ions) and have included

Page 9
1E22 1E23 1E24 1E25 1E26 1E27
1E18
1E19
1E20
1E21
1E22
1E23
y = 8e21 * (x^0.66/(1e18+x 0̂.66))
HStQ Olga
Toronto
DIONISOS
TPE Causey
JAERI
PISCES Doerner
FTU Loarte
Magnetron Alimov
PISCES Wampler
PSI2Loarte
TEXTOR
ASDEX Up, 400K
TPE Kolasniski
Reta
ined (
D/m
2)
Fluence (D/m2)
y = 1.5e22 * (x^0.55/(1e14+x^0.55))
poly-W500 KD energy 38-500 eVTDS
400K
Figure 3.5.1: Data for retention of implanted D in tungsten. Data from the following sources: HstQ Olga [25], Toronto [24], DIONISOS [29], TPE Causey [26], JAERI [31], PISCES/Doerner [30], FTU [27], Magentron/Alimov [28], PISCES/Wampler[33], PSI2 [27], Textor [34], ASDEX-Upgrade [35], TPE/Kolasinski [32].
a variety of different W materials. The temperature of W specimens was kept in the range
around 500 K. The analysis method for the laboratory data was in all cases thermal
desorption spectroscopy (TDS).
The retention data included in this summary are shown in Fig. 3.5.1 as function of incident
fluence. In this energy range, the ion-beam studies for fluences of ~1021
to ~1025
D/m2 show
that the retained amount of D is roughly proportional to the incident fluence to the power of
0.5-0.7 24,36,25
. Retention measurements in linear plasma devices at higher fluences ( 1026
/m2)
and fluxes (>1022
/m2s) evidence no consistent trend among themselves in terms of fluence
scaling. For example several studies show essentially no fluence dependence 31,32
, while the
recent PISCES results at somewhat higher fluence 33
show a fluence dependence comparable
to the ion-beam studies.
In order to use the information contained in Figure 3.5.1 in T retention calculations we have
fitted limits to the data as shown. As can be seen from the equations included in the figure
the upper limit curve follows a fluence0.55
scaling. The lower limit curve has a fluence0.66
dependence. As is clear from the curves we have assumed that the power law scaling of
retention with fluence saturates at the highest fluences. This ‘assumption’ is not strongly
supported in the sense of our real understanding as the results are minimal and mixed with
respect to saturation as described above; the TPE and PISCES data have different
dependences on fluence. At the same time JAERI laboratory data, at even higher fluences, are

Page 10
saturated in retention. The JAERI data consists of detailed measurements of the temperature
dependence of retention vs fluence while the datapoints in Figure 3.5.1 represent the
maximum values. The flattening of the two fitted curves thus comes from a combination of
bracketing the experimental data and what we view as the likely probability that the retention
will saturate. The saturation level for the fits is given in the figure: 1.5x10²²
and 0.8x10²¹
/m2
were assumed. The amount of saturation is clearly debatable.
Figure 3.5.1 also includes data from tokamak experiments for comparison with the laboratory
results. Those results are acquired under less controlled conditions, with ranges in surface
temperatures and fluxes for each measurement. The FTU and Textor results were acquired
with short term limiter tile exposures which, due to the nature of limiter tiles, likely leads to
fairly high temperatures, beyond the 500K of the laboratory data in the figure. The ASDEX-
Upgrade results were obtained from post-campaign analysis of divertor Langmuir probes
manufactured from solid tungsten 15
. As such
they experienced the fluxes integrated over a
campaign of discharges. Those W samples also
experienced the effects of transient temperature
increases due to disruptions and ELMs. We
note that the ASDEX-Upgrade samples have
been assigned an implantation temperature of ~
400K based on an estimate of average
exposure temperatures (averaged over ELMs
where there would be very short time period
increases in temperature). When that data is
scaled to 500K (the temperature of the
laboratory data), based on the discussion that
follows, the retention drops slightly. Even with
all the above caveats the tokamak data falls
within the general spread of the laboratory
data.
The ASDEX-Upgrade studies also revealed important information relevant to later discussions comparing retention in carbon vs tungsten. Over a period of 5 years the amount of tungsten-coated surfaces in ASDEX-Upgrade has steadily increased from 0-100%. The campaign-integrated retention for the corresponding campaign periods has been analyzed. The data from that analysis, given in Figure 3.5.2, shows that campaign-averaged retention has steadily dropped as the amount of carbon PFCs is reduced 15,35. In addition the type of retention has moved from dominated by co-deposition at the inner divertor plates to dominated by implantation at the outer divertor plates (as expected). There also exists ASDEX-Upgrade data for single-discharge retention 37 which indicate a saturation of retention with increasing fluence. Since it is not normalized to the implanting ion flux it cannot be included in Figure 3.5.1.
The other tokamak with all high-Z PFCs is Alcator C-Mod. The material is molybdenum
which is comparable in many ways to tungsten in terms of lattice structure and hydrogenic
retention. The full campaign-integrated retention 38
is lower than ASDEX-Upgrade, more on
the level of the TPE results (~ 2x10²¹
/m2 retained for ~ 10
26/m
2 integrated fluence
32). On the
other hand the single-discharge (quiescent, non-disruptive) retention (~ 1-2% retention at an
ion fluence of 1023
/m2) is at or slightly above the upper limit fit in Figure 3.5.1, a factor of 5-
10 higher retention than the highest laboratory data at those fluences. The differences
between single-discharge and campaign-integrated retention (~ 1000x lower) is thought to be
due to disruptions removing retained fuel.
0.1
1
2002/2003 2004/2005 2005/2006 2007
Inner divertor
O uter divertor
Rem ote areas
Total
D-I
nve
nto
ry in
3000 s
[g]
Campaign
Fig. 3.5.2: D inventory in AUG from post-campaign surface analysis [15].

Page 11
300 400
Model used
500 600 700 800 900 10000,01
0,1
1
10
Hydro
gen isoto
pe r
ete
ntion [10
20 (
D+
T)/
m2]
Exposure temperature [K]
Ogorodnikova et al. (2007) TDS
Alimov et al. (2007) NRA
Luo et al. (2006) TDS
Causey et al. (1999-2001) TDS
Tokunaga et al. (2005) TDS
Alimov, Shu (2007/08) TDS
Haasz et al. (1998) TDS
Sharpe et al. (2009) TDS
Figure 3.5.3: Temperature dependence of the hydrogenic retention in W measured at different ion fluxes and fluences. Ogorodnikova [42], Alimov [41], Luo [40], Causey 1999 [26], Tokunaga [39], Alimov/Shu [31], Haasz [24], Sharpe [32].
Author Implantation Energy
[eV]
Flux
[D/m2/s]
Fluence
[D/m2]
technique
Ogorodnikova [42] D beam 200 3x10¹⁹
3x1024
TDS
Alimov [41] D plasma 200 1x10²¹
9x1024
NRA
Luo [40] D plasma 98 1x10²²
1x1025
TDS
Causey [26] D+T plasma 100 9x10²¹
3x1025
TDS
Tokunaga [39] D plasma 100 1x10²²
1x1025
TDS
Alimov,/Shu [31] D plasma 38 1x10²²
1x1026
TDS
Haasz [24] D beam 500 8x10¹⁹
1x1024
TDS
Sharpe [32] D plasma 70 8x10²¹
1x1026
TDS
Table 3.5.1: Details of all the data used in deriving the scaling of retention with fluence dependence on material temperature, Figure 3.5.3
While the data of Figure 3.5.1 only
included a limited range of
temperatures we must also take into
account the temperature dependence
which appears to have other
dependencies as well. The data of
Figure 3.5.3 (some from that of
Figure 3.5.1 plus others 24,26,39-
42,31,32) includes a range in
temperatures and fluxes as well as
fluences (1024
– 1026
D+/m
2). To be
able to plot all such datasets on the
same graph we have scaled the
retention to a fixed fluence of
1024
/m2 under the assumption that
retention scales as fluence0.66
, the
lower limit scaling of Figure 3.5.1.
We note that above ~500 K, which
is most relevant for ITER, the
retention generally decreases with
increasing temperature. In order to
take this effect into account, a
common temperature dependence was fitted to the maxima of the temperature dependence of
each flux. It is shown in the figure as ‘model used’ and is given by 57.75xexp(-T/185.), an
exponential decay with a characteristic temperature of 185 K.
As obliquely referred to above the data of Fig. 3.5.3 appear to show some flux dependence as
well. For the lowest flux 36,25
the retention drops monotonically as a function of temperature.
For fluxes above 1x10²¹
/m2s the retention curves exhibit a maximum over a wide temperature
range (~400-600 K). The curves which have the highest temperature peaks also correspond to
data for the higher fluxes; There may be some decrease in maximum retention with
increasing flux as well. The information about where the maximum in retention occurs as a

Page 12
function of flux is not included in this study but clearly should be the subject of future work.
Concerns: In general there is considerable laboratory data on hydrogenic retention in
tungsten. It is unfortunate that at the highest fluences there is very little data and we are
basing our projection of saturation on that. It would be good to have more confidence in that,
particularly at the fluxes of ITER which are higher than any of the lab data. At first glance the
tokamak data appears to be roughly consistent with the laboratory data shown. More
thorough investigations are needed to obtain better statistics (and thus confidence) and to
better determine if there are differences between the tokamak and laboratory experience. It
will be difficult to construct such experiments under controlled conditions. We are also
lacking a reasonable model of implantation and transport in the W that will explain the
variations in the data shown and give us guidance as to whether we should expect to observe
saturation at the higher fluences or even how the retention should scale with fluence and
material temperature.
More specifically the detailed physics of what happens in the implantation region and beyond
is the subject of much speculation. For example it has clearly been observed that bubbles are
formed, typically a few microns below the surface. Such bubbles appear often to eventually
rupture thus limiting the retention and potentially blocking the hydrogen from diffusing
further into the material. Better understanding of this phenomena and its dependence on
fluxes, grain size and orientation would be helpful for retention as well as for dust formation.
Another process that may lead to reduced T retention is the simultaneous bombardment with
He. There is also the possibility (based on C-Mod results) that multiply-ionized impurities in
the plasma (Be, C, O) are being implanted at high energies into the tungsten and directly
creating traps there, a process that would increase retention but unlikely to occur in
laboratory plasmas.

Page 13
0.01
0.1
1
10
0.01 0.1 1 10
D p
er m
etal
ato
m (%
)
displacements per atom (dpa)
~104 ITER D-T shots
intrinsicD/metal
Source Metal T (K)
Fukomoto W 473Takagi Mo 493Wampler W 470Wright Mo 400Wright Mo 500Wright/Whyte Mo 500
fit used for enahnced D/metal atomfrom displacements ts
total
ITERend oflifetime
Figure 4.1.1. The increase in deuterium concentration due to damage from ion irradiation
in tungsten [48-49] and molybdenum [29, 50-51].
4. Neutron damage which leads to enhanced fuel retention in tungsten
4.1 Neutron damage effects (R. Kolasinski, W. Wampler, D. Whyte)
Fusion neutrons produce displacement damage in materials. Tritium atoms injected into
tungsten from the plasma diffuse through the metal lattice and may become atomically bound
at lattice defects, referred to here as trapping. Vacancies, vacancy clusters and voids are
particularly effective traps for hydrogen in metals 43
. Here we consider the potential impact of
such trapping on tritium retention at neutron damage sites in tungsten. The amount of damage
is characterized by the number of displacements per metal atom (dpa). The damage rate can
be calculated from the flux and energy spectrum of neutrons using collision cross sections
from nuclear data libraries 44
. Such calculations for ITER are reported in the 2004 ITER
Nuclear Analysis Report 45
, which gives an end of life damage level of 0.7 dpa for tungsten in
the divertor from a neutron power fluence of 0.26 MWa/m2 at a rate of 0.4 MW/m
2 for 0.63
full power year (FPY) or 2x10⁷ full power seconds (FPS). The corresponding damage rate is
therefore 1.1 dpa/FPY or 0.35x10⁻⁷
dpa/FPS, or 2.7 dpa/MWa/m2. Converting the neutron
power flux to the equivalent particle flux n of 14 MeV neutrons, this damage rate can be
expressed as a cross section for damage production of sd = 2.0x10⁻²¹
cm2 46
, where the damage
rate is given by sd n.
The number of defects and trap sites for tritium is less than the number of dpa because many
of the defects anneal. For example, in tungsten, interstitials are mobile and recombine with
vacancies below room temperature. Vacancies are mobile and anneal at temperatures above
about 600K 47
, whereas vacancy clusters and voids are stable to higher temperatures.
Experiments are therefore necessary to establish the concentration of hydrogen isotopes
retained for a given displacement damage.
Figure 4.1.1 shows a summary of several studies of the increase in deuterium retention due to

Page 14
displacement damage in tungsten 48,49
and molybdenum 50,29,51
near 500K. Molybdenum was
included because of the dearth of related data and because in general hydrogenic retention in
Mo is similar to that in W. Note that an assumed level of intrinsic traps in W of ~ 5x10⁻⁴
24
was used and is shown as a horizontal band for reference. This is a conservative assumption
as other studies have found lower levels, the value of which depends on processing. In these
studies, damage was produced by energetic ions rather than neutrons. This produces damage
similar to that of neutrons, but localized near the surface and peaked near the end of range of
the ions which is typically a few microns. The damaged metal samples were subsequently
exposed to a high fluence of low energy deuterium from a plasma to simulate ITER plasma
exposures. The resulting deuterium concentrations were then measured versus depth, in most
cases by nuclear reaction analysis, which typically has a maximum depth of analysis of a few
microns. Figure 4.1.1 shows the increase in D concentration due to the damage, averaged
over the damage profile, versus dpa. The dpa is calculated based on an average damage over
the range of the damaging ion using SRIM (not just at the peak damage location) 52
. In these
calculations a value of 40 eV for the displacement threshold energy was used for consistency
with the damage calculations reported in the 2004 ITER Nuclear Analysis Report 45
. This
displacement threshold energy is consistent with values from electron irradiation studies,
although higher values are reported for damage from ion and neutron irradiation 53
. Figure
4.1.1 thus provides the relation between damage and maximum concentration of D (or T) that
is trapped at this damage assuming that the T, implanted at the surface, can reach that
location.
As shown in figure 4.1.1, the concentration of trapped deuterium is about 0.01 D/W for the
0.7 dpa end of life damage in ITER. Assuming 50%D and 50%T, this corresponds to an
increase in tritium inventory with damage at a rate of 7.1x10⁻³
T/W/dpa or 2.2kg/(m3 dpa) or
7.8x10⁻⁵
gram/(m3 FPS) in ITER. The impact of this on tritium inventory in ITER depends
on the volume of tungsten throughout which this trapping extends. Since the damage from
neutrons extends throughout the entire volume of tungsten in ITER, there is the potential for
tritium to be trapped at this damage throughout the entire volume. This would give a large
contribution to the tritium inventory of 0.16 milligram/FPS in the divertor (210m2 x 0.01 m
thick tungsten) and 0.53 milligram/FPS in a tungsten main chamber wall (680m2 x 0.01m
thick), reaching an end of life inventory of 3.3 kg in the divertor and 10.7 kg in the main
chamber wall assuming it is tungsten. However, it is presently not known whether tritium
retention at damage will extend to depths of a centimeter. No data is available that give D
retention at displacement damage in tungsten from exposure to plasma at depths greater than
a few microns. Haasz et. al. reported D concentrations of ~ 0.001 D/W extending to 25
microns in undamaged tungsten foil after implantation with 500 eV D at 500K 24
, but these
were intrinsic traps of unknown type not produced by displacement damage. Furthermore,
the rate of tritium uptake may be limited by the rate at which tritium can reach the traps
rather than by the rate of trap production, particularly on the vessel wall where lower fluxes
lead to slower uptake.
For the purposes of modelling we need to abstract from Figure 4.1.1 a general algorithm for
describing the D/W as a function of dpa: The fit, shown in the figure, is:
“displacement damage”: D/atom = 0.03*dpa + exp(-0.4/dpa)*(1.2e-2 - 0.03*dpa) (4.1.1)
“total”: D/atom = 5e-4 + 0.03*dpa + exp(-0.4/dpa)*(1.2e-2 - 0.03*dpa) (4.1.2)

Page 15
102
103
104
105
discharges [x104]
To
tal tr
ap
in
ve
nto
ry
[ ÷ 2
x10
23]
0 0.2 0.4 0.6 0.8 1.0
Main chamber
Divertor
Figure 4.1.2: Prediction of the amount of traps in
ITER, due to neutron damage, vs shot. Note that this is
only for full Q=10 400s discharges.
Given that formulation and the rate of damage in ITER we can also predict the rate of trap
site creation for an all-W ITER as shown in Figure 4.1.2. Note that although the ion fluence
to main wall surfaces is lower than for the divertor the potential for trapping is higher there
due to its larger area.
Tritium uptake can be modeled by numerical simulations, which include diffusion, trapping
and detrapping. These can also include spatial and temporal variations in temperature and
incident flux of DT onto the surface
from the plasma. However, such
simulations may not include important
physical mechanisms such as
precipitation as gas into internal voids,
and thermal annealing of defects, which
may strongly influence tritium
retention. The presence of blisters on
the surface of plasma-exposed tungsten
(e.g. 54
) is evidence of gas precipitation.
At the higher temperature, D retention
may be reduced by annealing of the
damage. Thermal annealing of
vacancies is expected to reduce the
concentration of traps and in tungsten
occurring at 773K but not at 473K. The
current situation is therefore that there
is a possibility of a large contribution to
tritium inventory from trapping at neutron damage in tungsten to large depths, but also a
large uncertainty whether this will actually occur since it has not been experimentally
verified. Experiments to resolve this uncertainty should be a high priority.
Concerns: Clearly the understanding of conversion of dpa to traps and the characteristics of
those traps are at an early stage. More information is needed on the trap formation and its
dependence on a number of factors from temperature to whether the simultaneous ion
irradiation has an effect on the conversion efficiency (e.g. by filling traps before they are
lost). Another issue is will the T get to the traps? Will surface bubbles effectively block
diffusion into the bulk?

Page 16
4.2 Analytic formulation for trapping of T in W (W. Wampler, D. Whyte, R. Kolasinski, B. Lipschultz)
As a check for the models described later we first look at a simple analytic formulation for
the amount of T diffusing in and being trapped at sites in the bulk. This is an overestimate
because one assumes a constant trap fraction (1% concentration) for all operation as opposed
to the time dependence as shown in Figure 4.1.2. Furthermore the effect of detrapping is not
taken into account. The parameters used in analytic formulation are defined below:
= incident flux
r = implantation depth D = Diffusivity R = Recombination rate t = irradiation time CSr = concentration of mobile H in solution at the implantation depth CT = trap concentration CSs = surface concentration of H in solution sites x = depth to which traps are filled as a function of time I = Inventory as a function of time A= PFC area KR= Surface recombination rate for hydrogen Based on the analytic formulation
55 the following relationships were used for the diffusion
only case:
CSr = r /D
x =2DtCSr
CT
I = xCT = 2DtCSrCT
(4.2.1)
When one includes recombination at the surface the flux back to the surface from the implantation depth, r, depends on the concentration gradient, i.e. on the surface concentration of hydrogen. The equations change slightly: The surface concentration, CSs, is determined by the recombination rate according to D = KRCSs
2 (The molecular flux, D2 = 0.5•KRCSs2). At
the same time D = D(CSr-CSs)/r because the flux back to the surface is in series with the flux out of the surface (and ~ equal to the flux of ions being implanted).
CSs = /R
CSr = CSs + r /D (4.2.2)
I and x can then calculated as shown earlier.
In a review of the literature it is clear that there are divergent opinions on the subject of
surface recombination rate. A sampling of studies and the recombination rates has been
included in this work and is shown in Figure 4.2.1. They include:
(a) Infinite: C=0 at the surface
(b) Pick model 56
: Kr = 3.0x10⁻²⁵
/T0.5
exp(2.06 eV/kT)
(c) Anderl 57
: Kr = 3.2x10⁻¹⁵
exp(-1.16 eV/kT)

Page 17
10-33
10-30
10
-27
10-24
10-21
10-18
10
-15
10-12
10-9
10-6
10-3
100
Kr (m
4
/s)
3.02.52.01.51.00.5
1000/T (1/K)
Pick
Anderl
Wright
Figure 4.2.1: Surface recombination rates as afunction of 1/temperature.
(d) Wright 29,51
, using Mo as opposed
to W: Kr = 2.0x10⁻²⁸
exp(-0.25 eV/kT)
We note that amongst the authors of
this study the majority subscribe to the
opinion that properly cleaned high-Z
surfaces should have very high
recombination rates, most likely of the
level predicted by the Pick model.
Impurities on the surfaces will lead to
reduction of the recombination rate
(e.g. 58
). However, the uncertainties
expressed by some of our group,
together with the concern not to ignore
a potential enhancement of retention,
has led us to include in this study the
effect of the range of recombination
rates determined by the experimental results of Anderl 57
and Wright 29,51
. We note that
strictly speaking the Wright data are for Mo (another refractory metal), but are in good
agreement with other experiments on W that also found similarly low recombination
coefficients 59,50
. A further complication to the surface model is that tritium can precipitate
into near-surface cavities or bubbles which will reduce the near-surface solute concentration
and reduce the rate at which deeper traps are filled. Also it is likely that higher temperature
operations could anneal some damage, although the efficiency of this annealing is unknown
for the range of expected ITER W temperatures.
Concerns: It is generally agreed by the authors that the surface model is critical to predicting
the possible T retention rates in W, i.e. the surface concentration will set the rate at which
volumetric traps, both intrinsic and neutron-produced, can fill up. However there is not
agreement as to the most likely surface conditions that will be present in ITER. This is a
reflection of the extremely large scatter in the experimental/theoretical results themselves;
e.g. the many orders of magnitude difference in recombination coefficients. In some cases,
such as precipitation into bubbles, we presently do not have a quantitative model, and the
experimental results for precipitation are also mixed. Therefore, while this is likely important
we are uncertain as to how to implement these effects in the numerical modeling (of course
the presence of such bubbles may impede tritium retention but may simultaneously degrade
the surface properties of the W). So while we identify this subject as a critical research item,
for the purposes of this report we have moved forward by using the two extremes for the
assumption of surface recombination: namely 1) an "optimistic" case where the
recombination rate is taken as infinite and therefore the surface concentration is the
minimum it can be based on simple ion implantation and diffusion and 2) the "pessimistic"
case of the lowest recombination rates taken from Wright et al. (which are actually derived
from measured solute D concentrations during plasma exposure). This helps to both frame
the possible ranges of T retention, and to understand the sensitivity of the global T retention
rate to the surface model assumptions, which is not easily seen unless one works through the
effects at all the different W wall section of ITER with their different ion flux, temperature,
etc. conditions. In fact, this scoping study shows that despite the enormously different
assumptions in surface recombination the resulting enhancement is at most a factor of ~10
comparing the optimistic (10,000 shots to retention limit) to pessimistic case (~1000 shots to
retention limit). Obviously, this difference falls into the range where it may matter to ITER

Page 18
Enclosure
Implant
Zone
(20 nm)
Diffusion
Region
(200
microns)
Bulk
(10 mm)
32
nodes
42
nodes
27
nodes
Permeation
Barrier
Figure 4.3.1: TMAP simulation layout.
operations. On another positive note we are beginning to get data at very high fluences,
1027
/m2 31
, a level approaching 2500 discharges for the ITER divertor.
4.3 Modelling of permeation and trapping of the T in the W lattice (R. Kolasinski, D.
Whyte)
Appendix C includes a general comparison of available codes that occurred before the MIT
meeting in June of 2008. The goal of that exercise was to determine if the basic numerics of
the various codes agreed and whether there were advantages of one code over another. Based
on those results and the availability of people to run them 2 were selected for this study,
TMAP 60
and WW 61
.
Both TMAP and WW models can account for the gradient in temperature between the front
surface and the coolant channel, held at 425K. TMAP assumes an implantation profile in the
material that is Gaussian in space with width 1nm. WW places the implantation source at one
grid element. Both codes have assumed, for this exercise, that the implantation depth in nm is
0.1x the implantation energy in eV. While WW can account for the changing trap densities
vs. time (Fig. 4.1.2) TMAP cannot and assumes a constant total trap density of 1%
corresponding to the full ITER lifetime.
A listing of relevant input parameters is given below:
Trap energy (defined here as the energy of D in a trap relative to
solution, 1.06 eV, plus the activation energy for diffusion, 0.39 eV): 1.45
(eV)
Trap density: 10-2 (/W)
Diffusivity (H): D=4.1x10⁻⁷*exp(-0.39/8.625 10-5/T) (m2/s)
Solubility: S=1.83x1024xexp(-1.04/8.625x10-5/T) (1/m3Pa1/2)
Maximum computation time step: 1 sec (TMAP)
Trap rate: D/(3.147x10-10)2 (s-1)
Release rate: 1013*exp(-1.45/8.625x10-5/T) (s-1)
Note: For the calculations described here the diffusivity listed above was
corrected for tritium.
PFC thickness: 10 mm

Page 19
All implanted flux is assumed to be tritium such that the Frauenfelder diffusivity is assumed
for T. After the calculation is done then only half the trapped T is really T, the other half D.
To simplify the calculation further we have combined the neutral and ion fluxes detailed in
the table of Appendix B. That means we use a total incident flux (the sum of the ion and
neutral fluxes). The energy ascribed to that total incident flux is the flux-weighted average of
the 2 species.
Once the details of the actual ITER regions was specified it was clear that a wide range of
conditions would need to be properly modeled by these codes. And so a second comparison
study was launched in order to make sure such issues as the surface models and detrapping
were being handles properly. Appendix C includes a direct comparison of the TMAP and
WW codes for three different flux regions in ITER ranging from high to low flux for the case
of infinite recombination at the front surface. The comparison was helpful in tuning the codes
to properly model the situation over different time and spatial scales.
Concerns: These models are simple models of hydrogenic diffusion through the tungsten containing atomic trap sites. They are not meant to encompass the details of what happens during the ion implantation and near surface dynamics discussed in Section 3.5 and the same issues arise here. Better models for the retention resulting from ion implantation (and the resultant damage to the material) will also make the models of what happens overall including neutron damage better. Further studies of the transport and retention of hydrogen in tungsten, and the influence of damage and precipitation, are needed.
5. Surface temperatures (B. Lipschultz)
The surface (and bulk) temperature of the location where T is retained is as central to the calculation of T retention as the material properties, reviewed in the previous section. To this end we have utilised the wall fluxes of Section 3.1 to obtain the local fluxes and temperatures of main chamber surfaces. The details and summary of those calculations are given in Appendix B. Tsurf is calculated assuming 2 different thermal conductivities for the divertor
CFC: =50 W/(mK) for irradiated CFC and =150 W/(mK) for non-irradiated CFC. The former is for neutron-damaged NB31. The latter conductivity is for the average conductivity (pan/pitch) for NB31 and also applies to W. The through-thickness distance to the coolant channel (held at 125°C) was assumed to be 1 cm in all cases in calculating the equilibrium surface temperature.
The fluxes to divertor surfaces are relatively straightforward. We utilized a calculation by Andre Kukushkin using B2-EIRENNE for the particle and heat fluxes (see Appendix A). Because the official divertor surface area is 220 m2 and the B2 EIRENNE regions with non-negligible amounts of ion and neutral flux total 112 m2 we have adjusted the main chamber area to include extra area beyond that officially ascribed to it (680 m2); 108 m2 of low ion and atom flux, corresponding to the missing divertor area (the upper regions of both divertor areas) was added to the main chamber surface area for a total of 788 m2.
The fluxes to the 788 m2 of main chamber surfaces (derived in section 3.1) have been further broken up into 5 regions (see Appendix B). These include the upper divertor (35 m2), the high flux regions of limiters (50 m2), both of which experience ELM heat loads. In addition there are fluxes to the wall between limiters (315 m2, including the tops of the inner and outer divertors) as well as shadowed regions between limiters (215 m2) and regions of the wall that only experience atom fluxes (177 m2). The areas and corresponding fluxes given are estimates assuming the walls are covered with limiter surfaces that vary in radius as one
Page 20
moves toroidally; at each point poloidally the flux to the surface varies toroidally in a repetitive peak and valley.
All of the above information as well as the specifications for surface temperatures, ion and atom flux as well as energies can be found in Appendix B.
Concerns: Of course the surface temperature calculations are only as good as the description of the plasma fluxes and plasma characteristics of Section 3.1 and Appendix B. Furthermore ITER is considering a variety of cooling channel temperatures which will correspondingly vary the front surface temperatures.
6. Projections to ITER
The review of the existing database of information and statement of assumptions in the
previous sections serves as the foundation for making projections of T retention to ITER.
What follows in this section should not be perceived as a prediction of ITER inasmuch as we
have, as yet, been unable to really put uncertainties on the data and assumptions of the
previous sections. The reader should view the projected retention in ITER as a guide based
on our current knowledge that this group has agreed upon. If asked a year from now to revise
this projection it could likely be very different.
In making the calculations that follow we have pursued two methods -
Method 1 – strictly empirical, scaling from the data of section 3.
Method 2 – Primarily using codes (ERO & DIVIMP) but with some ad hoc assumptions
based on experiment.
Using the above methods we have addressed four combinations of surface materials and
techniques used to project to ITER:
1a) Be main chamber, C/W or all W divertor (method 1 & 2)
1b) Be main chamber, C/W divertor (method 2)
2) All – carbon PFCs (method 1)
3) All – tungsten PFCs (method 1 with, and without neutron damage effects)
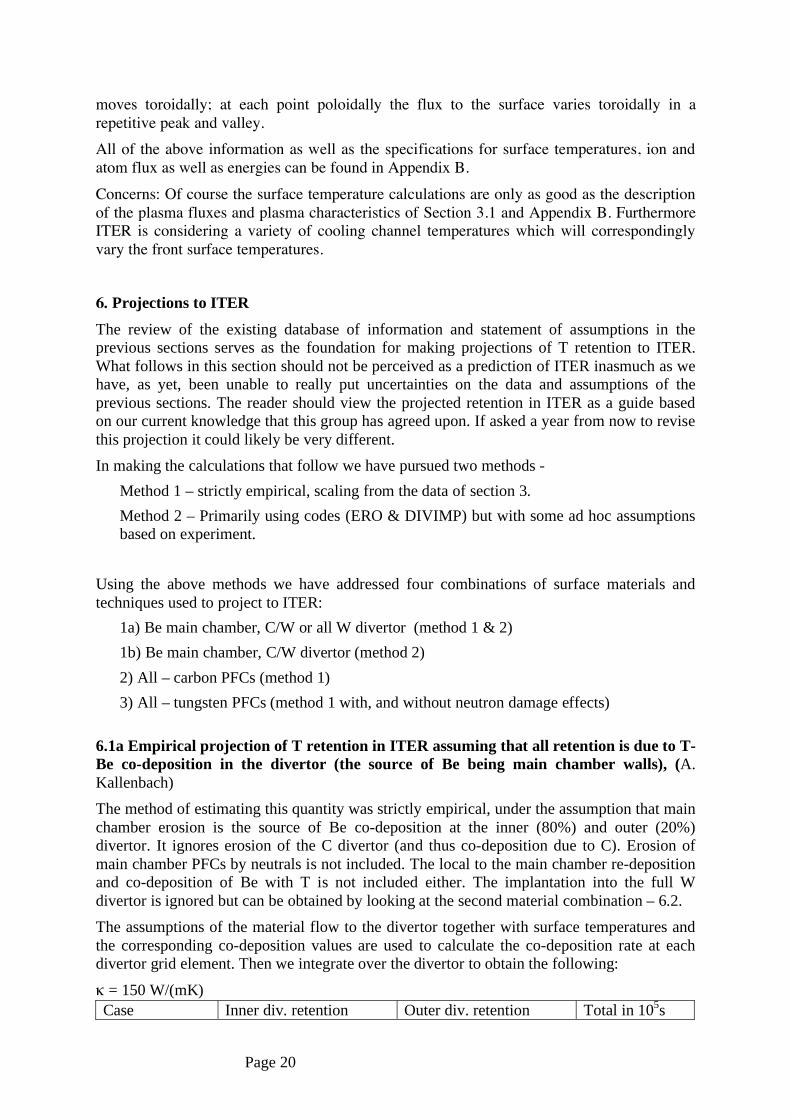
6.1a Empirical projection of T retention in ITER assuming that all retention is due to T-
Be co-deposition in the divertor (the source of Be being main chamber walls), (A.
Kallenbach)
The method of estimating this quantity was strictly empirical, under the assumption that main
chamber erosion is the source of Be co-deposition at the inner (80%) and outer (20%)
divertor. It ignores erosion of the C divertor (and thus co-deposition due to C). Erosion of
main chamber PFCs by neutrals is not included. The local to the main chamber re-deposition
and co-deposition of Be with T is not included either. The implantation into the full W
divertor is ignored but can be obtained by looking at the second material combination – 6.2.
The assumptions of the material flow to the divertor together with surface temperatures and
the corresponding co-deposition values are used to calculate the co-deposition rate at each
divertor grid element. Then we integrate over the divertor to obtain the following:
= 150 W/(mK)
Case Inner div. retention Outer div. retention Total in 105s

Page 21
Low wall flux 1.80x10¹⁹
T/s (0.09 mg/s) 5.25x10¹⁸
T/s (0.03 mg/s) 12g T
High wall flux 1.26x10²⁰
T/s (0.63 mg/s) 3.7x10¹⁹
T/s (0.18 mg/s) 82g T
= 50 W/(mK), hotter targets:
Case Inner div. retention Outer div. retention Total in 105s
Low wall flux 6.25x10¹⁸
T/s (0.03 mg/s) 1.95x10¹⁸
T/s (0.01 mg/s) 4.1g T
High wall flux 4.38x10¹⁹
T/s (0.22 mg/s) 1.37x10¹⁹
T/s (0.07 mg/s) 29g T
Table 6.1.1: Empirical estimates for the tritium retention rates for ITER divertor plates. Co-
deposition with wall-source impurities is assumed as dominant mechanism. Calculations are done for
Be walls and thus Be co-deposition. Two different heat conductivities of the CFC target material are
assumed.
Concerns: As expressed above we have not dealt with the erosion of the local material
(carbon) in the divertor and the resultant co-deposition with D and T. We have also not dealt
with the migration of C or Be to shadowed regions both in the divertors as well as along the
way from the main chamber to the divertors. The latter poor state of affairs, including the
lack of a realistic range for Be erosion rates, was already brought up in section 3.3. Lastly
there is likely migration from the outer divertor to the inner divertor, which is not taken into
account. There has been some discussion that JET and ASDEX-Upgrade data might give us
some idea of what the level of that material transfer is. In general, in both these empirical
calculations as well as the ERO and DIVIMP models to follow, the effect of transient heating
(ELMs, disruptions, H-L transitions…) will lead to erosion of poorly adhered (and poor
thermal contact) deposition layers. Such an effect is not taken into account.

Page 22
18 20 2210
-8
10-6
10-4
10-2
100
Neutral
Be+1
Be+2
Be+3
Be+4
Total NO redeposition Total WITH redeposition
Be f
lux f
racti
on
Poloidal position (m)
Outer divertor Dome baffle Inner divertor
Fig. 6.1.1: Be flux fraction ( Be/ D+T) arriving at the ITER divertor. Square symbols show the charge
resolved Be flux distribution due to main wall erosion alone. Filled circles show the charge integrated Be
flux distribution including the effect of re-erosion and re-deposition. This figure is taken from [62] (figure
11).
6.1b Model projection of T retention in ITER with Be walls (Standard C/W divertor (A.
Kirschner, K. Schmid)
Two models were used to calculate the T retention in ITER. The first calculation uses the
DIVIMP code and assumes an all-W divertor and Be walls. Erosion at main chamber surfaces
is directly calculated as well as the transport of that material to the inner and outer divertors.
The second calculation utilizes the ERO code with the current ITER selection of materials
(Be/C/W). In contrast to the DIVIMP code the main chamber Be source is directly assumed.
That source is treated as an influx into the two divertor regions.
The first modelling effort, using DIVIMP, determines the Be erosion by extrapolating the ion
fluxes and plasma temperatures from the boundary of the DIVIMP calculation grid towards
the ITER first wall. The details of that calculation can be found in 62. At the Be main chamber
wall the D ion fluxes are in the range from 1019
to 1020
(m-2
s-1
) and the D ion energies are of
the order of a few hundred eV. Be Erosion at the first wall is dominated by D and Ar ions.
Note that the lower limit of the ion fluxes used for empirical scaling of Be erosion, averaged
over 680 m2, was 1.5x10
20/m
2/s. The poloidal distribution of D-CX flux is similar to that of
the D ions. The highest fluxes occur in the divertor with energies below 10eV. The highest
average D-CX energies are found in the main chamber but the CX-flux is much lower.
The average Be erosion flux is 6x10¹⁸
(m-2
s-1
) which corresponds to ~0.05 nm/s. It shows a
pronounced minimum at the location of the upper divertor due to the low plasma
temperatures at this location. The total amount of eroded Be at the main wall when integrated
over the entire surface area of the first wall amounts to 2x10²¹
Be/s., again, similar to the
levels obtained in the empirical evaluation of Be erosion (section 3.3) for the low-flux case.

Page 23
The initial Be flux into the divertor is ~20% of the Be eroded in the main chamber. The rest
of the main chamber Be source is initially re-deposited in the main chamber. This does not
mean that it stays there because it is re-eroded and makes a step-wise transition into the
divertor since the main wall is Be erosion dominated.
The fraction of Be in the particle flux onto the divertor surface (‘Be flux fraction’) calculated
with DIVIMP due to main chamber Be erosion as the only source is shown as open symbols
in Fig. 6.1.1. The open circles show a strong inner outer divertor asymmetry. The flux
fractions at the inner divertor are higher than in the outer divertor. The maximum Be flux
fraction of 0.06 is found at the baffle at the inner divertor entrance. The maximum Be flux
fraction in the outer divertor is roughly an order of magnitude lower as was assumed for the
empirical calculations of section 3.3. No Be flux at all is found on the outer part of the dome
baffle. The influence of re-erosion and re-deposition after the initial Be deposition step has a
strong influence both on the Be flux fraction distribution and on the Be layer growth in the
divertor . The closed symbols in Fig. 6.1.1 show the Be flux distribution including the effect
of re-erosion and re-deposition. These two processes make the Be flux fraction distribution
poloidally more homogenous and strongly increase it to percent levels on average.
With respect to Be layer growth the outer divertor is still erosion dominated and the inner
divertor deposition dominated. The main difference when including re-erosion and re-
deposition is that now layer growth also takes place on the dome baffle where initially no Be
flux and thus no Be layer deposition was occurring at all.
The second model calculation of T co-deposition in the divertor, using ERO, simulates the
erosion and deposition along the inner and outer divertor graphite target plates (no W
sections) in ITER. 7,5,63
A uniform beryllium influx of 1% (relative to the incoming deuterium
ion flux) to the inner, and 0.1% to the outer, divertor has been assumed which is in agreement
with the average values from DIVIMP as well as the high flux empirical estimates of section
3.3. Here we present a subset of ERO calculations presented elsewhere. 5,63
A homogenous
mixing model is used. However, it has been found that applying a TriDyn-based model
instead does not change the results significantly. Plasma background parameters such as
temperature, density and parallel flow velocity from B2-Eirene (so-called case 585) have
been used as input for these ERO calculations. 63
The B2-Eirene case 585 delivers deuterium
ion fluences of 2.5·1024
D+/s at the inner and 4·10
24 D
+/s at the outer divertor target.
Deuterium atoms (of similar fluence as ions) are taken into account in the ERO modelling to
calculate the erosion of the divertor plates. The ERO modelling considers chemical erosion of
carbon according to a yield YRoth depending on surface temperature, ion energy and flux. 64
Chemical erosion of deposited carbon is assumed to be ten times higher than YRoth. The
sticking of hydrocarbons returning to the surface is assumed to be zero. Both effects together
(enhanced erosion of re-deposited carbon and zero sticking of hydrocarbons) represent an
enhanced erosion of in-situ growing carbon layers. 7 Sticking of beryllium and carbon atoms
is determined by TRIM reflection coefficients. The assumed surface temperature profiles
represent average operation conditions and lead to a maximum temperature of ~565 K at
inner and ~1080 K at outer target plate. 65
The ERO modelling results in large amounts of re-deposition of eroded particles on the target
plates: nearly 100% for beryllium and 98 - 99% for carbon. Particles not deposited on the
targets leave the simulation volume in the direction of the private flux region and are not
treated by ERO anymore. It is assumed that these particles form layers at remote areas of the
divertor.
Whereas in 7 constant values of (T+D)/C and (T+D)/Be in deposits have been assumed, here
fit formulae based on experimental data are applied (equations 3.4.1-3) for layers deposited

Page 24
on the targets. 23
The tritium content, according to these observations, depends on ion energy
Ei [eV], surface temperature T [K] and in case of beryllium deposits also on the flux ratio
((D+T)/Be)flux.
These formulae are provided for certain intervals of energy, temperature and flux ratio.
However, within the ERO modelling the values of these parameters along the ITER divertor
plates can be outside these intervals, which can lead to unphysical tritium contents. Therefore
an upper value of (T+D)/C = (T+D)/Be =1 is used. Using the beryllium deposition profiles
from ERO together with profiles of surface temperature and deuterium impact energy results
in profiles for (T+D)/Be and (T+D)/C as shown in figure 6.1.2 for inner and outer divertor.
The red dashed line indicates a fuel ratio of 0.1 as has been used for beryllium and carbon
layers in 7. Also included in figure 6.1.2 are the modelled profiles of beryllium and carbon
deposition rates. Taking these deposition rates together with the calculated (T+D)/Be and
(T+D)/C finally results in tritium retention rates on the targets as summarized in table 6.1.2.
For comparison the retention rates assuming fuel codeposition concentrations of (T+D)/Be =
(T+D)/C = 0.1 are also included. As can be seen the overall tritium retention on the targets
calculated with spatially resolved fuel ratio decreases from 7.1 to 1.9 mg T/s compared to the
estimations using constant fuel ratio of 0.1. Generally, the tritium retention in beryllium
layers decreases whereas the one in carbon layers increases. As for the previous calculations
in 7, the main tritium retention takes place in beryllium layers at the inner target due to the
assumption of a ten times larger beryllium influx to inner than outer divertor. This results in
the overall decreased retention rate. For this set of data the total tritium retention amounts to
3 mg/s, or 300 g in 105 seconds.
A simple estimation (upper value) of tritium retention in remote areas assuming (T+D)/Be =
(T+D)/C = 1 delivers an additional retention of 2.1 mg T/s and thus an overall retention rate
of 4 mg T/s in beryllium and carbon layers at the targets and remote areas.
-0.2 0.0 0.2 0.4 0.6
1E-4
1E-3
0.01
0.1
1
(T+D)/Be
(T+D)/C
distance along inner target (m)
(T+
D)/
Be
, (T+
D)/
C
0
1x10¹⁵
2x10¹⁵
3x10¹⁵
4x10¹⁵
5x10¹⁵
Be deposition
C deposition (*10)
Be
, C d
ep
so
ition
(pa
rticle
s/m
m2s)
-0.2 0.0 0.2 0.4 0.6
1E-4
1E-3
0.01
0.1
1
(T+D)/Be
(T+D)/C
distance along outer target (m)
(T+
D)/
Be
, (T+
D)/
C
0
2x10¹⁴
4x10¹⁴
6x10¹⁴
8x10¹⁴
1x10¹⁵
Be deposition
C deposition
Be
, C d
ep
so
ition
(pa
rticle
s/m
m2s)
Figure 6.1.2: Calculated profiles of (T+D)/C and (T+D)/Be along inner (left) and outer (right) divertor
plate. The red lines indicate the value as used in [7] for layers deposited on the targets. Also shown are the
deposition profiles for beryllium and carbon as modelled by ERO.
Divertor Remote
Be Carbon Be Carbon
(D+T)/Be=0.1 (D+T)/Be~fit (D+T)/C=0.1 (D+T)/C~fit (D+T)/Be=0.1 (D+T)/C=0.1
Outer 0.9 mg T/s 0.17 mg T/s 0.2 mg T/s 0.29 mg T/s 0.02 mg T/s 0.8 mg T/s
Inner 6.0 mg T/s 1.3 mg T/s 0.02 mg T/s 0.16 mg T/s 0.1 mg T/s 0.1 mg T/s

Page 25
Table 6.1.2: Estimated tritium retention rates for ITER on outer and inner target. Red values
correspond to constant fuel ratios as assumed in [7], green numbers result from the usage of spatially
resolved fuel ratios as obtained from equations 3.4.1-3.
Summing the information from Table 6.1.2 we see that the total retention ranges from 8.12 to
2.94 mgT/s, the range corresponding to the assumption of the incoming Be ion flux [(D+T/Be
=1 vs. (D+T)/Be = fit). The contribution of remote regions (1.02 mg/s), based on the
assumption stated, contributes between 12.5% and 35% of the total retention. If the C was
removed (replaced by W) then this calculation at first glance indicated that the retention
would drop to a range 6.82-1.59 mg/s, again the range is due to the different assumptions of
the incoming Be flux. That corresponds to a 16% - 46% drop in T retention, so less than a
factor of 2. Thus in our initial assessment of the effect of completely removing C from ITER
the effect is not large, well within the uncertainties of the underlying physics.
Further ERO calculations are planned to analyse the influence of the assumption of enhanced
erosion of re-deposited carbon and zero sticking for hydrocarbons. Also, plasma parameters
from a new B2-Eirene run (so-called case 1084) will be used. Finally, more realistic
beryllium influx profiles and concentrations will be addressed.
Concerns: Certainly the wall source calculation, both empirical and through DIVIMP, needs
to be improved with better experimental measurements of the erosion, better measurements
of the re-deposition in the main chamber. Of course we need better models of SOL flows to
enable that as well. As pointed out earlier for the empirical calculation we also need better
estimates of what fraction of the divertor erosion ends up in shadowed regions and what the
characteristics of such co-deposited materials will be. Overall the modelling and empirical
scaling projections of retention have to be made more consistent in terms of their
assumptions and models.
6.2 Empirical projection of T retention in ITER assuming that all retention is due to T-
C co-deposition in the divertor due to erosion from all-C walls, (A. Kallenbach)
As in Section 6.1a the method of estimating this quantity was strictly empirical, under the
assumption that main chamber erosion is the source of C co-deposition at the inner divertor.
It ignores erosion of the C divertor (and thus the associated co-deposition). The implantation
into the full W divertor is ignored but can be obtained by looking at the second material
combination – 6.3.
The assumptions of the material flow to the divertors together with surface temperatures and
the corresponding co-deposition values are used to calculate the co-deposition rate at each
inner divertor grid element. Then we integrate over the divertor to obtain the following:
= 150 W/(m-K)
Case Inner div. retention Outer div. retention Total in 105s
Low wall flux 3.07x10²⁰
T/s (1.53 mg/s) 4.2x10¹⁹
T/s (0.20 mg/s) 174g T
High wall flux 1.53x10²¹
T/s (7.67 mg/s) 2.1x10²⁰
T/s (1.0 mg/s) 871g T
= 50 W/(m-K), hotter targets:
Case Inner div. retention Outer div. retention Total in 105s
Low wall flux 1.08x10²⁰
T/s (0.54 mg/s) 1.67x10¹⁹
T/s (0.08 mg/s) 63g T

Page 26
Figure 6.3.1: Retention of tritium in tungsten plasma-facing components. Left figure
shows the low wall flux case with lower limit to the retention data (Fig. 3.5.1). The right
figure shows the high wall flux case with the upper limit of retention data.
High wall flux 5.41x10²⁰
T/s (2.7 mg/s) 8.34x10¹⁹
T/s (0.42 mg/s) 313g T
Overall, the retention of tritium by co-deposition with Be amounts to about 1/10 of the
retention with C. As the erosion rates from the wall are assumed to be the same this
difference is due to the much lower co-deposition efficiency under the assumed conditions,
with the local surface temperature being the dominant parameter.
Concerns: Concerns are similar as for the empirical Be calculation (6.1a). Namely, we have
poor knowledge of, or confidence in, the transport of first-wall material around the chamber
to the divertors. We do not really know what the level of co-deposition is along the way.
6.3 All-tungsten PFCs in the case of no neutron damage (J. Roth)
An empirical projection of retention was also performed for all-W PFCs, with implantation,
diffusion and retention in ion-induced or intrinsic defects in the W material being considered
as dominant process. The same assumptions on wall and divertor fluxes and resulting surface
temperatures were made as for the empirical projection for Be and C first-wall (Sections 6.1a
and 6.2). From the range of retention data shown in fig. 3.5.1 the upper and lower fits were
used for the evaluations and, as for C and Be, the two different wall fluxes, i.e. 1x10²³
/s and
1x1024
/s, were assumed. The breakdown of the various regions in terms of fluxes (ions and
neutrals), areas, and surface temperatures are again given in Appendix B).
Figure 6.3.1 shows the projected tritium inventories in different W PFC regions as a function
of exposure time for the extreme cases: lower wall flux for the lower data fit limit of Fig.
3.5.1, and higher wall flux for the upper data fit limit. Due to the saturation inherent in the
limit formulae of Figure 3.5.1 the retention also saturates. The largest amount of retention is
at main chamber PFCs (low Tsurf and large area). The projection to 105 seconds gives 3-30g T
retained (low to high flux limit), the saturation retention in both cases is around 25 to 50g
(lower to upper margin).
Clearly, the lowest retention was found for low wall flux and the lower limit of the data from
Fig. 3.5.1, the highest for the high flux case and the upper limit.

Page 27
PFC combination Study Wall retention included
Grams T retained
All-carbon Kallenbach (empirical) 63-870 Be wall, C/W divertor (but no role) Kallenbach (empirical) 4.1-82 Be wall, C divertor Kirchner (ERO+
empirical/Divimp) 294
All-tungsten Roth (empirical) X 2-29 Table 6.4.1: Compilation of projections for non-neutron-damage scenario. All projections include retention in the divertor. Only one takes into account retention at main chamber surfaces.
102
103
104
105
discharges
Tota
l tr
ap invento
ry
[ ÷ 2
x10
23]
100 101 102 103 104
Main chamber
Divertor
Figure 6.5.1: Logarithmic version of Fig. 4.1.2: total traps (for D+T) including both intrinsic and those from neutron damage vs discharge for full power, Q=10, ITER discharges. The number of traps are divided by 2x10²³.
Concerns: Most of the issues associated with this calculation are due to the underlying data
for retention and as such were already covered in section 3.5. But we would like to mention
again the concerns about saturation – what will the ultimate level be and at what fluence will
it occur? In that regard the reader should also compare these results with those of section
6.5.2 which are based on just modelling assuming no saturation (Figure 6.5.5).
6.4 Summary of projections for non-neutron-damage operation
In the previous sections we have made projections using a number of methods and materials
combinations. Here we try to bring them all together at one point in ITER operation, 105
seconds (250 400 second discharges), and with the same units.
At 105 seconds all-carbon or Be wall + carbon divertor all lead to significant retention in the
divertor PFCs. The all-W case is lower than the range of almost all the predictions for other
materials. Beyond 105 seconds the tungsten, based on the saturation effect implied by
laboratory data, would tend to saturate. On the other hand the Be and C co-deposition would
be expected to be linear in time. Allowing for co-deposition in the main chamber would
certainly increase the projections for that material but the amount is difficult to estimate
given our poor knowledge of erosion, transport and deposition in the main chamber. If, on the
other hand, the divertor CFC surface were replaced by W we only expect a factor of order 2
drop in the divertor co-deposition, far smaller than the uncertainties in other aspects of the
calculations.
6.5 Retention for all-W PFCs with neutron
damage effects
6.5.1 Analytic evaluation of T retention (R.
Kolasinski, B. Lipschultz, W. Wampler, D.
Whyte)
Based on the models discussed in Section 4.2
we have made analytic projections to ITER
of the effect of neutron damage on T
retention under the assumption of constant
traps at the full lifetime ITER limit – 1% of
the W density, 6.5x1028
m-3
. This calculation
is only to be viewed as a guide and a check
on more detailed numerical calculations as
this analytic model assumes the traps are

Page 28
Figure 6.5.2: Diffusion front depth for 14 regions defined in Appendix A. Constant trap density of 1%W is assumed.
filled with T as the traps appear due to
damage - obviously an overestimate given it
does not take into account the time it takes
for the hydrogen to diffuse to the traps. The
model used here assumes neutron damage
rates (0.5x10⁻⁷
dpa/s for the divertor, 1.0x10-
7 dpa/s for the main chamber) together with
the conversion of that damage to traps (Fig.
4.1.1 and accompanying equations). We
again plot in Figure 6.5.1 the total D+T trap
sites in the main chamber and divertor
(given in grams) under the assumption that
50% of all available traps are filled with T,
the rest with D. This calculation further
assumes 1 cm tile thickness, 680 m2 of main
chamber and 220 m2 of divertor area. Note
that it is of order a few 100 discharges
before the nuclear damage doubles the
intrinsic traps in the bulk.
As can be seen from Figure 6.5.1 the main
chamber will dominate in terms of the
number of available traps. That is of course
due to its area, ~ 3x that of the divertor.
One can ask how deep into a tile the tritium must reach and fill 1% trap concentrations before
ITER reaches the 700 g limit. Assuming the total ITER area of 900 m2 that depth is 0.48 mm.
If only the divertor is tungsten the depth is ~ 2 mm.
The analytic formulation in section 4.2 gives the rate at which tritium permeates to the traps
as determined by a combination of the diffusion coefficient (so local temperature) and the
near surface concentration of mobile D in interstitial solution sites, which drives the
implanted D down the concentration gradient into the material. The near-surface
concentration depends on temperature, incoming flux, and loss at surfaces and other near-
surface sinks such as internal cavities or bubbles. Using the analytic model of section 4.2 we
can calculate the depth that the diffusion front reaches vs time or # of 400s ITER, Q=10,
discharges. The result is shown in Figure 6.5.2 for the 14 regions described in Appendix 1.
Regions 1-4 correspond to the outer divertor, 5-8 the inner divertor, and 9-14 the various
main wall surfaces. The diffusion front location for each of the 14 regions is shown twice,
once for the front surface density determined by diffusion only (infinite recombination), and
secondly for the case where the recombination dominates (recombination level as specified
by the results of Wright for Mo 29
). Note that in the recombination dominated case the
diffusion front reaches the back of the tile (.01 m) before the 104th ITER discharge for
regions 1-3 as well as 5-7, all in the divertor. The affected area is small, ~ 20 m2.
The surface densities are ~ 1000x higher in the recombination-dominated case. Increasing the
recombination rate a factor of 105 over that found by Wright, to a level similar to that
determined by Anderl 57
, essentially eliminates the surface density enhancement over that of
diffusion only. Such an increase is much less than the range of 1020
in model and measured
recombination rates discussed in section 4.2

Page 29
Figure 6.5.3: Amount of tritium stored in neutron-induced + inherent traps for a) diffusion-only cases; and b) recombination + diffusion. Constant trap density of 1%W assumed.
The effects of low surface recombination
rates and the dominance of the main
chamber are also evident when examining
the actual T that is projected to be retained.
Figure 6.5.3 displays the sum of T (taking
into account D fills half the sites) retained if
all neutron-induced traps are filled up to the
depth of the diffusion front of Figure 6.5.2
assuming a 1% trap density constant in time.
Integrals over the 14 regions - inner and
outer divertor as well as all main chamber -
have been done. Of the main chamber
regions the contributions in order of
dominance are regions 11 (Wall between
limiters), 10 (peak flux on limiters), 14
(Upper divertor), 12 (shadowed regions
between limiters) and 13 (shadowed, from
ions, regions). Of course region 11 has the
largest area (315 m2). We note that although
the main chamber ion flux used in this case
(high flux) is 1x1024
/s, the neutral flux is
over a factor of 2 larger than the ion flux.
This is partly due to an assumption in region
12 of neutral flux being twice the ion flux
(based on KN1D modelling). There are also
several regions where there is no ion flux
(regions 9 & 13) and the neutral flux is set to
low values corresponding to pressures of 1.3x10⁻³
Pa at 5 eV neutral temperatures which is an
average over those generated in the plasma through charge exchange and those corresponding
to Franck-Condon dissociation. Even so the total neutral fluxes are large given the large
areas.
Note that the effect of the diffusion front reaching the back of the tile is evident in the
‘saturation’ in a number of areas shown in Figure 6.5.3.
We can gain some insight into the time-dependent effect of the neutron-damage sites over the
inherent trap level, set to .05% of the W density. Figure 6.5.4 displays the same analytic
derivation of the total retention given by Figure 6.5.3 for the diffusion- and recombination-
dominated cases along with 2 other limits: 1) no enhancement of traps due to neutron damage
(so the trap level is kept constant at .05%W) and 2) the enhancement of traps following the
prediction of Figure 6.4.1. Allowing for changing trap densities is physically incorrect as it
assumes that the trap filling is independent of the T diffusion which it is not. So the three
calculations are really just meant to give the reader an intuitive feel for what to expect from
the modelling which follows in the next sections. But generally one can conclude that the
enhancement of the trap density by a factor of 20 has a 200.5
= 4.5 increase in retention during
the period of ITER operation. Also, the effect of neutron-induced traps would not be
significant until of order 1000 Q=10 discharges are reached.

Page 30
Figure 6.5.4: Same as Figure 6.5.3 but showing, in green, an approximation for the effect of traps increasing in time: Amount of tritium stored in neutron-induced + inherent traps for a) diffusion-only cases; and b) recombination + diffusion. The different time dependence corresponds to the three cases of constant traps (1%W and .05%W) as well as traps increasing with time from Figure 6.4.1)
a) Diffusion-only case
#g
ram
s-T
re
tain
ed
#g
ram
s-T
re
tain
ed
b) Recombination+diffusion case
100100
101
101
102
102
103
103
100
101
102
103
104
104
700g
700g
low-resolution
high-resolution
discharges
Total
Main chamber
Outer divertor
Inner divertor
Figure 6.5.5: Results of the WW code projection of T retention in neutron-induced + inherent traps for a) diffusion-only cases; and b) recombination + diffusion. The solid lines correspond to the low and high resolution cases respectively.
It is interesting to compare the projections
for T retention based on the analytical
formulation, for inherent traps and no
surface recombination effect, with the
projection to ITER based on the laboratory
data scaling of Figure 6.3.1. At the 10,000
discharge point the diffusion model data
with no neutron-damage of Fig. 6.5.4 lead ~
to the same levels as the projection shown in
Fig. 6.3.1. IF one assumed that the
experimental formulation underlying Fig.
6.3.1 is ‘truth’ then the implication is we
should ignore the recombination-dominated
projections of Fig. 6.5.4. However, as
discussed earlier, we should not ignore the
potential for recombination effects to be
significant in the tokamak, as opposed to
laboratory, setting.
Concerns: This section is really meant as a
guide to assessing the modelling results that
follow. It is not meant to be quantitatively
accurate as it ignores de-trapping and does
not properly treat the role of traps increasing
with time and it ignores several effects
including de-trapping and annealing of
damage. Furthermore, near-surface
precipitation, which has been observed to
occur, will reduce the rate of D permeation
to greater depths, and this effect is also
neglected here. In general the main concerns
for such calculations are: a) the accuracy of
the conversion of dpa to traps, which
depends on temperature because of damage
annealing, b) the concentration of mobile D
produced near the surface by exposure to the
plasma, c) the binding energy of D to the
traps, and other such issues as described in
sections 4.1 and 4.2.

Page 31
6.5.2 Model projection of T retention (D. Whyte, R. Kolasinski)
Having made a number of empirical projections to ITER in the previous sections we now turn
our attention to the predictions of retention in W based on two currently available hydrogen
transport codes. As described in Section 4.3 and Appendices C and D the two codes used in
this study, WW and TMAP, have been benchmarked and adjusted so that their results are
fairly close. The primary issue that remained after the comparisons of Appendix D was that
the time steps and grid spacing of WW were too coarse for short time scale predictions. To
address this concern WW was run on the same input conditions twice for each of the 14
regions of T implantation – ‘high resolution’ (small grid spacing and time step) and ‘low
resolution’ (larger time step and grid spacing). The results for the high flux case only are
shown in Figure 6.5.5. The effort to run the code for the low wall flux case was not deemed
warranted; it would result in a simple shift of wall retention to one order of magnitude higher
numbers of discharges while the divertor retention stays constant. As was found earlier for
the lab-based (Fig. 6.3.1b) and analytic (Fig. 6.4.4) high-flux case projections the amount
retained for less than a few hundred discharges scales with fluence to a power of order 0.5
(different for the Fig. 6.3.1b and 6.4.4). In addition, all projections show that the main
chamber would be the primary region of retention due to the large area. After a few hundred
discharges the lab-based projections (Fig. 6.3.1) saturate as assumed in the fits to the data
(Fig. 3.5.1) while the analytic and WW model projections actually are enhanced due to the
effect of neutron traps (absent in the lab-based projection, Fig. 6.3.1).
6.5.3 Summary of retention in an all-W ITER and concerns
There is a wide range of projections for retention in an all-W ITER. For the lifetime of ITER
(10000 discharges) the lowest projection of 5-10gT is for no neutron-damage sites, low wall
fluxes and saturation of retention (Figure 6.3.1a). If the neutron-damage sites are not
accessible by the T (e.g. diffusion barrier near the surface or trap annealing) then the
maximum we might expect would be in the range of the high wall flux limit projection of
Fig. 6.3.1b and 6.5.4 (red line), of order 100g over the lifetime of ITER. That number is of
course limited by the assumption of saturation of retention (Fig. 6.3.1b). Relaxing the
assumption of saturation in retention and allowing access of the T to the neutron damage sites
raises the high wall flux case T retention projection from 50 to ~ 700g over the ITER lifetime
(diffusion only case, Figure 6.5.5a). A further potential increase in retention would occur if
the recombination rate at the front surface was low enough, thus raising the T density there
and driving it into the bulk faster (Figure 6.5.5b). The 700g limit would then be reached at
close to 1000 discharges. Conversely, near-surface precipitation may reduce the permeating
flux 33,49
and the retained quantity of T below the 700g lifetime retention prediction of the
diffusion only case. The bottom line is that even under the most conservative assumptions an
all-W ITER could operate for ~1000 full performance discharges before reaching a limit in
in-vessel T inventory (Fig. 6.5.5b).
Such a wide range of projections is reasonable given the state of our understanding. Certainly
among our group we cannot agree on the probability of all of the above scenarios. Again, the
reader can assess the various projections based on the source of assumptions. Our group does
feel that several areas of research would serve to reduce uncertainties and the range of
projections. Those areas include the actual level of wall fluxes as well as the retention of T in
W under simultaneous T, He, impurity and neutron bombardment. Simultaneous implantation
by the various species is needed to evaluate a) whether the simultaneous implantation (at the
right range of fluxes) somehow synergistically reduces the retention, b) whether the H
implantation somehow enhances the density of surviving neutron damage sites (e.g. by H
filling damage sites before they can recombine). It is doubtful that such exact simulations of

Page 32
1E22 1E23 1E24 1E25 1E26 1E27
1E18
1E19
1E20
1E21
1E22
1E23
IPP Ogorodnikova
Toronto Haasz
DIONISOS Wright
TPE Causey
JAEA Alimov, Shu
PISCES Doerner
FTU Loarte
Magnetron Alimov
PISCES Wampler
PSI2 Loarte
TEXTOR Philipps
TPE Kolasniski
Reta
ined (
D/m2
)
Fluence (D/m2
)
poly-W, 500 KD energy 38-200 eVTDS
Figure 7.1.1:Version of Figure 3.5.1 with new data from U. Toronto and Alimov added.
ITER can be done before ITER operates but various aspects of such situations can be studied
in isolation and hopefully, with physics understanding, combined to better project to ITER.
7. Underlying uncertainties, assumptions and future work
In the course of this study a number of areas were identified for further research either
because they were not included, or because the level of understanding is very poor. In the
numerous steps between main chamber source and final co-deposition the first uncertainty is
in the first-wall fluxes including their characteristics (energy of ions and neutrals) and flux
pattern. Secondly we have a difficulty of how to split up a general prescription for radial
fluxes (and localized erosion) amongst the various 3D objects in the SOL including limiters
and tile gaps. We need to better understand the transport of eroded material from where it is
eroded (first-wall or divertors) to where it
finally re-deposits and possibly co-
deposits. This includes the local physics
of erosion and re-deposition (and co-
deposition) as well as the continual re-
erosion and migration of material as it
moves along the first-wall, probably co-
depositing with T in remote areas along
the way to the inner and outer divertors.
Certainly much of the above could be
addressed with a better understanding of
parallel and perpendicular plasma
transport for the fuel ions and impurities.
A significant unknown is the effect of
transient heating (ELMs and disruptions)
which could lead to both reduced
retention (increased temperatures) and
enhanced retention (spread co-deposition
to cooler areas), both at the divertor plates and elsewhere.
In this study the range of possible material properties for Be and C were not really taken into
account. Any follow-on study should undertake to set a range of erosion rates for each
material. In addition the properties of the re-deposited material, in terms of T retention, need
to be addressed for how the retention changes as a function of material temperatures, both for
steady state and for transients such as ELMs. There is new data for the effect of baking
following co-deposition with and without mixed materials presented at the December 2009
ITPA SOL/Div meeting in San Diego by J. Roth.
With respect to W the uncertainties are more related to what happens in the material as
opposed to in the plasma: The exact nature of T accumulation in the region of the
implantation depth through expanding or creating traps is uncertain. Likewise, when T
agglomerates into voids or bubbles we need to quantitatively predict what the effect on
retention locally is (whether the T is trapped or released through rupture back to the surface)
and whether such material structures impede diffusion and trapping of T further into the bulk.
In other words given all the obvious changes in micros-structure and composition of the near
surface what are the related effects on diffusion to greater depths? There has been recent
work on the issue of surface modification by the IPP-Garching and JAERI groups 66-68,54
showing near-surface damage structure at high fluence (1026
/m2 - 10
27/m
2) that appears
responsible for release of D and corresponding saturation in retention. A study of ideal (e.g.

Page 33
Figure 7.1.2:Example of the reduction in H retention with addition of simultaneous He+ implantation from Alimov et al.
non-tokamak) W 69
determined
recombination rates at the front surface in
line with those from Anderl57
and
Baskes70
(section 4.2).
In the area of retention as a function of
fluence on W there have been some
additions/changes to Figure 3.5.1. First,
new low energy data (200 eV) from Univ. Toronto 71 replaces the earlier, higher energy ion data 24
. These new results extend the fluence range previously obtained with ion beams by an order of magnitude, to ~1026 D/m2 (up to the fluence range of plasma devices), and confirm the power-law dependence of D-in-W retention on D fluence over this extended range. The new results also
agree well with similar results from IPP.
Secondly, additional data from the same study by Alimov at high fluence were added31
. The
new points have slightly higher retention but are similar in trend. Most of the old data along
with the new are shown in Figure 7.1.1. The old upper and lower guidelines used for this
report are shown as well. Certainly any new study should take these changes into account and
possibly adjust limits. The question of how to handle saturation is particularly important as
illustrated earlier in section 6 where the empirical scaling (Figure 6.3.1) is compared to the
modelling projection to ITER (Figure 6.5.5).
At the beginning of this study the characteristics of traps created by nuclear damage (trap
energy, de-trapping rates, trap density, the T/W enhancement over undamaged W) were very
uncertain. The efforts to deduce the level of T retention from the little data available shown in
this report turn out to be consistent with the follow-on data that was obtained this last year by
a number of groups 72-74,49
. In addition the same data shows retention in damaged material
dropping strongly with increasing temperature72,74,49
. However, more experiments are needed
to clarify the rate at which damage-induced traps are filled and hence the depth to which
trapping extends into the material with the corresponding enhancement in T inventory.
Lastly, there is evidence that impurities can play a role in affecting T retention. Certainly we
have discussed earlier the effect of impurity implantation on retention. But in the past year
there has been surprising unanimity amongst a number of laboratories in finding that
simultaneous implantation of He and T ions at low He concentrations (less than ~ 5%) lead to
dramatic drops in T retention, up to a factor of 100031,66,75-79,49
. An example is given in Figure
7.1.2. Some decrease in retention due to simultaneous He/H ion implantation is also found for
nuclear-damaged material 49
.
8. Conclusions
As can be seen from reading the details of this paper, the exercise of bringing together all the
processes connected to retention is very complicated and involves processes which currently
have very large uncertainties (e.g. impurity transport). The range in the projection for a given
material or situation does not represent the underlying uncertainty (or error bars) but a range
of conditions that we deem ‘probable’ at this point in time. In fact, for a number of parts of

Page 34
this analysis (e.g. the level of erosion and finally co-deposition at the inner divertor) we are
making educated guesses.
What is clear from this research effort is that our current understanding leads to the
conclusion that a fully carbon first-wall will probably lead to higher T retention than for a Be
first-wall due to a combination of factors:
1) Lower T/Be than T/C for a given temperature and incident impurity flux fraction
( imp/ D+) incident on the final co-deposition surface; and
2) The higher probability of C to migrate to remote areas due to the form of its chemical
erosion products.
The analysis of the various scenarios included in this report also informs the debate on the T
retention difference between the standard Be/W/C configuration and the Be wall, all-W
divertor. The ERO analysis, as well as the discussion of co-deposition properties for Be and
C, both point towards a minor drop in T retention, less than a factor of 2 in the changeover
due to the fact that the main source of retention, T co-deposition with Be, has not been
removed. Of course the T in Be co-deposits is easier to thermally remove than T co-deposited with C. However the impact of material mixing has not been addressed in this report and may have a substantial effect on the release of T from co-deposits formed in ITER.
Furthermore, this comparison of material properties and performance indicates that, in the
absence of nuclear damage, a fully-W first wall will probably lead to lower T retention than
the standard ITER mix of materials (C/W/Be) or an all-carbon case.
The subject of nuclear damage, the trap sites created and how that leads to retention is subject
to rapidly changing knowledge. Our initial analysis indicates a possibility of a high capacity
of the damaged W to hold T. Based on this initial analysis it is still probable that tritium
retention for an all-W machine would be lower than for the 2 other cases examined. Such
retention would likely be lower still if surface recombination does not play an important role,
if near-surface precipitation of the implanted T impedes its diffusion deeper into the bulk, and
if thermal de-trapping and annealing of damage are taken into account.
The uncertainties of the above probable outcomes, as ill-defined as they are, are different for
W than for C and Be. All processes leading to co-deposition of T with C or Be are uncertain.
Such processes include the rate of erosion of from main chamber surfaces, the level of local
re-deposition and co-deposition (e.g. on sides of tiles), the rate of migration around the vessel
and how much is deposited (and co-deposited) along the way, the deposition pattern at the
inner and outer divertor which should include how much finds its way to shadowed areas
near the divertors.
The uncertainties for retention in tungsten are different in most ways. They include
uncertainties in ion/neutral fluxes to main chamber surfaces as well as their energies. In
general though the uncertainties for retention in W are for processes in the material – The
exact nature of T accumulation in the bulk through expanding or creating traps is uncertain.
Likewise, when T agglomerates into voids or bubbles, we need to know whether that impedes
diffusion and trapping of T further into the bulk. And of course the characteristics of traps
created by nuclear damage (trap energy, de-trapping rates, trap density, trap annealing) and
the ease with which the implanted T can reach them need more research.
There are fundamental differences between the different materials in terms of how the T will
be retained: Retention due to co-deposition with C and Be is a surface effect. Retention in W
will be further into the bulk, potentially throughout the entire bulk. The implication is that co-
deposition is amenable to surface heating/removal. Bulk retention is less amenable to T

Page 35
removal (but possibly immobilized from the safety point of view). T removal techniques are
required, but will likely be very different for Be/C and W. In all cases higher surface and bulk
temperatures generally lead to lower retention.
In summary we advise readers to look at this work more as an identification of areas needing
additional research, rather than a material selection recommendation. Use of this work to
select, or deselect, one material compared to another, is not wise. In addition, issues such as
component lifetime, dust, and the material’s effect on the core plasma should be included in
any material decisions along with T retention.
Acknowledgement:
We thank our many colleagues in the materials, SOL and divertor physics areas whose work
this is based on.

Page 36
χ2: 2.56
1020
1020
1019
1019
7.14x10⁻⁴ x ne1.14 x fGREEN
0.37
Sse
pa
ratr
ix D
en
sity
AUG
C-Mod
DIII-D
JET
JT-60U
Figure A.1: Scaling of separatrix density across tokamaks.
0.1
1.0
De
nsity [
10
19/m
3]
0.00 0.05 0.10 0.15Distance from separatrix [m]
10
100
Te [
eV
]
Te
Ti
Figure A.2: Assumed steady state density and temperature profiles.
Appendix A: Calculation of wall fluxes (A. Kallenbach, B. Lipschultz)
Utilizing the current database of tokamaks separatrix data we calculate first the SOL profiles expected for ITER (A.1). Those profiles allow us, with further assumptions to calculate the time-averaged heat flows to main chamber surfaces (A.2). Following that we utilize two methods to calculate the wall fluxes and energy characteristics of those wall fluxes (A.4, A.4).
A.1 ITER SOL profiles
We base the prediction of the SOL profiles on analysis of a multi-tokamak (C-Mod, DIII-D, ASDEX-Upgrade, JET, JT-60U) database of near-separatrix profiles. 80 From this a scaling of the separatrix density can be fit (shown in figure 1.1.1) which predicts separatrix density 4x10¹⁹/m3. Similar values (3-5x10¹⁹/m3) are found on the basis of ITER modelling 81. For this exercise we will use a value of 3.5x10¹⁹/m3.
The same database was used to derive the density e-folding length, n,sep in the region of the separatrix - the so-called near SOL. The data are more scattered than for the separatrix density giving values in the range 40-55 mm. We note that ITER modelling gives ~ x2 smaller values. For this exercise we assume 50 mm.
For the purpose of calculating heat loads we also need the temperature profile. The same database provides us with values of T,sep ~ 2 cm. We limit Te at a low value of 10 eV in the far SOL. Ti is assumed to be 2xTe.
Together we display the profiles in Figure 1.1.2.
A.2 Upper divertor fluxes
To calculate the particle and heat fluxes to the upper divertor we need to make further assumptions:
- second separatrix (drsep) at 5 cm from the separatrix at the outer midplane;
- 20% of ELM energy (1 MJ) goes to upper divertor (and outer wall both). The second separatrix ELM density is 1x10¹⁹/m3 and the separatrix temperatures adjusted to give 200 kJ/ELM (Te~ 300 eV, Ti~ 600 eV).
- ELM frequency 40 Hz, e-folding length for ELM power outside ssep = 5 cm
- Ti always 2xTe - Midplane BPol/BTor ~ 0.35 - Outer midplane between ssep and limiter
radius is 10 cm from 8.05 to 8.15 m.

Page 37
Steady state & time-average (ELM) loads
0.0
0.2
0.4
0.6
5.0 5.2 5.4 5.6 5.8 6.0Rmajor [m]
qperp [MW/m2]
Γperp [1023/m2/s]
qtot =7.5 MW
Γtot =2.83x10²³/s
Figure A.3: Calculated steady state + time-averaged heat and particle flux profiles at the upper divertor
This maps to upper divertor with x10 flux expansion from R=5-6m. - Flux expansion from the midplane to
the upper divertor ~ 10 - Coolant temperature 400K
The heat flux load is assumed to be free flow along the flux tube (0.5ncsx(2.0Ti +2.0Te + 3.5Te)) where the terms are the ion and electron thermal energies (half Maxwellian) and the energy gained in the sheath + pre-sheath. Since the actual geometry is not being used we take the parallel power flow and convert it to poloidal power flow:
The poloidal power flow is then mapped to the upper divertor according to the flux expansion and change in R in the assumptions. Taking into account the ELM and steady state particle and heat flows the resultant particle and heat flows to the upper divertor are given in Figure 1.1.3.
The ‘normal’, or time-averaged, loading to the upper divertor is fairly low – 7.5 MW and ~ 2.8x10²³ particles/s. The corresponding peak heat load is < 1 MW/m2 (time-average), with higher values during an ELM – 7 MW/m2. These results are based on the assumption of 1 MJ ELMs at 40 Hz (10% going to upper divertor). The corresponding delta-T between surface and coolant will be small. Of course there are ‘off-normal’ loads as well as uncertainties on what ELMs will really be like.
Average surface temperatures range from 420K (high conductivity) to 470K. These are accompanied by average fluxes of 8x10²¹/m2/s over 35 m2.
A.3 Scaling wall fluxes from ASDEX Upgrade to ITER
Predictions for the ITER wall ion fluxes have been obtained by scaling from the total main chamber ionization rate in ASDEX Upgrade obtained by H spectroscopy. ASDEX Upgrade is in particular well suited for these scaling studies since it has similar separatrix densities compared to ITER and similar plasma shape and high heating power available. Different scaling assumptions have been used: a) Similar relative edge density profile shapes in ITER and AUG in combination with a diffusive transport ansatz, b) identical radial flux densities for similar values of P/R, where P is the total power through the separatrix and R the major radius; and c) the same exercise assuming flux density similarity for the same P/R2.
With the diffusive ansatz using D= 3 m2/s and an assumed density gradient of 2 1019 m-3 / 0.05 m, a flux density of 1.2 1021 m-2s-1 was obtained. Taking into account the experimental observation that the outflux is concentrated around the outer midplane, a fraction of 1/3 of the ITER surface area of 680 m2 is used resulting in a total inter-ELM outflux of 3 1023 ions/s. This ion outflux partly recycles on LFS limiters, a significant fraction is directed towards the HFS due to (~ parallel) SOL flows. For standard AUG conditions, the recycling flux on the HFS dominates the LFS value by typically a factor 2-4, depending on inner and outer wall

Page 38
0.0
0.2
0.4
0.6
0.8
1.0
1.2
Steady state + time-average (ELM) loads
5.0 5.2 5.4 5.6 5.8 6.0Rmajor [m]
qperp[MW/m2]
Γperp[1023/m2]
qtot = 14.4 MW
Γtot = 5.7 x10²³/s
Figure A.4: Calculated steady state + time-averaged heat and particle flux profiles at the upper divertor
clearance. However, the flux densities are larger on the LFS due to the much smaller limiter wetted area.
Under the assumption of ion flux density being the same in AUG and ITER for similar P/R2 we use from AUG a medium power discharge (7.5 MW and R= 1.65m, S=43 m2) with total wall flux 2 1022 ions/s. ITER has 100 MW and R=6.2 m for P/R2 of 2.6 (AUG value close at 2.75). Assuming the ion flux densities are the same then the total flux in ITER is obtained by multiplying the AUG value with (SITER/SAUG) = 16 to account for different surface areas. This results in a predicted ITER wall ion flux of 3 1023 ions/s, similar to the diffusive ansatz. If P/R were the correct similarity parameter, the high ITER values cannot be achieved in AUG. So we take the measured AUG recycling flux and scale by its power dependence, which is roughly P0.25 82 from 7.5 MW to 26.6 MW which would be required to have the same P/R in AUG compared to ITER (a factor of (26.6/7.5)0.25=1.37). We then can scale by the areas again (factor of 16) giving an ITER value 4.4 1023 ions/s.
Recent high power AUG discharges (12 MW, Psep~10 MW) with higher current (1.2 MA) showed a total main chamber recycling flux of 1023 ions/s, including the effect of ELMs which carry about 33% of the time-averaged recycling. Extrapolating these values according to P/R2 (again, assume the same scaling with area of x16) suggest an ITER inter-ELM recycling level of 1.1x1024 ions/s or 1.6x1024 ions/s if the ELMs are taken into account. No power scaling is used here, the AUG P/R2 is higher and the AUG P/R is lower than the ITER value.
Taking the average of the different methods, a total inter-ELM recycling level of 7 1023 ions/s is recommended, and 1 1024 ions/s regarded as upper limit.
The in-out asymmetries depend on the respective wall clearance and probably also the number and shape of the limiters. In AUG, a major part of the flux recycles at the high field side, but approaching a double-null configuration, a part of the parallel flux directed to the HFS is expected to be directed towards the upper divertor. The following distribution of the total ion wall flux i is suggested: 1/3 i to the LFS, 2/3 i exp(-dRXP/ n) to the upper divertor and 2/3 i (1 - exp(-dRXP/ n)) to the HFS. dRXP is the distance between the two X-points mapped to the outer midplane and n the density e-folding length (~ 50 mm).
A.4 Convective model scaling of wall fluxes to ITER
This method assumes that the far SOL transport (radial flux of ions, radial) is dominated by convection, radial= nveff, where veff is the convective velocity. Based on analysis of multi-tokamak (JET, DIII-D and C-Mod) L-mode similarity discharges it was found that the far SOL convective velocity was essentially independent of dimensionless parameters ( *, * and ) 83,84. Examination of H-mode plasmas led to similar levels of wall ion fluxes as found in L-mode 85. The implication for ITER was that far from the separatrix (limiter radius, r/a~1.08) a convective velocity range of 50-100 m/s would be predicted. A value of 75 m/s was selected for this exercise.

Page 39
Based on the convective paradigm and the SOL profiles of section 1.1.1 we can make predictions of the ion flux reaching the main chamber surfaces. The limiter density from the Figure 1.1.2 density profile is 1.3x10¹⁹/m3. Together with 75 m/s the time-averaged flux would then be ~1021/m2/s. Over the 670 m2 of vessel surfaces (excluding the divertors) that leads to a total flux of ~7x10²³/s. As part of this study we compared the L-mode and H-mode (with ELMs) particle fluxes to the main chamber surface in DIII-D based on work by Leonard. 85 The fluxes were essentially the same after taking into account ELMs.
The power fluxes to main chamber surfaces are more difficult to estimate in light of the ITER specification of ELMs with < 1 MJ energy losses. First, examining only the steady state heat flux it is simply the wall flux (7x10¹⁹) which carries (2Ti + 5.5Te) per ion-electron pair (~ 100 eV), or 11 MW. If we utilize the densities and temperature profiles for ELMs discussed earlier, together with an assumption of 75m/s convective velocity, we find that the instantaneous energy carried by each ELM at the limiter radius to be (1x10¹⁸/m3 x 500m/s (assumed for ELMs) x 2000eV/ELM x 1.6x10⁻¹⁹ J/eV x .001s/ELM x 670 m2) ~ 100kJ or 4.2 MW averaged over time. So ~ 15 MW to the first wall other than divertors.
We can sum the upper and divertor particle fluxes. Together with the upper divertor flux (2.8x10²³/s) the total wall flux would be ~1x1024/s. The total power to all surfaces outside the lower divertor would be 15 MW (main chamber) + 6.5 MW to upper divertor, ~ 22 MW overall.
Note that in the likely scenario of 18 poloidal limiters as part of the first wall the local flux will be enhanced over the values described above.

Page 40
Appendix B: Particle fluxes and surface temperatures used for empirical scaling calculations
B. Lipschultz 20-6-2008 Technique: Used spreadsheets with data from the edge of the plasma edge and wall grids. They are from an equilibrium solution 1084 from A. Kukushkin. The profiles of fluxes and temperatures are shown in a series of figures following table 1.
Table 1 summarizes an effort to quantize sections of the divertor to be easily used in scaling calculations for T retention. The division into areas was made on the basis of the local ion flux density. For example the section 2 of the outer divertor was limited on both sides by the flux density dropping by a factor of 10 from the peak. The edge of section 3 was another factor of 10 lower in flux density still.
The surface temperatures were calculated for 2 cases – thermal conductivity kappa =150 W/m-K, and 50 W/m-K. The former covers an average conductivity (pan/pitch) for NB31 as well as for W. The latter is for neutron-damaged NB31.
Most variables plotted are self-explanatory. But Andre has given me the secret to the power loadings:
Wrad the radiation power; Wpart the total power delivered with particles; Wpls the total power delivered with charged particles (ions + electrons); Wneu the total power delivered with neutrals; Wheat the kinetic energy released at the target from impinging particles (ions + electrons + neutrals); Wpot the potential energy released at the target from impinging particles (ions + electrons + neutrals). The basic relations among these quantities are: Wtot = Wrad + Wpart Wpart = Wpls + Wneu = Wheat + Wpot
Please note that the kinetic energy delivered to the target is not equal to the product of the particle flux and the mean energy, since the kinetic energy of the reflected particles is subtracted. This is indeed the net power delivered to the target. You can use the difference between these two as a measure of the power reflected back from the surface. One more comment to the same estimates: the electrons should also be included, they contribute 2*Te per electron (or 2*Z*Te per ion).

Page 41

Page 42

Page 43
Outer divertor Various profiles are given below. Note that the sections shown in fig. 1 correspond to [-.045, .01], [.01, .065], [.065, .3], and [.3, 0.9].
1084 plasma - outer divertor
0.0 0.2 0.4 0.6 0.8WALL:x_arnd, GRID: x_rv
0.1
1.0
10.0
100.0
D+
, D
0 e
nerg
y [eV
] WALL: eava_d
GRID: 3.5*Ti
x axis offset of 22.11m
WALL: flxa_d/1.e22
GRID: flx_01d/1.e22
WALL: Area[m2]

Page 44
1084 plasma - outer divertor
0.0 0.2 0.4 0.6 0.8GRID: x_rv
1018
1019
1020
1021
1022
ne fro
m flx
_01d/c
s/a
lpha GRID: ne~flx_01d/cs/alpha
1084 plasma - outer divertor
0.0 0.2 0.4 0.6 0.8WALL:x_arnd, GRID: x_rv
0
2
4
6
8
10
he
at
flu
x [
MW
/m2
]
x axis offset of 22.11m
WALL: WTOT
WALL:WRAD
WALL:wpls
GRID: flx_01d*ei_o1d
WALL:flxi_d*eavi_d

Page 45
1084 plasma - outer divertor
0.0 0.2 0.4 0.6 0.8WALL:x_arnd, GRID: x_rv
0
500
1000
1500
2000
2500
T_
su
rf [
de
g.
K]
WALL: T_surf_50 (K=50 W/m-K)
WALL: T_surf_150 (K=150 W/m-K)

Page 46
Inner divertor: Various profiles are given below. Note that the sections shown in fig. 1 correspond to [-.05, .01], [.01, .17], [.17, .35], and [.35, 0.6].
1084 plasma - inner divertor
0.0 0.1 0.2 0.3 0.4 0.5 0.6WALL:x_arnd, GRID: x_rv
0.1
1.0
10.0
100.0
D+
, D
0 e
ne
rgy [e
V]
WALL: eava_d
GRID: 3.5*Ti
x axis offset of 1.0m
WALL: flxa_d/1.e22
GRID: flx_01d/1.e22
WALL: Area[m2]

Page 47
1084 plasma - inner divertor
0.0 0.1 0.2 0.3 0.4 0.5 0.6WALL:x_arnd, GRID: x_rv
0
1
2
3
4
he
at
flu
x [
MW
/m2
] WALL: WTOT
WALL:WRAD
WALL:wpls
GRID: flx_01d*ei_o1d
WALL:flxi_d*eavi_d
x axis offset of 1.0m
1084 plasma - inner divertor
0.0 0.1 0.2 0.3 0.4 0.5 0.6WALL:x_arnd, GRID: x_rv
0
200
400
600
800
1000
T_surf
[deg. K
]
WALL: T_surf_50 (K=50 W/m-K)
WALL: T_surf_150 (K=150 W/m-K)

Page 48
Dome:
1084 plasma - dome
4.0 4.5 5.0 5.5 6.0R[m]
0
5
10
15
WALL: flxa_dg [1.e22/m2/s]
WALL: eava_dg [eV]
Total atom flux = 1.76237e+24 #/s
flux-weighted atom energy = 1.39903 eV
Average atom flux density = 2.82715e+22 #/m2/s
Dome area = 62.3374 m2
1084 plasma - dome
4.2 4.4 4.6 4.8 5.0 5.2 5.4R[m]
0
100
200
300
400
500
600
T_surf
[deg. K
]
WALL: T_surf_50WALL: T_surf_150
Avg surf temp (K=50 W/m-K) = 438KAvg surf temp (K=150 W/m-K) = 346K

Page 49
Appendix C – Comparison of available T diffusion and trapping codes (written by D. Whyte, June 20, 2008) This writeup compares the two cases that Rob K. ran with TMAP/DIFFUSE for the benchmark. Data are tabulated in the Excel file also attached. I now include Olga’s result after clarification of the total fluence / exposure time. These were for the “MIT” benchmark case at 2e23 D/m2/s. I have translated her results into g-T/m2 assuming 50:50 D:T. Benchmark conditions for all my runs: constant T throughout PFC, 2 cm thick PFC, Frauenfelder diffusivity, bounce frequency in trap 1e13 /s. I have organized the data to g-T / m2 versus shot, assuming 50:50 D-T hydrogenic mix throughout. The first comparison is for the “BPO report” benchmark, which is good to look at since DIFFUSE runs were also available. Case: fixed trap density ~0.65% W density, 1.4 eV traps, 2 nm implantation depth. Results are plotted for different incident flux and T below.

Page 50
The agreement is very good between the three codes at 650 K in both absolute magnitude and trends versus shot and incident flux. At 900 K the codes diverge somewhat (factors up to three) in absolute levels, although the trend versus shot still look the same. My code calculation is on the lower side of TMAP/DIFFUSE. From my code I can see that the large reduction between the 650 K to 900 K case is the effect of de-trapping turning on, namely the quasi-equilibrium condition is that the traps are only partially filled (~2-10%) even though the solute H has permeated quite deeply. I checked the numerical results against a simple analytic model I have to calculate the equilibrium fraction of filled traps and they agree. Based on examining the analytic solution, it looks 900 K is just when (for these conditions) the de-trapping starts to turn on. Since the de-trapping is exponentially sensitive to T, it may be that a small detail in calculating the de-trapping rate is leading to the difference. In fact, my code uses the general formulation for de-trapping used in TMAP as below; so Rob and I could check details to spot the difference.
The form of trapping and de-trapping rate (/s) are taken from TMAP 60
as
Rtrap =Dntr2 nW
Rde trap = exp(Etr
kTPFC) Eq. 3
where is the distance between empty traps ~ , ~1013 s-1 is the bounce frequency of H in traps and Etr~1.5 eV is the trap activation energy

Page 51
Now I show the comparison for the “MIT benchmark” case between my code and TMAP. Case: fixed trap density ~0.1% W density, 1.5 eV traps, 10 nm implantation depth.
The three codes have excellent agreement for the 2e23 case versus shot number.

Page 52
The agreement again is excellent at 600 K, but my calculation is factor 2-3 lower than TMAP at 900 K. Since this condition is not wildly different than the “BPO” case, I assume that the differences can be attributed to the same issues described above. Olga’s result at 100 shots with 2e23 at 900K fall between TMAP and my calculation. The codes agree within a factor of three for the reduction in retention versus T. Since we all get the same answer at low T, I’d assume we’re treating the permeation the same, and so these differences are due to different ways of handling de-trapping.

Page 53
Appendix D: Comparison of TMAP and WW diffusion codes (D. Whyte ca. Oct. 2008):
Before getting to the specific comparison between TMAP and WW, I’ll note that my
suspicion about the large slab thickness for my initial runs affecting the accuracy at this time
scale are correct. For Case 3 I plot the trapped T density as a function of time (out to 1e5 s)
for two cases with different slab thickness. Each line, starting from the top, represents a slab,
moving into the material as one moves vertically down the plot.
For the case of 500 micron slabs we have for WW:
while for the case of 100 micron slabs we find:
Evidently in the 500 micron slab case the T accounting accuracy is affected by the discrete
slabs being too large in comparison to the diffusion depth at 1e5 s. This accuracy problem is
resolved of course at longer times, as for example from the initial WW runs I replot the
trapped T density, but now with the time axis out to 4e6 s.

Page 54
Now let’s compare the WW runs with inputs matched to TMAP runs
a) Use 1/sqrt(3) correction to Frauenfelder for T
b) Fix trap solid fraction at 1e-2.
c) Have finer time resolution (10s 1s) which will allow me to run the code with finer
slab resolution if desired (as above)
d) Back T = 425 K
Other inputs kept the same such as surface T (WW uses T gradient as TMAP), flux, etc.
These are for case with implantation only affecting Css so that recombination infinity. I
record two WW outputs for the different slab thicknesses in the model of 500 and 100
microns.
Case 3: Flux: 9.3e22 /m2/s, T_surf = 645 K, E_ions = 93 eV.
Theory TMAP WW: 500 micron
WW:
100 micron I (10
4 s)
(m-2
) 1.03E+23 1.02E+23 1.88e23 7.46e+22
I (105 s)
(m-2
) 3.27E+23 3.21E+23 4.48E+23 2.947E+23
Case 6: Flux: 6.5e23 /m2/s, T_surf = 591 K, E_ions = 4.5 eV.
Theory TMAP WW: 500 micron
WW:
100 micron I (10
4 s)
(m-2
) 6.05E+22 7.56E+22 8.96e22 3.13e+22
I (105 s)
(m-2
) 1.91E+23 2.37E+23 3.28+23 1.70E+23

Page 55
Case 11: Flux: 2.1e21 /m2/s, T_surf = 425 K, E_ions = 46 eV.
Theory TMAP WW: 500 micron slab
WW:
100 micron
slab
WW: 100
micron, x10
time-split I (10
4 s)
(m-2
) 1.10E+22 1.04E+22 3.78e21 1.19e+21 7.6e21
I (105 s)
(m-2
) 3.49E+22 3.18E+22 3.5+22 1.21E+22 4.56e22
At this point the conclusion is that the comparisons from theory, TMAP and WW are
sufficiently good for cases 3 and 6, with the stipulation that WW is used with finer slab
resolution for comparison at this relatively short time of 1e5 s.
The agreement for case 11 (the lowest flux case) is not so good, with in fact the disagreement
becoming larger for finer grid resolution, which is the opposite of the expected trend. The
reason for this underestimate by WW in case 11 is the time-splitting resolution I set in WW
to keep the code numerically stable to trapping v. de-trapping, while accurately following
diffusion processes on finer timescales (e.g. when heating is pulsed). This problem is easily
detected in the trapped T density versus time for case 11 as in the table above, again with
each line representing a slab in the model. The linear increase in time is the indicator that my
time-splitting is too conservative for this particular case, i.e. even though the code has
allowed diffusion of solute D to various layers the traps are effectively being filled at too
slow a rate in the numerics, resulting in a linear increase in the trapped T density. As with the
slab thickness, the limitation in accuracy imposed by the time-splitting vanishes at longer
timescales. Note that the time-splitting can only ever underestimate the trapped T density if
the numerics are stable.
For comparison then at 1e5 s, I reduced the time-split, with the following result plotted
below. Note that now the trapped T increases more like sqrt(time) which indicates my time-
splitting is better suited to this case with reduced permeation.

Page 56
The results with the corrected time-split are also reported in the case 11 table. Note the much
better agreement to TMAP, and that the WW result is slightly higher than TMAP, as
expected from the slightly too coarse grid resolution at 100 microns.
Discussion
The conclusion is that WW is calculating the T retention to sufficient accuracy as compared
to the analytic model and TMAP when the input parameters are kept consistent. The accuracy
of these WW runs is in a sense intentionally poor at short timescales (< 1e4-1e5 s) since the
goal was to examine deep permeation at long time-scales when the T inventory might
approach the 700 g limit in ITER. The specific numerical inputs (larger slab thickness,
conservative time-splitting) of these WW runs were geared toward that goal with the result
that WW runs of this sort are very fast (< 5 minutes for all 14 ITER zones). Yet these WW
runs provide further insight than the analytic model since it can accurately deal with the T
gradient through the PFC and the time-evolving trap density. The numerical accuracy of the
WW runs can/should be checked in each zone by simply plotting the T trap density versus
time for each slab. The WW runs are sufficiently accurate at a particular time if: 1) the
trapped tritium density is distributed through more than the top 1-2 slabs in the model and b)
the trapped tritium density is not scaling exactly linearly in time which indicates that the
time-splitting is too conservative.

Page 57
References 1S. Ciattaglia, P Andrew, A. Loarte et al., in (Proc. of the 25th Symposium on Fusion Energy,
Rostock, Germany, 2008), series, Vol., (2008) Paper P3.109. 2T. Loarer, C. Brosset, J. Bucalossi et al., Nuclear Fusion 47 (2007) 1112.
3J. N. Brooks, A. Kirschner, D. G. Whyte et al., Journal of Nuclear Materials 313-316 (2003)
424. 4J. Roth, A. Kirschner, W. Bohmeyer et al., Journal of Nuclear Materials 337-339 (2005)
970. 5A. Kirschner, D. Borodin, S. Droste et al., Journal of Nuclear Materials 363-365 (2007) 91.
6A.S. Kukushkin, H.D. Pacher, V. Kotov et al., Nuclear Fusion 45 (2005) 608.
7A. Kirschner, P. Wienhold, V. Philipps et al., Journal of Nuclear Materials 328 (2004) 62.
8Joachim Roth, Emmanuelle Tsitrone, Thierry Loarer et al., Plasma Physics and Controlled
Fusion 50 (2008) 103001. 9A. A. Haasz, J. N. Brooks, R. Causey et al., "On US-BPO ITER task #5 - Choice of PFC for
ITER," (University of Toronto Institute for Aerospace Studies (UTIAS), 2007). 10
R. P. Doerner, A. Grossman, S. Luckhardt et al., Journal of Nuclear Materials 257 (1998)
51. 11
H. Y. Guo, J. P. Coad, S. J. Davies et al., Journal of Nuclear Materials 241-243 (1997) 385. 12
The JET Team, Journal of Nuclear Materials 176-177 (1990) 3. 13
A. Kallenbach, R. Dux, J. Harhausen et al., Journal of Nuclear Materials 363-365 (2007)
60. 14
A. Kreter, S. Brezinsek, J. P. Coad et al., Journal of Nuclear Materials 390-391 (2009) 38. 15
M. Mayer, V. Rohde, K. Sugiyama et al., Journal of Nuclear Materials 390-391 (2009)
538. 16
D.G. Whyte, J.P. Coad, P. Franzen, and H. Maier, Nuclear Fusion 39 (1999) 1025. 17
Y. Gotoh, T. Tanabe, Y. Ishimoto et al., Journal of Nuclear Materials 357 (2006) 138. 18
V. Philipps, 'Erosion-redeposition and fuel retention in JET C4-C15 campaigns', ITPA
meeting report, November 6-9, 2006, Toronto. 19
V. Philipps, 'JET conditioning with Beryllium', ITPA SOL/Divertor meeting report, January
9-12, 2006, Shanghai. 20
M. Miyamoto, K. Tokunaga, T. Fujiwara et al., Journal of Nuclear Materials 313-316
(2003) 82. 21
G. De Temmerman and R. P. Doerner, Journal of Nuclear Materials 389 (2009) 479. 22
G. De Temmerman, M. J. Baldwin, R. P. Doerner et al., Journal of Nuclear Materials 390-
391 (2009) 564. 23
G. De Temmerman, M. J. Baldwin, R. P. Doerner et al., Nuclear Fusion 48 (2008) 075008. 24
A. A. Haasz, J. W. Davis, M. Poon, and R. G. Macaulay-Newcombe, Journal of Nuclear
Materials 258-263 (1998) 889. 25
O. V. Ogorodnikova, J. Roth, and M. Mayer, Journal of Nuclear Materials 373 (2008) 254. 26
R. Causey, K. Wilson, T. Venhaus, and W. R. Wampler, Journal of Nuclear Materials 266-
269 (1999) 467. 27
I. Alessandrini, G. Maddaluno, G. Giacomi, and W. Bohmeyer, 'Report on deuterium
desorption from W-1% La2O3 samples after exposure in plasma generators', ENEA Frascati
report FUS TN PF-TS-R-004, 2001, 28
V.Kh. Alimov and J. Roth, Physica Scripta T128 (2007) 6. 29
G.M. Wright, "The dynamics of hydrogen retention in irradiated molybdenum," PhD,
University of Wisconsin, 2007. 30
R. Doerner (personal communication). 31
V. Kh Alimov, W. M. Shu, J. Roth et al., Physica Scripta in press (2009).
Page 58
32J. P. Sharpe, R. D. Kolasinski, M. Shimada et al., Journal of Nuclear Materials 390-391
(2009) 709. 33
W. R. Wampler and R. Doerner, Physica Scripta, in press (2009). 34
V. Philipps (personal communication). 35
K. Sugiyama, M. Mayer, V. Rohde et al., Nuclear Fusion submitted to (2009). 36
O. V. Ogorodnikova, J. Roth, and M. Mayer, Journal of Nuclear Materials 313-316 (2003)
469. 37
V. Rohde, V. Mertens, and A. Scarabosio, Journal of Nuclear Materials 390-391 (2009)
474. 38
B. Lipschultz, D. G. Whyte, J. Irby et al., Nuclear Fusion 49 (2009) 045009. 39
K. Tokunaga, M. J. Baldwin, R. P. Doerner et al., Journal of Nuclear Materials 337-339
(2005) 887. 40
G. N. Luo, W. M. Shu, and M. Nishi, Fusion Engineering and Design 81 (2006) 957. 41
V. Kh Alimov, J. Roth, R. A. Causey et al., Journal of Nuclear Materials 375 (2008) 192. 42
O. V. Ogorodnikova, J. Roth, and M. Mayer, Journal of Applied Physics 103 (2008)
034902. 43
S. M. Myers, P. M. Richards, W. R. Wampler, and F. Besenbacher, Journal of Nuclear
Materials 165 (1989) 9. 44
"Evaluated Nuclear Data File," (National Nuclear Data Center, Brookhaven National
Laboratory). 45
H. Iida, V. Khripunov, V. Petrizzi, and G. Federici, 'ITER Nuclear Analysis Report', ITER
report G 73 DDD 2 W 0.2, 2004, 46
C. H. M. Broeders and A. Yu Konobeyev, Journal of Nuclear Materials 328 (2004) 197. 47
H. Eleveld and A. van Veen, Journal of Nuclear Materials 212-215 (1994) 1421. 48
M. Fukumoto, H. Kashiwagi, Y. Ohtsuka et al., Journal of Nuclear Materials 390-391
(2009) 572. 49
W. R. Wampler and R. P. Doerner, Nuclear Fusion 49 (2009) 115023. 50
I. Takagi, S. Watanabe, S. Nagaoka, and K. Higashi, Fusion Science and Technology 41
(2002) 897. 51
G. M. Wright, D. G. Whyte, and B. Lipschultz, Journal of Nuclear Materials 390-391
(2009) 544. 52
J.F. Ziegler, J.P. Biersack, and U. Littmark, "SRIM," in The Stopping and Range of Ions in
Solids (Pergamon Press, New York, 1985). 53
P. Jung, "1.5 Production of atomic defects in metals in thermal equilibrium," in Atomic
Defects in Metals, edited by H. Ullmaier (Springer Verlag, 1991), Vol. 25, pp. 4-5. 54
W. M. Shu, M. Nakamichi, V. Kh Alimov et al., Journal of Nuclear Materials 390-391
(2009) 1017. 55
G. Federici, C.H. Skinner, J.N. Brooks et al., Nuclear Fusion 41 (2001) 1967. 56
M. A. Pick and K. Sonnenberg, Journal of Nuclear Materials 131 (1985) 208. 57
R.A. Anderl, D.F. Holland, G.R. Longhurst et al., Fusion Technology 21 (1992) 745. 58
W. R. Wampler, Journal of Nuclear Materials 145-147 (1987) 313. 59
P. Franzen, C. Garcia-Rosales, H. Plank, and V. Kh Alimov, Journal of Nuclear Materials
241-243 (1997) 1082. 60
G.R. Longhurst, 'TMAP-7 user Manual', Idaho National Laboratory report INEEL/EXT-04-
02352, 2004, 61
D. G. Whyte, Journal of Nuclear Materials 390-391 (2009) 911. 62
K. Schmid, Nuclear Fusion 48 (2008) 105004. 63
A. Kirschner, D. Borodin, V. Philipps et al., Journal of Nuclear Materials 390-391 (2009)
152. 64
J. Roth, R. Preuss, W. Bohmeyer et al., Nuclear Fusion 44 (2004) L21.
Page 59
65G. Federici, P. Andrew, P. Barabaschi et al., Journal of Nuclear Materials 313-316 (2003)
11. 66
V. Kh Alimov, W. M. Shu, J. Roth et al., 'Deuterium retention in tungsten exposed to pure
and helium-seeded deuterium plasmas', ITPA SOL/Divertor report, January 9-12, 2009,
Amsterdam. 67
S. Lindig, M. Balden, V. Kh Alimov et al., Physica Scripta in press (2009). 68
J. Roth, S. Lindig, M. Balden et al., 'Correlation of sub-surface structural changes with
hydrogen concentrations in Tungsten', ITPA SOL/Divertor report, January 9-12, 2009,
Amsterdam. 69
M. Mayer, 'Deuterium permeation through W foils - diffusivity and trap concentration',
ITPA SOL/Divertor report, January 9-12, 2009, Amsterdam. 70
M. I. Baskes, Journal of Nuclear Materials 92 (1980) 318. 71
Z. Tian, J.W. Davis, and A. A. Haasz, Journal of Nuclear Materials in press (2009). 72
Y. Ueda, M. Fukumoto, Y. Ohtsuka et al., 'D behavior in damaged W by high energy ion
beam', ITPA SOL/Divertor report, September 15-18, 2008, Nagasaki. 73
B. Tyburska, V. Kh Alimov, O. V. Ogorodnikova et al., Journal of Nuclear Materials In
Press (2009). 74
W. R. Wampler and R. Doerner, 'Retention of deuterium at displacement damage in
plasma-exposed tungsten', ITPA SOL/Divertor report, January 9-12, 2009, Amsterdam. 75
R. Doerner, 'Simultaneous D/He implantation in W using PISCES', ITPA SOL/Divertor
report, January 9-12, 2009, Amsterdam. 76
H.T. Lee, A. A. Haasz, and J. W. Davis, Journal of Nuclear Materials 363-365 (2007) 898. 77
Y. Ueda, M. Fukumoto, J. Yoshida et al., Journal of Nuclear Materials 386-388 (2009)
725. 78
Y. Ueda, S. Kajita, N. Ohno et al., 'Formation condition of nano-structure and
retention/blistering under He/D plasma', ITPA SOL/Divertor report, January 9-12, 2009,
Amsterdam. 79
Y. Ueda, H. Kashiwagi, M. Fukumoto et al., Fusion Science and Technology 56 (2009) 85. 80
A. Kallenbach, N. Asakura, A. Kirk et al., Journal of Nuclear Materials 337-339 (2005)
381. 81
A.S. Kukushkin, H.D. Pacher, G.W. Pacher et al., Nuclear Fusion 43 (2003) 716. 82
A. Kallenbach, M.N.A. Beurskens, A. Korotkov et al., Nuclear Fusion 42 (2002) 1184. 83
B. Lipschultz, P. Andrew, J. Coad et al., in (Proc. of the 30th European Conf. On
Controlled Fusion and Plasma Physics, St. Petersburg, Russia, 2003), series, Vol., European
Physical Society, Geneva (2003). 84
B. Lipschultz, D. Whyte, and B. LaBombard, Plasma Phy. & Cont. Fusion 47 (2005) 1559. 85
A. W. Leonard, J. A. Boedo, M. Groth et al., Journal of Nuclear Materials 363-365 (2007)
1066.