Embed Size (px)
Citation preview

AN ASSESSMENT OF THE APPLICATION OF USED
LUBE-OIL FOR IMPROVEMENT OF ENGINEERING
FOUNDATIONS
PAUL CHRISTOPHER KIMALI KIOKO
MASTER OF SCIENCE
(Civil Engineering)
JOMO KENYATTA UNIVERSITY OF
AGRICULTURE AND TECHNOLOGY
2015

An assessment into the application if used lube-oil for improvement
of engineering foundations
Paul Christopher Kimali Kioko
A thesis submitted in partial fulfillment for the degree of Master of
Science in Civil Engineering in Jomo Kenyatta University of
Agriculture and Technology
2015

ii
DECLARATION
This thesis is my original work and has not been presented for a degree in any other
University.
Signature ………………………………….. Date ………………………...
Paul Christopher Kimali Kioko
This thesis has been submitted for examination with our approval as university
supervisors.
Signature ………………………………….. Date ………………………...
Dr. (Eng.) G. N. Mang’uriu
JKUAT, Kenya
Signature ………………………………….. Date ………………………...
Prof. (Eng.) Walter Oyawa
JKUAT, Kenya

iii
DEDICATION
This thesis is dedicated to my wife Jane Kimali and two sons, Xavier Kioko Kimali
and Vincent Mwanzi Kimali for their resilience, positive attitude, encouragement
and support throughout my academic life.

iv
ACKNOWLEDGEMENT
I would like to take this opportunity to express my heartfelt appreciation and sincere
gratitude to my joint supervisors, Prof. (Eng.) Walter Oyawa and Dr. (Eng.) G. N.
Mang‟uriu for their relentless, invaluable and reliable advice and guidance towards
the success of this thesis.
I would also like to thank my family for their support and encouragement. I would
also like to acknowledge many members of technical staff who have all been a
source of inspiration and motivation to me throughout the thesis duration. This
include Mr. Karugu, Mr. Hinga, Mr. Obadiah and Ms. Lydia of the Civil
Engineering Department, Mr. Kibiro and Mr. Mwangi of the Mechanical
Engineering Department, and Mrs. AkinyiNgugi and Mr. Eric Onyango of the
Materials Testing and Research Department in the Ministry of Roads.

v
TABLE OF CONTENTS
DECLARATION ..................................................................................................... ii
DEDICATION ........................................................................................................ iii
ACKNOWLEDGEMENT ..................................................................................... iv
TABLE OF CONTENTS ........................................................................................ v
LIST OF TABLES ............................................................................................... viii
LIST OF FIGURES ............................................................................................... ix
LIST OF APPENDICES ......................................................................................... x
LIST OF ABBREVIATIONS AND ACRONYMS ............................................... xi
ABSTRACT ........................................................................................................... xii
CHAPTER ONE...................................................................................................... 1
INTRODUCTION ................................................................................................... 1
1.1 Background Information ...................................................................................... 1
1.2 Problem Statement .............................................................................................. 6
1.3 Justification of the Study ..................................................................................... 9
1.4 Research Hypothesis ......................................................................................... 11
1.5 Research Objectives .......................................................................................... 11
1.5.1 Main Objective ...................................................................................... 11
1.5.2 Specific Objectives ................................................................................ 11
1.6 Limitations of the Research ............................................................................... 11
CHAPTER TWO .................................................................................................. 13
LITERATURE REVIEW ..................................................................................... 13
2.1 Background ....................................................................................................... 13

vi
2.1.1 Uses of Used Lube Oil ........................................................................... 17
2.2 Effects of Used engine Oil on Soil ..................................................................... 17
2.2.1 Soil Characterization Results (Uncontaminated Soil) ............................. 18
2.3 Soil types........................................................................................................... 19
2.3.1 Black Cotton Soil .................................................................................. 20
2.3.2 Red Coffee Soil ..................................................................................... 29
2.3.3 Engineering Characteristics of Kenyan Red Soils .................................. 34
CHAPTER THREE .............................................................................................. 39
MATERIALS AND METHODOLOGY .............................................................. 39
3.1 An overview of the tests and test procedures ...................................................... 39
3.2 Viscosity Test .................................................................................................... 40
3.2.1 Preamble ............................................................................................... 40
3.2.2 Apparatus ............................................................................................ 41
3.2.3 Procedure .............................................................................................. 41
3.2.4 Observation ........................................................................................... 42
3.3 Determination of Particle Size Distribution ........................................................ 43
3.4 Atterberg Limits ................................................................................................ 43
3.4.3 Linear shrinkage .................................................................................... 44
3.5 Compaction Test ............................................................................................... 44
3.5.1 Standard Proctor Test ............................................................................ 45
3.6 Permeability Tests ............................................................................................. 45
3.7 California Bearing Ratio (CBR) Test ................................................................. 45
3.7.1 Equipment ............................................................................................. 45
3.7.2 Moulding ............................................................................................... 46

vii
3.7.3 CBR Penetration .................................................................................... 47
CHAPTER 4 .......................................................................................................... 48
RESULTS AND DISCUSSION ............................................................................ 48
4.1 Viscosity Test Results ....................................................................................... 48
4.2 Test Results on Soils ......................................................................................... 49
4.2.1 Moisture Content ................................................................................... 49
4.2.2 Particle size distribution......................................................................... 50
4.3.3 Atterberg Limits .................................................................................... 51
4.3.4 Effect of Waste Lube Oil on Engineering Properties .............................. 55
4.3.5 Compaction Test.................................................................................... 57
4.3.6 Dynamic CBR Test................................................................................ 60
CHAPTER FIVE ................................................................................................... 64
CONCLUSIONS AND RECOMMENDATIONS ................................................ 64
5.1 Conclusions ....................................................................................................... 64
5.1.1 Oil Viscosity ......................................................................................... 64
5.1.2 Soil Properties ....................................................................................... 64
5.2 Recommendations ............................................................................................. 66
REFERENCES ...................................................................................................... 68
APPENDICES ....................................................................................................... 69

viii
LIST OF TABLES
Table 4.1 Dynamic Viscosity Results .................................................................... 48
Table 4.2 Field Moisture Content .......................................................................... 49
Table 4.3 plastic limit test- black cotton soil ......................................................... 51
Table 4.4 Typical Comparison of Properties of Virgin and Treated black cotton soil52
Table 4.5 Mean of Atterbergs: at 0% = 33.6x, at 10% = 30.5y .............................. 53
Table 4.6 Typical Comparison of Properties of Virgin and Treated Red Coffee Soil54
Table 4.7 Mean of Atterbergs: at 0% = 33.6x, at 10% = 30.5y .............................. 55
Table 4.8 Effect of used lube oil on Atterberg Limits for BC ................................ 56
Table 4.9 Average coefficient of permeability for research soils ........................... 57
Table 4.10 Compaction results for research soils ................................................... 58
Table 4.11 CBR results for black cotton and red soils ........................................... 60

ix
LIST OF FIGURES
Figure 4.1 Typical grading curve for neat black cotton soil. .................................. 50
Figure 4.2 Typical grading curve for neat red coffee soil ...................................... 50
Figure 4.3 Liquid limit for neat black cotton soil .................................................. 51
Figure 4.4 Combined results for proctor analysis for black cotton soil .................. 58
Figure 4.5 Variation of maximum dry density with Used Lube Oil ....................... 59
Figure 4.6 Variation of OMC with Used Lube Oil ................................................ 60
Figure 4.7 Variation of CBR for black cotton with used lube oil ........................... 61

x
LIST OF APPENDICES
Appendix 1 - Viscosity Test ................................................................................. 69
Appendix 2 - Particle Size Distribution ................................................................. 71
Appendix 3 - Atterberg Limits .............................................................................. 98
Appendix 4 - Compaction ................................................................................... 102
Appendix 5 - Permeability .................................................................................. 107
Appendix 6 - CBR .............................................................................................. 108
Appendix 7 - Maps ............................................................................................. 113
Appendix 8 - Photographs .................................................................................. 114

xi
LIST OF ABBREVIATIONS AND ACRONYMS
ASTM American Standards for Material Testing
BRRI Building and Road Research Institute
BS British Standards
CBR California Bearing Ratio
EMCA Environmental Management and Coordination Act
ISO International Organization for Standardization
KNBS Kenya National Bureau of statistics
LNAPL Light Non Aqueous Phase Liquid
MDD Maximum Dry Density
NCCK National Council of Churches of Kenya
NEMA National Environment Management Authority
OMC Optimum Moisture Content
RAP Reclaimed Asphalt Pavement
UNHCR United Nations High Commission for Refugees
USEPA United States Environmental Protection Agency
VOCs Volatile Organic Compounds
WEO Waste Engine Oil

xii
ABSTRACT
Lube Oil is used to mean Lubricating Oil as used in automobile engines for
lubrication of moving parts, cooling, cleaning, corrosion control and is produced in
fractional distillation in refinery processes. It is mainly used in the automotive
industry but subsequent research with a view to its application for infrastructure
development is necessary.
The purpose of this study was to assess the suitability of used lube oil for
improvement of engineering foundations as experimented on black cotton and red
coffee soils. I was guided by the following specific objectives; to determine the
fundamental properties of used engine oil, to explore the effect of used lube oil on
the strength and engineering and index properties of the soils and to assess the effect
of used lube oil on the permeability of soil.
Soil improvement is the alteration of any property of a soil to improve its
engineering performance through for instance; increased shear strength, reduced
permeability and reduced compressibility. It results in improved durability of soil by
increasing its strength and resistance to water.
The improvement of black cotton soil and red coffee soils were the basis of this
study by the application of Used Lube Oil in varying quantities at percentages of
0%, 5%, 10%, 15% and 20% by weight. The soils being highly sensitive to seasonal
moisture content variations and are responsible for substantial distress to
foundations and the structures that are built over them. When subjected to static and
dynamic forces these soils heave and crack due to swelling and shrinkage. Hence,
the soils are to be stabilized before construction in order to have efficient and long
lasting foundations. The experimental study involved tests on Used Lube Oil using
Red Wood Viscometer Test No 1-Universal for viscosity less than 2000 seconds
(ASTM D445-06), classification and evaluation of the main index properties of the
soil, compaction tests, California bearing ratio tests and permeability tests. The
attempt was to investigate the limits within which Used Lube Oil can be used to
improve black cotton soil and red coffee soil for engineering foundations and to

xiii
examine the effect of used lube oil on various geotechnical and engineering
properties the methods used being the Red Wood Efflux Viscometer Test No.1-
Universal, cone penetrometer test, compaction test, California bearing ratio test and
permeability tests.
Key test results were ;800kg/m3 density of used lube oil and 55mPa.s dynamic
viscosity, an increase in the maximum dry densities of black cotton and red coffee
soils up to 1655kg/m3 and 1523kg/m
3 respectively at 10% Used Lube Oil; California
bearing ration for black cotton soil and red coffee soil increased from 1 to 8 and 1
to 14 respectively with 10% used lube oil replacement; permeability for black cotton
soil and red coffee soil increased to 3.73x10⁻⁷
and 5.93x10⁻⁷
,respectively.
This led to the conclusion that used lube oil increases maximum dry density,
increases the California bearing ratio and increases permeability among other
properties at 10% used lube oil replacement which is taken as the optimal value.

1
CHAPTER ONE
INTRODUCTION
1.1 Background Information
Soil is generally a very important material in civil engineering where it provides
the foundation for all civil engineering structures. Soils exist in many different
forms such as clay soils, sandy soils, gravel, organic soils and murram all of which
behave differently with regard to strength, susceptibility to cracking, permeability
and erosion. These properties can be improved using admixtures such as bitumen,
cement, lime, pozollana and used lube oil. As a result of this there is need to
improve these weaknesses using an admixture.
Black cotton soils, which form the basis of this thesis, are highly sensitive to
seasonal moisture content variations and are responsible for substantial distress to
foundations and the structures that are built over them on these soils. Civil
Engineering Structures especially foundations in these areas suffer from premature
failures attributed to the rich proportions of montimorillonite and kaolinite found in
the soil. Stabilizing black cotton soil with chemicals, industrial wastes, geotextiles
and so on have been found to be effective in improving their engineering
properties, strength characteristics and CBR value.
Black cotton soils are problematic for Civil Engineers, because of their
unconventional behaviour. These soils show large volume changes with respect to
variation of seasonal moisture content. These soils when subjected to static and
dynamic forces heave and crack due to swelling and shrinkage. Hence, the soils are
to be stabilized before construction in order to have efficient and long lasting
foundations. Considerable research has taken place using different stabilizing
materials such as lime, fly ash, cement, rice husk ash, industrial wastes and
geosynthetics and proved to be useful improvement of black cotton soils.
Foundation cracks resulting from alternate heave and settlement lead to ultimate
failure.

2
Black cotton soil swells during rainy season and cracks in summer due to
shrinkage. These shrinkage cracks are 100 mm to 150 mm wide and 0.5 m to 2 m
deep. Swelling creates upwards pressure on the structure and shrinkage creates
downward pull. It results into cracks in foundations results, walls and roof, Hence
foundation in black cotton soil needs special care.
Used Oil has been a challenge over a long time and efforts to sustainable handling
started way back in the 1970s in Pennsylvania. Due to this, interest has been
developed into the suitability of Used Oil for soil improvement for engineering
foundations.Soil stabilization is the alteration of any property of a soil to improve
its engineering performance through for instance; increased shear strength, reduced
permeability, and reduced compressibility. It results in improved durability of soil
by increasing its strength and resistance to water.
Soil improvement in foundation construction has become very expensive in recent
times due to the increased costs on the materials that go into their construction.
This research seeks to come up with an appropriate technology that is suitable,
sustainable and economically adaptable. Used Lube Oil is thereby investigated to
establish its suitability as an improvement material for foundations in Kenya and
beyond.
Expansive soils are encountered in arid and semi-arid regions of the world, where
annual evaporation exceeds annual precipitation. In India, expansive soils cover
about 20% of the total land area (Ranjan & Rao, 2005; Shelke & Murthy, 2010).
These soils increase in volume on absorbing water during rainy seasons and
decrease in volume when the water evaporates from them (Chen, 1988). The
volume increase (swell) if resisted by any structure resting on it; then vertical
swelling pressure is exerted by the soil on the structure. This pressure if not
controlled, may cause uplifting and distress in the structure (Shelke & Murthy
2010). The strength loss on wetting is another severe problem with such soils. Due
to this peculiar behaviour many civil engineering structures constructed on
expansive soils get severely distressed. Pavements are in particular, susceptible to
damage by expansive soils because they are lightweight and extend over large

3
areas. Dwelling houses transferring light loads to such soils are also subjected to
severe distress. Similarly, earth structures such as embankments, canals built with
these soils suffer slips and damages (Mishra et al., 2008).
Soil stabilization techniques are widely used for stabilizing expansive soils.
Physico-chemical stabilization using lime, cement, fly ash, enzymes, and other
chemicals control the swelling in expansive soil (Lopez-Lara et al., 1999). In these
techniques, uniform mixing of the stabilizers in soil must be ensured else erratic
results may come. Mechanical stabilization of soil (without altering chemical
properties) includes controlling compaction (Sridharan and Gurtug, 2004), pre-
wetting (Chen, 1988), mixing with sand (Sridharan &Gurtug, 2004; Mishra et al.,
2008), using cohesive non-swelling soil (Katti et al., 1983), EPS geofoam (Shelke
& Murthy 2010), reinforcing the soil, using geosynthetics (Sharma & Phanikumar,
2005; Ikizler et al., 2009) and by using polypropylene fiber (Muthukumar 2012) are
used. Special foundation techniques such as lime under-reamed piles, belled piers
and granular pile anchors are also suggested (Phanikumar 1997).
Recently Kumar and Jain (2013) and Kumar (2014) have demonstrated that the
concept of granular pile, that is popular in improving the weak marine clays, could
be utilized to improve the load carrying capacity of soft expansive black cotton
soils too. In the granular pile, also known as stone column, technique about 10 to
35% weak soil is removed and replaced with granular material in the form of piles.
Kumar (2014) performed model test in the laboratory on granular piles of sand
constructed in soft expansive soil of different UCS values. End bearing granular
Piles were casted in the soil and the load test were performed. The test results
showed that load carrying capacity of a footing resting on granular pile is
significantly more than the corresponding value for the footing placed directly on
the soft soil bed. The increase in load carrying capacity is observed for all soil
consistencies of the expansive soil. It is concluded from his study that loss in
strength and excessive settlement of the expansive soil due to wetting could be
minimized to a large extent by installation of granular piles in the soil.
4
As reported above, besides the strength loss, the swelling and volume instability are
the other severe problems with these soils. The present work is an attempt to fill
this gap. The size of the sand column and the consistency of the soil play an
important role in changing the behaviour of composite ground. Hence these two
aspects are varied in the present work and the influence of the sand column
diameter and the initial moisture content on the swelling of an expansive black
cotton soil has been studied. The details of the experimental program, results of the
tests and the conclusions drawn from the study were published.
It has been observed that in Nigerian roads, road construction is mostly done using
lateritic soils as base and sub-base materials. If the surfacing material accumulates
small surface water due to poor drainages, the water penetrates to the base and sub-
base, thereby giving it a bad look. The water percolates the base and sub-base
materials and dissolve them thereby causing big damage to the road. The base/sub-
base material dissolves because of high percentage of clay soil present or as a result
of improper stabilization methods. This depicts the need for special additives in our
road pavement material stabilization to ensure improvement in the engineering
properties of the soil such as volume stability, strength and stress-strain properties,
permeability, and durability.
Much research has been carried out on the stabilization of soil, especially on
laterites using several stabilization agents, mostly the use of cement, lime and fly-
ash. But meaningful works on the applicability of used engine oil in soil
stabilization are wanting. This research is an assessment on the engineering
properties of the stabilized soil with used lube oil in varying quantities (0%, 5%,
10%, 15%, and 20%).
Used motor oil contaminations of soil are common wherever motor mechanic
workshops are located (Euchun & Braja, 2001).
Oil contaminated soil (OCS) has been defined by Colorado Department of Health
and Environment (2003) as any earthen material or artificial fill that has human or

5
natural alteration of its physical, chemical, biological or radiological integrity
resulting from the introduction of crude oil, any fraction or derivative thereof (such
as gasoline, diesel, or used motor oil) or any oil based product. Oil waste dumping,
production, pollution, and spills wreak havoc on the surrounding wildlife and
habitat. It is in this vein that geotechnical engineers are faced with increasing
challenges as a result of oil spills and hence the need for laboratory studies in order
to develop methodologies for testing, identification, classification, engineering
behavior, stabilization, utilization and remediation technologies for such soils.
OCS could also be the waste product of cleaning up oil spills or due to oil spillage.
Left unattended, these soils pose a threat to human health and the environment.
Numerous remedial technologies are available to eliminate or significantly reduce
the risk that OCS poses, such as conversion of oily soil to road base material or a
topping layer for car parks and roads after mixing with aggregate or a consolidation
agent (Bund, 2012). Other methods include containment in large burial sites,
incineration, biological methods, absorption methods, soil washing methods, and
vacuum extraction. Most of these methods are expensive and uneconomical,
considering the large quantities of materials involved.
Lateritic soil as a soil group rather than well-defined materials is most commonly
found in the leached soils of the humid tropics where they were first studied.
Lateritic soils are formed under weathering systems productive of the process of
laterization (Wooltorton, 1975). The most important characterization is the
decomposition of ferro-aluminium silicate minerals and the permanent deposition
of sesquioxide (i.e., oxides of iron and Aluminum - Fe2O3 and Al2O3) within the
profile to form the horizon of materials known as laterite.
The term “laterization” describes the processes that produce laterite soils (Gidigasu,
& Kuma, 1987). Construction Industry Research and Information Association
(CIRIA, 1988) proposed the following definition for lateritic soils which states that
„laterite in all its form is a highly weathered natural material formed by the
concentration of the hydrated oxides of iron and aluminum. This concentration may
be by residual accumulation or by solution, movement and chemical precipitation.

6
For the purpose of this study a modified definition is used which states that laterite
is a highly weathered material rich in secondary oxides of any of iron, aluminum,
manganese, or titanium(Ijimdiya, 2011).
The purpose of this study was to investigate the effect of used oil on the strength
and compressibility behavior of lateritic soils. Laboratory testing program was
carried out on a reference soil- laterite taken from Shika-Zaria, Kaduna State,
Nigeria. The soil was contaminated with used motor oil at stepped concentrations
of 0, 2, 4, 6 and 8 % by dry weight of soil (Al-Sanad et al., 1995). Similar
researches were carried out by Shin and Das (2001) on the bearing capacity of
unsaturated oil-contaminated sand in Kuwait. Shin and Das (2001) reported that the
bearing capacity of oil-contaminated sands drastically reduced.
During the last two decades, the results of a number of studies related to the
physical properties and behavior of oil and petroleum contaminated soils have been
published by many researchers like Al-Sanad et al. (1995), Aiban (1997), Meegoda
and Ratnaweera (1994), Mohammed (1995), Khamehchiyun et al. (2006) and
Ijimdiya (2007, 2010, 2011).
1.2 Problem Statement
Good infrastructure has been and still is the desire of many nations especially in the
developing world and indeed even in the developed world. This has been a
daunting task to many governments though it has been declared a millennium
development goal to be achieved in this century. The Kenya government has also
outlined this to achieve its Vision 2030 which is the country‟s new development
blue print covering the years 2008 to 2030. This goal cannot be achieved if
expensive construction methods and approaches are still used as is the case today.
With the high levels of poverty and uncertainty of the world‟s economy, there is
need for cheaper and locally available construction materials. First and foremost,
Portland cement, fly ash and ordinary bitumen which are widely used in
stabilization of road sub-bases albeit being readily available in most countries are
significantly more expensive in contrast with the used lube oil being investigated in

7
this research. The monthly waste is estimated at 1.5 million litres and the figure is
always escalating and this will soon be exacerbated by the recent discoveries of oil
in Turkana, north-eastern Kenya, and the coast region compounded with the overall
accelerated development towards Vision 2030.
Used lube oil is a generic of fractional distillation just like bitumen and is
discharged or drained as waste in numerous waste generators including petrol
stations and mechanics‟ garages with the discharge rate now creating inter-alia;
unprecedented public health concerns, detrimental impacts on the flora and fauna,
soil degradation, compromising on the quality and the standard of living and image
and rating at a global scale. For years, motor oil commonly has been used and
reused or discarded in ways that neither protected the environment nor conserved
its resource value.
All possible and current modes of disposal are known to contaminate the
environment, very little if not nothing is being done to address the problem. The
country lacks a legal framework that encompasses handling of harmful waste with
the exception of toxic and radioactive waste (Karanja et al., 2005).
This research seeks to come up with an appropriate technology that is suitable,
sustainable and economically adaptable and to provide enhanced soil improvement
technique while contributing to waste oil management.
The research is aimed at obviating the costs associated with the use of alternative
foundation types like piles or at worst the cost of hiring mechanical plant to scoop
vast quantities of black cotton soil and associated municipal disposal costs
compounded with EMCA (1999) and regulations as enforced by NEMA.
The civil engineer is faced with the practical problems raised by use of soil as a
foundation and construction material. A consideration of careful experimental
investigation and the need for simplicity in the means employed has to be attained.
In Kenya, the non-availability of generalized relevant data in this area, particularly
for initial preliminary engineering planning and designs, has been the major cause
of failure of most of subgrade.

8
The construction material, which is used for engineering highway projects, is
therefore as important, as other engineering design factors. Thus in road pavement
design, the soil materials used in the pavement construction transmit the axle-load
to the sub-soil or sub grade. Hence, the durability of a highway pavement is a
function of the ease and rigidity of the pavement soil to transmit the stress induced
in it to the sub-soil such that unnecessary deformation is avoided.
Large amount of waste product from the automotive industry and by-product of
frying can impose adverse impact if not disposed properly. Recycling of the waste
product can be seen as sustainable options, which offers conservation of natural
resources and economic benefits.
Waste oil which is discarded into the environment without any treatment
prominently produce adverse impact to the environment. The effect can be seen by
eutrophication process. The thin layer of oil that appears on the surface of river or
lake can block the sunlight, the photosynthesis and also disrupt the oxygen supply
to the aquatic life (El-Fadel & Khoury, 2001; Hamad et al., 2003). These processes
lead to the excessive growth of micro-organism, phytoplankton and algea that use
the waste oil as a food source. Lake or river quality deteriorates and also disrupts
the intrinsic equilibrium of aquatic ecosystem. The source of waste oil pollution to
the river can be contributed by engine oil from automotive industry and also waste
cooking oil from residential area. With the concern of high construction cost and
natural resource conservation, waste oil recycling is becoming the viable alternative
in mitigating these problems (El-Fadel & Khoury, 2001). After years of exposure to
traffic loads and climate change, the road will experience aging and reduction in
binder performance. The pavement distinctive feature is that after the end of its
design life, the pavement surfaces can be milled and recycled which is known as
RAP (Jamshidi et al., 2012; NAPA, 2009). This renewability process can be done
through 'rejuvenation'. Higher RAP content in the mixture can significantly
increase the mixture's stiffness. However, too much RAP can reduce the mixtures
performance. Therefore, through rejuvenation the properties of the old asphalt
pavement particularly the binder properties can be improved to restore the original

9
ratio of asphaltenes to maltenes and compensate this hardening effect (You et al.,
2011; Garcia et al., 2011; Romera et al., 2006). Economic improvement has a direct
impact on commercial activities and road network facilities in a country. This
situation can lead to an increase in the number of vehicles on the road. In Malaysia,
there are a total of 22 million registered vehicles which can contribute to the WEO
that can lead to environmental pollution if not disposed of properly or recycled
(Road Transport Department, 2012). Generally, engine oil also referred as oil
lubricants, oil cylinder, crankcase oil and motor oil (Ssempebwa & Carpenter,
2009; Romera et al., 2006). Vehicle workshops and factories with heavy machinery
are seen as primary sources that generate waste engine oil (WEO). If the discharge
of WEO is not well managed or disposed, it will affect human health, aquatic life
and ground pollution. According to previous studies, little waste engine oil is
enough to ruin millions of gallons of fresh water (Moghaddam et al., 2011).
1.3 Justification of the Study
A study of this nature is very useful and it has far-reaching benefits. It is imperative
to note that to date there is no policy on used oil management and micro-managing
the same by limited entrepreneurs including credit for collection of used oil in
Nairobi has not born any fruits hitherto.
This comes hot on the heels of vast quantities of used lube oil discharge into the
liquid and solid waste stream currently estimated at 1.5 Million Litres Monthly and
this figure is conservative.
Any legislation based on this research on used lube oil will be to assign common
points for generating and collecting used lube oil for purposes of ensuring safe
disposal and ultimate use for the improvement of our engineering foundations
through treatment of the same.
It will be useful to the National and County Governments (for roads, airstrips,
building foundations, harbours, earth-dams, retaining walls and related engineering
works) as well as related professional bodies like Engineers Board of Kenya,
Institution of Engineers, the National Construction Authority ,the National

10
Environmental Management Authority and others ,all in an endeavor to address
economy in construction, the ever glaring eco-challenges of waste management and
disposal , enhancement of small & medium size industries for used oil storage,
handling and disposal. Professionally it will help set precedent in defining other
frontiers within this research context for our universities towards achieving our
national goals.
This research is an integrated effort towards sustainable development as defined in
Agenda21 of the United Nations Conference on Environment and Development
held at Rio de Janeiro,Brazil,3rd
to 14th June,1992 and as well the provisions of
EMCA (1999) laws of Kenya. Specifically, it will facilitate in drafting of the
relevant legislation and policy making for this cause.
The research is aimed at obviating the costs associated with the use of alternative
foundation types like piles or at worst the cost of hiring mechanical plant to scoop
vast quantities of black cotton soil and associated municipal disposal costs and
further NEMA (2003) regulations regarding the same.
Used Lube Oil for black cotton soil improvement for foundations was extracted
from a lube bay at Shell Petrol Station on Latema road in Nairobi City. In Kenya,
used lube oil is predominantly treated as waste and is cheaply dispensed with to
prospective buyers and is extremely cheap citing the example of far flung sites
across the country like Kakuma where the retail prices of items is at least 3times
the normal cost in towns like Nairobi. This makes used lube oil quite versatile for
use in stabilization and is expected to cut down the cost of stabilization
significantly.
This study is considered very important as it investigates the effect of used engine
oil as an additive in soil stabilization. This research is meant to evaluate and
compare the engineering characteristics of normal soil and that contaminated with
used engine oil. If the required objectives such as improvement of volume stability,
strength and stress strain properties, permeability and durability are met using
engine oil, it would be a breakthrough in the applicability of waste material like

11
used engine oil in the construction industries, particularly in Kenyan roads which
are most often not satisfying the expected standard design life span and which also
would reduce the exorbitant cost in road construction.
1.4 Research Hypothesis
It is conjectured that there is a significant impact in the physical and mechanical
properties of black cotton soil and red coffee soil with the application of used lube
oil for engineering foundations within the ranges of replacement of 0%, 5%, 10%,
15% and 20%.This is predicated on the properties of used lube oil on the
engineering and index properties as well as permeability as per the research
objectives.
1.5 Research Objectives
1.5.1 Main Objective
The main objective of the study was to assess the suitability of used lube oil for
improvement of engineering foundations as experimented with black cotton and red
coffee soils.
1.5.2 Specific Objectives
1. To determine the fundamental properties of used engine oil.
2. To explore the effect of used lube oil on the strength and engineering and
index properties of the soils such as liquid limit, plastic limit, plasticity index,
optimum moisture content, California Bearing Ratio.
3. To assess the effect of used lube oil on the permeability of soil.
1.6 Limitations of the Research
This study is an assessment on the applicability of used lube oil in black cotton soil
and red coffee soil. The work is limited to black cotton soil and red coffee soil
samples collected from Kakuma food distribution center camp site in Turkana
County and Red Coffee Soil from Kwa-Vonza Urban Center in Kitui County,

12
although any other soil with the same chemical characteristics as the ones studied
can also benefit from the results obtained.

13
CHAPTER TWO
LITERATURE REVIEW
2.1 Background
This chapter gives the review of the literature on the application of used lube oil for
soil improvement. There was once a five acre property in Pennsylvania which was
formerly the location of a fuel oil recycling and solvent recovery facility between the
late 1970s and early 1990s. During this time period, used oils were re-refined into
fuel oil for sale to residual fuel users and lubricating oil was also manufactured from
the used oils. This process generated a clay filter cake waste that was stockpiled on
the property. The property came to the attention of the Pennsylvania Department of
Environmental Protection (PADEP) due to community complaints and non-
compliance issues on the solid waste mess. In 1988, they conducted a site inspection
of the property and identified volatile organic compounds (VOCs). Analytical
results, for samples collected by the United States Environmental Protection Agency
(USEPA) Region III, from staged waste materials (sludges, clay filter cake) on-site
recommended remedial measures.
Remedial investigation for the property was transferred to the Potentially
Responsible Parties (PRPs) group in the late 1990s. Following preparation, submittal
and approval of the Remedial Investigation Work Plan (2000), investigative activities
were conducted from 2000 to 2004 and included collection and analysis of surface
soils, subsurface soils, groundwater, sediment, surface water and light non-aqueous
phase liquid (LNAPL).
Results from the five phases of the remedial investigation reported no site
contaminants were detected in surface water samples and the results of the stream
sediment data did not indicate that the site contaminants had impacted sediments.

14
A human health risk assessment was conducted that evaluated both industrial and
residential receptors based on current and projected future use of the property. Site-
specific remedial objectives were identified and included in the Feasibility Study.
The Remedial Investigation Report (including the human health risk assessment) and
Feasibility Study Report were approved by USEPA Region III in 2005 and 2006.
EPA issued the Record of Decision (ROD) for the site in the spring of 2007. A
remedial design investigation is anticipated for late 2010 or 2011.
Evaluated human health exposure pathways included vapour intrusion into future
commercial buildings, direct contact risks to future construction workers, and direct
contact risks to future residents on offsite, down gradient properties.
Improved lubricating oils usually contain special additives, such as detergents and
dispersants to prevent carbon-forming deposits, as well as antioxidants and corrosion
inhibitors to protect metallic surfaces. Viscosity-index improvers, wetting agents,
extreme pressure additives and pour point depressants are added to motor oils to
improve overall performance.
Engine oil is a complex mixture of hydrocarbons and other organic compounds,
including some organometallic constituents (Butler & Mason, 1997) that is used to
lubricate parts of an automobile engine, in order to smoothen engine operation
(Hagwell et al., 1992). Used motor oil contains metals and heavy polycyclic aromatic
hydrocarbons that could contribute to chronic hazards including mutagenicity and
carcinogenicity (Keith &Telliard, 1979; Hagwell et al., 1992; Boonchan et al., 2000).
Prolonged exposure to high oil concentration may cause the development of liver or
kidney disease, possible damage to the bone marrow, and an increased risk of cancer
(Propst et al., 1999; Mishra et al., 2001; Lloyd & Cackette, 2001).
Large amounts of spent or used engine oil are liberated into the environment when
motor oil is changed and disposed into gutters, water drains, open vacant plots and
farmlands, a common practice in Nigeria by motor mechanics and generator
mechanics (Odjegba & Sadiq, 2002). In some developing countries, used engine oil
is discharged into the environment.

15
In Nigeria and some developing countries, about 20 million gallons of waste engine
oil are generated annually from mechanic workshops and discharged carelessly into
the environment (Faboya, 1997; Adegoroye, 1997). According to US Environmental
Protection Agency, USEPA (1996), only 1 litre of used engine oil is enough to
contaminate one million gallons of freshwater. Used engine oil also renders the
environment unsightly and constitutes a potential threat to humans, animals, and
vegetation (Edeworet et al., 2004; Adelowo et al., 2006). Environmental pollution
with petroleum and petrochemical products has attracted much attention in recent
times. The presence of various kinds of automobiles and machinery vehicles has
caused an increase in the use of motor oil. Spillages of used motor oils such as
diesels or jet fuels contaminate our natural environment with hydrocarbon (Husaini
et al., 2008). As the usage of petroleum hydrocarbon products increase, soil
contamination with diesel and engine oils is becoming one of the major
environmental problems (Ameh et al., 2012). To investigate the countermeasure to
remediate soils contaminated with oils, bioremediation provides an effective and
efficient strategy to speed up the clean-up processes (Mandri & Lin, 2007). Various
factors may limit the rate of petroleum hydrocarbon degradation including lack of
essential nutrients such as nitrogen. Therefore, the addition of inorganic or organic
nitrogen-rich nutrients (biostimulation) is an effective approach to enhance the bio-
remediation process (Hollender et al., 2003; Semple et al., 2006; Walworth et al.,
2007).
There are relatively large amounts of hydrocarbon in the used oil, including the
highly toxic polycyclic aromatic hydrocarbons. Also most heavy metals such as
Vanadium (V), Lead (Pb), Aluminium (Al),Nickel (Ni), and Iron (Fe), which are
below detection in unused lubricating oil, have been reported to give high values in
(ppm) in used oil (Vwioko et al., 2006). In addition, the oil is also released into the
environment from the exhaust system during engine use and due to engine leaks
(Anoliefo & Edegbai, 2000). Spent engine oil, when present in the soil, creates an
unsatisfactory condition for life in the soil, which is due to the poor aeration it causes
in the soil, immobilization of soil nutrients and lowering of soil pH (Achuba &

16
Peretiemo-Clarke, 2008). Petroleum hydrocarbon contamination will not just affect
the quality of the soil but will also alter the physical properties of oil contaminated
soils. This will lead to geotechnical and foundation problems related to construction
of buildings and other Civil Engineering structures such roads, dams, water/oil
retaining structures.
Used oil was defined by the US Environmental Protection Agency (USEPA, 1996) as
oil that has been refined from crude oil or any synthetic oil; this has been used and as
a result of such use is contaminated by chemical impurities which contribute to
chronic hazards including mutagenicity and carcinogenicity as well as environmental
hazard with global ramifications (Udeani et al., 2009). The term, used engine oil,
refers to any lubricating oil that has served its service properties in a vehicle
withdrawn from the meant area of application and considered not fit for its initial
purpose (Ameh et al., 2012). Used engine oil, which is also known as used mineral
based crankcase oil, is a brown-to-black liquid produced when new mineral-based
crankcase oil is subjected to high temperature and high mechanical strain (Arise et
al., 2012).
Used engine oil (UEO) is a mixture of several different chemicals (Wang et al.,
2000), including low and high molecular weight (C15-C20) aliphatic hydrocarbons,
aromatic hydrocarbons, polychlorinated biphenyls, chlorodibenzofurans, lubricative
additives, decomposition products, heavy metal contaminants such as aluminium,
chromium, tin, lead, manganese, nickel, and silicon that come from engine parts as
they wear down. Used oil can also originate at seaports from ocean going vessels
which can contain salt sea water, heavy and intermediate fuel oil along with various
heavy metals common to such fuel oil.
Appreciable quantities of used oil motor spills are common at and around mechanic
workshops. Laboratory testing program has been carried out to determine the effect
of used motor contamination on the strength properties of lateritic soils.
Contaminated specimens were prepared by mixing the soil with used oil by weight of
dry soil.
17
2.1.1 Uses of Used Lube Oil
According to Sriniwas (2012, the waste lube oil is used for the following purposes:
i) Wood Preservative
Used to preserve metal equipment and as well used in formworks preparatory to
concreting.
ii) Dust control
Can be used for stabilization.
2.2 Effects of Used engine Oil on Soil
The method used in the sample collection is the trial pit method. One (1) undisturbed
block sample and several disturbed samples were collected from one location at the
Engineering workshop complex site. A trial pit is simply a hole dug in the ground
that is large enough for a ladder to be inserted, thus permitting a close examination of
the sides. With this method, relatively undisturbed samples of soils were collected.
The depth of the trial pit was 1.8m (6ft) and about (1.2m) 4ft x (1.2m) 4ft wide i.e.
1.2m x 1.2m x 1.8m pit. The pit was sunk by hand excavation with the aid of spade
and digger.
In the study, used engine oil collected from a motor mechanic workshop near the
university campus was used to contaminate the soil samples. The used engine oil of
0, 2, 4, 6, 8 and 10% by weight of the dry soil samples was mixed with the soil
samples. The five (5) mixed samples (soil-oil) were put in containers and allowed to
equilibrate with time in line with the procedure adopted by Khamehchiyan et al.
(2007).
Soil index property and classification tests namely, natural moisture content, specific
gravity, particle size analysis, Atterberg limits and compaction tests were performed
on the soil. Strength tests (CBR and unconfined compression tests) were then
performed on the uncontaminated soil and all the used engine oil (UEO)
contaminated soil samples.
18
2.2.1 Soil Characterization Results (Uncontaminated Soil)
For this lateritic soil, the percentage passing sieve No. 200 (0.075 mm), No. 40
(0.425 mm) and No. 10 (2.00 mm) are 32.80%, 49.58% and 79.25%, respectively.
The specific gravity of the soils was 2.72. The soil is classified as A-2-7 with a group
index of 3 according to the Association of American States Highway and
Transportation Officials Classification System (AASHTO). It is also classified as
sandy clay (SC), according to the Unified Soil Classification System (USCS). The
results of the index properties (mechanical and physical analysis), compaction
characteristics, unconfined compressive strength and California bearing ratio (CBR)
for the uncontaminated soil are summarized below:
For the compaction test, the standard proctor method was adopted for this study. This
test was used to determine the maximum dry density (MDD) and the optimum
moisture content (OMC) of the lateritic soil. The results for the compaction tests
performed on the uncontaminated and variably contaminated lateritic soils using the
standard proctor method are presented in graphical plots in Figure 2. Both the
maximum dry density (MDD) and the optimum moisture content (OMC) decreased
with increase in the used engine oil concentration in the soil. This is clearly indicated
by the downwards and left side shift of the compaction curves from the
uncontaminated soils‟ curve. This is probably due to the fact that oil has partially
occupied the soil inter-particle spaces and the occurrence of oil has resulted in some
loosening of the soil matrix. The change in the composition of the pore fluid would
also affect the microstructure of the clayey lateritic soil.
In conclusion, the MDD for the lateritic soil decreased from 1795 kg/m3 to 1698
kg/m3 with increase in used engine oil concentration. The OMC values dropped from
15.3% to 10.9%. The CBR value of the lateritic soil decreased from 22.05 % to
14.45%. The unconfined compressive strength (qu) value for uncontaminated soils
was 204kN/m2. This reduced to 140kN/m
2 at an oil content of10%. These results
reveal that the addition of used engine oil has adverse effects on the compaction and
strength characteristics of this lateritic soil. Used engine oil contamination does not
just affect the quality of the soil and ground water; it also alters the physical and

19
geotechnical properties of the oil contaminated soil. The high indices of correlation
(the coefficient of determination, R2) for the established relationships between
geotechnical characteristics and the used engine oil content, suggest that these
expressions are suitable for the determination of the compaction and strength
characteristics for similar lateritic soils at different degrees of used engine oil
contamination.
In Kenya attempts have been made to manage used lube oil mess but the challenge
still remains unabated .Motor vehicle mechanics are given small loans which they
use for buying tools and improving their business. The mechanics repay the loans by
supplying used oil drained from motor vehicles they repair.
This project aims to reduce water pollution by used oil generated by mechanics who
then dispose the oil into the environment. Through this scheme, participants access
loans by trading in waste. In return for safely collecting and recycling the used oil,
the mechanics get small loans for improving their motor vehicle repair business.
Provision of small loans to 70 mechanics enables the project to safely collect 31,000
litres of used oil. According to the KNBS (2015), it is estimated that there are over
two million vehicles on Kenyan roads. With the increasing number of vehicles being
registered daily used lube oil is overwhelmingly being discharged to the environment
and the need to bridge this gap.
2.3 Soil types
Soils are sediments or other unconsolidated accumulation of solid particles produced
by the physical and chemical disintegration of rocks, and which may or may not
contain organic matter. Soil has distinct advantages as a construction material,
including its relative availability, low cost, simple construction techniques, and
material properties, which can be modified by mixing, blending, and compaction.
However, there are distinct disadvantages to the use of soil as a construction
material, including its non-homogeneity, variation in properties in space and time,
changes in stress-strain response with loading, erodability, weathering, and
difficulties in transitions between soil and rock.

20
Prior to construction, engineers conduct site characterization, laboratory testing, and
geotechnical analysis, design and engineering. During construction, engineers ensure
that site conditions are as determined in the site characterization, provide quality
control and quality assurance testing, and compare actual performance with predicted
performance.
Numerous soil classification systems have been developed, including geological
classification based on parent material or transportation mechanism, agricultural
classification based on particle size and fertility, and engineering classification based
on particle size and engineering behaviour. The purpose of engineering soil
classification is to group soils with similar properties and to provide a common
language by which to express general characteristics of soils.
Selection of the type of soil for use in this project is based on prior knowledge of the
widely used red coffee soils, especially in Nairobi. Conclusions and
recommendations of the project are meant to bring about an insight on any necessary
improvements on the same.
2.3.1 Black Cotton Soil
Black clay soils or tropical black earth or black cotton soils are known to be
potentially expansive soils. They classify in pedological parlance as vertisols and
have been subject of considerable agricultural and engineering research especially in
India and some African countries. The black cotton soils are considered
“problematic” and sometimes as “potential natural hazard” because they cause
extensive damage to light structures founded on them due to excessive seasonal
volumetric changes (swell & shrinkage).
Considering the widespread prevalence of black cotton soils around the world and
the geomechanical challenges they pose to structures founded on them, we need to
understand the peculiar characteristics and behaviours to enable effective utilization
of these soils for engineering purposes. As a first step there is a need to assemble,
correlate and integrate useful information on the genesis, nature and distribution as
well as some basic geotechnical characteristics of the black cotton soils useful for

21
civil engineering purposes scattered in various journal papers, proceedings of
conferences, symposia, workshops, etc.
Secondly, there is also the need to add value to existing knowledge in terms of
technical information relating to geology and geomechanics of the black cotton soils
occurring in Ghana through laboratory and field studies.
Black cotton soils are major problematic soils of some tropical countries especially
in Africa and India. They are poor materials by temperate zone standards and
difficult to use for road and air field construction because they are often expansive
due to the presence of large percentages of expansive clay minerals, i.e.
montmorillonite. These soils swell when in contact with water and shrink on drying.
The soil deposits are usually extensive making it impossible to avoid or by pass
during construction of engineering projects. Many roads and foundations of light
buildings have been reported distressed due to the seasonal volume change (i.e. swell
and shrinkage) of these soils (Chen, 1988). These soils have reportedly inflicted
billions of dollars in damages and repairs annually to earth structures and facilities.
Definition and Nomenclature:
Black clays or tropical black earth or black cottons are known to be potentially
expansive soils which are “black” or “greyish black” or in their eroded phase
“greyish white” heavy loam or clay (usually 50%), with predominantclay mineral of
the smectite group, rich in alkali earth elements and the horizons sometimes contain
calcium carbonate or magnesium oxide concretions. Many other terms have been
applied locally, such as “regur”soils in India, “margalitic” soils in Indonesia, “black
turf”in Africa and “tirs” in Morocco. Although there are several names,the term
“black cotton soil” is adopted in this paper because of its extensive use in literature.
The term “black cotton”is believed to have originated from India where the locations
of these soils favour cotton growth.
Black cotton soils have been defined differently by different authors, for instance
Mohr and Van Baren (1959) proposed the term “margalitic soils” which they defined
as “black or greyish black, grey or in the eroded phase greyish-white” heavy loam or

22
clays; which crack when dry and swell when moistened, they are mostly rich in
alkaline earths; horizons of calcium concretions develop sometimes or lime
concretions are found scattered throughout the profile; they are characterized by
montmorillonite or other minerals of the smectite group as clay compound.
USAID/BRRI (1971) also defined the tropical black cotton clay to be dark grey to
black soil with a high content of clay usually over 50%, in which montmorillonite is
the principal clay mineral and are commonly expansive. Morin (1971) defined black
cotton soil as dark grey to black soil which has high clay content usually over 50%
and are potentially expansive. Bucher and Sailie (1984) described black cotton soil as
rich in montmorillonite and therefore prone to high volume change in the presence of
water.Black cotton soils have been identified on igneous, sedimentary and
metamorphic rocks. They are formed mainly by the chemical weathering of mafic
(basic) igneous rocks such as basalt, norite, andesites, diabases, dolerites, gabbros
and volcanic rocks and their metamorphic derivatives (e.g. gneisses) which are made
up calcium rich feldspars and dark minerals which are high in the weathering order,
in poorly drained areas with well-defined wet and dry seasons. All constituents
weather to form amorphous hydrous oxides and under suitable conditions clay
minerals develop. The absence of quartz leads to the formation of fine grained,
mostly clay size, plastic soils which are highly impermeable and easily becomes
waterlogged. In addition abundant magnesium and calcium present in the rock adds
to the possibility of formation of black cotton soil with its attendant swelling problem
(Ola, 1983). The black cotton soils have also formed over sedimentary materials such
as shales, limestones, slates etc.
Topography:
Kattietal. (2002) reported that the black cotton soil deposits are formed under
conditions where the slope of the terrain is less than 3°. The most frequent
physiographic position of black cotton soils is flat, alluvial plains (Dudal & Eswaran,
1988; Eswaran et al.,1988) such as those found in Sudan, Texas in the USA, Darling
Downs in Australia, the Accra plains, Ho-Keta plains and the Winneba plains in

23
Ghana (USAID/BRRI, 1971; BRRI, 1985). Other fewer occurrences are the Lufina
valley of Zaire, the Kafue Flats of Zambia and the Panamalenga plains and the
Springbok flats in Botswana, and South Africa respectively. However, black cotton
soils also occur in surfaces with greater slopes (Ahmad, 1983).
Age:
Clemente et al., (1996) reported that time of formation of vertisols are usually
inferred from the age of the underlying parent material from which the soil has
developed. Furthermore, they realised that most vertisols are derived from cenozoic
era materials including Tertiary and Quaternary. Some sediments of Cretaceous age
have also formed vertisols (Gidigasu & Gawu, 2013). They indicated however, that
the age of the parent material gives information only on the maximum chronological
point, the age of the geomorphic surface and the soils would be much younger.
Distribution of Black cotton soils:
Black cotton soils (vertisols) have been reported all over the world and have been
found to occupy about 2% (257 million hectares) of the total ice-free land area of the
earth with 72million hectares occurring in India, 71million hectares in Australia
(Swindale, 1988) and 43million hectares is in Africa(Virmani, 1988). Countries
reported to have black cotton soils are Australia (Aitchison, et. al., 1962; Ingles &
Metcalf, 1972), Algeria (Afes &Didier, 2000), Botswana, Ethiopia (Mgangira &
Paige-Green, 2008), Bulgaria, Hungry, Italy (Dudal & Eswaran, 1985), Togo (Oscar
et al.,1977), Nigeria (Ola, 1976, 1983; Osinubi, 2006), South Africa (Van Der
Merwe, 1964), Morocco, Chad, Cameroon,Kenya, Zambia, (USAID/BRRI,
1971),Tanzania (Bucher & Sailie, 1984), Sudan (Charlie et al., 1984), India
(Michael,2006; Rao et al., 2001), Ghana (Building & Road Research Institute, 1985;
USAID/BRRI, 1971).
The roads laid on Black cotton soil (BC soil) bases develop undulations at the road
surface due to loss of strength of the sub grade through softening during monsoon.
The black color in Black cotton soil (BC soil) is due to the presence of titanium
oxide in small concentration. The Black cotton soil (BC soil) has a high percentage

24
of clay, which is predominantly montimorillonite in structure and black or blackish
grey in color. The physical properties of Black cotton soil (BC soil) vary from place
to place.
About 40 to 60% of the Black cotton soil (BC soil) has a size less than 0.001 mm. At
the liquid limit, the volume change is of the order of 200 to 300% and results in
swelling pressure as high as 8 kg/cm2/ to 10 kg/cm
2. As such Black cotton soil (BC
soil) has very low bearing capacity and high swelling and shrinkage characteristics.
Due to its peculiar characteristics, it forms a very poor foundation material for road
construction. Soaked laboratory CBR values of Black Cotton soils are generally
found in the range of 2 to 4%. Due to very low CBR values of Black cotton soil (BC
soil), excessive pavement thickness is required for designing for flexible pavement.
Research & Development (R&D) efforts have been made to improve the strength
characteristics of Black cotton soil (BC soil) with new technologies.
2.3.1.1 Problems of Highway Construction in Black Cotton Soil Areas
There are problems arising out of water saturation. It is a well-known fact that water
is the worst enemy of road pavement, particularly in expansive soil areas. Water
penetrates into the road pavement from three sides viz. top surface, side berms and
from sub grade due to capillary action. Therefore, road specifications in expansive
soil areas must take these factors into consideration. The road surfacing must be
impervious, side berms paved and sub grade well treated to check capillary rise of
water.
It has been found during handling of various road investigation project assignments
for assessing causes of road failures that water has got easy access into the pavement.
It saturates the sub grade soil and thus lowers its bearing capacity, ultimately
resulting in heavy depressions and settlement. In the base course layers comprising
of Water Bound Macadam (WBM), water lubricates the binding material and makes
the mechanical interlock unstable. In the top bituminous surfacing, raveling,
stripping and cracking develop due to water stagnation and its seepage into these
layers.

25
Generally, road construction agencies do not pay sufficient attention to the aspects of
construction and maintenance of side berms. It is emphasized that road formation
consisting of carriageway and berms must be considered as one single unit. In
expansive soil areas, unpaved berms pose the maximum problem as they become
slushy during rains, as they are most neglected lot.
2.3.1.2 Design Problems in Black cotton soils
As we all know, the problem with black cotton soils is that their large volume
changes with moisture content means that are a big problems with foundations.
Tomlinson (1980) notes that seasonal swelling and shrinkage can extend down as far
as 4-5m and says that piled foundations to below this level may be needed even for
light buildings, or that raft foundations may be needed for important structures.
Black cotton soils are a large problem in India. Khanna (1999) notes that in such
soils: 1. Foundation loads are limited to 5 to 10t per m2 (way below your load). 2.
Foundations are taken below the cracking zone 3. Trenches filled with sand or other
material may be used alongside the foundation trench to prevent intimate contact of
the black cotton soil with the foundation concrete and masonry. Sand piling (sand
columns below the foundation) is not so useful in black cotton soils because of the
risk of sand loss through cracks. He recommends that for ordinary buildings,
foundations should be taken 15cm below the depth of cracking and complicated
foundation arrangements with sand. Of course, a key issue is to avoid creating
problems from the roof water by taking it away from the foundations. It is also a
good idea to check what local practices are. If they normally use piles or raft
foundations locally, then these are probably a good idea.
In India, CBR method developed in USA is generally used for the design of crust
thickness. This method stipulates that while determining the CBR values in the
laboratory and in the field, a surcharge weight of 15 kg and 5 kg per 62 mm and 25
mm thickness respectively should be used to counteract the swelling pressure of
Black cotton soils (BC soils). BC soils produce swelling pressure in the range of 20-
80 tons/m2 and swelling in the range of 10-20%. Therefore, CBR values obtained are

26
not rational and scientific modification is required for determining CBR values of
expansive soil.
Having heavy-duty traffic of 4500 commercial vehicles per day and msa 150 as
generally found on our National Highways and taking CBR value of 2%, total crust
thickness of flexible pavement works out to 830 mm which is practically an
impossible preposition. It is felt that CBR design curves require modification for
expansive soils.
Assuming heavy traffic intensity of 4500 commercial vehicles per day and msa 150,
crust thickness of rigid pavement works out approximately 300-320 mm, which is
about one third of thickness needed for flexible pavement. Therefore, it sounds
reasonable to adopt cement concrete pavement in Black cotton soil areas. This type
of pavement may save the engineers from day to day maintenance problems also.
Another approach to the problem can be in having semi rigid sub-bases. It is
discernible that the CBR value of the BC soil be improved by giving a suitable
treatment with the appropriate technology and then work out the crust thickness. This
will substantially reduce the required crust thickness.
Uncompacted berms without any treatment cannot withstand the traffic stresses. It is
a common sight and experience that heavy vehicles get stuck up while overtaking
and sometimes results in serious accidents. Development of separate specifications
for berms need to be evolved.
2.3.1.3 Technologies for Improving CBR of Black cotton soils
2.3.1.3.1 Materials for Soil Stabilization
The engineering properties of Black cotton soil (BC soil) can significantly be
improved with lime or cement treatment. This technology has been very common at
global level and is in vogue for the last several years. Cement or hydrated lime in the
range of 3 to 5 per cent brings remarkable improvement in the engineering
characteristics of Black cotton soil (BC soil). The test results of typical Black cotton

27
soil (BC soil) samples are given in Table 2 to indicate the improvement in its
characteristics.
Cement/ Lime–soil stabilization technology has been found useful cost-effective and
suited to manual methods of construction. This technology has been found 20-30%
cheaper than conventional WBM construction. The cement or lime treatment is being
utilized for the following purposes:
To provide a pavement foundation of marginally weaker in strength than that of
concrete pavement, but much improved strength than natural Black cotton soil (BC
soil).
To consolidate subgrades and base courses for concrete pavement in order to make
them resistant to volume changes and displacement or erosion in the presence of
moisture even under the rocking action of curled slabs, if any.
To overcome the susceptibility of foundations to volume change and to increase their
shearing resistance and bearing capacity.
2.3.1.3.2 Pulverization and Mixing Methodology
The method of pulverization of Black cotton soil (BC soil) and mixing with cement
and murram or lime and murram shall be as follows:
The Black cotton soil (BC soil) is dug from the ground where the embankment is to
be constructed and clods broken with pick-axes so as to reduce them to a maximum
size of 50 mm. Alternatively disc harrows with tractor could be employed. Soil clods
are spread over the prepared and compacted surface of excavation and a smooth
wheeled 8 tonne power roller passed over them a number of times, accompanied by
frequent raking of the crushed material. About 8 passes of the roller combined with
raking should normally be able to achieve the degree of pulverization. The degree of
pulverization should be such that at least 80 per cent of soil passes through 475
micron sieve and there are no lumps larger than 25 mm size.
The pulverized Black cotton soil (BC soil) is mixed uniformly in given proportion by
weight with cement and murram in-situ field conditions by using rotavator machine

28
or motor grader. Portland cement or lime and Black cotton soil (BC soil) mixed at
the proper moisture content has been used to build stabilized bases under concrete
pavements for highways/ expressways and air fields .Cement/ lime-modified Black
cotton soil (BC soil) is a mix that generally contains less than 5 per cent cement by
volume.
This forms a semi-rigid system, improves the engineering properties of the soil and
reduces the potential of the soil to expand by absorbing water. OPC or lime, when
mixed with pulverized Black cotton soil (BC soil) reduces the liquid limit (LL), the
plasticity index (PI) and the potential for volume change. It increases the shrinkage
limit and shear strength. Due to the strength increase incorporated by the use of
cement, the Black cotton soil (BC soil) cement mixture can increase the subgrade
bearing capacity and strength significantly. This technique is relatively cheap and
quite effective. At the ingress of moisture in cement stabilized black cotton soil mix,
the water increases the strength of cement matrix and imparts strength to the mix.
Use of geo-textile fabric has found extensive application in highway engineering,
particularly in expansive soil area. It was used in USA in early 70‟s and in India it is
initial stage. Geo-textiles are manufactured from petroleum derivatives such as
polypropylenes, polyesters, polyamides etc. These have high tensile strength, burst
and puncture strength, permeability and abrasion resistance etc. The use of geotextile
fabric is made to provide a separation barrier between subgrade and sub-base
courses. This technique has tremendous potential for its application in Black cotton
soil (BC soil) area, and it has further been found that this geo-textile layer acts as a
reinforcing layer, acts and can also be used to combat reflective cracking in the
pavement structure. Also with the use of geo-textile, a reduction in the thickness of
the pavement has been predicted ranging from 10 to 25 per cent. The cost of the
geotextile has been the stumbling factor for its wider application in India. However,
in special areas, such as Black cotton soil (BC soil) area, geo-textile offers a solution
to highway engineering problems.
Use of murram layer as a barrier between subgrade and sub-base layer has been in
practice in view of its cost–effectiveness. Murram of low plasticity index has been

29
found effective and does not allow intrusion up of soft subgrade soil into the
interstices of stone aggregates and ingress of water through it. It is a common old
practice to provide about 225 mm thick sand blanket layer on soft soils as a barrier to
stop intrusion of subgrade soil into interstices of granular base/ sub-base layer and
serves as drainage layer, and also to give uniform support.
2.3.1.4 Choice of Top Wearing Courses on Flexible Pavement
In Black cotton soil (BC soil) areas, choice of bituminous surfacing on road crust is
an important parameter in enhancing the life of the pavement. In order to eliminate
the ingress of water into the pavement crust, it is preferred to adopt impervious
surfacing of low void content, such as dense asphaltic concrete, premix carpet with
liquid seal coat, bituminous macadam with seal coat etc. It has been found that open
graded bituminous surfacings develop unevenness, waviness and depression during
rainy season due to softening of subgrade caused by seeping of water through such
open graded bituminous surfacings. In case of construction of new surfacings, it
should be ensured that it is laid much before the monsoon season. It is felt that time
slot of at least one month should be given between the end of construction and
beginning of monsoon so that surface course gets additional compaction due to
traffic. It ensures consolidation and compaction.
Shoulders of roads need special treatment, as these are the vulnerable points for
vehicles getting stuck up during overtaking. It is felt that special treatment is needed
to make the berms paved and separate specifications should be formulated.
2.3.2 Red Coffee Soil
Nairobi red coffee soils have been chosen for geotechnical tests under this research.
Also known as lateritic soils. Various studies on red coffee soils or laterite soils or
red soils have been carried out over the years. These have been defined and described
by a number of researchers in several different ways.
Ola (1978), used local terminology in defining laterite soils as all product of tropical
weathering with reddish, brown colour with or without nodules or concretion but not
exclusively found below hardened ferruginous crust of hardpan.
30
Osula (1984) defined laterite as a highly weathered tropical soil; rich in secondary
oxides of combination of iron, aluminium and manganese. Laterite (also known as
“red soils”) is used to cover all tropically weathered soil that has been involved in the
accumulation of oxides of iron, aluminium or silica (Malomo, 1977).
In other words, red soil is a highly weathered material rich in secondary oxides of
iron, aluminium, or both. According to Alexander and Candy (1962), it is nearly
devoid of bases and primary silicate, but it may contain large amount of quartz and
kaolite. It is either hard or capable of hardening on exposure to wetting and drying
(Agbede, 1992).
Red soils derive their name from their red colour. Kenyan red soils are tropical soils
that result from weathering of parent rock (any type of parent rock containing iron)
which is enriched with oxides of iron and alumina in the form of clay mineral
especially kaolinite group and secondary clays like geothite and haematite. These
soils are the traditional materials for road and airfield construction in Africa and
many parts of the world. They have varied behaviour depending on the origin and
formation. Location also determines their behaviour, thus Kenyan red clays present
problems to engineers due to their unique properties which vary from site to site.
In any study of engineering properties of red clay, it is very essential to include the
geological aspects that are involved in the soil formation. Goetechnical engineering
therefore does have an inetrrelationship with geology. The use of geology helps an
engineer answer pertinent questions that include;
i) What materials are present in the structure and what effects do they have as far
as the strength characteristics of the soil are concerned?
ii) By what process did these materials arise?
iii) What are the mechanical properties of the materials?
iv) Are they subject to risk of failure due to future changes within the engineering
true scale due to geotechnical effects?
Certain aspects of red soils in Kenya have been studied although no comprehensive,
universal and coordinated study has been done. Basically experts involved in various
engineering undertakings in different parts of the country tackle the isolated
31
problems as they are encountered. Therefore there arises a need for a well-
coordinated study that will bring together all that has been done and single out what
that has yet to be done. On the other hand, there are certain generalizations as regards
red soils that are not true for all cases. For instance the Kenyan red coffee soil (red
friable clays) has been taken to have a bearing capacity of 80 kn/m2. This may not be
true for all cases of red soils across the country.
2.3.2.1 Formation of Red Soils
Red clay soils are found as in-situ products of weathering of many types of soils
(extrusive and intrusive). Igneous, metamorphic and sedimentary rocks all contribute
to the formation of red soils provided the right conditions prevail. Deep weathering
profiles develop on volcanic deposits. In most cases most of the original parent rock
has been lost but the gravel sized fragments of parent rock usually themselves get
weathered and relic discontinuities may be encountered. Red soils are therefore
formed from all types of rock:
i) Metamorphic rocks
ii) Igneous rocks (volcanic rocks)
iii) Sedimentary rocks.
2.3.2.1.1 Red soils from metamorphic rocks
When rocks are subjected to heat and pressure, metamorphic rocks are formed which
are entirely different from their original parent rocks. These rocks when subjected to
weathering decompose to form red soils (if enriched with oxides of iron and
alumina). The common types of red soils that result in red soils include;
a) Migmatites
b) Phyllites
c) Silicate Minerals
Migmatites
The introduction of igneous (e.g. granite) into country rock of igneous kinds
produces mixed rock or migmatite when subjected to processes of metamorphism.
These rocks are found in areas of high grade metamorphism in many belts. When

32
these rocks are weathered the iron coating present gives it red colour for which red
soil is identified.
Phyllites
When rock are subjected to pressure they are converted into new products. In this
case shale is converted into slates which in turn are converted to phyllites. Further
subjection of phyllites to greater pressure results in micas and schist from which
weathering breaks them.
In Kenya, these metamorphic rocks are the other major red soils forming red soils
forming rocks other than volcanic. However most Kenyan red soils are also found
where volcanic rocks are dominant.
Silicate minerals
Metamorphic rocks also result in silicate minerals the most important being the mica
group. These are monoclinic minerals whose property of splitting into thin flakes is
their main feature and easily recognized. The most commonly occurring micas are
muscorites which also occur in granites and other acid rocks. They have silver
crystals and are stable minerals. Other metamorphic rocks include quartzite and
gneisses with quartz as the main mineral.
The weathering of these rocks leads to soils of various minerals. Silty red soils are
also a result of these.
2.3.2.1.2 Red soils from igneous rocks
These are molten rock material generated from within or below the earth‟s crust
which reaches the surface from time to time and flows through orifices as lava while
some cool within the crust as intrusive. The most significant igneous rocks in
formation of red soils include:
a) Pyroclastics
b) Biotites

33
Pyroclastics
Pyroclastics are deposits formed by consolidation of fragments ejected during a
volcanic eruption. If the ejected mass forms near the vent then we have
agglomerates. Small particles of ash and dust may be blown by wind and spread over
large areas in layers which harden to form tuffs. Weathered soil containing course
grained silts and clays are formed.
Biotites
Biotites occur in many igneous rocks including granites, then in lavas and dykes.
They occur in crystal brown colour. Feldspars and quartz are the other common
mineral in igneous
When feldspars of granites decompose, the clay mineral kaolinite is formed which is
the main mineral in red soils.
2.3.2.1.3 Red soils in sedimentary rocks
In the sedimentary group of rocks the most important group of soils that are
responsible for the formation of red soil of the ferruginous deposits. These are the
sedimentary rock deposits that contion iron which is either precipitated as primary
mineral or in crystalline lattice. The most common types are iron stones, mudstones,
micaseous sandstones. However in Kenya these types of soils are not prevalent.
2.3.2.2 Red soil forming processes
The primary mineral weathers through illite or montimorillonite, forming kaolinite,
hydrated aluminium and oxide. More resistant quartz and mica particles may remain.
As weathering proceeds the contents of kaolinite decreases and hydrated oxides
progressively alter to sesquioxides which upon drying harden to form laterites,
cementing agents and concentrations.
i) Acid igneous rock – mainly sand or gravely soils with little clay
ii) Basic rocks – fine grained silts and clays
iii) Quartz – sand
iv) Feldspar – kaoline (clay mineral)

34
v) Product of kaolinization – sandy clay
The specific gravity of the soil increases as the weathering proceeds. This is because
the specific gravity of iron bearing mineral is high compared to most other rock and
tropical soil forming minerals.
Soluble irons are removed leaving iron and aluminiumsesquioxides plus kaolinitic
clay mineral. Most residual clays contain the mineral kaolinite aggregated with
oxides and hydroxides of iron and alumina. The parent rock can therefore be from
any of the following sub-groupings:
a) Agglomerates basalt
b) Trachytes
c) Tuffs (Volcanic)
d) Phonolite
e) Quartzite
f) Gneiss and Schist
g) Phyllites
2.3.3 Engineering Characteristics of Kenyan Red Soils
In Kenya red clays from volcanic tuff is very common especially around Nairobi
(Kabete, Limuru) with high contents of clay. Generally volcanic red soils are the
most widespread in Kenya. These soils are free draining and those formed on
volcanic ash deposits are much younger whereas those containing mineral
halloysiteare much older.
2.3.3.1 General
The engineering characteristics of red soil influence its use and performance as a
subgrade in the construction of road pavements. In general the tropical red soils have
properties that are unique to the tropics hence it would not be in order to adopt
testing techniques developed in the temperate areas. It is thus essential to develop
techniques to soils in the tropics.
35
2.3.3.2 Texture of the soil
The texture and the structure of the red soils of East Africa differs greatly from those
in temperate zones. Tropical red soils have concretionary structure as compared to
dispersed structure of temperate zone soil. The clay fraction may vary from 10% to
30%. In terms of texture, laterites for instance can be categorized into the following
categories:
i. Lateritic clays (diameter<0.002)
ii. Lateritic silts (diameter=0.002-0.06mm)
Improvement of red coffee soil using volcanic tuffs from Ngurunga:
i. Lateritic sands (diameter=0.06-2.0mm)
ii. Lateritic gravels (diameter=2.0-60mm)
iii. Lateritic stones and cuirasses (diameter>60mm)
Lateritic gravels and gravelly soils have high contents of fines. These soils exist as
hard medium or weak granules.
2.3.3.3 Structure of red soils
The Kenyan red soil has a concretionary structure which influences its engineering
properties. The physical hardening of laterites for example and its minerology affect
the genesis of laterite soil and the physio-chemical aspects which involve coating of
the soil by iron oxide and alumina. The soil particles later coagulate into clusters
with subsequent reduction of specific surface.
In Kenya, Sasumua clay for example, has aggregated particles that formed clusters
due to the presence of halloysites with iron coating.
2.3.3.4 Colloidal activities
Colloidal activity is the ratio of plasticity index to the clay mineral contents. The
predominant clay mineral in the red soil in Kenya is kaolinite which is inactive hence
low colloidal activity for Kenyan red soils. Residual red soils found in Kenya have
colloidal activity between 0.4-1.0 while non residual soils have values greater than

36
1.0. Low colloidal activity can also be due to method of weathering which involves
coatings of soil particles with sesquioxides hence surface activity suppression.
2.3.3.5 Shrinkage and swelling characteristics
In general, kaolinite particles swell very little but red soils in Kenya undergo an
amount of swell that depends on the initial density and moisture content, the
composition and the method of drying. The swell charecteristics of the Kenyan red
soils are normally found in soils whose permanent rock is of volcanic origin.
Weathering transforms volcanic ash into montimorillonite (black brown), halloysite
and kaolinite.
The high moisture absorption leads to water being held in porous oxide surface
structure. Oven drying leads to water loss hence high index results. On the other
hand prolonged mixing of the soil in the laboratory breaks down the surface structure
of the soil leading to release of iron oxide particles and destruction of any
aggregation of soil particles and hence an increase in the index values of the soil. The
breakdown in structure consequently leads increase in clay content. Linear shrinkage
test can be performed for tropical red soils and it has been found to be more reliable
than Atterberg limits tests hence it has been successfully used in selecting materials
for road construction.
The Kenyan experience(Road Design Manual Part III-Materials and Pavement
Design)) andfrom various studies shows that the soil has the following index
characteristics:
i) Plastic limit=35%
ii) Liquid limit =75%
iii) Strength properties of the soil
Strength tests on red soils vary mainly with texture. The main tests include
penetration test, vane shear test and plate loading test. The difference in strength
illustrates the variation in the homogeneity of the soil profile and degree of

37
laterization. The strength therefore is a function of chemical composition, age and
homogenity. Iron rich soils are harder than alumina rich red soils. Homogeneous
profiles have less impurities hence stronger soils. Older laterites are stronger than
recently formed. The most important strength test is the California bearing ratio test
(CBR test) which expresses the strength of subgrades and base courses of pavements.
The CBR test was developed by the California division of highways as a method of
classifying soils for suitable use in highway construction especially for the
classification of base course as for the support of flexible pavements. CBR measures
the shearing resistance of the soil under controlled density and moisture conditions
because it has been found that certain soils are very sensitive to such variables as
slight changes in moulding moisture, compactive effort and soaking of the specimen.
The CBR is expressed as a percentage of the unit load required to force a piston into
the soil divided by the unit load required to force the same piston on the same depth
into a standard sample of compacted crushed stone.
2.3.3.6 Consolidation and permeability characteristics
Permeability and consolidation characteristics of tropical red soils in Kenya have
been studied by a few researchers using soil from certain areas as representative of
the entire country. In these areas, Kabete, Limuru, Sasumua the parent rock is mainly
of volcanic origin. Under normal conditions, clay minerals are expected to have high
compressibility and low permeability. The Kenyan red soils have low compressibility
and high permeability. The angle of shearing resistance is also usually high.
These phenomena can be due to the coarse grained nature of the soil (high
permeability) due to aggregated particles into clusters due to the presence of
hallosites with iron oxide coating. Due to this aggregation of particles in red clay
soils, there is less change in water content and volume changes in compression is less
hence the low compressibility (Das, 2010; Anitha et al., 2010).
2.4 Reseach developments in application of used lube oil for engineering
applications
A number of research developments have been carried out to assess the suitability of
used oil in stabilizing soils for engineering foundations and generally.
38
For instance Nazir Ashraf K(International Review of Civil Engineering;Nov2012,
Vol. 3 Issue 6, p487) studied the effect of using oil on some of geotechnical
properties of collapsible soil. The testing included basis properties of collapse
potential, Atterberg limits, compaction and direct shear tests on collapsible soil
stabilized with oil in the amount of 0%, 4%, 8%, and 12% by dry weight. The results
indicated decrease in collapse potential, Atterberg limits, maximum dry density,
optimum moisture content and frictional angle, while the cohesion of soil is
increased significantly. The overall shear strength was slightly increased as the oil
content increased for unsoaked soil and slightly decreased for soaked soil.
In 2012,Ijimdiya, T.S.a and Igboro, T. researched on the compressibility behaviour
of lateritic soil upon application of used oil.From the results of the study carried out,
it was observed that the presence of oil inthe lateritic soil led to reduced values of
UCS, void ratios and increased values of volume
compressibility, Mv, and coefficients of consolidation, cv. Where these
soils exist, they are not suitable for engineering purposes and will require some
remediation orstabilization processes in order to improve the bearing capacity of the
affected soil.
There is still more research in this area of study in a bid to find a lasting solution.
39
CHAPTER THREE
MATERIALS AND METHODOLOGY
3.1 An overview of the tests and test procedures
The research method used in this study was experimental. I, the researcher gathered
information through laboratory experiments and tabulation after obtaining the used
lube oil and black cotton soil and red coffee soil from Kakuma in Turkana and
Kwa-Vonza town in Kitui areas. The information that was gathered from the
analysis was analyzed to aid in making sound conclusions and inferences in
addressing the research objectives.
The study involved samples collection and laboratory tests. Each test was done
several times, varying the quantities of lube oil and average of results considered;
all based on a work schedule.
In this thesis, experimental design was employed and deduction derived purely
from the results obtained.
The research samples and data were collected in the following ways:
1) Visiting the site to collect black cotton soil and red coffee soil and visit to
petrol station to buy used lube oil and packing the same in polythene bags
and containers ready for laboratory testing.
2) Laboratory tests to ascertain the engineering properties of these soils under
investigation.
3) Laboratory tests on improved black cotton soil with waste lube oil.
Laboratory tests were conducted at the Jomo Kenyatta University of Agriculture
and Technology and at the Kenya Material Testing and Research Laboratories
according torelevant ASTM and BS standards.

40
The summary of tests carried out were:
1) Determination of used lube oil properties according to ASTM- D445-06,
namely:
i) Density
ii) Kinematic Viscosity
iii) Dynamic Viscosity
2) Determination of engineering properties of soil according to BS 1377-
1990, namely:
i) Moisture content,
ii) Atterberg limits, and
iii) Particle size distribution
iv) Compaction,
i) Permeability, and
v) California Bearing Ratio.
Detailed laboratory tests carried out and both lube oil and the soil were mixed in
percentages of 0%, 5%, 10%, 15% and 20% by weight.
3.2 Viscosity Test
The determination of viscosity of Used Lube-Oil was done using a Redwood Efflux
Viscometer (No.1) according to ASTM- D445-06. The apparatus is universal for
viscosity less than 2000seconds.
3.2.1 Preamble
Viscosity is the property of a fluid that determines its resistance to flow. It is the
property that retards flow so that when the force is applied to a fluid, the lowest
the viscosity, the greater the flow ability; in this sense viscosity is a „pure‟ measure
of consistency.
If the space between two parallel surfaces is filled with a liquid, and one of the
surfaces is moved parallel to the other, a force which resists movement is set up as

41
a result of the presence of the liquid. If the force of the resistance is denoted by F,
the area of the surface by A, the velocity of movement of one surface relative to the
other by υ, and the distance between the surfaces by d, then Fis found to be
proportional to Aυ/d. If a factor η, which is called the coefficient of viscosity, is
introduced into the relationship, then the following equation can be written:
F=η.Aυ/d
At given temperature, ηhas a constant value for any one liquid, but generally it is
different for different liquids.
In this test , I have measured the time in seconds for a fixed quantity of the used
lube-oil (50ml) to flow from a cup through a standard orifice standardized at 10mm
under an initial standard head and at a known test temperature of 50degrees
Celsius.
3.2.2 Apparatus
i) Red Wood Viscometer (No. 1).
ii) Oil cup-holds the test sample of lube oil,
iii) Water bath-surrounds the oil cup for adjusting the temperature,
iv) Stop watch,
v) Measuring flask,
vi) Funnel,
vii) Thermometers, and
viii) Filter Paper.
3.2.3 Procedure
i. Selected the viscometer
ii. Cleaned the viscometer cup properly with the help of suitable solvent like
CCL4, ether, petroleum, spirit or benzene and dry it to remove any traces of
solvent,

42
iii. Leveled the viscometer with the help of leveling screws,
iv. Filled the outer bath with water for determining the viscosity at 500C and
below,
v. Placed the ball valve on the jet to close it and pour the test oil into the cup up
to the tip of indicator,
vi. Placed clean dry measuring flask immediately below and directly in line with
discharging jet,
vii. Inserted a clean thermometer and a stirrer in the cup and cover it with a lid,
viii. Heated the water filled in the bath slowly with constant stirring. When the oil
in the cup attains a desired temperature, stop the heating,
ix. Lifted the ball valve and start the stop watch. Oil from the jet flows into the
flask,
x. Stopped the stop watch when the lower meniscus of the oil reached the
50millilitre mark on the neck of receiving flask,
xi. Recorded the time taken for 50millilitres of the oil to collect in the flask,
xii. Repeated the experiment to get more readings.
Precaution
(i) The oil was filtered thoroughly with a muslin cloth to remove solid particles
that could clog the jet,
(ii) The receiving flask was placed in such a manner that the oil stream from the
jet struck the neck of receiving flask and did not cause any foaming,
(iii) After each reading the oil was completely drained out of receiving flask.
3.2.4 Observation
Viscosity was recorded as Red Wood seconds. The conversion constants for Red
Wood time units were:
Constant A=0.26

43
Constant B=172
Kinematic viscosity υ=A .t –B/t (c-st or mm2/s)
Dynamic viscosity from kinematic viscosity is obtained by:
η = υ .ρ.10-3
where;
η= dynamic viscosity, mPa.s
υ= kinematic viscosity, mm2/s
ρ= density, kg/m3at the same temperature used for the determination of the
kinematic viscosity.
Mass of Lube Oil in 50ml Beaker = Mass with Oil – Mass When Empty
Volume=50Ml= 0.00005m3
And, Density ρ=Mass/Volume
Therefore, Dynamic Viscosity, η = υ .ρ.10-3
3.3 Determination of Particle Size Distribution
This was aimed at determining the size of particles of which the soil consisted of
the mass percent of the grain at selected boundaries. The grain size distribution was
determined by sieving the sample and by further hydrometer test according to
BS1377:1990 Part 2:9.
3.4 Atterberg Limits
If the water content of a thick soil-water mixture is gradually reduced, the mixture
passes from a liquid state to a plastic state, then to a semi-solid state and finally to a
solid state.
The water contents corresponding to the transition from one state to another are
called Atterberg limits or consistency limits.
44
These limits (the liquid limit and plastic limit) are determined by arbitrary but
standardized tests as represented by BS1377:1990 Part 2:4 & 2:5.
Note: The difference between the liquid limit and plastic limit is the plasticity
index.
3.4.3 Linear shrinkage
This is a measure of one –dimensional shrinkage.
Apparatus: brass moulds, silicone grease or petroleum jelly, distilled water, two
palette knives, a flat glass (plastic) plate, drying oven and vernier calipers.
Procedure
The inner walls of the mould were cleaned and internal length measured accurately.
A thin film of silicone grease was applied to the inner walls to prevent any soil
adhering on the sides. The proportion of soil passing 2.00mm sieve was
determined. An air-dry soil was passed through 425µm sieve and this material
passing used to prepare a soil paste on the glass plate. The consistency of the soil
paste was at approximately that of the liquid limit.
The soil paste was placed in the mould taking care not to include any air pockets
and leveled on top. The specimen was allowed to dry in the air first until it
detached itself from the walls of the mould. It was then transferred into the drying
oven and dried at 105+
- 5 for about 12 hours.
The mould was then removed from the oven and allowed to cool. The mean length
of the soil bar was then measured and recorded. If the specimen cracked badly or
broke such that the measurements were difficult, the test was repeated. The results
were tabulated in the standard tables as attached.
3.5 Compaction Test
This test is done to determine the maximum dry density (MDD) and optimum
moisture content (OMC) of the material. It was done on the soil sample and then

45
various percentages of Used Lube Oil was added on the black cotton soil and MDD
and OMC determined.
3.5.1 Standard Proctor Test
To obtain the moisture content at which the dry density is maximum when the soil
is compacted in standard manner. This is a dynamic method of compaction by
repeated application of dead load according to BS1377:1990 Part 4:4.
3.6 Permeability Tests
This test is described in detail in BS 1377(1990).
3.7 California Bearing Ratio (CBR) Test
The dynamic CBR test was carried out according to BS1377:1990 Part 4:7. A
sample passing through 20mm was used; moisture content of sample determined
and then stored for 24hrs in a sealed place before compaction. This test was done
on the sample with various percentages of used lube oil.
3.7.1 Equipment
BS sieve 20mm
CBR mould (internal diameter of 152mm and internal effective height of 127mm)
with detachable base plate and top plate and a collar 50mm deep
Cylindrical plunger of hardened steel and cross sectional area 1935mm2
approximately 250mm long
Machine for applying force to plunger
Three steel basins
Means of measuring penetration of plunger into the specimen
Three annular surcharge discs each having a mass of 2kg, internal diameter of
14.5mm to 150mm
Metal rammer 4.5kg with a weight of fall being 450mm
46
Steel straight edge (dimensions 300mm*25mm*3mm)
Spatula (blade of approximately 100mm*20mm dimensions)
Means of measuring movement of top of specimen during soaking
Weighing balance accurate 5g
Moisture tins
Filter papers 150mm in diameter
3.7.2 Moulding
Moulding was done for three points i.e. 100%-62blows, 95%-25 blows, and 90% -
10blows.
The mould was cleaned and weighed, then assembled on base plate and the collar
fitted on it.
Required amount of water was mixed with the sample portion thoroughly
5 layers were compacted, each layer compacted with 62 blows such that the fifth
layer will end immediately at the brim of the mould
The collar was removed carefully and excess material trimmed to flush with the top
of the mould using steel straight edge
The mould with base plate after removing any external material stuck on mould
and base plate using a brush was weighed
The moulding procedure was repeated for the 95% and 90% moulding points.
3.7.2.1Submersion/soaking
Soaking was done to determine the materials rate of absorption of water and degree
of swell
The perforated mould with surcharge weights was soaked for 4 days and then
removed from water and after removing surcharge weights the moulds was drained
for 15mins before CBR penetrations

47
3.7.3 CBR Penetration
(i) Each mould was placed on CBR machine with plate in position
(ii) Surcharge masses to be placed on the specimen and machine set such that the
plunger was set on the specimen.
(iii) Readings gauges were set and adjusted to prevent zero errors
(iv) When the machine was switched and for bearing ratio above 30% the plunger
was made to penetrate the specimen at a uniform rate of 1mm/min (at a
plunger force of 250N) the readings of force were taken at intervals of
penetration of 0.5m a to a total penetration not exceeding 7.5m
(v) Penetration on the mould was done for both top and bottom and readings
taken as before. This is to be done for the three point moulds
(vi) A graph showing force on the plunger against penetration was plotted and a
smooth curve drawn through the points
(vii) The force read from the smooth curve required to cause a given penetration
expressed as a percentage of force required to cause the same penetration on
standard curve is defined as the CBR value of the penetration
(viii)The CBR value was calculated at penetrations of 2.5 and 5.0mm and the
higher value taken. A graph was drawn for penetrations against dry densities
in mould
(ix) After penetrations the mould were removed and wet soil from the 100% - 62
blow moulds oven dried and graded to determine the particle distribution as
influenced by compaction.

48
CHAPTER 4
RESULTS AND DISCUSSION
4.1 Viscosity Test Results
Properties of unused and used lube oil are based on the three tests which are:
1) Density,
2) Kinematic Viscosity, and
3) Dynamic.
The density of used lube oil obtained was 800kg/m3 while that of unused lube oil
was 872kg/m3 (Bejan, 2004). The results of kinematic viscosity and dynamic
viscosity are shown in Table 4.1 and were determined at the test temperature of
50°C. Also, the dynamic viscosity is derived from the kinematic viscosity and
modified by certain constants.
Table 4.1 Dynamic Viscosity Results
Test Run Red Wood
Seconds
Kinematic
Viscosity
(mm2/s)
Dynamic
Viscosity
(mPa.s)
1 268 69 55.2
2 262 67.5 54
3 264 68 54.4
Average viscosity 68.17 55
The average kinematic viscosity of the used lube oil, obtained after three
consecutive tests at 50°C, was 68 mm
2/s. Similarly, the average dynamic viscosity
was 55 mPa.s.

49
4.2 Test Results on Soils
The results attained of the stabilized black cotton soil and red coffee soils were
compared with data available from both virgin soils tests.
4.2.1 Moisture Content
This test was done to establish the field moisture content of soil samples. The soils
were the black cotton soil and the red coffee soil. The approximate field moisture
content for the black cotton soil, for example, was 60% as shown in Table 4.2.
Table 4.2 Field Moisture Content
A(Wet+Tin) B(Dry+Tin) C(Tin wt) (A-B) (B-C) (A-B)/(B-C)%
68.2 54.8 31 13.4 23.8 56.30252
69.2 54.8 30 14.4 24.8 58.06452
73.2 56.4 28.6 16.8 27.8 60.43165
77.4 61 34.6 16.4 26.4 62.12121
Average Moisture Content 60

50
4.2.2 Particle size distribution
This was done according to BS1377 part 2 (1990) in order to determine the
percentage particle size distribution of a given sample of the soil. Dry sieve analysis
was done. The results obtained for the black cotton soil were tabulated and presented
in a typical graph illustrated in fig. 4.1.
Figure 4.1 Typical grading curve for neat black cotton soil.
Similarly, the results of the red coffee soil are presented as Figure 4.2.
Figure 4.2 Typical grading curve for neat red coffee soil
Both soils were classified as silty CLAY.

51
4.3.3 Atterberg Limits
4.3.3.1 Liquid limit
The liquid limit of the samples was determined using cone penetrometer method.
The data was recorded and presented as Figures 4.2 and 4.3 for the black cotton soil
and red coffee soil respectively.
Figure 4.3 Liquid limit for neat black cotton soil
4.3.3.2 Plastic limit
This is the moisture content at which the soil becomes dry to be plastic. The test was
carried on a disturbed soil sample dried at room temperature and the gravel passed
through 0.425mm sieve.
Table 4.3 plastic limit test- black cotton soil
A
(Wet+Tin)
B
(Dry+Tin)
C (Tin wt) (A-B) (B-C) (A-B)/(B-C)%
35.4 34.4 30.8 1 3.6 27.78
37 35.8 31.8 1.2 4 30
A V E R A G E Plastic Limit 29
4.3.3.3 Plasticity index
Plasticity index is calculated from the equation,

52
Plasticity index (PI)
PI = LL – PL = 60-29 =31%
4.3.3.4 Linear shrinkage
It was calculated from the equation:
Half of P.I. = 31/2 = 15.5%
or Linear Shrinkage = (1 – Ld/Lo)×100%
LS = (20mm/140) ×100=14.3%
Where:
Lo – length of sample before oven drying=length of shrinkage mould
Ld– length of sample after oven drying.
4.3.3.5 Statistical Evaluation of Results
Table 4.4 Typical Comparison of Properties of Virgin and Treated black cotton
soil
Properties of neat Soil at
0%
Properties of improved soil at
10%
Percentage Change at
10%
LL = 60%
PL = 29%
PI = 31%
LS = 14.3%
MDD=1255Kg/
m3
OMC=26.5%
CBR= 1
LL = 44%
PL = 22%
PI = 22%
LS = 11%
MDD=1655Kg/m3
OMC=13.8%
CBR= 8
LL =26%
PL =25%
PI =29%
LS =23%
MDD=32%
OMC=48%
CBR= 700%
Observation:

53
The following is mathematically correct for all but CBR:-
Arithmetic Mean =30.5% That is; A=1/6[26+25+29+23+32+48]
Harmonic Mean = 29% That is;
1/H =1/6[1/26+1/25+1/29+1/23+1/32+1/48]
Standard Deviation=2.28 That is; S.D. = σ =
From the Atterberg Limits, it is possible to determine KARL PEARSON‟S
COEFFICIENT OF CORRELATION between neat soil and 10% treated soil :-
Where r between two variables x and y are defined by the relation,
r = where X= -x, Y= -y that is, X and Y are the deviations
measured from their respective means.
Table 4.5: Mean of Atterbergs: at 0% = 33.6x, at 10% = 30.5y
x y X=x-33.6 Y=y-30.5 X2 Y
2 XY
60
29
31
14.3
44
22
22
11
26.4
-4.6
-2.6
-19.3
13.5
-8.5
-8.5
-19.5
696.96
21.16
6.76
372.49
182.25
72.25
72.25
380.25
356.4
39.1
22.1
376.35
134.3 99 -0.1 -23 1,097.37 707 793.95
Here ∑X2
= 1,097, ∑X2
=707, ∑XY = 793.95
r = = = = 0.9 perfectcorrelation!
Therefore, r = 0.9 confirms a very high (perfect) correlation between change of soil
parameters upon application of used lube oil at 10% replacement (Dass & Rajnish,
2014).

54
Table 4.7 Typical Comparison of Properties of Virgin and Treated Red Coffee
Soil
Properties of neat Soil at
0%
Properties of improved soil at
10%
Percentage Change at
10%
LL = 60%
PL = 29%
PI = 31%
LS = 14.3%
MDD=1255Kg/
m3
OMC=26.5%
CBR= 1
LL = 44%
PL = 22%
PI = 22%
LS = 11%
MDD=1655Kg/m3
OMC=13.8%
CBR= 8
LL =26%
PL =25%
PI =29%
LS =23%
MDD=32%
OMC=48%
CBR= 700%
Observation:
The following is mathematically correct for all but CBR:-
Arithmetic Mean =30.5% That is; A=1/6[26+25+29+23+32+48]
Harmonic Mean = 29% That is; 1/H
=1/6[1/26+1/25+1/29+1/23+1/32+1/48]
Standard Deviation=2.28 That is; S.D. = σ =
From the Atterberg Limits it is possible to determine KARL PEARSON‟S
COEFFICIENT OF CORRELATION between neat soil and 10% treated soil :-
Where r between two variables x and y is defined by the relation,
r = where X= -x, Y= -y that is, X and Y are the deviations
measured from their respective means.
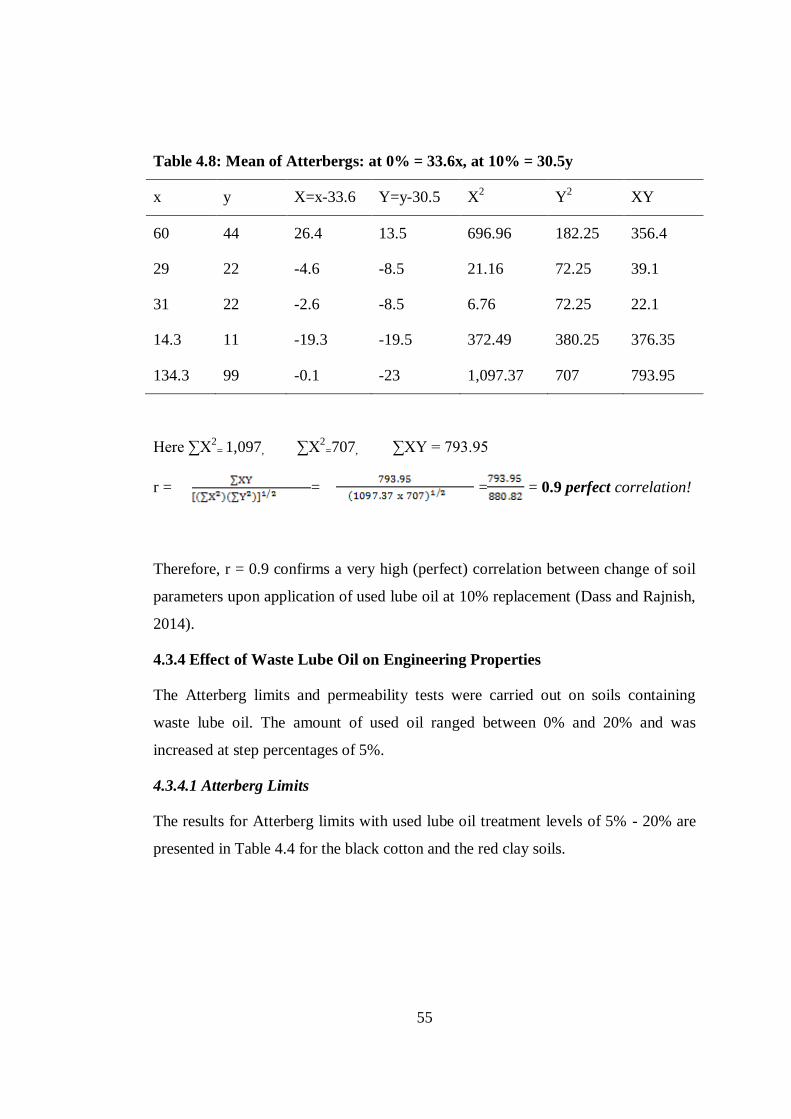
55
Table 4.8: Mean of Atterbergs: at 0% = 33.6x, at 10% = 30.5y
x y X=x-33.6 Y=y-30.5 X2 Y
2 XY
60
29
31
14.3
44
22
22
11
26.4
-4.6
-2.6
-19.3
13.5
-8.5
-8.5
-19.5
696.96
21.16
6.76
372.49
182.25
72.25
72.25
380.25
356.4
39.1
22.1
376.35
134.3 99 -0.1 -23 1,097.37 707 793.95
Here ∑X2
= 1,097, ∑X2
=707, ∑XY = 793.95
r = = = = 0.9 perfect correlation!
Therefore, r = 0.9 confirms a very high (perfect) correlation between change of soil
parameters upon application of used lube oil at 10% replacement (Dass and Rajnish,
2014).
4.3.4 Effect of Waste Lube Oil on Engineering Properties
The Atterberg limits and permeability tests were carried out on soils containing
waste lube oil. The amount of used oil ranged between 0% and 20% and was
increased at step percentages of 5%.
4.3.4.1 Atterberg Limits
The results for Atterberg limits with used lube oil treatment levels of 5% - 20% are
presented in Table 4.4 for the black cotton and the red clay soils.

56
Table 4.10 Effect of used lube oil on Atterberg Limits for BC
Used Lube
Oil (%)
Liquid Limit
(%)
Plastic Limit
(%)
Plasticity Index
(%)
Linear
Shrinkage
(%)
Black Cotton Soil
0 60 29 31 14
5 82 41 41 21
10 44 22 22 11
15 83 39 44 21
20 74 27 47 24
Red Coffee Soil
0 66 26 30 15
5 54 26 28 14
10 51 29 22 11
15 39 21 18 9
20 43 26 17 8
The liquid limit, plastic limit and linear shrinkage exhibit variations with increase in
used lube oil contents.
From the table of results for the black cotton soil liquid limit reduces to a minimum
at 10% used lube oil application and so does plastic limit giving a minimum
plasticity index overall, suggesting that at this percentage the soil is less plastic and
so is linear shrinkage suggesting the minimum amount of used lube oil at which no
further volumetric changes take place in the soil. The soil is thus medium plastic
(15-30) at 10% used lube oil replacement.
From the table of results for red coffee soil the liquid limit reduces to a minimum
between 10% and 15% and so does plastic limit. Despite a minimum plasticity index
and linear shrinkage being a minimum at 20% the differences are minimal and the
characteristics substantially correlate with those of the black cotton soil.The soil is
thus medium plastic (15-30)at 10% used lube oil replacement.
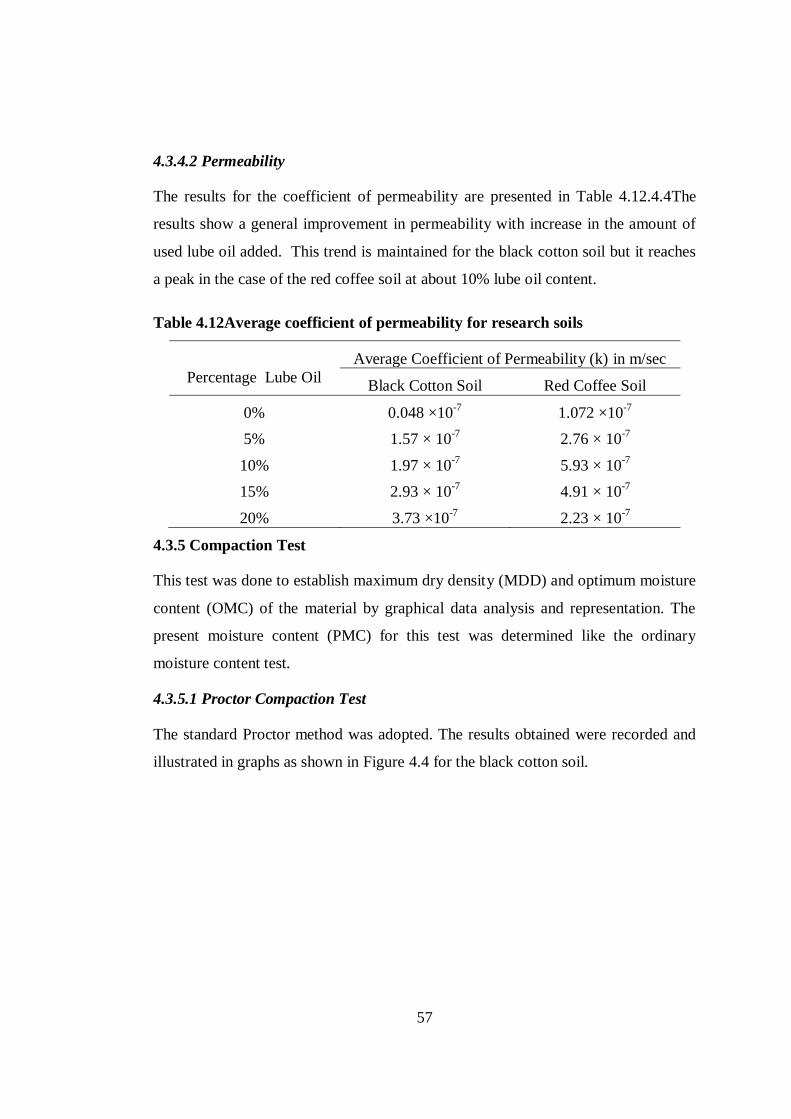
57
4.3.4.2 Permeability
The results for the coefficient of permeability are presented in Table 4.12.4.4The
results show a general improvement in permeability with increase in the amount of
used lube oil added. This trend is maintained for the black cotton soil but it reaches
a peak in the case of the red coffee soil at about 10% lube oil content.
Table 4.12Average coefficient of permeability for research soils
Percentage Lube Oil
Average Coefficient of Permeability (k) in m/sec
Black Cotton Soil Red Coffee Soil
0% 0.048 ×10⁻⁷
1.072 ×10⁻⁷
5% 1.57 × 10⁻⁷
2.76 × 10⁻⁷
10% 1.97 × 10⁻⁷
5.93 × 10⁻⁷
15% 2.93 × 10⁻⁷
4.91 × 10⁻⁷
20% 3.73 ×10⁻⁷
2.23 × 10⁻⁷
4.3.5 Compaction Test
This test was done to establish maximum dry density (MDD) and optimum moisture
content (OMC) of the material by graphical data analysis and representation. The
present moisture content (PMC) for this test was determined like the ordinary
moisture content test.
4.3.5.1 Proctor Compaction Test
The standard Proctor method was adopted. The results obtained were recorded and
illustrated in graphs as shown in Figure 4.4 for the black cotton soil.
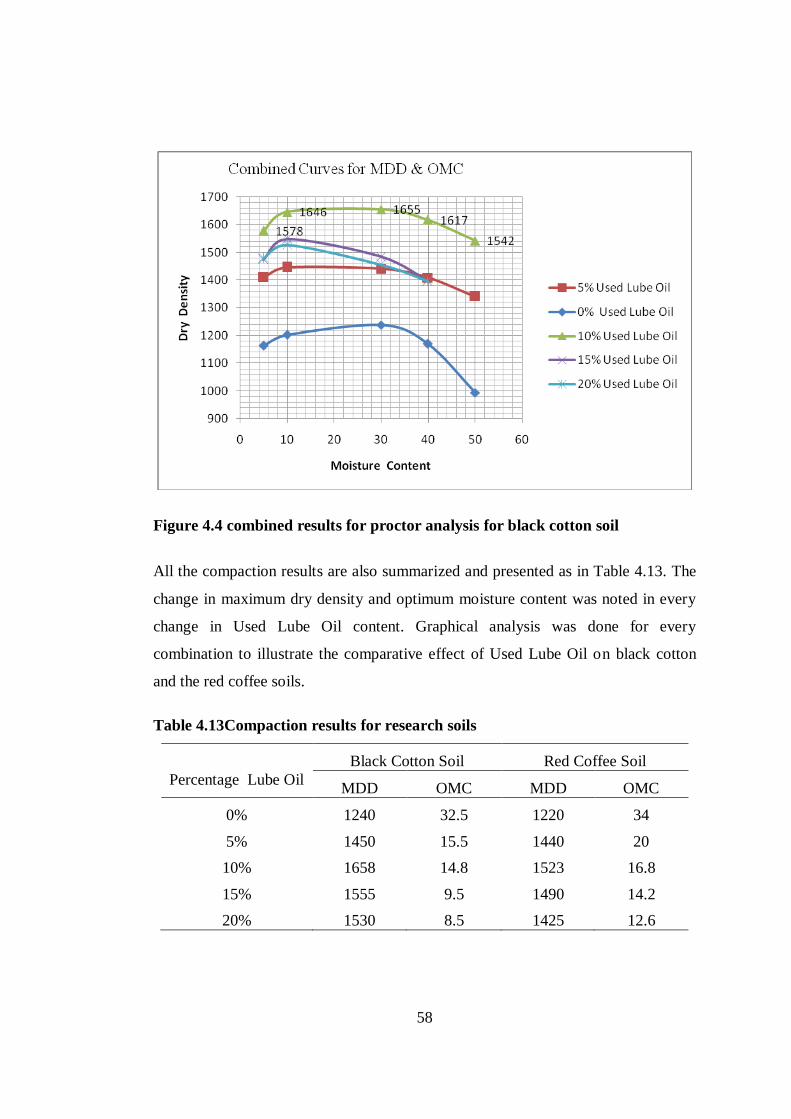
58
Figure 4.4 combined results for proctor analysis for black cotton soil
All the compaction results are also summarized and presented as in Table 4.13. The
change in maximum dry density and optimum moisture content was noted in every
change in Used Lube Oil content. Graphical analysis was done for every
combination to illustrate the comparative effect of Used Lube Oil on black cotton
and the red coffee soils.
Table 4.13Compaction results for research soils
Percentage Lube Oil
Black Cotton Soil Red Coffee Soil
MDD OMC MDD OMC
0% 1240 32.5 1220 34
5% 1450 15.5 1440 20
10% 1658 14.8 1523 16.8
15% 1555 9.5 1490 14.2
20% 1530 8.5 1425 12.6

59
The result shows the variation of OMC and MDD with increasing contents of Used
Lube Oil. The results for both the black cotton soil and the red coffee soil show that
the MDD increased with lube oil content whereas the OMC dropped.
The variation is attributed to the replacement of soil by Used Lube Oil in the
mixture which has relatively different physical properties compared to that of the
virgin soil.
It may also be attributed to the coating of the soil by the Used Lube Oil which
results to large particles with larger voids and hence variation in density.
However, the MDD reached a peak value at about 10% of used lube oil content and
then dropped as the OMC continued to fall. The MDD reduces because of the
dispersion caused by the increased used lube oil. Figure 4.5 illustrates the variation
in MDD with used lube oil content for the black cotton soil.
Figure 4.5 variation of maximum dry density with Used Lube Oil
The OMC varies within a certain range as shown in Figure 4.5. This trend may be
attributed to the addition of Used Lube Oil which alters the quantity of free silt and
clay fraction and forming coarser materials with larger surface areas (these processes
need water to take place).
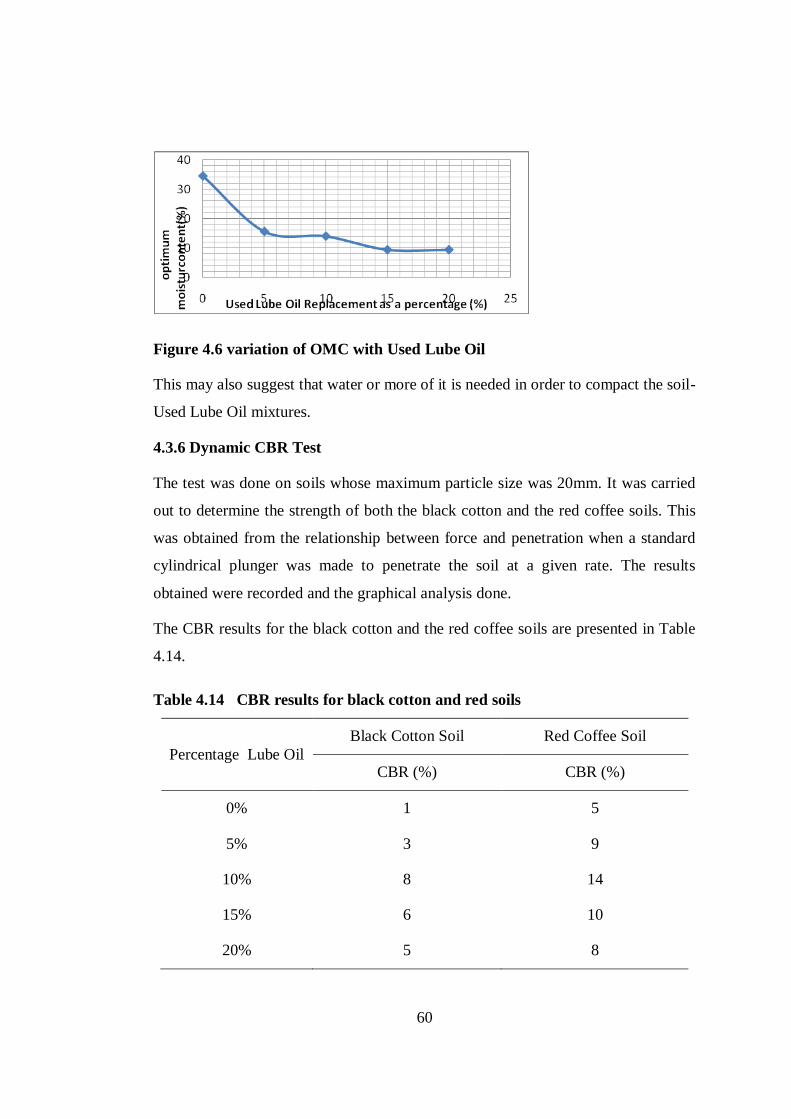
60
Figure 4.6 variation of OMC with Used Lube Oil
This may also suggest that water or more of it is needed in order to compact the soil-
Used Lube Oil mixtures.
4.3.6 Dynamic CBR Test
The test was done on soils whose maximum particle size was 20mm. It was carried
out to determine the strength of both the black cotton and the red coffee soils. This
was obtained from the relationship between force and penetration when a standard
cylindrical plunger was made to penetrate the soil at a given rate. The results
obtained were recorded and the graphical analysis done.
The CBR results for the black cotton and the red coffee soils are presented in Table
4.14.
Table 4.14 CBR results for black cotton and red soils
Percentage Lube Oil
Black Cotton Soil Red Coffee Soil
CBR (%) CBR (%)
0% 1 5
5% 3 9
10% 8 14
15% 6 10
20% 5 8

61
The results show that the CBR value of the black cotton soil varies with content of
used lube oil. For the black cotton soil, this increases up to a value of 8 at 10% used
lube oil replacement as illustrated in Figure 4.14. The reason for variation in CBR
may be because of the gradual formation of bond in the soil by Used Lube Oil.
Figure 4.7 Variation of CBR for black cotton with used lube oil

62

63

64
CHAPTER FIVE
CONCLUSIONS AND RECOMMENDATIONS
5.1 Conclusions
The chapter presents the conclusions that were drawn from the study and
recommendations for further research.
5.1.1 Oil Viscosity
The dynamic viscosity and density of the used lube oil was determined at 50°Cto be
55mPa.s. and 800 kg/m3respectively.
5.1.2 Soil Properties
From the table of results for the black cotton soil liquid limit reduces to a minimum
at 10% used lube oil application and so does plastic limit giving a minimum
plasticity index overall, suggesting that at this percentage the soil is less plastic and
so is linear shrinkage suggesting the minimum amount of used lube oil at which no
further volumetric changes take place in the soil. The soil is thus medium plastic
(15-30) at 10% used lube oil replacement.
From the table of results for red coffee soil the liquid limit reduces to a minimum
between 10% and 15% and so does plastic limit. Despite a minimum plasticity index
and linear shrinkage being a minimum at 20% the differences are minimal and the
characteristics substantially correlate with those of the black cotton soil.The soil is
thus medium plastic (15-30)at 10% used lube oil replacement.
The liquid and plastic limits decreased with increase in used lube oil content up to
10%. As the percentage of used lube oil increased, the liquid limit and plasticity
index increased while the plastic limit decreased and thus the oil is thought to cause
an inter-layer expansion within the clay minerals, which may have accounted for the
change in its plasticity and hence affecting the workability of the soil.

65
Used oil treatment gives enhanced consistency results compared with the standard
results where Liquid Limit is 75 and Plastic Limit 35.
The maximum dry density (MDDfor black cotton soil and red coffee soil increased
up to 1658 kg/m3and 1523 kg/m
3 respectively at 10% used lube oil content.
However, the OMC decreased with increased used lube oil content, so that OMC for
the black cotton and red coffee soils were 14.8% and 16.8% respectively at 10%
lube oil content.
Used lube oil gives enhanced results compared with the standard of 1560kg/m3 at
20.10% OMC
The CBR results showed that the CBR value of black cotton soil increased from 1%
to 8% with increased used lube oil content of 10%. For the red coffee soil, the CBR
value increased to 14% for the same percentage replacement with used lube oil. This
was due to the improved properties that caused improvement of the load bearing
capacity of both soils.
Thus used lube oil treatment results in improved CBR as compared to the standard
which is 3%.
The optimal values of the soils for Atterberg limits, compaction tests, California
bearing ratio tests and permeability tests were obtained at the used lube oil content
of 10%. For pure bitumen, this is usually at 4% content.
The permeability(k) of both black cotton soil and red coffee soil increased with the
addition of used lube oil. At 10% used lube content k was 1.97x10⁻⁷
m/sec and
5.93x10⁻⁷
m/sec for black cotton and red coffee soils respectively.The standard
permeability is 10-7
m/sec and therefore used lube oil treatment makes the soils more
impermeable and hence restricts water ingress.
Karl Pearson‟s statistical coefficient of correlation r = 0.9 confirms a very high
(perfect)correlation between change of soil parameters upon application of used

66
lube oil at 10% replacement and so would the red coffee soil from the tabulated test
results.
5.2 Recommendations
i. Foundations on black cotton and red coffee soils with enhanced stabilization
based on extensive studies can be safe.
ii. Collaborative research work on diverse soil samples should be done to augment
and corroborate the findings in this research.
iii. It is recommended that these findings be implemented as trial in selected roads

67

68
REFERENCES
Aparna, P. K. J. and Kumar, R. (2014). Study of swelling behaviour of black cotton
soil improved with sand column International Journal of Advances in
Engineering & Technology,7(3), 905-910.
Anitha, K. R., Ashalatha, A.and Johnson, A. S. (2009). Effect of RBI Grade 81 on
Different Types of Sub grade Soil, 10th National Conference on
Technological Trends (NCTT 09) 6 – 7, 165-170.
Braja, M. D. (2012). Principles of foundation engineering: Soil improvement and
ground modification, (7th
ed.). 722-732.
British standard institution, (1990). Method of test for soils for civil engineering
purposes. Britain: British standard institution.
British standard institution, (1990). Method of test for soils for civil engineering
purposes Part 2. Classification tests. BS 1377(2). Britain: British standard
institution.
Brooks, R. M. (2009) Soil stabilization with Flyash and Rice Husk Ash,
International Journal of Research and Reviews in Applied Sciences, 1(3).
BS 1377: part 1-5, (1990), Part 1. General requirements and sample preparation.
part 1-5. Britain: British standard institution.
BS 1377: part 4, (1990), Part 4 .compaction related tests. Britain: British standard
institution.
Das, B. M. (2009). Advanced Soil Mechanics. New York: Taylor and Francis, 123.
Das, B.M. (2002). Principles of Geotechnical Engineering, (5th ed.). California:
University, Sacramento.
Das, B. M. (2010). Principles of geotechnical engineering, (7th ed.). Australia:
Cengage Learning.
Bell, F. G.(2009). Engineering Treatment of Soil, (3rd
ed.) London : MCGrawhill

69
Dass, H. K., and Rajnish V., (2014). Higher Engineering Mathematics: Correlation
and Regression, (4th ed.), New Delhi: S.CHAND and Co.
Ijimdiya, T. S. (2011). Effect of oil contamination on particle size distribution and
plasticity Characteristics of Lateritic Soil, Advanced Materials Research,
367, 19-25.
Ijimdiya, T.S. and Igboro, T. (2012), Effect of used oil on the strength and
compressibility behavior of lateritic soil, EJGE, 17, 3653-3662.
Ikizler, S. B., Aytekin, M. and Vekli, M. (2009). Reductions in swelling pressure of
expansive soil stabilized using EPS geofoam and sand. Geosynthetics
International, 16(3), 216–221.
Lambe, T. W. and Whitnam, R. V. (2013). Soil Permeability and Filter
Requirements, New York: John Willey and Sons.
Little, D. and Nair, S. (2008). Background for Development of Standard Practice for
Modification and stabilization of Subgrade Soils and base Courses. Texas:
NCHRP, 20-27.
Liv, J., Shi, B., Jiang, H., Huang, H., Wang, G. and Kamai, T. (2011). Research on
the stabilization Treatment of clay slope top soil by organic polymer Soil
Stabilizer. Engineering Geology, 117(1 – 2), 114 - 120
NegiA.S. and Anand, S. C. (2013). Physical Chemistry (2nd
ed.). Viscosity, New
Delhi: New Age International.
NEMA, (2003). State of Environment Report, Republic of Kenya, Nairobi:
Government Printers.
NEMA, (2004). State of Environment Report, Republic of Kenya, Nairobi:
Government Printers.

70
Osinubi, K.J. and Ijimdiya, T.S. (2009). Effect of Compactive Efforts on the
Plasticity and Strength Properties of Reconstituted laterite. Nigerian Society
of Engineers, Transactions. 44(4), 1 – 14.
Puri, S. (2012).Soil Chemistry, Soil Contamination , Jaipur New Delhi: Oxford
Book Company.
Ranjan, G. and Rao, A.S.R. (2005), Basic and applied soil mechanics, New Delhi:
New Age International.
Raymond, C. (2010). Chemistry: Fractional Distillation , (9th ed.). New York: Tata
MC Graw Hill Education Private Ltd
Road design manual part 3 “standard specification for road and bridge construction”
Sharma, R. S. and Phanikumar, B. R. (2005). Laboratory study of heave behaviour
of expansive clay reinforced with geopiles. Journal of Geotechnical and
Geoenvironmental Engineering, 131 (4), 512–520
Shelke, A.P. and Murthy, D.S. (2010). Reduction of Swelling Pressure of Expansive
Soils Using EPS Geofoam. New Delhi: Indian Geotechnical Conference.
Singh, A.(2012). Modern Geotechnical Engineering, Soil Improvement Techniques
(5th ed.). New Delhi: CBS Publishers
Sridharan, A. and Gurtug, Y. (2004). Swelling behavior of compacted ûne-grained
soils. Engineering Geology 72(1-2), 9-18
TDT, (2005). Guidelines for modification and stabilization of soils and base for use
in pavement structures. Retrieved from ftp://ftp.dot.state.tx.us/pub/txdot-
info/cmd/tech/stabilization.pdf.
Technical university of Cluj-Napoca ( 2002). Leonardo Electronic Journal of
Practices and Technologies. 11,117-58

71
Texas Department of Transportation, (2005). Guidelines for modification and
Stabilization of Soils and base for Use in Pavement Structures. Texas: Texas
Department of Transportation.
Unified Facilities Criteria (3-250-11), (2004). Soil Stabilization for Pavements,
USA: US, Army, Naval and Air Force.
Venkatramalah, C. (2010). Geotechnical Engineering. (3rd
ed.). Tirupati, India: New
age International publishers.

72
APPENDICES
APPENDIX 1 - VISCOSITY TEST
Red Wood Efflux Viscometer Test (ISO 9000) ASTM- D445-06)
Viscosity Test: Red Wood Viscometer No. 1-Universal (for less than 2000seconds)
The conversion constants for Red Wood time units are;
Constant A=0.26
Constant B=172
Kinematic Viscosity υ=A .t –B/t (c-st or mm2/s)
Dynamic Viscosity from Kinematic Viscosity is obtained by:
η = υ .ρ.10-3
where:
η= dynamic viscosity,mPa.s
υ= kinematic viscosity,mm2/s
ρ= density, kg/m3at the same temperature (50
0C) used for the determination of
the kinematic viscosity.
Viscosity is recorded as Red Wood seconds.
Computation:
Mass of lube oil in 50ml beaker = mass with oil – mass when empty=75grammes-
35grammes=40grammes = 0.04kg
Volume=50ml= 0.00005m3
Therefore Density=Mass/Volume = 0.04/0.00005 = 800kg/m3
And Dynamic Viscosity is given by: η = υ .800.10-3

73
Table 1-1 Dynamic Viscosity Results
Test Run Red Wood
Seconds
Kinematic
Viscosity
(mm2/s)
Dynamic
Viscosity
(mPa.s)
1 268 69 55.2
2 262 67.5 54
3 264 68 54.4
Average viscosity 68.17 55

74
APPENDIX 2 - PARTICLE SIZE DISTRIBUTION
A) BLACK COTTON SOIL
Appendix 1 Dry Sieve Analysis: weight of total <5mm material
Table 2-1 Dry Sieve Analysis: weight of total <5mm material
BS Sieve mm Wt. retained
gms
% of total<5
retained
% of total<5
passing
≈% of total<5
passing
5
2 11.8 2.4 97.6 98
1 17.8 3.6 94.0 94.0
600µ 23.6 4.7 89.3 89.0
425 µ 16.2 3.2 86.1 86.0
300 20.0 4.0 82.1 82
212 µ 18.2 3.6 78.5 79
150 µ 15.3 3.0 75.5 76
75 µ 21.0 4.2 71.3 71
<75 µ 356.2 71.3 - -
Total 5mm material 100%
Wt of <5mm material taken=500.0gms
Total wt of >75 µ = 143.8gms
Wt of materials <75 µ = 356.2 gms
Figure 2-1 Dry Sieve Analysis

75
PERMEABILITY /HYDROMETER TESTS FOR BLACK COTTON SOIL
(0%,5%,10%,15% & 20%)
Table 2-2
NEAT BLACK COTTON SOIL(0% USED LUBE OIL REPLACEMENT)
DEPTH
LAB. NO.
MINISTRY OF PUBLIC WORKS
MATERIALS DEPARTMENT-FOUNDATION SECTION
SIGN.
CROSS SECTION OF SPECIMEN A cm2
HEIGHT OF SPECIMEN h cm
CROSS SECTION OF PLASTIC TUBE acm2
HEIGHT OF MERCURY COLUMN H cm
MOVEMENT OF MERCURY COLUMN l cm
TIME FOR THE MOVEMENT t sec
MOISTURE CONTENT
No._____ No. __
ww____D
T___
Ww__
DT__
DW__
TW___
DW_
TW___
DW_
WS__
DW__
WS__
WO
_______
WO
_______
AVE W =
CONSTANT HEAD
COEFFICIENT OF PERMEABILITY BULK DNSITY SPECIMEN Ϫ= kN/m3
=0.079 ah1 cm/sec DRY DENSITY SPECIMEN yd= kN/m3
AtH
Cv= 0.079
ϪHg – yw
CELL
PRESURE
63
Kg/cm2
EVER
AGE
PORE
udv
Kg/cm2
CONSOLIDA
TION
PRESSURE
6c
Kg/cm2
BURETT
E
READIN
G
Cm3
EXPELLE
D PORE
WATER
Cm3
HEAD
H
cm
MOV
EME
NT
OF
HG
L
cm
TIM
E
t
sec
PER
MIA
BILI
TY
K
Cm/s
ec

76
1 0 84 104 0
83 101 300
82 100 60
81 100 120
80 100 180
80 100 240 0.04
8X1
0-7
3 2 84 104 0
83 300
83 60
82 120
82 180
81 101 240 0.04
8X1
0-7
5 4 84 104 0
83 300
82 60
81 120
81 180
80 100 240 0.04
8X1
0-7
0.048X10⁻⁷

77
Table 2-3
BLACK COTTON SOIL AT 5% LUBE OIL REPLACEMENT
DEPTH
LAB. NO.
MINISTRY OF PUBLIC WORKS
MATERIALS DEPARTMENT-FOUNDATION SECTION
SIGN.
CROSS SECTION OF SPECIMEN A cm2
HEIGHT OF SPECIMEN
h cm
CROSS SECTION OF PLASTIC TUBE
acm2
HEIGHT OF MERCURY COLUMN
H cm
MOVEMENT OF MERCURY COLUMN
l cm
TIME FOR THE MOVEMENT
t sec
MOISTURE CONTENT
No._____ No. __
ww____D
T___
Ww__
DT__
DW__
TW___
DW_
TW___
DW_
WS__
DW__
WS__
WO
_______
WO
_______
AVE W =
CONSTANT HEAD
COEFFICIENT OF PERMEABILITY BULK DENSITY SPECIMEN
Ϫ= 1700kN/m3
=0.079 ah1 cm/sec DRY DENSITY SPECIMEN
Ϫd=1440kN/m3
AtH
Cv= 0.079
ϪHg – yw
CELL
PRESU
RE
63
Kg/cm2
EVER
AGE
PORE
udv
Kg/cm2
CONSOLIDA
TION
PRESSURE
6c
Kg/cm2
BURETT
E
READIN
G
Cm3
EXPELLE
D PORE
WATER
Cm3
HEAD
H
cm
MOV
EMEN
T OF
HG
L
cm
TIM
E
t
sec
PER
MIA
BILIT
Y
K
Cm/se
c
1 0 18.5 59.95 1.0 235

78
17.8 2.0 434
16.0 3.3 718
14.5 4.0 854
5.0 1075
6.0 1151
7.0 1620 1.535
x10-7
3 2 58.5 1.0 85
2.0 195
3.0 285
4.0 210
5.0 506 1.573
x10-7
4 3 58.0 1.0 90
2.0 200
3.0 280
4.0 385
5.0 509 1.570
x10-7
1.57x10⁻⁷
Table 2-4
BLACK COTTON SOIL AT 10% LUBE OIL REPLACEMENT
DEPTH
LAB. NO.
MINISTRY OF PUBLIC WORKS
MATERIALS DEPARTMENT-FOUNDATION SECTION
SIGN.
CROSS SECTION OF SPECIMEN A cm2
HEIGHT OF SPECIMEN
h cm
CROSS SECTION OF PLASTIC TUBE
acm2
MOISTURE CONTENT
No._____ No. __
ww____D
T___
Ww__
DT__

79
HEIGHT OF MERCURY COLUMN
H cm
MOVEMENT OF MERCURY COLUMN
l cm
TIME FOR THE MOVEMENT
t sec
DW__
TW___
DW_
TW___
DW_
WS__
DW__
WS__
WO
_______
WO
_______
AVE W =
CONSTANT HEAD
COEFFICIENT OF PERMEABILITY BULK DNSITY SPECIMEN
Ϫ= Kn/m3
=0.079 ah1 cm/sec DRY DENSITY SPECIMEN yd=
Kn/m3
AtH
Cv= 0.079
ϪHg – yw
CELL
PRESU
RE
63
Kg/cm2
EVER
AGE
PORE
udv
Kg/cm2
CONSOLIDA
TION
PRESSURE
6c
Kg/cm2
BURETT
E
READIN
G
Cm3
EXPELLE
D PORE
WATER
Cm3
HEAD
H
cm
MOV
EME
NT
OF
HG
L
cm
TIM
E
t
sec
PER
MIA
BILIT
Y
K
Cm/se
c
1.0 0 19.0 59.0 1.0 82
15.0 1.0 83
13.0 1.0 97
1.0 97
1.0 97 1.95x
10-7
3.0 2.0 58.0 0.1 22
0.1 22
0.1 21
0.1 22 3.75x
10-7
5.0 4.0 57 0.1 14

80
0.1 15
0.1 15
0.1 15 1.35x
10-7
1.97x10⁻⁷
TABLE 2-5
BLACK COTTON SOIL AT 15% LUBE OIL REPLACEMENT
DEPTH
LAB. NO.
MINISTRY OF PUBLIC WORKS
MATERIALS DEPARTMENT-FOUNDATION SECTION
SIGN.
CROSS SECTION OF SPECIMEN A cm2
HEIGHT OF SPECIMEN
h cm
CROSS SECTION OF PLASTIC TUBE
acm2
HEIGHT OF MERCURY COLUMN
H cm
MOVEMENT OF MERCURY COLUMN
l cm
TIME FOR THE MOVEMENT
t sec
MOISTURE CONTENT
No._____ No. __
ww____D
T___
Ww__
DT__
DW__
TW___
DW_
TW___
DW_
WS__
DW__
WS__
WO
_______
WO
_______
AVE W =
CONSTANT HEAD
COEFFICIENT OF PERMEABILITY BULK DNSITY
SPECIMEN Ϫ= kN/m3
=0.079 ah1 cm/sec DRY DENSITY SPECIMEN
yd=kN/m3
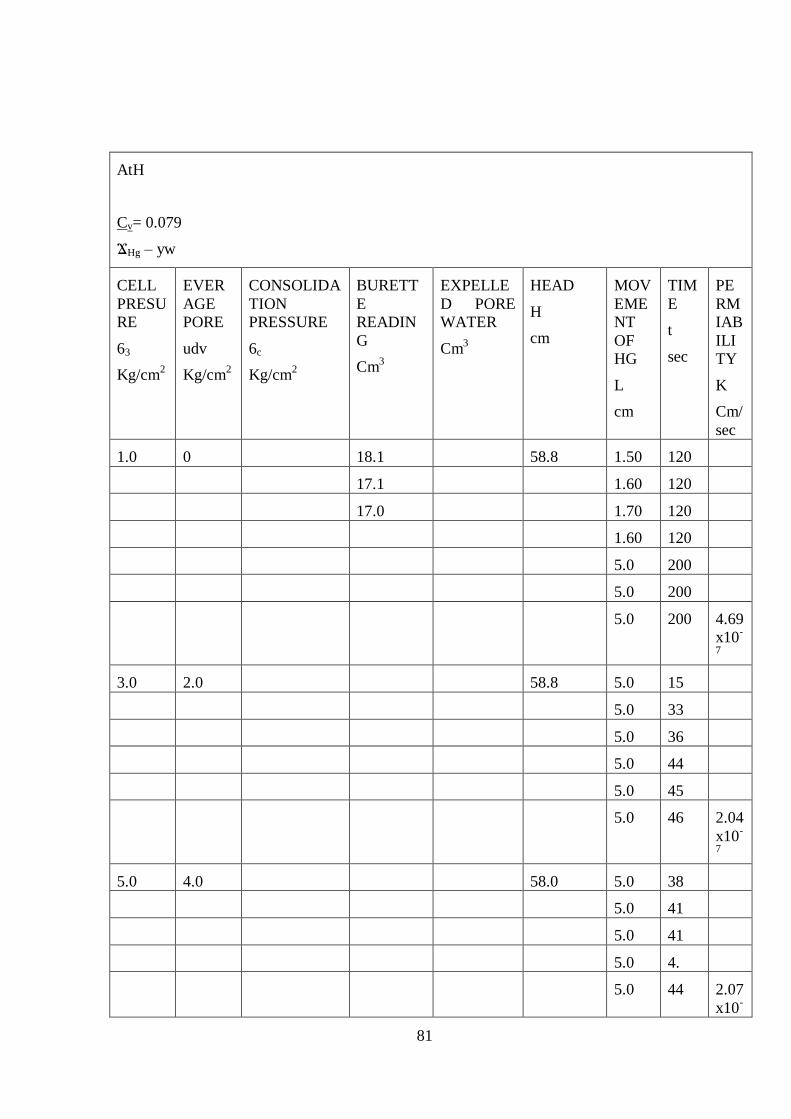
81
AtH
Cv= 0.079
ϪHg – yw
CELL
PRESU
RE
63
Kg/cm2
EVER
AGE
PORE
udv
Kg/cm2
CONSOLIDA
TION
PRESSURE
6c
Kg/cm2
BURETT
E
READIN
G
Cm3
EXPELLE
D PORE
WATER
Cm3
HEAD
H
cm
MOV
EME
NT
OF
HG
L
cm
TIM
E
t
sec
PE
RM
IAB
ILI
TY
K
Cm/
sec
1.0 0 18.1 58.8 1.50 120
17.1 1.60 120
17.0 1.70 120
1.60 120
5.0 200
5.0 200
5.0 200 4.69
x10-
7
3.0 2.0 58.8 5.0 15
5.0 33
5.0 36
5.0 44
5.0 45
5.0 46 2.04
x10-
7
5.0 4.0 58.0 5.0 38
5.0 41
5.0 41
5.0 4.
5.0 44 2.07
x10-
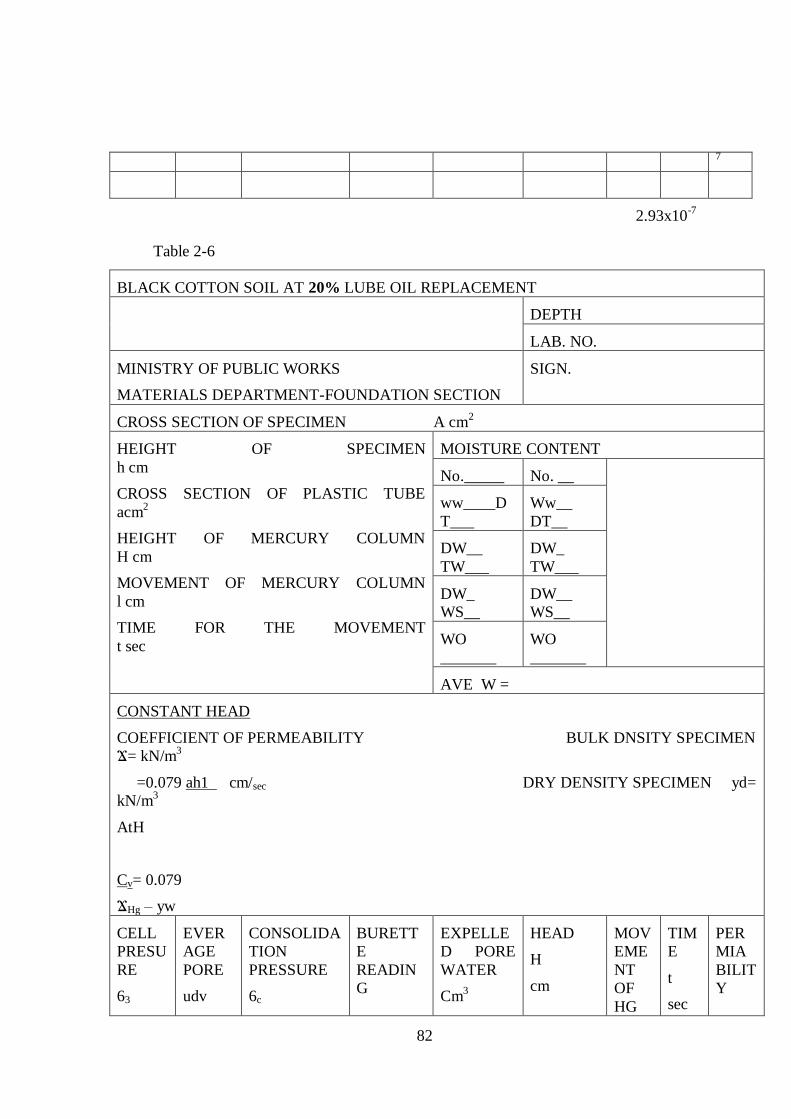
82
7
2.93x10⁻⁷
Table 2-6
BLACK COTTON SOIL AT 20% LUBE OIL REPLACEMENT
DEPTH
LAB. NO.
MINISTRY OF PUBLIC WORKS
MATERIALS DEPARTMENT-FOUNDATION SECTION
SIGN.
CROSS SECTION OF SPECIMEN A cm2
HEIGHT OF SPECIMEN
h cm
CROSS SECTION OF PLASTIC TUBE
acm2
HEIGHT OF MERCURY COLUMN
H cm
MOVEMENT OF MERCURY COLUMN
l cm
TIME FOR THE MOVEMENT
t sec
MOISTURE CONTENT
No._____ No. __
ww____D
T___
Ww__
DT__
DW__
TW___
DW_
TW___
DW_
WS__
DW__
WS__
WO
_______
WO
_______
AVE W =
CONSTANT HEAD
COEFFICIENT OF PERMEABILITY BULK DNSITY SPECIMEN
Ϫ= kN/m3
=0.079 ah1 cm/sec DRY DENSITY SPECIMEN yd=
kN/m3
AtH
Cv= 0.079
ϪHg – yw
CELL
PRESU
RE
63
EVER
AGE
PORE
udv
CONSOLIDA
TION
PRESSURE
6c
BURETT
E
READIN
G
EXPELLE
D PORE
WATER
Cm3
HEAD
H
cm
MOV
EME
NT
OF
HG
TIM
E
t
sec
PER
MIA
BILIT
Y

83
Kg/cm2 Kg/cm
2 Kg/cm
2 Cm
3 L
cm
K
Cm/se
c
1 0 18.5 59.0 0.1 15.5
18.1 0.2 15.5
18.5 0.3 15.5
0.4 15.5
0.5 15.5 5.8x1
0-7
3 2 58.3 0.1 22.5
0.2 22.5
0.3 22.5
0.4 22.5 3.4x1
0-7
5 4 57.6 0.1 17.5
0.2 17.5
0.3 17.5
0.4 17.5 4.45x
10-7
7 6 57.1 0.1 37.5
0.2 37.5
0.3 37.5
0.4 37.5 2.3x1
0-7
1.2x10⁻⁷

84
B) RED COFFEE SOIL
Figure 2-2 Typical grading (wet sieve) curve for Red Coffee soil (neat)
Hydrometer Tests
HYDROMETER TESTS FOR RED COFFEE SOIL(0%,5%,10%,15% &
20%)
Table 2-7
JOB: RED COFFEE SOIL
SITE: KAKUMA SITE
OPERATOR PAUL C.K.KIOKO CHECKED BY
DATE: MAY,2013
BORE HOLE NO. DEPTH
SAMPLE NO. 447/13/F
DESCRIPTION OF SAMPLE:
CYLINDER NO. 2
HYDROMETER NO. M.B. 109
SPECIFIC GRAVITY OF PARTICLE GS= 2.65
(MEASURED/ASSUMED)

85
PERCENTAGE OF PARTICLE FINER THAN 200 MM K, %
MENISCUS CORRECTION CM = 0.4
DISPENSING AGENT CORRECTION X = 4.0
CONTAINER NO.
MASS OF CONTAINER = DRY SOIL M2 =
348.38
MASS OF CONTAINER M1
=291.48
MASS OF OVEN DRY SOIL AFTER PRETREATMENT M =
M2 – M1 =56.9
PERCENTAGE OF PARTICLE K=100 GS Rh + Mt – X) % = 2.82
FINER THAN “D” M(GS -11)
TEMPERATURE T.C
TEMPERATURE CORRECTION; Mt
Mt: TEMPERATURE CORRECTION Rh1: HYDROMETER
READING
D: PARTICLE DIAMETER IN mm Rh: CORRECTED
HYDROMETER READING
D
AT
E
TIME TE
MP
T0 C
m
t
ELAPS
ED
TIME
(MIN)
Rh1 Rh=
Rh1
+CM
D
(MM)
(Rh+
MT-
X)
K
(%)
%
FINE
R
K.K1
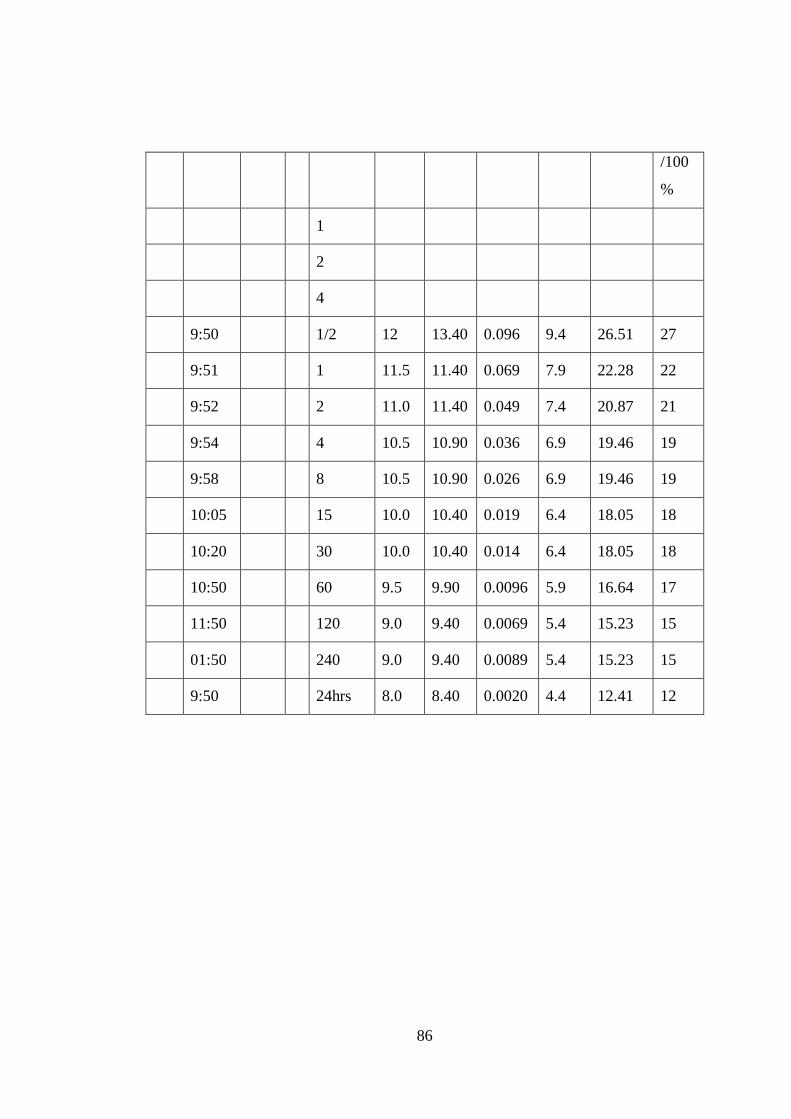
86
/100
%
1
2
4
9:50 1/2 12 13.40 0.096 9.4 26.51 27
9:51 1 11.5 11.40 0.069 7.9 22.28 22
9:52 2 11.0 11.40 0.049 7.4 20.87 21
9:54 4 10.5 10.90 0.036 6.9 19.46 19
9:58 8 10.5 10.90 0.026 6.9 19.46 19
10:05 15 10.0 10.40 0.019 6.4 18.05 18
10:20 30 10.0 10.40 0.014 6.4 18.05 18
10:50 60 9.5 9.90 0.0096 5.9 16.64 17
11:50 120 9.0 9.40 0.0069 5.4 15.23 15
01:50 240 9.0 9.40 0.0089 5.4 15.23 15
9:50 24hrs 8.0 8.40 0.0020 4.4 12.41 12

87
HYDROMETER TEST GRAPH FOR NEAT RED COFFEE
SOIL:
Figure 2-3
HYDROMETER PERMEABILITY TEST FOR RED COFFEE SOIL
Table 2-8
NEAT RED COFFEE SOIL(0% USED LUBE OIL REPLACEMENT)
DEPTH
LAB. NO.
MINISTRY OF PUBLIC WORKS
MATERIALS DEPARTMENT-FOUNDATION SECTION
SIGN.
CROSS SECTION OF SPECIMEN A cm2
HEIGHT OF SPECIMEN
h cm
CROSS SECTION OF PLASTIC TUBE
acm2
HEIGHT OF MERCURY COLUMN
H cm
MOVEMENT OF MERCURY COLUMN
l cm
MOISTURE CONTENT
No._____ No. __
ww____D
T___
Ww__
DT__
DW__
TW___
DW_
TW___
DW_
WS__
DW__
WS__

88
TIME FOR THE MOVEMENT
t sec
WO
_______
WO
_______
AVE W =
CONSTANT HEAD
COEFFICIENT OF PERMEABILITY BULK DNSITY SPECIMEN
Ϫ= kN/m3
=0.079 ah1 cm/sec DRY DENSITY SPECIMEN
yd= kN/m3
AtH
Cv= 0.079
ϪHg – yw
CELL
PRESU
RE
63
Kg/cm2
EVER
AGE
PORE
udv
Kg/cm2
CONSOLIDA
TION
PRESSURE
6c
Kg/cm2
BURETT
E
READIN
G
Cm3
EXPELLE
D PORE
WATER
Cm3
HEAD
H
cm
MOV
EME
NT
OF
HG
L
cm
TIM
E
t
sec
PER
MIA
BILI
TY
K
Cm/s
ec
1 0 147.9 0 0
“ 0.3 8
“ 0.7 15
“ 1.0 30
“ 1.4 60
“ 2.4 120
“ 4.5 240
139.7 8.2 480 1.34
5X1
0-7
3 2 147.9 0 0
0.3 8
0.4 15
0.6 30
0.9 60
1.7 120
3.2 240

89
141.7 6.2 480 1.01
0X1
0-7
5 4 0
8
15
30
60
120
240
480 8.0X
10-8
1.072X10⁻⁷
TABLE 2-9
RED COFFEE SOIL AT 5% USED LUBE OIL REPLACEMENT
DEPTH
LAB. NO.
MINISTRY OF PUBLIC WORKS
MATERIALS DEPARTMENT-FOUNDATION SECTION
SIGN.
CROSS SECTION OF SPECIMEN A cm2
HEIGHT OF SPECIMEN
h cm
CROSS SECTION OF PLASTIC TUBE
acm2
HEIGHT OF MERCURY COLUMN
H cm
MOVEMENT OF MERCURY COLUMN
l cm
TIME FOR THE MOVEMENT
t sec
MOISTURE CONTENT
No._____ No. __
ww____D
T___
Ww__
DT__
DW__
TW___
DW_
TW___
DW_
WS__
DW__
WS__
WO
_______
WO
_______
AVE W =

90
CONSTANT HEAD
COEFFICIENT OF PERMEABILITY BULK DNSITY SPECIMEN
Ϫ=19.35 kN/m3
=0.079 ah1 cm/sec DRY DENSITY SPECIMEN yd=15.18
kN/m3
AtH
Cv= 0.079
ϪHg – yw
CELL
PRESU
RE
63
Kg/cm2
EVER
AGE
PORE
udv
Kg/cm2
CONSOLIDA
TION
PRESSURE
6c
Kg/cm2
BURETT
E
READIN
G
Cm3
EXPELLE
D PORE
WATER
Cm3
HEAD
H
cm
MOV
EME
NT
OF
HG
L
cm
TIM
E
t
sec
PER
MIA
BILIT
Y
K
Cm/se
c
100 100 20.7 57.6 2.0 120 3.19x
10-7
20.3 57.6 1.9 120 3.03x
10-7
57.6 1.9 120 3.03x
10-7
300 200 300 57.0 2.1 120 3.39x
10-7
2.1 120 3.39x
10-7
2.2 120 3.55x
10-7
500 400 500 56.2 1.8 120 2.29x
10-7
1.6 120 2.59x
10-7
1.5 120 2.43x
10-7
700 600 700 55.5 1.5 120 2.46x
10-7
1.4 120 2.29x
10-7

91
1.6 120 2.60x
10-7
900 800 900 1.2 120 1.99x
10-7
1.4 120 2.32x
10-7
1.3 120 2.15x
10-7
2.76X10⁻⁷
Table 2-10
RED COFFEE SOIL AT 10% USED LUBE OIL REPLACEMENT
DEPTH
LAB. NO.
MINISTRY OF PUBLIC WORKS
MATERIALS DEPARTMENT-FOUNDATION SECTION
SIGN.
CROSS SECTION OF SPECIMEN A cm2
HEIGHT OF SPECIMEN
h cm
CROSS SECTION OF PLASTIC TUBE
acm2
HEIGHT OF MERCURY COLUMN
H cm
MOVEMENT OF MERCURY COLUMN
l cm
TIME FOR THE MOVEMENT
t sec
MOISTURE CONTENT
No._____ No. __
ww____D
T___
Ww__
DT__
DW__
TW___
DW_
TW___
DW_
WS__
DW__
WS__
WO
_______
WO
_______
AVE W =

92
CONSTANT HEAD
COEFFICIENT OF PERMEABILITY BULK DNSITY SPECIMEN
Ϫ= kN/m3
=0.079 ah1 cm/sec DRY DENSITY SPECIMEN
yd= kN/m3
AtH
Cv= 0.079
ϪHg – yw
CELL
PRESU
RE
63
Kg/cm2
EVER
AGE
PORE
udv
Kg/cm2
CONSOLIDA
TION
PRESSURE
6c
Kg/cm2
BURETT
E
READIN
G
Cm3
EXPELLE
D PORE
WATER
Cm3
HEAD
H
cm
MOV
EME
NT
OF
HG
L
cm
TIM
E
t
sec
PER
MIA
BILI
TY
K
Cm/s
ec
100 0 100 21.5 60 0.8 60 2.45
x10-7
209 60 1.0 60 3.07
x10-7
20.7 60 0.9 60 2.76
x10-7
20.9 0.6
3 2 3 59.5 1.7 60 5.26
x10-7
59.5 1.6 60 4.91
x10-7
59.5 1.8 60 5.57
x10-7
5 4 5 59.5 2.3 60 7.11
x10-7
59.5 2.1 60 6.49
x10-7
59.5 2.2 60 6.80
x10-7
7 6 7 59.0 2.9 60 9.04
x10-7
59.0 2.7 60 8.42
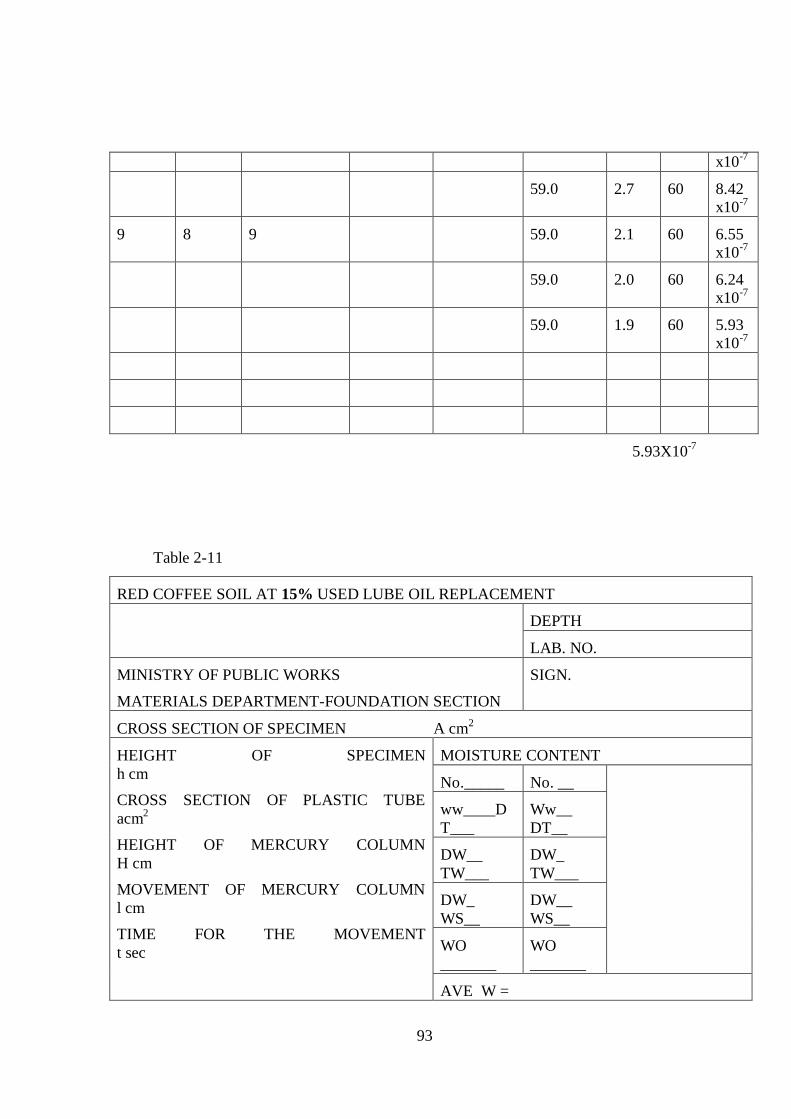
93
x10-7
59.0 2.7 60 8.42
x10-7
9 8 9 59.0 2.1 60 6.55
x10-7
59.0 2.0 60 6.24
x10-7
59.0 1.9 60 5.93
x10-7
5.93X10⁻⁷
Table 2-11
RED COFFEE SOIL AT 15% USED LUBE OIL REPLACEMENT
DEPTH
LAB. NO.
MINISTRY OF PUBLIC WORKS
MATERIALS DEPARTMENT-FOUNDATION SECTION
SIGN.
CROSS SECTION OF SPECIMEN A cm2
HEIGHT OF SPECIMEN
h cm
CROSS SECTION OF PLASTIC TUBE
acm2
HEIGHT OF MERCURY COLUMN
H cm
MOVEMENT OF MERCURY COLUMN
l cm
TIME FOR THE MOVEMENT
t sec
MOISTURE CONTENT
No._____ No. __
ww____D
T___
Ww__
DT__
DW__
TW___
DW_
TW___
DW_
WS__
DW__
WS__
WO
_______
WO
_______
AVE W =
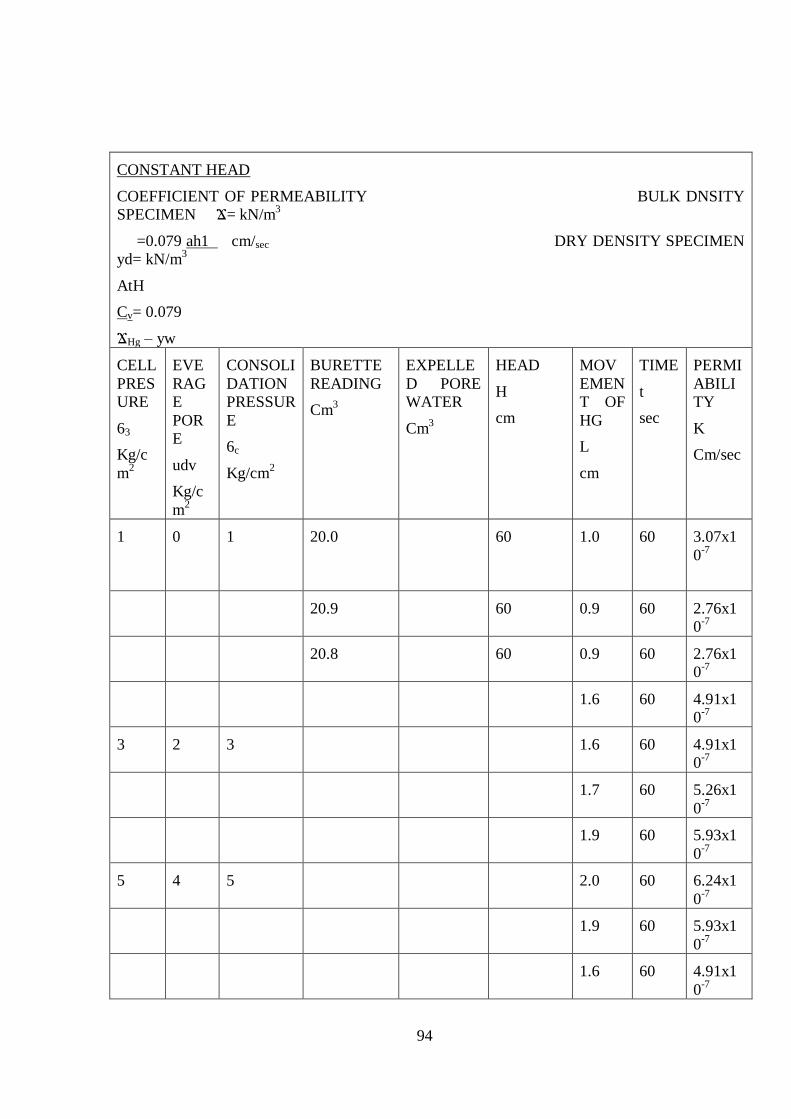
94
CONSTANT HEAD
COEFFICIENT OF PERMEABILITY BULK DNSITY
SPECIMEN Ϫ= kN/m3
=0.079 ah1 cm/sec DRY DENSITY SPECIMEN
yd= kN/m3
AtH
Cv= 0.079
ϪHg – yw
CELL
PRES
URE
63
Kg/c
m2
EVE
RAG
E
POR
E
udv
Kg/c
m2
CONSOLI
DATION
PRESSUR
E
6c
Kg/cm2
BURETTE
READING
Cm3
EXPELLE
D PORE
WATER
Cm3
HEAD
H
cm
MOV
EMEN
T OF
HG
L
cm
TIME
t
sec
PERMI
ABILI
TY
K
Cm/sec
1 0 1 20.0 60 1.0 60 3.07x1
0-7
20.9 60 0.9 60 2.76x1
0-7
20.8 60 0.9 60 2.76x1
0-7
1.6 60 4.91x1
0-7
3 2 3 1.6 60 4.91x1
0-7
1.7 60 5.26x1
0-7
1.9 60 5.93x1
0-7
5 4 5 2.0 60 6.24x1
0-7
1.9 60 5.93x1
0-7
1.6 60 4.91x1
0-7

95
7 6 7 1.7 60 5.26x1
0-7
1.9 60 5.93x1
0-7
1.6 60 4.91x1
0-7
9 8 9 1.6 60 4.91x1
0-7
1.9 60 5.93x1
0-7
4.91X10⁻⁷
Table 2-12
RED COFFEE SOIL AT 20% USED LUBE OIL REPLACEMENT
DEPTH
LAB. NO.
MINISTRY OF PUBLIC WORKS
MATERIALS DEPARTMENT-FOUNDATION SECTION
SIGN.
CROSS SECTION OF SPECIMEN A cm2
HEIGHT OF SPECIMEN
h cm
CROSS SECTION OF PLASTIC TUBE
acm2
HEIGHT OF MERCURY COLUMN
H cm
MOVEMENT OF MERCURY COLUMN
l cm
TIME FOR THE MOVEMENT
t sec
MOISTURE CONTENT
No._____ No. __
ww____D
T___
Ww__
DT__
DW__
TW___
DW_
TW___
DW_
WS__
DW__
WS__
WO
_______
WO
_______
AVE W =

96
CONSTANT HEAD
COEFFICIENT OF PERMEABILITY BULK DNSITY SPECIMEN
Ϫ= kN/m3
=0.079 ah1 cm/sec DRY DENSITY SPECIMEN
yd= kN/m3
AtH
Cv= 0.079
ϪHg – yw
CELL
PRESU
RE
63
Kg/cm2
EVER
AGE
PORE
udv
Kg/cm2
CONSOLIDA
TION
PRESSURE
6c
Kg/cm2
BURETT
E
READIN
G
Cm3
EXPELLE
D PORE
WATER
Cm3
HEAD
H
cm
MOV
EME
NT
OF
HG
L
cm
TIM
E
t
sec
PER
MIA
BILI
TY
K
Cm/s
ec
1.0 0 1.0 20.3 61 4 420 1.73
X 10-
7
20.3 61 4.2 480 1.59
X 10-
7
61 2.3 480 1.71
X 10-
7
2.0 1.0 2.0 61 10 89
61 13 428 2.52
X 10-
7
61 8 480 3.03
X 10-
7
61 18 1620 2.02
X 10-
7
4.0 3.0 4.0 60.7 5 1038 2.48
X 10-
7
60.7 29 423 2.38

97
X 10-
7
60.7 10 360 2.40
X 10-
7
60.7 10 660 2.77
X 10-
7
6.0 5.0 6.0 60 5 780 2.34
X 10-
7
60 7 715 2.36
X 10-
7
60 5 1025 2.14
X 10-
7
8.0 7.0 8.0 59.4 10 904 2.03
X 10-
7
59.4 10 4606 2.10
X 10-
7
59.4 6 3908 2.15
X 10-
7
2.23X10⁻⁷

98
APPENDIX 3 - ATTERBERG
LIMITS
Liquid Limit (LL), Plastic Limit(PL)
and Plasticity Indices(PI) at 0% oil.
Table 3-1 Liquid Limit
A(WE
T+TIN
)
B(DR
Y+TIN
)
C(
Ti
n
wt
)
(
A
-
B
)
(
B
-
C
)
(A-
B)/(
B-
C)%
68.2 54.8 31
1
3.
4
2
3.
8
56.3
025
2
69.2 54.8 30
1
4.
4
2
4.
8
58.0
645
2
73.2 56.4
28
.6
1
6.
8
2
7.
8
60.4
316
5
77.4 61
34
.6
1
6.
4
2
6.
4
62.1
212
1
A V E R A G E Liquid
Limit(L.L)
60
Table 3-2 Plastic Limit
A(WE
T+TIN
)
B(DR
Y+TIN
)
C(
Ti
n
wt
)
(
A
-
B
)
(
B
-
C
)
(A-
B)/(
B-
C)%
35.4 34.4
30.
8 1
3
.
6
27.7
7778
37 35.8
31.
8
1.
2 4 30
A V E R A G E Plastic Limit 29
P.I. =31
Liquid Limit (LL),Plastic Limit(PL)
and Plasticity Indices(PI) at 5% oil.
Table 3-3 Liquid Limit
Cone
Penetration
A(WET+TIN) B(DRY+
TIN)
C(Tin wt) (A-B) (B-C) (A-B)/(B-C)%
15.2mm 87.8 63.2 32 24.9 31.2 78.8
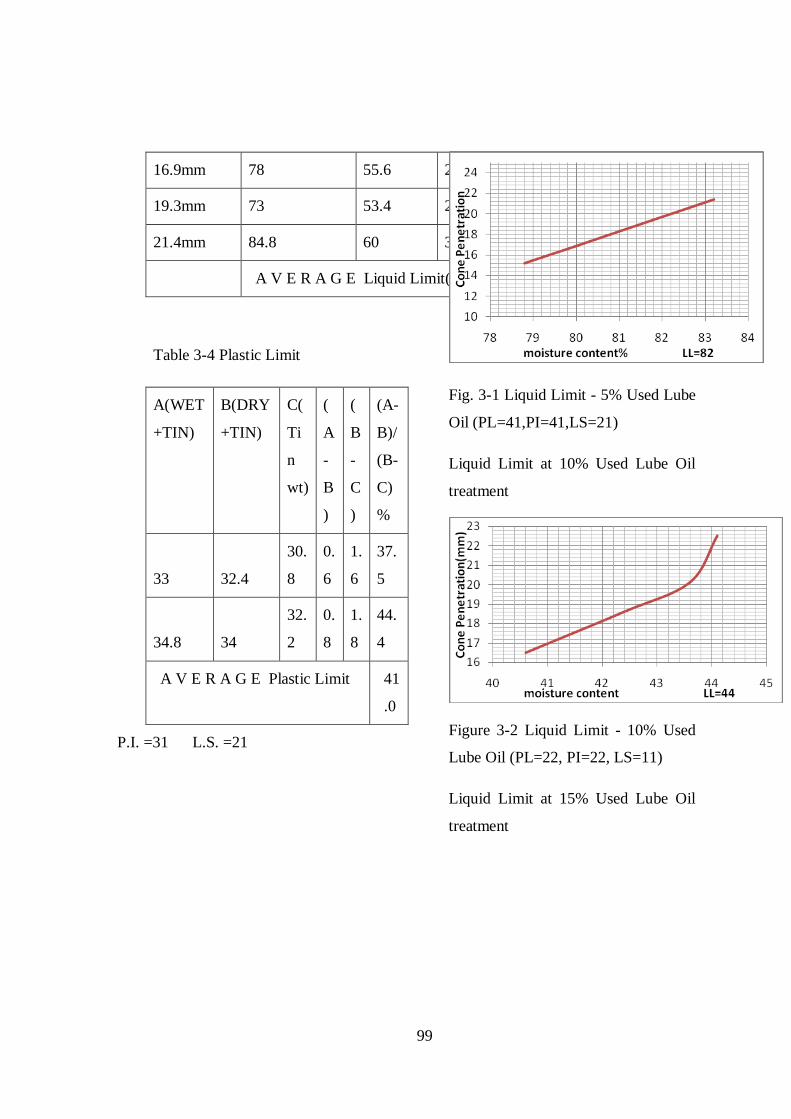
99
16.9mm 78 55.6 27.6 22.4 28 80
19.3mm 73 53.4 29.4 19.6 24 81.7
21.4mm 84.8 60 30.2 24.8 29.8 83.2
A V E R A G E Liquid Limit(L.L) 82
Table 3-4 Plastic Limit
A(WET
+TIN)
B(DRY
+TIN)
C(
Ti
n
wt)
(
A
-
B
)
(
B
-
C
)
(A-
B)/
(B-
C)
%
33 32.4
30.
8
0.
6
1.
6
37.
5
34.8 34
32.
2
0.
8
1.
8
44.
4
A V E R A G E Plastic Limit 41
.0
P.I. =31 L.S. =21
Fig. 3-1 Liquid Limit - 5% Used Lube
Oil (PL=41,PI=41,LS=21)
Liquid Limit at 10% Used Lube Oil
treatment
Figure 3-2 Liquid Limit - 10% Used
Lube Oil (PL=22, PI=22, LS=11)
Liquid Limit at 15% Used Lube Oil
treatment

100
Fgure 3-3 Liquid Limit - 15% Used
Lube Oil (PL=39,PI=44,LS=21)
Liquid Limit at 20% Used Lube Oil
treatment
Liquid limit
Figure 3-4 Liquid Limit - 20% Used
Lube Oil (PL=27,PI=47,LS=24)
Liquid Limit(LL),Plastic Limit(PL)
and Plasticity Indices(PI) at10% oil.
Table 3-5 Liquid Limit
Cone A(WET B(DRY+TI C(Tin wt) (A-B) (B-C) (A-B)/(B-C)%
Penetration +TIN) N)
16.5mm 84.0 63.0 28.6 16.0 39.4 40.6
18.6mm 75.6 62.2 28.7 14.2 33.5 42.4
20.1mm 82.0 66.4 30.6 15.6 35.8 43.6
22.5mm 81.2 66.6 32.2 15 34.0 44.1
A V E R A G E Liquid Limit(L.L) 44
Table 3-6 Plastic Limit
A(WET
+TIN)
B(DRY
+TIN)
C(
Ti
n
wt)
(
A
-
B
)
(
B
-
C
)
(A-
B)/
(B-
C)
%
42.4 40.4
21.
8
2.
0
8.
6
23.
3
41.2 39.2
29.
8
2.
0
9.
4
21.
3
A V E R A G E Plastic Limit 22.
3
P.I. =22 L.S. =11

101
Liquid Limit(LL),Plastic Limit(PL)
and Plasticity Indices(PI) at15% oil.
Table 3-7 Liquid Limit
Cone
Penetration
A(WET
+TIN)
B(DRY+TIN) C(Tin wt) (A-B) (B-C) (A-B)/(B-C)%
14.5mm 86.0 61.2 28.6 24.8 32.6 76.1
16.4mm 72.2 53.4 29.6 18.8 23.8 79.0
18.7mm 67.8 50.8 30.2 17.0 20.6 82.5
20.5mm 70.8 51.6 28.6 19.2 23.0 83.5
A V E R A G E Liquid Limit(L.L) 83

102
Table 3-8 Plastic Limit
A(WET
+TIN)
B(DRY
+TIN)
C(
Ti
n
wt)
(
A
-
B
)
(
B
-
C
)
(A-
B)/
(B-
C)
%
45.4 41.2
30.
0
4.
2
1
1.
2
37.
8
39.0 36.4
30.
0
2.
6
6.
4
40.
6
A V E R A G E Plastic Limit 39
P.I. =44 L.S. =21
Liquid Limit(LL),Plastic Limit(PL)
and Plasticity Indices(PI) at20% oil.
Table 3-9 Liquid Limit
Cone
Penetration
A(WET
+TIN)
B(DRY+TIN) C(Tin wt) (A-B) (B-C) (A-B)/(B-C)%
16.2mm 71.2 54.8 31.0 16.4 23.8 68.9
18.1mm 76.0 57.0 30.0 19.0 29.0 70.4
20.1mm 66.8 51.4 29.6 15.4 20.6 74.8
22.4mm 71.6 53.4 30.2 18.2 23.8 76.5
A V E R A G E Liquid Limit(L.L) 83
Table 3-10 Plastic Limit
A(WET
+TIN)
B(DRY
+TIN)
C(
Ti
n
wt)
(
A
-
B
)
(
B
-
C
)
(A-
B)/
(B-
C)
%
40.4
21.
8
2.
0
8.
6
23.
3
39.2
29.
8
2.
0
9.
4
21.
3
A V E R A G E Plastic Limit 39
P.I. =47 L.S. =24
APPENDIX 4 - COMPACTION
COMPACTION – BLACK COTTON
Fig. 4-1 proctor analysis for
black cotton soil at 0% Lube
Oil

103
Fig. 4-2 proctor analysis for black
cotton soil at 5% Lube Oil
Fig. 4-3 proctor analysis for black
cotton soil at 10% Lube Oil
Fig. 4-4 proctor analysis for black
cotton soil at 15% Lube Oil
Fig. 4-5 proctor analysis for black
cotton soil at 20% Lube Oil
Curves Summarised
Fig. 4-6 combined results for proctor
analysis for black cotton soil

104
COMPACTION/MAXIMUM DRY
DENSITY –RED
SOIL
Fig. 4-7 liquid limit for neat red coffee
soil 0% (PL=26,PI=30,LS=15)
Fig. 4-8 liquid limit for red coffee soil
5%(PL=26,PI=28,LS=14)
Fig. 4.9 liquid limit for red coffee soil
10%(PL=29,PI=22,LS=11)
Fig. 4-10 liquid limit for red coffee
soil 15%(PL=21,PI=18,LS=9)

105
Fig. 4-11 liquid limit for red coffee
soil 20%(PL=26,PI=17,LS=8)
Fig. 4-12 proctor analysis for Red
coffee soil at 0% Lube Oil
Fig. 4-13 proctor analysis for Red
coffee soil at 5% Lube Oil

106
Fig. 4-14 proctor analysis for Red
coffee soil at 10% Lube Oil
Fig. 4-15 proctor analysis for Red
coffee soil at 15% Lube Oil
Fig. 4-16 proctor analysis for Red
coffee soil at 20% Lube Oil
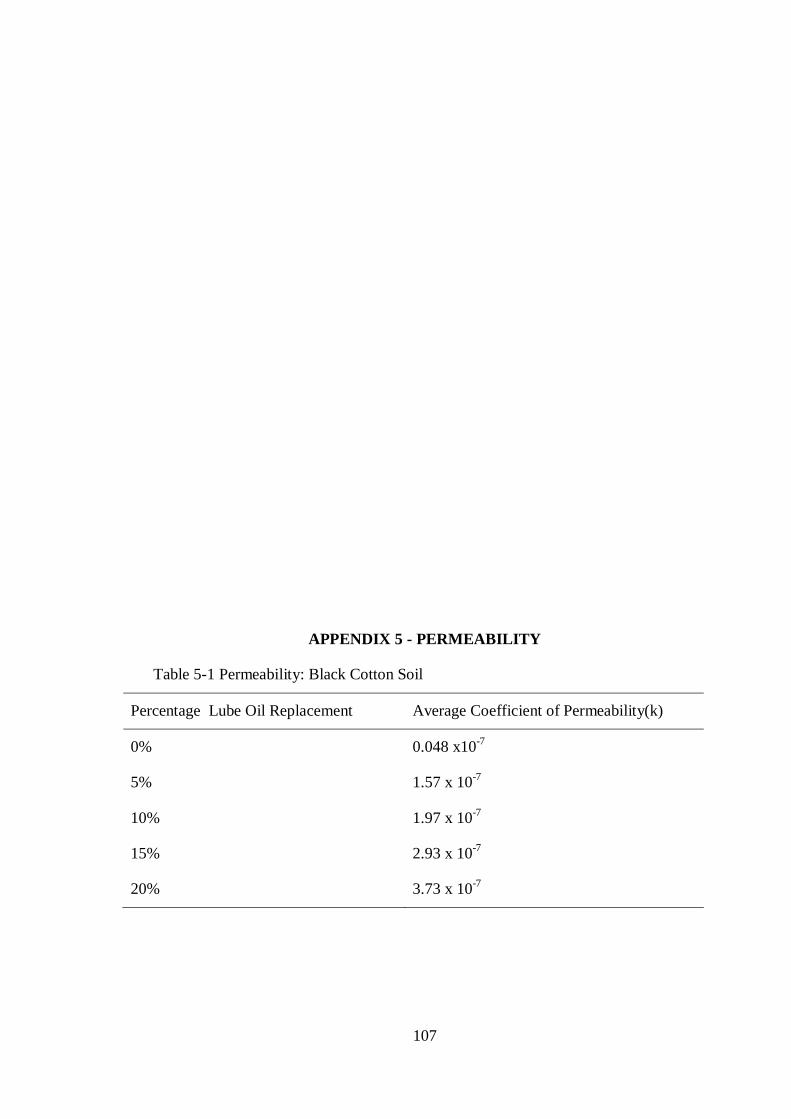
107
APPENDIX 5 - PERMEABILITY
Table 5-1 Permeability: Black Cotton Soil
Percentage Lube Oil Replacement Average Coefficient of Permeability(k)
0% 0.048 x10⁻⁷
5% 1.57 x 10⁻⁷
10% 1.97 x 10⁻⁷
15% 2.93 x 10⁻⁷
20% 3.73 x 10⁻⁷

108
Table 5-2 Permeability: Red Coffee Soil
Percentage Lube Oil Replacement Average Coefficient of Permeability(k)
0% 1.072 x10⁻⁷
5% 2.76 x 10⁻⁷
10% 5.93 x 10⁻⁷
15% 4.91 x 10⁻⁷
20% 2.23 x 10⁻⁷
APPENDIX 6 - CBR
A) BLACK COTTON SOIL

109
Figure 6-1CBR Analysis for black
cotton soil at 0% Lube Oil
Figure 6-2CBR Analysis for black
cotton soil at 5% Lube Oil
Figure 6-3CBR Analysis for black
cotton soil at 10% Lube Oil
Figure 6-4CBR Analysis for black
cotton soil at 15% Lube Oil

110
Figure 6-5CBR Analysis for black
cotton soil at 20% Lube Oil

111
Values at 0% Used Lube-Oil
Table 6-1 Dry Density, Moisture content and CBR Test Results
Moisture Content % 26.4 28.9 32.4 39.3 43.8
Dry Density 100ρ/100+w kg/m3 1163 1202 1238 1170 994
MDD=1255 KG/M3OMC=34.5% CBR=1
Values at 5% Used Lube-Oil
Table 6-2
Moisture Content % 12.1 14.8 16.6 18.6 20.9
Dry Density 100ρ/100+w
kg/m3
1409 1446 1441 1408 1340
MDD=1455 KG/M3OMC=15.8% CBR=3
Values at 10% Used Lube-Oil
Table 6-3
Moisture Content % 10.9 12.4 14.8 16.3 18.7
Dry Density 100ρ/100+w
kg/m3
1578 1646 1655 1617 1542
MDD=1665 KG/M3OMC=13.8% CBR=8
Values at 15% Used Lube-Oil
Table 6-4

112
Moisture Content % 7.2 9.2 11.2 13.2
Dry Density 100ρ/100+w
kg/m3
1474 1548 1484 1396
MDD=1555 KG/M3OMC=09.5% CBR=6
Values at 20%Used Lube-Oil
Table 6-5
Moisture Content % 6.8 9.4 11.3 13.2
Dry Density 100ρ/100+w
kg/m3
1479 1527 1456 1396
MDD=1530KG/M3OMC=9.2% CBR=5

113
B) RED COFFEE

114
Fig. 6-6 CBR analysis for Red soil at
0% Lube Oil
Fig. 6-7 CBR analysis for Red soil at
5% Lube Oil
Figure 6-8 CBR analysis for Red soil
at 10% Lube Oil
Figure 6-9CBR analysis for Red soil
at 15% Lube Oil
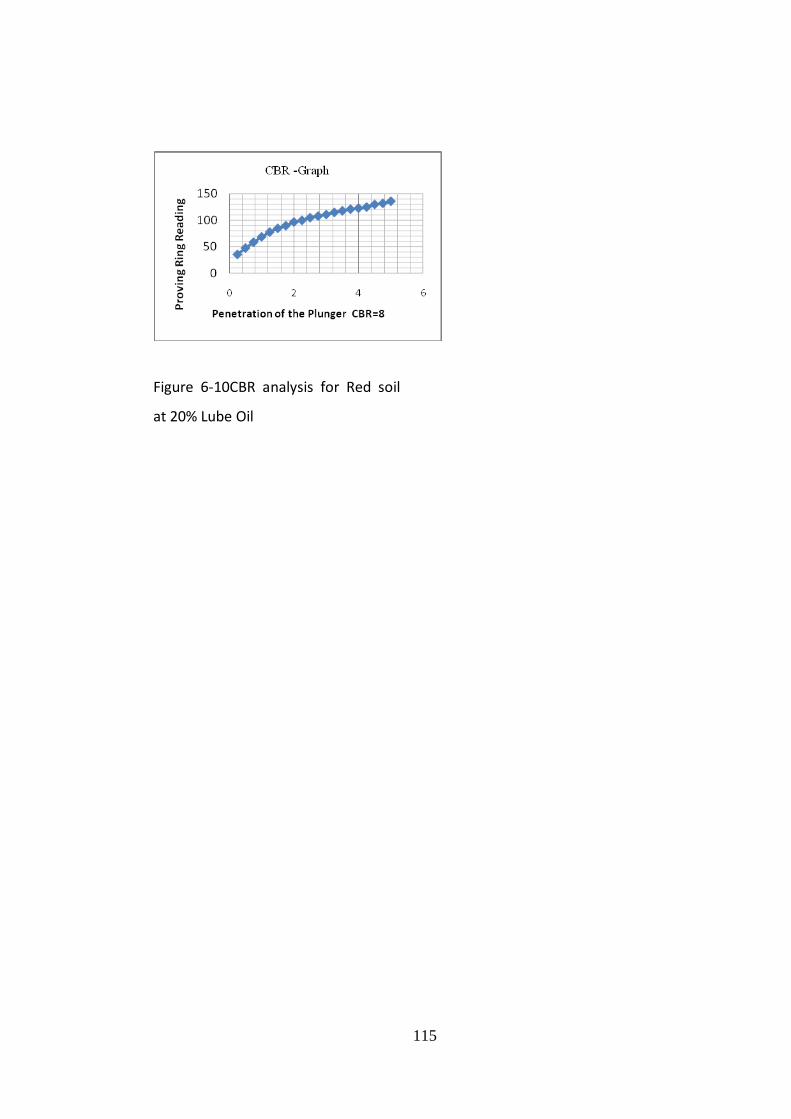
115
Figure 6-10CBR analysis for Red soil
at 20% Lube Oil

116
APPENDIX 7 - MAPS
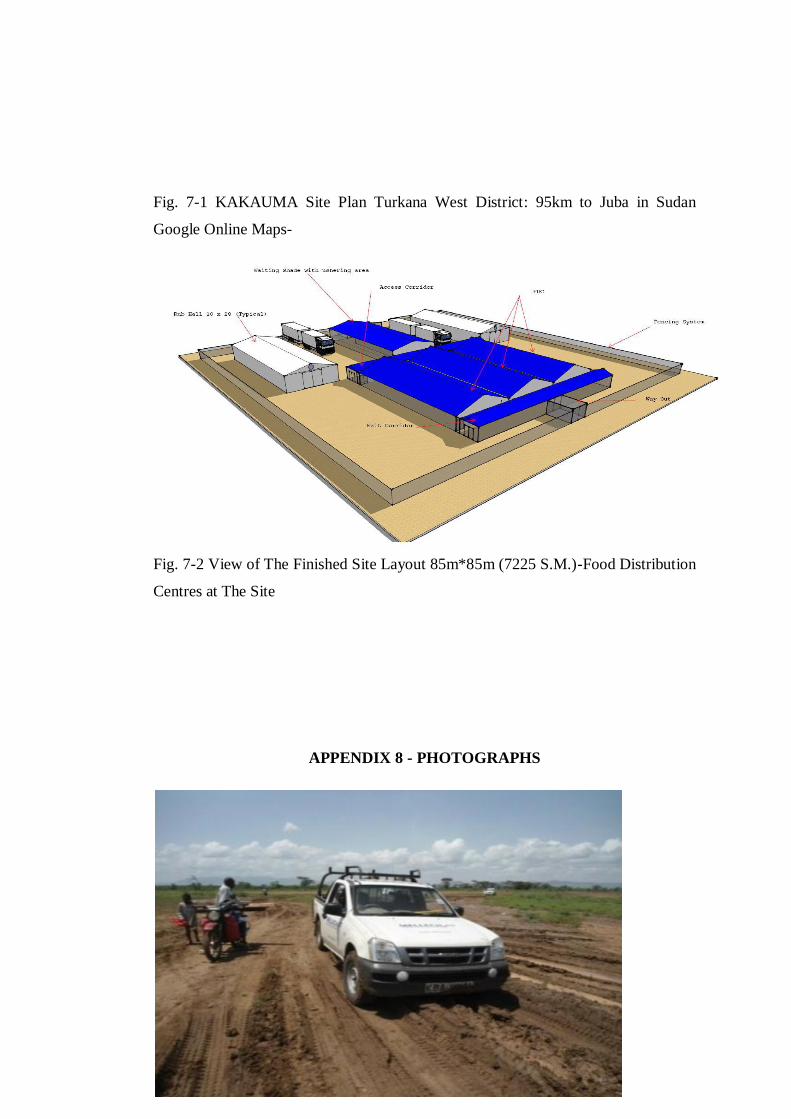
117
Fig. 7-1 KAKAUMA Site Plan Turkana West District: 95km to Juba in Sudan
Google Online Maps-
Fig. 7-2 View of The Finished Site Layout 85m*85m (7225 S.M.)-Food Distribution
Centres at The Site
APPENDIX 8 - PHOTOGRAPHS

118
Fig. 8-1 Traversing the Black Cotton
Soil Terrain between the Sites & Off-
Loading Used Lube Oil for Use at the
site.
Fig. 8-2 Off-Loading Used Lube Oil
for Use at the Site
Fig. 8-3 Use lube oil as used at the
site:June, 2012

119
Fig. 8-4 Embankment preparation size
85m x 85m (7225m2)

120
Fig. 8-5
Fig. 8-6
Fig. 8-7
Viscosity tests during experiments at the JKUAT Mechanical Engineering
Laboratory using Red Wood viscometer for less than 2000 seconds.

121
VARIOUS SOIL TESTS AT THE LAB
Fig. 8-8 Container with Used Lube Oil
Fig. 8-9 Used Lube Oil being weighed

122
Fig. 8-10 Mixed Red Black Cotton Soil and Lube Oil
Fig. 8-11 Mixed Red Coffee Soil and Lube Oil
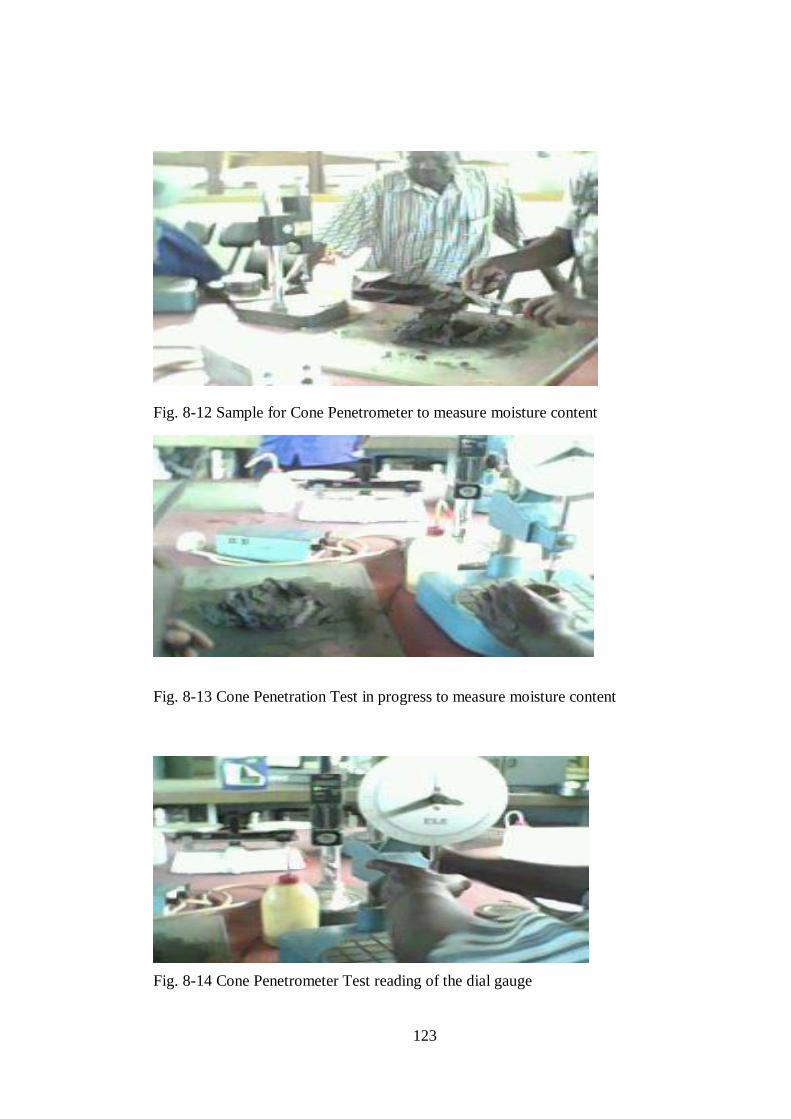
123
Fig. 8-12 Sample for Cone Penetrometer to measure moisture content
Fig. 8-13 Cone Penetration Test in progress to measure moisture content
Fig. 8-14 Cone Penetrometer Test reading of the dial gauge

124
Fig. 8-15 Soaked samples for CBR Test
Fig. 8-16 CBR Readings
Fig. 8-17 CBR Readings