Embed Size (px)
Citation preview
An assessment of diagnosticefficiency by Taguchi/DEA
methodsMehmet Tolga Taner
Department of Human Resource Management, Dogus University, Istanbul,Turkey, and
Bulent SezenDepartment of Management, Gebze Institute of Technology, Kocaeli, Turkey
Abstract
Purpose – The aim of this paper is to propose a new, objective and consistent method for thecalculation of the diagnostic efficiency in medical applications.
Design/methodology/approach – In this study, a hybrid method of Taguchi and DEA is proposed.This method reflects the diversity of inputs and outputs by incorporating the stepwise application ofsensitivity, specificity, leveling threshold, and efficiency score. A hypothetical case study is givenwhich involves eight readers of X-ray films in clinical radiology.
Findings – The selected pairs of sensitivity and specificity yielded two efficient readers. After superefficiency analysis, Reader 6 is found to be the most efficient reader.
Originality/value – The paper presents a new, objective and consistent method for the calculation ofthe diagnostic efficiency in medical applications.
Keywords Taguchi methods, Data analysis, Decision making, Process efficiency
Paper type Research paper
IntroductionToday’s health care executives continually strive to improve their organizations’internal efficiency and competitive advantage. This is driven by the global and localmarkets and ever-expected patient’s increased standard of treatment; with thespotlight firmly on cost reduction in health care.
High performance is a measure of success in all processes while low performancealways leads to failure. While the definition of performance can be differentlyperceived from individual to individual, the following three main characteristicsshould be taken into consideration:
(1) the efficient use of resources;
(2) the clear achievement of the goals; and
(3) comprehension by the user (patient) of the study undertaken.
The first item is related to efficiency, i.e. how well inputs are converted to outputs. Thesecond is related to effectiveness and is measured by how well the health care system ismanaged so that the goals aimed for are successfully achieved. The third is about thepatient. Without an assured outcome on the patient’s side, efficiency and effectivenessare meaningless.
The current issue and full text archive of this journal is available at
www.emeraldinsight.com/0952-6862.htm
An assessmentof diagnostic
efficiency
93
Received 7 December 2007Revised 1 February 2008
Accepted 6 April 2008
International Journal of Health CareQuality AssuranceVol. 22 No. 1, 2009
pp. 93-98q Emerald Group Publishing Limited
0952-6862DOI 10.1108/09526860910927989
There are many methods for measuring performance. One of these methods is dataenvelopment analysis (DEA). DEA is fairly new to the health systems applications. It isa non-parametric method and provides a means of scaling efficiency levels ofdecision-making units (DMUs). It can be used by medical decision-making people inany ensuing procedure. Another method used in performance evaluation is theTaguchi methods. This method involves the performance optimization of a systemunder noise, i.e. in our case, diagnostic misclassification.
In medical imaging, the benefit of making comparisons is not only to ratify thecommon core of readers, but also to allow each separate reader to demonstratemarginal differences which would have been overlooked by a single observer.Therefore, comparative performances of the readers should be measured, such thatmore efficient, reliable and beneficial detection systems are presented to the patients.Certainly, measuring the performance is only the first step in the systematic approachfor improvement. All the other steps of this approach include:
(1) measuring performance;
(2) identifying where improvements are needed;
(3) finding effective ways to achieve these improvements and learning from othersources;
(4) involving experienced staff and implementing the required changes; and
(5) monitoring and taking appropriate corrective action after a specified period.
As a result of this systematic improvement process, overall efficiency and productivitycan be increased, best returns can be obtained from qualified staff, skill levels areraised, methods and equipment are continuously updated, and incorrect interpretationsare minimized.
The proposed methodology is divided into two phases. In the following, thesemethods, namely Taguchi and DEA, are shortly defined. The paper deals, in the secondsection, with a description of the specific situation of the actual case study for whichthe methodology was developed, where both methods are used for comparing eightreaders in order to suggest a new hybrid method to medical practitioners that can beused in order to determine the diagnostic efficiency.
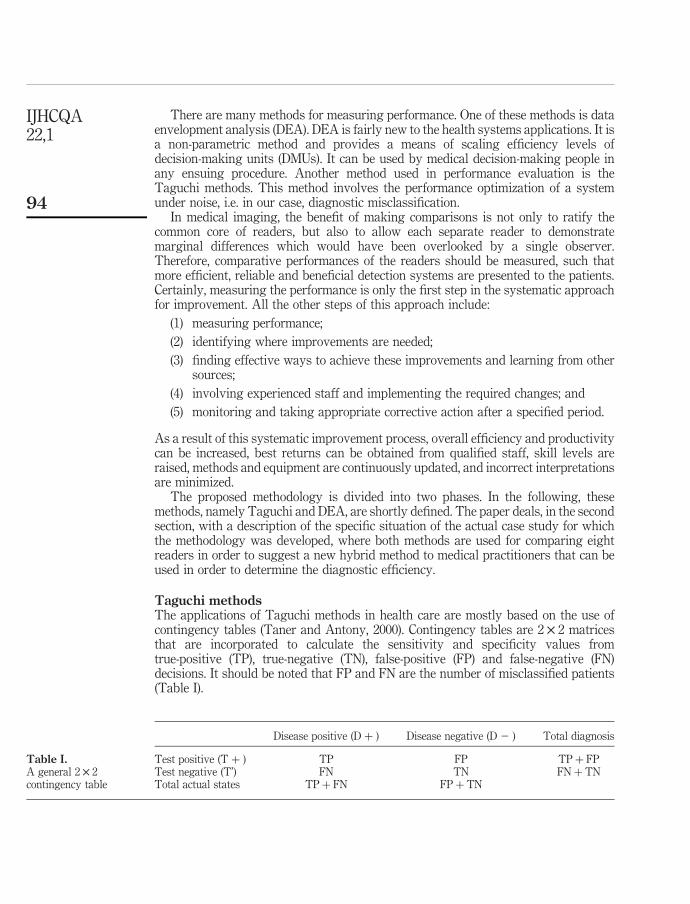
Taguchi methodsThe applications of Taguchi methods in health care are mostly based on the use ofcontingency tables (Taner and Antony, 2000). Contingency tables are 2 £ 2 matricesthat are incorporated to calculate the sensitivity and specificity values fromtrue-positive (TP), true-negative (TN), false-positive (FP) and false-negative (FN)decisions. It should be noted that FP and FN are the number of misclassified patients(Table I).
Disease positive (D þ ) Disease negative (D 2 ) Total diagnosis
Test positive (T þ ) TP FP TP þ FPTest negative (T’) FN TN FN þ TNTotal actual states TP þ FN FP þ TN
Table I.A general 2 £ 2contingency table
IJHCQA22,1
94
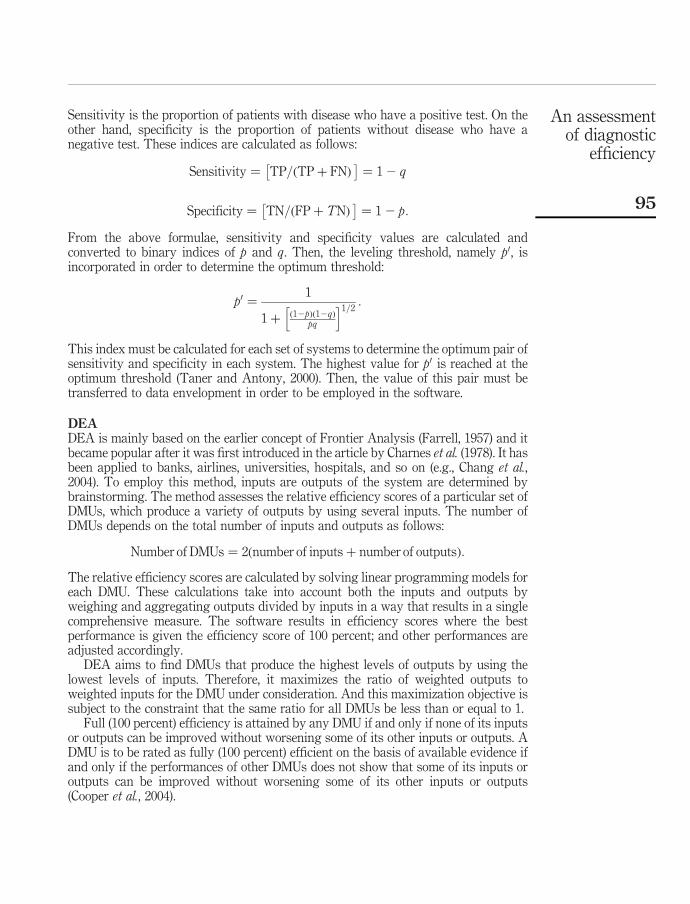
Sensitivity is the proportion of patients with disease who have a positive test. On theother hand, specificity is the proportion of patients without disease who have anegative test. These indices are calculated as follows:
Sensitivity ¼ TP= TP þ FNð Þ� �
¼ 1 2 q
Specificity ¼ TN= FP þ TNð Þ� �
¼ 1 2 p:
From the above formulae, sensitivity and specificity values are calculated andconverted to binary indices of p and q. Then, the leveling threshold, namely p0, isincorporated in order to determine the optimum threshold:
p0 ¼1
1 þ 12pð Þ 12qð Þpq
h i1=2:
This index must be calculated for each set of systems to determine the optimum pair ofsensitivity and specificity in each system. The highest value for p0 is reached at theoptimum threshold (Taner and Antony, 2000). Then, the value of this pair must betransferred to data envelopment in order to be employed in the software.
DEADEA is mainly based on the earlier concept of Frontier Analysis (Farrell, 1957) and itbecame popular after it was first introduced in the article by Charnes et al. (1978). It hasbeen applied to banks, airlines, universities, hospitals, and so on (e.g., Chang et al.,2004). To employ this method, inputs are outputs of the system are determined bybrainstorming. The method assesses the relative efficiency scores of a particular set ofDMUs, which produce a variety of outputs by using several inputs. The number ofDMUs depends on the total number of inputs and outputs as follows:
Number of DMUs ¼ 2 number of inputs þ number of outputsð Þ:
The relative efficiency scores are calculated by solving linear programming models foreach DMU. These calculations take into account both the inputs and outputs byweighing and aggregating outputs divided by inputs in a way that results in a singlecomprehensive measure. The software results in efficiency scores where the bestperformance is given the efficiency score of 100 percent; and other performances areadjusted accordingly.
DEA aims to find DMUs that produce the highest levels of outputs by using thelowest levels of inputs. Therefore, it maximizes the ratio of weighted outputs toweighted inputs for the DMU under consideration. And this maximization objective issubject to the constraint that the same ratio for all DMUs be less than or equal to 1.
Full (100 percent) efficiency is attained by any DMU if and only if none of its inputsor outputs can be improved without worsening some of its other inputs or outputs. ADMU is to be rated as fully (100 percent) efficient on the basis of available evidence ifand only if the performances of other DMUs does not show that some of its inputs oroutputs can be improved without worsening some of its other inputs or outputs(Cooper et al., 2004).
An assessmentof diagnostic
efficiency
95
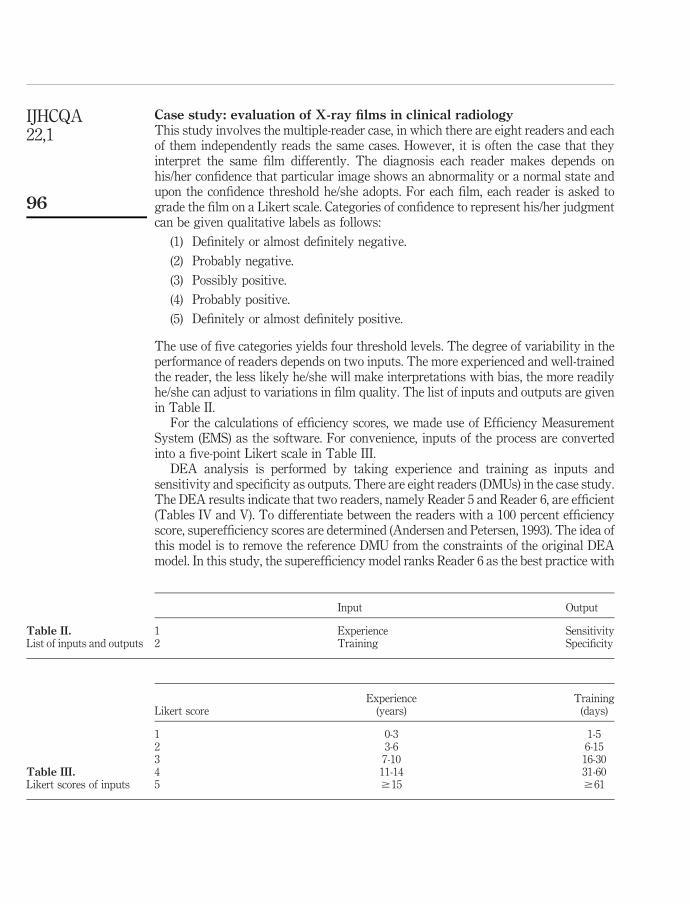
Case study: evaluation of X-ray films in clinical radiologyThis study involves the multiple-reader case, in which there are eight readers and eachof them independently reads the same cases. However, it is often the case that theyinterpret the same film differently. The diagnosis each reader makes depends onhis/her confidence that particular image shows an abnormality or a normal state andupon the confidence threshold he/she adopts. For each film, each reader is asked tograde the film on a Likert scale. Categories of confidence to represent his/her judgmentcan be given qualitative labels as follows:
(1) Definitely or almost definitely negative.
(2) Probably negative.
(3) Possibly positive.
(4) Probably positive.
(5) Definitely or almost definitely positive.
The use of five categories yields four threshold levels. The degree of variability in theperformance of readers depends on two inputs. The more experienced and well-trainedthe reader, the less likely he/she will make interpretations with bias, the more readilyhe/she can adjust to variations in film quality. The list of inputs and outputs are givenin Table II.
For the calculations of efficiency scores, we made use of Efficiency MeasurementSystem (EMS) as the software. For convenience, inputs of the process are convertedinto a five-point Likert scale in Table III.
DEA analysis is performed by taking experience and training as inputs andsensitivity and specificity as outputs. There are eight readers (DMUs) in the case study.The DEA results indicate that two readers, namely Reader 5 and Reader 6, are efficient(Tables IV and V). To differentiate between the readers with a 100 percent efficiencyscore, superefficiency scores are determined (Andersen and Petersen, 1993). The idea ofthis model is to remove the reference DMU from the constraints of the original DEAmodel. In this study, the superefficiency model ranks Reader 6 as the best practice with
Input Output
1 Experience Sensitivity2 Training Specificity
Table II.List of inputs and outputs
Experience TrainingLikert score (years) (days)
1 0-3 1-52 3-6 6-153 7-10 16-304 11-14 31-605 $15 $61
Table III.Likert scores of inputs
IJHCQA22,1
96
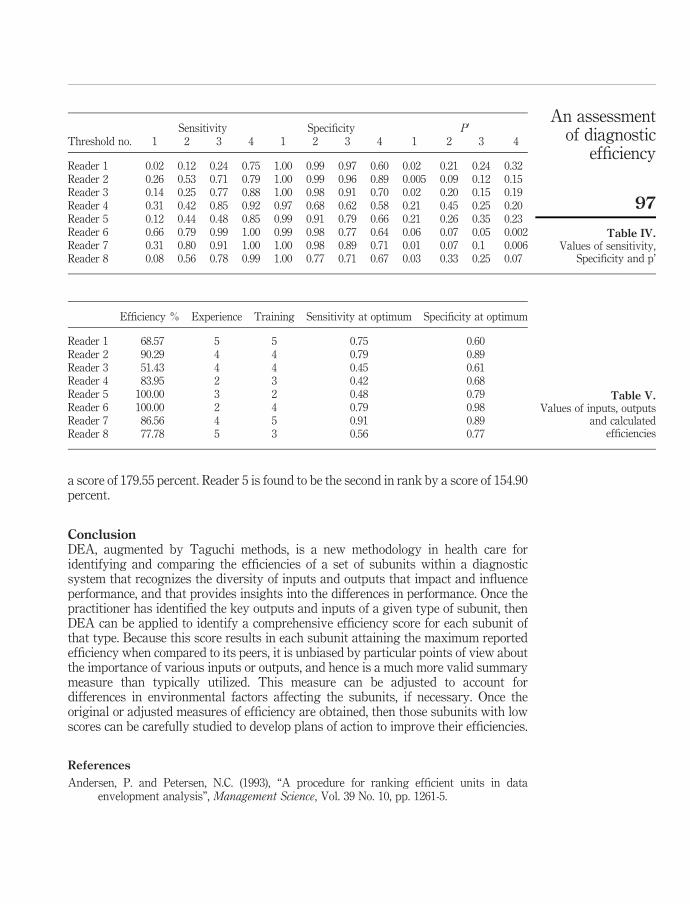
a score of 179.55 percent. Reader 5 is found to be the second in rank by a score of 154.90percent.
ConclusionDEA, augmented by Taguchi methods, is a new methodology in health care foridentifying and comparing the efficiencies of a set of subunits within a diagnosticsystem that recognizes the diversity of inputs and outputs that impact and influenceperformance, and that provides insights into the differences in performance. Once thepractitioner has identified the key outputs and inputs of a given type of subunit, thenDEA can be applied to identify a comprehensive efficiency score for each subunit ofthat type. Because this score results in each subunit attaining the maximum reportedefficiency when compared to its peers, it is unbiased by particular points of view aboutthe importance of various inputs or outputs, and hence is a much more valid summarymeasure than typically utilized. This measure can be adjusted to account fordifferences in environmental factors affecting the subunits, if necessary. Once theoriginal or adjusted measures of efficiency are obtained, then those subunits with lowscores can be carefully studied to develop plans of action to improve their efficiencies.
References
Andersen, P. and Petersen, N.C. (1993), “A procedure for ranking efficient units in dataenvelopment analysis”, Management Science, Vol. 39 No. 10, pp. 1261-5.
Sensitivity Specificity P0
Threshold no. 1 2 3 4 1 2 3 4 1 2 3 4
Reader 1 0.02 0.12 0.24 0.75 1.00 0.99 0.97 0.60 0.02 0.21 0.24 0.32Reader 2 0.26 0.53 0.71 0.79 1.00 0.99 0.96 0.89 0.005 0.09 0.12 0.15Reader 3 0.14 0.25 0.77 0.88 1.00 0.98 0.91 0.70 0.02 0.20 0.15 0.19Reader 4 0.31 0.42 0.85 0.92 0.97 0.68 0.62 0.58 0.21 0.45 0.25 0.20Reader 5 0.12 0.44 0.48 0.85 0.99 0.91 0.79 0.66 0.21 0.26 0.35 0.23Reader 6 0.66 0.79 0.99 1.00 0.99 0.98 0.77 0.64 0.06 0.07 0.05 0.002Reader 7 0.31 0.80 0.91 1.00 1.00 0.98 0.89 0.71 0.01 0.07 0.1 0.006Reader 8 0.08 0.56 0.78 0.99 1.00 0.77 0.71 0.67 0.03 0.33 0.25 0.07
Table IV.Values of sensitivity,
Specificity and p’
Efficiency % Experience Training Sensitivity at optimum Specificity at optimum
Reader 1 68.57 5 5 0.75 0.60Reader 2 90.29 4 4 0.79 0.89Reader 3 51.43 4 4 0.45 0.61Reader 4 83.95 2 3 0.42 0.68Reader 5 100.00 3 2 0.48 0.79Reader 6 100.00 2 4 0.79 0.98Reader 7 86.56 4 5 0.91 0.89Reader 8 77.78 5 3 0.56 0.77
Table V.Values of inputs, outputs
and calculatedefficiencies
An assessmentof diagnostic
efficiency
97

Chang, H., Chang, W.J., Das, S. and Li, S.H. (2004), “Health care regulation and the operatingefficiency of hospitals: evidence from Taiwan”, Journal of Accounting and Public Policy,Vol. 23 No. 6, pp. 483-510.
Charnes, A., Cooper, W.W. and Rhodes, E. (1978), “Measuring the efficiency of decision makingunits”, European Journal of Operational Research, Vol. 12 No. 6, pp. 429-44.
Cooper, W.W., Seiford, L.M. and Zhu, J. (2004), “Data envelopement analysis: models andinterpretations”, in Cooper, W.W., Seiford, L.M. and Zhu, J. (Eds), Handbook on DataEnvelopment Analysis, Kluwer Academic Publisher, Boston, MA, pp. 1-39, Ch. 1.
Farrell, M.J. (1957), “The measurement of productive efficiency”, Journal of Royal StatisticalSociety (A), Vol. 120 No. 3, pp. 253-81.
Taner, T. and Antony, J. (2000), “The assessment of quality in medical diagnostic tests: acomparison of ROC/Youden and Taguchi methods”, International Journal of Health CareQuality Assurance, Vol. 12 No. 7, pp. 300-7.
Corresponding authorMehmet Tolga Tanner can be contacted at: [email protected]
IJHCQA22,1
98
To purchase reprints of this article please e-mail: [email protected] visit our web site for further details: www.emeraldinsight.com/reprints