Embed Size (px)
Citation preview
An assessment of customer satisfaction in hotel industry in
Cambodia1
Veasna UNG2
CAS Discussion paper No 89
April 2013
1 This paper is largely based on my DBA thesis.
2 I would like to express my gratitude to Dr. Reth Soeng for his many valuable comments, from which the paper greatly benefits. Dr.
Veasna Ung is currently Chair of Faculty of Tourism and Hospitality, National University of Management, Phnom Penh, Cambodia. Email: [email protected]
Centre for ASEAN Studies Centre for International Management and Development Antwerp
cimda
1
Abstract
This paper analyses the factors that might influence hotel guest satisfaction in Cambodia’s hotel
industry. Using a sample of 608 respondents, it is found that hotel guests’ expectations are
greater than the perceived performance of hotels across all attributes of the dimensions. With
perceived performance scores of on average greater than 5 on the seven-point Likert scale, it
suggests that hotels’ guests generally rated hotels’ performance in terms of service quality
favorably although it remains below their expectations. The econometric results show that six
dimensions (tangibility, empathy, responsiveness, reliability, core hotel benefits, and assurance)
have a significant, positive impact on the overall satisfaction of hotel guests, with tangibility
dimension being the most important predictor of hotel guest satisfaction. The findings of the
study indicate that the five dimensions of SERVQUAL cannot be replicated fully to hotel
industry.
Keywords: Service Quality; Customer Satisfaction; Hotel Industry; Cambodia.
2
1. Introduction
Service sector has increasingly been considered as an important sector, making up the majority
of the economies, in particular those of advanced nations (Akbaba, 2006; Jensen, 2011; Petri et
al. 2012). The share of service sector contributing to output and employment is also growing,
which is confirmed by Soubbotina (2004). The rapid development of the service industries in the
21th century and the inevitable rise in competition between rival companies have resulted in an
increasing need for service providers to identify service quality gap in the market in order to
improve service provision, retain customers and create new customers. This encourages firms
to search for competitive advantages through placing more emphasis on the quality of their
products—either goods and/or services. Firms that achieve high levels of service quality tend to
realize high levels of customer satisfaction and sustainable competitive advantage (Guo et al.,
2008).
Quality service has contributed significantly to firms’ market shares, greater return on
investment, lower production costs (Mueller and Bedwell, 1993; Phillips et al., 1983; Reichheld
and Sasser, 1990), higher profitability (Gundersen et al., 1996) and customer satisfaction
(Oliver, 1997). Providing quality service improves satisfaction of customers and this is believed
to lead to the increased customer loyalty to the firm, repeat purchases of the same products,
and long-term relationship commitment. Service quality has become an important research topic
because of its perceived relationship to costs (Crosby, 1984), customer satisfaction (Bolton and
Drew, 1991), customer retention and positive word-of-mouth communications (Reichheld and
Sasser, 1990).
Moreover, highly satisfied customers also help to spread the positive word-of-mouth
recommendations and in effect become walking, talking advertisements for providers whose
service has pleased them, thus lowering the cost of attracting new customers. Satisfied
customers tend to buy more, to be less price conscious, and to generate the positive word-of-
mouth recommendations, thus contributing to profit (Anderson and Mittal, 2000). On the
contrary, highly dissatisfied customers spread a faster negative word-of-mouth.
Currently, successful hotel management is experiencing the increased competitive pressures as
a consequence of the combined effect of the globalization, economic-political integration
tendencies, consolidation, and growing supply in emerging and mature tourist destinations, and
actually local small and medium-size enterprise cannot escape from facing this competitive
pressure (Kutter, 2007). Therefore, hotels have to strive to deliver to their guests with quality
products and services. Hotels that provide superior service quality are likely to be successful in
enhancing guest satisfaction and loyalty. So quality and customer satisfaction are the
cornerstone for success in any business, and are perceived as key factors in acquiring and
sustaining competitive advantage, retaining the existing customers and attracting the new ones,
3
creating long term profitability as well as improving living standard of employees in
organizations.
Service quality is conceptualized and measured by a number of models. Among these
numerous methods, the most widely used generic measure of service quality is probably the
SERVQUAL model initially developed by Parasuraman et al. (1985) and later further refined by
Parasuraman et al. (1988). Some authors have used the augmented SERVQUAL technology by
incorporating other relevant dimensions such as core benefits and technologies (Ransaran-
Fowder, 2007). Since its inception, the SERVQUAL model has been widely used in a large
variety of service sectors, including hotel industry. Recent published studies on hotel sector
have been carried out for many developing and developed countries, which include, among
others, Malaysia (Mola and Jusoh, 2011; Huei and Easvaralingam, 2011; Fah and Kandasamy,
2011); Ghana (Appaw-Agbola and AfenyoDehlor, 2011); Scotland (Briggs et al., 2007); Pakistan
(Malik et al., 2011; Abbasi et al., 2010; Naseem et al., 2011) and Jordan (Al khattab and
Aldehayyat, 2011; Al-Rousan et al., 2010).
The purpose of the current study is to examine the impact of SERVQUAL dimensions on hotel
guest satisfaction in the Cambodia’s hotel industry. Specifically, the objective of this study is to
measure and evaluate the service quality in the hotel industry, using the gap analysis and
multiple regression analysis. The study also investigates the factors that contribute most
significantly to guest satisfaction in the industry. A good understanding of these determining
factors is critically important for the industry’s managers in developing an effective strategy to
improve hotel guest satisfaction. Research questions thus need to be formally formulated, and
vigorous analysis are required to systematically answer the questions before any sound
managerial implications can be provided.
2. Review of related literature
Service quality has been increasingly recognized as a critical factor in the success of any
business (Parasuraman et al., 1985, 1988). Recently literature documents a number of methods
used to measure service quality. However, the most well-known one is probably SERVQUAL
technology, which is based on multiple dimensions (Parasuramanet al., 1985), thanks to its
broad applicability in many service settings. The SERVQUAL initiated by Parasuraman et al.
(1985) identified ten potentially overlapping components. These dimensions are reliability,
responsiveness, competence, access, courtesy, credibility, security, understanding or knowing
the customer, and tangibles. In their later studies, Parasuraman et al. (1988, 1990) reduced the
original ten potentially overlapping dimensions to five testable dimensions. The five widely used
dimensions include tangibles (referring to physical facilities, appearance of personnel and
equipment); reliability (referring to the ability to perform the promised service dependably and
accurately); responsiveness (referring to the willingness to help customers and provide prompt
service); assurance (referring to the knowledge and courtesy of employees and their ability to
4
convey trust and confidence); and empathy (referring to the provision of caring, and
personalized individual attention given to customers).
The SERVQUAL model, however, suffers from some criticisms on the theoretical and operational
grounds, in particular operationalization of expectations, reliability of instruments’ difference score
formulation and scale’s dimensionality across industrial settings (Sureshchandar et al., 2001;
Baumann et al., 2007). In light of these criticisms, Buttle (1996) provides some future research
directions; one of which is to continue to investigate the relationships among service quality,
customer satisfaction, buying behavior, customer retention, behavioral intention, word-of-mouth
communications and market share. Yet, despite SERVQUAL model being criticized, its core
content remains unchanged and has been used for studies of service-providing business
organizations in many countries. SERVQUAL model is also found to be superior in the
measurement of service quality in developing economy (Angur et al., 1999). Parasuraman et al.
(1990) claim that, with appropriate adaptation of the SERVQUAL model, it can be used in a
wide range of service settings to ascertain the quality of service provided (Dhurup and
Mohamane, 2007). Specifically, the SERVQUAL model has been used to evaluate service
quality provided by hotel industry (Saleh and Ryan, 1991; Ramsaran-Fowdar, 2006). Similarly,
Nyeck et al. (2002) indicate that SERVQUAL remains the most complete attempt to conceptualize
and measure service quality.
In highly competitive industries, customer satisfaction has a positive impact on firms’ profitability
(Abbasi et al., 2010) and is essential for retaining customers (Clow and Vorhies, 1993; Oliver,
1989). This is valid for the hotel industry (Bowen and Shoemaker, 1998; Pizam and Ellis, 1999),
and more generally in the broader service industry environment (Zeithaml et al., 1996). Many
researchers come to a conclusion there are linkages between service quality and customer
satisfaction (Spreng and MacKoy 1996; Buttle, 1996; Caruana, 2002; Cronin et al., 2000), and
between customer satisfaction and consumer loyalty (Bloemer and Kasper, 1995; Buttle, 1996),
and between customer satisfaction and purchasing intentions (Cronin and Taylor 1992;
Woodside et al., 1989).
In her study of hotel industry in Mauritius, Ramsaran-Fowdar (2007) incorporated two additional
dimensions, core benefits and hotel technologies, to those of SERVQUAL model. Ramsaran-
Fowdar’s results suggest that the five conventional dimensions of SERVQUAL technology
cannot be fully replicated to hotel industry. Additional dimensions, such as hotel core benefits
(including comfortable, relaxed and welcome feeling; quietness of rooms; security and safety,
etc.) and hotel technologies (including access to telephone, computers with internet connection,
televisions, email, wake-up system, etc.) are also shown to be important attributes that hotel
guests use to evaluate hotel service in Mauritius. Service quality in the hotel industry has also
been examined in a number of studies (Briggs et al., 2007; Mola and Jusoh, 2011; Appaw-
Agbola and AfenyoDehlor, 2011; Huei and Easvaralingam, 2011).
5
In a more recent study by Fah and Kandasamy (2011) to determine the dimensions of service
quality in Malaysia, they find that service dimension of tangibility carries the heaviest weight in
explaining customer satisfaction, followed by responsiveness, empathy, reliability and
assurance. For Pakistan’s hotel sector, Malik et al. (2011) finds that hotel tangibles, empathy
and reliability dimensions are found to be the significant predictors of overall customer
satisfaction and brand loyalty, with tangible dimension making the most contribution. Similarly,
Al khattab and Aldehayyat (2011) find for hotel sector in Jordan that service dimensions of
reliability, responsiveness and assurance are found to positively impact upon customer
satisfaction.
3. Research methodology
3.1 Data collection and instrument
To evaluate service quality in the Cambodian hotel industry, a questionnaire is designed and
distributed randomly to target respondents, who are staying a hotel in the capital city of Phnom
Penh and the provinces of Siem Reap and Preah Sihanouk, which are attractive to tourists. In
order to receive the most accurate responses possible, for Cambodian respondents the
questionnaires were translated into Khmer, the official language of Cambodia. The
questionnaire includes the five widely-used dimensions (tangibility, reliability, responsiveness,
assurance, and empathy) and two additional dimensions of service quality (hotel core hotel
benefits and hotel technologies), following Ramsaran-Fowdar (2007).
The questionnaire is classified into four major parts. The first part of the questionnaire contains
respondents’ perceived performance of their hotels. In the second part, questions were asked to
obtain respondents’ expectations of their hotels. The third part captures the information related
to overall satisfaction. Respondents were asked to respond to each item on the widely used
seven-point Likert scale, ranging from 7 being extremely satisfied to 1 representing extremely
dissatisfied. The scale is often used for measuring satisfaction and other related-satisfaction
variables (Marinkovic at al., 2011). The final part of the questionnaire is used to get the
information on the socio-demographic information of the respondents.
In order to produce the best possible estimates, the collection of a reasonably large data set
has to be made from the population. Roscoe (1975) suggests a series of general rules in
determining the acceptable sample size for research, and proposes that, for any research
intending to conduct a multiple regression analysis, a sample size should be 10 times as large
as that of the number of variables. This research is to assess service quality through satisfaction
of guests who recently stayed or are staying in the hotel of price from US$20 to US$100 per
night. 1500 questionnaires were randomly distributed to hotel guests in Phnom Penh city and
the provinces of Siem Reap and Preah Sihanouk. It took around eight months to complete the
6
data collection and the rate of the responses was about 41 percent. Following cleaning process
of the data, a sample of 608 respondents is considered usable for the analysis.
3.2 Analytical methods
The statistical analysis of data consists of descriptive statistics, gap analysis and multivariate
data analysis and other necessary testing in order to avoid reporting misleading results.
Reliability and consistency analysis, using Cronbach’s alpha coefficient values, is to be carried
out to test for the internal consistency of each of the perception and expectation attributes. It is
generally agreed that Cronbach’s alpha coefficients should exceed 0.70 to be internally
consistent and reliable (Nunnally, 1967; Hair et al., 2010).
Since data set used is cross-sectional data, heteroskedasticity is often present in such a data
set. Therefore, the OLS estimator is no longer the best linear unbiased estimator and the t-
statistic is not t-distributed. Likewise, F-statistic is no longer F-distributed. Before presenting
econometric results, we carry out several tests, such as those for multicollinearity, based on
variance inflation factor (VIF), and heteroskedasticity.
There are a number of tests for heteroskedasticity (Wooldridge, 2006): the Breusch and Pagan
(1979) test for heteroskedasticity (Verbeek, 2004; Wooldridge, 2006); the general White test for
heteroskedasticity, which suffers from a weakness in the pure form of the test because it
employs many degrees of freedom (Soeng, 2008); and the special White test for
heteroskedasticity. In order to save degrees of freedom, the special White test for
heteroskedasticity is used in the current paper, which incorporates the Breusch-Pagan and the
general White tests. The special White test suggests testing for heteroskedasticity by estimating
the OLS squared residuals on fitted values and squared fitted values. Under the null hypothesis,
the LM statistic for the special White test is χ² distributed with two degrees of freedom,
regardless of the number of independent variables in the model (Soeng, 2008). This is why the
special White test for heteroskedasticity is to be preferred. The multicollinearity check is made
through values of variance inflation factor (VIF). In order to obtain stable estimated slope
parameters, VIF should be lower than five (Studenmund, 2006).
3.3 The Model
Service quality is the customer’s judgment about the service delivered by a service-providing
firm. As cited by Su (2004), service quality is defined as the degree and direction of discrepancy
between a customer’s perceptions and expectations, while perceived service quality is the gap
between a customer’s expectations and perceptions (Parasuraman et al., 1985). In light of
discussion in the review of related literature, following among others Ramsaran-Fowder (2007),
Jamal and Anastasiadou (2009) and Marinkovic et al. (2011) the relationship between service
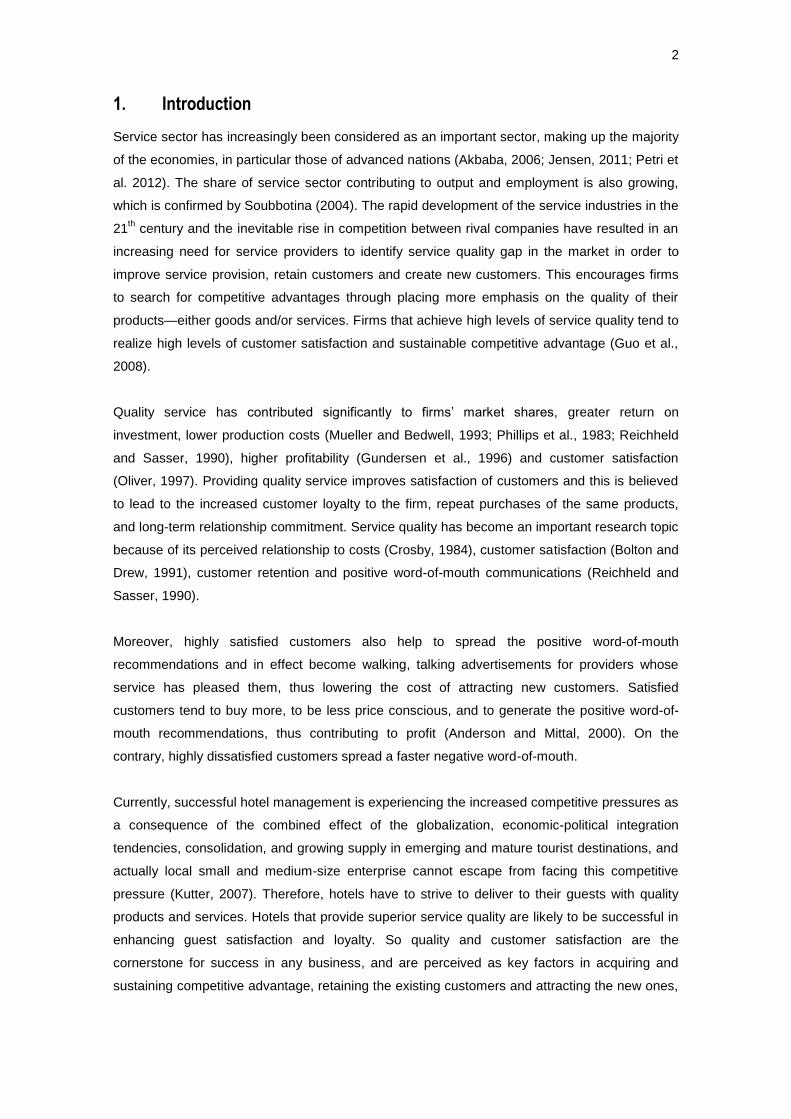
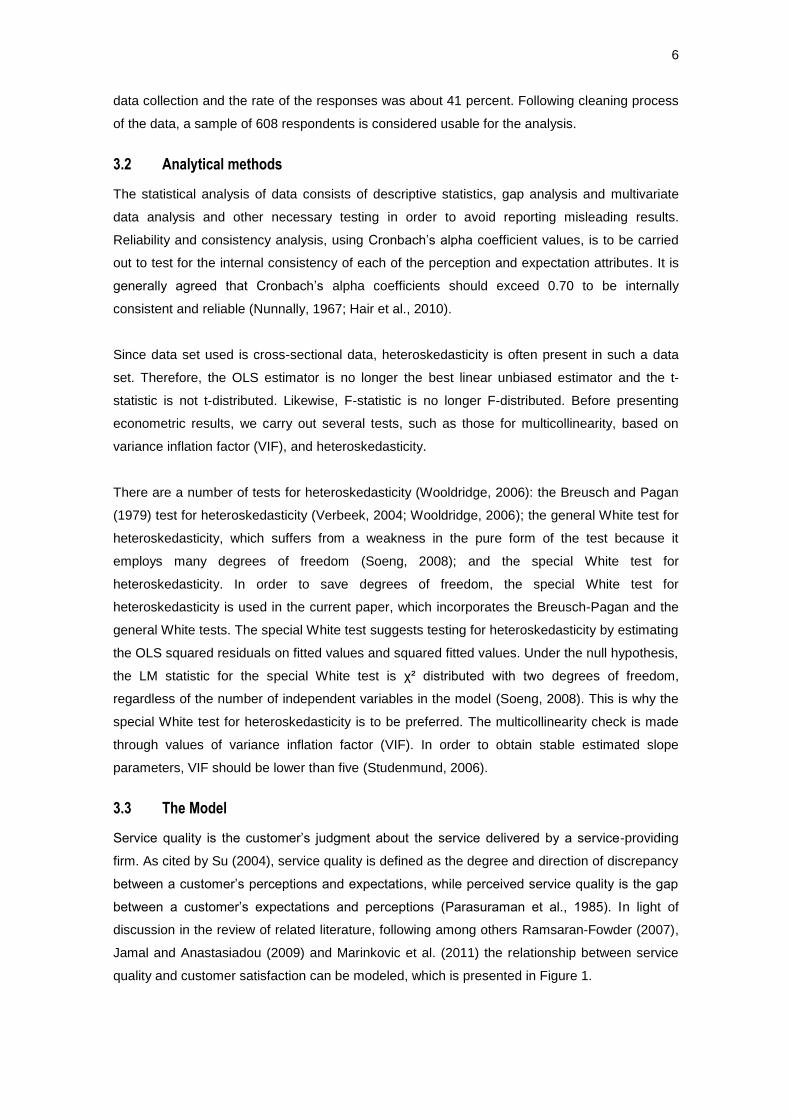
quality and customer satisfaction can be modeled, which is presented in Figure 1.
7
Figure 1: Proposed Research Model
4. Empirical results and discussion
4.1 Basic statistics
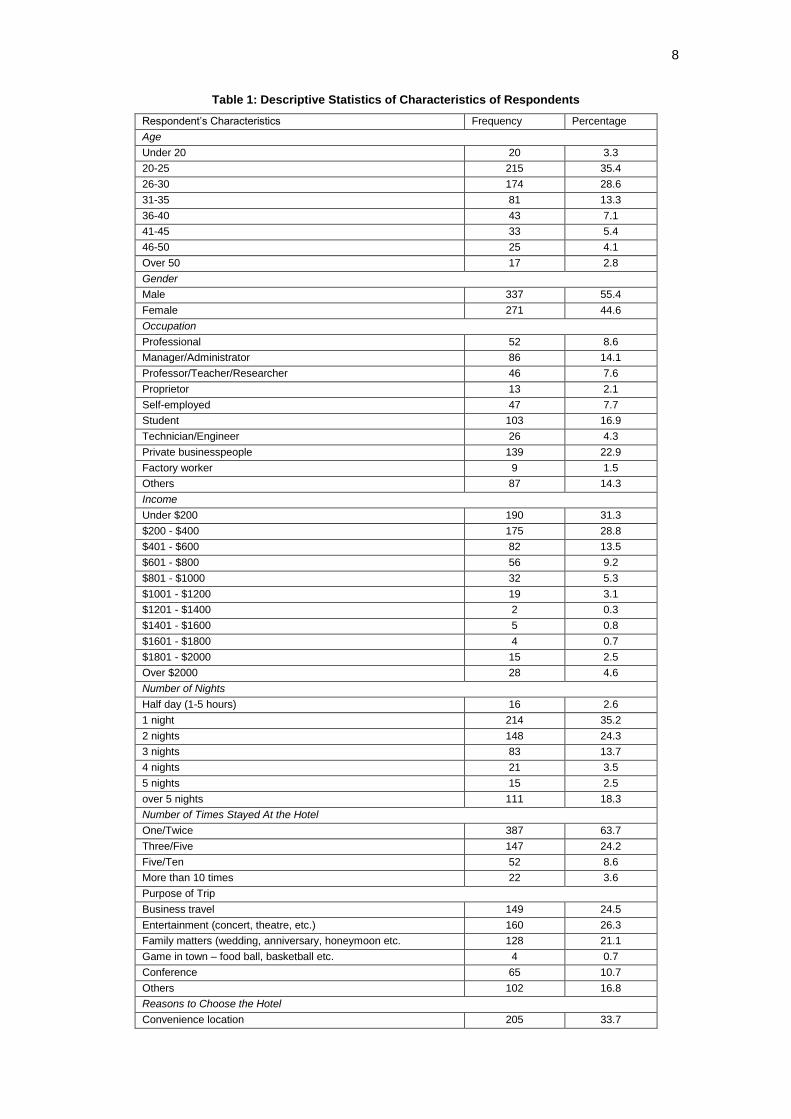
The profile of respondents is presented in Table 1. A broad range of age group was
represented, with 35.4% of the sample aged between 20 and 25. Of the 608 respondents,
almost 55.4% were male and 22.9%of respondents were private businesspeople. Around 31.3%
of the respondents reported that they have relatively low income of less than US$ 200 per
month. This is not surprising as almost all visitors are Cambodians. Over 35.2% and 63.7% of
respondents said they were staying hotel one night and used to stay at the hotel in the past
years. More than 26.3% and 33.7% were on holidays and for reason of convenience,
respectively. Nearly 17.6% of guests afford to expend up to US$ 30 per night at hotel.
Assurance
Responsiveness
Tangibility
Reliability
Core Hotel
Benefits
Empathy
Guest
Satisfaction
Service Quality
(augmented
SERVQUAL)
Dimensions
in hotel
Hotel
Technologies
8
Table 1: Descriptive Statistics of Characteristics of Respondents
Respondent’s Characteristics Frequency Percentage
Age
Under 20 20 3.3
20-25 215 35.4
26-30 174 28.6
31-35 81 13.3
36-40 43 7.1
41-45 33 5.4
46-50 25 4.1
Over 50 17 2.8
Gender
Male 337 55.4
Female 271 44.6
Occupation
Professional 52 8.6
Manager/Administrator 86 14.1
Professor/Teacher/Researcher 46 7.6
Proprietor 13 2.1
Self-employed 47 7.7
Student 103 16.9
Technician/Engineer 26 4.3
Private businesspeople 139 22.9
Factory worker 9 1.5
Others 87 14.3
Income
Under $200 190 31.3
$200 - $400 175 28.8
$401 - $600 82 13.5
$601 - $800 56 9.2
$801 - $1000 32 5.3
$1001 - $1200 19 3.1
$1201 - $1400 2 0.3
$1401 - $1600 5 0.8
$1601 - $1800 4 0.7
$1801 - $2000 15 2.5
Over $2000 28 4.6
Number of Nights
Half day (1-5 hours) 16 2.6
1 night 214 35.2
2 nights 148 24.3
3 nights 83 13.7
4 nights 21 3.5
5 nights 15 2.5
over 5 nights 111 18.3
Number of Times Stayed At the Hotel
One/Twice 387 63.7
Three/Five 147 24.2
Five/Ten 52 8.6
More than 10 times 22 3.6
Purpose of Trip
Business travel 149 24.5
Entertainment (concert, theatre, etc.) 160 26.3
Family matters (wedding, anniversary, honeymoon etc. 128 21.1
Game in town – food ball, basketball etc. 4 0.7
Conference 65 10.7
Others 102 16.8
Reasons to Choose the Hotel
Convenience location 205 33.7
9
Company contract with hotel 95 15.6
Excellent service 141 23.2
Reasonable room rate 114 18.8
Others 53 8.7
Hotel Rate Per Day Stay (US$)
20 63 10.4
25 68 11.2
30 107 17.6
35 38 6.3
40 76 12.5
45 21 3.5
50 78 12.8
55 4 0.7
60 30 4.9
65 4 0.7
70 15 2.5
75 8 1.3
80 24 3.9
85 3 0.5
90 9 1.5
95 4 0.7
100 56 9.2
Total 608 100
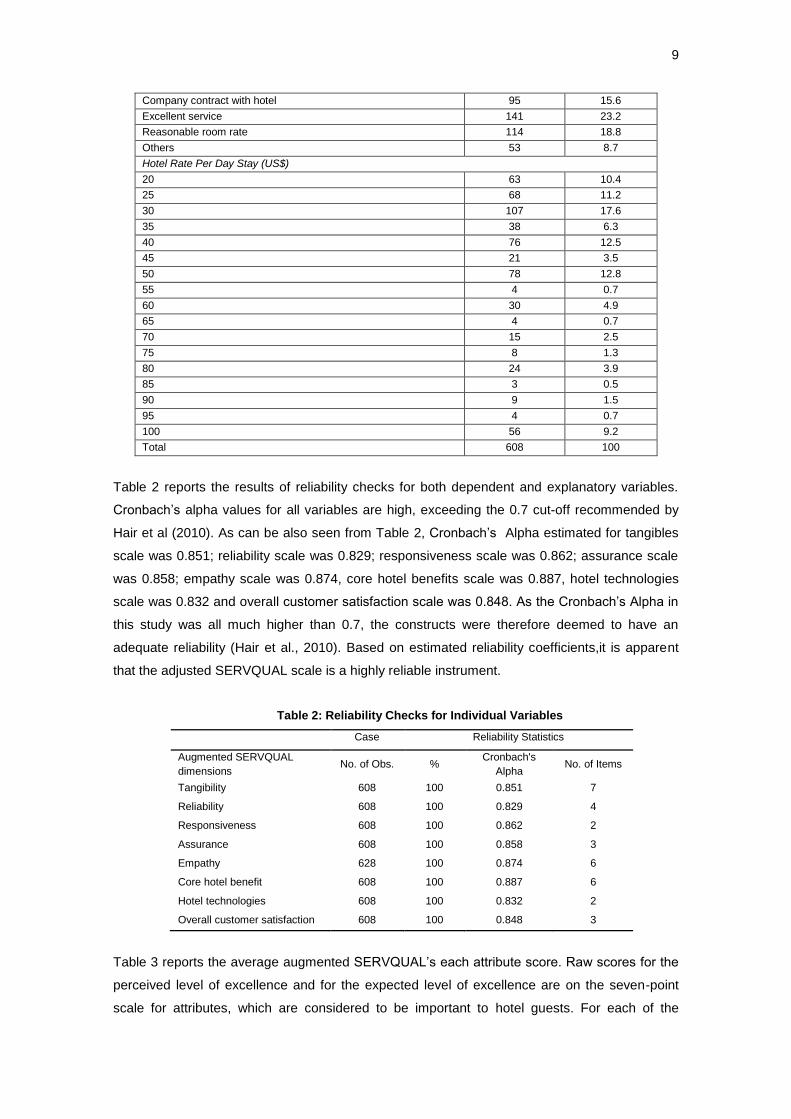
Table 2 reports the results of reliability checks for both dependent and explanatory variables.
Cronbach’s alpha values for all variables are high, exceeding the 0.7 cut-off recommended by
Hair et al (2010). As can be also seen from Table 2, Cronbach’s Alpha estimated for tangibles
scale was 0.851; reliability scale was 0.829; responsiveness scale was 0.862; assurance scale
was 0.858; empathy scale was 0.874, core hotel benefits scale was 0.887, hotel technologies
scale was 0.832 and overall customer satisfaction scale was 0.848. As the Cronbach’s Alpha in
this study was all much higher than 0.7, the constructs were therefore deemed to have an
adequate reliability (Hair et al., 2010). Based on estimated reliability coefficients,it is apparent
that the adjusted SERVQUAL scale is a highly reliable instrument.
Table 2: Reliability Checks for Individual Variables
Case Reliability Statistics
Augmented SERVQUAL
dimensions No. of Obs. %
Cronbach's
Alpha No. of Items
Tangibility 608 100 0.851 7
Reliability 608 100 0.829 4
Responsiveness 608 100 0.862 2
Assurance 608 100 0.858 3
Empathy 628 100 0.874 6
Core hotel benefit 608 100 0.887 6
Hotel technologies 608 100 0.832 2
Overall customer satisfaction 608 100 0.848 3
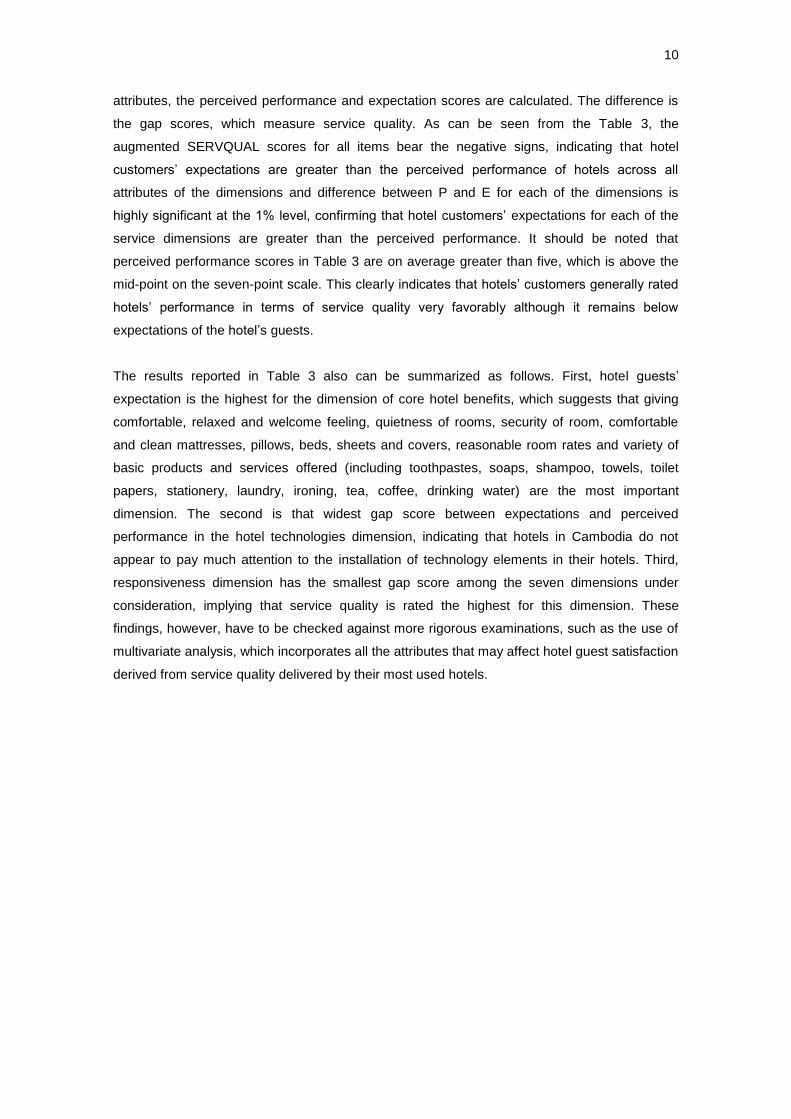
Table 3 reports the average augmented SERVQUAL’s each attribute score. Raw scores for the
perceived level of excellence and for the expected level of excellence are on the seven-point
scale for attributes, which are considered to be important to hotel guests. For each of the
10
attributes, the perceived performance and expectation scores are calculated. The difference is
the gap scores, which measure service quality. As can be seen from the Table 3, the
augmented SERVQUAL scores for all items bear the negative signs, indicating that hotel
customers’ expectations are greater than the perceived performance of hotels across all
attributes of the dimensions and difference between P and E for each of the dimensions is
highly significant at the 1% level, confirming that hotel customers’ expectations for each of the
service dimensions are greater than the perceived performance. It should be noted that
perceived performance scores in Table 3 are on average greater than five, which is above the
mid-point on the seven-point scale. This clearly indicates that hotels’ customers generally rated
hotels’ performance in terms of service quality very favorably although it remains below
expectations of the hotel’s guests.
The results reported in Table 3 also can be summarized as follows. First, hotel guests’
expectation is the highest for the dimension of core hotel benefits, which suggests that giving
comfortable, relaxed and welcome feeling, quietness of rooms, security of room, comfortable
and clean mattresses, pillows, beds, sheets and covers, reasonable room rates and variety of
basic products and services offered (including toothpastes, soaps, shampoo, towels, toilet
papers, stationery, laundry, ironing, tea, coffee, drinking water) are the most important
dimension. The second is that widest gap score between expectations and perceived
performance in the hotel technologies dimension, indicating that hotels in Cambodia do not
appear to pay much attention to the installation of technology elements in their hotels. Third,
responsiveness dimension has the smallest gap score among the seven dimensions under
consideration, implying that service quality is rated the highest for this dimension. These
findings, however, have to be checked against more rigorous examinations, such as the use of
multivariate analysis, which incorporates all the attributes that may affect hotel guest satisfaction
derived from service quality delivered by their most used hotels.
11
Table 3: Average augmented SERVQUAL Scores of Hotel Guests in Cambodia
Dimension items Perception
Score (P)
Expectation
Score (E)
Gap Score
(P - E)
Tangibility
Appealing interior and exterior hotel
decor 5.23 5.40 -0.17
Spaciousness of rooms 5.22 5.56 -0.34
Hygienic bathrooms and toilets 5.56 5.82 -0.26
Convenience hotel location 5.50 5.65 -0.15
Neat and professional appearance of
staff 5.26 5.47 -0.21
Visually appealing brochures,
pamphlets 4.88 4.97 -0.09
Image of the hotel 5.11 5.32 -0.21
Mean 5.29 5.45 -0.16***
Reliability
Performing the services at the time
promised 5.40 5.57 -0.17
Hotel has experienced staff 5.27 5.48 -0.21
Accurate information about hotel
services 5.50 5.66 -0.16
Timely housekeeping services 5.43 5.48 -0.05
Mean 5.40 5.55 -.115***
Responsiveness
Willingness of staff to provide help
promptly 5.35 5.50 -0.15
Availability of staff to provide service 5.43 5.50 -0.07
Mean 5.39 5.50 -0.11***
Assurances
Friendliness of staff 5.54 5.49 -0.05
Courteous employees 5.34 5.61 -0.27
Ability of staff to instill confidence into
customers 5.35 5.56 -0.21
Mean 5.43 5.57 -0.14***
Empathy
Availability of room service 5.27 5.56 -0.29
Giving special attention to the
customer 5.06 5.12 -0.06
Recognizing the hotel customer 5.26 5.50 -0.24
Understanding the customer's
requirements and needs 5.26 5.58 -0.32
Listening carefully to complaints 5.34 5.66 -0.32
Hotel to have customers' best interest
at heart 5.34 5.52 -0.18
Mean 5.25 5.49 -0.24***
Core Hotel
Benefits
Comfortable, relaxed and welcome
feeling 5.54 5.76 -0.22
Quietness of rooms 5.59 5.62 -0.03
Security of rooms 5.75 5.97 -0.22
Comfortable and clean mattresses,
pillows, beds, sheets and covers 5.77 5.88
-0.11
Reasonable room rates 5.41 5.63 -0.22
Variety of basic products and services
offered (toothpaste, soap, shampoo,
towel, toilet paper, stationery, laundry,
ironing, tea, coffee, drinking water)
5.60 5.62 -0.02
Mean 5.61 5.75 -0.14***
Hotel
technologies
In-room technologies (telephone,
voicemail, TV, internet plug, meal
ordering, email, wake-up system)
5.06 5.34 -0.28
Hotel technologies(online reservation,
email, internet, fax, international calling
facilities, hotel website, direct hotel
email, computerized feedback form,
special promotions on hotel website,
acceptance of credit and debit cards)
5.10 5.38 -0.28
Mean 5.08 5.36 -0.28***
Overall Guest Satisfaction 5.36 5.54 -0.18
Note: *** denotes statistical significance at the 1% significance level.
12
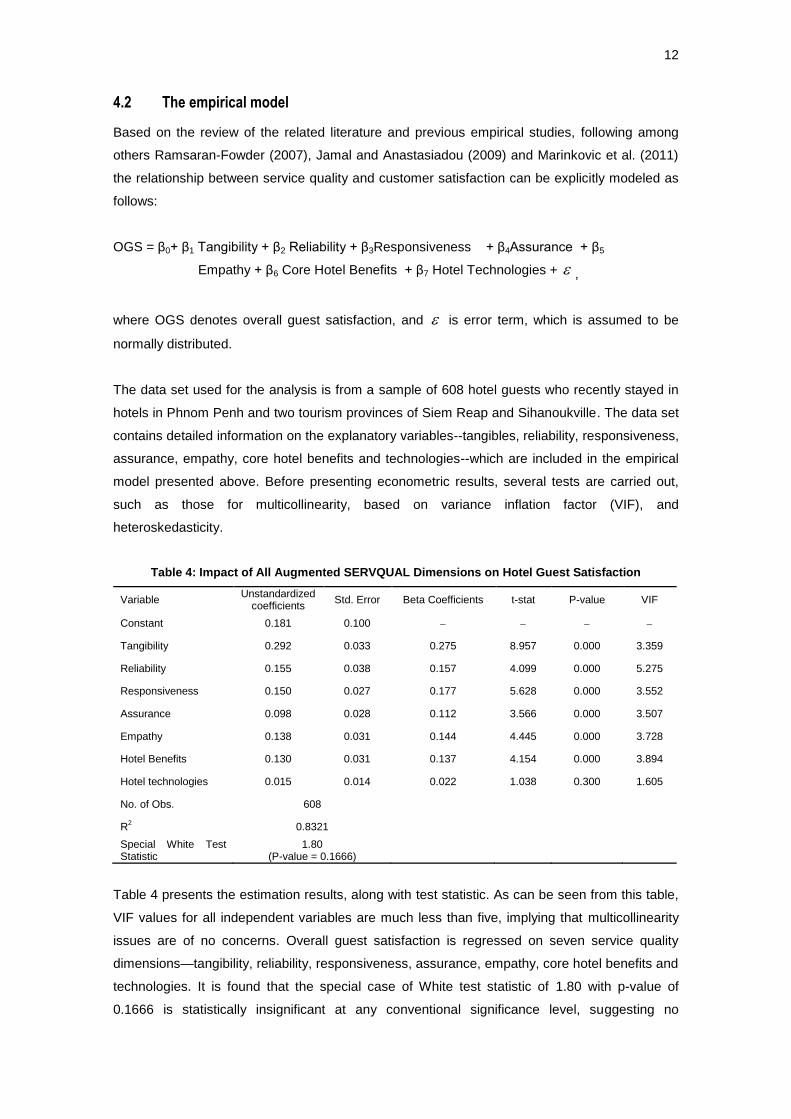
4.2 The empirical model
Based on the review of the related literature and previous empirical studies, following among
others Ramsaran-Fowder (2007), Jamal and Anastasiadou (2009) and Marinkovic et al. (2011)
the relationship between service quality and customer satisfaction can be explicitly modeled as
follows:
OGS = β0+ β1 Tangibility + β2 Reliability + β3Responsiveness + β4Assurance + β5
Empathy + β6 Core Hotel Benefits + β7 Hotel Technologies + ,
where OGS denotes overall guest satisfaction, and is error term, which is assumed to be
normally distributed.
The data set used for the analysis is from a sample of 608 hotel guests who recently stayed in
hotels in Phnom Penh and two tourism provinces of Siem Reap and Sihanoukville. The data set
contains detailed information on the explanatory variables--tangibles, reliability, responsiveness,
assurance, empathy, core hotel benefits and technologies--which are included in the empirical
model presented above. Before presenting econometric results, several tests are carried out,
such as those for multicollinearity, based on variance inflation factor (VIF), and
heteroskedasticity.
Table 4: Impact of All Augmented SERVQUAL Dimensions on Hotel Guest Satisfaction
Variable Unstandardized
coefficients Std. Error Beta Coefficients t-stat P-value VIF
Constant 0.181 0.100
Tangibility 0.292 0.033 0.275 8.957 0.000 3.359
Reliability 0.155 0.038 0.157 4.099 0.000 5.275
Responsiveness 0.150 0.027 0.177 5.628 0.000 3.552
Assurance 0.098 0.028 0.112 3.566 0.000 3.507
Empathy 0.138 0.031 0.144 4.445 0.000 3.728
Hotel Benefits 0.130 0.031 0.137 4.154 0.000 3.894
Hotel technologies 0.015 0.014 0.022 1.038 0.300 1.605
No. of Obs. 608
R2 0.8321
Special White Test Statistic
1.80 (P-value = 0.1666)
Table 4 presents the estimation results, along with test statistic. As can be seen from this table,
VIF values for all independent variables are much less than five, implying that multicollinearity
issues are of no concerns. Overall guest satisfaction is regressed on seven service quality
dimensions—tangibility, reliability, responsiveness, assurance, empathy, core hotel benefits and
technologies. It is found that the special case of White test statistic of 1.80 with p-value of
0.1666 is statistically insignificant at any conventional significance level, suggesting no
13
heteroskedasticity in the data set. The seven dimensions explain 83.21 per cent of the variation
of the overall guest satisfaction, which is statistically significant at less 1% significance level (F-
value = 424.91 and P-value < 0.001).
To identify which dimensions of service quality contribute most significantly to the overall
customer satisfaction, a regression using z-scores is run to obtain standardized coefficients or
beta coefficients. The use of a regression with standardized coefficients has an advantage over
that with the unstandardized or OLS coefficients in that, in the former, the explanatory variables
are put on an equal footing (Wooldridge, 2006). Therefore, explanatory variables with higher
standardized coefficients contribute more significantly to the dependent variable. The estimation
results suggest that the regression model is statistically significant and that the seven service
quality dimensions exert a positive effect on the overall guest satisfaction, except hotel
technologies dimension which lacks statistical significance (Table 4), which is in line with
Ramsaran-Fowdar (2006). The highest estimated standardized coefficient on tangibility
dimension of 0.275implies that the dimension makes the greatest contribution to hotel
satisfaction, followed by the service quality dimensions of responsiveness (0.177), reliability
(0.157), empathy (0.144), hotel benefits (0.137) and assurance (0.112). These findings indicate
that tangibility has been the most important predictor of overall hotel guest satisfaction in the
Cambodia’s hotel industry.
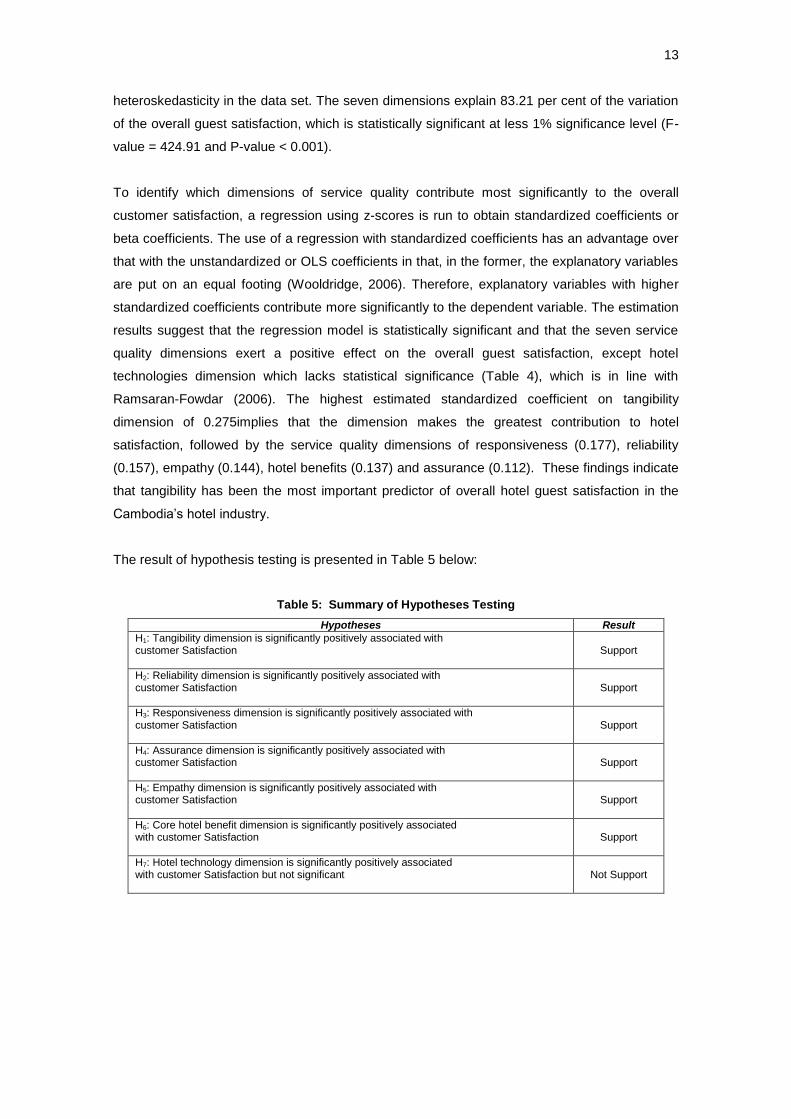
The result of hypothesis testing is presented in Table 5 below:
Table 5: Summary of Hypotheses Testing
Hypotheses Result
H1: Tangibility dimension is significantly positively associated with customer Satisfaction
Support
H2: Reliability dimension is significantly positively associated with customer Satisfaction
Support
H3: Responsiveness dimension is significantly positively associated with customer Satisfaction
Support
H4: Assurance dimension is significantly positively associated with customer Satisfaction
Support
H5: Empathy dimension is significantly positively associated with customer Satisfaction
Support
H6: Core hotel benefit dimension is significantly positively associated with customer Satisfaction
Support
H7: Hotel technology dimension is significantly positively associated with customer Satisfaction but not significant
Not Support
14
5. Conclusion and implications
The current study started out with detailed descriptions of service quality dimensions of
augmented SERVQUAL model and addressed the research questions with respect to service
dimensions that may influence hotel guest satisfaction in Cambodia’s hotel industry. It also
seeks to identify the dimensions that contribute most significantly to overall guest satisfaction.
The purposes of the study are to identify the relationship between SERVQUAL dimension
attributes and the overall satisfaction of tourists who recently stayed in hotels in three major
tourist attractions of Phnom Penh and the provinces of Preah Sihanouk and Siem Reap. Survey
questionnaires were distributed randomly to 1500 respondents; but after rounds of verification
only 608 are usable.
In order to measure service quality of hotels, gap analysis is undertaken to compare hotel
guests’ expectations with the perceived performance. The difference is the measurement of
service quality, and t-test was performed to determine the statistical, significant difference
between the two. The scores for all items bear the negative signs, indicating that hotel guests’
expectations are greater than the perceived performance of hotels across all attributes of the
seven dimensions.
Using multiple regression analysis, the study shows that six dimensions (tangibility, empathy,
responsiveness, reliability, core hotel benefits, and assurance) have a significant, positive
impact on the overall satisfaction of hotel guests, with tangibility dimension being the most
important predictor of hotel guest satisfaction. This result emphasizes the importance of
tangibility dimension, which is consistent with the findings of Fah and Kandasamy (2011) for
Malaysia and Al-Rousan and Badaruddin (2010) for Jordan, who report that tangibility
dimension is the most important antecedents that trigger guest satisfaction. The findings of the
study indicate that the five dimensions of SERVQUAL cannot be replicated fully to hotel
industry. Another dimension, core benefits, is of equal importance. The results present a
number of managerial implications and recommendations for hotel management, while
contributing to the improvements of the SERVQUAL model, with application to hotel industry in
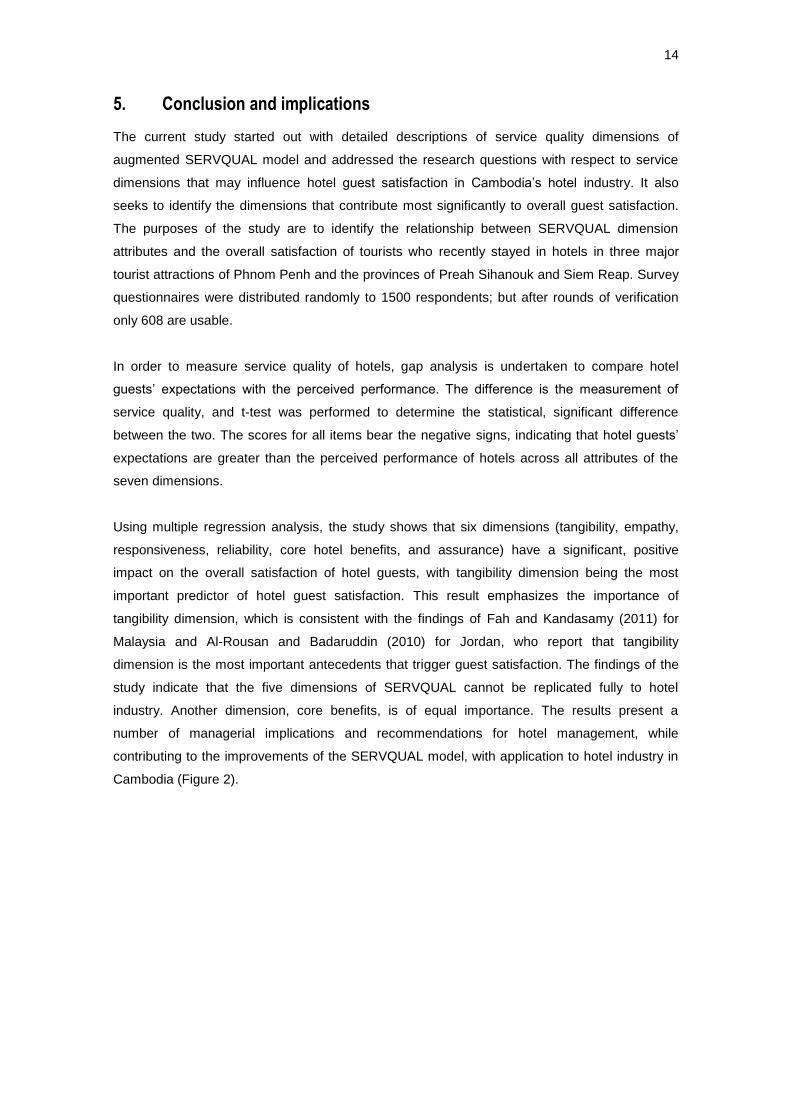
Cambodia (Figure 2).
15
Figure 2: Effects of service quality dimensions on guest satisfaction, revisit intention,
and word-of-month recommendations.
.
While special attention should be paid to the most important trigger of hotel guest satisfaction,
hotel management should also place an emphasis other significant predictors such as empathy
(giving special attention to the customer, availability of room service, understanding the
customer’s requirement, listening carefully to complaints of hotel guests and hotels have to
regard the customers who are best interested at heart); responsiveness (willingness of staff to
provide help promptly to guests and availability of staff to provide service perfectly); core hotel
benefits (providing comfortable, relaxed and welcome feeling to guest, quietness of rooms,
security of room, comfortable and clean mattress, pillow, bed, sheets and covers, reasonable
room rates and give variety of basic products and services such as toothpaste, soap, shampoo,
towels, toilet paper, stationery, laundry, ironing, tea, coffee, drinking water); Reliability
(performing the services at the time promised, hotels should have experienced staff, giving an
accurate information about hotel services and providing timely housekeeping services to hotel
guest); and assurance (friendliness of staff, courteous employees and ability of staff to install
confidence in customers).
Although this study provides contributions from both theoretical and practical perspective for
Cambodia, there are a few limitations. First, this research was conducted in Phnom Penh and
two provinces of Siem Reap and Sihanoukville, most attractive to tourists. Second, it was
conducted based solely on hotel industry; the result of which many not be generalized to other
service organizations. Future research should be conducted to measure customer satisfaction
with tourism-related sectors, such as travel agencies and restaurants.
Tangibility
Responsiveness
Reliability
Assurance
Empathy
Core benefits
Overall Guest
Satisfaction
(OGS)
Revisit intention
Word-of-Mouth
16
REFERENCES
Abbasi, S.A., Khalid, W., Azam, M. and Riaz, A. (2010). Determinants of Customer Satisfaction in Hotel Industry of Pakistan, European Journal of Scientific Research, Vol.48, pp. 97-105.
Akbaba, A. (2006). Measuring Service Quality in the Hotel Industry: A study in a Business Hotel in Turkey, Hospitality Management, Vol. 25, pp. 170-192.
Al Khattab, S.A. and Aldehayyat, J.S. (2011). Perceptions of Service Quality in Jordanian Hotels, International Journal of Business and Management, Vol. 6, pp. 226-233.
Al-Rousan, M.R., and Mohamed, B. (2010). Customer Loyalty and the Impacts of Service Quality: The Case of Five Star Hotels in Jordan, International Journal of Human and Social Sciences, Vol. 5, pp. 886-892.
Anderson, E. and Mittal, V. (2000). Strengthening the Satisfaction-Profit Chain, Journal of Service Research, Vol. 3, pp. 107-120.
Angur, M.G., Nataraajan, R., and Jahera, J.S. (1999). Service Quality in the Banking Industry: An Assessment in a Developing Economy, International Journal of Bank Marketing, Vol. 17, pp. 116-125.
Appaw-Agbola, E.T. and AfenyoDehlor, S. (2011). Service Quality in Ghanas Tourism Industry: A Perspective from Tourists and Hotel Managers in the Volta Region, World Review of Business Research, Vol. 1, pp. 110-125.
Baumann, C., Burton, S., Elliott, G. and Kehr, H.M. (2007). Prediction of Attitude and Behavioural Intentions in Retail Banking, International Journal of Bank Marketing, Vol. 25, pp. 102-116.
Bloemer, J.M.M. and Kasper, H.D.P. (1995). The Complex Relationship Between Consumer Satisfaction and brand loyalty, Journal of Economic Psychology, Vol. 16, pp. 311-329.
Bolton, R.N. and Drew, J.H. (1991). A Multistage Model of Customers Assessment of Service Quality and Value, Journal of Consumer Research, Vol. 17, pp. 375-384.
Bowen, J.T. and Shoemaker, S. (1998). Loyalty: A Strategic Commitment, Cornell Hotel and Restaurant Administration Quarterly, Vol. 39, pp. 12-25.
Breusch, T.S. and Pagan, A.R. (1979). A Simple Test for Heteroskedasticity and Random Coefficient Variation, Econometrica, Vol. 47, pp. 1287-1294.
Briggs, S., Sutherland, J. and Drummond, S. (2007). Are Hotels Serving Quality? An Exploratory Study of Service Quality in the Scottish Hotel Sector, Tourism Management, Vol. 28, pp. 1006-1019.
Buttle, F. (1996). SERVQUAL: Review, Critique, Research Agenda, European Journal of Marketing, Vol. 30, pp. 8-35.
Caruana, A. (2002). Service Loyalty: the Effect of Service Quality and the Mediating Role of Customer Satisfaction, European Journal of Marketing. Vol. 36, pp.811-830
Clow, K.E. and Vorhies, D.W. (1993). Building a Competitive Advantage for Service Firms: Measurement of Consumer Expectations of Service Quality, Journal of Services Marketing, Vol. 7, pp. 22-32.
Cronin, J.J., Brady, M.K. and Hult, G.T.M. (2000). Assessing the Effects of Quality, Value, and Customer Satisfaction on Consumer Behavioral Intentions in Service Environments, Journal of Retailing, Vol. 76, pp. 193-218.
Cronin, J.J., and Taylor, S.A. (1992). Measuring service quality: A reexamination and extension, Journal of Marketing, Vol. 56, pp. 55-68.
Crosby, P.B. (1984). Quality Without Tears, New York: New American Library
Dhurup, M. and Mohamane, P.B.P.L. (2007). Assessing Internal Marketplace Relationships: Measuring Internal Service Quality within a Petrochemical Company, Southern African Business Review, Vol. 11, pp. 56-78.
Fah, L.K. and Kandasamy, S. (2011). An Investigation of Service Quality and Customer Satisfaction Among Hotels in Langkawi, International Conference on Management, Hydro Hotel, Malaysia (13-14 June 2011).
Gunderson, M.G., Heide, M. and Olsson, U.H. (1996). Hotel Guest Satisfaction among Business Travelers: What are the Important Factors?, Cornell Hotel and Restaurant Administration Quarterly, Vol. 37, pp. 72-81.
Guo, X., Duff, A. and Hair, M. (2008). Service Quality Measurement in the Chinese Corporate Banking Market, International Journal of Bank Marketing, Vol. 26, pp. 305-327.
Hair, J.F, Black, W.C., Babin, B.J. and Anderson, R.E. (2010). Multivariate Data Analysis: A Global Perspective, (10th Edition). New Jersey: Pearson.
Huei, C.T. and Easvaralingam, Y. (2011). Perceptions of Service Quality, Corporate Image, and Customer Loyality in the Hotel Industry of Malaysia, The 2 nd International Research Symposium in Service Management, Yogyakarta, Indonesia (26-30 July 2011).
Jamal, A. and Anastasiadou, K. (2009). Investigating the Effects of Service Quality Dimensions and Expertise on Loyalty, European Journal of Marketing, Vol. 43, pp. 398-420.
Jensen, J. B. (2011). Global Trade in Services: Fear, Facts, and Offshoring, Washington, DC: Peterson Institute for International Economics.
Kutter, L. (2007). The Influence of National Culture on Service Quality Perceptions of European Hotel Guests: A studying focusing on four small hotels in Granada, Spain and on British, French and Spanish hotel guests, manuscript (August 2007). accessed at http://www.du.se/PageFiles/5054/Kutter.pdf.
17
Malik, M.E., Naeem, B. and Nasir, A.M. (2011). Hotel Service Quality and Brand Loyalty, Interdisciplinary Journal of Contemporary Research in Business, Vol. 3, pp. 621-629.
Marinković, V., Senić, V., Kocić, M., and Šapić, S. (2011). Investigating the Impact of SERVQUAL Dimensions on Customer Satisfaction: The Lessons Learnt from Serbian Travel Agencies, International Journal of Tourism Research, DOI: 10.1002/jtr.884.
Mola, F. and Jusoh, J. (2011). Service Quality in Penang Hotels: A Gap Score Analysis, World Applied Sciences Journal, Vol.12, pp.19-24
Mueller, G. and Bedwell, D. (1993). Customer Service and Service Quality, in E. Shewing (ed.). The Service Quality Handbook, New York: AMACOM.
Naseem, A., Ejaz, S. and Malik GPHR, K.P (2011). Improvement of Hotel Service Quality: An Empirical Research in Pakistan, International Journal of Multidisciplinary Sciences and Engineering, Vol. 2, pp. 52-56.
Nunnally, J. C. (1967). Psychometric Theory, New York: McGraw-Hill.
Nyeck, S., Morales, M., Ladhari, R., and Pons, F. (2002). 10 years of Service Quality Measurement: Reviewing the Sse of the SERVQUAL Instrument, Cuadernos de Diffusion, Vol. 7, pp.101-107.
Oliver, R.L. (1989). Processing of the Satisfaction Response in Consumption: A Suggested Framework and Research Propositions, Journal of Consumer Satisfaction , Dissatisfaction and Complaining Behavior, Vol. 2, pp. 1-16.
Oliver, R.L. (1997). Satisfaction: A Behavioural Perspective on the Customer, New York: McGraw-Hill.
Parasuraman, A., Zeithaml, V. and Berry, L.L. (1985). A Conceptual Model of Service Quality and its Implications for Future Research, Journal of Marketing, Vol. 49, pp. 41-50.
Parasuraman, A., Zeithaml, V. and Berry, L.L. (1988). SERVQUAL: A Multiple Item Scale for Measuring Consumer Perceptions of Service Quality, Journal of Retailing, Vol. 64, pp. 12-40.
Parasuraman, A., Berry, L.L, and Zeithaml, V. A. (1990). Guidelines for Conducting Service Quality Research, Marketing Research, Vol. 2, pp. 34-44.
Petri, P.A., Plumer, M.G. And Zhai, F. (2012). ASEAN Economic Community: A General Equilibrium Analysis, Asian Economic Journal, Vol. 26, pp. 93-118.
Phillips, L.W., Chang, D.R. and Buzzell, R.D. (1983). Product Quality, Cost Position and Business Performance: A Test of Some Key Hypotheses, Journal of Marketing, Vol. 47, pp. 26-43.
Pizam, A and Ellis, T. (1999). Customer Satisfaction and its Measurement in Hospitality Enterprises, International Journal of Contemporary Hospitality Management, Vol. 11, pp. 326-339.
Ramsaran-Fowder, R.R. (2007). Developing a Service Quality Questionnaire for the Hotel Industry in Mauritius, Journal of Vacation Marketing, Vol. 13, pp. 19-27.
Reichheld, F.F. and Sasser, E.W. (1990). Zero Defections: Quality Comes to Services, Harvard Business Review, Vol. 68, pp. 105-111.
Roscoe, J. (1975). Fundamentals of Research Statistics for the Behaviour Sciences, Holt, Rineheart and Winston, USA.
Saleh, F. and Ryan, C. (1991). Analyzing Service Quality in the Hospitality Industry Using the SERVQUAL model, Service Industries Journal, Vol. 11, pp. 324-343.
Soeng, R. (2008). Foreign Direct Investment in Cambodia: Determinants and Impact on Domestic Labour Productivity and International Trade, PhD Dissertation, Faculty of Applied Economics, University of Antwerp, Belgium.
Soubbotina, T.P. (2004). Beyond Economic Growth: An Introduction to Sustainable Development, Washington, DC: The World Bank.
Spreng, R. A. Mackoy, R.D. (1996). An Empirical Examination of a Model of Perceived Service Quality and Satisfaction, Journal of Retailing, Vol. 72, pp. 201-214.
Studenmund, A. H. (2006). Using Econometrics: A Practical Guide, (5th Edition). New Jersey: Pearson.
Su, A. Y.L. (2004). Customer Satisfaction Measurement Practice in Taiwan Hotels, Hospitality Management, Vol. 23, pp. 397-408.
Sureshchandar, G.S., Rajendran, C. and Kamallanabhan, T.J. (2001). Customer Perceptions of Service Quality: a critique, Total Quality Management, Vol. 12(1). pp. 111-124.
Verbeek, M. (2004). A Guide to Modern Econometrics, (2nd edition). Chichester: John Wiley.
Woodside, A.G., Frey, L.L. and Daly, R.T. (1989). Linking Service Quality, Customer Satisfaction, and Behavioral Intention, Journal of Health Care Marketing, Vol. 9, pp. 5-17.
Wooldridge, J.M. (2006). Introductory Econometrics: A Modern Approach, (3th Edition). Ohio: South-Western.
Zeithaml, V.A., Berry, L.L. and Parasuraman, A. (1996). The Behavioral Consequences of Service Quality, Journal of Marketing, Vol. 60, pp. 31-47.


![View case study: Cambodia [ext. link] - DRR Platformdrrplatform.org/images/Case_Study_Cambodia.pdf · page case study Cambodia1 Context and ... to the combination of each risk’s](https://img.pdfslide.us/doc/110x75/5aa51ec07f8b9a185d8ce55e/view-case-study-cambodia-ext-link-drr-case-study-cambodia1-context-and-.jpg)