Embed Size (px)
Citation preview
An Assessment of Cost Improvements in the NASA COTS/CRS Program and
Implications for Future NASA Missions
Edgar Zapata NASA Kennedy Space Center
Presented at
The American Institute of Aeronautics & Astronautics Space 2017 Forum
Session: Space Cost and Economics
Orlando FL, September 12-14, 2017
https://ntrs.nasa.gov/search.jsp?R=20170008894 2019-12-24T18:43:01+00:00Z
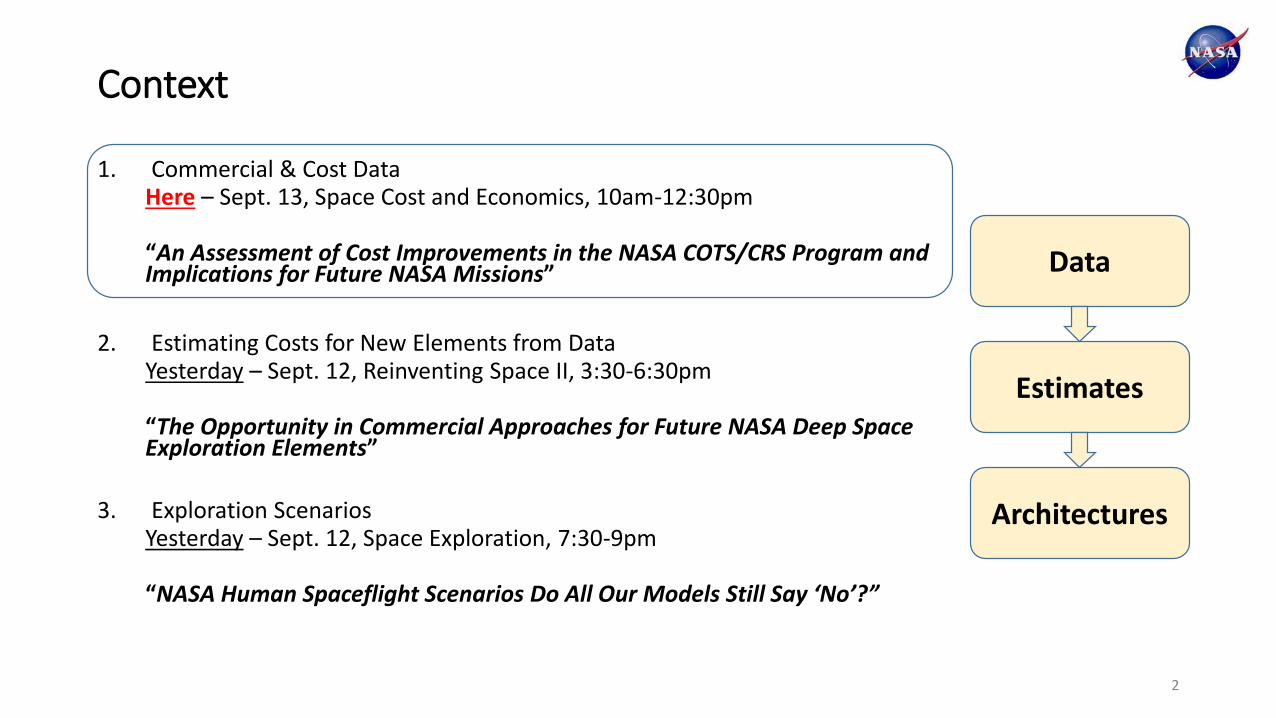
1. Commercial & Cost DataHere – Sept. 13, Space Cost and Economics, 10am-12:30pm
“An Assessment of Cost Improvements in the NASA COTS/CRS Program and Implications for Future NASA Missions”
2. Estimating Costs for New Elements from DataYesterday – Sept. 12, Reinventing Space II, 3:30-6:30pm
“The Opportunity in Commercial Approaches for Future NASA Deep Space Exploration Elements”
3. Exploration ScenariosYesterday – Sept. 12, Space Exploration, 7:30-9pm
“NASA Human Spaceflight Scenarios Do All Our Models Still Say ‘No’?”
Context
2
Data
Estimates
Architectures
• NASA Commercial cargo & crew programs life cycle cost data• Organize
• Quantify
• Compare
• Document
Is that a rhetorical point, or would you like to do the math?
I'd like to do the math. –Sheldon Cooper
Purpose
3
• 2004 Bush / Vision for Space Exploration (post-Columbia)
End Shuttle after ISS construction finished, and -
“Separate to the maximum practical extent crew from cargo transportation to the International Space Station and for launching exploration missions beyond low Earth orbit”
“Pursue commercial opportunities for providing transportation and other services supporting the International Space Station and exploration missions beyond low Earth orbit”
A Little History First
4
• NASA Commercial Market Assessment of Crew & Cargo Systems• NASA Cost Model (NAFCOM) predicted $1.7 – 4.0 billion for Falcon 9
development
• SpaceX indicated Falcon 9 launch vehicle development was approximately $300 million.
“It is difficult to determine exactly why the actual cost was so dramatically lower than the NAFCOM predictions.”
To date? More reports, debate and discussion!
Fast Forward to 2010
5
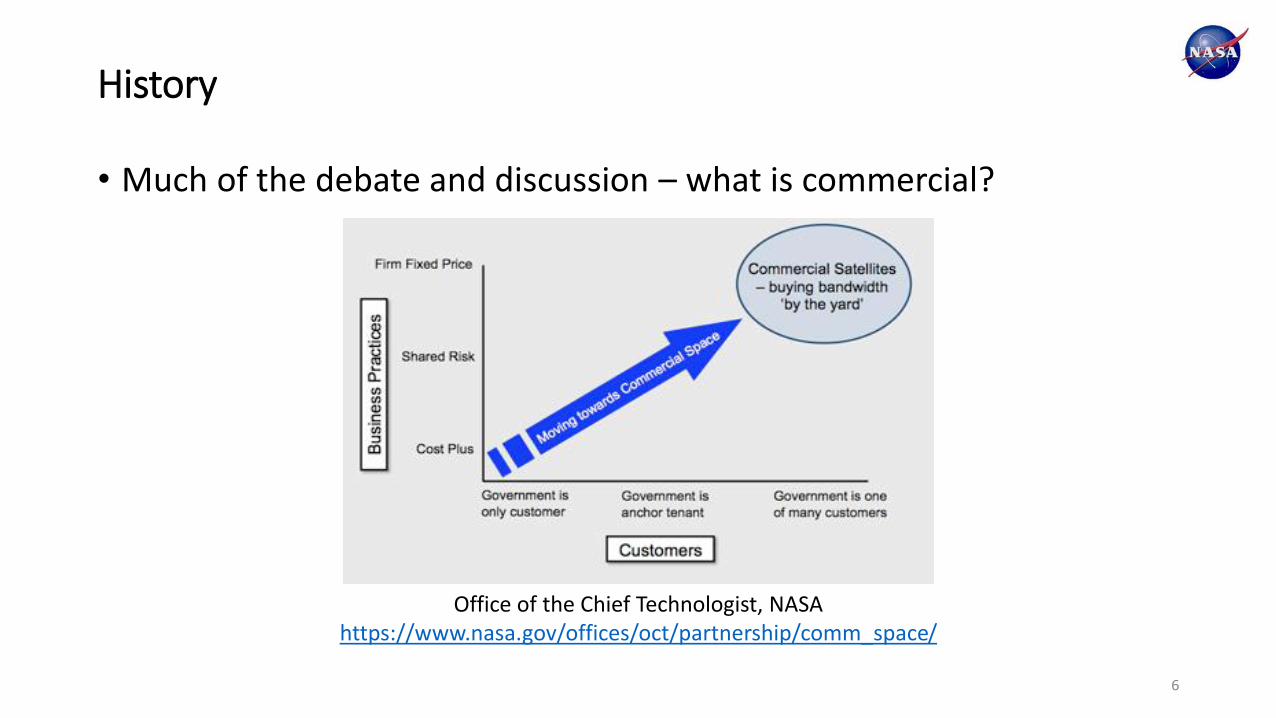
• Much of the debate and discussion – what is commercial?
History
6
Office of the Chief Technologist, NASAhttps://www.nasa.gov/offices/oct/partnership/comm_space/
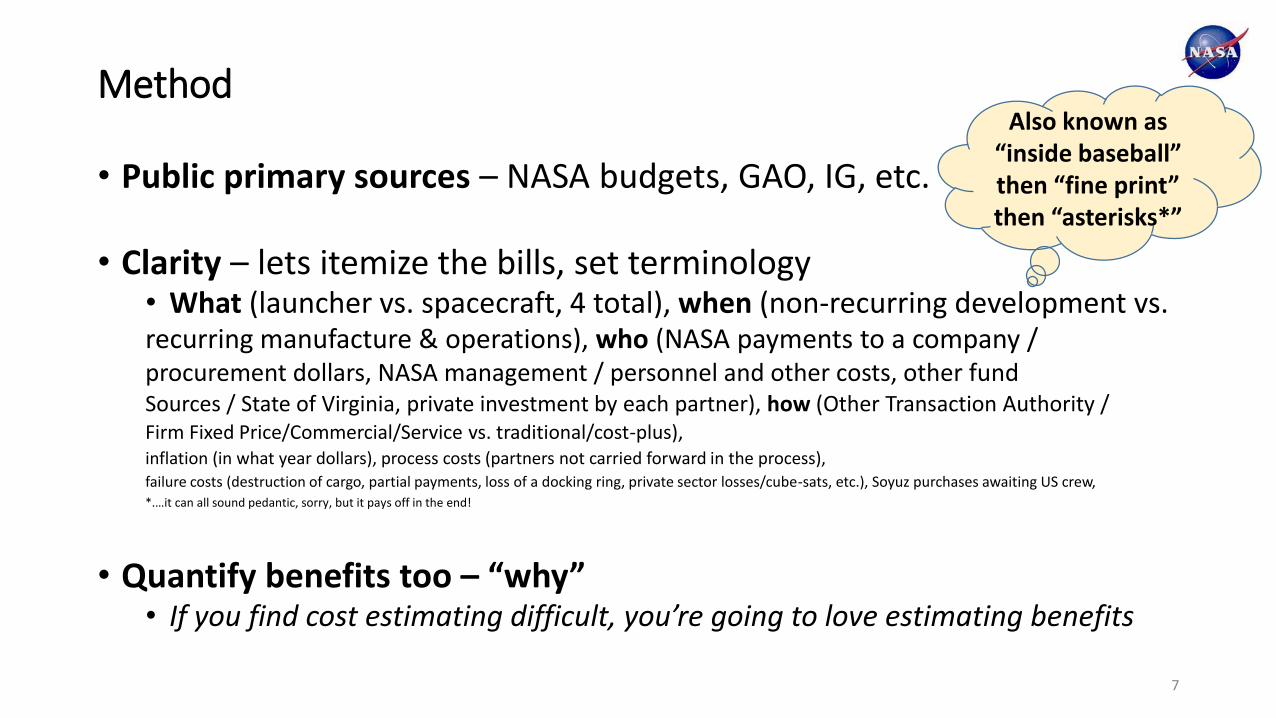
• Public primary sources – NASA budgets, GAO, IG, etc.
• Clarity – lets itemize the bills, set terminology• What (launcher vs. spacecraft, 4 total), when (non-recurring development vs.recurring manufacture & operations), who (NASA payments to a company /procurement dollars, NASA management / personnel and other costs, other fundSources / State of Virginia, private investment by each partner), how (Other Transaction Authority / Firm Fixed Price/Commercial/Service vs. traditional/cost-plus), inflation (in what year dollars), process costs (partners not carried forward in the process), failure costs (destruction of cargo, partial payments, loss of a docking ring, private sector losses/cube-sats, etc.), Soyuz purchases awaiting US crew, *.…it can all sound pedantic, sorry, but it pays off in the end!
• Quantify benefits too – “why”• If you find cost estimating difficult, you’re going to love estimating benefits
Method
7
Also known as“inside baseball” then “fine print” then “asterisks*”
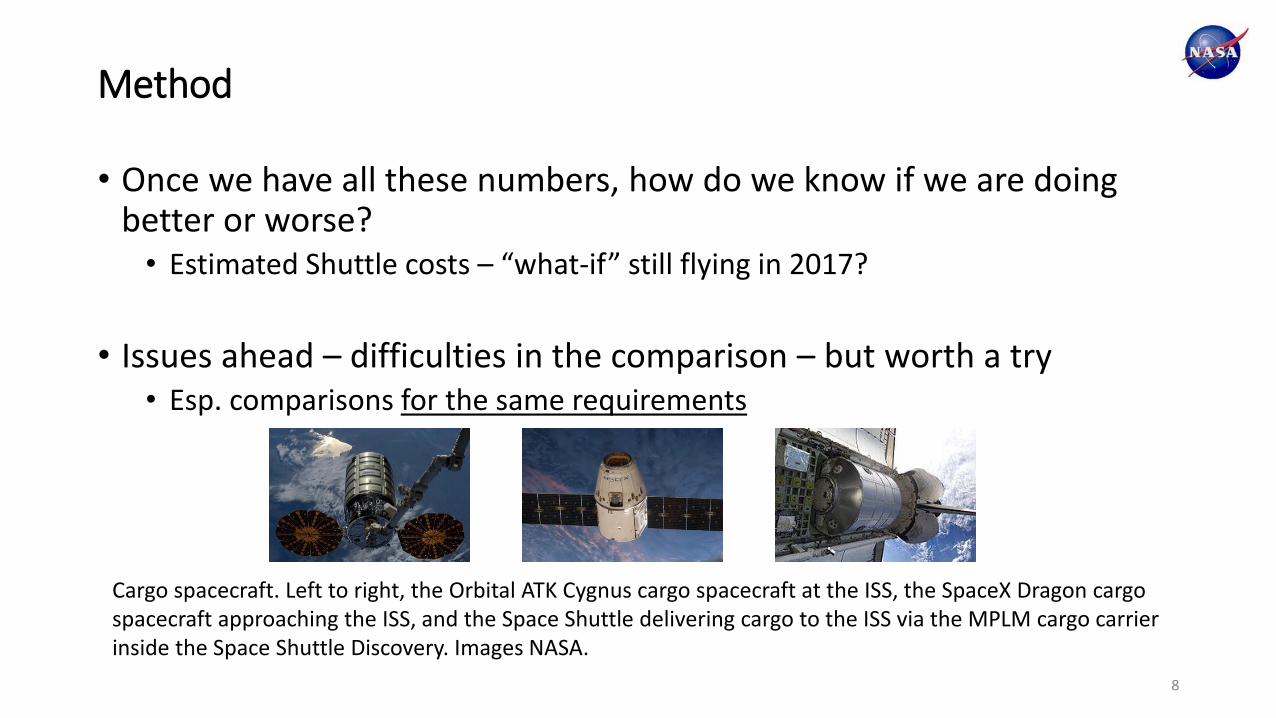
• Once we have all these numbers, how do we know if we are doing better or worse?• Estimated Shuttle costs – “what-if” still flying in 2017?
• Issues ahead – difficulties in the comparison – but worth a try• Esp. comparisons for the same requirements
Method
8
Cargo spacecraft. Left to right, the Orbital ATK Cygnus cargo spacecraft at the ISS, the SpaceX Dragon cargo spacecraft approaching the ISS, and the Space Shuttle delivering cargo to the ISS via the MPLM cargo carrier inside the Space Shuttle Discovery. Images NASA.
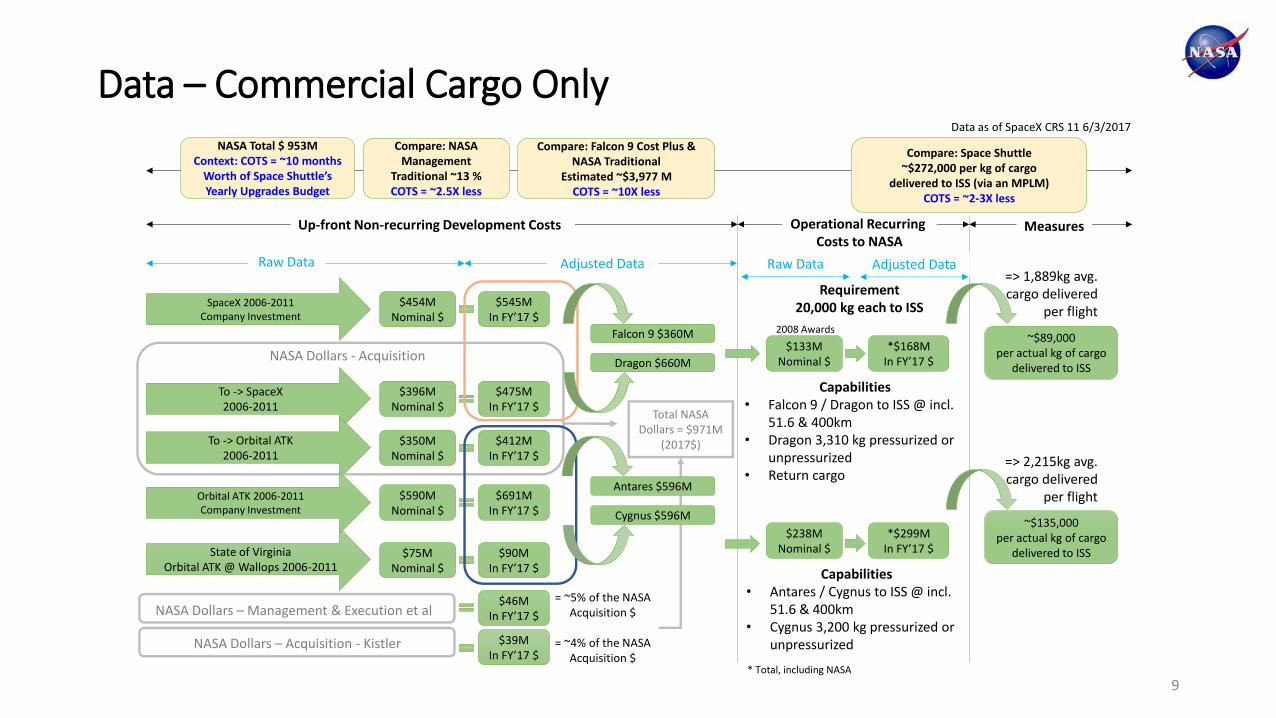
Data – Commercial Cargo Only
9
To -> SpaceX2006-2011
To -> Orbital ATK2006-2011
State of VirginiaOrbital ATK @ Wallops 2006-2011
$396MNominal $
$475MIn FY’17 $
$350MNominal $
$412MIn FY’17 $
NASA Dollars - Acquisition
$75MNominal $
$90MIn FY’17 $
SpaceX 2006-2011Company Investment
$454MNominal $
$545MIn FY’17 $
Orbital ATK 2006-2011Company Investment
$590MNominal $
$691MIn FY’17 $
NASA Dollars – Management & Execution et al
NASA Dollars – Acquisition - Kistler
$46MIn FY’17 $
$39MIn FY’17 $
Falcon 9 $360M
Dragon $660M
Antares $596M
Cygnus $596M
Raw Data Adjusted Data
Up-front Non-recurring Development Costs Operational Recurring Costs to NASA
$133MNominal $
*$168MIn FY’17 $
$238MNominal $
Capabilities• Falcon 9 / Dragon to ISS @ incl.
51.6 & 400km• Dragon 3,310 kg pressurized or
unpressurized• Return cargo
Capabilities• Antares / Cygnus to ISS @ incl.
51.6 & 400km• Cygnus 3,200 kg pressurized or
unpressurized
Measures
Compare: Falcon 9 Cost Plus & NASA Traditional
Estimated ~$3,977 MCOTS = ~10X less
Compare: Space Shuttle ~$272,000 per kg of cargo
delivered to ISS (via an MPLM)COTS = ~2-3X less
Compare: NASA Management
Traditional ~13 %COTS = ~2.5X less
= ~5% of the NASA Acquisition $
= ~4% of the NASA Acquisition $
~$135,000per actual kg of cargo
delivered to ISS
Requirement20,000 kg each to ISS
NASA Total $ 953MContext: COTS = ~10 months
Worth of Space Shuttle’s Yearly Upgrades Budget
~$89,000per actual kg of cargo
delivered to ISS
Total NASA Dollars = $971M
(2017$)
=> 1,889kg avg. cargo delivered
per flight
*$299MIn FY’17 $
=> 2,215kg avg. cargo delivered
per flight
2008 Awards
Raw Data Adjusted Data
* Total, including NASA
Data as of SpaceX CRS 11 6/3/2017
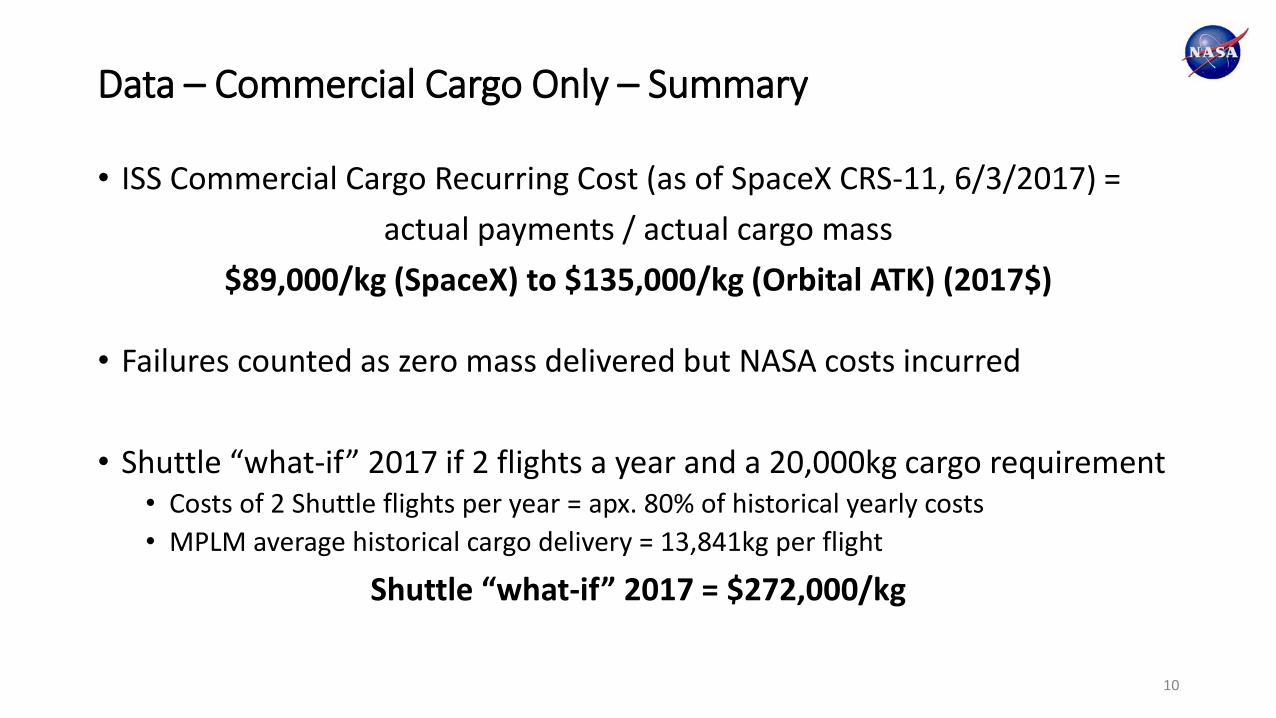
• ISS Commercial Cargo Recurring Cost (as of SpaceX CRS-11, 6/3/2017) =
actual payments / actual cargo mass
$89,000/kg (SpaceX) to $135,000/kg (Orbital ATK) (2017$)
• Failures counted as zero mass delivered but NASA costs incurred
• Shuttle “what-if” 2017 if 2 flights a year and a 20,000kg cargo requirement• Costs of 2 Shuttle flights per year = apx. 80% of historical yearly costs
• MPLM average historical cargo delivery = 13,841kg per flight
Shuttle “what-if” 2017 = $272,000/kg
Data – Commercial Cargo Only – Summary
10
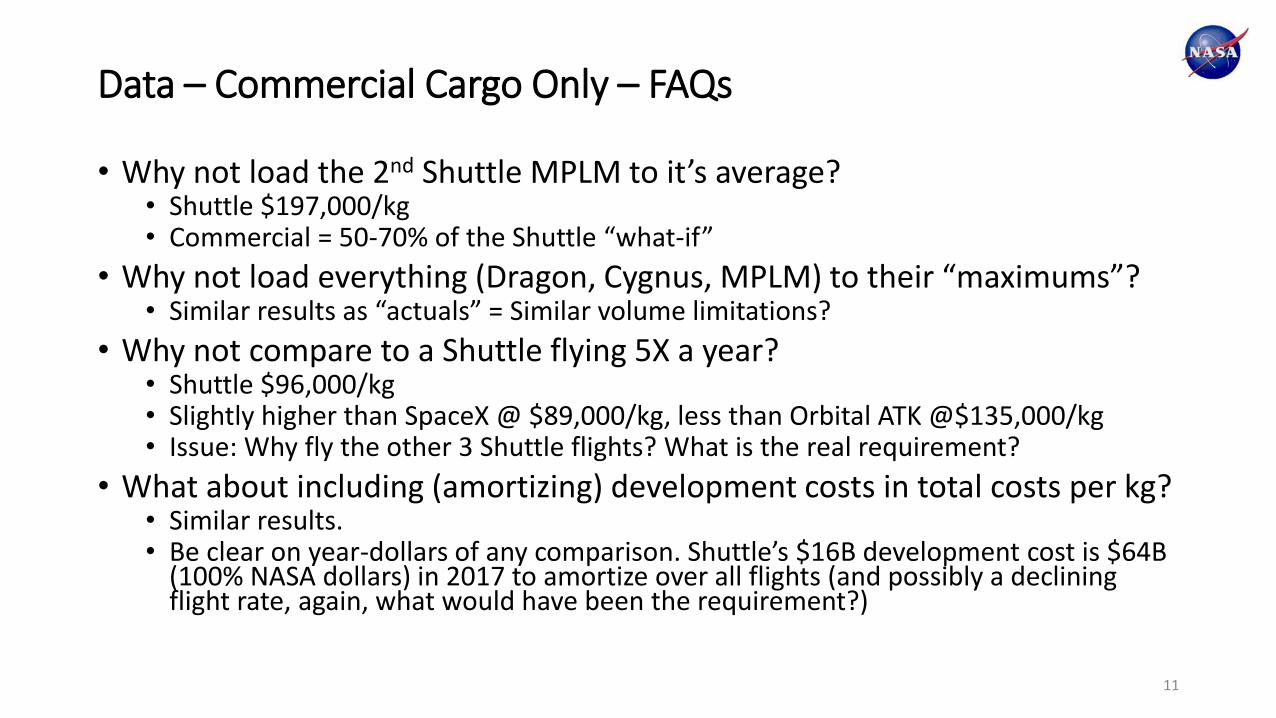
• Why not load the 2nd Shuttle MPLM to it’s average?• Shuttle $197,000/kg• Commercial = 50-70% of the Shuttle “what-if”
• Why not load everything (Dragon, Cygnus, MPLM) to their “maximums”?• Similar results as “actuals” = Similar volume limitations?
• Why not compare to a Shuttle flying 5X a year?• Shuttle $96,000/kg• Slightly higher than SpaceX @ $89,000/kg, less than Orbital ATK @$135,000/kg• Issue: Why fly the other 3 Shuttle flights? What is the real requirement?
• What about including (amortizing) development costs in total costs per kg?• Similar results.• Be clear on year-dollars of any comparison. Shuttle’s $16B development cost is $64B
(100% NASA dollars) in 2017 to amortize over all flights (and possibly a declining flight rate, again, what would have been the requirement?)
Data – Commercial Cargo Only – FAQs
11
• What about crew?
• The Shuttle also took up crew.
• Both commercial programs go together, cargo and crew.
..and the big FAQ…
12
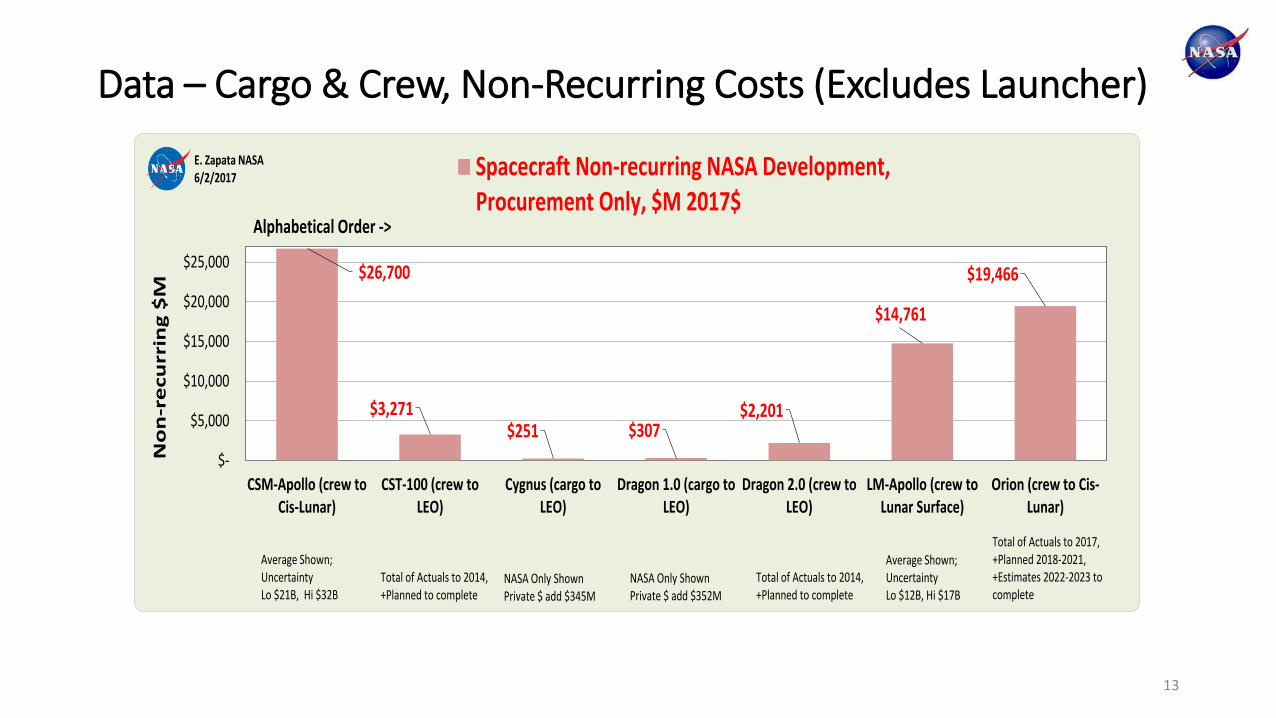
$26,700
$3,271 $251 $307
$2,201
$14,761
$19,466
$-
$5,000
$10,000
$15,000
$20,000
$25,000
CSM-Apollo (crew toCis-Lunar)
CST-100 (crew toLEO)
Cygnus (cargo toLEO)
Dragon 1.0 (cargo toLEO)
Dragon 2.0 (crew toLEO)
LM-Apollo (crew toLunar Surface)
Orion (crew to Cis-Lunar)
No
n-r
ecu
rrin
g $
MSpacecraft Non-recurring NASA Development,Procurement Only, $M 2017$
E. Zapata NASA6/2/2017
Alphabetical Order ->
Total of Actuals to 2017, +Planned 2018-2021, +Estimates 2022-2023 to complete
Average Shown; UncertaintyLo $21B, Hi $32B
Average Shown; UncertaintyLo $12B, Hi $17B
Total of Actuals to 2014,+Planned to complete
Total of Actuals to 2014,+Planned to complete
NASA Only ShownPrivate $ add $345M
NASA Only ShownPrivate $ add $352M
Data – Cargo & Crew, Non-Recurring Costs (Excludes Launcher)
13
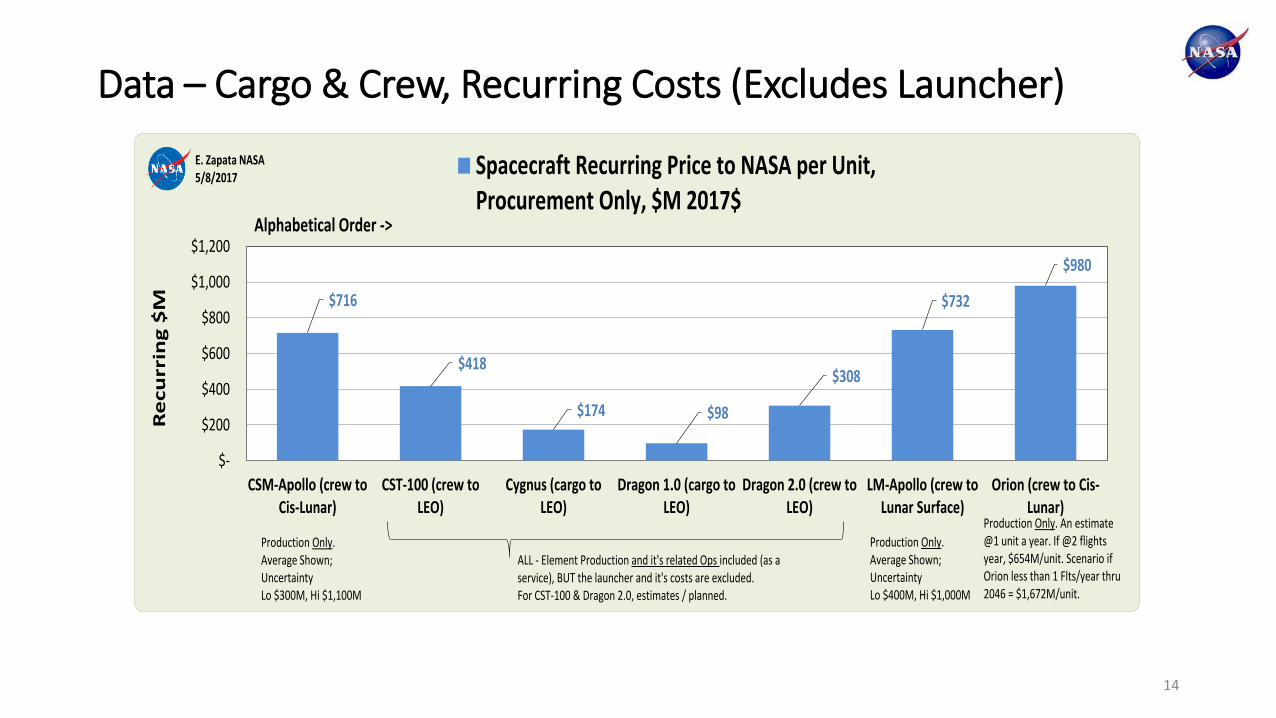
Data – Cargo & Crew, Recurring Costs (Excludes Launcher)
14
$716
$418
$174 $98
$308
$732
$980
$-
$200
$400
$600
$800
$1,000
$1,200
CSM-Apollo (crew toCis-Lunar)
CST-100 (crew toLEO)
Cygnus (cargo toLEO)
Dragon 1.0 (cargo toLEO)
Dragon 2.0 (crew toLEO)
LM-Apollo (crew toLunar Surface)
Orion (crew to Cis-Lunar)
Re
cu
rrin
g $
MSpacecraft Recurring Price to NASA per Unit,Procurement Only, $M 2017$
E. Zapata NASA5/8/2017
Alphabetical Order ->
Production Only. An estimate @1 unit a year. If @2 flights year, $654M/unit. Scenario if Orion less than 1 Flts/year thru 2046 = $1,672M/unit.
ALL - Element Production and it's related Ops included (as a service), BUT the launcher and it's costs are excluded.For CST-100 & Dragon 2.0, estimates / planned.
Production Only.Average Shown; UncertaintyLo $300M, Hi $1,100M
Production Only.Average Shown; UncertaintyLo $400M, Hi $1,000M
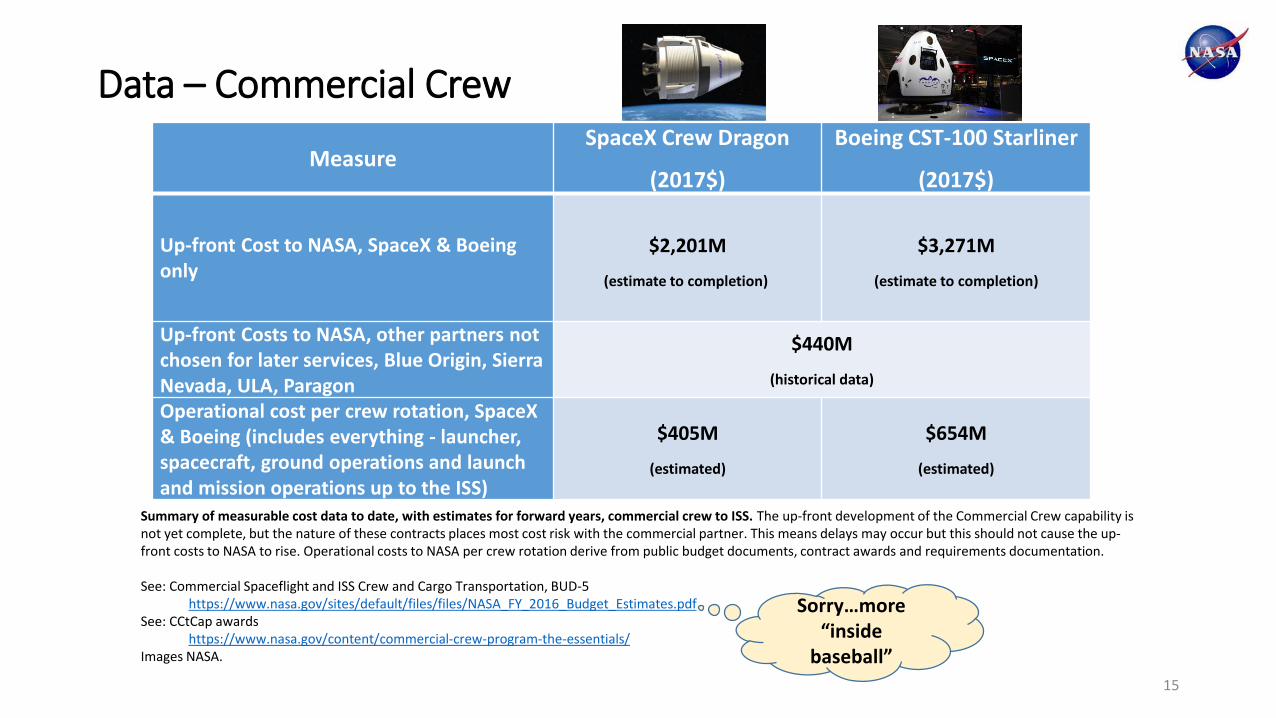
Data – Commercial Crew
15
MeasureSpaceX Crew Dragon
(2017$)
Boeing CST-100 Starliner
(2017$)
Up-front Cost to NASA, SpaceX & Boeing only
$2,201M
(estimate to completion)
$3,271M
(estimate to completion)
Up-front Costs to NASA, other partners not chosen for later services, Blue Origin, Sierra Nevada, ULA, Paragon
$440M
(historical data)
Operational cost per crew rotation, SpaceX & Boeing (includes everything - launcher, spacecraft, ground operations and launch and mission operations up to the ISS)
$405M
(estimated)
$654M
(estimated)
Summary of measurable cost data to date, with estimates for forward years, commercial crew to ISS. The up-front development of the Commercial Crew capability is not yet complete, but the nature of these contracts places most cost risk with the commercial partner. This means delays may occur but this should not cause the up-front costs to NASA to rise. Operational costs to NASA per crew rotation derive from public budget documents, contract awards and requirements documentation.
See: Commercial Spaceflight and ISS Crew and Cargo Transportation, BUD-5https://www.nasa.gov/sites/default/files/files/NASA_FY_2016_Budget_Estimates.pdf
See: CCtCap awardshttps://www.nasa.gov/content/commercial-crew-program-the-essentials/
Images NASA.
Sorry…more “inside
baseball”
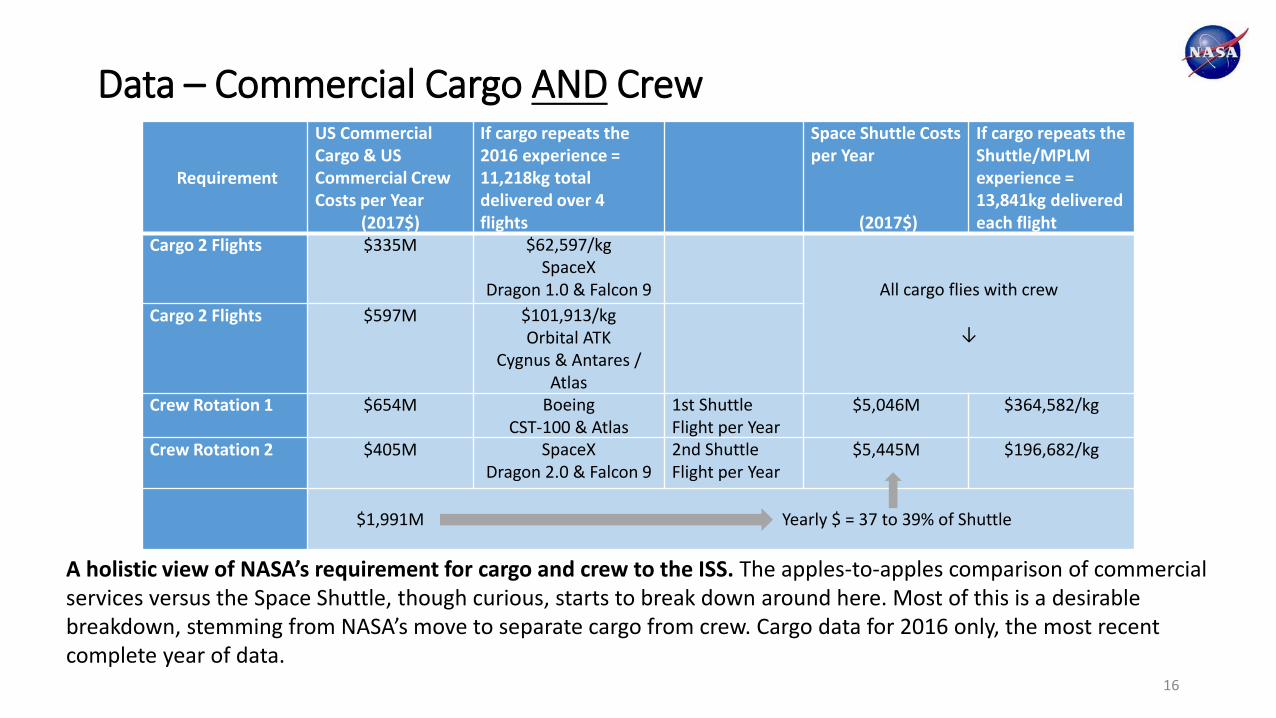
Data – Commercial Cargo AND Crew
16
Requirement
US Commercial Cargo & US Commercial Crew Costs per Year
(2017$)
If cargo repeats the 2016 experience = 11,218kg total delivered over 4 flights
Space Shuttle Costs per Year
(2017$)
If cargo repeats the Shuttle/MPLM experience = 13,841kg delivered each flight
Cargo 2 Flights $335M $62,597/kgSpaceX
Dragon 1.0 & Falcon 9 All cargo flies with crew
↓Cargo 2 Flights $597M $101,913/kg
Orbital ATKCygnus & Antares /
AtlasCrew Rotation 1 $654M Boeing
CST-100 & Atlas1st Shuttle Flight per Year
$5,046M $364,582/kg
Crew Rotation 2 $405M SpaceX Dragon 2.0 & Falcon 9
2nd Shuttle Flight per Year
$5,445M $196,682/kg
$1,991M Yearly $ = 37 to 39% of Shuttle
A holistic view of NASA’s requirement for cargo and crew to the ISS. The apples-to-apples comparison of commercial services versus the Space Shuttle, though curious, starts to break down around here. Most of this is a desirable breakdown, stemming from NASA’s move to separate cargo from crew. Cargo data for 2016 only, the most recent complete year of data.
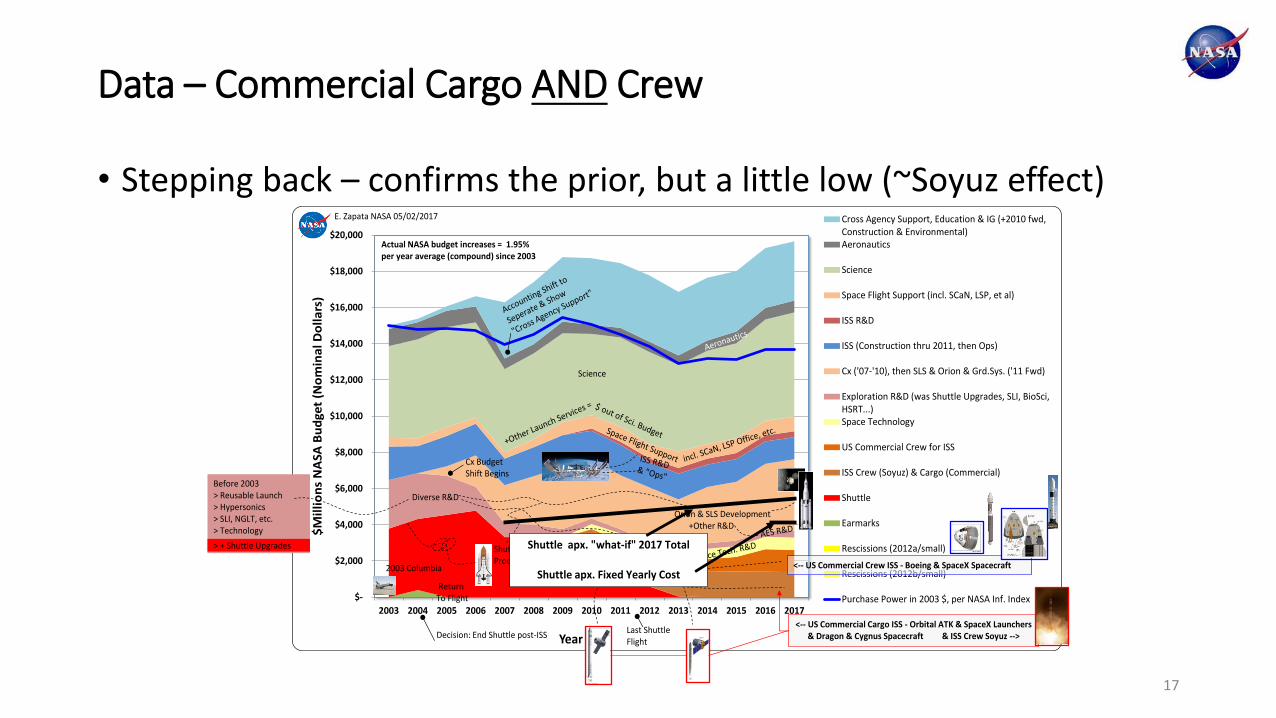
• Stepping back – confirms the prior, but a little low (~Soyuz effect)
Data – Commercial Cargo AND Crew
17
$-
$2,000
$4,000
$6,000
$8,000
$10,000
$12,000
$14,000
$16,000
$18,000
$20,000
2003 2004 2005 2006 2007 2008 2009 2010 2011 2012 2013 2014 2015 2016 2017
$M
illi
on
s N
ASA
Bu
dge
t (N
om
ina
l Do
lla
rs)
Year
Cross Agency Support, Education & IG (+2010 fwd,Construction & Environmental)Aeronautics
Science
Space Flight Support (incl. SCaN, LSP, et al)
ISS R&D
ISS (Construction thru 2011, then Ops)
Cx ('07-'10), then SLS & Orion & Grd.Sys. ('11 Fwd)
Exploration R&D (was Shuttle Upgrades, SLI, BioSci,HSRT...)Space Technology
US Commercial Crew for ISS
ISS Crew (Soyuz) & Cargo (Commercial)
Shuttle
Earmarks
Rescissions (2012a/small)
Rescissions (2012b/small)
Purchase Power in 2003 $, per NASA Inf. Index
Diverse R&D
<-- US Commercial Crew ISS - Boeing & SpaceX Spacecraft
Decision: End Shuttle post-ISS
Cx Budget Shift Begins
Last Shuttle Flight
2003 Columbia
Return To Flight
<-- US Commercial Cargo ISS - Orbital ATK & SpaceX Launchers & Dragon & Cygnus Spacecraft & ISS Crew Soyuz -->
Actual NASA budget increases = 1.95% per year average (compound) since 2003
Shuttle Production & Ops
E. Zapata NASA 05/02/2017
Orion & SLS Development+Other R&D
Science
Before 2003> Reusable Launch> Hypersonics> SLI, NGLT, etc.> Technology
> + Shuttle Upgrades Shuttle apx. "what-if" 2017 Total
Shuttle apx. Fixed Yearly Cost
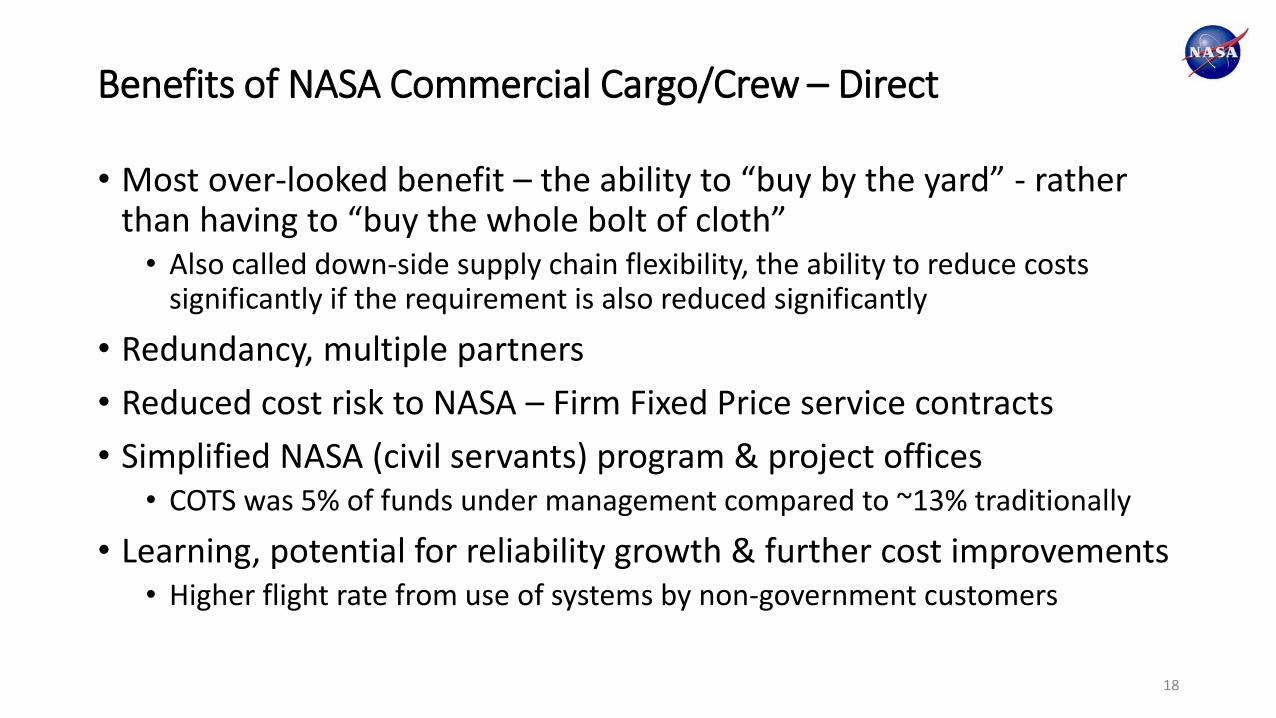
• Most over-looked benefit – the ability to “buy by the yard” - rather than having to “buy the whole bolt of cloth”• Also called down-side supply chain flexibility, the ability to reduce costs
significantly if the requirement is also reduced significantly
• Redundancy, multiple partners
• Reduced cost risk to NASA – Firm Fixed Price service contracts
• Simplified NASA (civil servants) program & project offices• COTS was 5% of funds under management compared to ~13% traditionally
• Learning, potential for reliability growth & further cost improvements• Higher flight rate from use of systems by non-government customers
Benefits of NASA Commercial Cargo/Crew – Direct
18
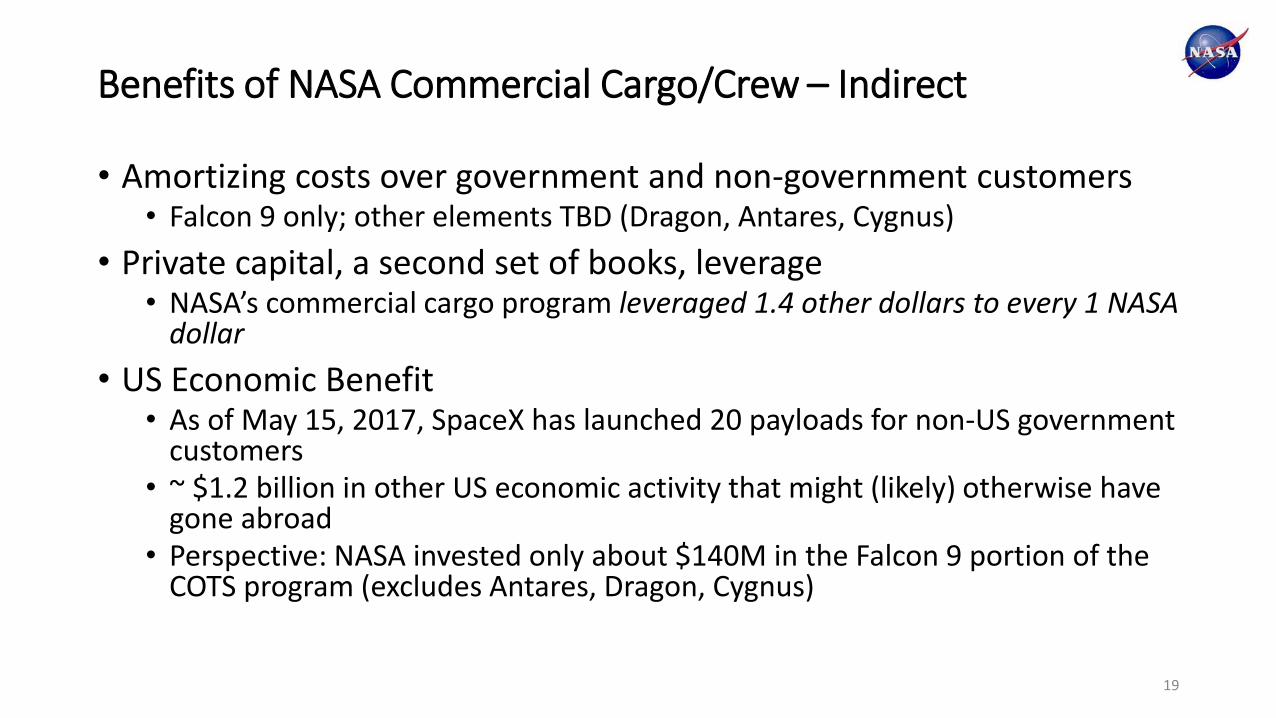
• Amortizing costs over government and non-government customers• Falcon 9 only; other elements TBD (Dragon, Antares, Cygnus)
• Private capital, a second set of books, leverage• NASA’s commercial cargo program leveraged 1.4 other dollars to every 1 NASA
dollar
• US Economic Benefit• As of May 15, 2017, SpaceX has launched 20 payloads for non-US government
customers• ~ $1.2 billion in other US economic activity that might (likely) otherwise have
gone abroad• Perspective: NASA invested only about $140M in the Falcon 9 portion of the
COTS program (excludes Antares, Dragon, Cygnus)
Benefits of NASA Commercial Cargo/Crew – Indirect
19
Benefits of NASA Commercial Cargo/Crew – Indirect
20
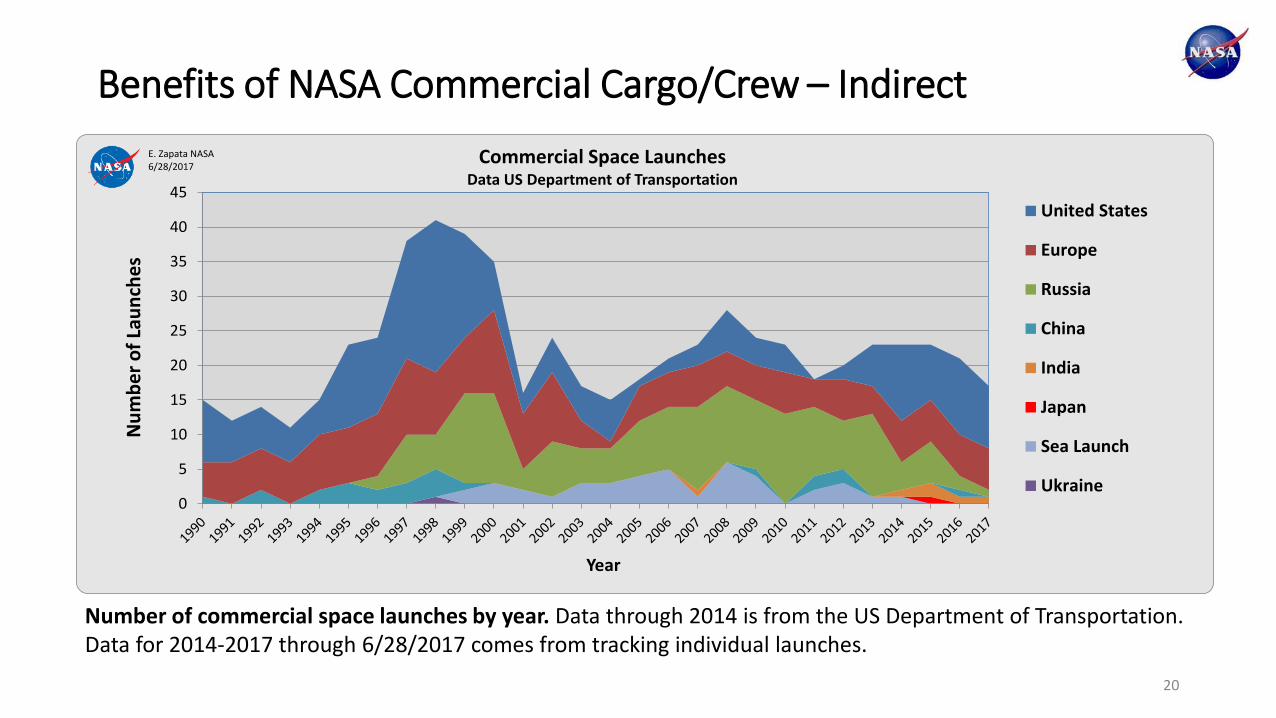
Number of commercial space launches by year. Data through 2014 is from the US Department of Transportation. Data for 2014-2017 through 6/28/2017 comes from tracking individual launches.
0
5
10
15
20
25
30
35
40
45
Nu
mb
er o
f La
un
ches
Year
Commercial Space LaunchesData US Department of Transportation
United States
Europe
Russia
China
India
Japan
Sea Launch
Ukraine
E. Zapata NASA6/28/2017
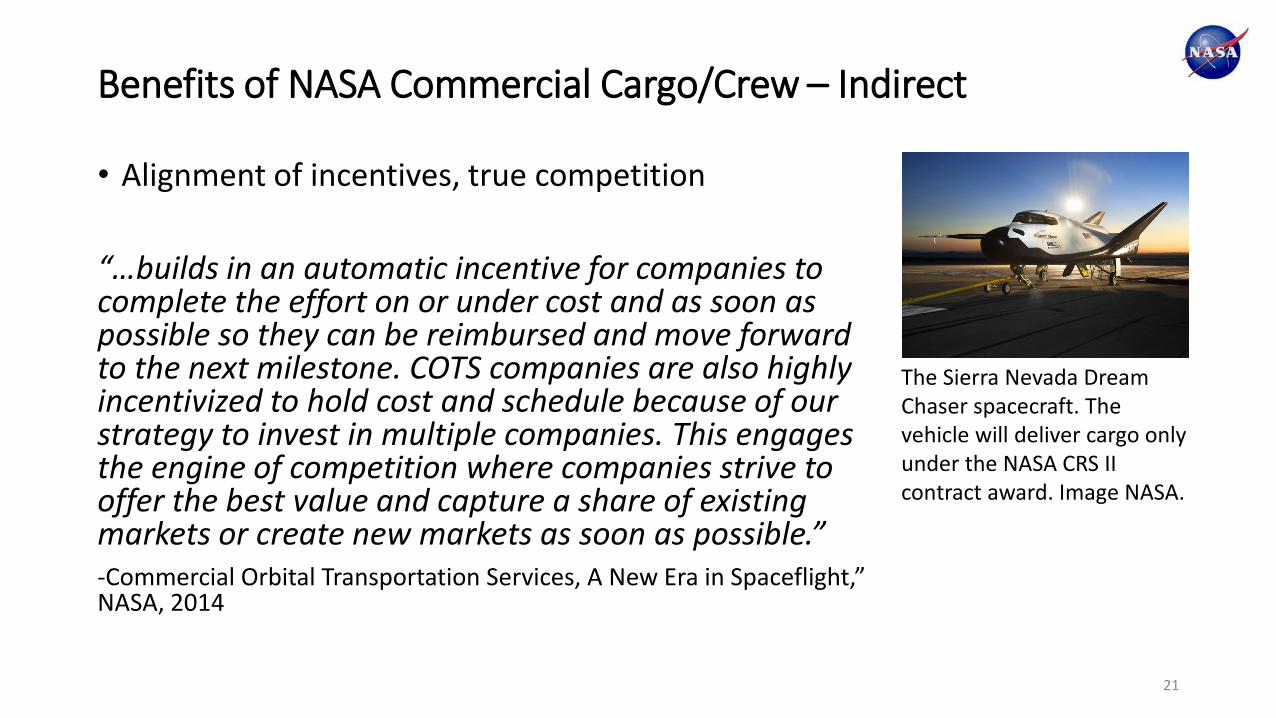
• Alignment of incentives, true competition
“…builds in an automatic incentive for companies to complete the effort on or under cost and as soon as possible so they can be reimbursed and move forward to the next milestone. COTS companies are also highly incentivized to hold cost and schedule because of our strategy to invest in multiple companies. This engages the engine of competition where companies strive to offer the best value and capture a share of existing markets or create new markets as soon as possible.”-Commercial Orbital Transportation Services, A New Era in Spaceflight,” NASA, 2014
Benefits of NASA Commercial Cargo/Crew – Indirect
21
The Sierra Nevada Dream Chaser spacecraft. The vehicle will deliver cargo only under the NASA CRS II contract award. Image NASA.
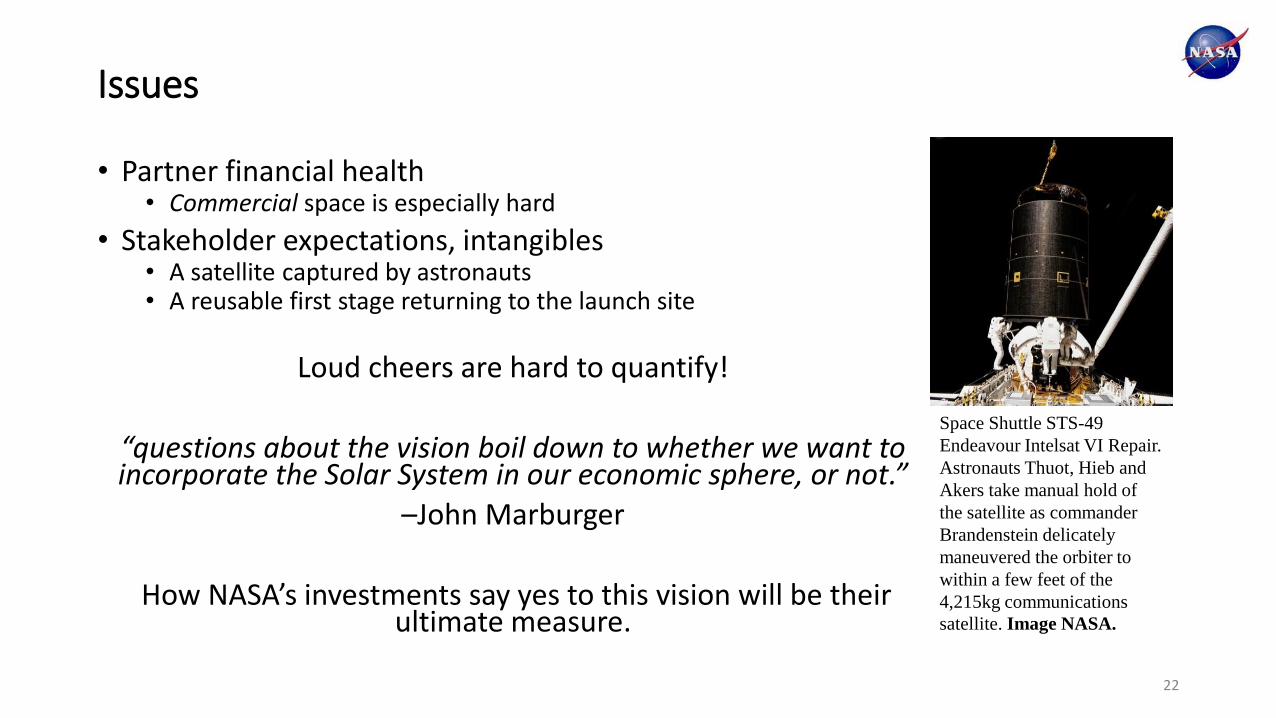
• Partner financial health• Commercial space is especially hard
• Stakeholder expectations, intangibles• A satellite captured by astronauts• A reusable first stage returning to the launch site
Loud cheers are hard to quantify!
“questions about the vision boil down to whether we want to incorporate the Solar System in our economic sphere, or not.”
–John Marburger
How NASA’s investments say yes to this vision will be their ultimate measure.
Issues
22
Space Shuttle STS-49
Endeavour Intelsat VI Repair.
Astronauts Thuot, Hieb and
Akers take manual hold of
the satellite as commander
Brandenstein delicately
maneuvered the orbiter to
within a few feet of the
4,215kg communications
satellite. Image NASA.
• One word - Plastic!
• No really –• Commercial future deep space systems?
• Habitation?• Landers?• More?
• Yesterday – two related works• Session - Reinventing Space II: “The Opportunity in Commercial Approaches
for Future NASA Deep Space Exploration Elements”• Session - Space Exploration: “NASA Human Spaceflight Scenarios, Do All Our
Models Still Say ‘No’?”
Opportunities
23
• Rigorous, comprehensive review of NASA commercial cargo and crew cost data, including benefits and issues
“By isolated measures or by the most holistic measures, the ISS cargo partnerships are a significant advance in affordability and the ISS commercial crew partnerships appear just as promising.”
Conclusions
24
The author gratefully acknowledges the assistance and review of Alan Lindenmoyer, Commercial Orbital Transportation Services (COTS) program manager, Allison Zuniga in the NASA Emerging Space Office, and the encouragement and ideas of participants across many NASA centers in NASA Emerging Space Office discussions.
Acknowledgements
25
Questions?
26
Backup
27
28
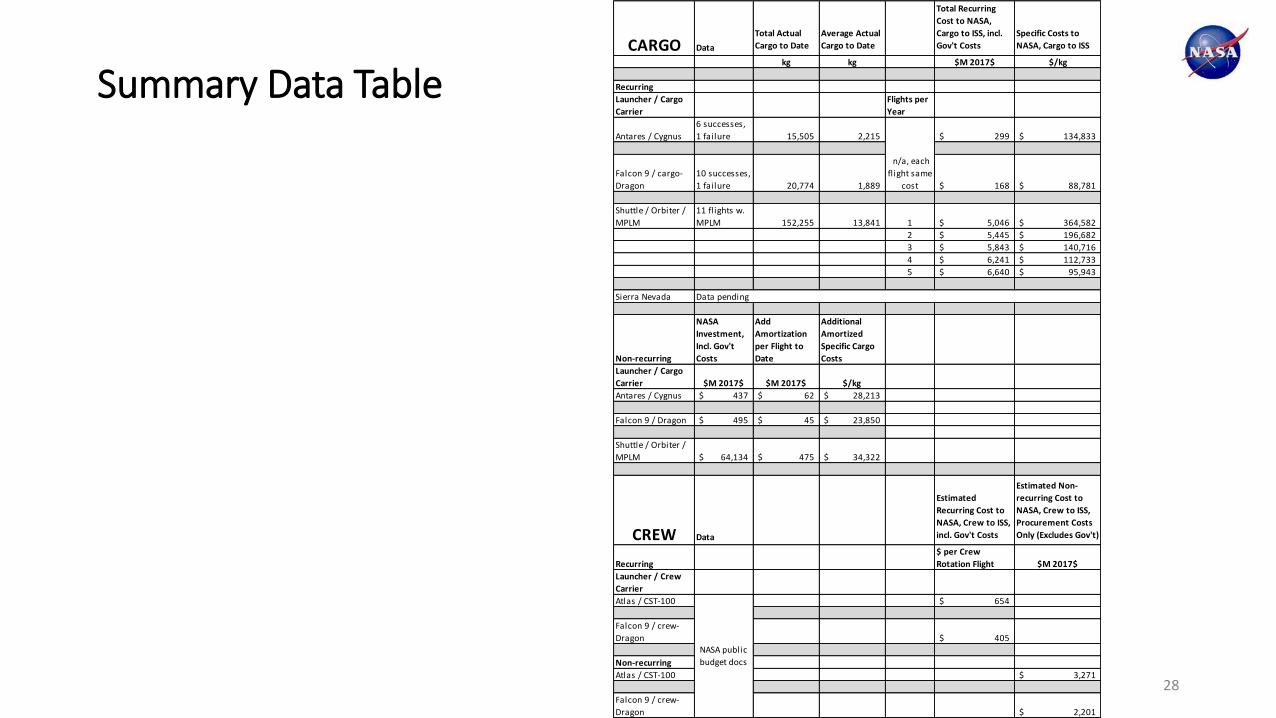
CARGO Data
Total Actual
Cargo to Date
Average Actual
Cargo to Date
Total Recurring
Cost to NASA,
Cargo to ISS, incl.
Gov't Costs
Specific Costs to
NASA, Cargo to ISS
kg kg $M 2017$ $/kg
Recurring
Launcher / Cargo
Carrier
Flights per
Year
Antares / Cygnus
6 successes,
1 failure 15,505 2,215 299$ 134,833$
Falcon 9 / cargo-
Dragon
10 successes,
1 failure 20,774 1,889 168$ 88,781$
Shuttle / Orbiter /
MPLM
11 fl ights w.
MPLM 152,255 13,841 1 5,046$ 364,582$
2 5,445$ 196,682$
3 5,843$ 140,716$
4 6,241$ 112,733$
5 6,640$ 95,943$
Sierra Nevada Data pending
Non-recurring
NASA
Investment,
Incl. Gov't
Costs
Add
Amortization
per Flight to
Date
Additional
Amortized
Specific Cargo
Costs
Launcher / Cargo
Carrier $M 2017$ $M 2017$ $/kg
Antares / Cygnus 437$ 62$ 28,213$
Falcon 9 / Dragon 495$ 45$ 23,850$
Shuttle / Orbiter /
MPLM 64,134$ 475$ 34,322$
CREW Data
Estimated
Recurring Cost to
NASA, Crew to ISS,
incl. Gov't Costs
Estimated Non-
recurring Cost to
NASA, Crew to ISS,
Procurement Costs
Only (Excludes Gov't)
Recurring
$ per Crew
Rotation Flight $M 2017$
Launcher / Crew
Carrier
Atlas / CST-100 654$
Falcon 9 / crew-
Dragon 405$
Non-recurring
Atlas / CST-100 3,271$
Falcon 9 / crew-
Dragon 2,201$
n/a, each
fl ight same
cost
NASA public
budget docs
Summary Data Table