Embed Size (px)
Citation preview

1
An Architecture for Managing Virtual Circuit and Virtual PathServices on ATM Networks
Abstract
ATM networks rely on the Virtual Circuit (VC) and Virtual Path (VP) concept to provide uni-cast connection-oriented services with Quality of Service guarantees. This paper presents amodel for managing the configuration and performance of the VC and VP services in these net-works. The model consists of a connection management architecture that provides the servicesand is instrumented for network management purposes, and a network management architec-ture that uses the OSI management model to provide access to the appropriate service monitor-ing and control functions. The network management architecture proposes complete managedobject definitions that achieve a variety of monitoring and control objectives: service configura-tion, service performance at the call and cell level, and service control. The latter includes thecapability to establish VPs and control their allocated networking capacity and also control pa-rameters of the signaling system that affect the performance of the VC service. The architecturewas implemented in its entirety on the Xunet ATM testbed, and several experiments were con-ducted to illustrate the trade-off between the throughput of the VC service and the allocation ofcapacity to VPs. The experiments further demonstrated that the signaling system can createthroughput bottlenecks in the absence of VPs in the network, and therefore, the network opera-tor can increase performance by controlling the VP distribution.
Keywords: ATM, Service Management, Virtual Circuit, Virtual Path, Xunet.
1. Introduction
The significant progress achieved in the past few years in the development of signaling standards forATM networks has generated a strong interest for architectures that enable the introduction and man-agement of broadband services. This paper presents a model for managing the Virtual Circuit (VC)and Virtual Path (VP) connection services in ATM networks with Quality of Service Guarantees.These services can be regarded as thecore broadband services, in the sense that other more complexservices such as video-on-demand, video conferencing, virtual networks, etc., can be built on top ofthem. We give special attention to the VP service for the following reasons: VPs can be provided asan end-to-end connection service to the users or can be employed by the network operator to opti-
Nikolaos Anerousis
AT&T Laboratories600 Mountain Avenue
P.O. Box 636Murray Hill, NJ 07974-0636
tel. (908) 582-5499e-mail: [email protected]
Aurel A. Lazar
Department of Electrical Engineeringand
Center for Telecommunications ResearchColumbia UniversityNew York, NY 10027tel. (212) 854-1747
e-mail: [email protected]

An Architecture for Managing Virtual Circuit and Virtual Path Services on ATM Networks
2
mize the call level performance of the ATM network. In this case, they can be used to establish con-nections for the VC service at a reduced signaling processing cost. This implies that the VP config-uration (especially with respect to resource allocation) has a direct impact on the VC service perfor-mance. Therefore, the observed performance of the VC service should influence the decisionsregarding the distribution of networking capacity to VPs (theVP distribution), and consequently, theVC and VP management architectures should be integrated.
In addition to the architecture for managing the VC and VP services, there is a need to develop anunderstanding of the architecture that provides these services, i.e., the connection management ar-chitecture. The VC service in ATM networks is provided through a signaling system, much in thesame way that calls are established in telephone networks [BEL91]. VPs can be either installed froma management system or established through the signaling system. To this extent, we provide a con-nection management architecture for VC and VP connection setup under quality of service con-straints. The architecture is integrated with the service management model. Integration here meansthat VCs and VPs set up by the connection management system can be instrumented for configura-tion and performance management purposes. The reader will quickly recognize that this instrumen-tation is representative for a large class of management problems such as billing (accounting),configuration management, etc.
1.1 Previous Work on Service Management
The review of service management efforts for ATM broadband networks reveals an increasing in-terest in the research community regarding the management of network services and especially ofthe VP service. [OHT93] presents an OSI-based management system for testing ATM Virtual Paths.The system is used exclusively for testing the cell-level performance of Virtual Paths, and allows thecontrol of cell generators and the retrieval of information from monitoring sensors. The system isdesigned for testing purposes only and does not have the capability to install Virtual Paths, regulatetheir networking capacity, or measure any call-level statistics.
A more complete effort for standardizing the Management Information Base for ATM LANs thatmeets the ATM Forum specifications is currently under way in the Internet Engineering Task Force(IETF) [IET94]. This effort focuses on a complete MIB specification based on the SNMP standardfor configuration management, including VP configuration management. Performance managementis also considered but at the cell level only.
The ICM RACE project [ICM93] is defining measures of performance for ATM networks both atthe call and at the cell level and the requirements for Virtual Path connection management. It is ex-pected to deliver a set of definitions of managed objects for VP management and demonstrate an im-plementation of the architecture.
A more complete approach is taken by Griffin and Georgatsos [GRI95] who propose a system thatoffers the generic functions of performance monitoring, load monitoring and VP configuration man-agement in ATM networks. In addition it provides functions for routing and bandwidth managementin a hierarchical structure.
1.2 The Objective
The first objective of this paper is to describe the connection management architecture for establish-ing VC and VP connection services under QOS constraints. In essence, we provide a model for an

Introduction
3
ATM signaling system that provides these services. The signaling system is then instrumented forthe following service and performance management capabilities:
■ Monitoring of individual Virtual Circuits for configuration information and cell-level per-formance.
■ Control of individual Virtual Circuits such as renegotiation of the allocated resources orforcibly removing them from the network if, for example, they are a cause of congestion.
■ Monitoring of the call-level performance of the VC service, such as call arrival rate, block-ing probability, call setup time, etc., at several levels of abstraction. In contrast with thecell-level performance which is provided for every individual VC, the call level perfor-mance contains statistical averages computed by monitoring the total number of VC ser-vice requests.
■ Monitoring of individual Virtual Paths for configuration information and cell-level perfor-mance. The later is computed from the cell-level performance measures of all the VCs thatuse the VP.
■ Installation of new VPs in the ATM network or removal of existing ones
■ VP configuration control, especially with respect to resource allocation.
■ Control of operating parameters of the signaling system such as retransmission time-outs,call setup time-outs, etc., that affect the call level performance of the VP service.
■ Monitoring of network links for configuration and resource utilization information.
■ Control of the admission control policy at links and VPs.
These capabilities are encoded in Managed Objects which are then distributed in the MIBs installedon every agent in the network. In order to do this, an understanding must be developed of how thesemonitoring and control objectives are translated into attribute and behavioral information. This de-sign procedure is empirical and cannot be formalized, and as a result, there exist many possible man-agement system structures that accomplish the above monitoring and control objectives. We providean informal methodology for deriving such a structure and verify our design on the Xunet III ATMbroadband network that covers the continental United States.
The management system that we develop is then used to highlight how the VP service control capa-bilities can influence the performance of the VC service by obtaining measurements that reveal thefundamental trade-off between the throughput and the signaling processing load.
Since the scope of VC and VP management is very broad, we have identified the above managementcapabilities as a basic requirement for these services. Purpose of this work is not to claim that thesecapabilities will be sufficient for solving every management problem regarding these services, butrather to demonstrate how an abstract representation of management requirements can be mappedinto a concrete service management architecture. To this extent, we believe that the work presentedin this paper can serve as an example for solving a large class of service management problems.
This paper is organized as follows. Section 2 presents the architectural framework for installing andmanaging VC and VP connection services. Section 3 describes the Xunet III ATM testbed and otherimplementation details of the service management architecture. Network experiments with the ob-jective of evaluating the management model and the performance of the network under several VPconfigurations are presented in Section 4. Finally, Section 5 summarizes our findings.

An Architecture for Managing Virtual Circuit and Virtual Path Services on ATM Networks
4
2. Architecture
This section presents an overall architectural framework for configuring and managing the perfor-mance of VC and VP services on ATM networks. Section 2.1 presents the Integrated ReferenceModel (IRM). The connection management architecture within the IRM is discussed in Section 2.2.The management architecture is outlined in Section 2.3. Finally, in Section 2.4, the integration of theservice and network management architectures through the network telebase is presented.
2.1 The Integrated Reference Model
To overcome the complexity problems in emerging broadband networks - caused by the variety ofcommunication services to be provided, the required quality of service guarantees, the large numberof network nodes, etc. - there is an urgent need for integrating network management, connectionmanagement and real-time control tasks into a consistent framework. To this end, an overall modelfor network architectures was developed, called theIntegrated Reference Model (IRM) [LAZ92]. Inthis model, the key role for network integration is played by the network telebase, a distributed datarepository that is shared among network mechanisms.
The IRM incorporates monitoring and real-time control, management, communication, and abstrac-tion primitives that are organized into five planes: the network management or N-plane, the resourcecontrol or M-plane, the data abstraction and management or D-plane, the connection managementor C-plane and the user information transport or U-plane (Figure 1). The subdivision of the IRM intothe N-, M- and C-plane on one hand, and the U-plane on the other, is based on the principle of sep-aration between controls and communications. The separation between the N- and, M- and C-planesis primarily due to the different time-scales on which these planes operate.
The N- plane covers the functional areas of network management, namely, configuration, perfor-mance, fault, accounting and security management. Manager and agents, its basic functional com-ponents, interact with each other according to the client-server paradigm. The M-plane comprisesthe entities and mechanisms responsible for resource control, such as cell scheduling, call admission,and call routing; the C-plane those for connection management and control. The user transport or U-plane models the protocols and entities for the transport of user information. Finally, the data ab-straction and management or D-plane (the Telebase) implements the principles of data sharing fornetwork monitoring, control and communication primitives, the functional building blocks of the N-, M-, and C- and U-plane mechanisms. (A mechanism is a functional atomic unit that performs aspecific task, such as setting up a virtual circuit in the network [LAZ93]).
2.2 Connection Management Architecture
According to our model, the VC service is provided to the users through a signaling system. Usersprovide their VC requests to the network through a network node referred to as the networkPoint-of-Presence (POP). Each request for the VC service is parametrized by traffic class, i.e., users canselect any of the traffic classes available from the network (e.g., video, voice, etc.). Every traffic classprovides different QOS guarantees, and so, the users must select the one that best matches their re-quirements. The POP then examines the parameters of the request and initiates a VC setup procedurethrough the ATM network. How the connection is routed is of little importance in this context. Ifthere are available resources in the network, the connection is established and terminated at the des-
Architecture
5
tination user through a remote POP. Otherwise, it is blocked. If the request was successful, the orig-inator (user) is notified that the connection has been established. Through the duration of theconnection the user can renegotiate the allocated resources to the connection. The connection is ter-minated upon a user request or by force from the network operator (the network manager).
The VP connection management architecture can be divided in two parts: the first part describes amodel for establishing VPs, and the second presents a model for VP operation during the VC setupprocedure. In either case, central to the architecture is the D-plane of the IRM. The D-plane containsall information regarding the configuration and operational state of VCs and VPs and is used by thealgorithms of the other planes both for monitoring and control operations.
The establishment of VPs is performed by the signaling system using a hop-by-hop setup procedure.The VP setup request can be presented by a user at a network POP, and in this case the resulting VPis terminated at the user (user-to-user or user-to-network mode). It can also originate from the net-work management system. This happens when a user does not have VP signaling capabilities withwhich to present a VP setup request to the POP, so he notifies the network manager to perform thisoperation on his behalf. The network manager can also establish VPs in network-to-network mode.In this case, VPs are terminated within the network and can be used for routing VC connections atreduced signaling costs.
Protocols
Node
Agent
Manager
User Access Protocols
N-plane
M-plane
D-plane
C-plane
U-plane
Management
User Information
Transport
ConnectionManagementand Control
Data Abstractionand Management
ResourceControl
NetworkManagement
Protocol
Telebase
Figure 1: The Integrated Reference Model

An Architecture for Managing Virtual Circuit and Virtual Path Services on ATM Networks
6
Figure 2 demonstrates an example of the VC and VP setup procedure. The network manager estab-lishes VP D-B in network-to-network mode by initiating the appropriate VP setup procedure at node(POP) D. This VP can be used to route VC connections requested at node D and destined for nodeB. For example, User 3 establishes a connection with User 2 by making a VC request at POP D. TheATM network then routes the requested VC connection over VP D-B and terminates the connectionat User 2. Users can also establish VPs to other users by requesting the service directly from the POP.Alternatively, they can issue a request to the network manager to do this on their behalf. For example,in the above figure, User 1 wishes to establish a VP to User 4. He issues the VP request to the net-work manager and the manager using his VP control interface initiates a VP setup at POP A, indi-cating that the VP should be established in user-to-user mode (i.e., terminated at the customergateway switch).
A VP is established along many physical network links. At every node along the route of the VP, thenecessary networking capacity must be secured from the output link that the VP is traversing. In ourmodel, the networking capacity of links is described by the Schedulable Region (SR) [HYM91], andof VPs by the Contract Region (CR) [HYM93b]. Informally, the Schedulable Region is a surface inak dimensional space (wherek is the number of traffic classes), that describes the allowable combi-nations of calls from each traffic class that can be accepted on the link and be guaranteed Quality ofService. The Contract Region is a region of the SR reserved for exclusive use by the VP. If the re-quested capacity allocation of a VP cannot be achieved, the allocated capacity at the end of the VPestablishment phase is the minimum capacity available on the corresponding links (best effort re-source allocation). If the allocated capacity is not satisfactory, the requestor has the option of releas-ing the VP. The set of all VPs in the network, characterized by their route, Contract Region andassociated configuration information, comprise theVP distribution policy. The VP distribution pol-icy is stored in the D-plane. Figure 3 shows how two VPs can be multiplexed on one physical link.We assume the existence of two traffic classes. QOS can be guaranteed if the sum of the two contractregions (which is a convolution operation) is a region which is strictly below the schedulable regionof the link.
A B
CD
POP
User 1User 2
User 3 User 4
ATM Public Network
Network Manager
network-to-network VP D-B
user-to-user VP 1-4
VC user 3to user 2
Figure 2: Virtual Circuits and Virtual Paths
user VPrequest
VP controls

Architecture
7
An admission control algorithm located in the M-plane formulates the admission control policy(ACP), which is encoded as an object in the D-plane. The ACP is used by the signaling algorithm ofthe C-plane to make admission control decisions for incoming call requests.
Figure 4 shows the interaction between entities in the various planes of the IRM that provide the VP
connection service. During the VP establishment phase, the signaling engine creates a set of 3 ob-jects in the D-plane: the CR, ACP and VP Configuration objects. The VP configuration object con-
Class I
Class II
x1.
x2.
Output Link 1
Output Link 2
Class I
Class II
Class I
Class II Class I
Class IIInput Link 1
Input Link 2
Virtual Path A
Virtual Path B
Class I
Class II
Class I
Class II
Contract Region A
Contract Region B
+
Switching Node
Link 1 Sched. Region
Link 2 Sched. Region
Multiplexed Region for Virtual Paths A and B
Figure 3: Multiplexing of VPs on the same physical link
VP Configuration Contract Region Admission Control Pol.
Virtual CircuitEstablishment
Virtual PathEstablishment
AdmissionControl
C-Plane
D-Plane
M-Plane
Signaling Enginecall establishment VP establishment
requestrequest
VP Connection Service
Schedulable RegionVirtual Circuit
Figure 4: Flow of Information during Installation and Operation of the VP Connection Service

An Architecture for Managing Virtual Circuit and Virtual Path Services on ATM Networks
8
tains general VP configuration information such as the input and output port numbers, the allocationof the VCI space, the VP operational state, etc.
During the VC establishment phase, the signaling engine reads the VP configuration object to deter-mine if the VP can be used to reach the desired destination. It also reads the CR and ACP objects toexamine if the call can be admitted on the VP. When the call has been established, a Virtual Circuitobject is created in the D-plane that contains all necessary information for the VC. This informationincludes the VP Identifier (VPI) and VC Identifier (VCI), the traffic descriptor used to allocate re-sources, and other parameters for performance monitoring.
As mentioned in a previous section, VPs can be used in several ways. If the VP is terminated at theCustomer Premises Equipment (CPE) (user-to-user or user-to-network mode), the customer is con-trolling the VP admission controller. In this case the VP can be regarded as a dedicated virtual link(or pipe) of a rated networking capacity. A network composed of such VPs terminated at the cus-tomer premises is also known as a Virtual Network (VN). The Network Manager has the capabilityto configure and maintain a VN by managing the individual VP components according to the cus-tomer requirements.
Alternatively, the termination of VPs may not be visible to the network customer. In this case (net-work-to-network mode), VPs are used by the network operator to improve the performance of thesignaling system, the availability of resources between a pair of nodes, or even improve certain calllevel measures of Quality of Service for the users, such as call setup time and blocking probability.The existence of network-to-network VPs is completely transparent to the users.
2.3 Network Management Architecture
The Management Architecture builds on the OSI Management model [ISO88]. According to thismodel, network entities (either physical, like hardware modules, or logical, like virtual circuits) aremapped into “Managed Objects” for monitoring and control purposes. The managed objects are alsoreferred to aslogical objectsand the network entities that they represent asreal objects. A Manage-ment Agent contains the information about the managed objects in the Management InformationBase (MIB). Managed objects are characterized by a set of attributes that reflect the state of the cor-responding real object and behavioral information, which defines the result of management opera-tions on the managed object. A proprietary protocol can be used forlinking the state of every realobject to its logical counterpart in the MIB. The Manager connects to the agent(s) and performs op-erations on the objects in the MIB using CMIP (the Common Management Information Protocol).These operations are of synchronous nature, i.e., they are initiated by the manager who, then, waitsfor a reply from the agent(s). Events of asynchronous nature (notifications) such as hardware faultscan be emitted from the agent(s) to the manager using the event reporting primitive of CMIP.
Management operations take place in the N-plane of the IRM (Figure 1). The MIB of every agent islocated in the D-plane of the IRM. As a result, the linking of the logical objects in the MIB with realobjects is done within the D-plane [TSU92]. Control operations from the manager applied to objectsin the MIB are reflected in the state of the real objects of the D-plane, which in turn, affect the be-havior of the algorithms in the C- and M- planes. Conversely, the change of state of the real objectsin the D-plane will cause an update of the state of the logical objects in the MIB.

Architecture
9
The question that arises is how to define the appropriate managed objects and their attribute structurethat will satisfy the monitoring and control requirements of the management problem at hand. Asmentioned previously, this procedure cannot be formalized. However, the manager can follow thefollowing rules of thumb:
■ In object-oriented modeling, a system can be represented by defining logical equivalents(objects) of the physical entities that will be managed. For example, the MIB in our servicemanagement system can contain objects that relate to Virtual Circuits, Virtual Paths, phys-ical Links, Hardware Modules, etc.
■ The quantities that need to be monitored and controlled in each one of these objects can berepresented as one of their attributes. For example, the cell loss probability for a VC can berepresented as one of the attributes of the corresponding managed object.
■ Every attribute is assigned a “behavior”. The behavior indicates the semantics of manage-ment operations (such asget andset ) on the attribute. For example, every VP objectcontains an attribute representing the contract region (CR) of the VP. Using the behavioraldescription, the agent knows how to obtain the value of the contract region from the D-plane upon aget operation. When the CR is modified with aset operation, the agentknows also how to propagate this change in the D-plane, and then to the signaling system,which in turn will initiate a procedure to modify the allocated capacity of the VP.
■ There may exist objects in the managed system that do not represent physical network en-tities. For example, our model needs to monitor the call-level performance of the VC ser-vice between a source and a destination POP. In this case, a managed object can be definedwith attributes whose value is obtained from the appropriate state and event information inthe D-plane. In this example, performance measures such as call arrival rate, etc., can beextracted by filtering event information in the D-plane related to VC setup requests. Thefilter is such that only VC requests between the POP pair are taken into account.
Managed object attributes are therefore either a reflection of an attribute of an object in the D-plane,or the result of processing and filtering operations on several D-plane objects and event information.Therefore, for every managed object attribute, the management system implementor must provideinformation on how the value of the attribute is obtained from the D-plane, or, in the case of controloperations, how the new attribute value is propagated in the D-plane. This procedure is also knownas thestate linking of the physical and the logical objects, and must be coded in every agent of themanagement system.
Therefore, in our model, monitoring and control of the VC and VP services is possible by definingthe appropriate managed objects in the MIB and linking them to the appropriate entities of the D-plane. What managed objects to define, how to integrate them in the D-plane and how to define theirbehavior will be the topic of the following section.
2.4 Integration of the Connection and Network Management Architecture
The purpose of this section is to describe the object level model for VC and VP management and itsintegration within the D-plane. Management operations take place in the N-plane. Our objective isto translate the management system requirements that were outlined in Section 1.2 into a manage-ment cycle and then into concrete managed object definitions.

An Architecture for Managing Virtual Circuit and Virtual Path Services on ATM Networks
10
2.4.1 The Management Cycle for VC and VP Management
One of the objectives of service management is to ensure that services are provided to the users withQuality of Service guarantees. In order to evaluate the offered service QOS, the manager must firstdefine a set of service performance measures. [NEU93] defines two different levels of refinement forperformance management purposes: the call level and the cell level (Figure 5). On the call level, we
consider the ATM network as the service provider. The user makes service requests by attemptingto establish VC connections of a certain traffic class (e.g., voice, video, etc.). The call level perfor-mance measures include the following:
■ Call request (arrival) rate: average number of connection requests in the unit of time
■ Utilization and capacity: number of currently open connections and maximum number ofopen connections allowed (due to limits in the available networking capacity or availabilityof VC identifiers).
■ Service time: average holding time of connections. The service time multiplied by the re-quest rate gives the offered load in Erlangs.
■ Blocking (or Error) rate: the rate of calls being blocked due to resource unavailability orother errors. Further subdivision of this quantity into categories can give more informationon the rates with which every error occurs. For example we can measure the rate withwhich connections are being blocked due to networking capacity unavailability, routing er-rors, virtual circuit identifier unavailability, signaling errors, etc. The ratio of the error ratewith the request rate gives the blocking probability.
User
(Connection Establishment phase)
Network
Call Requests
Call Request Rate
Circuit utilizationCall Setup TimeCall Holding TimeBlocking RateSignaling Load
Call Level Cell Level
User
Network
User Data
Cell Arrival Rate
Cell Dropped RateCell Delay
(Data Transmission phase)
Cell ThroughputCall Throughput
Figure 5: Performance Management Related Properties at the Call and the Cell Level
Architecture
11
■ Signaling load: this quantity measures the load imposed on the signaling system and de-pends on the call request rate and the necessary time to complete the connection setup re-quest. The higher the load, the less the ability of the signaling system to provide theservice. Factors that contribute in increasing the signaling load are: high number of signal-ing message retransmissions due to protocol errors, higher percentage of connection at-tempts over routes with many hops (that increases the number of transmitted messages),high call arrival rates, etc.
The second level of refinement for performance monitoring purposes refers to the data transmissionphase of communication, after the connection has been established. The user and the network main-tain the service user / service provider relationship but with different semantics: the user sends cellsto the network for transmission. The following performance related properties are of significance:
■ Cell arrival rate: average number of cells arriving from the user in the unit of time.
■ Cell drop rate: average number of cells that are being dropped in the unit of time.
■ Cell throughput: average number of cells transmitted successfully.
■ Cell transmission delay: average delay for to transmitting of a cell from the time it hasbeen received at the input port.
We can see that cell level measurements are related to the performance of individual VC connec-tions. The call level measurements however are not tied to a specific connection but represent statis-tical performance measures for the VC service. Further, the call level measurements can becomputed at different levels of abstraction by considering only the appropriate subset of VC servicerequests. For example, we can measure the call level performance by isolating the VC requests be-tween a source and a destination POP (also referred to as a Source-Destination pair - SDP), or byconsidering only the requests offered to a specific link admission controller, etc.
The manager observes the above service performance measures and determines whether servicesmeet their QOS requirements. The objective at the call level is to provide a bounded call blockingprobability and call setup time for every SDP in the network. Blocking can be caused by several fac-tors including a faulty link, a poor VP capacity allocation policy, a routing malfunction, an overload-ed signaling processor, etc. High call set up times may prompt the user to cancel his request, leadingto loss of revenue for the service provider. At the cell level, the objective is to guarantee the negoti-ated QOS parameters. We assume that cell level QOS is provided by the network traffic control func-tions that operate in real time, and therefore does not require the intervention of the servicemanagement system. We also assume in the sequel that users make requests for the VC service only,i.e, VPs are employed only by the network manager in network-to-network mode.
The manager can satisfy the above call-level QOS objectives by controlling the VP distribution inthe network and other parameters of the signaling system. In more detail, the manager has availablethe following set of controls:
1. Create a VP.
2. Delete a VP.
3. Change the Contract Region of a VP.
4. Change the Admission Control Policy of links or VPs.
An Architecture for Managing Virtual Circuit and Virtual Path Services on ATM Networks
12
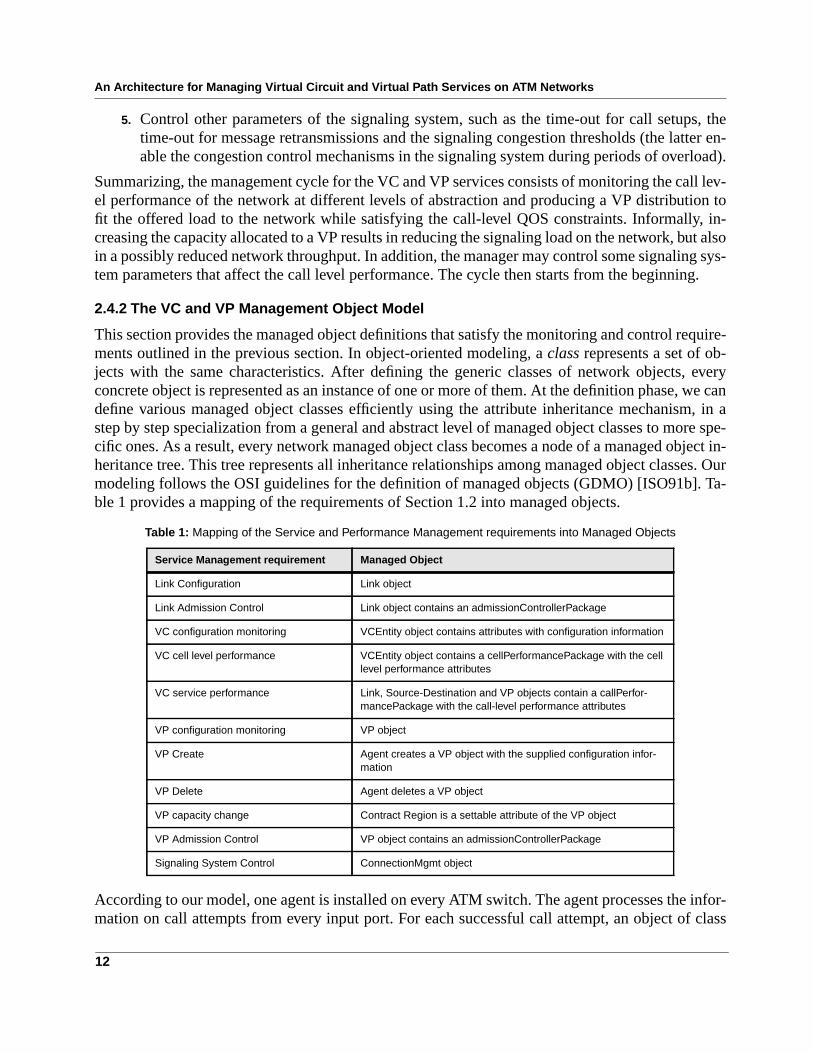
5. Control other parameters of the signaling system, such as the time-out for call setups, thetime-out for message retransmissions and the signaling congestion thresholds (the latter en-able the congestion control mechanisms in the signaling system during periods of overload).
Summarizing, the management cycle for the VC and VP services consists of monitoring the call lev-el performance of the network at different levels of abstraction and producing a VP distribution tofit the offered load to the network while satisfying the call-level QOS constraints. Informally, in-creasing the capacity allocated to a VP results in reducing the signaling load on the network, but alsoin a possibly reduced network throughput. In addition, the manager may control some signaling sys-tem parameters that affect the call level performance. The cycle then starts from the beginning.
2.4.2 The VC and VP Management Object Model
This section provides the managed object definitions that satisfy the monitoring and control require-ments outlined in the previous section. In object-oriented modeling, aclass represents a set of ob-jects with the same characteristics. After defining the generic classes of network objects, everyconcrete object is represented as an instance of one or more of them. At the definition phase, we candefine various managed object classes efficiently using the attribute inheritance mechanism, in astep by step specialization from a general and abstract level of managed object classes to more spe-cific ones. As a result, every network managed object class becomes a node of a managed object in-heritance tree. This tree represents all inheritance relationships among managed object classes. Ourmodeling follows the OSI guidelines for the definition of managed objects (GDMO) [ISO91b]. Ta-ble 1 provides a mapping of the requirements of Section 1.2 into managed objects.
According to our model, one agent is installed on every ATM switch. The agent processes the infor-mation on call attempts from every input port. For each successful call attempt, an object of class
Table 1: Mapping of the Service and Performance Management requirements into Managed Objects
Service Management requirement Managed Object
Link Configuration Link object
Link Admission Control Link object contains an admissionControllerPackage
VC configuration monitoring VCEntity object contains attributes with configuration information
VC cell level performance VCEntity object contains a cellPerformancePackage with the celllevel performance attributes
VC service performance Link, Source-Destination and VP objects contain a callPerfor-mancePackage with the call-level performance attributes
VP configuration monitoring VP object
VP Create Agent creates a VP object with the supplied configuration infor-mation
VP Delete Agent deletes a VP object
VP capacity change Contract Region is a settable attribute of the VP object
VP Admission Control VP object contains an admissionControllerPackage
Signaling System Control ConnectionMgmt object

Architecture
13
VcEntity is created for the corresponding Virtual Circuit connection (VC). Each VC object containsconfiguration information such as the number of the input and output slot, Virtual Path Identifier(VPI) and Virtual Circuit Identifier (VCI). In ATM terminology, this implies that the VC object mod-els the input and output Virtual Circuit Link (VCL) at every switch. Thus, the end-to-end manage-ment of a VC that spans many switches (and hence has one instance in each OSI agent at everyswitch) is achieved by managing the individual objects in combination. Additional attributes foreach VC include the call establishment time, traffic descriptor (composed of a service class charac-terization and the allocated networking capacity in kilobits per second), adaptation layer informationand source/destination end-user service information. The packagecellPerformancePackage containsattributes associated with the cell-level performance related parameters, and will be described below.
The classVirtualPath derived fromTop is used to describe a VP. The VP object in analogy with theVC object is comprised of an incoming and an outgoing part at every switch. At the VP source ortermination point, the VP has only an outgoing / incoming part respectively. Attributes used to de-scribe the configuration of the Virtual Path are:vpIdentifier (VPI), vpSource, vpDestination (VPsource and termination address),circuitCapacity andtimeEstablished. The VP object at the sourcealso contains acallPerformancePackage, and anadmissionControllerPackage.These will be de-scribed below.
The classLink is derived fromTop and is used to model input or output network links. The manda-tory attributes for this class arelinkType (input or output),linkModuleDescription (describes thehardware of the link interface),linkSource, linkDestination andlinkSlotNumber (the slot number thelink is attached to). If it corresponds to an output link, it contains acallPerformancePackage, and anadmissionControllerPackage.
The classSourceDestination is used to describe the call level activity between a pair of nodes, andcan be used to evaluate the call level performance in an end-to-end fashion. A Source-Destination(SD) object exists in the agent if there is call-level activity between the two nodes, and the sourcenode is either the local switch, or a directly attached User-Network Interface (UNI). The SD objectcontains the following attributes:sourceNodeAddress anddestinationNodeAddress and acallPerfor-mancePackage.
ThecallPerformancePackageis an optional package that measures the call-level performance. It iscontained in all SD objects, and in some link and VP objects. For the objects of classLink, the pack-age measures the activity for calls that follow the link but not a VP that uses the same link. For VPobjects, the package measures the activity of call requests that use the VP. The attributes of thecall-PerformancePackageare the following:activeCircuits, callArrivalRate(average arrival rate of re-quests in calls/min),callArrivedCounter (counter of call requests),callResourceBlockedCounter(counter of calls blocked due to resource unavailability),callErrorBlockedCounter (counter of callsblocked due to protocol errors, e.g., time-outs, etc.),callBlockingRate (average rate of calls blockedfor any reason in calls/min),setupTime (average time to establish the connection in milliseconds),holdingTime (average duration of connections in seconds),numExchangedMessages (average num-ber of messages that have been exchanged to setup the connections, as an indicator of the processingrequired for each connection), andmeasureInterval (the time in which the above averages are com-puted in seconds). All quantities are measured separately for each traffic class, and then a total overall classes is computed.

An Architecture for Managing Virtual Circuit and Virtual Path Services on ATM Networks
14
The cellPerformancePackage measures cell-level performance. The attributescellTransmitted-Counter, cellTransmissionRate, cellDroppedCounter andcellDroppedRate measure the number ofcells transmitted or blocked and their respective time averages. The attributeavgCellDelay measuresthe average time from the reception till the transmission of cells from the switch. The package is in-cluded in objects of classVcEntity, and in this case, only the cells belonging to the VC are measured.As an option, it can also be included in objects of class Link, SourceDestination or VirtualPath. Inthe latter case, a sum of the attributes over all VC objects that belong to the Link/SourceDestination/VirtualPath is computed, and the respective attributes of the Link/SourceDestination/VirtualPath ob-jects are updated.
The packageadmissionControllerPackageis mandatory for output link and VP objects. It describesthe state of the admission controller, which is located at the output links (for switches with outputbuffering) and at all VP source points. The package contains the following attributes:networking-Capacity (the schedulable region for link objects or the contract region for VP objects),admission-ControllerOperatingPoint (the operating point of the admission controller given the established callsfor each traffic class),admissionControlPolicy, admissionControllerOperationalState (enabled (callrequests allowed to go through and allocate bandwidth) or disabled) andadmissionControllerAd-ministrativeState.
The classConnectionMgmt contains attributes that control the operation of the local signaling entity.There is only one instance of this class in every agent. The attributes of this class are the following:signalingProcessingLoad (an index of the call processing load observed by the signaling processor),maxSignalingProcessingLoad (the maximum signaling load value allowed, beyond which the sig-naling processor denies all call establishment requests),signalingRetransmitTimeout (the time-outvalue in milliseconds for retransmitting a message if no reply has been received), andsignaling-CallSetupTimeout (the maximum acceptable setup time in milliseconds for a call establishment. Ifthe time to establish a circuit is more than the current value, the circuit is forced to a tear-down). Thesingle instance of this class is also used to contain four other container objects of classLinkMgmt,SourceDestinationMgmt, VirtualPathMgmt, and VirtualCircuitMgmt. There is only one instancefrom each of these four classes, which is used to contain all objects of classLink, SourceDestination,VirtualPath, andVirtualCircuit, respectively.
Figure 6 shows the inheritance tree of the object model. For simplicity, we omitted the definition of
associated thresholds for each performance variable that can trigger notifications in case of thresholdcrossing [ISO92]. Such definitions can be easily incorporated in the above model.
Top ConnectionMgmt
VcMgmt
VcEntity
VPMgmt
LinkMgmt
SrcDestMgmtLink
SourceDestination
VirtualPath
Figure 6: The Inheritance Tree
Implementation of the VC and VP Management Architecture
15
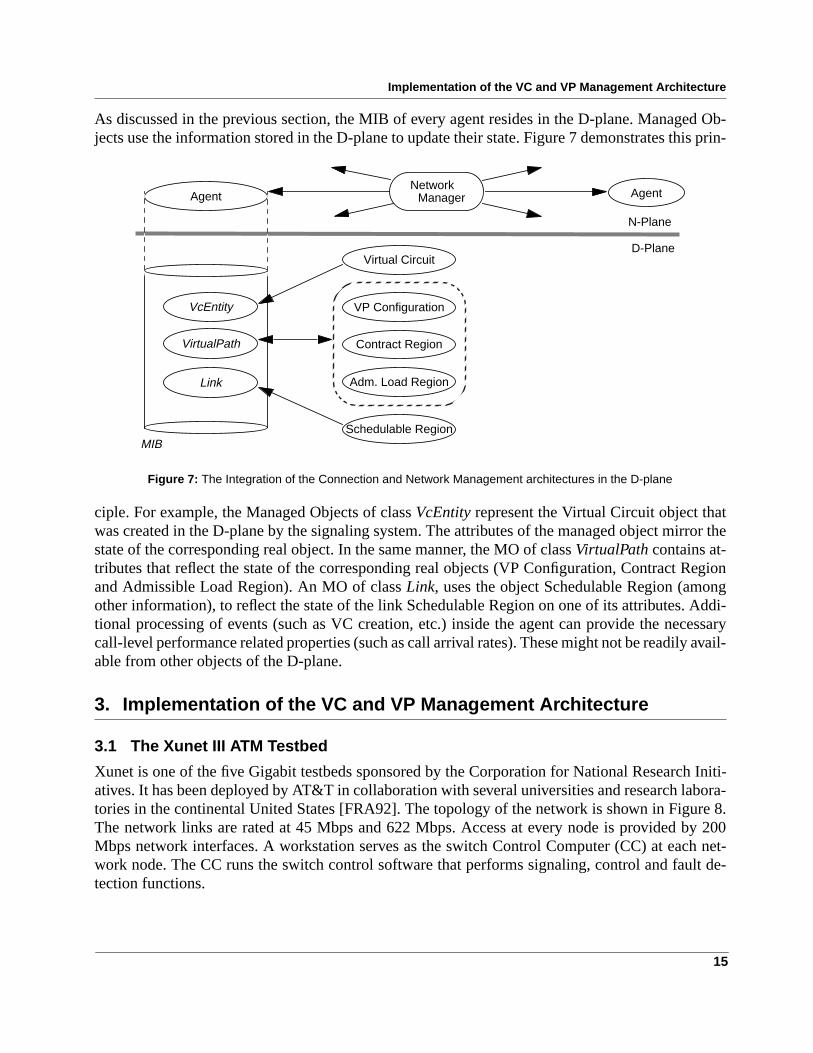
As discussed in the previous section, the MIB of every agent resides in the D-plane. Managed Ob-jects use the information stored in the D-plane to update their state. Figure 7 demonstrates this prin-
ciple. For example, the Managed Objects of classVcEntity represent the Virtual Circuit object thatwas created in the D-plane by the signaling system. The attributes of the managed object mirror thestate of the corresponding real object. In the same manner, the MO of classVirtualPath contains at-tributes that reflect the state of the corresponding real objects (VP Configuration, Contract Regionand Admissible Load Region). An MO of classLink, uses the object Schedulable Region (amongother information), to reflect the state of the link Schedulable Region on one of its attributes. Addi-tional processing of events (such as VC creation, etc.) inside the agent can provide the necessarycall-level performance related properties (such as call arrival rates). These might not be readily avail-able from other objects of the D-plane.
3. Implementation of the VC and VP Management Architecture
3.1 The Xunet III ATM Testbed
Xunet is one of the five Gigabit testbeds sponsored by the Corporation for National Research Initi-atives. It has been deployed by AT&T in collaboration with several universities and research labora-tories in the continental United States [FRA92]. The topology of the network is shown in Figure 8.The network links are rated at 45 Mbps and 622 Mbps. Access at every node is provided by 200Mbps network interfaces. A workstation serves as the switch Control Computer (CC) at each net-work node. The CC runs the switch control software that performs signaling, control and fault de-tection functions.
VP Configuration
Contract Region
Adm. Load Region
NetworkManager
D-Plane
N-Plane
Schedulable Region
VcEntity
Agent
Virtual Circuit
VirtualPath
MIB
Link
Agent
Figure 7: The Integration of the Connection and Network Management architectures in the D-plane

An Architecture for Managing Virtual Circuit and Virtual Path Services on ATM Networks
16
3.2 The Xunet Signaling and Admission Control Architecture
Xunet supports five traffic classes. Class 1 is used for high priority control messages and is givenabsolute priority by the link scheduler (multiplexer). Class 2 is used for Video service, Class 3 forVoice, Class 4 for priority data and Class 5 for bulk data [SAR93].
A signaling system very similar in characteristics with the CCSS#7 (Common Channel SignalingSystem) has been installed on Xunet. The system allows virtual circuit establishment with best effortresource allocation in a single pass. An admission controller operates on every output link. The nec-essary Schedulable Region and Admission Control Policy objects are downloaded from a manage-ment station. The admission control policy used is Complete Sharing [HYM93a].
Virtual Path establishment is also done in one pass with best effort resource allocation. When the VPhas been established, an admission controller is activated at the source node of the VP that uses theallocated contract region for admission control decisions. The admission control policy is also Com-plete Sharing. A signaling channel is also established between the two VP termination points to carryVC establishment requests over the VP. It operates in the same way as the signaling channel used onevery physical link. As a result, from the point of view of the signaling system, VPs are consideredas regular links with only minor differences.
Every Contract Region can be changed dynamically. The deallocation or allocation of additional re-sources is performed in the same way as in the VP establishment phase. Finally, when a VP is re-
Columbia XUNET NetworkManagement Center
CMIS/CMIP
Berkeley
LLNL-Sandia
Chicago
Oakland
Madison
Urbana
MurrayHill
OSI Manager
Rutgers
Newark
Exper
Figure 8: The Xunet Management System

Implementation of the VC and VP Management Architecture
17
moved, the Contract Region is returned to the Schedulable Regions of the links along the path, allVCs using the VP are forced to termination and the VP signaling channel is destroyed.
3.3 The Xunet OSI Management System
From the five functional areas covered by the OSI management model, we have chosen to supportconfiguration, fault and performance management for Xunet (the remaining functional areas beingsecurity and accounting management). The fault management architecture enables us to monitorclosely all the network switches for hardware faults, such as link level errors, buffer overflows, etc.The configuration management architecture allows us to monitor and control the hardware configu-ration of the switch and the configuration of the VC and VP services. The performance managementarchitecture provides the service performance measures outlined in Section 2.4.
As the basis of our OSI Management system, we have selected the OSIMIS software [KNI91]. Ourimplementation expanded the agent with managed objects for Xunet and the management applica-tions to include powerful graphics that depict the operational state of the network and a point-to-mul-tipoint control interface that facilitates the overall management task [ANE93]. The managementapplications run at Columbia University. TCP/IP sockets are used at the transport layer to connectto the agent at each site. Inside the agents, communication between logical and physical objects isachieved by using a proprietary protocol between the agent and the Xunet switch. For this purpose,we use UDP/IP packets over a local Ethernet. The structure of the system is shown in Figure 9.
3.4 The OSI Agent
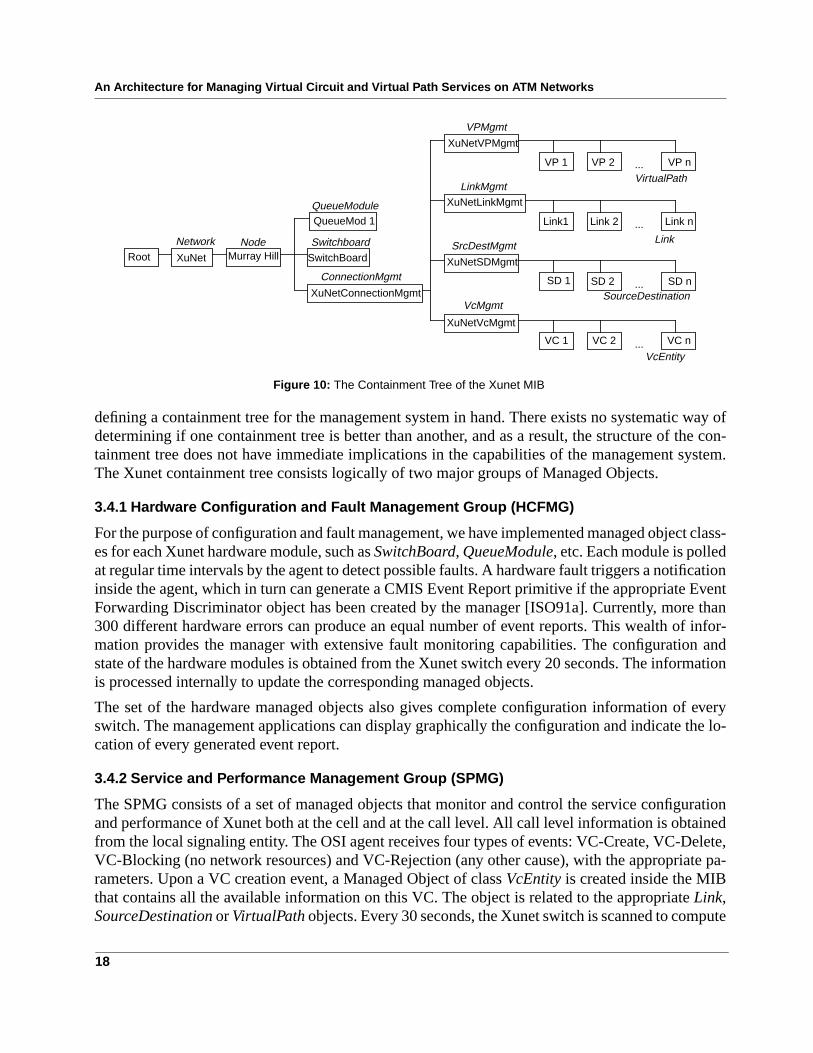
The OSI agent contains managed objects for configuration, fault and performance management. Fig-ure 10 shows the containment tree for the Xunet MIB. In contrast with the inheritance tree, the con-tainment tree depicts the organization of managed objects in the MIB. Its main usage is in thedefinition of the Distinguished Names (DNs) that specify each managed object instance. However,since the containment relationship specifies only a naming relationship, there exist many ways of
Queue Mod 1
Queue Mod 2
SwitchBoardether
Xunet SwitchSGI Control Computer
Link
ControllerVP Admission
SchedRegion
Signaling Engine
ContractRegion
AdmissionController
Connection Mgmt Software
OSI Agent
MIB
OSIMIS
Line 1
Line 2
OSI Manager
VC1VC2 VP1
SrcDest 1 Link 2
Workload MonitoringSystem
VC CreateVC DeleteVC Reject
VP CreateVP SetVP Delete
Switch ConfigurationFault ManagementVirtual Path
ManagementPerformanceMonitoringNetwork Topology
Figure 9: Structure of the Xunet Management System
Call/Cell Generation
VC Block
Queue Mod 3 Line 3
An Architecture for Managing Virtual Circuit and Virtual Path Services on ATM Networks
18
defining a containment tree for the management system in hand. There exists no systematic way ofdetermining if one containment tree is better than another, and as a result, the structure of the con-tainment tree does not have immediate implications in the capabilities of the management system.The Xunet containment tree consists logically of two major groups of Managed Objects.
3.4.1 Hardware Configuration and Fault Management Group (HCFMG)
For the purpose of configuration and fault management, we have implemented managed object class-es for each Xunet hardware module, such asSwitchBoard, QueueModule, etc. Each module is polledat regular time intervals by the agent to detect possible faults. A hardware fault triggers a notificationinside the agent, which in turn can generate a CMIS Event Report primitive if the appropriate EventForwarding Discriminator object has been created by the manager [ISO91a]. Currently, more than300 different hardware errors can produce an equal number of event reports. This wealth of infor-mation provides the manager with extensive fault monitoring capabilities. The configuration andstate of the hardware modules is obtained from the Xunet switch every 20 seconds. The informationis processed internally to update the corresponding managed objects.
The set of the hardware managed objects also gives complete configuration information of everyswitch. The management applications can display graphically the configuration and indicate the lo-cation of every generated event report.
3.4.2 Service and Performance Management Group (SPMG)
The SPMG consists of a set of managed objects that monitor and control the service configurationand performance of Xunet both at the cell and at the call level. All call level information is obtainedfrom the local signaling entity. The OSI agent receives four types of events: VC-Create, VC-Delete,VC-Blocking (no network resources) and VC-Rejection (any other cause), with the appropriate pa-rameters. Upon a VC creation event, a Managed Object of classVcEntity is created inside the MIBthat contains all the available information on this VC. The object is related to the appropriateLink,SourceDestination orVirtualPath objects. Every 30 seconds, the Xunet switch is scanned to compute
SwitchBoardRoot XuNet Murray Hill
XuNetConnectionMgmt
XuNetVcMgmt
QueueMod 1
Node Switchboard
ConnectionMgmt
VcMgmt
Network
XuNetSDMgmt
XuNetLinkMgmt
LinkMgmt
XuNetVPMgmt
VC 1 VC 2 VC n
VcEntity
SD 1 SD 2 SD nSourceDestination
Link1 Link 2 Link n
LinkSrcDestMgmt
VPMgmt
VP 1 VP 2 VP n
VirtualPath
QueueModule
...
...
...
...
Figure 10: The Containment Tree of the Xunet MIB

Implementation of the VC and VP Management Architecture
19
the number of cells transmitted or dropped for each VC. At the same time we use this informationto update the total number of cells transmitted or lost on a link, SD pair or VP based on the relationsdefined when the VC was created. The VC object is removed by a deletion event.
All 4 event types cause the agent to update some internal counters in the corresponding Link/SD/VPobjects. Additional processing is performed at a regular time interval (controllable by the managerthrough themeasureInterval attribute, and usually set to 30 seconds). At that time, the agent calcu-lates the values for the performance related attributes, taking into account only the events that oc-curred during the past interval. For example, when a VC is created, a counter that registers the callarrivals is incremented. At the end of the 30 second period, the arrival rate is calculated, and thecounter is reset to zero. All other attributes are calculated in a similar fashion. Figure 11 shows the
procedure for creating VC objects and updating the objects that contain the call-level performancepackage.
VP management functions originate at the network manager site. When the management applicationissues acreate command with the appropriate parameters, a VP managed object inside the MIBis instantiated, and the Xunet signaling entity is informed to initiate a VP setup procedure. VPs canbe subsequently modified by theset command operating on the appropriate object, and deletedwith adelete command.
Parameters of the signaling entity are controlled throughset operations on attributes of theCon-nectionMgmtobject. Eachset operation causes a control message to be sent from the agent to thesignaling entity.
3.5 The OSI Manager
Xunet is monitored and controlled through a Motif/X-Toolkit-based application. The same applica-tion is used to run controlled call and cell generation experiments on Xunet. It consists of six tightlyinterconnected subsystems (Figure 9). Every subsystem contains the appropriate display tools andmanagement interface functions for a specific management task:
1. Switch Configuration: Displays the hardware configuration of the switch using informationfrom the objects of the HCFMG.
User
Create object ofclass VcEntity Update Link Object
Update VP Object
Update SD Object
FollowsLink?
CallAccepted?
Follows
VP?
Node Adirectly attached
?
Cal
l Atte
mpt
(Nod
e A
to n
ode
B) OSI Agent
UpdateCallLevelStatistics
Figure 11: Flowchart for computing the call level performance
yes
no
An Architecture for Managing Virtual Circuit and Virtual Path Services on ATM Networks
20
2. Fault Management: Receives OSI Event reports from the agents, that are related to hardwareproblems, and uses the Switch Configuration subsystem’s display functions to inform themanager about the nature and location of the problem.
3. Network Topology: Displays a map of the network, with all switches, links and attacheduser-network interfaces. The displayed objects can be selected and observed independently.Support is also provided for displaying the route and configuration information of VPs.
4. Virtual Path Management: The manager is able to create and subsequently control VPs withcreate andset operations. The VP control task is guided by the observations obtainedfrom the Performance Monitoring system.
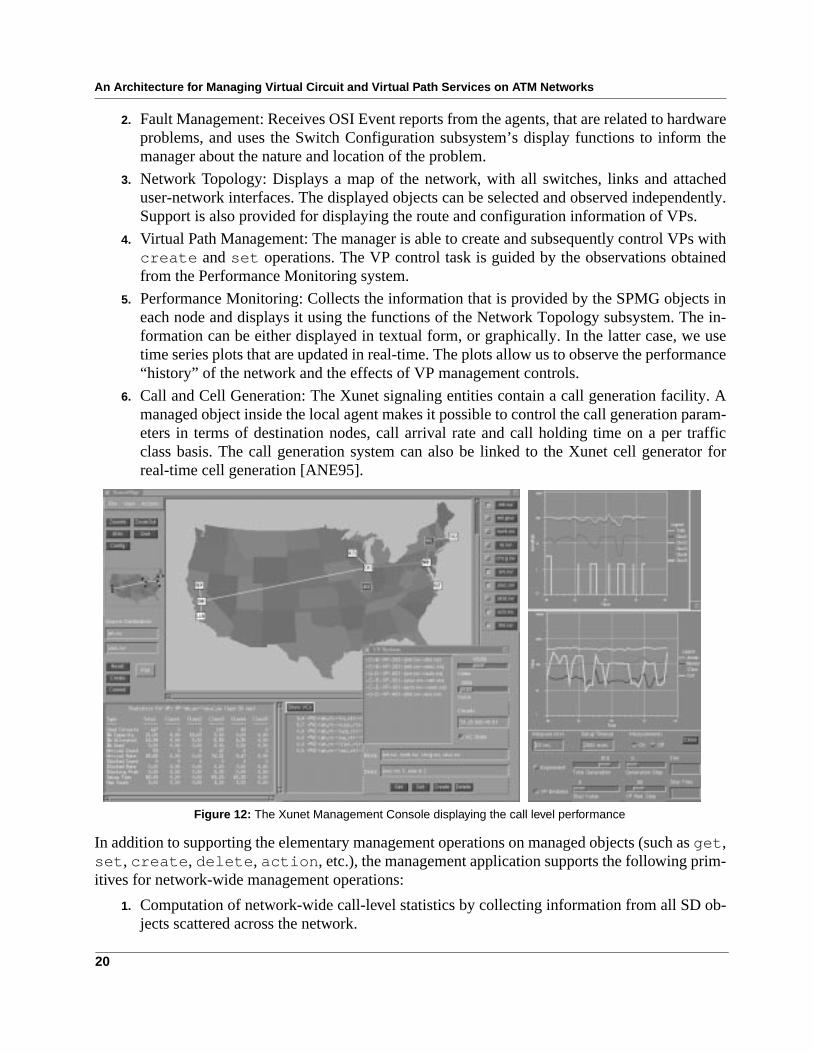
5. Performance Monitoring: Collects the information that is provided by the SPMG objects ineach node and displays it using the functions of the Network Topology subsystem. The in-formation can be either displayed in textual form, or graphically. In the latter case, we usetime series plots that are updated in real-time. The plots allow us to observe the performance“history” of the network and the effects of VP management controls.
6. Call and Cell Generation: The Xunet signaling entities contain a call generation facility. Amanaged object inside the local agent makes it possible to control the call generation param-eters in terms of destination nodes, call arrival rate and call holding time on a per trafficclass basis. The call generation system can also be linked to the Xunet cell generator forreal-time cell generation [ANE95].
In addition to supporting the elementary management operations on managed objects (such asget ,set , create , delete , action , etc.), the management application supports the following prim-itives for network-wide management operations:
1. Computation of network-wide call-level statistics by collecting information from all SD ob-jects scattered across the network.
Figure 12: The Xunet Management Console displaying the call level performance

Performance
21
2. Installation of the VP distribution policy in the entire network.
3. Activation and deactivation of all call generators in the network.
4. Performance
We have used the management system to run controlled experiments on Xunet to study the call levelperformance of the network, such as the performance of the signaling system and the networkthroughput under various VP distribution policies. Call level experiments consist of loading the sig-naling system with an artificial call load. A Call Generator on every switch produces call requestswith exponentially distributed interarrival and holding times. The call-level experiments have beenseparated in two phases. In the first phase, we measure the performance of the signaling system with-out using VPs. This experiment allows us to find suitable values for the congestion control parame-ters of the signaling entities that give the highest call throughput. The second phase builds upon thefirst phase and attempts to determine the call throughput by measuring the performance of the net-work with VPs in place.
4.1 Performance of the Signaling System for Virtual Circuit Set-Up
In this experiment, the network was loaded with an artificial call pattern. Our goal was to measurethe performance of the signaling system under heavy call arrivals. For each call, the signaling systemsets up a VC by traversing all the nodes in the path and patching the appropriate connections in eachnode. Call generation is controllable for each destination in terms of the call arrival rate and callholding time for each of the five traffic classes supported by Xunet. The network was homogeneous-ly loaded from five sites (Murray Hill, Rutgers U., U. of Illinois, U.C. Berkeley and Livermore) withPoisson call arrivals and an exponential holding time with a mean of 3 minutes. We used only videocalls (assumed to consume a peak of 6 Mbps/call) and voice calls (64 Kbps/call) in a ratio of 1:10(i.e., the arrival rate of voice calls is 10 times greater). All the links in the experiment described hereare of 45 Mbps capacity. The schedulable region (SR) of each link assumed to be given by a twodimensional hyperplane. We used peak rate allocation, and according to this scheme, the SR can ac-commodate a maximum of 7 video calls or 703 voice calls. The admission control policy used wascomplete sharing [HYM93a].
Figure 13 shows the measurements obtained by gradually increasing the call generation rate. Eachmeasurement (throughput, call setup time, call blocking, etc.) is computed by adding (or averaging)the respective measurements for the video and voice traffic. Both the call throughput and call block-ing due to resource unavailability (the “Throughput” and “Blocked Percentage” curves) rise almostlinearly with the call arrival rate. The sudden drop in the total call throughput is due to the overload-ing of the signaling system with call setup requests. At that point, the call setup time and the per-centage of calls blocked due to congestion of the signaling system (the “Rejected Percentage” plot)start to rise sharply. The “Blocked Percentage” curve drops because the strain has now been movedfrom network transport to call setup, and thus, calls contend for signaling resources rather than net-working resources. During overload, only a small percentage of the total call attempts is actually es-tablished, and therefore, the probability that these calls will find no networking capacity available isdiminished. In the extreme situation, all calls are blocked while the networking capacity of all linksis unused.

An Architecture for Managing Virtual Circuit and Virtual Path Services on ATM Networks
22
The congestion situations seem to appear first at the Newark and Oakland switches, that are the firstto become overloaded with call request messages. It is therefore essential for the network managerto regulate the call arrival rate at the entry points in the network. This can be done by setting an ap-propriate value for themaxSignalingProcessingLoad attribute of the ConnectionMgmt object. Thesignaling load is computed from the number of signaling messages received and transmitted fromthe switch in the unit of time. If the load reaches themaxSignalingProcessingLoad value, a fractionof the incoming call requests are discarded. We have found experimentally that by restricting the sig-naling load to about 450 messages per minute at the nodes connected to the call generators, the net-work operates within the capacity of the signaling processors.
4.2 Performance Trade-off due to VP Capacity Allocation
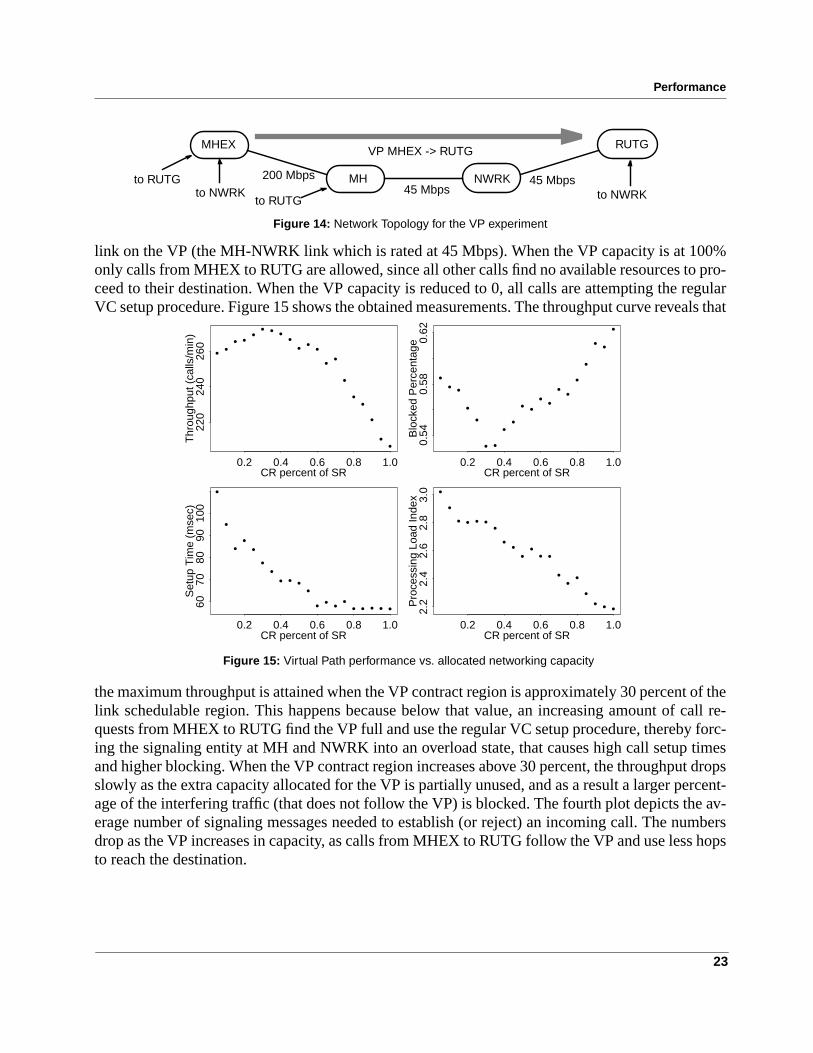
This experiment had the objective of studying the trade-off between the network throughput and theallocation of networking capacity to VPs. It was performed on the east coast segment of the network.This four node segment consists of two nodes in MurrayHill (called MHEX and MH), one node inNewark (NWRK), and one at Rutgers University (RUTG) connected in tandem.
The generation ratio between Class 2 and Class 3 calls was 1:100. The call arrival rate from each callgenerator was kept fixed throughout the experiment. The generator at MHEX produces traffic toNWRK (180 calls/min) and RUTG (210 calls/min). The generator at MH produces only traffic toRUTG at 180 calls/min. The generator at RUTG produces traffic to NWRK at 180 calls/min. OneVP is established from MHEX to RUTG (Figure 14).
Only the traffic from MHEX to RUTG is allowed to follow the VP. Calls that find the VP full andthe calls from other traffic generators follow a hop by hop call setup procedure, that is, trying to se-cure bandwidth on each hop. By contrast, calls that follow the VP contend for bandwidth only at theVP source node. The capacity of the VP varies from 0 to 100 percent of the capacity of the smallest
Figure 13: Performance of the Signaling System
•••
••• ••
•••
•••••
••••••••
••••
•• •
•
••
• •
Call Arrival Rate (Calls/min)
Thr
ough
put
100 200 300 400 500 600
5015
025
0
•• • •••
•• • •
•••••••• •••••• • •••
• •••••
••
Call Arrival Rate (Calls/min)
Set
up T
ime
(mse
c)
100 200 300 400 500 600
200
400
600
800
1000
•
•• ••
• ••• ••
••••••••••••• • ••
•••
•
•
••
• •
Call Arrival Rate (Calls/min)
Blo
cked
Per
cent
age
100 200 300 400 500 600
0.05
0.10
0.15
0.20
•• • ••• •• • •• ••••••• •••••• •
•••
•
•••••
• •
Call Arrival Rate (Calls/min)R
ejec
ted
Per
cent
age
100 200 300 400 500 6000.
00.
20.
40.
60.
81.
0
Performance
23
link on the VP (the MH-NWRK link which is rated at 45 Mbps). When the VP capacity is at 100%only calls from MHEX to RUTG are allowed, since all other calls find no available resources to pro-ceed to their destination. When the VP capacity is reduced to 0, all calls are attempting the regularVC setup procedure. Figure 15 shows the obtained measurements. The throughput curve reveals that
the maximum throughput is attained when the VP contract region is approximately 30 percent of thelink schedulable region. This happens because below that value, an increasing amount of call re-quests from MHEX to RUTG find the VP full and use the regular VC setup procedure, thereby forc-ing the signaling entity at MH and NWRK into an overload state, that causes high call setup timesand higher blocking. When the VP contract region increases above 30 percent, the throughput dropsslowly as the extra capacity allocated for the VP is partially unused, and as a result a larger percent-age of the interfering traffic (that does not follow the VP) is blocked. The fourth plot depicts the av-erage number of signaling messages needed to establish (or reject) an incoming call. The numbersdrop as the VP increases in capacity, as calls from MHEX to RUTG follow the VP and use less hopsto reach the destination.
MHEX VP MHEX -> RUTG
MH NWRK
RUTG
to NWRKto RUTG
to RUTG to NWRK
Figure 14: Network Topology for the VP experiment
200 Mbps45 Mbps
45 Mbps
Figure 15: Virtual Path performance vs. allocated networking capacity
••
••
•
•
•••••
•••••••••
CR percent of SR
Thr
ough
put (
calls
/min
)
0.2 0.4 0.6 0.8 1.0
220
240
260
•••••••••
••••
••
••
•
•
•
CR percent of SR
Set
up T
ime
(mse
c)
0.2 0.4 0.6 0.8 1.0
6070
8090
100
•
••
••
••••
••
••
••
••
•••
CR percent of SR
Blo
cked
Per
cent
age
0.2 0.4 0.6 0.8 1.0
0.54
0.58
0.62
••••
•••
•••
•••
••••••
•
CR percent of SR
Pro
cess
ing
Load
Inde
x
0.2 0.4 0.6 0.8 1.0
2.2
2.4
2.6
2.8
3.0
An Architecture for Managing Virtual Circuit and Virtual Path Services on ATM Networks
24
4.3 The relation between the Signaling and the Transport Network
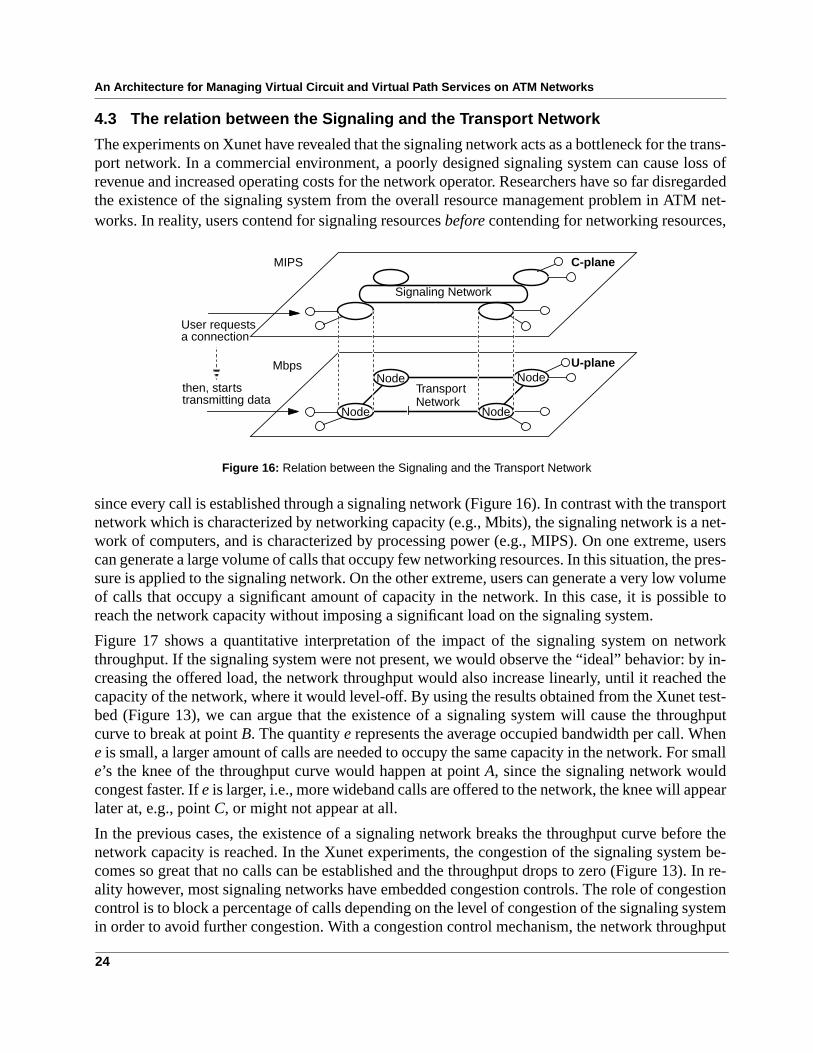
The experiments on Xunet have revealed that the signaling network acts as a bottleneck for the trans-port network. In a commercial environment, a poorly designed signaling system can cause loss ofrevenue and increased operating costs for the network operator. Researchers have so far disregardedthe existence of the signaling system from the overall resource management problem in ATM net-works. In reality, users contend for signaling resourcesbefore contending for networking resources,
since every call is established through a signaling network (Figure 16). In contrast with the transportnetwork which is characterized by networking capacity (e.g., Mbits), the signaling network is a net-work of computers, and is characterized by processing power (e.g., MIPS). On one extreme, userscan generate a large volume of calls that occupy few networking resources. In this situation, the pres-sure is applied to the signaling network. On the other extreme, users can generate a very low volumeof calls that occupy a significant amount of capacity in the network. In this case, it is possible toreach the network capacity without imposing a significant load on the signaling system.
Figure 17 shows a quantitative interpretation of the impact of the signaling system on networkthroughput. If the signaling system were not present, we would observe the “ideal” behavior: by in-creasing the offered load, the network throughput would also increase linearly, until it reached thecapacity of the network, where it would level-off. By using the results obtained from the Xunet test-bed (Figure 13), we can argue that the existence of a signaling system will cause the throughputcurve to break at pointB. The quantitye represents the average occupied bandwidth per call. Whene is small, a larger amount of calls are needed to occupy the same capacity in the network. For smalle’s the knee of the throughput curve would happen at pointA, since the signaling network wouldcongest faster. Ife is larger, i.e., more wideband calls are offered to the network, the knee will appearlater at, e.g., pointC, or might not appear at all.
In the previous cases, the existence of a signaling network breaks the throughput curve before thenetwork capacity is reached. In the Xunet experiments, the congestion of the signaling system be-comes so great that no calls can be established and the throughput drops to zero (Figure 13). In re-ality however, most signaling networks have embedded congestion controls. The role of congestioncontrol is to block a percentage of calls depending on the level of congestion of the signaling systemin order to avoid further congestion. With a congestion control mechanism, the network throughput
TransportNode
Node
Signaling Network
C-plane
U-planeNode
Node
MIPS
Mbps
Network
Figure 16: Relation between the Signaling and the Transport Network
User requestsa connection
then, startstransmitting data

Summary
25
curve would level-off at the knee point (where the signaling network becomes congested), since anyadditional load to the network would be blocked. This behavior is still below the ideal throughputthat could be achieved from the network.
By using VPs, we can effectively bypass the congestion regions of the signaling system and attain aperformance closer to the ideal throughput. A strategic placement of VPs in the network would re-move the strain imposed by the VC connection requests from the most loaded signaling processorsin the network and possibly enable the network operator to attain a higher throughput. In a networktopology like the one of Xunet, signaling congestion first appears in the switches at the center of thenetwork. By using VPs to bypass the central nodes, we were able to more than double the throughputof the network. The question that arises is how to compute the VP distribution policy. The work in[ANE96] presents a complementary framework that optimizes the VP distribution policy with re-spect to network revenue under Quality of Service constraints.
5. Summary
This paper examined the integration of service and performance management within the IntegratedReference Model. We presented a basic model for managing VC and VP connection services inATM networks. A set of managed object classes following the OSI standard for network manage-ment with complete attribute structure was proposed. The model enables the network manager to re-trieve information from agents installed in the network, make decisions based on serviceconfiguration and performance observations, and apply a set of controls if the observed performancecan be improved. These controls include setting the operating parameters of the signaling system andchanging entirely or in part the VP distribution in the network.
Our model was fully implemented on the Xunet ATM testbed. The manager was able to observe thecall level performance of Xunet from a dedicated management tool. We presented unique measure-ments of the call level performance of Xunet and demonstrated the behavior of the network whenVPs are in use. These measurements revealed that the signaling system can act as a bottleneck onnetwork thoughpout due to the finite processing resources available to signaling processors. In somecases, calls can be blocked even if capacity is still available in the network. A careful placement ofVPs can alleviate most signaling system bottlenecks.
Throughput
Offered Load (Mbps)
ideal
real
e
e = average occupied bandwidth per call(Mbps)
with congestion control
Figure 17: Throughput vs. Offered Load
AB
C

An Architecture for Managing Virtual Circuit and Virtual Path Services on ATM Networks
26
This work was funded in part by NSF Grant CDA-90-24735, and in part by a Grant from the AT&TFoundation.
References
[ANE96] N.G. Anerousis and A.A. Lazar, “Virtual Path Control for ATM Networks with Qual-ity of Service Guarantees”,Proceedings of the 1996 INFOCOM, San Francisco, CA,March 1996.
[ANE95] N.G. Anerousis, A.A. Lazar and D.E. Pendarakis, “Taming Xunet III”,ACM Comput-er Communications Review, Vol. 25, No. 3, pp. 44-65, October 1995.
[ANE93] N.G. Anerousis, C.R. Kalmanek and V.E. Kelly, “Implementing OSI ManagementFacilities on the Xunet ATM Platform,”Proceedings of the Fourth IFIP/IEEE Interna-tional Workshop on Distributed Systems: Operations and Management, Long Branch,New Jersey, October 1993.
[BEL91] J. Bellamy, “Digital Telephony”, second edition, John Wiley and Sons, 1991.
[FRA92] A.G. Fraser, C.R. Kalmanek, A.E. Kaplan, W.T. Marshall and R.C. Restrick, “Xunet2: A Nationwide Testbed in High-Speed Networking,”Proceedings of the IEEE IN-FOCOM’92, Florence, Italy, May 1992.
[GRI95] D.P. Griffin and P. Georgatsos, “A TMN System for VPC and Routing Management inATM Networks”, inProceedings of the 1995 IFIP/IEEE International Symposium onIntegrated Network Management, Santa Barbara, CA, May 1-5, 1995.
[HYM91] J.M. Hyman, A.A. Lazar, and G. Pacifici, “Real-time scheduling with quality of ser-vice constraints,”’IEEE Journal on Selected Areas in Communications, vol. 9, pp.1052-1063, September 1991.
[HYM93a] J.M. Hyman, A.A. Lazar, and G. Pacifici, “A separation principle between schedulingand admission control for broadband switching,”IEEE Journal on Selected Areas inCommunications, vol.11, pp. 605-616, May 1993.
[HYM93b] J.M. Hyman, A.A. Lazar, and G. Pacifici, “Modeling VC, VP and VN Bandwidth As-signment Strategies in Broadband Networks”,Proceedings of the Workshop on Net-work and Operating Systems Support for Digital Audio and Video, Lancaster, UnitedKingdom, November 3-5, 1993, pp. 99-110.
[ICM93] ICM Consortium, “Revised TMN Architecture, Functions and Case Studies”, ICMDeliverable 5, 30 September 1993.
[IET94] Internet Engineering Task Force, “Definition of Managed Objects for ATM Manage-ment”, Internet Draft Version 7.0, March 9, 1994.
[ISO92] Information Processing Systems - Open Systems Interconnection, “Systems Manage-ment - Performance Management - Part 11: Workload Monitoring Function”, April1992. International Standard 10164-11.
[ISO91a] ISO, “Information Processing Systems - Open Systems Interconnection: SystemsManagement - Fault Management - Part 5: Event Report Management Function,” July1991. International Standard 10164-5.

Summary
27
[ISO91b] ISO, “Information Processing Systems - Open Systems Interconnection: Structure ofManagement Information - Part 4: Guidelines for Definition of Managed Objects”, In-ternational Standard 10165-4, July 1991.
[ISO88] Information Processing Systems - Open Systems Interconnection, “OSI ManagementFramework,” October 1988. International Standard 7498-4.
[KNI91] G. Pavlou, G. Knight and S. Walton, “Experience of Implementing OSI ManagementFacilities,” Integrated Network Management, II(I. Krishnan and W. Zimmer, editors),pp. 259–270, North Holland, 1991.
[LAZ93] A.A. Lazar and R. Stadler, “On Reducing the Complexity of Management and Controlin Future Broadband Networks”,Proceedings of the Fourth IFIP/IEEE InternationalWorkshop on Distributed Systems: Operations and Management, Long Branch, NewJersey, October 1993.
[LAZ92] A.A. Lazar, “A Real-Time Management, Control and Information Transport Architec-ture for Broadband Networks”, inProceedings of the 1992 International Zurich Semi-nar on Digital Communications, Zurich, Switzerland, March 1992.
[NEU93] B. Neumair, “Modeling Resources for Integrated Performance Management”, inPro-ceedings of the IFIP TC6/WG6.6 Third International Symposium on Integrated Net-work Management, San Francisco, California, 18-23 April, 1993.
[OHT93] S. Ohta and N. Fujii, “Applying OSI System Management Standards to Virtual PathTesting in ATM Networks”,Proceedings of the IFIP TC6/WG6.6 Third InternationalSymposium on Integrated Network Management, San Francisco, California, 18-23April, 1993.
[SAR93] H. Saran, S. Keshav, C.R. Kalmanek and S.P. Morgan, “A Scheduling Discipline andAdmission Control Policy for Xunet 2",Proceedings of the Workshop on Network andOperating Systems Support for Digital Audio and Video, Lancaster, United Kingdom,November 3-5, 1993.
[TSU92] M. Tsuchida, A.A. Lazar and N.G. Anerousis, “Structural Representation of Manage-ment and Control Information in Broadband Networks”,Proceedings of the 1992IEEE International Conference on Communications, Chicago IL., June 1992.

An Architecture for Managing Virtual Circuit and Virtual Path Services on ATM Networks
28
Nikolaos Anerousis received the Diploma in Electrical Engineering from the National TechnicalUniversity of Athens, Greece, in May 1990, and the M.S., M.Phil. and Ph.D. degrees in ElectricalEngineering from Columbia University, New York, NY in 1991, 1994 and 1995. Since 1996 he is aSenior Technical Staff Member in the Networking Research Department of AT&T Research. His in-terests are in the field of computer and communication networks with emphasis on management ar-chitectures for large-scale broadband networks, network performance optimization and servicecreation. He is a member of the IEEE and the ACM and a member of the Technical Chamber ofGreece.
Aurel A. Lazar is a Professor of Electrical Engineering and the Director of the Multimedia Net-working Laboratory of the Center for Telecommunications Research, at Columbia University inNew York. Along with his long-standing interest in network control and management, he is leadinginvestigations into multimedia networking architectures that support interoperable exchange mech-anisms for interactive and on demand multimedia applications with quality of service requirements.
A Fellow of IEEE, Professor Lazar is an editor of the ACM Multimedia Systems, past area editor forNetwork Management and Control of the IEEE Transactions on Communications, member of theeditorial board of Telecommunication Systems and editor of the Springer monograph series on Tele-communication Networks and Computer Systems. His home page address is http://www.ctr.colum-bia.edu/~aurel.