Embed Size (px)
Citation preview
An Approach to Evaluate the Reliability of Web
Applications in Cloud Computing Using Dynamic Fault
TreeElinda Kajo Meçe
Department of Computer Engineering Polytechnic University of Tirana
Tirana, Albania
Eneida Driza Department of Computer Engineering
Polytechnic University of Tirana Tirana, Albania
ABSTRACT
Nowadays, one of the main challenges in developing different
systems is obtaining reliable ones. So, preliminary studies of
problematic atomic components which convert the system from
reliable to unreliable need to be done. This paper is focused in
evaluating one of the nonfunctional characteristics like the
reliability of web applications in cloud environment.
Nonfunctional characteristics such as reliability, security and
availability of a web service application and hence its service
components play an important role in evaluating the system
performance of the web application. The paper proposes a
Dynamic Fault Tree analysis of applications ran on cloud
platform. As a case study in order to demonstrate the feasibility of
this approach is used online payment system in e-commerce
hosted on a cloud platform. The results obtained reveal that this is
a good way in studying the reliability of the systems. Under
specific system conditions with minimal functional resources on
the cloud platform, cloud impact on system unreliability is nearly
twice the impact of application type.
Categories and Subject Descriptors
C.4 [Computer Systems Organization]: Performance of systems
- modeling techniques, performance attributes, reliability,
availability and serviceability
General Terms
Measurement, Performance, Design, Reliability, Experimentation,
Standardization, Verification
Keywords
Web Application, Cloud Computing, Dynamic Fault Trees (DFT),
Reliability, E-Commerce
1. INTRODUCTION Deployed applications on cloud environment show a high level of
complexity, since the problems are not only related to the well-
functioning of the application but also to the Cloud platform, that
gives the illusion of infinite computing resources available on
demand [1].
So, we aim to specify and detect the undesired behaviors of such
system in order to evaluate how specific failure events or
combination of failure events relative to the system components
can cause the failure of subsystems or of the whole system [9].
The main goal of the paper consists in evaluating the reliability
level of cloud applications focusing on the fault tree usage.
The system will be modeled using Dynamic Fault Tree technique.
This technique graphically represents logical relationship of
system failures [14]. System analysis will be performed based on
a dynamic model, using constant failure rates of the components
[7], which at certain time intervals make faulty a specific
component. The reliability of the application can be calculated,
once modeling the system and evaluating each component
reliability level using DFT. This analysis aims to detect the most
problematic and the most vital components, and sorting them out
based on their unreliability level on the system.
According to technical definition, the term reliability means:
“The ability of an item (system, subsystem that can be considered
an entity by itself) to perform a required function, under given
environmental and operational conditions and for a stated period
of time (ISO84021)” [7]
System designers pay importance to system reliability. A system is
considered fully-functional if it guarantees fault tolerance and
failure avoidance. Failure avoidance is attained by using high
quality and reliable components, meanwhile fault tolerance is
assured using redundancy, which sometimes causes design
complexities and can be cost-expensive. So, in cases when it’s
needed to be specified how to improve system reliability, either by
using fault tolerance or failure avoidance, the reliability of each
atomic component needs to be evaluated.
Two types of results are available in a fault tree evaluation:
qualitative and quantitative results. Qualitative assessments give a
qualitative ranking of each component in regard to its contribution
1 Standard: ISO8402 Quality Management and Quality Assurance
- Quality Vocabulary
BCI'13 September 19-21, Thessaloniki, Greece. Copyright © 2013 for the individual papers by the papers' authors. Copying permitted only for private and academic purposes. This volume is published and copyrighted by its editors.
150
to system failure [11], while quantitative assessments determine if
reliability requirements of the component are fulfilled or not. It is
suggested to find out which component or module mostly
contributes in system unreliability in order to provide a solution in
improving its reliability. So, reliability is a nonfunctional
characteristic and a term that is focused in the ability of a product
to fulfill a certain function. This product can be a hardware or
software product, a system or a service. The paper looks into
evaluating the level of unreliability, where as a real model will be
used E-Commerce applications deployed on a cloud environment.
The paper is organized as follows. The introduction section
reveals the necessity reasons of this paper theme, the main issues
and what is aimed to be achieved. The second section describes
the Cloud platform chosen, the hosted applications and DFT
technique for system modeling. The third section is focused on
hosting E-Commerce application on cloud while the fourth part
gives details about system modeling using DFT. An evaluation of
reliability, graphical representations and the interpretation of
results are given in the fifth and sixth section, while in the last
part are given the conclusions of the paper.
2. DFT TECHNIQUE IN WEB APP As a case study, for demonstrating the feasibility of DFT
technique is chosen two E-Commerce applications, Cyclos Open
Source Online Banking and JadaSite E-Commerce Solution. The
Cloud Platform where these applications are deployed is Jelastic
Java Cloud (dogado Host Europe v.1.8.2) [15].
E-Commerce applications provide services on the Software as a
Service (SaaS) layer of the cloud. SaaS is based on licensing
software use on demand, which is already installed and running
on a cloud platform [2]. E-Commerce applications have a high
level of complexity and are prone to failure considering some
criteria such as: high load on the web server, dynamic resource
necessities (CPU, memory, I/O, etc), support for objects that are
dynamically created etc. They also have strict requirements related
to response time, transactions or storage capacity [3].
Assuring reliability in such complex systems requires preliminary
identifications of the components and subsystems with the major
impact on system reliability. A fault tree provides a conceptually
simple modeling framework to represent the system-level
interactions between component reliabilities [4]. Dynamic fault
trees are shown particularly useful for reliability analysis [4]: a
logic evaluation of system components and their escalation until a
final evaluation.
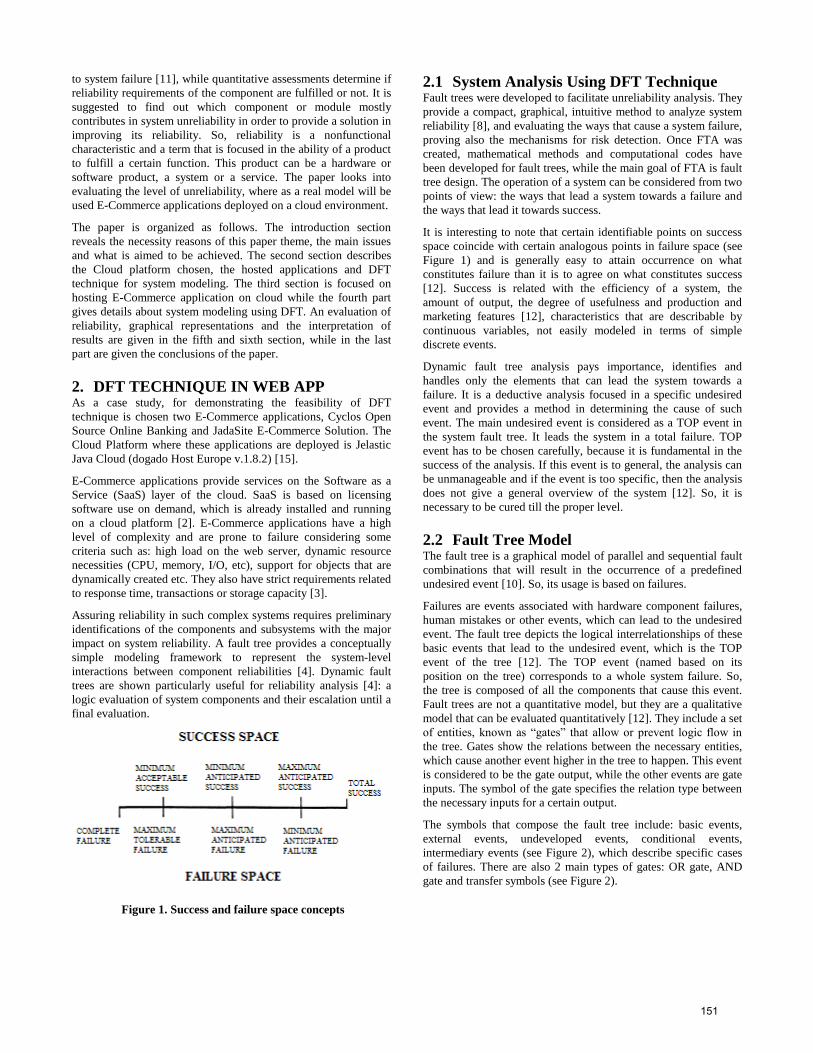
Figure 1. Success and failure space concepts
2.1 System Analysis Using DFT Technique Fault trees were developed to facilitate unreliability analysis. They
provide a compact, graphical, intuitive method to analyze system
reliability [8], and evaluating the ways that cause a system failure,
proving also the mechanisms for risk detection. Once FTA was
created, mathematical methods and computational codes have
been developed for fault trees, while the main goal of FTA is fault
tree design. The operation of a system can be considered from two
points of view: the ways that lead a system towards a failure and
the ways that lead it towards success.
It is interesting to note that certain identifiable points on success
space coincide with certain analogous points in failure space (see
Figure 1) and is generally easy to attain occurrence on what
constitutes failure than it is to agree on what constitutes success
[12]. Success is related with the efficiency of a system, the
amount of output, the degree of usefulness and production and
marketing features [12], characteristics that are describable by
continuous variables, not easily modeled in terms of simple
discrete events.
Dynamic fault tree analysis pays importance, identifies and
handles only the elements that can lead the system towards a
failure. It is a deductive analysis focused in a specific undesired
event and provides a method in determining the cause of such
event. The main undesired event is considered as a TOP event in
the system fault tree. It leads the system in a total failure. TOP
event has to be chosen carefully, because it is fundamental in the
success of the analysis. If this event is to general, the analysis can
be unmanageable and if the event is too specific, then the analysis
does not give a general overview of the system [12]. So, it is
necessary to be cured till the proper level.
2.2 Fault Tree Model The fault tree is a graphical model of parallel and sequential fault
combinations that will result in the occurrence of a predefined
undesired event [10]. So, its usage is based on failures.
Failures are events associated with hardware component failures,
human mistakes or other events, which can lead to the undesired
event. The fault tree depicts the logical interrelationships of these
basic events that lead to the undesired event, which is the TOP
event of the tree [12]. The TOP event (named based on its
position on the tree) corresponds to a whole system failure. So,
the tree is composed of all the components that cause this event.
Fault trees are not a quantitative model, but they are a qualitative
model that can be evaluated quantitatively [12]. They include a set
of entities, known as “gates” that allow or prevent logic flow in
the tree. Gates show the relations between the necessary entities,
which cause another event higher in the tree to happen. This event
is considered to be the gate output, while the other events are gate
inputs. The symbol of the gate specifies the relation type between
the necessary inputs for a certain output.
The symbols that compose the fault tree include: basic events,
external events, undeveloped events, conditional events,
intermediary events (see Figure 2), which describe specific cases
of failures. There are also 2 main types of gates: OR gate, AND
gate and transfer symbols (see Figure 2).
151
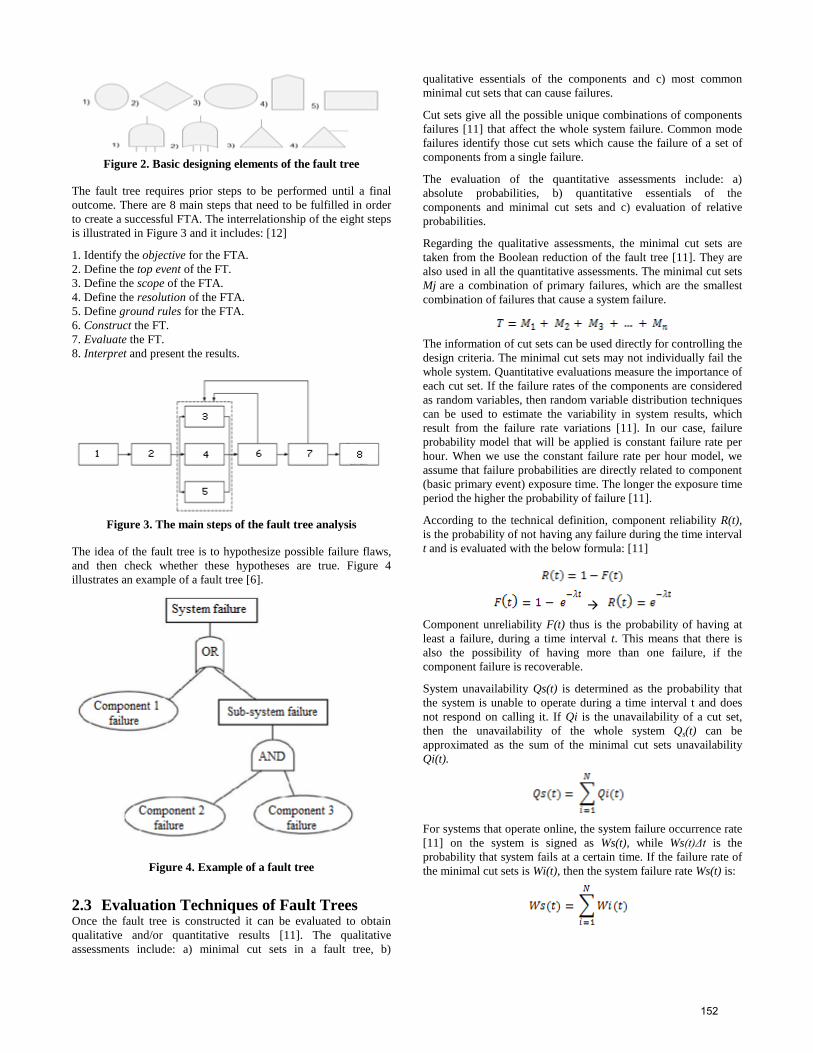
Figure 2. Basic designing elements of the fault tree
The fault tree requires prior steps to be performed until a final
outcome. There are 8 main steps that need to be fulfilled in order
to create a successful FTA. The interrelationship of the eight steps
is illustrated in Figure 3 and it includes: [12]
1. Identify the objective for the FTA.
2. Define the top event of the FT.
3. Define the scope of the FTA.
4. Define the resolution of the FTA.
5. Define ground rules for the FTA.
6. Construct the FT.
7. Evaluate the FT.
8. Interpret and present the results.
Figure 3. The main steps of the fault tree analysis
The idea of the fault tree is to hypothesize possible failure flaws,
and then check whether these hypotheses are true. Figure 4
illustrates an example of a fault tree [6].
Figure 4. Example of a fault tree
2.3 Evaluation Techniques of Fault Trees Once the fault tree is constructed it can be evaluated to obtain
qualitative and/or quantitative results [11]. The qualitative
assessments include: a) minimal cut sets in a fault tree, b)
qualitative essentials of the components and c) most common
minimal cut sets that can cause failures.
Cut sets give all the possible unique combinations of components
failures [11] that affect the whole system failure. Common mode
failures identify those cut sets which cause the failure of a set of
components from a single failure.
The evaluation of the quantitative assessments include: a)
absolute probabilities, b) quantitative essentials of the
components and minimal cut sets and c) evaluation of relative
probabilities.
Regarding the qualitative assessments, the minimal cut sets are
taken from the Boolean reduction of the fault tree [11]. They are
also used in all the quantitative assessments. The minimal cut sets
Mj are a combination of primary failures, which are the smallest
combination of failures that cause a system failure.
The information of cut sets can be used directly for controlling the
design criteria. The minimal cut sets may not individually fail the
whole system. Quantitative evaluations measure the importance of
each cut set. If the failure rates of the components are considered
as random variables, then random variable distribution techniques
can be used to estimate the variability in system results, which
result from the failure rate variations [11]. In our case, failure
probability model that will be applied is constant failure rate per
hour. When we use the constant failure rate per hour model, we
assume that failure probabilities are directly related to component
(basic primary event) exposure time. The longer the exposure time
period the higher the probability of failure [11].
According to the technical definition, component reliability R(t),
is the probability of not having any failure during the time interval
t and is evaluated with the below formula: [11]
Component unreliability F(t) thus is the probability of having at
least a failure, during a time interval t. This means that there is
also the possibility of having more than one failure, if the
component failure is recoverable.
System unavailability Qs(t) is determined as the probability that
the system is unable to operate during a time interval t and does
not respond on calling it. If Qi is the unavailability of a cut set,
then the unavailability of the whole system Qs(t) can be
approximated as the sum of the minimal cut sets unavailability
Qi(t).
For systems that operate online, the system failure occurrence rate
[11] on the system is signed as Ws(t), while Ws(t)Δt is the
probability that system fails at a certain time. If the failure rate of
the minimal cut sets is Wi(t), then the system failure rate Ws(t) is:
152
The system unavailability Qs(t) and the system failure occurrence
rate Ws(t) give comprehensive information on the probabilistic
description of system failure [11].
3. APPLICATIONS DEPLOYMENT Testing of system reliability is achieved by deploying E-
Commerce applications in cloud environment. The Cloud
platform used is Jelastic Java Cloud. It supports every application
JVM-based, including Java, JRuby, Groovy and
ColdFusion/CFML [15].
E-Commerce applications that will be deployed are: Cyclos-Open
Source Online Banking and Jadasite-E-Commerce Solution. The
source code of both applications can be downloaded for free on
the Internet. Jelastic cloud supports application deployment in
.war archived form. These types of files are zipped files (Web
Archive), which can be used for hosting Servlets including EE
(Enterprise Edition) and JSP (Java Server Page). The .war files
are similar with .jar files used by Servlets. They can include
different types of files such as: *.java, *.jsp, *.xml, *.css, *.ejb,
*.gif, *.html, *.png, *.sql, *.xsl, *.xtp [16].
For the deployment process of each application, the environment
will use Tomcat Server 6 and MySQL 5.5. The environments
give the opportunity to use the below capacities for free: 3
environments for each account, 4 application servers per
environment , 16 cloudlets for the application servers and also
1GB storage dedicated to them [15]. However the deployment
process includes a large number of problems, cloud platform gives
the opportunity of managing and solving them.
4. SYSTEM MODELING After the deployment process on cloud environment, we ran both
the applications as an administrator and also as a simple user. We
interfere in the application codes, in order to detect some possible
failures. Cloud provides also some data regarding application
usage, which will be used in constructing the fault tree.
Failure reasons of E-Commerce applications on cloud are
numerous, starting with the simplest issues related to human
mistakes, up to the most complex problems that may require
external interventions (e.g., an overall blockage of the hosting
platform).
Fault Tree + Analysis Tool will be used for constructing the
system fault tree. This is a framework for system modeling based
on system points of failure. Quantitative assessments of these
failures can also be evaluated using Fault Tree +. This approach is
based on reasoning from individual failures to an overall
conclusion.
Reliability Workbench v.11 incorporating Fault Tree + is
executed under Microsoft .NET Framework [14]. This is a single
powerful integrated environment for reliability and safety
analysis. The fault tree is constructed based on the failures that
affect the general functionality of the deployed applications on
cloud environment.
4.1 Failures Detection The identification of system failures is necessary, prior
constructing the fault tree. First of all, the environment taken as a
reference point may be a bit disappointing, because we used the
cloud platform with its minimal available resources. Normally, it
is expected to have high rates of failures but we decided to
perform worst-case analysis in order to identify most of cloud
failures and to evaluate their impact. The platform is fault tolerant
from failures related to servers or database because it provides
new elements and it also stores logs operation history on the
platform. Continuous monitoring of its capacities (CPU, RAM,
HDD, Network), can also be provided. These values are used
when applying failure models to the components.
Second, we interfered in the application codes. We performed
some changes at administrator level in order to generate several
errors, for example: deleting all the data by mistake, resetting the
system by mistake, putting incorrect numeric values and in the
wrong format etc. We also used the application at user level, for
example: performing incorrect navigations, using the wrong type
of browser, completing the wrong fields with the wrong
information etc. Some other failures are also taken from similar
studies of these systems.
We have determined the main functional elements of our system,
which can probably be points of failures. These elements included
cloud elements (e.g., servers, databases etc.) or application
elements (e.g., human mistakes, third party software etc.).
These failures include: database server failures, web server
failures, hardware failures, third-party software failures, browser
failures, network failures, hosting problems, memory leakage,
human mistakes and bad planning capacity problems etc [13].
Each of these main failures is caused by other failures. For
example, the browser is the most vulnerable piece of software of
the entire e-commerce system. It acts as a window for information
transaction and management for the whole system. So, if the
browser crashes and its window closed, it also closes all the
possibilities for a successful e-commerce transaction. In this case,
a user will think twice prior using the site again. The evaluated
browser failures in our case include factors such as: blockage
(browser blockage due to its components failures) and closure
(browser closure by mistake). Blockage can be caused due to
incompatibility problems (content - browser incompatibility or
browser - plug-in incompatibility), and issues due to memory
leaks.
We inspect all the main failure components of the system, for
finding out the failure reasons for each of them, the same way.
After failures are detected, the fault tree can be constructed.
4.2 Fault Tree Construction A well constructed fault tree requires some forethought. Things
done in early phase of the fault tree construction can impact later
phases of the analysis [5]. It is difficult to make construction
changes at a later development stage if the fault tree is very large.
Fault Tree + tool, is a deductive analysis tool that provides a way
to logically combine all the failures that can lead to the occurrence
of the undesired event (TOP event). The process of system
modeling starts with the TOP event. A TOP event is fundamental
in the success of the analysis, so it has to be chosen carefully. In
our case, the fault tree construction starts with the TOP event
called Unreliable Application and scales down in creating a
hierarchical structure (see Figure 5). The two main failure areas
are related to the applications and cloud platform. In the fault tree,
they are labeled as: Application and Cloud (see Figure 5). The
construction of a complete fault tree (including main failures,
sublevels or initial events) will present all the evaluated failures.
153
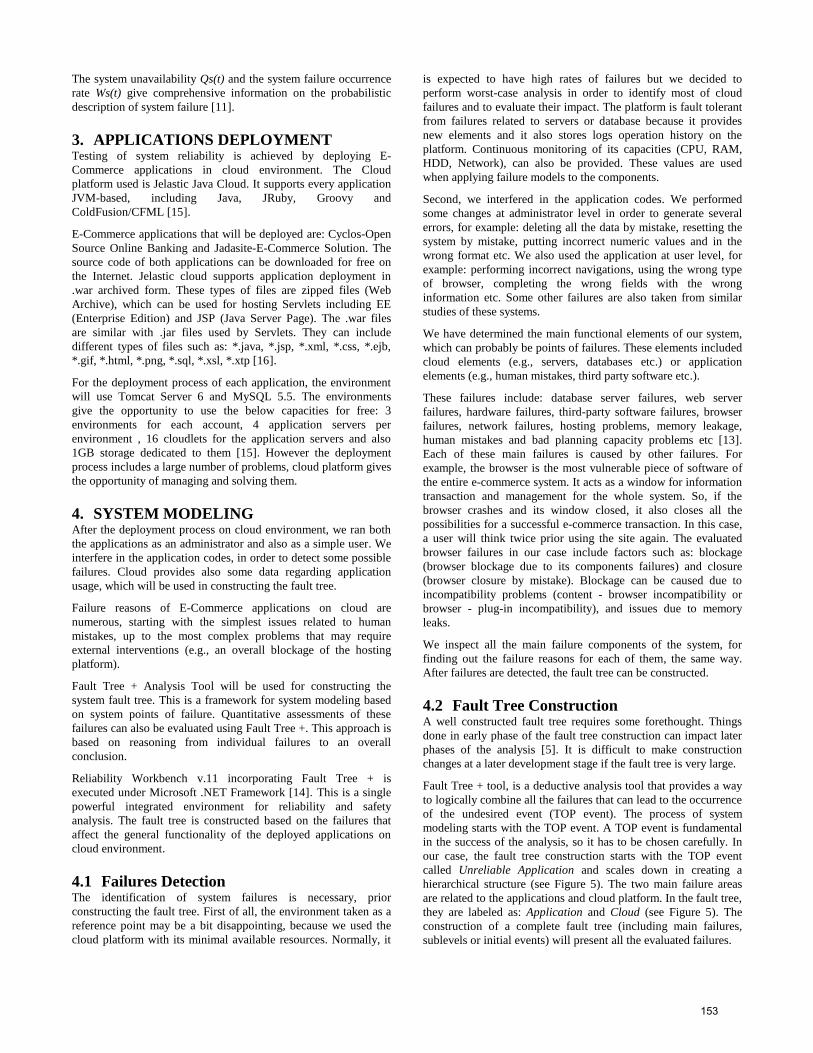
There are evaluated 12 main failure components. These failures
are related to the usage of the deployed applications, also to the
cloud environment. After evaluations, there are assessed 35 basic
initial events of failure for the application and 64 for the cloud, in
a total of 99 basic initial events. So, continuing the example of the
browser (as explained in Section 4.1), browser failure is a main
failure component classified under Application sub-tree. Failures
of the first sublevel are browser blockage and browser closure
(see Figure 6).
Figure 5. Initial modeling of the system fault tree (TOP event
and 2 main failure components)
Figure 6. Example of how the fault tree is constructed
(browser failure)
Browser closure is also considered as a basic initial event because
it does not include any other reasons of failures, except its closure
by mistake. The blockage of the browser is related either to the
incompatibility problems with the application content and the
plug-ins or problems with memory leakage. So, incompatibility
and memory leakage are considered as basic initial events.
We depict the basic initial events even for the other components,
the same way.
The entire fault tree is entitled “Unreliability”, since it is the
nonfunctional characteristic to be evaluated. It is composed of a
total of 23 sub-trees. Two general structures of application and
cloud sub-trees are illustrated in Figure 7 and Figure 8. These
sub-trees give the idea how the failures are spread across the fault
tree.
Figure 7. General structure of application fault tree
Figure 8. General structure of cloud fault tree
4.3 Failure Models Failure models provide a quantitative assessment of failures
related to a specific component or related to the primary event on
the fault tree [11]. They can be local failure models or global
failure models. The difference between them stands on the fact
that local failure models can be assigned to only one component,
while global failure models can be assigned to a set of
components.
It is necessary to determine a failure model, for each of the initial
basic events. The failure model requires assuming some failure
characteristics for the components. These characteristics include
MTTF (Mean time to failure) and MTTR (Mean time to repair).
So, for each initial failure, we specify a possible failure time and a
possible repair time. This model also assumes a constant failure
rate and an exponential distribution of these failures.
The failure models are added to each of the 99 initial basic events.
These models are unique because it is supposed that the failure
time varies for each of the components. System evaluation begins
the same time of system operation and is done during 1 and 24
hours.
The evaluation of the modeled system begins with the evaluation
of the initial basic events. The reliability evaluation for higher
154
events positioned on the fault tree, up to the TOP event is done
based on the logic functions of the gates.
After a complete system analysis, Fault Tree + provides the
possibility of taking graphical results. The graphical results
include: system unreliability values depending on time,
problematic system components depending on their critical level
to the system, failure frequencies of the components and their
unavailability depending on time.
5. RELIABILITY EVALUATION AND
GRAPHICAL REPRESENTATIONS Reliability evaluation is performed, once the system is modeled
using Fault Tree + Analysis Tool. This tool requires some failure
specifications in regard to the failure components such as: MTTF
and MTTR values. The existence of such specifications is
necessary for the real evaluation of system unreliability.
Advance detections and evaluations of the unreliability of each
failure component, helps finding out that certain items are major
contributors to system unreliability compared with others, so they
should be the ones to be addressed.
The graphical representations are also based on MTTF and MTTR
values. Mathematic models use these values for calculating
components unreliability, failure frequency and failure/repair
rates. RWB performs data calculation based on the below
formulas:
Q(t) - component unavailability ω(t) - failure frequency of the component λ - failure rate of the component
μ - repair rate of the component
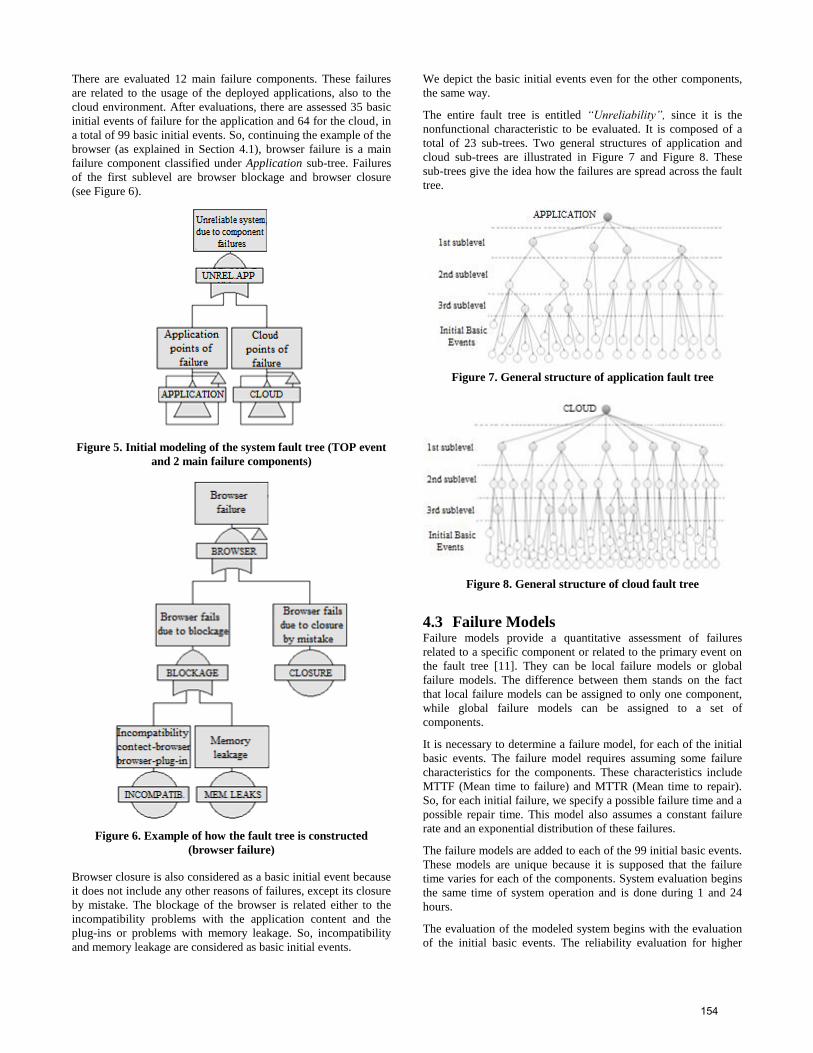
For each main failure (as explained in Section 4.1), which causes
a certain substantial impact on system reliability are taken some
graphical results (see Figure 9). Regardless the complexity of
modeling the system, RWB provides graphical illustrations of the
calculated unreliability indices for the main failure components.
The unreliability values for each main component such as:
application server, cache server, database server, network,
hardware, capacity, hosting problems, web server, human
mistakes or the browser are calculated on developing them further
by finding the initial basic events unreliability values which may
contribute to them. The graphical representations do not include
the hardware component, since it is dependable from the capacity
component. The hardware component includes issues related to
CPU/RAM, source conflicts or server hardware that somehow can
be evaluated as part of capacity component.
Thus, as illustrated in Figure 9, the affect of cloud components on
system unreliability is higher than the application components.
This relates to the fact that, while application issues are somehow
reparable and not quite problematic to the whole system, cloud
issues are more numerous and can lead to a total system failure
that require some time to be repaired. The number of initial basic
events (35 for the application and 64 for the cloud environment)
also indicates the higher impact of cloud on system unreliability.
Fig 9. Graphical representations of system unreliability based
on main failure components depending on time (1 hour and 24
hours)
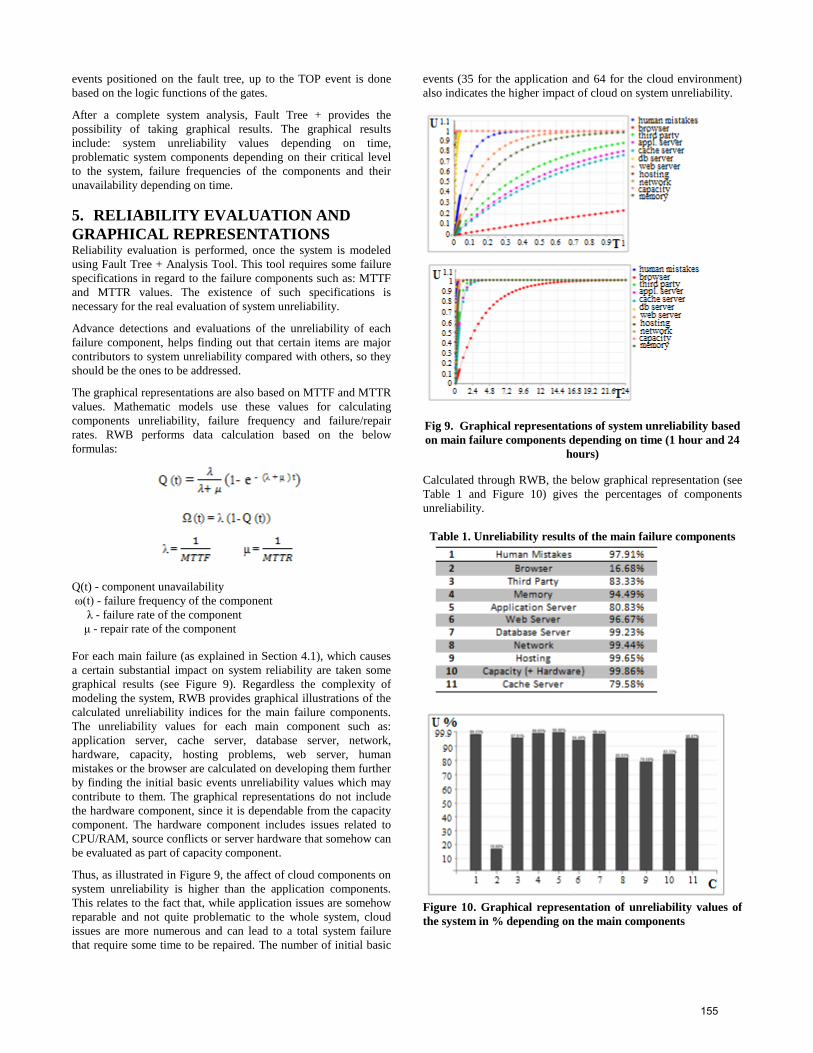
Calculated through RWB, the below graphical representation (see
Table 1 and Figure 10) gives the percentages of components
unreliability.
Table 1. Unreliability results of the main failure components
Figure 10. Graphical representation of unreliability values of
the system in % depending on the main components
155
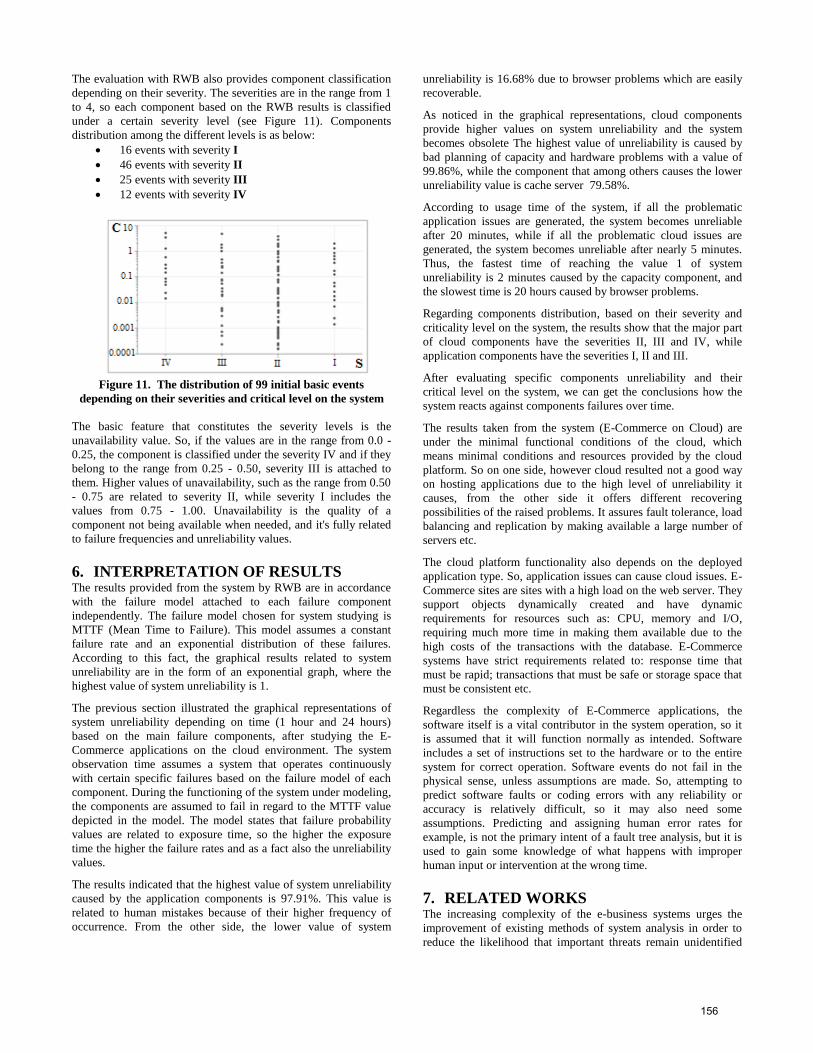
The evaluation with RWB also provides component classification
depending on their severity. The severities are in the range from 1
to 4, so each component based on the RWB results is classified
under a certain severity level (see Figure 11). Components
distribution among the different levels is as below:
16 events with severity I
46 events with severity II
25 events with severity III
12 events with severity IV
Figure 11. The distribution of 99 initial basic events
depending on their severities and critical level on the system
The basic feature that constitutes the severity levels is the
unavailability value. So, if the values are in the range from 0.0 -
0.25, the component is classified under the severity IV and if they
belong to the range from 0.25 - 0.50, severity III is attached to
them. Higher values of unavailability, such as the range from 0.50
- 0.75 are related to severity II, while severity I includes the
values from 0.75 - 1.00. Unavailability is the quality of a
component not being available when needed, and it's fully related
to failure frequencies and unreliability values.
6. INTERPRETATION OF RESULTS The results provided from the system by RWB are in accordance
with the failure model attached to each failure component
independently. The failure model chosen for system studying is
MTTF (Mean Time to Failure). This model assumes a constant
failure rate and an exponential distribution of these failures.
According to this fact, the graphical results related to system
unreliability are in the form of an exponential graph, where the
highest value of system unreliability is 1.
The previous section illustrated the graphical representations of
system unreliability depending on time (1 hour and 24 hours)
based on the main failure components, after studying the E-
Commerce applications on the cloud environment. The system
observation time assumes a system that operates continuously
with certain specific failures based on the failure model of each
component. During the functioning of the system under modeling,
the components are assumed to fail in regard to the MTTF value
depicted in the model. The model states that failure probability
values are related to exposure time, so the higher the exposure
time the higher the failure rates and as a fact also the unreliability
values.
The results indicated that the highest value of system unreliability
caused by the application components is 97.91%. This value is
related to human mistakes because of their higher frequency of
occurrence. From the other side, the lower value of system
unreliability is 16.68% due to browser problems which are easily
recoverable.
As noticed in the graphical representations, cloud components
provide higher values on system unreliability and the system
becomes obsolete The highest value of unreliability is caused by
bad planning of capacity and hardware problems with a value of
99.86%, while the component that among others causes the lower
unreliability value is cache server 79.58%.
According to usage time of the system, if all the problematic
application issues are generated, the system becomes unreliable
after 20 minutes, while if all the problematic cloud issues are
generated, the system becomes unreliable after nearly 5 minutes.
Thus, the fastest time of reaching the value 1 of system
unreliability is 2 minutes caused by the capacity component, and
the slowest time is 20 hours caused by browser problems.
Regarding components distribution, based on their severity and
criticality level on the system, the results show that the major part
of cloud components have the severities II, III and IV, while
application components have the severities I, II and III.
After evaluating specific components unreliability and their
critical level on the system, we can get the conclusions how the
system reacts against components failures over time.
The results taken from the system (E-Commerce on Cloud) are
under the minimal functional conditions of the cloud, which
means minimal conditions and resources provided by the cloud
platform. So on one side, however cloud resulted not a good way
on hosting applications due to the high level of unreliability it
causes, from the other side it offers different recovering
possibilities of the raised problems. It assures fault tolerance, load
balancing and replication by making available a large number of
servers etc.
The cloud platform functionality also depends on the deployed
application type. So, application issues can cause cloud issues. E-
Commerce sites are sites with a high load on the web server. They
support objects dynamically created and have dynamic
requirements for resources such as: CPU, memory and I/O,
requiring much more time in making them available due to the
high costs of the transactions with the database. E-Commerce
systems have strict requirements related to: response time that
must be rapid; transactions that must be safe or storage space that
must be consistent etc.
Regardless the complexity of E-Commerce applications, the
software itself is a vital contributor in the system operation, so it
is assumed that it will function normally as intended. Software
includes a set of instructions set to the hardware or to the entire
system for correct operation. Software events do not fail in the
physical sense, unless assumptions are made. So, attempting to
predict software faults or coding errors with any reliability or
accuracy is relatively difficult, so it may also need some
assumptions. Predicting and assigning human error rates for
example, is not the primary intent of a fault tree analysis, but it is
used to gain some knowledge of what happens with improper
human input or intervention at the wrong time.
7. RELATED WORKS The increasing complexity of the e-business systems urges the
improvement of existing methods of system analysis in order to
reduce the likelihood that important threats remain unidentified
156
[6]. The CORAS approach provides one way of increasing trust
and confidence in information and communication systems based
on the integration of security risk management and graphical
semiformal modeling. The risk assessment process consists of
steps: identify context, identify risk, analyse risks, evaluate risks,
and treat risks [17]. Another paper, presents a component oriented
development approach to e-business applications that is strongly
architecture-centric. The component oriented architecture
provides a set of rules and structure for managing complexity
which provides flexibility and a framework for reuse and
integration of components to support e-business evolution [18].
Except the other methods applied in studying risk analysis, we
chose Fault Tree. The benefits of this approach is that it can easily
include design flaws, human and procedural errors which are
sometimes difficult to quantify. It is considered an excellent tool
for studying complex systems.
8. CONCLUSIONS AND FUTURE WORK The main goal of the paper consisted on developing a dynamic
model for the evaluation of web application's reliability using
DFT technique. After introducing the success and failure space
concepts, we focused on building the system fault tree by
identifying two main components that affect system reliability, 1)
application and 2) cloud. The system under modeling included a
complete system fault tree of 99 initial basic events of failure. In
our case but also in similar systems, the opportunities for the
system to become unreliable from cloud issues are nearly twice
the opportunities of the application based on the number of failure
events (35 application/64 cloud) and unreliability values. The
average sum of unreliability values for cloud components is nearly
twice the average sum of unreliability values for application
components. The question raised is that we all use cloud
computing nowadays, but do not see such high rates of failures.
The results are related to the environment taken as a reference
point, because we decided to perform worst-case analysis, leading
to very high unreliability results, in order to generate and detect
the majority of failures on the system. The Fault Tree usage
answers the question of what can go wrong by identifying these
failure scenarios.
Advance studies can be done on the aspect of system unreliability
including E-Commerce systems on cloud environment, changing
cloud specifics that can reduce system unreliability, such as load
balancing, replication etc, in order to check how system
unreliability will change in such cases.
9. REFERENCES [1] Michael Armbrust, Armando Fox, Rean Griffith, Anthony D.
Joseph, Randy Katz, Andy Konwinski, Gunho Lee, David
Patterson, Ariel Rabkin, Ion Stoica, and Matei Zaharia,
"Above the Clouds: A Berkeley View of Cloud Computing",
Technical Report No. UCB/EECS-2009-28, UC Berkeley
Reliable Adaptive Distributed Systems Laboratory, February
10, 2009
[2] N. Ram Ganga Charan, S. Tirupati Rao, Dr .P.V.S Srinivas,
"Deploying an Application on the Cloud", The International
Journal of Advanced Computer Science and Applications,
(IJACSA) , Vol. 2, No. 5, 2011
[3] Marisa A. S´anchez, Juan Carlos Augusto, and Miguel
Felder, "Fault-based Testing of E-Commerce Applications",
The 2nd Workshop on Verification and Validation of
Enterprise Information Systems , 2004, Porto, Portugal
[4] Ragavan Manian, Joanne Bechta Dugan, David Coppit,
Kevin Sullivan,"Combining Various Solution Techniques for
Dynamic Fault Tree Analysis of Computer Systems", Third
IEEE International High-Assurance System Engineering
Symposium, 1998, Washington DC.,. DOI=
http://dx.doi.org/10.1109/HASE.1998.731591
[5] Clifton A. Ericson II, "Fault Tree Analysis By Design",
Proceedings of the 16th International System Safety
Conference, 1998
[6] Wang Chu, Yanli Feng, "Fault Tree Based Architectural
Analysis for E-Bussiness Systems", Proceedings of the
Second Symposium International Computer Science and
Computational Technology (Huangshan, P. R. China, 26-
28,Dec. 2009), ISCSCT ’09, pg. 052-057
[7] Marvin Rausand, Arnljot Hoyland, “System Reliability
Theory - Models, Statistical Methods and Applications”, 2nd
edition, 2004
[8] Joanne Bechta Dugan, Fellow, Kevin J. Sullivan, and David
Coppit, "Developing a Low-Cost High-Quality Software
Tool for Dynamic Fault-Tree Analysis", Proceedings of the
10th International Symposium on Software Reliability
Engineering (ISSRE'99) DOI=
http://dx.doi.org/10.1109/24.855536
[9] Daniele Codetta-Raiteri, "Extended Fault Trees Analysis
supported by Stochastic Petri Nets", Doctoral Thesis, 15
November 2005, Torino, Italy
[10] Robert Apthorpe, "A Probabilistic Approach to Estimating
Computer System Reliability", Proceedings of the 15th
USENIX Conference on Systems Administration (San Diego,
California, USA, December 2-7, 2001 ), LISA 2001
[11] United States Nuclear Regulatory Commission, "Fault Tree
Handbook", NUREG - 0492, 1993
[12] Michael Stamatelatos, William Vesely, Joanne Dugan,
Joseph Fragola, Joseph Minarick III, Jan Railsback, "Fault
Tree Handbook with Aerospace Applications", Version 1.1,
August 2002, Washington
[13] Giridharan Vilangadu Vijayaraghavan,"A Taxonomy of E-
Commerce Risks and Failures", Master Thesis, May 2003,
Melbourne, Florida,
[14] Isograph – Reliability Workbench with Fault Tree+
Integrated - Documentation
http://www.isograph-software.com/
[15] Jelastic Java Cloud Computing - Documentation
http://www.jelastic.com/documentation/
[16] WAR file: Java Glossary
http://mindprod.com/jgloss/warfile.html
[17] T.Dimitrakos, B.Ritchie, D.Raptis, K.Stolen, "Model based
Security Risk Analysis for Web Applications: The CORAS
Approach", Proceedings of the 2002 international
conference on EuroWeb, EuroWeb'02, UK 2002
[18] Wang Chu, Depei Qian. “A Component-Oriented
Development Approach to E-Business Applications”,
Proceedings of IEEE International Conference on eBusiness
Engineering, October 22-24, 2008, Xi’an, China, IEEE
Press. pp.45-52. DOI =
http://dx.doi.org/10.1109/ICEBE.2008.23
157