Embed Size (px)
Citation preview
An approach to characterization of sources of urban airborneparticles through heavy metal speciation
Antonio J. Fern�andez, Miguel Ternero, Francisco J. Barrag�an *, Juan C. Jim�enez
Department of Analytical Chemistry, Faculty of Chemistry, University of Seville, C. Profesor Garc�õa Gonz�alez s/n, 41012, Seville, Spain
Received 23 September 1997; accepted 13 October 1999
Importance of this paper: In extended urban areas, the large amount of particulate matter in the air is a matter for
concern, especially the heavy metals associated with it that have serious health e�ects. The complexity of airborne particles
makes their characterization and source identi®cation di�cult. Chemical speciation for heavy metals, rather than total
content, is a new approach in determining the real metal activity in the environment and provides a new perspective for
assessment of potential toxicity. Our research shows that speciation allows an advantageous source identi®cation of sus-
pended air particles using statistical analyses of pattern recognition.
Abstract
Airborne particles, collected in an urban atmosphere, in¯uenced by surrounding farm areas (Seville), were analyzed
by speciation for ten heavy metals. The use of a sequential extraction procedure allowed the subdivision of the total
content of each metal into four di�erent fractions. Statistical multivariate analysis was performed on the fractions and
the main sources of metal contamination were characterized. The results show that soil aerosols make the largest
contribution to pollution with Fe and Al as the most abundant metals acting as markers for this source. In addition, the
close correlation between Pb and Cu suggests that these are mainly pollutants generated by tra�c. The other metals
permitted identi®cation of an industrial source but always in association with a soil source. From the percentage
distribution of species, we found that Fe and Al are found in the carbonate or oxide fraction (40%) and in the residual
metal fraction (40%). While Pb and Cu mainly appear as oxides and carbonates (50% and 40%, respectively), Cd
prevails in soluble or exchangeable form (55%). Ó 2000 Elsevier Science Ltd. All rights reserved.
Keywords: Metal speciation; Suspended particulate matter; Multivariate statistical analyses; Characterization of atmospheric particles
1. Introduction
The problem of atmospheric contamination by air-
borne particulate matter has worsened notably in the
last few years due to the increase in motor vehicles, ur-
ban constructions, heat installations and industry. Sus-
pended particulate matter is considered to be a health
hazard since it can be absorbed into human lung tissues
during breathing. For this reason, a great deal of re-
search has focused on the chemical composition of at-
mospheric suspended particulate matter. The control of
heavy metal levels is particularly important because of
the serious e�ects these have on biological systems.
Conventional analytical metal measurements in at-
mospheric particles usually entail the determination of
total metal concentrations. Nevertheless, it is often
necessary to quantify speci®c metallic forms (species)
since bioavailability, solubility, geochemical transport
and metal cycles largely depend on physical-chemical
speciation. Speciation is, therefore, a way to determine
the real metal activity in the environment and provides a
new perspective for analytical control.
There are two principal kinds of speciation: speci®c
and operational speciation. The ®rst of these depends on
Chemosphere ± Global Change Science 2 (2000) 123±136
* Corresponding author. Tel.: +34-95-4557171; fax: +34-95-
4557168.
E-mail address: [email protected] (F.J. BarragaÂn).
1465-9972/00/$ - see front matter Ó 2000 Elsevier Science Ltd. All rights reserved.
PII: S 1 4 6 5 - 9 9 7 2 ( 0 0 ) 0 0 0 0 2 - 7
direct determination of speci®c chemical forms and the
second on the e�ect of applying successive reagents to
the sample.
Techniques for speci®c speciation generally involve
the use of spectroscopic or chromatographic techniques
and are di�cult to use routinely or for a large number of
samples.
Operational speciation de®nes di�erent fractions of
the total metal content according to the expected char-
acteristic behavior of the di�erent chemical forms pre-
sent in the sample. This involves treatment of the sample
sequentially with a series of extraction reagents to sep-
arate species. Since the reagents are chosen according to
bioavailability criteria, the metal species analyzed rep-
resent those that can be assimilated by living creatures.
Determination of total metal contents has been fre-
quently used together with receptor models to identify
source emissions (Miller et al., 1972; Heidam, 1981;
Sche� et al., 1984). Some of this research was carried out
in Spain (Ferrer and Perez, 1990) and, in certain cases, in
Seville (Usero et al., 1988; Luis-Sim�on, 1995). However,
there are few examples of the application of operational
speciation schemes to atmospheric particles reported in
the literature (Obiols et al., 1986; Que, 1994) and some
of these are restricted to only one metal (Clevenger et al.,
1991; Zatka et al., 1992). All these schemes are derived
from others employed for soils or sediments. For in-
stance, in this work we use an uncomplicated adaptation
of Tessier's scheme (Tessier et al., 1979), which is con-
sidered as the most general. The objective of our study
was to investigate, for the ®rst time, if metal speciation is
capable of determining and characterizing the principal
pollution sources in an area using statistical analyses of
pattern recognition. The proposed methodology was
applied to data of a city with a Mediterranean climate,
Seville, with little industrial activity but a major agri-
cultural in¯uence. In addition, it was also considered
valuable to determine the distribution of metal species in
di�erent areas of the city.
2. Experimental
2.1. Area description
Seville is the largest population nucleus in southern
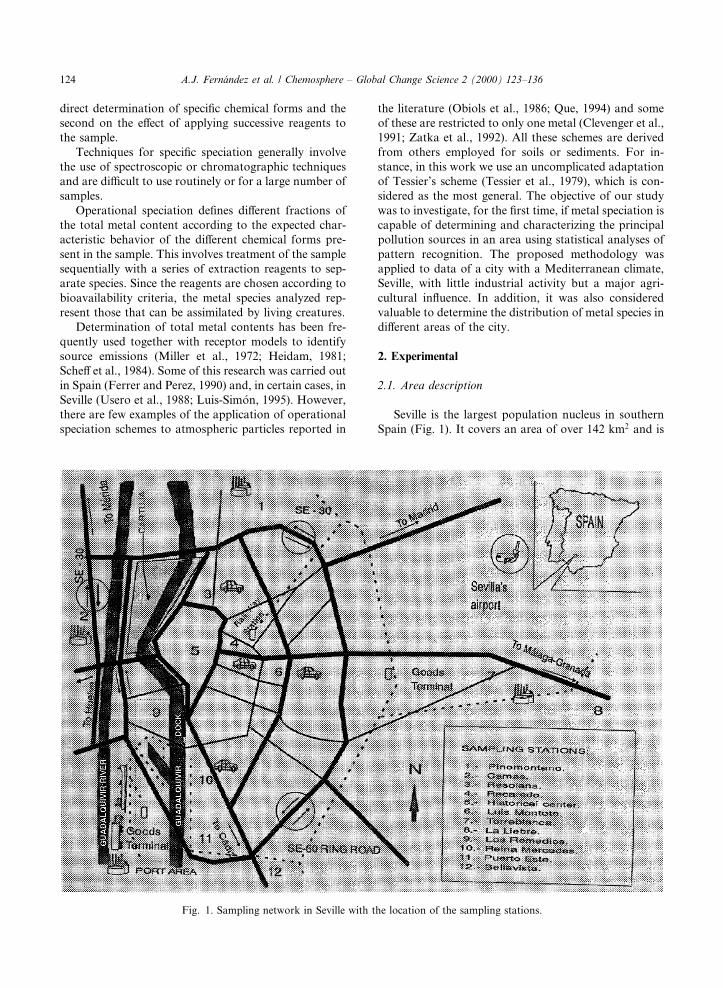
Spain (Fig. 1). It covers an area of over 142 km2 and is
Fig. 1. Sampling network in Seville with the location of the sampling stations.
124 A.J. Fern�andez et al. / Chemosphere ± Global Change Science 2 (2000) 123±136
located 10 m a.s.l. on a large plain alongside the Gua-
dalquivir River. In 1993, the year of this study, Seville is
the fourth most populated city in Spain (after Madrid,
Barcelona and Valencia) and the ®rst in Andalusia. It
has a population of 716,937 inhabitants and on work-
days this increases to about one million due to incoming
tra�c from nearby towns. The annual mean tra�c
density is 62,356 vehicles a day for a total of 338,029
vehicles. This source corresponds to a large speci®c
weight in the city which can be expected to be re¯ected
in lead emission since many vehicles still use leaded
petrol. The obligation to manufacture automobiles that
only use unleaded petrol was imposed in 1991. Seville is
less polluted than other more industrial Spanish cities
such as Barcelona and Madrid or Huelva and Algeciras,
the latter two in Andalusia. In the periphery of the city a
large area of land is subject to urban construction, un-
controlled dumps and especially dry crops that are af-
terwards burnt. In a dry climate, such as that found in
the study area, agriculture often produces a large
amount of particles by practices such as ploughing,
harrowing or harvesting, and especially stubble burning,
that is actually forbidden but still persists. Also, the
in¯uence of winds from North Africa bearing dust
particles makes a signi®cant contribution.
The area is characterised by a Mediterranean climate
distinguished by an annual mean temperature of 18°C
and rainfall of 580 mm, in addition to other climato-
logical conditions that do not facilitate pollutant dis-
persion. There are frequent atmospheric inversions in
the morning and a low wind speed (mean annual ve-
locity of 4.8 m sÿ1). The majority of air currents come
from a SW±NE direction from the sea along the Gua-
dalquivir valley. There is a little industry that contrib-
utes to metal pollution and in order of decreasing
importance this consists of: the manufacture of metal
products, construction, cement and chemical industries.
Seville harbor has an important shipping tra�c devoted
mainly to the transport of agricultural goods and
foodstu�s and secondarily of scrap iron and cement. The
city is located in a ¯at valley surrounded by crop soils
(cereal and sun¯ower mainly). Because of this, together
with the relatively dry climate, dust from agricultural
work makes an important contribution to the city's air
pollution.
2.2. Particle sampling
A sampling network, with twelve monitoring sta-
tions, distributed to cover practically the whole urban
area and some zones of interest on the periphery of
Seville, was set up. The stations were placed near emis-
sion sources (industries and zones of high tra�c densi-
ty), as well as in places with cleaner air. The main
sources of contamination in Seville had been previously
studied in 1985 by one of the authors of this work
(Usero et al., 1988), using total concentrations of heavy
metals and PCA. The metals in our work have been
selected according to the results of research carried out
in 1985. Fig. 1 shows the locations of the monitoring
stations and the most signi®cant contamination sources.
We collected a total of 48 air samples from heights
ranging between 4 and 6 m, i.e., four random samples
were collected for each of the 12 stations on di�erent
days of the week. The sampling period was February to
October 1993, inclusive.
Particulate samples were collected in cellulose ®lters
(Wathman-41, 20.3 ´ 25.4 cm) using a high volume air
sampler Quimisur SMAV. The volume collected
was about 1500 m3 per 48 h, with a nominal air ¯ow of
40 m3 hÿ1.
2.3. Procedure for chemical treatment of the samples
(speciation)
Before chemical treatment, each cellulose ®lter was
divided into four equal parts and each quarter was cut
into small pieces. The chemical procedure consisted of
applying a sequential extraction scheme of four frac-
tions, a modi®cation proposed by Obiols et al. (1986) of
the Tessier scheme for sediments for application to
particles suspended in air. The corresponding four
fractions had the chemical properties shown in Table 1,
where some information on the sequential extraction
scheme is also given. Treatment for total metal deter-
mination was the same as that used for fraction IV al-
though it was carried out on a di�erent quarter of the
®lter sample.
We also determined average blanks for all the pa-
rameters, repeating the previous procedure on four un-
used ®lters. The average value of the blanks was
subtracted from the value obtained. We also evaluated
the possible matrix e�ect of ®lters and reagents on the
determinations but no detectable in¯uence was found.
2.4. Apparatus and reagents for the analysis
Samples were analyzed by ¯ame atomic absorption
spectrometry (FAAS PERKIN-ELMER 3100) for ma-
jority metals Fe, Al, Zn, Cu and Pb. Atomic absorption
spectrometry with graphite furnace (PERKIN-ELMER
HGA programmer-300 and 2380 spectrometer) was used
for the trace metals Cd, Co, Ni, Mn and Cr.
All the reagents employed were of analytical grade
and the distilled water was further treated by a Milli-Q
system (Millipore).
2.5. Multivariate statistical analyses
In order to obtain global conclusions from all results,
several chemometrical techniques of pattern recognition
A.J. Fern�andez et al. / Chemosphere ± Global Change Science 2 (2000) 123±136 125
were applied to the values corresponding to the four
samples analyzed at each sampling station. A data ma-
trix (40 ´ 48) was obtained which represents the 10 metal
concentrations in each of the four fractions. From a
chemical perspective, the whole set of parameters
(variables) determined for each sample (case) were
considered to be adequate for multivariate statistical
analysis. The following statistical techniques were ap-
plied by means of the STATISTICA (Statsoft) computer
programme: correlation between parameters, principal
components analysis (PCA) and cluster analysis of
cases.
In this work, each factor from the Principal Com-
ponents Analysis (PCA) has been associated to a source
characterized by its more representative metal species.
Factor Analysis was followed by Varimax Rotation of
the matrix and only the Principal Components that ex-
plained more than 5% of total variance of the data set
were used as factors. Loadings determine the more
representative metal species in each factor (loadings
above 0.5 were selected) and the scores represent
the most representative samples for the factors at each
station.
After the PCA, we applied Cluster Analysis to the
standardized matrix of samples using Ward's Method
and euclidean distances.
After the cluster analysis, multiple linear regression
was carried out and the data matrix (standardized) used
was that formed by the scores of the variables and fac-
tors. Linear regression involved taking all the variables
versus each of the factors.
3. Results and discussion
In the treatment of the results, graphical representa-
tions, basic statistics and multivariate statistics were all
taken into account. Using these techniques it was pos-
sible to simplify the interpretation for complex systems
such as those related to the chemical composition of
dusts and airborne particles and to reduce the variables
to a few new ones called factors (Usero et al., 1988;
Ferrer and Perez, 1990). We obtained a classi®cation of
metals in each fraction (variables) and another of sam-
ples from the stations (cases) according to the predom-
inant kind of emission sources.
3.1. General
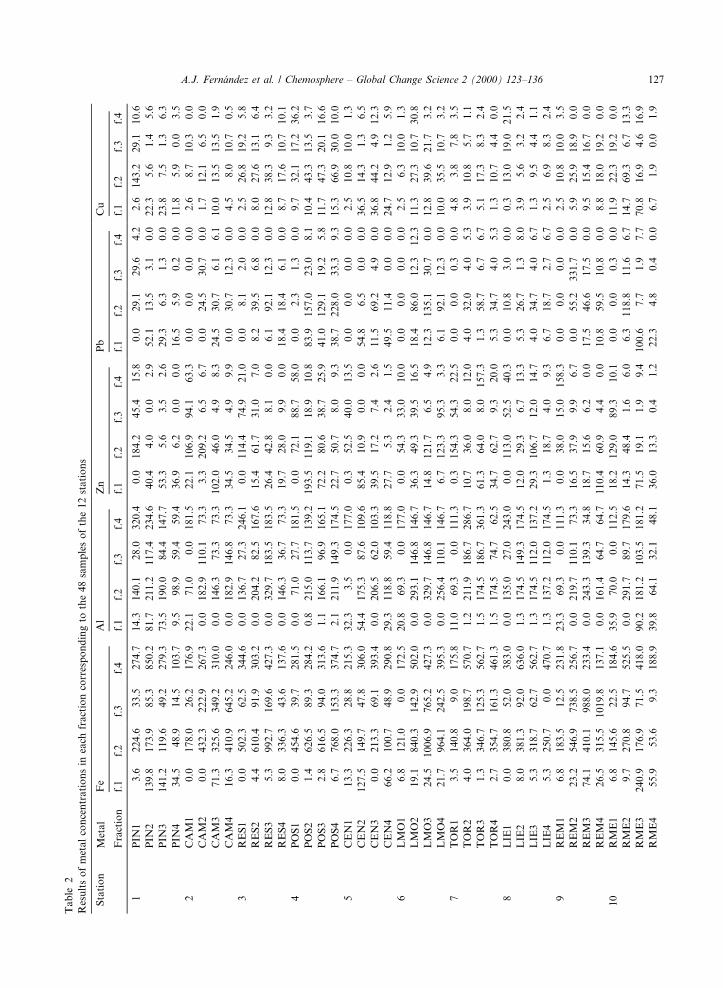
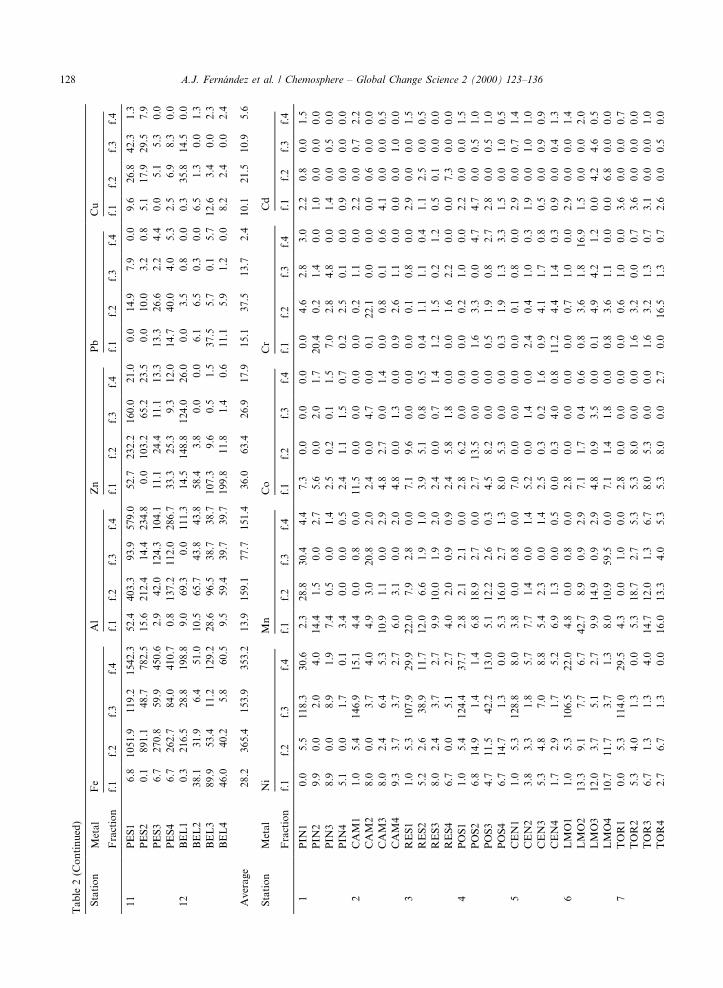
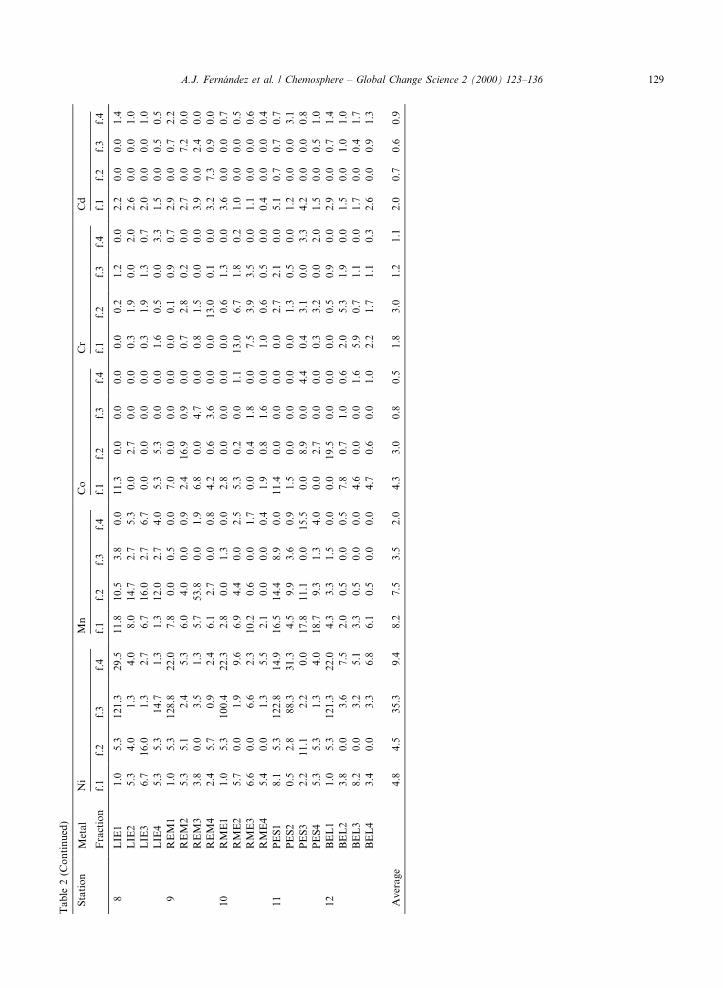
The metal contents in each fraction of the samples
from the stations are shown in Table 2. These concen-
trations are described as emission concentrations ex-
pressed as ng mÿ3 of sampled air. Although not recorded
here the percentage values were also calculated and are
discussed below.
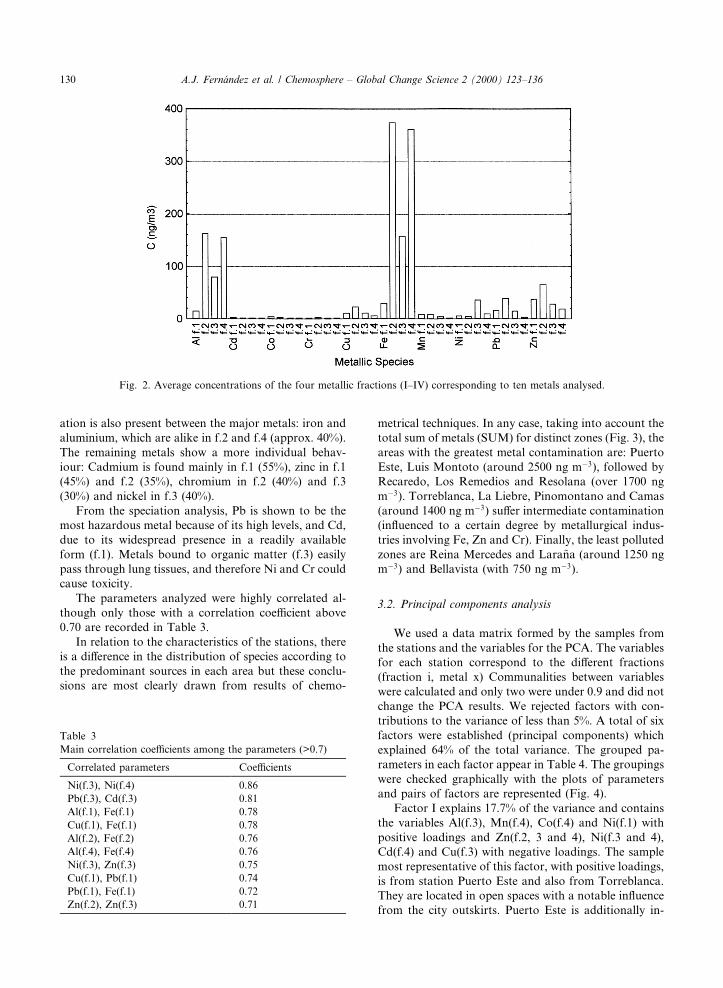
From the speciation data in Fig. 2 in general the
more concentrated fractions (f.number) in the suspended
air particles in Seville are: Fe(f.2) and Fe(f.4), with val-
ues of about 350 ng mÿ3, followed by Al(f.2), Al(f.4) and
Fe(f.3) (around 150 ng mÿ3) and thirdly by Al(f.3) and
Zn(f.2) (around 75 ng mÿ3). The fractions Pb(f.2),
Zn(f.1), Ni(f.3), Fe(f.1), Zn(f.3) and Cu(f.2) show lower
values (20±40 ng mÿ3) and others are below 20 ng mÿ3.
In brief, higher total metal contents were observed for
Fe and Al and the predominant species were the oxides
or the combined form as mineral material. Lower levels
of Zn, Pb and Cu were recorded which all predominate
as oxides and carbonates.
Taking into consideration the percentages of the
metal fractions (mean values of all stations) several
metals present a similar distribution. Manganese and
cobalt form a pair and have similar percentages f.1
(50%) and f.2 (30%); lead and copper are also matched,
both appearing primarily as f.2 (45%). Another associ-
Table 1
Sequential extraction scheme for the chemical speciation of suspended particles
Metallic fractions Reagents and conditions
Fraction 1. Soluble metal and easily interchangeable with water by
sorption-desorption processes
25 ml of 1% NaCl-mechanical agitation during
60 min at room temperature
Fraction 2. Metal as carbonates (or other forms susceptible to pH changes) and
bound to hydrated oxides (susceptible to be released under reducing
conditions)
25 ml of 0.04 M NH2OH.HCl in 25% AcOH 1 h
at 95°C, agitating occasionally
Fraction 3. Metal bound to organic matter, that is found adsorbed to living
organisms, detritus, coatings on proteins, fats, mineral particles, etc. (easily
soluble under oxidizing conditions)
25 ml of 0.02 M HNO3 + 10 ml 30% H2O2 90 min
at 85°C; + 3 ml 30% H2O2 1 h at 85°C; + 5 ml of
3.2 M NH4OAc in 20% HNO3, continuous
agitation 30 min at room temperature
Fraction 4. Residual metal found in elementary form, and in the crystalline
structure of primary and secondary minerals, silicates, cements, passivated
oxides, etc., and that ougth to be extracted under hard acid conditions.
The remaining ®nal residue is formed by silica and clay
5 ml of conc. HNO3 + 2 ml of conc. HCl + 20 ml
H2O, 90 min at 95°C, agitating occasionally
126 A.J. Fern�andez et al. / Chemosphere ± Global Change Science 2 (2000) 123±136
Tab
le2
Res
ult
so
fm
etal
con
cen
trati
on
sin
each
fract
ion
corr
esp
on
din
gto
the
48
sam
ple
so
fth
e12
stati
on
s
Sta
tio
nM
eta
lF
eA
lZ
nP
bC
u
Fra
ctio
nf.
1f.
2f.
3f.
4f.
1f.
2f.
3f.
4f.
1f.
2f.
3f.
4f.
1f.
2f.
3f.
4f.
1f.
2f.
3f.
4
1P
IN1
3.6
22
4.6
33
.52
74
.714.3
140.1
28.0
320.4
0.0
184.2
45.4
15.8
0.0
29.1
29.6
4.2
2.6
143.2
29.1
10.6
PIN
21
39
.81
73
.98
5.3
85
0.2
81.7
211.2
117.4
234.6
40.4
4.0
0.0
2.9
52.1
13.5
3.1
0.0
22.3
5.6
1.4
5.6
PIN
31
41
.21
19
.64
9.2
27
9.3
73.5
190.0
84.4
147.7
53.3
5.6
3.5
2.6
29.3
6.3
1.3
0.0
23.8
7.5
1.3
6.3
PIN
43
4.5
48
.91
4.5
10
3.7
9.5
98.9
59.4
59.4
36.9
6.2
0.0
0.0
16.5
5.9
0.2
0.0
11.8
5.9
0.0
3.5
2C
AM
10
.01
78
.02
6.2
17
6.9
22.1
71.0
0.0
181.5
22.1
106.9
94.1
63.3
0.0
0.0
0.0
0.0
2.6
8.7
10.3
0.0
CA
M2
0.0
43
2.3
22
2.9
26
7.3
0.0
182.9
110.1
73.3
3.3
209.2
6.5
6.7
0.0
24.5
30.7
0.0
1.7
12.1
6.5
0.0
CA
M3
71
.33
25
.63
49
.23
10
.00.0
146.3
73.3
73.3
102.0
46.0
4.9
8.3
24.5
30.7
6.1
6.1
10.0
13.5
13.5
1.9
CA
M4
16
.34
10
.96
45
.22
46
.00.0
182.9
146.8
73.3
34.5
34.5
4.9
9.9
0.0
30.7
12.3
0.0
4.5
8.0
10.7
0.5
3R
ES
10
.05
02
.36
2.5
34
4.6
0.0
136.7
27.3
246.1
0.0
114.4
74.9
21.0
0.0
8.1
2.0
0.0
2.5
26.8
19.2
5.8
RE
S2
4.4
61
0.4
91
.93
03
.20.0
204.2
82.5
167.6
15.4
61.7
31.0
7.0
8.2
39.5
6.8
0.0
8.0
27.6
13.1
6.4
RE
S3
5.3
99
2.7
16
9.6
42
7.3
0.0
329.7
183.5
183.5
26.4
42.8
8.1
0.0
6.1
92.1
12.3
0.0
12.8
38.3
9.3
3.2
RE
S4
8.0
33
6.3
43
.61
37
.60.0
146.3
36.7
73.3
19.7
28.0
9.9
0.0
18.4
18.4
6.1
0.0
8.7
17.6
10.7
10.1
4P
OS
10
.04
54
.63
9.7
28
1.5
0.0
71.0
27.7
181.5
0.0
72.1
88.7
58.0
0.0
2.3
1.3
0.0
9.7
32.1
17.2
36.2
PO
S2
1.4
62
6.5
89
.32
84
.20.8
215.0
113.7
139.2
193.5
119.1
18.9
10.8
83.9
15
7.0
23.0
8.1
10.4
43.3
13.5
3.7
PO
S3
2.8
61
6.5
94
.03
13
.61.1
166.1
96.9
165.1
72.2
80.6
38.7
25.9
41.0
12
9.1
19.2
5.8
11.7
47.3
20.1
16.6
PO
S4
6.7
76
8.0
15
3.3
37
4.7
2.1
211.9
149.3
174.5
22.7
50.7
8.0
9.3
38.7
22
8.0
33.3
9.3
15.3
66.9
30.0
10.0
5C
EN
11
3.3
22
6.3
28
.82
15
.332.3
3.5
0.0
177.0
0.3
52.5
40.0
13.5
0.0
0.0
0.0
0.0
2.5
10.8
10.0
1.3
CE
N2
12
7.5
14
9.7
47
.83
06
.054.4
175.3
87.6
109.6
85.4
10.9
0.0
0.0
54.8
6.5
0.0
0.0
36.5
14.3
1.3
6.5
CE
N3
0.0
21
3.3
69
.13
93
.40.0
206.5
62.0
103.3
39.5
17.2
7.4
2.6
11.5
69.2
4.9
0.0
36.8
44.2
4.9
12.3
CE
N4
66
.21
00
.74
8.9
29
0.8
29.3
118.8
59.4
118.8
27.7
5.3
2.4
1.5
49.5
11.4
0.0
0.0
24.7
12.9
1.2
5.9
6L
MO
16
.81
21
.00
.01
72
.520.8
69.3
0.0
177.0
0.0
54.3
33.0
10.0
0.0
0.0
0.0
0.0
2.5
6.3
10.0
1.3
LM
O2
19
.18
40
.31
42
.95
02
.00.0
293.1
146.8
146.7
36.3
49.3
39.5
16.5
18.4
86.0
12.3
12.3
11.3
27.3
10.7
30.8
LM
O3
24
.51
00
6.9
76
5.2
42
7.3
0.0
329.7
146.8
146.7
14.8
121.7
6.5
4.9
12.3
135.1
30.7
0.0
12.8
39.6
21.7
3.2
LM
O4
21
.79
64
.12
42
.53
95
.30.0
256.4
110.1
146.7
6.7
123.3
95.3
3.3
6.1
92.1
12.3
0.0
10.0
35.5
10.7
3.2
7T
OR
13
.51
40
.89
.01
75
.811.0
69.3
0.0
111.3
0.3
154.3
54.3
22.5
0.0
0.0
0.3
0.0
4.8
3.8
7.8
3.5
TO
R2
4.0
36
4.0
19
8.7
57
0.7
1.2
211.9
186.7
286.7
10.7
36.0
8.0
12.0
4.0
32.0
4.0
5.3
3.9
10.8
5.7
1.1
TO
R3
1.3
34
6.7
12
5.3
56
2.7
1.5
174.5
186.7
361.3
61.3
64.0
8.0
157.3
1.3
58.7
6.7
6.7
5.1
17.3
8.3
2.4
TO
R4
2.7
35
4.7
16
1.3
46
1.3
1.5
174.5
74.7
62.5
34.7
62.7
9.3
20.0
5.3
34.7
4.0
5.3
1.3
10.7
4.4
0.0
8L
IE1
0.0
38
0.8
52
.03
83
.00.0
135.0
27.0
243.0
0.0
113.0
52.5
40.3
0.0
10.8
3.0
0.0
0.3
13.0
19.0
21.5
LIE
28
.03
81
.39
2.0
63
6.0
1.3
174.5
149.3
174.5
12.0
29.3
6.7
13.3
5.3
26.7
1.3
8.0
3.9
5.6
3.2
2.4
LIE
35
.33
18
.76
2.7
56
2.7
1.3
174.5
112.0
137.2
29.3
106.7
12.0
14.7
4.0
34.7
4.0
6.7
1.3
9.5
4.4
1.1
LIE
45
.32
50
.70
.04
70
.71.3
137.2
112.0
174.5
1.3
18.7
4.0
9.3
6.7
18.7
2.7
6.7
2.5
6.9
8.3
2.4
9R
EM
16
.81
83
.51
2.5
23
1.8
23.3
69.3
0.0
111.3
0.0
38.0
15.0
158.3
0.0
0.0
0.0
0.0
2.5
10.8
10.0
3.5
RE
M2
23
.25
46
.97
38
.52
56
.70.0
219.7
110.1
73.3
16.5
37.9
9.9
6.7
0.0
55.2
331.7
0.0
5.9
25.9
18.9
0.0
RE
M3
74
.14
10
.19
88
.02
33
.40.0
243.3
139.3
34.8
18.7
15.6
6.2
0.0
17.5
46.6
17.5
0.0
9.5
15.4
16.7
0.0
RE
M4
26
.53
15
.51
01
9.8
13
7.1
0.0
161.4
64.7
64.7
110.4
60.9
4.4
0.0
10.8
59.5
10.8
0.0
8.8
18.0
19.2
0.0
10
RM
E1
6.8
14
5.6
22
.51
84
.635.9
70.0
0.0
112.5
18.2
129.0
89.3
10.1
0.0
0.0
0.3
0.0
11.9
22.3
19.2
0.0
RM
E2
9.7
27
0.8
94
.75
25
.50.0
291.7
89.7
179.6
14.3
48.4
1.6
6.0
6.3
118.8
11.6
6.7
14.7
69.3
6.7
13.3
RM
E3
24
0.9
17
6.9
71
.54
18
.090.2
181.2
103.5
181.2
71.5
19.1
1.9
9.4
100.6
7.7
1.9
7.7
70.8
16.9
4.6
16.9
RM
E4
55
.95
3.6
9.3
18
8.9
39.8
64.1
32.1
48.1
36.0
13.3
0.4
1.2
22.3
4.8
0.4
0.0
6.7
1.9
0.0
1.9
A.J. Fern�andez et al. / Chemosphere ± Global Change Science 2 (2000) 123±136 127
Tab
le2
(Co
nti
nu
ed)
Sta
tio
nM
eta
lF
eA
lZ
nP
bC
u
Fra
ctio
nf.
1f.
2f.
3f.
4f.
1f.
2f.
3f.
4f.
1f.
2f.
3f.
4f.
1f.
2f.
3f.
4f.
1f.
2f.
3f.
4
11
PE
S1
6.8
10
51.9
11
9.2
15
42.3
52.4
403.3
93.9
579.0
52.7
232.2
160.0
21.0
0.0
14.9
7.9
0.0
9.6
26.8
42.3
1.3
PE
S2
0.1
89
1.1
48
.77
82
.515.6
212.4
14.4
234.8
0.0
103.2
65.2
23.5
0.0
10.0
3.2
0.8
5.1
17.9
29.5
7.9
PE
S3
6.7
27
0.8
59
.94
50
.62.9
42.0
124.3
104.1
11.1
24.4
11.1
13.3
13.3
26.6
2.2
4.4
0.0
5.1
5.3
0.0
PE
S4
6.7
26
2.7
84
.04
10
.70.8
137.2
112.0
286.7
33.3
25.3
9.3
12.0
14.7
40.0
4.0
5.3
2.5
6.9
8.3
0.0
12
BE
L1
0.3
21
6.5
28
.81
98
.89.0
69.3
0.0
111.3
14.5
148.8
124.0
26.0
0.0
3.5
0.8
0.0
0.3
35.8
14.5
0.0
BE
L2
38
.13
1.9
6.4
51
.010.5
65.7
43.8
43.8
58.4
3.8
0.0
0.0
6.1
6.5
0.3
0.0
6.5
1.3
0.0
1.3
BE
L3
89
.95
3.4
11
.21
29
.228.6
96.5
38.7
38.7
107.3
9.6
0.5
1.5
37.5
5.7
0.1
5.7
12.6
3.4
0.0
2.3
BE
L4
46
.04
0.2
5.8
60
.59.5
59.4
39.7
39.7
199.8
11.8
1.4
0.6
11.1
5.9
1.2
0.0
8.2
2.4
0.0
2.4
Av
era
ge
28
.23
65
.41
53
.93
53
.213.9
159.1
77.7
151.4
36.0
63.4
26.9
17.9
15.1
37.5
13.7
2.4
10.1
21.5
10.9
5.6
Sta
tio
nM
eta
lN
iM
nC
oC
rC
d
Fra
ctio
nf.
1f.
2f.
3f.
4f.
1f.
2f.
3f.
4f.
1f.
2f.
3f.
4f.
1f.
2f.
3f.
4f.
1f.
2f.
3f.
4
1P
IN1
0.0
5.5
11
8.3
30
.62.3
28.8
30.4
4.4
7.3
0.0
0.0
0.0
0.0
4.6
2.8
3.0
2.2
0.8
0.0
1.5
PIN
29
.90
.02
.04
.014.4
1.5
0.0
2.7
5.6
0.0
2.0
1.7
20.4
0.2
1.4
0.0
1.0
0.0
0.0
0.0
PIN
38
.90
.08
.91
.97.4
0.5
0.0
1.4
2.5
0.2
0.1
1.5
7.0
2.8
4.8
0.0
1.4
0.0
0.5
0.0
PIN
45
.10
.01
.70
.13.4
0.0
0.0
0.5
2.4
1.1
1.5
0.7
0.2
2.5
0.1
0.0
0.9
0.0
0.0
0.0
2C
AM
11
.05
.41
46
.91
5.1
4.4
0.0
0.8
0.0
11.5
0.0
0.0
0.0
0.0
0.2
1.1
0.0
2.2
0.0
0.7
2.2
CA
M2
8.0
0.0
3.7
4.0
4.9
3.0
20.8
2.0
2.4
0.0
4.7
0.0
0.1
22.1
0.0
0.0
0.0
0.6
0.0
0.0
CA
M3
8.0
2.4
6.4
5.3
10.9
1.1
0.0
2.9
4.8
2.7
0.0
1.4
0.0
0.8
0.1
0.6
4.1
0.0
0.0
0.5
CA
M4
9.3
3.7
3.7
2.7
6.0
3.1
0.0
2.0
4.8
0.0
1.3
0.0
0.9
2.6
1.1
0.0
0.0
0.0
1.0
0.0
3R
ES
11
.05
.31
07
.92
9.9
22.0
7.9
2.8
0.0
7.1
9.6
0.0
0.0
0.0
0.1
0.8
0.0
2.9
0.0
0.0
1.5
RE
S2
5.2
2.6
38
.91
1.7
12.0
6.6
1.9
1.0
3.9
5.1
0.8
0.5
0.4
1.1
1.1
0.4
1.1
2.5
0.0
0.5
RE
S3
8.0
2.4
3.7
2.7
9.9
10.0
1.9
2.0
2.4
0.0
0.7
1.4
1.2
1.5
0.2
1.2
0.5
0.1
0.0
0.0
RE
S4
6.7
0.0
5.1
2.7
4.0
2.0
0.9
0.9
2.4
5.8
1.8
0.0
0.0
1.6
2.2
0.0
0.0
7.3
0.0
0.0
4P
OS
11
.05
.41
24
.43
7.7
2.8
2.1
2.1
0.0
2.8
6.2
0.0
0.0
0.0
0.2
1.0
0.0
2.2
0.0
0.0
1.5
PO
S2
6.8
14
.91
.41
.46.8
18.9
2.7
0.0
2.7
13.5
0.0
0.0
1.6
3.3
0.0
4.7
4.7
0.0
0.5
1.0
PO
S3
4.7
11
.54
2.2
13
.05.1
12.2
2.6
0.3
4.5
8.2
0.0
0.0
0.5
1.9
0.8
2.7
2.8
0.0
0.5
1.0
PO
S4
6.7
14
.71
.30
.05.3
16.0
2.7
1.3
8.0
5.3
0.0
0.0
0.3
1.9
1.3
3.3
1.5
0.0
1.0
0.5
5C
EN
11
.05
.31
28
.88
.03.8
0.0
0.8
0.0
7.0
0.0
0.0
0.0
0.0
0.1
0.8
0.0
2.9
0.0
0.7
1.4
CE
N2
3.8
3.3
1.8
5.7
7.7
1.4
0.0
1.4
5.2
0.0
1.4
0.0
2.4
0.4
1.0
0.3
1.9
0.0
1.0
1.0
CE
N3
5.3
4.8
7.0
8.8
5.4
2.3
0.0
1.4
2.5
0.3
0.2
1.6
0.9
4.1
1.7
0.8
0.5
0.0
0.9
0.9
CE
N4
1.7
2.9
1.7
5.2
6.9
1.3
0.0
0.5
0.0
0.3
4.0
0.8
11.2
4.4
1.4
0.3
0.9
0.0
0.4
1.3
6L
MO
11
.05
.31
06
.52
2.0
4.8
0.0
0.8
0.0
2.8
0.0
0.0
0.0
0.0
0.7
1.0
0.0
2.9
0.0
0.0
1.4
LM
O2
13
.39
.17
.76
.742.7
8.9
0.9
2.9
7.1
1.7
0.4
0.6
0.8
3.6
1.8
16.9
1.5
0.0
0.0
2.0
LM
O3
12
.03
.75
.12
.79.9
14.9
0.9
2.9
4.8
0.9
3.5
0.0
0.1
4.9
4.2
1.2
0.0
4.2
4.6
0.5
LM
O4
10
.71
1.7
3.7
1.3
8.0
10.9
59.5
0.0
7.1
1.4
1.8
0.0
0.8
3.6
1.1
0.0
0.0
6.8
0.0
0.0
7T
OR
10
.05
.31
14
.02
9.5
4.3
0.0
1.0
0.0
2.8
0.0
0.0
0.0
0.0
0.6
1.0
0.0
3.6
0.0
0.0
0.7
TO
R2
5.3
4.0
1.3
0.0
5.3
18.7
2.7
5.3
5.3
8.0
0.0
0.0
1.6
3.2
0.0
0.7
3.6
0.0
0.0
0.0
TO
R3
6.7
1.3
1.3
4.0
14.7
12.0
1.3
6.7
8.0
5.3
0.0
0.0
1.6
3.2
1.3
0.7
3.1
0.0
0.0
1.0
TO
R4
2.7
6.7
1.3
0.0
16.0
13.3
4.0
5.3
5.3
8.0
0.0
2.7
0.0
16.5
1.3
0.7
2.6
0.0
0.5
0.0
128 A.J. Fern�andez et al. / Chemosphere ± Global Change Science 2 (2000) 123±136
Tab
le2
(Co
nti
nu
ed)
Sta
tio
nM
eta
lN
iM
nC
oC
rC
d
Fra
ctio
nf.
1f.
2f.
3f.
4f.
1f.
2f.
3f.
4f.
1f.
2f.
3f.
4f.
1f.
2f.
3f.
4f.
1f.
2f.
3f.
4
8L
IE1
1.0
5.3
12
1.3
29
.511.8
10.5
3.8
0.0
11.3
0.0
0.0
0.0
0.0
0.2
1.2
0.0
2.2
0.0
0.0
1.4
LIE
25
.34
.01
.34
.08.0
14.7
2.7
5.3
0.0
2.7
0.0
0.0
0.3
1.9
0.0
2.0
2.6
0.0
0.0
1.0
LIE
36
.71
6.0
1.3
2.7
6.7
16.0
2.7
6.7
0.0
0.0
0.0
0.0
0.3
1.9
1.3
0.7
2.0
0.0
0.0
1.0
LIE
45
.35
.31
4.7
1.3
1.3
12.0
2.7
4.0
5.3
5.3
0.0
0.0
1.6
0.5
0.0
3.3
1.5
0.0
0.5
0.5
9R
EM
11
.05
.31
28
.82
2.0
7.8
0.0
0.5
0.0
7.0
0.0
0.0
0.0
0.0
0.1
0.9
0.7
2.9
0.0
0.7
2.2
RE
M2
5.3
5.1
2.4
5.3
6.0
4.0
0.0
0.9
2.4
16.9
0.9
0.0
0.7
2.8
0.2
0.0
2.7
0.0
7.2
0.0
RE
M3
3.8
0.0
3.5
1.3
5.7
53.8
0.0
1.9
6.8
0.0
4.7
0.0
0.8
1.5
0.0
0.0
3.9
0.0
2.4
0.0
RE
M4
2.4
5.7
0.9
2.4
6.1
2.7
0.0
0.8
4.2
0.6
3.6
0.0
0.0
13.0
0.1
0.0
3.2
7.3
0.9
0.0
10
RM
E1
1.0
5.3
10
0.4
22
.32.8
0.0
1.3
0.0
2.8
0.0
0.0
0.0
0.0
0.6
1.3
0.0
3.6
0.0
0.0
0.7
RM
E2
5.7
0.0
1.9
9.6
6.9
4.4
0.0
2.5
5.3
0.2
0.0
1.1
13.0
6.7
1.8
0.2
1.0
0.0
0.0
0.5
RM
E3
6.6
0.0
6.6
2.3
10.2
0.6
0.0
1.7
0.0
0.4
1.8
0.0
7.5
3.9
3.5
0.0
1.1
0.0
0.0
0.6
RM
E4
5.4
0.0
1.3
5.5
2.1
0.0
0.0
0.4
1.9
0.8
1.6
0.0
1.0
0.6
0.5
0.0
0.4
0.0
0.0
0.4
11
PE
S1
8.1
5.3
12
2.8
14
.916.5
14.4
8.9
0.0
11.4
0.0
0.0
0.0
0.0
2.7
2.1
0.0
5.1
0.7
0.7
0.7
PE
S2
0.5
2.8
88
.33
1.3
4.5
9.9
3.6
0.9
1.5
0.0
0.0
0.0
0.0
1.3
0.5
0.0
1.2
0.0
0.0
3.1
PE
S3
2.2
11
.12
.20
.017.8
11.1
0.0
15.5
0.0
8.9
0.0
4.4
0.4
3.1
0.0
3.3
4.2
0.0
0.0
0.8
PE
S4
5.3
5.3
1.3
4.0
18.7
9.3
1.3
4.0
0.0
2.7
0.0
0.0
0.3
3.2
0.0
2.0
1.5
0.0
0.5
1.0
12
BE
L1
1.0
5.3
12
1.3
22
.04.3
3.3
1.5
0.0
0.0
19.5
0.0
0.0
0.0
0.5
0.9
0.0
2.9
0.0
0.7
1.4
BE
L2
3.8
0.0
3.6
7.5
2.0
0.5
0.0
0.5
7.8
0.7
1.0
0.6
2.0
5.3
1.9
0.0
1.5
0.0
1.0
1.0
BE
L3
8.2
0.0
3.2
5.1
3.3
0.5
0.0
0.0
4.6
0.0
0.0
1.6
5.9
0.7
1.1
0.0
1.7
0.0
0.4
1.7
BE
L4
3.4
0.0
3.3
6.8
6.1
0.5
0.0
0.0
4.7
0.6
0.0
1.0
2.2
1.7
1.1
0.3
2.6
0.0
0.9
1.3
Av
era
ge
4.8
4.5
35
.39
.48.2
7.5
3.5
2.0
4.3
3.0
0.8
0.5
1.8
3.0
1.2
1.1
2.0
0.7
0.6
0.9
A.J. Fern�andez et al. / Chemosphere ± Global Change Science 2 (2000) 123±136 129
ation is also present between the major metals: iron and
aluminium, which are alike in f.2 and f.4 (approx. 40%).
The remaining metals show a more individual behav-
iour: Cadmium is found mainly in f.1 (55%), zinc in f.1
(45%) and f.2 (35%), chromium in f.2 (40%) and f.3
(30%) and nickel in f.3 (40%).
From the speciation analysis, Pb is shown to be the
most hazardous metal because of its high levels, and Cd,
due to its widespread presence in a readily available
form (f.1). Metals bound to organic matter (f.3) easily
pass through lung tissues, and therefore Ni and Cr could
cause toxicity.
The parameters analyzed were highly correlated al-
though only those with a correlation coe�cient above
0.70 are recorded in Table 3.
In relation to the characteristics of the stations, there
is a di�erence in the distribution of species according to
the predominant sources in each area but these conclu-
sions are most clearly drawn from results of chemo-
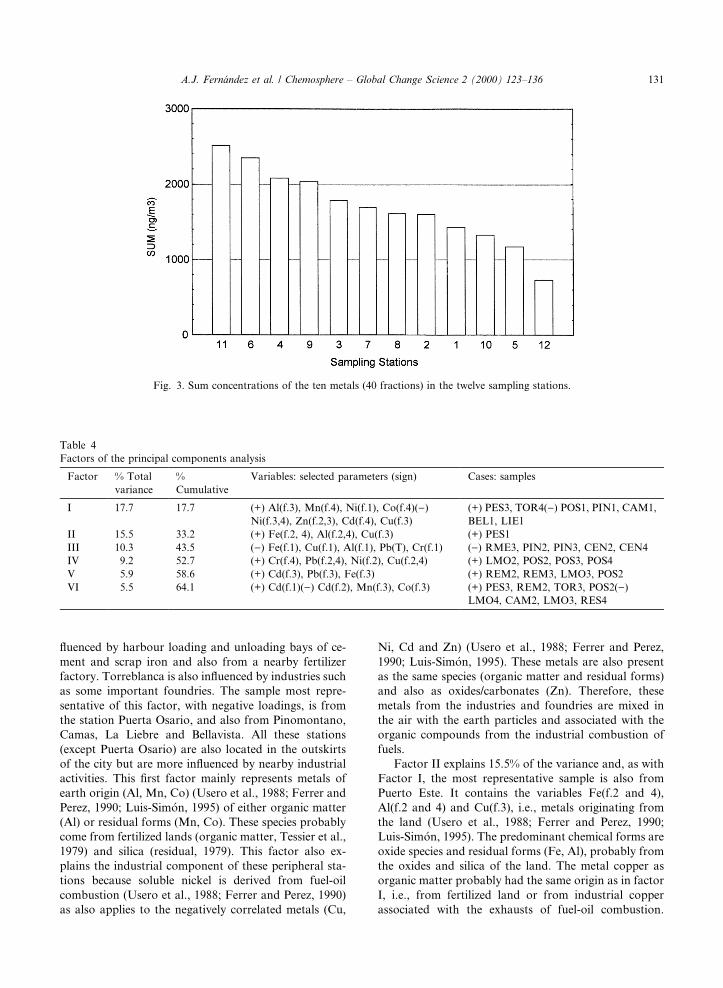
metrical techniques. In any case, taking into account the
total sum of metals (SUM) for distinct zones (Fig. 3), the
areas with the greatest metal contamination are: Puerto
Este, Luis Montoto (around 2500 ng mÿ3), followed by
Recaredo, Los Remedios and Resolana (over 1700 ng
mÿ3). Torreblanca, La Liebre, Pinomontano and Camas
(around 1400 ng mÿ3) su�er intermediate contamination
(in¯uenced to a certain degree by metallurgical indus-
tries involving Fe, Zn and Cr). Finally, the least polluted
zones are Reina Mercedes and Lara~na (around 1250 ng
mÿ3) and Bellavista (with 750 ng mÿ3).
3.2. Principal components analysis
We used a data matrix formed by the samples from
the stations and the variables for the PCA. The variables
for each station correspond to the di�erent fractions
(fraction i, metal x) Communalities between variables
were calculated and only two were under 0.9 and did not
change the PCA results. We rejected factors with con-
tributions to the variance of less than 5%. A total of six
factors were established (principal components) which
explained 64% of the total variance. The grouped pa-
rameters in each factor appear in Table 4. The groupings
were checked graphically with the plots of parameters
and pairs of factors are represented (Fig. 4).
Factor I explains 17.7% of the variance and contains
the variables Al(f.3), Mn(f.4), Co(f.4) and Ni(f.1) with
positive loadings and Zn(f.2, 3 and 4), Ni(f.3 and 4),
Cd(f.4) and Cu(f.3) with negative loadings. The sample
most representative of this factor, with positive loadings,
is from station Puerto Este and also from Torreblanca.
They are located in open spaces with a notable in¯uence
from the city outskirts. Puerto Este is additionally in-
Fig. 2. Average concentrations of the four metallic fractions (I±IV) corresponding to ten metals analysed.
Table 3
Main correlation coe�cients among the parameters (>0.7)
Correlated parameters Coe�cients
Ni(f.3), Ni(f.4) 0.86
Pb(f.3), Cd(f.3) 0.81
Al(f.1), Fe(f.1) 0.78
Cu(f.1), Fe(f.1) 0.78
Al(f.2), Fe(f.2) 0.76
Al(f.4), Fe(f.4) 0.76
Ni(f.3), Zn(f.3) 0.75
Cu(f.1), Pb(f.1) 0.74
Pb(f.1), Fe(f.1) 0.72
Zn(f.2), Zn(f.3) 0.71
130 A.J. Fern�andez et al. / Chemosphere ± Global Change Science 2 (2000) 123±136
¯uenced by harbour loading and unloading bays of ce-
ment and scrap iron and also from a nearby fertilizer
factory. Torreblanca is also in¯uenced by industries such
as some important foundries. The sample most repre-
sentative of this factor, with negative loadings, is from
the station Puerta Osario, and also from Pinomontano,
Camas, La Liebre and Bellavista. All these stations
(except Puerta Osario) are also located in the outskirts
of the city but are more in¯uenced by nearby industrial
activities. This ®rst factor mainly represents metals of
earth origin (Al, Mn, Co) (Usero et al., 1988; Ferrer and
Perez, 1990; Luis-Sim�on, 1995) of either organic matter
(Al) or residual forms (Mn, Co). These species probably
come from fertilized lands (organic matter, Tessier et al.,
1979) and silica (residual, 1979). This factor also ex-
plains the industrial component of these peripheral sta-
tions because soluble nickel is derived from fuel-oil
combustion (Usero et al., 1988; Ferrer and Perez, 1990)
as also applies to the negatively correlated metals (Cu,
Ni, Cd and Zn) (Usero et al., 1988; Ferrer and Perez,
1990; Luis-Sim�on, 1995). These metals are also present
as the same species (organic matter and residual forms)
and also as oxides/carbonates (Zn). Therefore, these
metals from the industries and foundries are mixed in
the air with the earth particles and associated with the
organic compounds from the industrial combustion of
fuels.
Factor II explains 15.5% of the variance and, as with
Factor I, the most representative sample is also from
Puerto Este. It contains the variables Fe(f.2 and 4),
Al(f.2 and 4) and Cu(f.3), i.e., metals originating from
the land (Usero et al., 1988; Ferrer and Perez, 1990;
Luis-Sim�on, 1995). The predominant chemical forms are
oxide species and residual forms (Fe, Al), probably from
the oxides and silica of the land. The metal copper as
organic matter probably had the same origin as in factor
I, i.e., from fertilized land or from industrial copper
associated with the exhausts of fuel-oil combustion.
Fig. 3. Sum concentrations of the ten metals (40 fractions) in the twelve sampling stations.
Table 4
Factors of the principal components analysis
Factor % Total
variance
%
Cumulative
Variables: selected parameters (sign) Cases: samples
I 17.7 17.7 (+) Al(f.3), Mn(f.4), Ni(f.1), Co(f.4)())
Ni(f.3,4), Zn(f.2,3), Cd(f.4), Cu(f.3)
(+) PES3, TOR4()) POS1, PIN1, CAM1,
BEL1, LIE1
II 15.5 33.2 (+) Fe(f.2, 4), Al(f.2,4), Cu(f.3) (+) PES1
III 10.3 43.5 ()) Fe(f.1), Cu(f.1), Al(f.1), Pb(T), Cr(f.1) ()) RME3, PIN2, PIN3, CEN2, CEN4
IV 9.2 52.7 (+) Cr(f.4), Pb(f.2,4), Ni(f.2), Cu(f.2,4) (+) LMO2, POS2, POS3, POS4
V 5.9 58.6 (+) Cd(f.3), Pb(f.3), Fe(f.3) (+) REM2, REM3, LMO3, POS2
VI 5.5 64.1 (+) Cd(f.1)()) Cd(f.2), Mn(f.3), Co(f.3) (+) PES3, REM2, TOR3, POS2())
LMO4, CAM2, LMO3, RES4
A.J. Fern�andez et al. / Chemosphere ± Global Change Science 2 (2000) 123±136 131
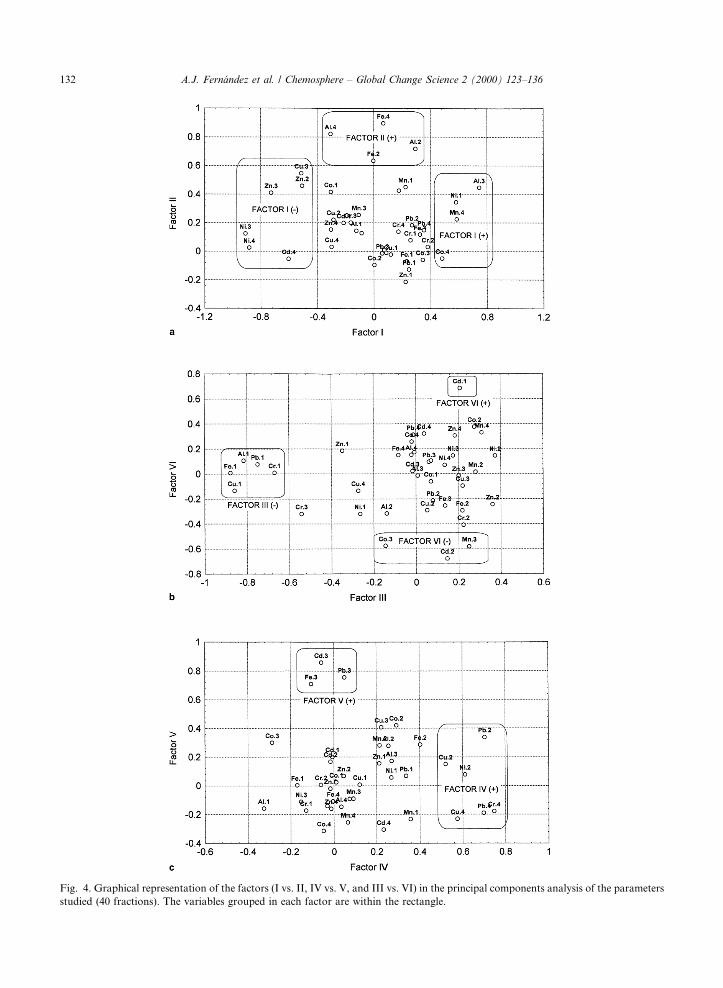
Fig. 4. Graphical representation of the factors (I vs. II, IV vs. V, and III vs. VI) in the principal components analysis of the parameters
studied (40 fractions). The variables grouped in each factor are within the rectangle.
132 A.J. Fern�andez et al. / Chemosphere ± Global Change Science 2 (2000) 123±136
Both factor I and factor II explain more than 33% of the
variance of all the samples showing that the principal
sources of the particles in Seville are particles of land
origin transported by winds, always inevitably mixed
with the industrial particles, because the principal in-
dustries and foundries are located on the city's outskirts.
Factor III explains 10.3% of the variance and con-
tains the variables Fe(f.1), Al(f.1), Cu(f.1), Pb(f.1) and
Cr(f.1). All these metals are in a soluble chemical form,
the most bioavailable to the human body and, therefore,
the most harmful. The most representative sample is
from Reina Mercedes and the others are from Pino-
montano and Centro. The metals Fe and Al indicate the
in¯uence of land particles and the metals Cu, Cr and Pb
re¯ect industrial activity of these stations and the tra�c
in the Center and Reina Mercedes, where the main
commercial and tourist center is situated and the most
important University Campus, respectively. This factor
groups the soluble species from the land (Fe and Al
assimilable by plants) and the soluble metals from in-
dustry and tra�c (Cu, Cr and Pb). The metal species
probably correspond to newly emitted particles which
have not yet been oxidized in the air.
Factor IV, however, contains oxides and residual
chemical forms of lead that originated from tra�c since
these species prevail in the samples from the two stations
with the greatest in¯uence of tra�c nearest to the city
center (furthest from the outskirts). This factor explains
9.2% of the variance and also contains the variables
Cu(f.2 and 4), Ni(f.2) and Cr(f.4). The metals Cu and Cr
also appear in factor III associated with lead, and cop-
per is the metal with the most similar behaviour to lead.
This implies that copper is not only of industrial origin
but is also produced by tra�c combustion. In this fac-
tor, the metals which appear as oxide species are Pb, Cu
and Ni, and Pb, Cu and Cr appear in the residual form.
These are the metal species that naturally prevail in
the tra�c source as with factor II in the land source
(Fe and Al).
Factor V explains only 5.9% of the variance but
contains a group of organic-bound metals (Cd, Fe and
Pb). The most representative sample of this factor is
from Los Remedios station. This is located at a cross-
roads with intermediately heavy tra�c. The other sam-
ples with high scores are samples from Los Remedios
station and samples from Puerta Osario and Luis
Montoto. Like factor IV, these are stations with high
tra�c density. In this case, Pb is found together with Cd
and Fe.
Finally, factor VI explains only a small variance
(5.5%) and contains the variable Cd(f.1) with positive
loading and Cd(f.2), Mn(f.3) and Co(f.3) with negative
loadings. The most representative sample, with positive
loadings, is from the station Puerto Este, and also
samples from Torreblanca and Los Remedios. In the
negative loadings, the most representative sample is
from Luis Montoto, and other samples are from Camas,
Luis Montoto again and Resolana. This factor shows a
negative correlation between the presence of soluble
forms of cadmium and its oxide form i.e., this form
oxidizes easily. Therefore, this group explains the be-
havior of newly emitted Cd and the correlation between
oxidized Cd and organic forms of Mn and Co. This
behavior of cadmium prevails in samples from stations
with an in¯uence of both land particles and industrial
activities (Puerto Este, Torreblanca, Camas) and tra�c
particles (Remedios, Luis Montoto, Resolana, Puerta
Osario), i.e., in the di�erent source types in Seville where
there are cadmium emissions.
With PCA analysis we have identi®ed three principal
sources: particles originating from the land, particles
originating from the industries and foundries and par-
ticles originating from road tra�c. The ®rst two sources
are almost inseparable.
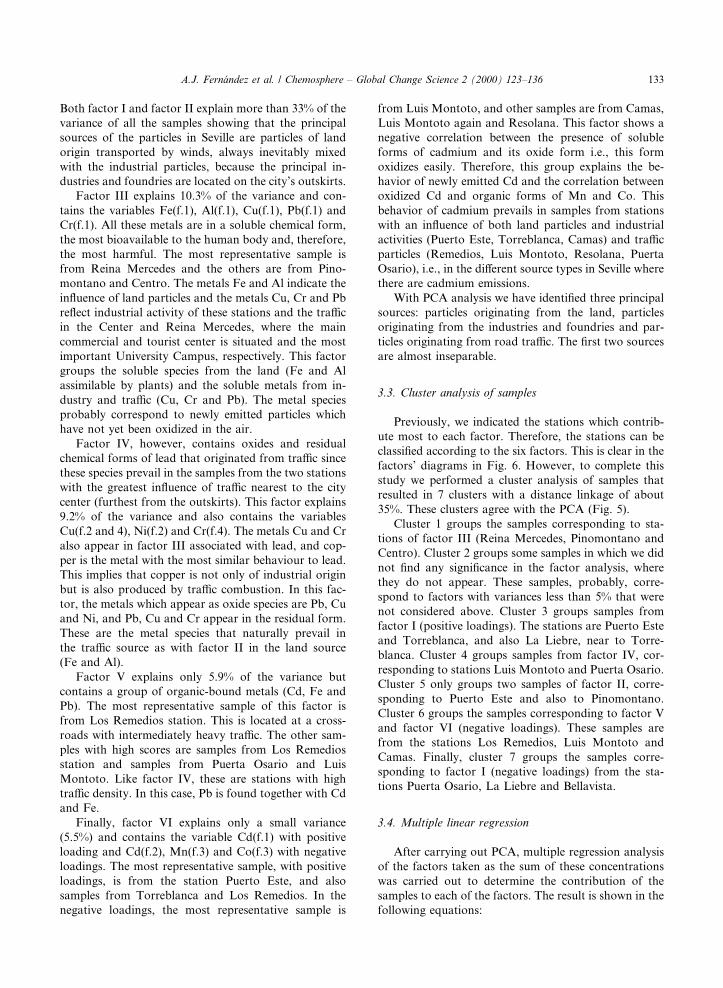
3.3. Cluster analysis of samples
Previously, we indicated the stations which contrib-
ute most to each factor. Therefore, the stations can be
classi®ed according to the six factors. This is clear in the
factors' diagrams in Fig. 6. However, to complete this
study we performed a cluster analysis of samples that
resulted in 7 clusters with a distance linkage of about
35%. These clusters agree with the PCA (Fig. 5).
Cluster 1 groups the samples corresponding to sta-
tions of factor III (Reina Mercedes, Pinomontano and
Centro). Cluster 2 groups some samples in which we did
not ®nd any signi®cance in the factor analysis, where
they do not appear. These samples, probably, corre-
spond to factors with variances less than 5% that were
not considered above. Cluster 3 groups samples from
factor I (positive loadings). The stations are Puerto Este
and Torreblanca, and also La Liebre, near to Torre-
blanca. Cluster 4 groups samples from factor IV, cor-
responding to stations Luis Montoto and Puerta Osario.
Cluster 5 only groups two samples of factor II, corre-
sponding to Puerto Este and also to Pinomontano.
Cluster 6 groups the samples corresponding to factor V
and factor VI (negative loadings). These samples are
from the stations Los Remedios, Luis Montoto and
Camas. Finally, cluster 7 groups the samples corre-
sponding to factor I (negative loadings) from the sta-
tions Puerta Osario, La Liebre and Bellavista.
3.4. Multiple linear regression
After carrying out PCA, multiple regression analysis
of the factors taken as the sum of these concentrations
was carried out to determine the contribution of the
samples to each of the factors. The result is shown in the
following equations:
A.J. Fern�andez et al. / Chemosphere ± Global Change Science 2 (2000) 123±136 133
F:I � 0:2185 Al�f:3� � 0:1472
Co�f :4� � 0:1438 Mn�f :4� � 0:0763
Zn�f :2� � 0:0127 Ni�f :1� ÿ 0:3387
Ni�f :3� ÿ 0:1624 Ni�f:4� ÿ 0:1581
Zn�f :3� ÿ 0:1343 Cu�f :2� ÿ 0:0765
Cd�f :4� ÿ 0:0489 Cu�f:3� ÿ 0:0463
Cu�f :4�; r � 0:9886:
F:II � 0:4301 Fe�f :4� � 0:2382
Al�f :4� � 0:1583 Co�f :1� � 0:1344
Al�f :3� � 0:1316 Al�f :2� � 0:1304
Cu�f :3� � 0:0814 Al�f :1� � 0:0721
Mn�f :1� � 0:0380 Fe�f :2�; r � 0:9699:
F:III � ÿ0:319 Cu�f:1� ÿ 0:2569
Al�f :1� ÿ 0:1654 Cr�f :1� ÿ 0:1647
Pb�f :1� ÿ 0:1623Fe�f:1�; r � 0:9629:
F:IV � 0:3071 Cu�f:4� � 0:2874
Pb�f :2� � 0:2558 Cr�f :4� � 0:2151
Pb�f :4� � 0:2141 Ni�f:2� � 0:1202
Cu�f :2�; r � 0:9563:
F:V � 0:4503 Cd�f:3� � 0:3197
Fe�f :3� � 0:2570 Pb�f :3�; r � 0:8989:
F:VI � 0:4457 Cd�f :1� ÿ 0:3261
Mn�f:3� ÿ 0:3217Cd�f :2� ÿ 0:2347
Co�f :3�; r � 0:9207:
With these equations, the predominant source of the
particles in a sample collected at any one of the city
stations, as a function of the values in F.I, F.II, F.III,
F.IV, F.V and F.VI, can be established.
4. Conclusions
Metal chemical speciation permits us to ful®l one of
the goals of atmospheric particulate research i.e., the
degree of toxicity assigned to the particles and the pol-
lution sources are now better known. Furthermore, this
work shows that speciation increases the knowledge of
urban air pollution and gives satisfactory results in the
case study of a lightly industrialized city such as Seville.
Thus, the sources of particles in Seville have been better
characterized than in previous studies (Usero et al.,
1988; Luis-Sim�on, 1995).
The methodology proposed here consists of a direct
study of metal distribution in chemical species with
subsequent PCA of the speciation data, cluster analysis
and multiple linear regression analysis of the samples
from the stations.
PCA permitted characterization of the sources, ren-
dering six factors that also explained the degree of tox-
icity of the main sources. The ®rst two factors mainly
explain the e�ect of land particles resuspended by the
wind, containing the metals Al, Fe, Mn and Co, which
are present as organic matter and mineral chemical
Fig. 5. Dendrogram of the cluster analysis of the samples of stations.
134 A.J. Fern�andez et al. / Chemosphere ± Global Change Science 2 (2000) 123±136
forms. This source is the most important and is always
mixed with industrial components from the areas where
the stations are located, e.g., on the city outskirts. The
second most important source was the tra�c in the city.
Two factors (factor IV and V) are clearly attributed to
the tra�c. One presents the metals in the oxide and re-
sidual fractions (Pb, Cu and also Ni, Cr) and the other
presents metals bound to organic matter (Pb, Cd, Fe)
and are both present in stations dominated by high
density tra�c.
In relation to toxicity, factor II shows the metals that
predominate together in the soluble chemical forms (Fe,
Al, Pb, Cu and Cr) which appear in all the source types
(land, tra�c and industry). Lead and chromium are the
most harmful metals and lead is the most abundant in
air. Factor VI explains the behavior of another very
toxic metal (cadmium) which predominates as the sol-
uble species and is readily oxidized, this is also present in
all the source types.
Cluster analysis of the samples was carried out as a
complementary analysis. This classi®es the stations ac-
cording to the PCA of fractions and also provides in-
formation about the stations that do not appear in the
PCA because they belong to factors with variances lower
than 5%. The stations that can be classi®ed as being
dominated by land and industrial pollution are: Puerto
Este, Torreblanca, La Liebre, Pinomontano, Bellavista
and Camas, and the stations classi®ed as being domi-
nated by tra�c pollution are: Luis Montoto, Puerta
Osario, Los Remedios, Reina Mercedes, Centro and
Resolana.
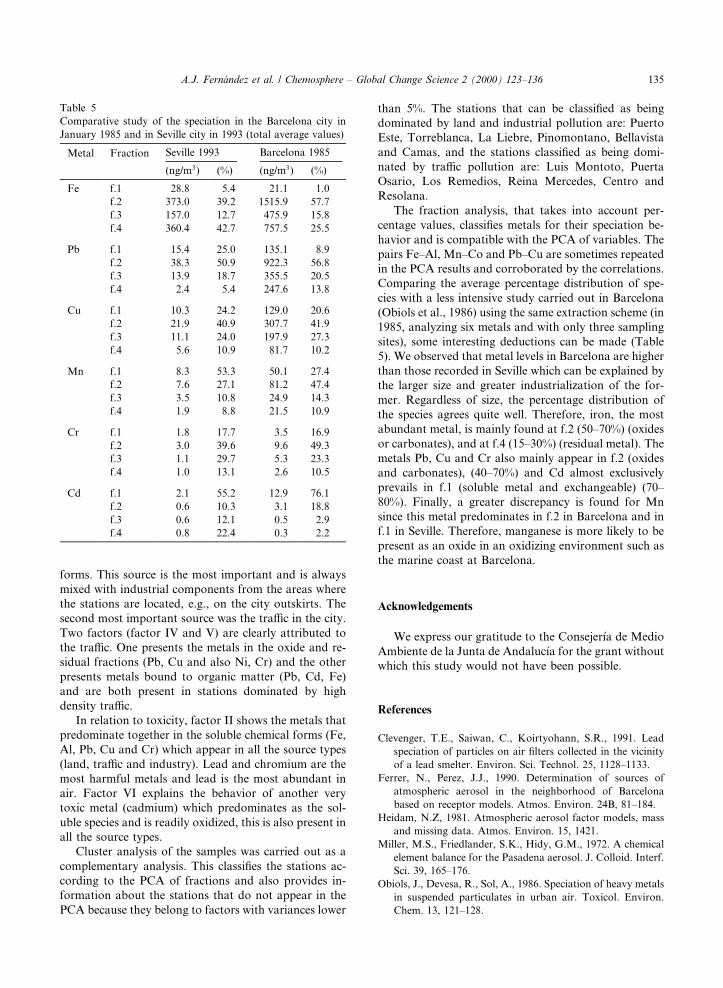
The fraction analysis, that takes into account per-
centage values, classi®es metals for their speciation be-
havior and is compatible with the PCA of variables. The
pairs Fe±Al, Mn±Co and Pb±Cu are sometimes repeated
in the PCA results and corroborated by the correlations.
Comparing the average percentage distribution of spe-
cies with a less intensive study carried out in Barcelona
(Obiols et al., 1986) using the same extraction scheme (in
1985, analyzing six metals and with only three sampling
sites), some interesting deductions can be made (Table
5). We observed that metal levels in Barcelona are higher
than those recorded in Seville which can be explained by
the larger size and greater industrialization of the for-
mer. Regardless of size, the percentage distribution of
the species agrees quite well. Therefore, iron, the most
abundant metal, is mainly found at f.2 (50±70%) (oxides
or carbonates), and at f.4 (15±30%) (residual metal). The
metals Pb, Cu and Cr also mainly appear in f.2 (oxides
and carbonates), (40±70%) and Cd almost exclusively
prevails in f.1 (soluble metal and exchangeable) (70±
80%). Finally, a greater discrepancy is found for Mn
since this metal predominates in f.2 in Barcelona and in
f.1 in Seville. Therefore, manganese is more likely to be
present as an oxide in an oxidizing environment such as
the marine coast at Barcelona.
Acknowledgements
We express our gratitude to the Consejer�õa de Medio
Ambiente de la Junta de Andaluc�õa for the grant without
which this study would not have been possible.
References
Clevenger, T.E., Saiwan, C., Koirtyohann, S.R., 1991. Lead
speciation of particles on air ®lters collected in the vicinity
of a lead smelter. Environ. Sci. Technol. 25, 1128±1133.
Ferrer, N., Perez, J.J., 1990. Determination of sources of
atmospheric aerosol in the neighborhood of Barcelona
based on receptor models. Atmos. Environ. 24B, 81±184.
Heidam, N.Z, 1981. Atmospheric aerosol factor models, mass
and missing data. Atmos. Environ. 15, 1421.
Miller, M.S., Friedlander, S.K., Hidy, G.M., 1972. A chemical
element balance for the Pasadena aerosol. J. Colloid. Interf.
Sci. 39, 165±176.
Obiols, J., Devesa, R., Sol, A., 1986. Speciation of heavy metals
in suspended particulates in urban air. Toxicol. Environ.
Chem. 13, 121±128.
Table 5
Comparative study of the speciation in the Barcelona city in
January 1985 and in Seville city in 1993 (total average values)
Metal Fraction Seville 1993 Barcelona 1985
(ng/m3) (%) (ng/m3) (%)
Fe f.1 28.8 5.4 21.1 1.0
f.2 373.0 39.2 1515.9 57.7
f.3 157.0 12.7 475.9 15.8
f.4 360.4 42.7 757.5 25.5
Pb f.1 15.4 25.0 135.1 8.9
f.2 38.3 50.9 922.3 56.8
f.3 13.9 18.7 355.5 20.5
f.4 2.4 5.4 247.6 13.8
Cu f.1 10.3 24.2 129.0 20.6
f.2 21.9 40.9 307.7 41.9
f.3 11.1 24.0 197.9 27.3
f.4 5.6 10.9 81.7 10.2
Mn f.1 8.3 53.3 50.1 27.4
f.2 7.6 27.1 81.2 47.4
f.3 3.5 10.8 24.9 14.3
f.4 1.9 8.8 21.5 10.9
Cr f.1 1.8 17.7 3.5 16.9
f.2 3.0 39.6 9.6 49.3
f.3 1.1 29.7 5.3 23.3
f.4 1.0 13.1 2.6 10.5
Cd f.1 2.1 55.2 12.9 76.1
f.2 0.6 10.3 3.1 18.8
f.3 0.6 12.1 0.5 2.9
f.4 0.8 22.4 0.3 2.2
A.J. Fern�andez et al. / Chemosphere ± Global Change Science 2 (2000) 123±136 135
Que, S.S., 1994. Availability of elements in leaded/unleaded
automobile exhausts, a leaded paint, a soil, and some
mixtures. Arch. Environ. Contam. Toxicol. 27, 145±153.
Sche�, P.A., Wadden, R.A., Allen, R.J., 1984. Receptor model
identi®cation of particulate sources and implications for the
development of air quality control strategies for Chicago.
Environ. Sci. Technol. 18, 923.
Tessier, A., Campbell, P.G.C., Bisson, M., 1979. Sequential
extration procedure for the speciation of particulate trace
metals. Anal. Chem. 51, 844±851.
Usero, J., Rosa, F., Ternero, M., Gracia, I., 1988. A determi-
nation of the sources in the Seville urban aerosol. Inter.
J. Environ. Anal. Chem. 33, 233±244.
Zatka, V.J., Warner, J.S., Maskery, D., 1992. Chemical
speciation of nickel in airborne dusts: analytical method
and results of an interlaboratory test program. Environ. Sci.
Technol. 26, 138±144.
Antonio Jos�e Fern�andez Espinosa received his Ph.D. degree inChemistry from the University of Seville in 1998. He has aninterest in metallic air pollution and currently he is collabo-rating with the Andalousian government in research on Poly-cyclic Aromatic Hydrocarbons in air particulates, following anew European Directive. He advises local authorities on topicsof atmospheric contamination. He is an Associate Teacher inthe Department of Analytical Chemistry.
F.J. Barragan de la Rosa has taught in the Department ofAnalytical Chemistry of the University of Seville since 1979. In1986 he became Titular Professor in the department. At presenthe is investigating groundwater, atmospheric particles, andelectroanalysis of pharmaceuticals.
136 A.J. Fern�andez et al. / Chemosphere ± Global Change Science 2 (2000) 123±136