Embed Size (px)
Citation preview
AN APPROACH ON DILUTION AND ORE RECOVERY/ LOSS CALCULATIONS IN MINERAL RESERVE ESTIMATIONS
AT THE CAYELI MINE, TURKEY
A THESIS SUBMITTED TO THE GRADUATE SCHOOL OF NATURAL AND APPLIED SCIENCES
OF MIDDLE EAST TECHNICAL UNIVERSITY
BY
NİHAT SOYER
IN PARTIAL FULFILLMENT OF THE REQUIREMENTS FOR
THE DEGREE OF MASTER OF SCIENCE IN
MINING ENGINEERING
DECEMBER, 2006
Approval of the Graduate School of Natural and Applied Sciences
Prof. Dr. Canan Özgen
Director
I certify that this thesis satisfies all the requirements as a thesis for the degree of
Master of Science.
Prof. Dr. Celal Karpuz
Head of Department
This is to certify that we have read this thesis and that in our opinion it is fully
adequate, in scope and quality, as a thesis for the degree of Master of Science.
Prof. Dr. Tevfik Güyagüler
Supervisor
Examining Committee Members
Prof. Dr. Naci Bölükbaşı (METU, MINE)
Prof. Dr. Nurkan Karahanoğlu (METU, GEO)
Assoc. Prof. Dr. Aydın Bilgin (METU, MINE)
Prof. Dr. Tevfik Güyagüler (METU, MINE)
M.Sc. Ömer Ünver

iii
I hereby declare that all information in this document had been contained and presented in accordance with academic rules and ethical conduct. I also declare that, as required by these rules and conduct, I have fully cited and referenced all material and results that are not original to this work. Nihat Soyer
iv
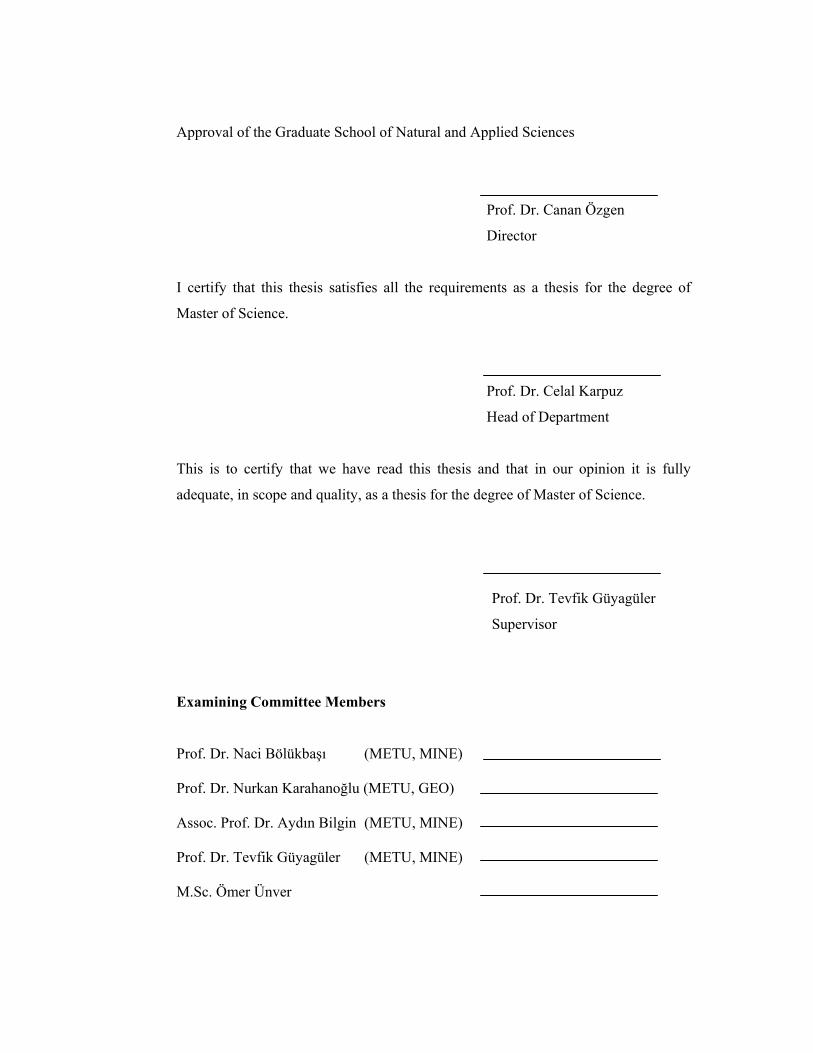
ABSTRACT
AN APPROACH ON DILUTION AND ORE RECOVERY/ LOSS CALCULATIONS IN MINERAL RESERVE ESTIMATIONS
AT THE CAYELI MINE, TURKEY
Soyer, Nihat
M. Sc., Department of Mining Engineering
Supervisor: Prof. Dr. Tevfik Güyagüler
December 2006, 102 Pages
Dilution and ore recovery/loss have an important role in calculation of mineral
reserves. Each percent increase in dilution and decrease in recovery negatively affects economic value of the reserve. These parameters are mainly controlled by the quality of the mine design and stoping practice.
This study provides an approach developed for dilution and recovery/ore loss
calculations. The contribution of mine design software (MineSight) and the recent survey technique called Cavity Monitoring System (CMS) were presented in this study. The purpose was to compare the new approach with the old system where the calculations had been done according to some assumptions and to optimize mineral reserve estimation process.
Results indicate that the new approach used in reserve estimation process gives
~1.6% closer tonnages to the actual numbers and the grades are both ~1.6% closer to the actual values numbers when compared with the old system. Keywords: Dilution, Recovery, Mineral Reserve, Mine Design
v
ÖZ
ÇAYELİ MADENİ, TÜRKİYE’DEKİ CEVHER REZERVİ TAHMİNLERİNDE PASA KARIŞIMI VE CEVHER KAZANIMI/KAYBI
HESAPLAMALARI ÜZERİNE BİR YAKLAŞIM
Soyer, Nihat
Yüksek Lisans, Maden Mühendisliği Bölümü
Tez Yöneticisi: Prof. Dr. Tevfik Güyagüler
Aralık 2006, 102 Sayfa
Pasa karışımı ve cevher kazanımı / kaybı, mineral rezervleri hesaplamalarında önemli bir rol oynar. Her bir yüzdelik pasa karışımındaki artış ve cevher kazanımındaki azalış, rezervin ekonomik değerini olumsuz yönde etkiler. Bu parametreler, temel olarak maden tasarımına ve cevher üretim uygulamasına bağlı olarak değişir.
Bu çalışmada, pasa karışımı ve cevher kazanımı / kaybı hesaplamaları için
geliştirilen bir yaklaşım verilmistir. Paket programda (MineSight) yapılan maden tasarımı sistemlerinin ve yeni geliştirilmiş Boşluk Geometrisi Ölçüm Tekniğinin (CMS) katkıları bu çalışmada anlatılmıştır. Amaç, yeni yaklaşımı eski sistemle (varsayımlarla yapılan hesaplama) mukayese etmek ve mineral rezervi tahminlerini en uygun şekilde hesaplamaktır.
Sonuçlar, reserv hesaplamalarında kullanılan yeni yaklaşımın, eski sistemle
karşılastırıldığında, gerçekleşen rakamlara tonaj bazında ~1.6% ve tenör bazında da yine ~1.6% (bakır ve çinko için) daha yakın değerler verdiğini göstermektedir. Anahtar Kelimeler: Pasa Karışımı, Cevher Kazanımı, Reserv, Maden Dizayni

vi
To My Parents

vii
ACKNOWLEDGEMENTS
I would like to express my sincere thanks to my thesis supervisor Prof. Dr. Tevfik Güyagüler for his support and guidance in preparation of this thesis.
My grateful acknowledgement extends to the circle of dear friends:
M.Sc. Nihat Ataman, Mine Eng., Middle East Technical University; Hacı Karakuş, Geo. Eng., Çayeli Bakır İşletmeleri A.Ş.; Ertan Uludağ, Geo. Eng., Çayeli Bakır İşletmeleri A.Ş.
I am ever so grateful to my manager Joe Boaro, for his patience and support
during this work. I am very blessed that I had all the supports of my lovely sister Ayla Soyer. Finally, the biggest thanks are for my father and mother, and the other members
of my family, Işılay - Cahit Altınsoy and Sevinç - Bülent Yazgan for the reason of my existence and their support in my life.
I finally want to thank to my wonderful wife, Nazan and pretty daughter Naz
Pelin for being the source of strength in my life.
viii
TABLE OF CONTENTS
iiiivv
vivii
viiix
xixii
PLAGIARISM ……………………………………………………………………...... ABSTRACT………………………………………………………………………....... ÖZ…………………………………………………………………………………...... DEDICATION………………………………………………………………………... ACKNOWLEDGMENTS………………………………………………………......... TABLE OF CONTENTS……………………………………………………………... LIST OF TABLES……………………………………………………………………. LIST OF FIGURES…………………………………………………………………... LIST OF SYMBOLS…………………………………………………………………. CHAPTERS 1. INTRODUCTION………………………………………………………… 1 1.1. General Remarks………………………………………………………….. 1 1.2. Mineral Resource and Mineral Reserve Estimates………………………... 1 1.3. Terms of Reference………………………………………………………... 2 1.4. Objectives of the Thesis………………………………………………........ 3 1.5. Procedure………………………………………………………………….. 3 2. PROPERTY INFORMATION……………………………………………. 4 2.1. Property Location………………………………………………………..... 4 2.2. Property Accessibility……………………………………………………... 5 2.3. Infrastructure and Labor…………………………………………………... 7 2.4. History…………………………………………………………………….. 9 3. GEOLOGICAL SETTING………………………………………………... 12 3.1. Regional Geology………………………………………………………..... 12 3.2. Deposit Geology ……………...…………………………………………... 13 3.3. Mineralization ……………...……………………………………………... 16 4. MINING OPERATIONS AT CAYELI MINE…………………………… 18 4.1. Mine Development………..……………………..………………………... 18 4.2. Mining Method …………………………………………………………… 19 4.3. Backfilling ……………………………….……………………………….. 22 4.4. Mine Access and Infrastructure …………………………………………... 23 4.4.1. Ramp ……………………………………………………………………… 23 4.4.2. Shaft ………………………………………………………………………. 23 4.5. Material Handling ………………………………………………………… 24 4.5.1. Ore and Waste Handling ………………………………………………...... 24 4.5.2. Shotcrete Delivery………………………………………………………… 25 4.5.3. Aggregate Delivery ……………………………………………………...... 25 4.5.4. Materials and Fuel Delivery ……………………………………………… 26 4.5.5. Compressed Air Delivery ………………………………………………… 26 4.5.6. Water Supply ……………………………………………………………... 26 4.6. Ventilation ………………………………………………………………... 26 4.7. Mine Drainage and Dewatering…………………………………………… 27
ix
4.8. Maintenance ………………………………………………………………. 27 4.9. Electric Energy ……………..…………………………………………….. 28 4.10. Ore Hoisting and Transport to Surface Stockpile ……………………........ 28 4.11. Mobile equipment ………………………………………………………… 29 5. MINERAL RESOURCE ESTIMATES ……………………….………..... 30 5.1. Geological Model ……………………………………………….………... 30 5.2. Mineral Resource and Mineral Reserve Classification…………………… 31 5.3. Smelter Return and Equivalent Copper Calculations ……….….………… 32 5.4. Grade, Tonnage and NSR Comparisons ………………………………...... 33 5.5. Block Model Limits ………………………………………………………. 36 5.6. Mineral Resource – Tonnes and Grades ………………………………...... 36 5.7. Distribution of Resources by Ore Type...…………………………..……... 37 5.8. Comparison with Previous Resource Estimates………………….……….. 37 6. MINERAL RESERVE ESTIMATES …………………………………..... 39 6.1. Mineral Reserves ……..………………………………………….……….. 39 6.2. MineSight 3-D Mine Software …………………………………….……... 39 6.3. Mine Design ……………………………………………………….……… 42 6.4. Creating Strings and Wireframes for the Mining Block ………………...... 43 6.5. Conventional Method for Wireframe Creation …………………………… 44 6.6. New Method for Wireframe Creation …………………………………...... 44 6.7. Dilution Calculations ……………………………………………………... 46 6.8. Old System – Dilution and Recovery Calculations ……………….……… 49 6.9. New System – Dilution and Recovery Calculations ……………………… 51 6.10. Recovery Calculations – Ore Recovery / Loss……………………………. 52 6.11. Cavity Monitoring System Database …………………………….……...... 54 6.12. Dilution and Recovery Calculation Process …………………….………... 55 6.13. Reconciliation with Historical Production ……………………….……...... 59 6.14. Comparison with Previous Estimates …………………………….……..... 60 6.15. Comparison of Dilution and Recovery Ratios : New vs. Old System…...... 61 7. CONCLUSIONS AND RECOMMENDATIONS ………….……………. 64 REFERENCES …………………………………………………………………..…… 65 APPENDICES A. CIM STANDARDS ON MINERAL RESOURCES AND RESERVES…. 66 B. NSR CALCULATION METHOD ……………………………………...... 93 C. MINERAL RESOURCE TONNES AT A SERIES OF CUEQ CUT-OFF
AND NSR LIMITS ………………………………………………………..
95 D. RELATIONSHIP BETWEEN NSR AND CUEQ ……………………….. 97 E. COPPER AND ZINC PRICES SINCE 1990 …………………………….. 98 F. DILUTION AND ORE LOSS/RECOVERY CALCULATIONS ……….. 100
x
LIST OF TABLES
1.1. Mineral Resource-December 31, 2005 ………………………..….…………... 21.2. Mineral Reserve-December 31, 2005 …………………………….…………... 22.1. List of Properties ………………………………………………….….............. 52.2. Road Segment Distance...…………..……………………….………..….......... 72.3. Labor ...…………………..……………………….………….……….………. 92.4. Highlights of the Activities ……………..……………….…….……..………. 112.5. Historical Reserves and Production……..………..……………………..….…. 114.1. Underground Mobile Equipment List …….…….…….…………...…………. 295.1. Block Model Parameters …..…………………………….….…...…………… 365.2. Undiluted Mineral Resources (Inclusive of Mineral Reserves)-
December 31, 2005 at a cut-off grade of $35 NSR/tonne of ore.........…...……
365.3. Mineral Resources by Ore Type-December 31, 2005 at a cut-off
grade of $35 NSR/tonne of ore ………………………………………..…...….
385.4. Comparison of Mineral Resources: December 31, 2005 vs. 2004 ………....… 386.1. Mineral Reserves-December 31, 2005 at a cut-off grade of $46
NSR/tonne of ore ……….………………………………………………..........
396.2. Dilution Calculations – Old System….……………………………………….. 506.3. Dilution Factors – Old System………………………………………………... 516.4. Dilution Factors – New System……………………………………………….. 526.5. Recovery Factors...…..………...…………………………………………........ 546.6. Actual vs. Model Grade Reconciliation – 2005 Production Year……….......... 596.7. Comparison of Mineral Reserves: December 31, 2005 vs. 2004 …..……........ 606.8. Gain (Loss) to 2005 Mineral Reserves.………………………………….……. 616.9. Summary of Dilution and Recovery by Calculation System………………….. 616.10. Database – Planned vs. Actual Stope Tonnes and Grades in 2006………........ 626.11. Calculation of Tonnes and Grades Including Dilution and Recovery………… 626.12. Actual vs. Plan Reconciliation – 2006 Production Year…………………........ 63A1. Checklist For the Estimation of Mineral Resources…………………………... 86A1a. Additional Guidance for the Reporting of Sampling Techniques and Data…... 88A1b. Additional Guidance for the Reporting of Exploration Results.…………........ 89A2. Exploration Best Practices Guidelines……………………………………....... 90B1. Assumptions on Net Smelter Return (NSR) Calculations…………………….. 93B2. Spec Ore and Non-Spec Ore NSR Calculations………………………...…….. 94C1. Mineral Resource Tonnes at a Series of CuEq Cut-off Limits………………... 95C2. Mineral Resource Tonnes at a Series of NSR Cut-off Limits……………........ 96D1. NSR vs. CuEq Database………………………….……………………..…….. 97E1. Copper Prices…………………………………………………………...……... 98E2. Zinc Prices………………………………………………….…………...…….. 99F1. Dilution / Ore Loss Calculations in 2005……………………………………... 100F2. Dilution / Ore Loss Calculations in 2006 (for the first 6 months)…………….. 102
xi
LIST OF FIGURES
2.1. Cayeli, Turkey Location Map ……………………..…………………….……. 42.2. Cayeli, Mine Location Map ………………………..…………………..……... 52.3. Property Boundary Map ……………………………………………………… 62.4. Kackar Mountains …………………………………..………………….…….. 72.5. Site Map …………………………………..…………………………….......… 83.1. Regional Geology Map…………………..…………………………….……… 123.2. Deposit Geology Map ……………………..………………………………….. 143.3. 3D Main and Deep Ore Zones……………..………………………………….. 153.4. Geology Cross-Section (looking north) …..…………………………………... 163.5. Mine Geology – Ore Types ………………..…………………………………. 174.1. Actual and Planned Mine Development............................................................. 184.2. Schematic Mining Sequence ………………….……………………………… 204.3. Mining Method and Sequence...…………………………………..................... 214.4. Ore Transportation to Stockpiles...……………………………………………. 285.1. Mineral Resource vs. Mineral Reserve………………………..……………… 325.2. Undiluted Mineral Resource Grade/Tonnage Distribution………………........ 345.3. Undiluted Mineral Resource NSR/Tonnage Distribution …………................. 345.4. NSR versus CuEq ..……………...……………………………………………. 355.5. Copper and Zinc Prices History .………………………………...…................ 355.6. Distribution of Resource Classification…………………………..…………… 376.1. Mineral Reserve Estimation Process……………………………..………..….. 406.2. Mineral Reserves at a Cut-Off Grade of $46 NSR/tonne of ore ………...…… 416.3. Ore Development in Deep Ore Zone (Plan View)…………..………………... 436.4. Conventional Method for Wireframe Creation……………..……………..….. 446.5. New Method for Wireframe Creation………………………………….…..…. 456.6. Attributes of Each Wireframe………………………………..………….……. 466.7. Types of Production Dilution of An Ore…………………………………....… 476.8. Planned and Unplanned Dilution…………………………………………..….. 486.9 Calculation of Overall Dilution in Old System……………………………….. 516.10. Recovery / Ore Loss Sources ………………………………………………… 536.11. Components of CMS………………………………………………………….. 546.12. CMS in Stope for Survey…………………………………………………...… 546.13. Results of CMS Survey in a Stope……………………………………………. 556.14. Conduction of CMS Survey………………………………………………..…. 566.15. Importing CMS of Adjacent Stopes…………………..……………………..... 566.16. Intersection of the CMS Data with the CMS’s of Adjacent Stopes……..…..... 576.17. Importing Planned Solid………………………………………………………. 586.18. Subtraction of the Planned Solid from the CMS Data…………………….….. 586.19. Copper and Zinc Grade Reconciliation from 2003 to 2005 Production………. 60A1. Relationship Between Mineral Resources and Mineral Reserves…………….. 77
xii
LIST OF SYMBOLS
CBI : Cayeli Bakir Isletmeleri A.S., a Turkish company owned by Inmet Mining Corporation (100%)
CIM : Canadian Institute of Mining, Metallurgy and Petroleum NI 43-101 : The standards of Canadian National Instrument CMS : Cavity Monitoring System for scanning solutions of dangerous and
inaccessible cavities CO : Clastic ore type, massive sulphides containing >10% sphalerite fragments
which commonly show internal intergrowths of chalcopyrite YO : Yellow ore type, copper-rich, and zinc poor sulphides BO : Black ore type, zinc-rich massive sulphides with >4.5% Zn and Cu/Z ratio
<1 NSR : Net Smelter Return cut-off, $46 per tonne for the mineable reserve in
Cayeli deposit FWR : Foot Wall Ramp drift developed in Rhyolite zone at foot wall side for
connecting sub-levels cutting the ore MTA : Turkish Mineral Research and Exploration Institute
1
CHAPTER 1
INTRODUCTION
1.1 General Remarks
Cayeli Bakir Isletmeleri (CBI) is a Copper and Zinc mine which operates in Northeastern Turkey in the province of Rize. The Cayeli Deposit is located in 8 km south of the Black Sea coast. It is owned and operated by CBI, a Canadian company consisting of Inmet Mining Corporation (100%) of Toronto.
CBI prepares annual reserve report by the end of the previous year at the first
quarter of the current year. The reports are prepared with factors for mining dilution and recovery. In addition, the sampling methods, assaying procedures, compositing methods, data handling, cutoff grade and Net Smelter Return (NSR) applications and grade calculations were reviewed.
Technical report on Mineral Resource and Mineral Reserve Estimates at CBI has
been prepared as per CIM (Canadian Institute of Mining, Metallurgy and Petroleum) recommendations and as per Inmet standards. The CIM Definition Standards on Mineral Resources and Reserves establish definitions and guidelines for the reporting of exploration information, mineral resources and mineral reserves in Canada. The Mineral Resource and Mineral Reserve definitions were incorporated, by reference, in National Instrument 43-101 – Standards of Disclosure for Mineral projects (NI 43-101) (Appendix A) (Postle, Haystead, Clow, Hora, Vallee, and Jensen, 2000), which became effective February 1, 2001.
The deposit at CBI is characterized as a volcanogenic massive sulphide that exhibits similarities to the Kuroko deposits of Japan (Ohmoto and Skinner, 1983). It is currently in operation, producing 0.8M tonnes of ore from underground mining activities. The flotation concentrator plant on site produces copper and zinc concentrates which are sold to numerous customers throughout the world. The mining method is transverse/longitudinal sublevel retreat with paste and waste filling. Drift and fill method with 5 m horizontal slicing is also used for remnant areas. CBI, a wholly owned subsidiary of Inmet, has the surface rights to operate on the immediate mine property.
1.2 Mineral Resource and Mineral Reserve Estimates
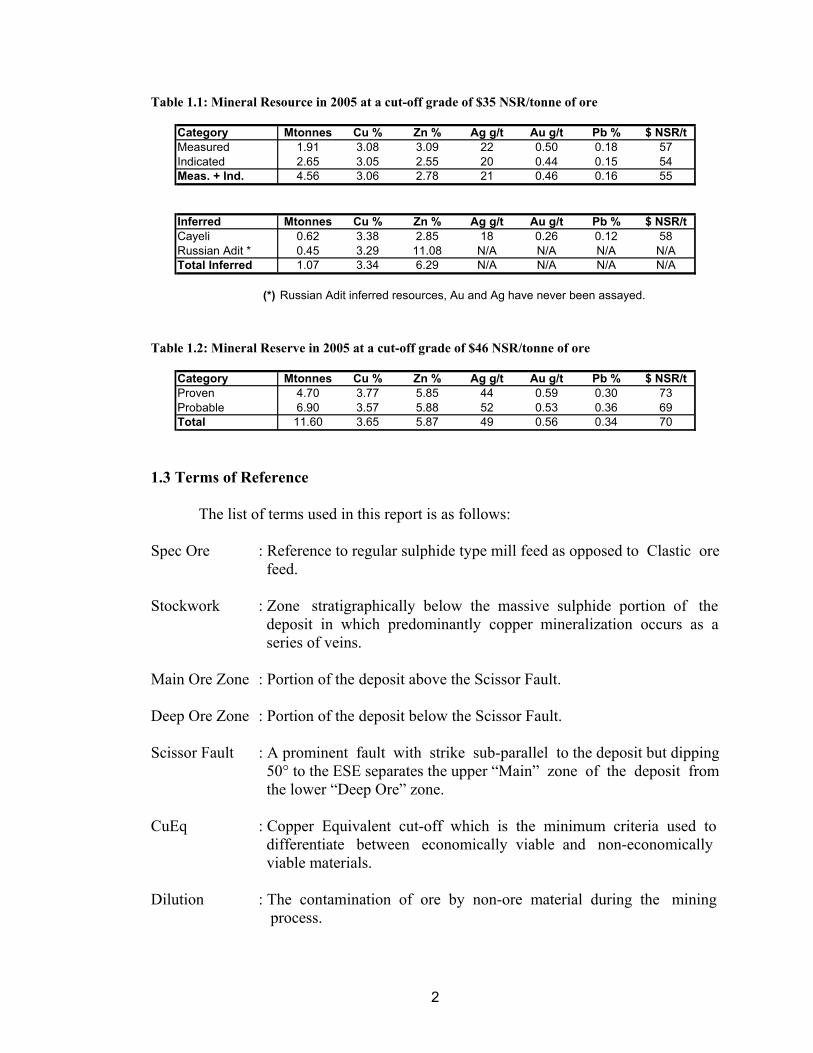
The Mineral Resource and Mineral Reserve estimates by December 31, 2005 for the Cayeli Mine, according to NI43-101 standards, are summarized in the Table 1.1 and Table 1.2 (Anonymous, 2005a).
2
Table 1.1: Mineral Resource in 2005 at a cut-off grade of $35 NSR/tonne of ore
Category Mtonnes Cu % Zn % Ag g/t Au g/t Pb % $ NSR/tMeasured 1.91 3.08 3.09 22 0.50 0.18 57Indicated 2.65 3.05 2.55 20 0.44 0.15 54Meas. + Ind. 4.56 3.06 2.78 21 0.46 0.16 55
Inferred Mtonnes Cu % Zn % Ag g/t Au g/t Pb % $ NSR/tCayeli 0.62 3.38 2.85 18 0.26 0.12 58Russian Adit * 0.45 3.29 11.08 N/A N/A N/A N/ATotal Inferred 1.07 3.34 6.29 N/A N/A N/A N/A
(*) Russian Adit inferred resources, Au and Ag have never been assayed. Table 1.2: Mineral Reserve in 2005 at a cut-off grade of $46 NSR/tonne of ore
Category Mtonnes Cu % Zn % Ag g/t Au g/t Pb % $ NSR/tProven 4.70 3.77 5.85 44 0.59 0.30 73Probable 6.90 3.57 5.88 52 0.53 0.36 69Total 11.60 3.65 5.87 49 0.56 0.34 70
1.3 Terms of Reference
The list of terms used in this report is as follows: Spec Ore : Reference to regular sulphide type mill feed as opposed to Clastic ore feed. Stockwork : Zone stratigraphically below the massive sulphide portion of the deposit in which predominantly copper mineralization occurs as a series of veins. Main Ore Zone : Portion of the deposit above the Scissor Fault. Deep Ore Zone : Portion of the deposit below the Scissor Fault. Scissor Fault : A prominent fault with strike sub-parallel to the deposit but dipping 50° to the ESE separates the upper “Main” zone of the deposit from the lower “Deep Ore” zone. CuEq : Copper Equivalent cut-off which is the minimum criteria used to differentiate between economically viable and non-economically viable materials. Dilution : The contamination of ore by non-ore material during the mining
process.
3
Recovery : The allowance for the physical risks that occur in a stope during extraction phase of the production cycle.
1.4 Objective of the Thesis
The objective of this study is to find out the contribution of mine design systems in 3-D software and to optimize the calculation of dilution and recovery factors used in mineral reserve calculations. Since the calculations are based on the actual stope CMS surveys under 3-D software (MineSight) support, the results gathered for dilution and recovery serve us better estimations in mineral reserve and long term planning studies. This study gives an approach for calculation of dilution/recovery factors for mineral reserve estimations. 1.5 Procedure
Dilution and recovery factors used in mineral reserve estimations were based on some assumptions in old system and there was no correct measurement of the factors. A new approach developed in the new system that all open stope (mined- out) outlines has been surveyed by Cavity Monitoring System (CMS) and dilution and recovery calculations derived from the measurements. In the new system, correct volume of the mined out stopes, ore loss and diluted waste amounts are calculated by using 3-D software (MineSight) and CMS data.
4
CHAPTER 2
PROPERTY INFORMATION
2.1 Property Location
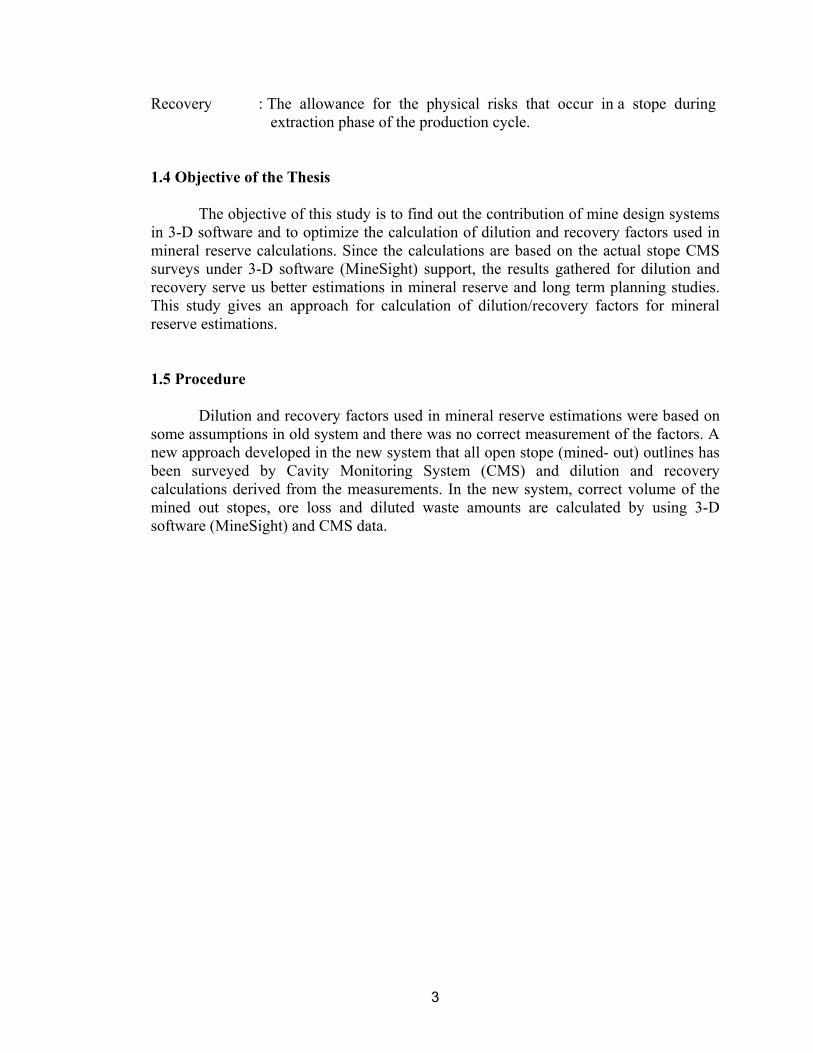
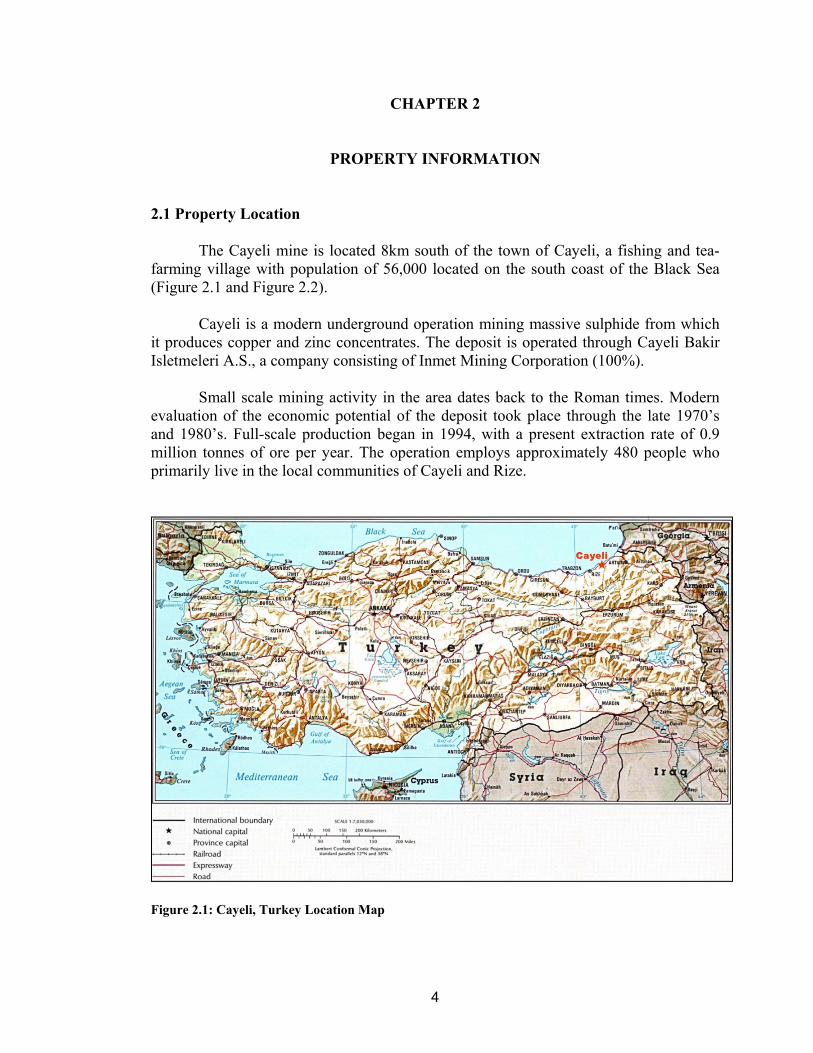
The Cayeli mine is located 8km south of the town of Cayeli, a fishing and tea-farming village with population of 56,000 located on the south coast of the Black Sea (Figure 2.1 and Figure 2.2).
Cayeli is a modern underground operation mining massive sulphide from which
it produces copper and zinc concentrates. The deposit is operated through Cayeli Bakir Isletmeleri A.S., a company consisting of Inmet Mining Corporation (100%).
Small scale mining activity in the area dates back to the Roman times. Modern
evaluation of the economic potential of the deposit took place through the late 1970’s and 1980’s. Full-scale production began in 1994, with a present extraction rate of 0.9 million tonnes of ore per year. The operation employs approximately 480 people who primarily live in the local communities of Cayeli and Rize.
Figure 2.1: Cayeli, Turkey Location Map
5
Figure 2.2: Cayeli, Mine Location Map
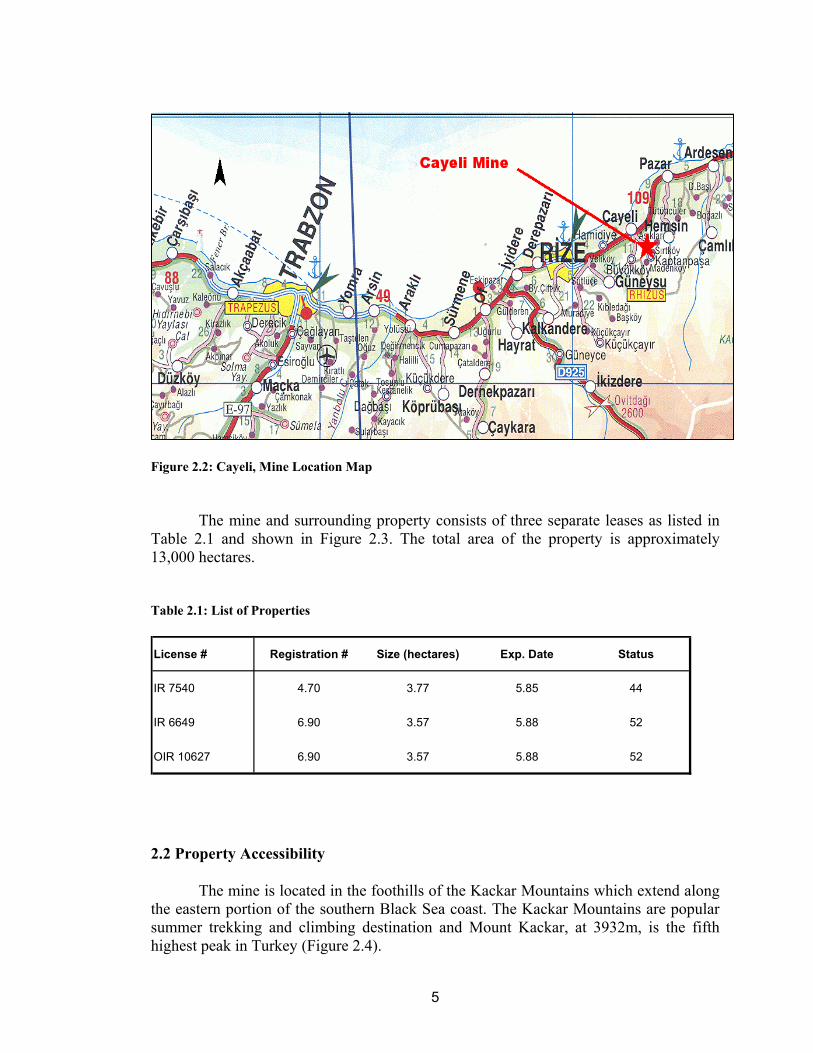
The mine and surrounding property consists of three separate leases as listed in Table 2.1 and shown in Figure 2.3. The total area of the property is approximately 13,000 hectares.
Table 2.1: List of Properties License # Registration # Size (hectares) Exp. Date Status
IR 7540 4.70 3.77 5.85 44
IR 6649 6.90 3.57 5.88 52
OIR 10627 6.90 3.57 5.88 52
2.2 Property Accessibility
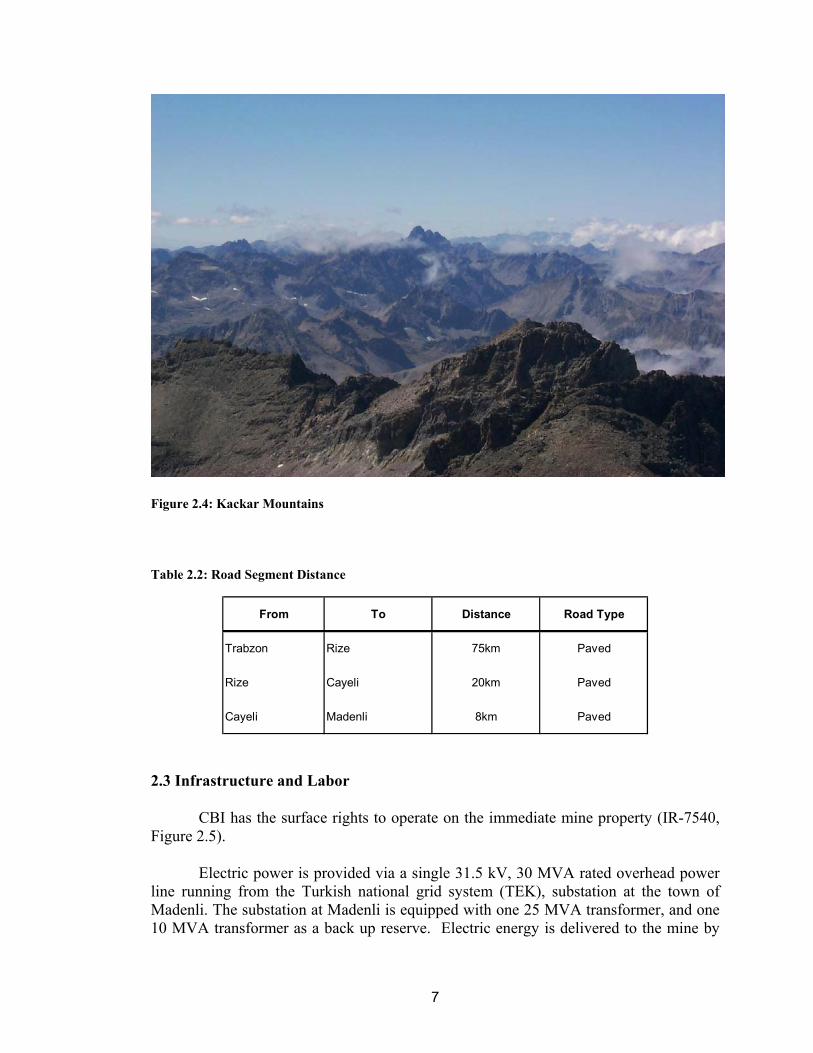
The mine is located in the foothills of the Kackar Mountains which extend along the eastern portion of the southern Black Sea coast. The Kackar Mountains are popular summer trekking and climbing destination and Mount Kackar, at 3932m, is the fifth highest peak in Turkey (Figure 2.4).
6
Figure 2.3: Property Boundary Map
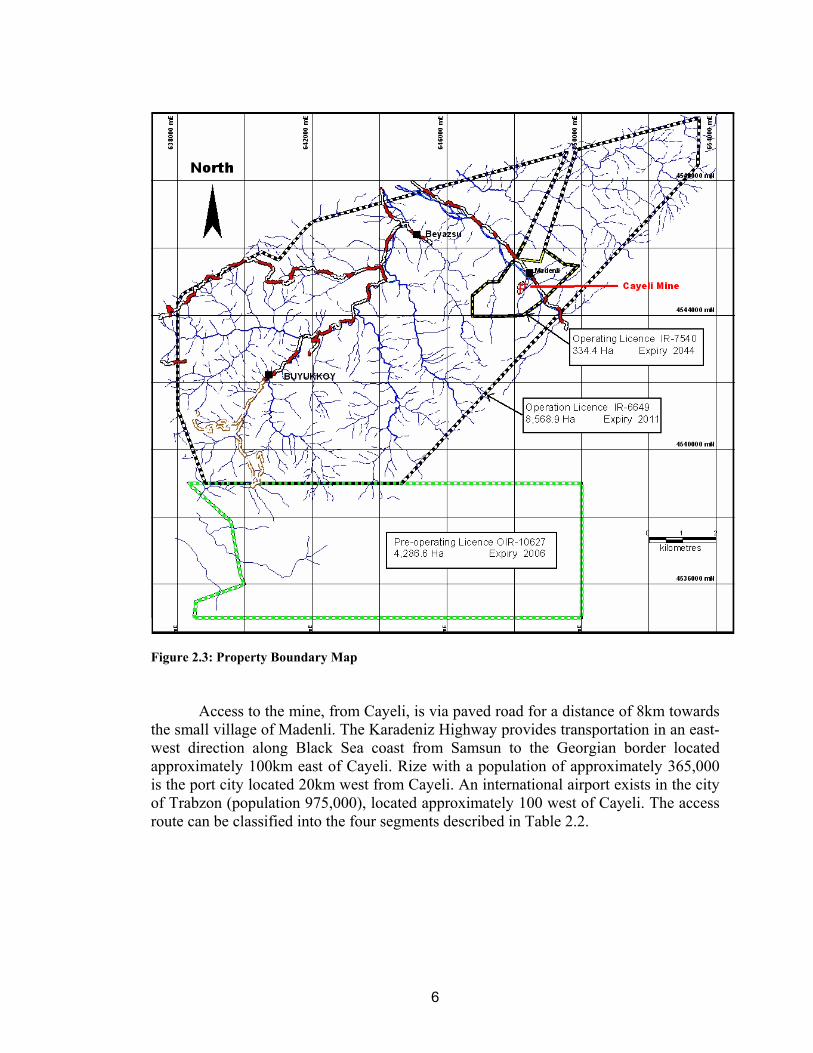
Access to the mine, from Cayeli, is via paved road for a distance of 8km towards the small village of Madenli. The Karadeniz Highway provides transportation in an east-west direction along Black Sea coast from Samsun to the Georgian border located approximately 100km east of Cayeli. Rize with a population of approximately 365,000 is the port city located 20km west from Cayeli. An international airport exists in the city of Trabzon (population 975,000), located approximately 100 west of Cayeli. The access route can be classified into the four segments described in Table 2.2.
7
Figure 2.4: Kackar Mountains
Table 2.2: Road Segment Distance
From To Distance Road Type
Trabzon Rize 75km Paved
Rize Cayeli 20km Paved
Cayeli Madenli 8km Paved
2.3 Infrastructure and Labor
CBI has the surface rights to operate on the immediate mine property (IR-7540, Figure 2.5).
Electric power is provided via a single 31.5 kV, 30 MVA rated overhead power line running from the Turkish national grid system (TEK), substation at the town of Madenli. The substation at Madenli is equipped with one 25 MVA transformer, and one 10 MVA transformer as a back up reserve. Electric energy is delivered to the mine by
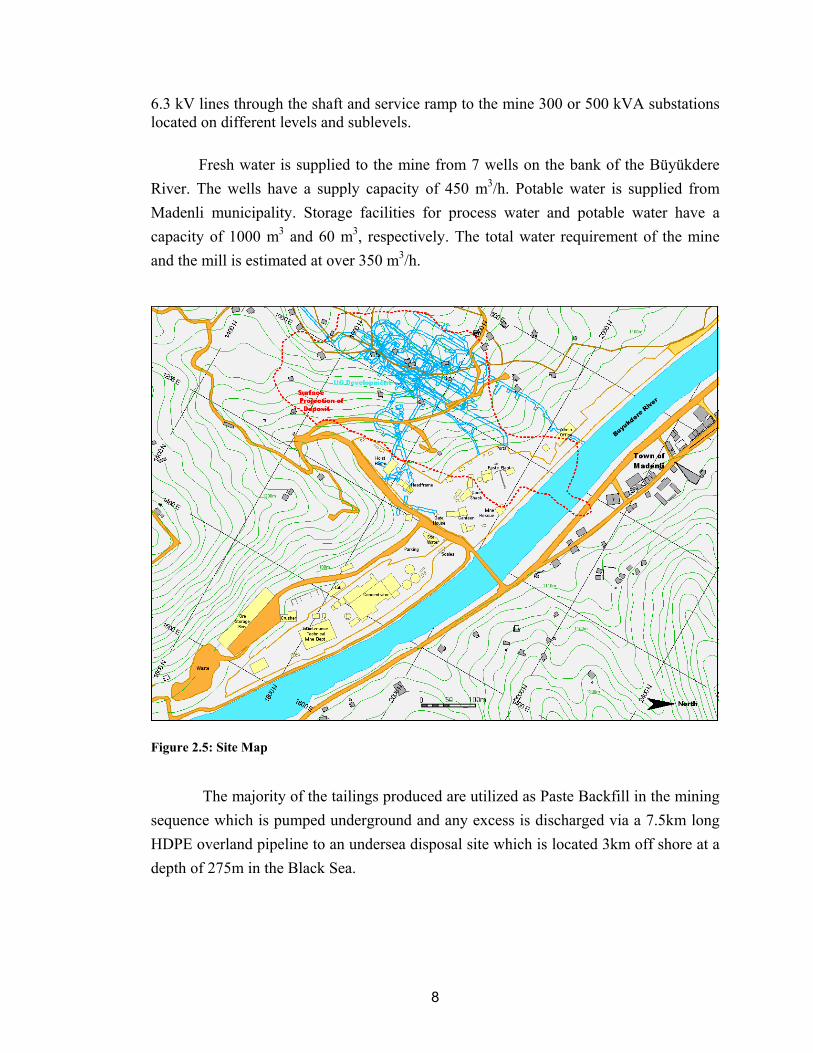
8
6.3 kV lines through the shaft and service ramp to the mine 300 or 500 kVA substations located on different levels and sublevels.
Fresh water is supplied to the mine from 7 wells on the bank of the Büyükdere River. The wells have a supply capacity of 450 m3/h. Potable water is supplied from Madenli municipality. Storage facilities for process water and potable water have a capacity of 1000 m3 and 60 m3, respectively. The total water requirement of the mine and the mill is estimated at over 350 m3/h.
Figure 2.5: Site Map
The majority of the tailings produced are utilized as Paste Backfill in the mining sequence which is pumped underground and any excess is discharged via a 7.5km long HDPE overland pipeline to an undersea disposal site which is located 3km off shore at a depth of 275m in the Black Sea.
9
The mine locally employs approximately 480 people in its operations, the large majority of whom were hired locally (Table 2.3). Other skilled and professional workers have migrated from other parts of the country. Only 1.5% of the workforce is expatriates. 24 hours work achieved at mill, workshops, paste plant and underground operation as 3 shifts per day (7.5 hrs per shift). Administrative and support staff work a nine-hour day, five days a week. Table 2.3: Labor
Category Number
Executive 2
Human Resources 3
Ankara Office 10
Finance 32
Security 15
Mill 51
Mine 200
Maintenance 90
Technical 52
Safety, Health and Environment 7
Administration 18
TOTAL 480
2.4 History
Mining activities along the Black Sea coast and at Cayeli date back at least a thousand years. At the turn of this century minor exploration by the Russians was reported and, between 1930 and 1955, various shafts and adits were driven and some minor production took place.
The work which led to the present mine was started in 1967 by the Turkish Mineral Research and Exploration Institute (MTA). MTA carried out a geophysical survey and drilling programme, and drove an adit into massive sulphide ore located just south of the current deposit.
In 1981, CBI was formed as a company with Etibank (now Eti Holding A.S.), Phelps Dodge and Gama Endustri AŞ as shareholders to develop the ore body. Phelps Dodge sold its 45% share to Metall Mining (now Inmet Mining) in 1988. Further underground work and metallurgical testing was done in the period 1988 to 1991. After positive results, a production decision was made and site construction started in 1992.
10
Basic mine infrastructure commenced in 1993 and in August 1994, the first concentrate was produced. The total capital cost of the operation was approximately $200M.
In 2002, Inmet’s share in ÇBİ increased to 55% after acquisition of Gama’s 6% share. Acquisition of Cerattepe and Rize Property from Teck Cominco was done in 2003.
In 2004, Inmet purchased Eti Holding A.S.’s 45%, and owned (100%) of the total share.
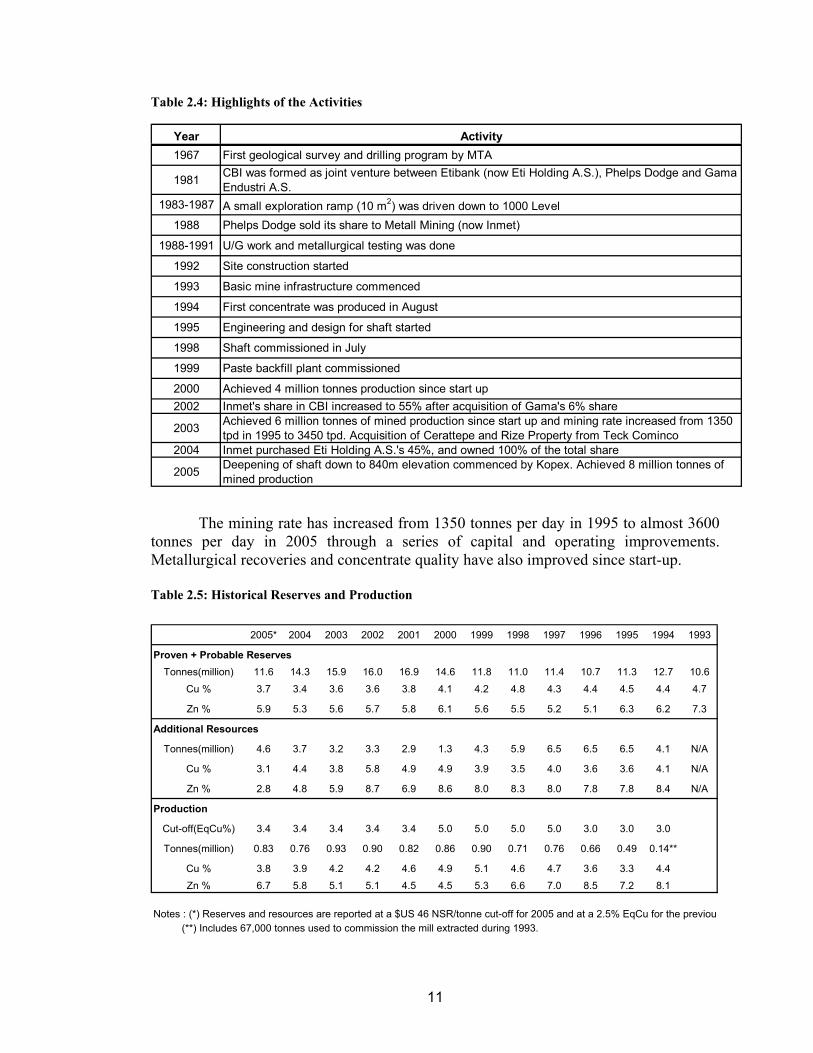
In 2005, the project of deepening shaft to 540m elevation was commenced by Kopex, Polish company. This project will be completed by the end of the 1st quarter in 2007. In Table 2.4, the highlights of the activities are summarized (Yumlu, 2001).
The historical reserve and production figures are listed for comparison purposes in Table 2.5. The classification parameters for Proven + Probable reserves (as listed in this table) are considered to be consistent with National Instrument 43-101 (see Appendix A for the Definitions and Guidelines of CIM Standards on Mineral Resources and Reserves) (Postle, Haystead, Clow, Hora, Vallee, and Jensen, 2000).
Since the beginning of the operation, the production cut-off grade has varied between 3% and 5% CuEq. The current reserve statement is at a cut-off limit of 2.5% CuEq and appropriate adjustments have been made to account for reserves sterilized by mining at a higher cut-off limit.
11
Table 2.4: Highlights of the Activities
Year Activity1967 First geological survey and drilling program by MTA
1981 CBI was formed as joint venture between Etibank (now Eti Holding A.S.), Phelps Dodge and Gama Endustri A.S.
1983-1987 A small exploration ramp (10 m2) was driven down to 1000 Level1988 Phelps Dodge sold its share to Metall Mining (now Inmet)
1988-1991 U/G work and metallurgical testing was done
1992 Site construction started
1993 Basic mine infrastructure commenced
1994 First concentrate was produced in August
1995 Engineering and design for shaft started
1998 Shaft commissioned in July
1999 Paste backfill plant commissioned
2000 Achieved 4 million tonnes production since start up2002 Inmet's share in CBI increased to 55% after acquisition of Gama's 6% share
2003 Achieved 6 million tonnes of mined production since start up and mining rate increased from 1350 tpd in 1995 to 3450 tpd. Acquisition of Cerattepe and Rize Property from Teck Cominco
2004 Inmet purchased Eti Holding A.S.'s 45%, and owned 100% of the total share
2005 Deepening of shaft down to 840m elevation commenced by Kopex. Achieved 8 million tonnes of mined production
The mining rate has increased from 1350 tonnes per day in 1995 to almost 3600 tonnes per day in 2005 through a series of capital and operating improvements. Metallurgical recoveries and concentrate quality have also improved since start-up. Table 2.5: Historical Reserves and Production
2005* 2004 2003 2002 2001 2000 1999 1998 1997 1996 1995 1994 1993
Proven + Probable ReservesTonnes(million) 11.6 14.3 15.9 16.0 16.9 14.6 11.8 11.0 11.4 10.7 11.3 12.7 10.6
Cu % 3.7 3.4 3.6 3.6 3.8 4.1 4.2 4.8 4.3 4.4 4.5 4.4 4.7
Zn % 5.9 5.3 5.6 5.7 5.8 6.1 5.6 5.5 5.2 5.1 6.3 6.2 7.3
Additional Resources
Tonnes(million) 4.6 3.7 3.2 3.3 2.9 1.3 4.3 5.9 6.5 6.5 6.5 4.1 N/A
Cu % 3.1 4.4 3.8 5.8 4.9 4.9 3.9 3.5 4.0 3.6 3.6 4.1 N/A
Zn % 2.8 4.8 5.9 8.7 6.9 8.6 8.0 8.3 8.0 7.8 7.8 8.4 N/A
Production
Cut-off(EqCu%) 3.4 3.4 3.4 3.4 3.4 5.0 5.0 5.0 5.0 3.0 3.0 3.0
Tonnes(million) 0.83 0.76 0.93 0.90 0.82 0.86 0.90 0.71 0.76 0.66 0.49 0.14**
Cu % 3.8 3.9 4.2 4.2 4.6 4.9 5.1 4.6 4.7 3.6 3.3 4.4
Zn % 6.7 5.8 5.1 5.1 4.5 4.5 5.3 6.6 7.0 8.5 7.2 8.1
Notes : (*) Reserves and resources are reported at a $US 46 NSR/tonne cut-off for 2005 and at a 2.5% EqCu for the previous(**) Includes 67,000 tonnes used to commission the mill extracted during 1993.
12
CHAPTER 3
GEOLOGICAL SETTING
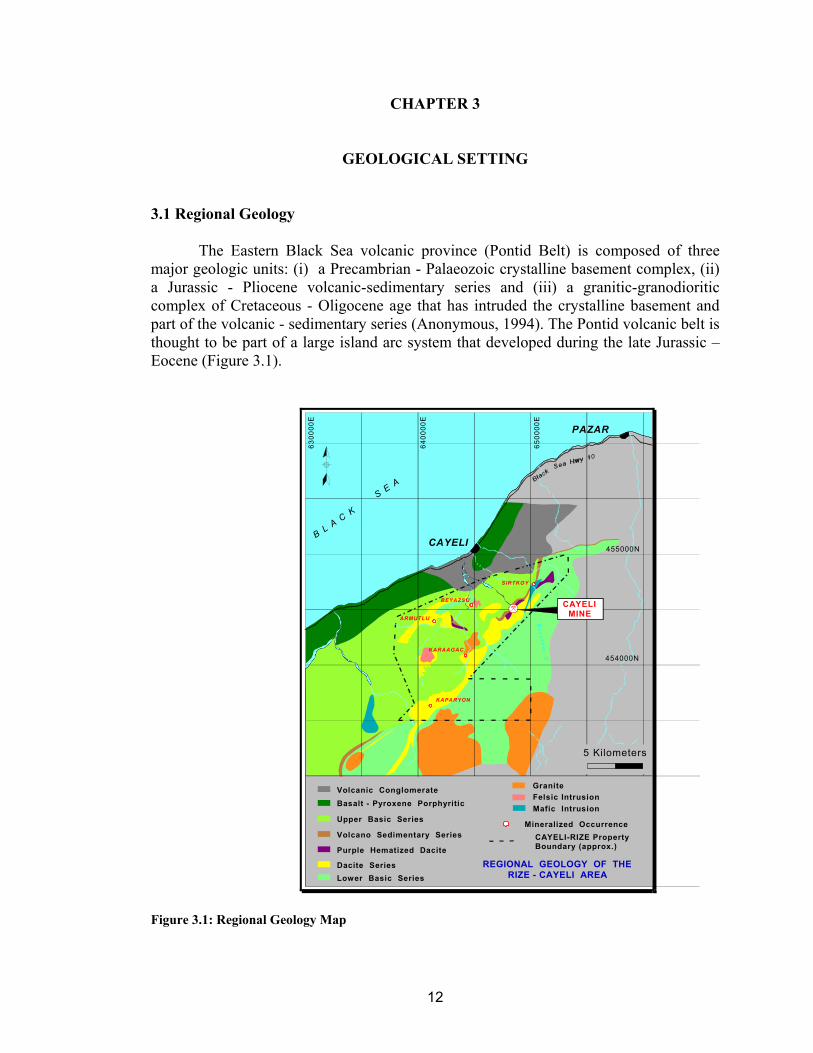
3.1 Regional Geology
The Eastern Black Sea volcanic province (Pontid Belt) is composed of three major geologic units: (i) a Precambrian - Palaeozoic crystalline basement complex, (ii) a Jurassic - Pliocene volcanic-sedimentary series and (iii) a granitic-granodioritic complex of Cretaceous - Oligocene age that has intruded the crystalline basement and part of the volcanic - sedimentary series (Anonymous, 1994). The Pontid volcanic belt is thought to be part of a large island arc system that developed during the late Jurassic – Eocene (Figure 3.1).
5 Kilometers
PAZAR
CAYELIMINE
SIRTKOY
BEYAZSU
KARAAGAC
KAPARYON
454000N
455000N
6300
00E
6400
00E
6500
00E
B L A C K
S E A
Bu
yu
kc
ay
D.
REGIONAL GEOLOGY OF THERIZE - CAYELI AREA
Mineralized OccurrenceCAYELI-RIZE PropertyBoundary (approx.)
CAYELI
ARMUTLU
Volcanic Conglomerate GraniteFelsic IntrusionMafic IntrusionBasalt - Pyroxene Porphyritic
Upper Basic Series
Volcano Sedimentary Series
Purple Hematized Dacite
Dacite SeriesLower Basic Series
Figure 3.1: Regional Geology Map
13
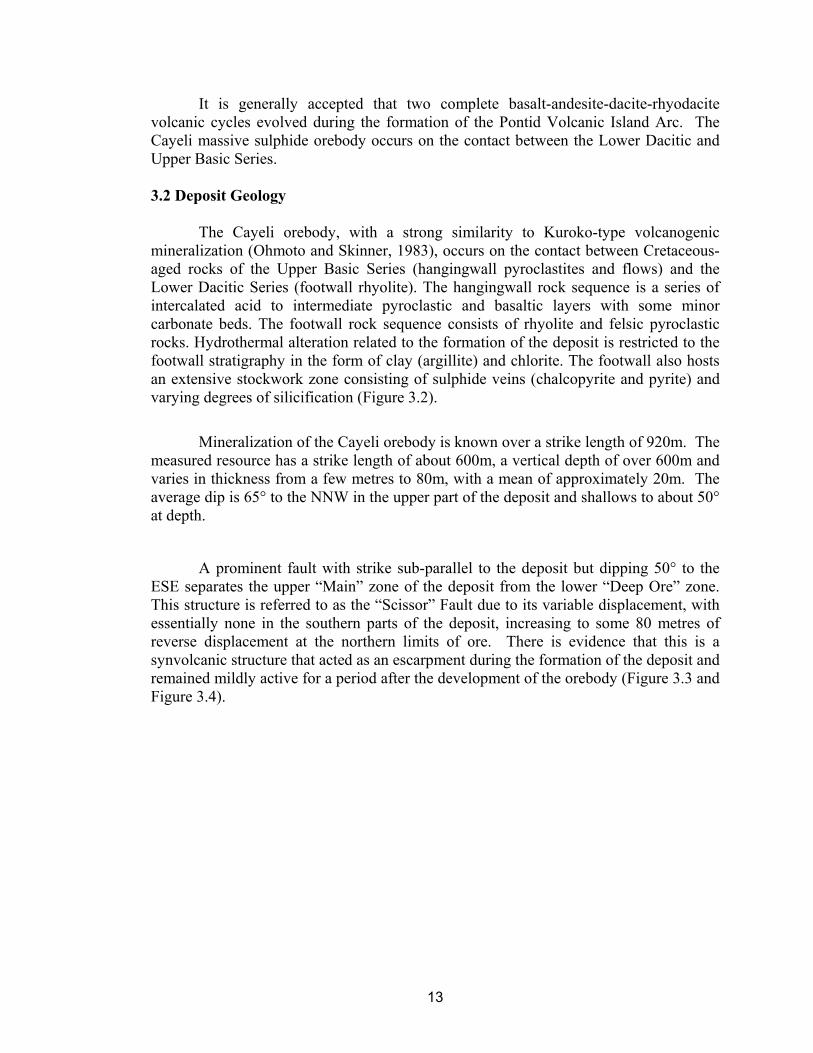
It is generally accepted that two complete basalt-andesite-dacite-rhyodacite volcanic cycles evolved during the formation of the Pontid Volcanic Island Arc. The Cayeli massive sulphide orebody occurs on the contact between the Lower Dacitic and Upper Basic Series. 3.2 Deposit Geology
The Cayeli orebody, with a strong similarity to Kuroko-type volcanogenic mineralization (Ohmoto and Skinner, 1983), occurs on the contact between Cretaceous-aged rocks of the Upper Basic Series (hangingwall pyroclastites and flows) and the Lower Dacitic Series (footwall rhyolite). The hangingwall rock sequence is a series of intercalated acid to intermediate pyroclastic and basaltic layers with some minor carbonate beds. The footwall rock sequence consists of rhyolite and felsic pyroclastic rocks. Hydrothermal alteration related to the formation of the deposit is restricted to the footwall stratigraphy in the form of clay (argillite) and chlorite. The footwall also hosts an extensive stockwork zone consisting of sulphide veins (chalcopyrite and pyrite) and varying degrees of silicification (Figure 3.2).
Mineralization of the Cayeli orebody is known over a strike length of 920m. The measured resource has a strike length of about 600m, a vertical depth of over 600m and varies in thickness from a few metres to 80m, with a mean of approximately 20m. The average dip is 65° to the NNW in the upper part of the deposit and shallows to about 50° at depth.
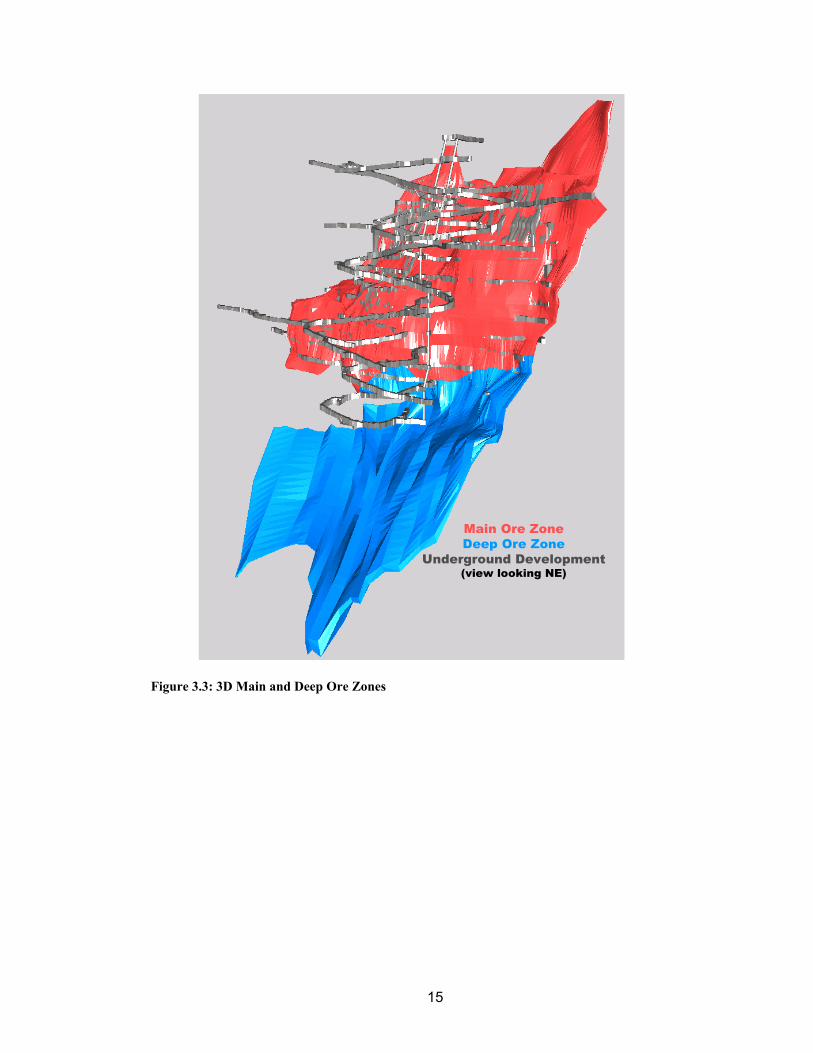
A prominent fault with strike sub-parallel to the deposit but dipping 50° to the ESE separates the upper “Main” zone of the deposit from the lower “Deep Ore” zone. This structure is referred to as the “Scissor” Fault due to its variable displacement, with essentially none in the southern parts of the deposit, increasing to some 80 metres of reverse displacement at the northern limits of ore. There is evidence that this is a synvolcanic structure that acted as an escarpment during the formation of the deposit and remained mildly active for a period after the development of the orebody (Figure 3.3 and Figure 3.4).
14
Figure 3.2: Deposit Geology Map
15
Main Ore ZoneDeep Ore Zone
Underground Development(view looking NE)
Figure 3.3: 3D Main and Deep Ore Zones

16
Main Zone
Deep Zone
Scissor Fault
Section 1740N
Clastic OreMassive Sulphides(Yellow + Black Ore)Stockwork Zone
Figure 3.4: Geology Cross-Section (looking north) 3.3 Mineralization
The sulphide composition and grade distribution can be highly variable throughout the deposit indicating an active depositional environment with multiple sources (vent points) for hydrothermal activity. Massive sulphides, with little to no original primary textures, form the majority of the ore in the deposit. This is comprised of varying amounts of pyrite, chalcopyrite and sphalerite with minor dolomite and
17
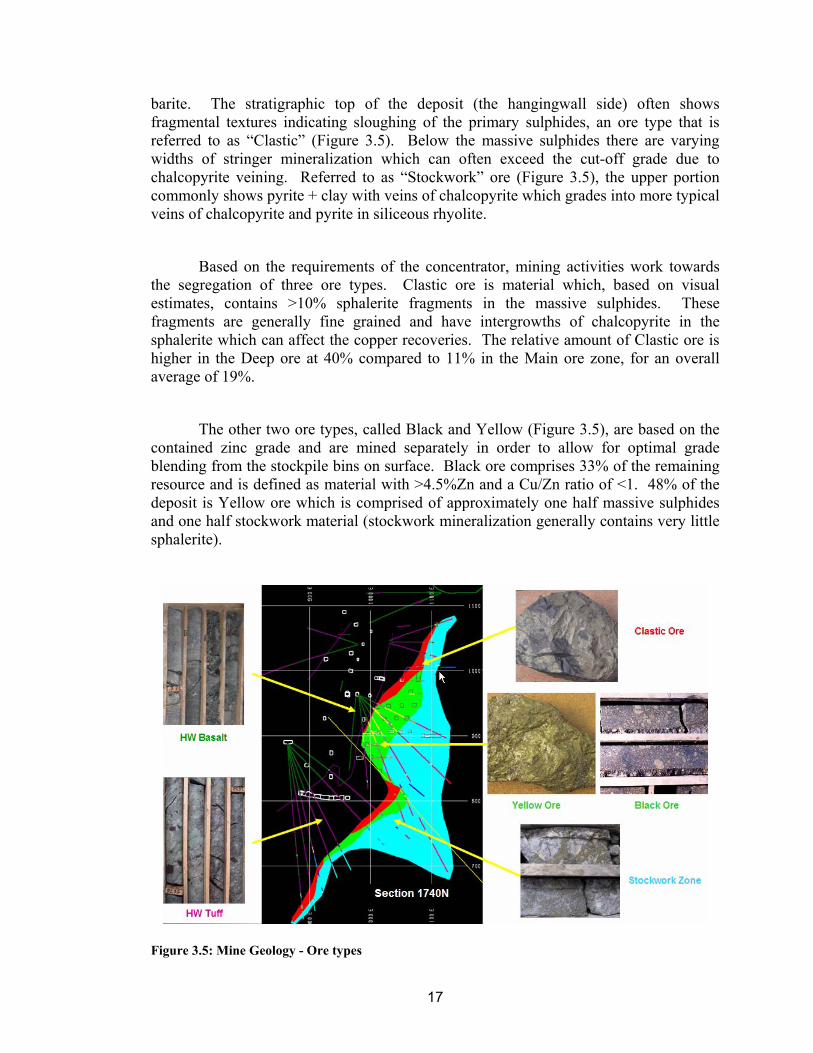
barite. The stratigraphic top of the deposit (the hangingwall side) often shows fragmental textures indicating sloughing of the primary sulphides, an ore type that is referred to as “Clastic” (Figure 3.5). Below the massive sulphides there are varying widths of stringer mineralization which can often exceed the cut-off grade due to chalcopyrite veining. Referred to as “Stockwork” ore (Figure 3.5), the upper portion commonly shows pyrite + clay with veins of chalcopyrite which grades into more typical veins of chalcopyrite and pyrite in siliceous rhyolite.
Based on the requirements of the concentrator, mining activities work towards the segregation of three ore types. Clastic ore is material which, based on visual estimates, contains >10% sphalerite fragments in the massive sulphides. These fragments are generally fine grained and have intergrowths of chalcopyrite in the sphalerite which can affect the copper recoveries. The relative amount of Clastic ore is higher in the Deep ore at 40% compared to 11% in the Main ore zone, for an overall average of 19%.
The other two ore types, called Black and Yellow (Figure 3.5), are based on the contained zinc grade and are mined separately in order to allow for optimal grade blending from the stockpile bins on surface. Black ore comprises 33% of the remaining resource and is defined as material with >4.5%Zn and a Cu/Zn ratio of <1. 48% of the deposit is Yellow ore which is comprised of approximately one half massive sulphides and one half stockwork material (stockwork mineralization generally contains very little sphalerite).
Figure 3.5: Mine Geology - Ore types
18
CHAPTER 4
MINING OPERATIONS AT CAYELI MINE
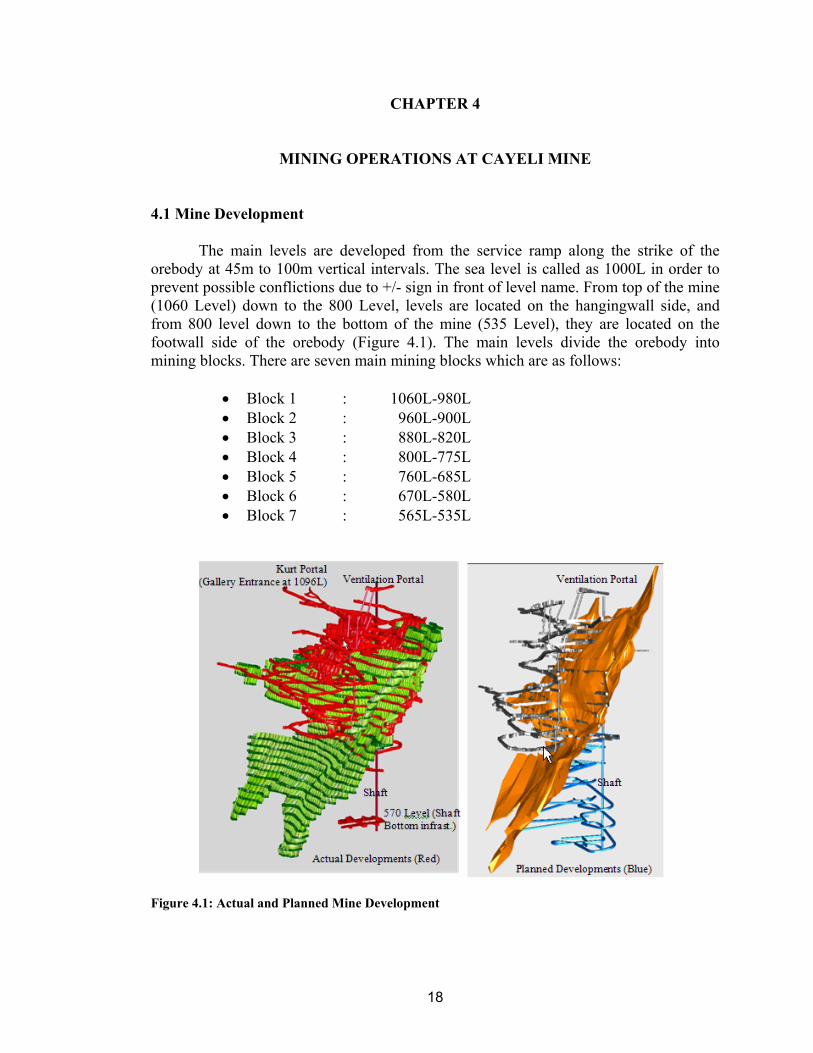
4.1 Mine Development
The main levels are developed from the service ramp along the strike of the orebody at 45m to 100m vertical intervals. The sea level is called as 1000L in order to prevent possible conflictions due to +/- sign in front of level name. From top of the mine (1060 Level) down to the 800 Level, levels are located on the hangingwall side, and from 800 level down to the bottom of the mine (535 Level), they are located on the footwall side of the orebody (Figure 4.1). The main levels divide the orebody into mining blocks. There are seven main mining blocks which are as follows:
• Block 1 : 1060L-980L • Block 2 : 960L-900L • Block 3 : 880L-820L • Block 4 : 800L-775L • Block 5 : 760L-685L • Block 6 : 670L-580L • Block 7 : 565L-535L
Figure 4.1: Actual and Planned Mine Development
19
Sublevels are developed inside the orebody along the contact with the hangingwall or in the centre of the orebody in the upper parts of the mine. In the lower parts of the mine, sublevels are developed along the gradational contact with the footwall. The sublevels are part of the stopes. Stopes are grouped as primary, secondary and tertiary. The ore within sublevel drift configurations is recovered after the primary and secondary stopes in a block are mined out and backfilled. Extraction of the ore from the sublevels drifts is called the tertiary stoping and is done in a retreat scenario.
The sublevel vertical distance is dictated by the stope height. In the upper parts
of the mine (above 800 Level), it is 20m, allowing development of a 15m high by 7m wide stope bench for production drilling. In the lower part of the mine (below 800 Level), the sublevels will be developed 15m apart, allowing development of a 10m high by 10m wide bench for production drilling. 4.2 Mining Method
The mining method employed at CBI is sublevel retreat transverse and
longitudinal long hole stoping with paste fill and loose or consolidated waste rock backfill application. The stopes are mined in primary, secondary, and tertiary sequencing. The primary and secondary stopes are mined as transverse and the tertiary as longitudinal stopes. The mining method has been designed for 100% extraction with complete pillar recovery while allowing no perceptible surface subsidence.
In the upper parts of the mine, stope sill drifts (both primary and secondary) are
7m wide (stope width) by 5m high and are driven on a 7m centre. In the lower parts of the mine, the sill drifts will be of the same cross section, but driven on a 10m centre (10m wide stopes). The length of the sill drifts depends on the thickness of the ore body. The sill drift length varies, and can be from 10m to 50m long. The average stope size in the upper part of the mine is 7,000 t to 8,000 t. In the lower part of the mine, the average stope size will be in a 5,000 t to 6,000 t range.
Sequencing of the mining method depending on the mining blocks is as follows:
• Retreat from the boundaries of the orebody to the 57m wide Central Pillar (Blocks 1&2, i.e. above 900 Level)
• Retreat from the 57m wide Central Pillar to the boundaries of the orebody (Block 3, i.e. 820-880 Levels)
• Retreat from centre to the boundaries at Central Part (between x/cuts) and retreat from the boundaries of the orebody to the Central Part at North and South Regions without any central pillar (Blocks 4 to 7, i.e. below 800 Level). Figure 4.3 shows a schematic mining sequence between 685-760 levels.
• Production from main levels up. • Mining front at an overall angle of ~45 degrees (Figure 4.2). • Alternating primary and secondary stopes.
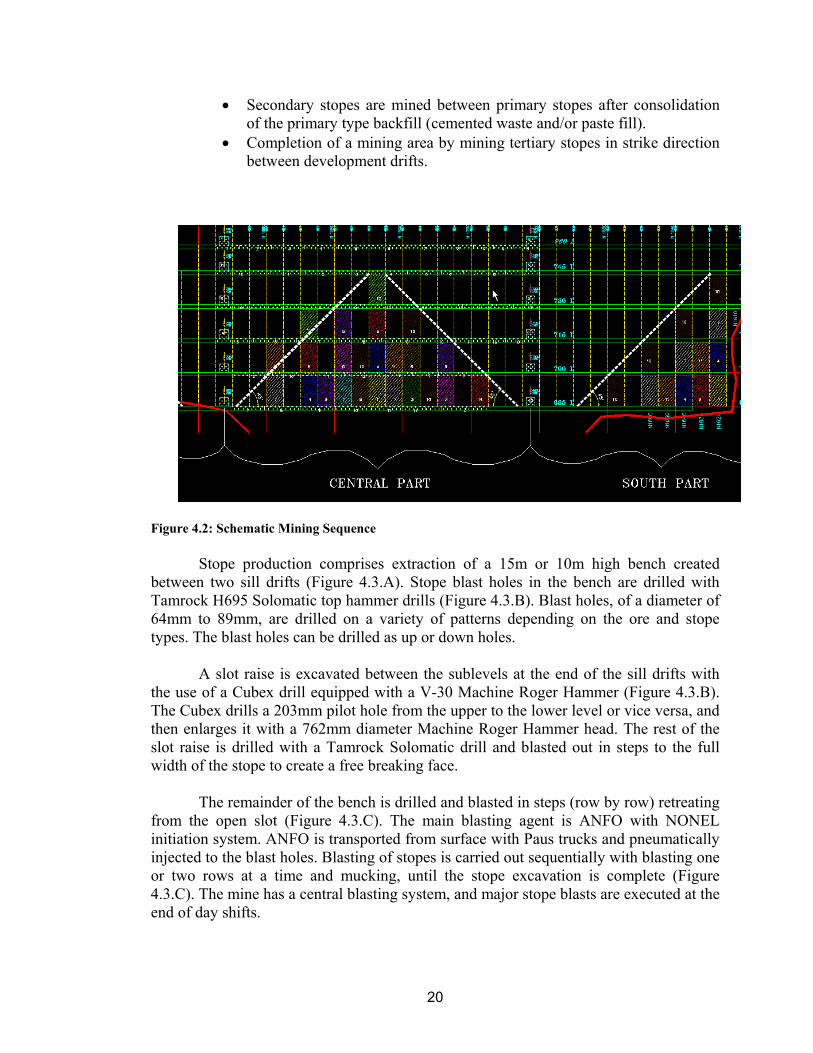
20
• Secondary stopes are mined between primary stopes after consolidation of the primary type backfill (cemented waste and/or paste fill).
• Completion of a mining area by mining tertiary stopes in strike direction between development drifts.
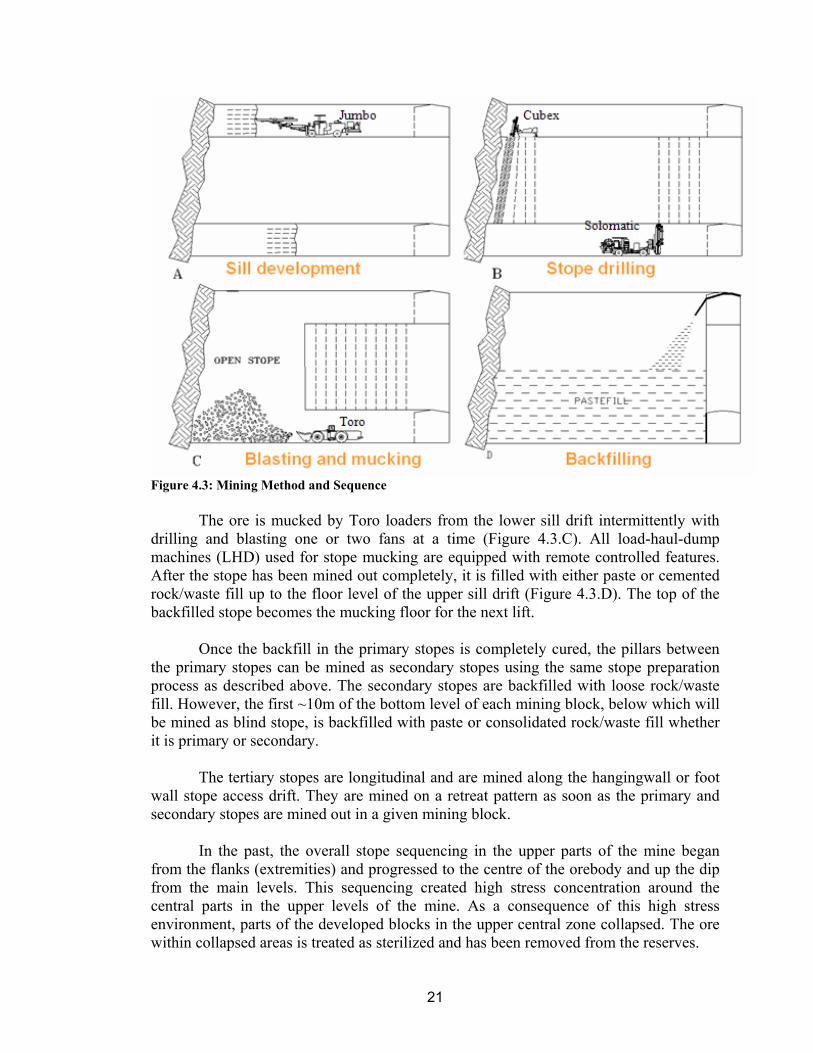
Figure 4.2: Schematic Mining Sequence Stope production comprises extraction of a 15m or 10m high bench created
between two sill drifts (Figure 4.3.A). Stope blast holes in the bench are drilled with Tamrock H695 Solomatic top hammer drills (Figure 4.3.B). Blast holes, of a diameter of 64mm to 89mm, are drilled on a variety of patterns depending on the ore and stope types. The blast holes can be drilled as up or down holes.
A slot raise is excavated between the sublevels at the end of the sill drifts with
the use of a Cubex drill equipped with a V-30 Machine Roger Hammer (Figure 4.3.B). The Cubex drills a 203mm pilot hole from the upper to the lower level or vice versa, and then enlarges it with a 762mm diameter Machine Roger Hammer head. The rest of the slot raise is drilled with a Tamrock Solomatic drill and blasted out in steps to the full width of the stope to create a free breaking face.
The remainder of the bench is drilled and blasted in steps (row by row) retreating
from the open slot (Figure 4.3.C). The main blasting agent is ANFO with NONEL initiation system. ANFO is transported from surface with Paus trucks and pneumatically injected to the blast holes. Blasting of stopes is carried out sequentially with blasting one or two rows at a time and mucking, until the stope excavation is complete (Figure 4.3.C). The mine has a central blasting system, and major stope blasts are executed at the end of day shifts.
21
Figure 4.3: Mining Method and Sequence
The ore is mucked by Toro loaders from the lower sill drift intermittently with
drilling and blasting one or two fans at a time (Figure 4.3.C). All load-haul-dump machines (LHD) used for stope mucking are equipped with remote controlled features. After the stope has been mined out completely, it is filled with either paste or cemented rock/waste fill up to the floor level of the upper sill drift (Figure 4.3.D). The top of the backfilled stope becomes the mucking floor for the next lift.
Once the backfill in the primary stopes is completely cured, the pillars between
the primary stopes can be mined as secondary stopes using the same stope preparation process as described above. The secondary stopes are backfilled with loose rock/waste fill. However, the first ~10m of the bottom level of each mining block, below which will be mined as blind stope, is backfilled with paste or consolidated rock/waste fill whether it is primary or secondary.
The tertiary stopes are longitudinal and are mined along the hangingwall or foot
wall stope access drift. They are mined on a retreat pattern as soon as the primary and secondary stopes are mined out in a given mining block.
In the past, the overall stope sequencing in the upper parts of the mine began
from the flanks (extremities) and progressed to the centre of the orebody and up the dip from the main levels. This sequencing created high stress concentration around the central parts in the upper levels of the mine. As a consequence of this high stress environment, parts of the developed blocks in the upper central zone collapsed. The ore within collapsed areas is treated as sterilized and has been removed from the reserves.
22
Below 880 Level, the mining sequence has been changed and ore extraction
starts in the centre of the block and progresses outwards to the extremities of the orebody.
The mining blocks are not separated by traditional ore sill pillars, but by a row of
primary and secondary stopes that have been mined out and filled with consolidated backfill. These primary and secondary stopes form sill pillar(s), allowing effective separation of the mining blocks. In such case, mining activities can be conducted in several blocks simultaneously without interference with each other.
The stope preparation process is based on “in-time” drifting, production drilling,
blasting, and mucking philosophy. The reason for this is that, due to the relatively poor ground conditions, the excavations often deteriorate quickly. As a consequence, they require rehabilitation, which slows down extraction and increases production costs.
4.3 Backfilling
Backfilling is an essential part of mining at CBI which allows relatively high
extraction of the deposit and at the same time maintaining stability of the mine. Particularly, the regional stability of the weak hangingwall depends on timely backfill placement.
Several types of fill are used for backfilling: cemented rock/waste fill (CRF/
CWF), cemented paste fill (PF), and uncemented waste fill (WF). The mining sequencing requires that the primary stopes to be filled with
consolidated fill (PF and/or CRF/CWF) to allow safe and maximum extraction of the secondary and tertiary stopes. The primary stopes are filled with CRF/CWF with ~5% cement content or PF with ~7-9% cement contents. The backfill cement content depends on stope requirements.
The majority of the secondary and tertiary stopes are backfilled with loose waste rock (uncemented waste rock), and occasionally these stopes require consolidated fill in order to maintain access for mining the remaining ore or creation of sills for mining underneath the remnant ores. The need for the partial use of consolidated backfill in the secondary and tertiary stopes results from the stope accesses being driven inside the ore.
Secondary stopes except for the brow portion, which will be exposed during
tertiary extraction, are filled with uncemented development waste material or paste fill having 5% cement content. The brow portions that will be exposed during tertiary extraction are filled with CRF/CWF with 5% cement content or PF with 7-9% cement in order to minimize dilution.
Tertiary and longitudinal stopes are backfilled with CRF/CWF with 5% cement
content and/or PF with 7% cement content.
23
Generally, the cement content of the CRF/CWF and PF is 5% to 7%
respectively; however the stope geometry and the prevailing mining conditions dictate the final cement content in backfill.
The uppermost sill drifts on main levels require tight backfilling against the back
to minimize spans and to improve regional stability. Application of paste fill, due to the excellent floatability of the paste mass, allows successful accomplishment of this task.
The use of waste rock as CWF for the most part facilitates disposal of waste from
development mining, eliminating the need to truck or skip the material to surface waste stockpiles. 4.4 Mine Access and Infrastructure 4.4.1 Ramp
Current access to the underground operation for mobile equipment, personnel, and materials delivery is through a 5m x 5m decline that extends at -15% to the 640 level. The ramp was initially driven on the hanging wall side of the orebody and the portal is at the 1096m level. The ramp also provides access to the top and bottom of the aggregate backfill raises and serves as an exhaust way for ventilation. The upper portion of the ramp is located on the hangingwall side of the orebody down to the 800m Level. On the 800m level, the ramp location was switched to the footwall side from where it continues down to the lowest level of the mine. The service ramp is currently being deepened and planned to be connected with the new shaft bottom at 540m level by the end of 2006.
Additional access to the mine is also provided via an exploration ramp with a
9m2 cross sectional area on a 17% gradient down to the 1000 level. This ramp is used as a return airway and accommodates paste fill delivery pipelines. 4.4.2 Shaft
A 5.5m diameter vertical concrete lined shaft, located on the footwall side of the orebody, services the mine. The shaft was recently deepened by 295m and is now 570m deep. The shaft sinking contractor (Kopex) is currently working on the ore handling system and shaft bottom infrastructure. All the works and developing the ramp up to 620L for connection to the FWR going down by CBI is expected to be completed in 1st quarter of 2007.
The shaft collar is at the 1110m level and the bottom is at the 540m level.
Current underground access to the shaft is at the 900m level. Access to the shaft on the 900m level is by an approximately 120m long cross cut. After the service ramp
24
connection with the lower part of the mine (end of 2006) is established, additional shaft access will be provided on the 800m, 570m and 540m levels. The shaft is equipped with two skips, a main cage, and a small cage for hoisting man.
The hoistroom is equipped with two winders. One winder is for hoisting two 5.67
tonne capacity skips and the second one for hoisting main cage. In addition to the skips and man cage, an auxiliary small cage is installed in the shaft for transporting man.
The rated hoisting capacity of the shaft is 260 tonnes of ore/waste per hour. The
skips discharge ore and waste into two storage bins. A 200 tonne bin is assigned to ore and a 50 tonne bin to waste. Both bins can be used to handle ore.
From the shaft, the ore is transported by two Volvo A35 trucks to the ore
stockpile shed located approximately 400m away. The shed has eight compartments each rated at a 3,500 tonne capacity.
The headframe is a sheet metal clad steel frame structure erected on a shaft
concrete collar. The headframe support legs rest on steel reinforced concrete footings. One of the leg footings recently subsided by approximately 250mm. Reportedly, this was caused by neighboring hillside movement or existence of a cavity under the footing. Remedial work consisting of erecting a rock filled buffer against the hillside did not slow the subsidence process.
Another attempt using extensive grouting under subsided footing appears to have
slowed down the subsidence process. The gap between the footing and the headframe leg was fitted with adjustable steel filler plate. A monitoring system was set up at the headframe for measuring and recording any further deformation.
As consequence of this event, the headframe is slightly bent at the top and hoist
rope sheave wheel is off the centre line. The hoisting is apparently not affected by the headframe deformation. Allowing this situation to continue for longer time might cause premature wear of the cage shoes and guides.
4.5 Material Handling 4.5.1 Ore and Waste Handling
A fleet of six and eight cubic yard LHDs and 25t trucks handles ore mucking from development headings and stopes. The LHDs work in combination with Wagner MT 400 series mine trucks due to the long haulage distances from the most of the development faces and some of the stopes to the ore passes. The LHDs are equipped with ejection buckets and remote control features. Remote stope mucking is mandatory.
Until the middle of 1998 (before commissioning of the shaft), all ore was hauled
via the service ramp directly to the ore storage bins on surface. The trucks now dump the ore at the two ore pass loading stations on the 960m, 940m and 920m levels. Haulage
25
distances on the 900m to 960m levels do not exceed 200 metres. Ore from the upper levels is hauled to the 960m level and from the lower levels to the 920m level and/or 900m level dump station.
The two ore passes each with a cross section of 10.2 m2, are located in the central
pillar of the main ore zone (section N1760) and are part of the mine ore handling system. The ore passes are steel-concrete lined. The two ore pass system allows separate handling of three different ore types. The orebody consists of three types of ore – Yellow, Black, and Clastic ore. Clastic ore currently accounts for about 30% of the total ore mined and is mucked and hauled in campaigns as a separate material.
The ore passes have 400 tonne capacity each between sublevels and must be
pulled constantly. Ore pass hang-ups rarely occur due to the excellent fragmentation of the generally friable ore.
On the 900 level, the ore is transferred by an ST 6C LHD from the ore passes to
a feeder hopper with a grizzly, which limits the block size to 300mm x 300mm. The haulage distance from the two ore passes to the feeder hopper is 25m and 50m’ respectively. Separation and handling of the different ore types is strictly observed. When the ore type changes, the feeder hopper is emptied completely before another ore type can enter the system.
Presently, one of the ore pass (Ore Pass #2) is out of order due to mining of the
ore in this region. However, the new ore pass system below 790 level has been in operation by mid of August 2006.
Waste rock is hauled from the development faces by trucks either directly to
stopes, as backfill material, or to surface for stockpiling and future use for backfilling.
4.5.2 Shotcrete Delivery The mine uses a wet shotcrete, which is prepared on surface at a batch plant
located close to the ramp portal. The batched shotcrete is transported in mixer trucks to the underground for application.
4.5.3 Aggregate Delivery
Two backfill raises for aggregate storage are located in the hangingwall. The raises are 3.1m in diameter and inclined at 85 degrees. The loading stations for both raises ate at the 1080m level. One raise discharges on the 1040m level and the second on the 1020m level. The 1020 backfill station is not used due to water leaking problem through the raise.
Presently, the new backfill station (CWF station) between 770 and 730 levels is
planned to be completed by the end of 2006.
26
4.5.4 Materials and Fuel Delivery
Consumable materials and supplies are transported from surface to underground
work places by Paus trucks.
There are two diesel fuel stations, one of them is located near the ramp portal on surface, and second one is located in underground at 800 level next to underground workshop. All underground mobile fleet, including surface fleet, refuel at these stations. A diesel fuel line is currently installed from surface fuel tank down to 800 level fuel station. This system has been increased operating availability of the mobile equipment underground. 4.5.5 Compressed Air Delivery
Four compressors located on surface provide compressed air for the mine. Each unit is powered by a 160 kW motor and delivers 380 l/sec of compressed air at 10 bars pressure. Three pipelines, 100mm to 200mm in diameter, distribute compressed air to the different parts of the mine. One line is installed in the shaft, the second in the ventilation raise, and the third in the service ramp.
4.5.6 Water Supply
Fresh water is supplied to the mine from seven wells on the bank of the Buyuk Dere River. The wells have a supply capacity of 450 m3/h. Although potable water is supplied from Madenli municipality, water for consumption (drinking) is delivered in special plastic tubs or small bottles. Storage facilities for process water and potable water have a capacity of 1000 m3 and 60 m3, respectively. The total water requirement of the mine and the mill is estimated at over 350 m3/h.
Water is supplied to the underground via three 50mm and 100mm diameter pipe
lines installed in the shaft, ventilation raise and service ramp.
4.6 Ventilation Fresh air for primary ventilation to the mine is supplied through two downcast
raises and the shaft at a combined maximum flow rate of 245 m3/s. The ventilation raises are equipped with a 220 kW fan each with a maximum capacity of 110 m3/s. The two ventilation raises are located on the hangingwall side, with a diameter of 3.6m each and inclination of 70 degrees. On surface, these raises are accessed by a horizontal drift.
Ventilation raise No.1, located at section N1730, is serving the mining area
between 900 and 980 levels. Ventilation raise No.2, located at section N1710, ends at the 1000 level and ventilates mining areas above the 1000 level only.
27
The shaft is equipped with a 30 kW fan, which provides 25 m3/s fresh air through a 900mm diameter ventilation duct to the shaft bottom.
Several raises within the orebody, with diameters between 0.8m and 3.0m, serve
as exhaust raises. Exhaust air is returned through the top levels of mining areas to the service and exploration ramps to surface.
Total ventilation requirement of the mine is calculated based on the total kW of
underground diesel equipment in use in accordance with Ontario, Canada regulations (0.06 m3/s per kW). At CBI, Cogema fans are used due to their low noise generation. The ventilation network of the mine is regularly measured. Any adjustments and ventilation calculations are performed using VNETPC, software.
4.7 Mine Drainage and Dewatering
The Cayeli mine can be considered as a dry mine. Almost half of the underground water is generated from the used process water.
The current main dewatering pump is installed adjacent to the shaft on 900 level.
The recently deepened shaft and shaft bottom development activities are handled through temporary pumping arrangements. After completion of these activities, a permanent setup will be installed at the deepest part of the mine to handle water from the lower levels.
All the mine water flows through drainage holes and ditches to the 900 level
main dirty water sump and is pumped to surface through the shaft where dewatering pipeline installed. The main dewatering pump used is a 132 kW Geho pump, model ZPM 700. The pump can handle 65 m3/h of dirty water at a maximum operating pressure of 53 bars.
Furthermore, a standby pumping station on the 100 level pumps clear water to
surface through a pipeline installed in the exploration ramp. The total mine water pumped to surface on average is 25 m3/h. Process water
accounts for approximately 40% to 45% of the total mine water pumped to surface.
4.8 Maintenance There is a small underground maintenance shop for servicing equipment and
handling miscellaneous repairs. There is also office, lunchroom, and small warehouse located in underground maintenance shop.
Most of the major repairs are done on surface in large maintenance shop. This
shop is properly equipped to handle bigger jobs and can accommodate several pieces of
28
mobile equipment at the same time. Dry facilities and mine offices are located in the same building.
4.9 Electric Energy
The mine’s electrical main substation is connected to the national power grid by a single 31.5 kV, 30 MVA rated overhead power with the TEK substation north of the town of Madenli. The substation at Madenli is equipped with one 25 MVA transformer, and one 10 MVA back up unit.
Electric energy is delivered to the underground by 6.3 kV lines through the shaft
and service ramp to the mine 300 or 500 kVA substations located on different levels and sublevels. The feed from the substations to the electrical equipment is reduced to 380 Volt.
4.10 Ore Hoisting and Transport to Surface Stockpile
The underground skip loading arrangement consists of two conveyor belts (100m and 15m long) with a feed rate of 350 tonnes/hr. The conveyors transport the ore from the ore pass feed hopper and discharge it to a 50m3 surge bin located at the skip loading station. The two skip loading hoppers can take 5.67 tonnes each. The skips with a volume of 1.89m3 each operate at an average load of 5.35 tonnes. The rated capacity of the shaft, based on a hoisting speed of 7.7m per second, is 260 tonnes ore per hour.
At the headframe, the skipped ore is discharged into two storage bins. One of the
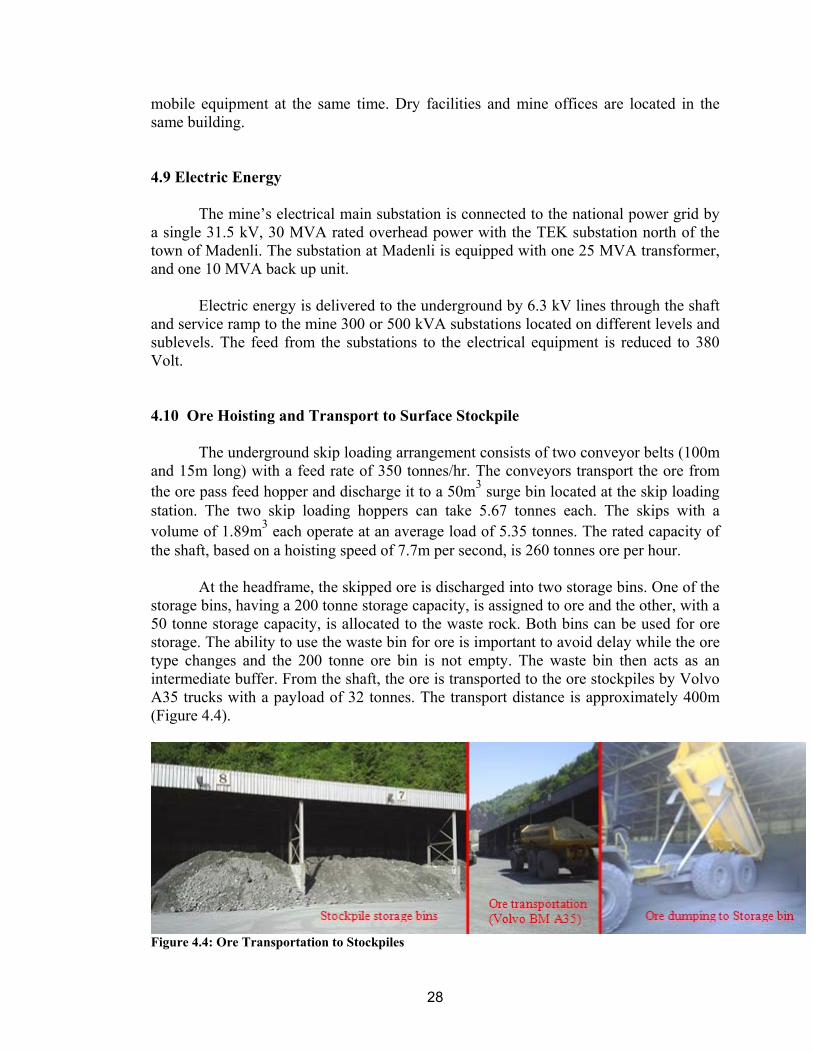
storage bins, having a 200 tonne storage capacity, is assigned to ore and the other, with a 50 tonne storage capacity, is allocated to the waste rock. Both bins can be used for ore storage. The ability to use the waste bin for ore is important to avoid delay while the ore type changes and the 200 tonne ore bin is not empty. The waste bin then acts as an intermediate buffer. From the shaft, the ore is transported to the ore stockpiles by Volvo A35 trucks with a payload of 32 tonnes. The transport distance is approximately 400m (Figure 4.4).
Figure 4.4: Ore Transportation to Stockpiles
29
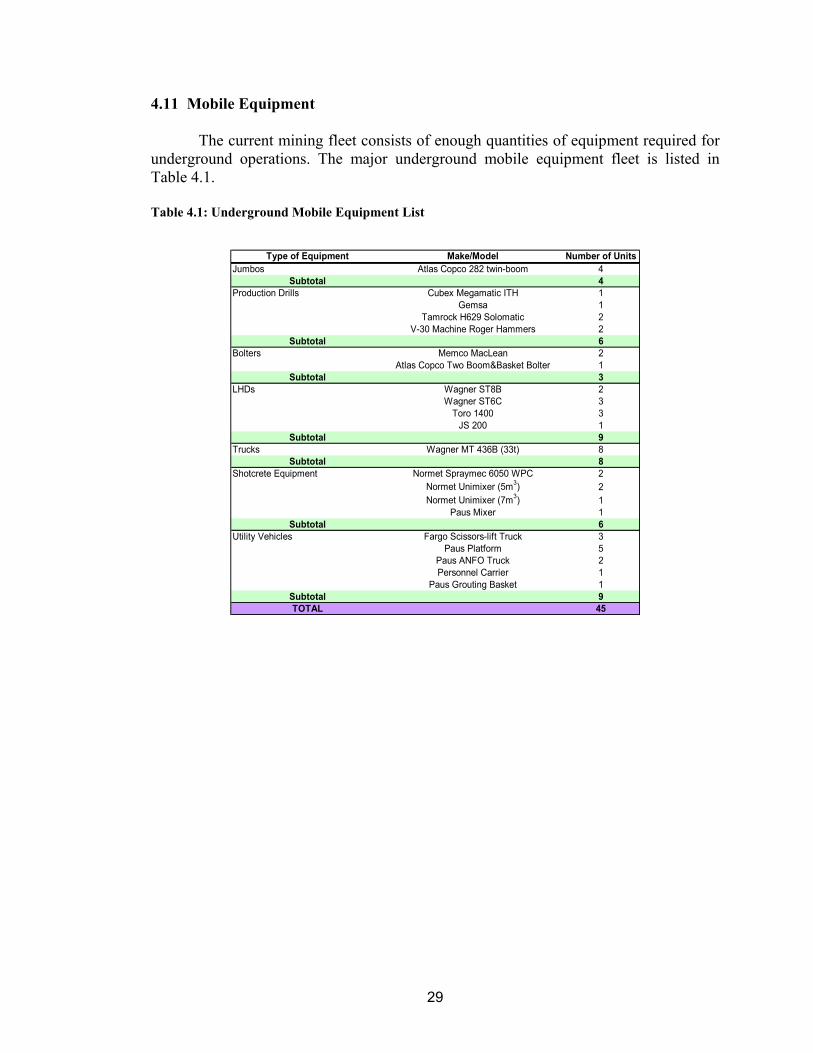
4.11 Mobile Equipment
The current mining fleet consists of enough quantities of equipment required for underground operations. The major underground mobile equipment fleet is listed in Table 4.1.
Table 4.1: Underground Mobile Equipment List
Type of Equipment Make/Model Number of UnitsJumbos Atlas Copco 282 twin-boom 4
Subtotal 4Production Drills Cubex Megamatic ITH 1
Gemsa 1Tamrock H629 Solomatic 2
V-30 Machine Roger Hammers 2Subtotal 6
Bolters Memco MacLean 2Atlas Copco Two Boom&Basket Bolter 1
Subtotal 3LHDs Wagner ST8B 2
Wagner ST6C 3Toro 1400 3
JS 200 1Subtotal 9
Trucks Wagner MT 436B (33t) 8Subtotal 8
Shotcrete Equipment Normet Spraymec 6050 WPC 2Normet Unimixer (5m3) 2Normet Unimixer (7m3) 1
Paus Mixer 1Subtotal 6
Utility Vehicles Fargo Scissors-lift Truck 3Paus Platform 5
Paus ANFO Truck 2Personnel Carrier 1
Paus Grouting Basket 1Subtotal 9TOTAL 45
30
CHAPTER 5
MINERAL RESOURCE ESTIMATES
5.1 Geological Model
The geologic model is continuously being modified as new information is gained through drilling and development. Computerized model from the database using MineSight software was used for mineral resource and reserve estimations.
There are three main geologic domains in the deposit based primarily on the style
of the mineralization. Each of these domains is further divided by the Scissor fault which separates the Main and Deep Ore zones. The domains are:
- Clastic Ore (which contacts with hangingwall tuff zone) - Spec Ore (which includes all massive sulphides excluding the Clastic Ore
portion) - Stockwork Ore (which comprised of massive pyrite and veins of chalcopyrite
in footwall zone due to the nature of the copper mineralization)
The geological interpretation of all material above and including the 775m level has been conducted on level plans. Plans prepared on 20m intervals above and including 800m level and on 15m intervals below 820m level. The information is gathered from underground geologic mapping from developments and diamond drilling/channel sampling interpretation.
Below 775m level, the geological interpretation and model of the majority of the
Deep Ore zone was conducted on a series of vertical E-W cross sections spaced at 20m intervals, and the information is gathered from diamond drilling.
Three-dimensional wireframes were developed for all domains and tested for any
gaps or overlaps. The final geological model contains the following six domains:
- Zone 1: Main Ore Zone, Clastic Ore (MOCO)
- Zone 2: Main Ore Zone, Spec Ore (MOSpec)
- Zone 3: Main Ore Zone, Stockwork Ore (MOStwk)
- Zone 4: Deep Ore Zone, Clastic Ore (DOCO)
- Zone 5: Deep Ore Zone, Spec Ore (DOSpec)
- Zone 6: Deep Ore Zone, Stockwork Ore (DOStwk)
31
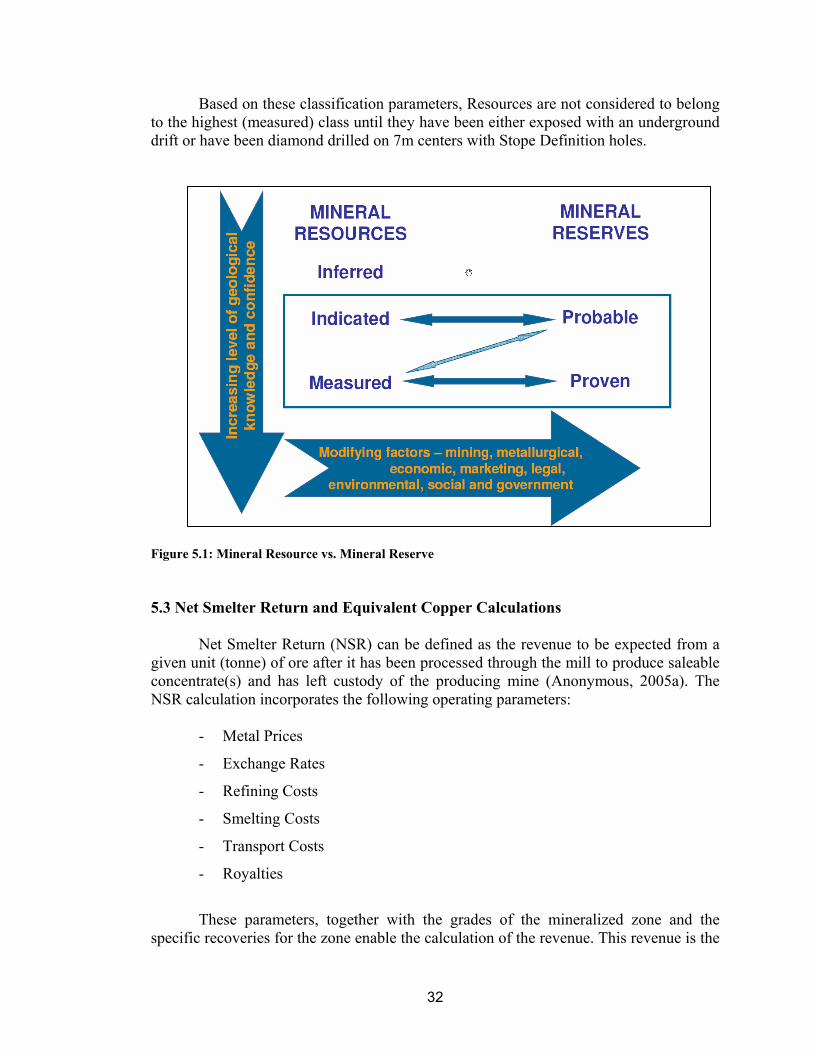
5.2 Mineral Resource and Mineral Reserve Classification Mineral Resources and Mineral Reserves presented herein are based on the
classification into various categories. The category of an estimate implies confidence in the geological information available on the mineral deposit; the quality and quantity of data available on the deposit; the level of detail of the technical and economic information which has been generated about the deposit, and the interpretation of the data and information.
The in-situ Mineral Resources are sub-divided, in order of increasing geological
confidence, into Inferred, Indicated and Measured categories, based on a combination of the number of samples used in the interpolation, the distance from the block and finally, the type of samples used. An Inferred Mineral Resource has a lower level of confidence than that applied to an Indicated Mineral Resource. An Indicated Mineral Resource has a higher level of confidence than an Inferred Mineral Resource but has a lower level of confidence than a Measured Mineral Resource.
Mineral reserves are sub-divided in order of increasing confidence into Probable
Mineral Reserves and Proven Mineral Reserves. A Probable Mineral Reserve has a lower level of confidence than a Proven Mineral Reserve. Proven and Probable Mineral Reserves are derived from Measured and Indicated Resources respectively and have been shown that they can be mined and processed at a profit. These definitions have resulted from experience gained through past mining and result in confidence levels which are consistent with the definitions in the CIM Standards on Mineral Resources and Reserves (Appendix A) (Postle, Haystead, Clow, Hora, Vallee, and Jensen, 2000). These definitions are derived using all drill hole, channel and sludge sample data (Figure 5.1) (Parker, 2006).
The classification parameters are described as follows (Appendix A):
Measured Resource (Proven Reserve): Blocks in the model in which the grade has been estimated using a minimum of three drill holes. All blocks in this category are located within a maximum distance of 10m from either an existing drift opening underground (Channel or Sludge sample) or a Stope Definition drill hole.
Indicated Resource (Probable Reserve): Blocks in the model which do not
meet the criteria for Measured resources but have had grades estimated using a minimum of three drill holes within the search ellipse, the closest of which is a maximum distance of 28m from the center of the block.
Inferred Resource: Blocks in the model which do not meet the criteria for
Measured or Indicated resources but have had grades interpolated by at least one drill hole within the search ellipse.
32
Based on these classification parameters, Resources are not considered to belong to the highest (measured) class until they have been either exposed with an underground drift or have been diamond drilled on 7m centers with Stope Definition holes.
Figure 5.1: Mineral Resource vs. Mineral Reserve
5.3 Net Smelter Return and Equivalent Copper Calculations
Net Smelter Return (NSR) can be defined as the revenue to be expected from a
given unit (tonne) of ore after it has been processed through the mill to produce saleable concentrate(s) and has left custody of the producing mine (Anonymous, 2005a). The NSR calculation incorporates the following operating parameters:
- Metal Prices
- Exchange Rates
- Refining Costs
- Smelting Costs
- Transport Costs
- Royalties
These parameters, together with the grades of the mineralized zone and the
specific recoveries for the zone enable the calculation of the revenue. This revenue is the
33
NSR. NSR is a tool to assist in the determination of ore/waste boundaries for a mineralized zone under particular operating conditions. Material is considered to be “ore” if its NSR exceeds the unit site costs.
As a simple formula, the NSR can be summarized as: NSR = Revenue of recovered metals in situ – (Smelter Cost + Refinery Costs and
Penalties + Royalties + Transport Costs) In the past, for the purposes of the resource and reserve estimation, and since the
copper is the most important metal in terms of its contribution to the NSR, CBI had been using, until December 2005, an equivalent copper grade (CuEq%) as a common parameter from which the cut-off was derived. The resource and reserve estimations were based on a 2.5% CuEq and the CuEq formula was:
CuEq% = Cu% + 0.37*Zn% In December 2005, reporting of resource and reserve by using CuEq values was
replaced with NSR method and the development and stope designs were performed by using NSR cut-off. The NSR value for each block of the model is calculated on the basis of its grades (Cu, Zn, Ag, and Au) and metal recoveries. Metal recoveries are obtained from the recovery curves based upon head grades (See APPENDIX B for the NSR calculation method).
The reserves are reported at a money equivalent of $US 46 (NSR) per tonne of
ore cut-off depending on the present mining cost.
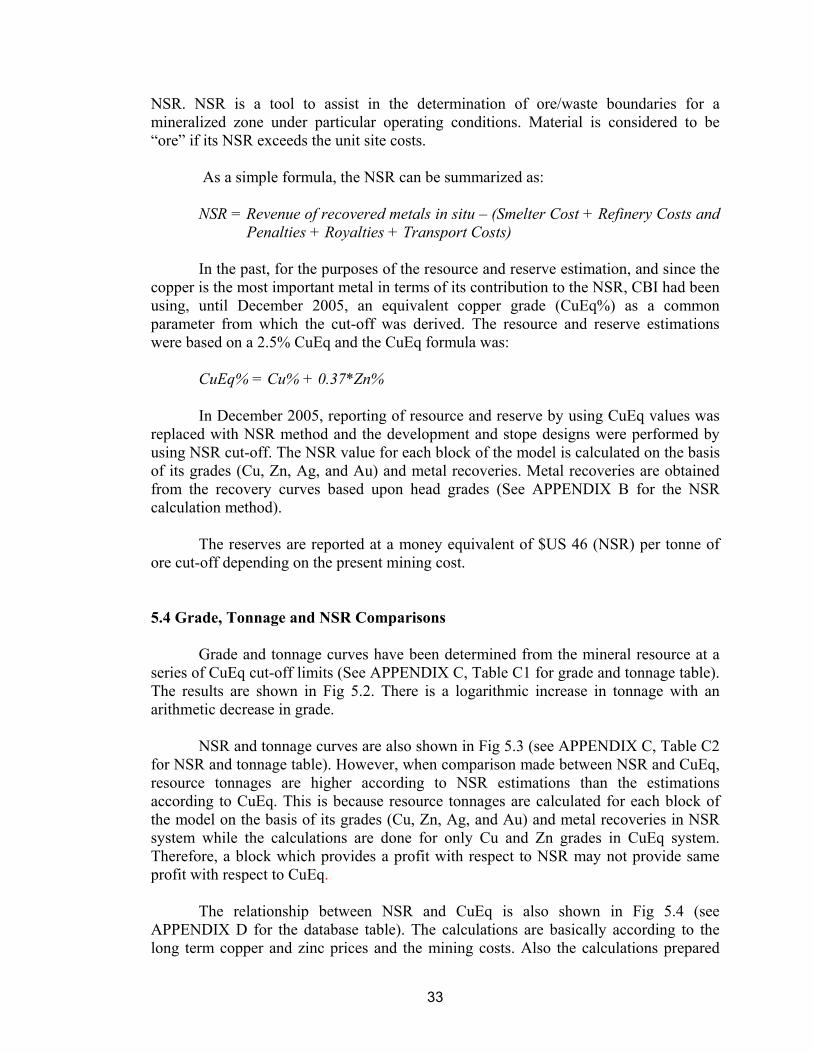
5.4 Grade, Tonnage and NSR Comparisons
Grade and tonnage curves have been determined from the mineral resource at a
series of CuEq cut-off limits (See APPENDIX C, Table C1 for grade and tonnage table). The results are shown in Fig 5.2. There is a logarithmic increase in tonnage with an arithmetic decrease in grade.
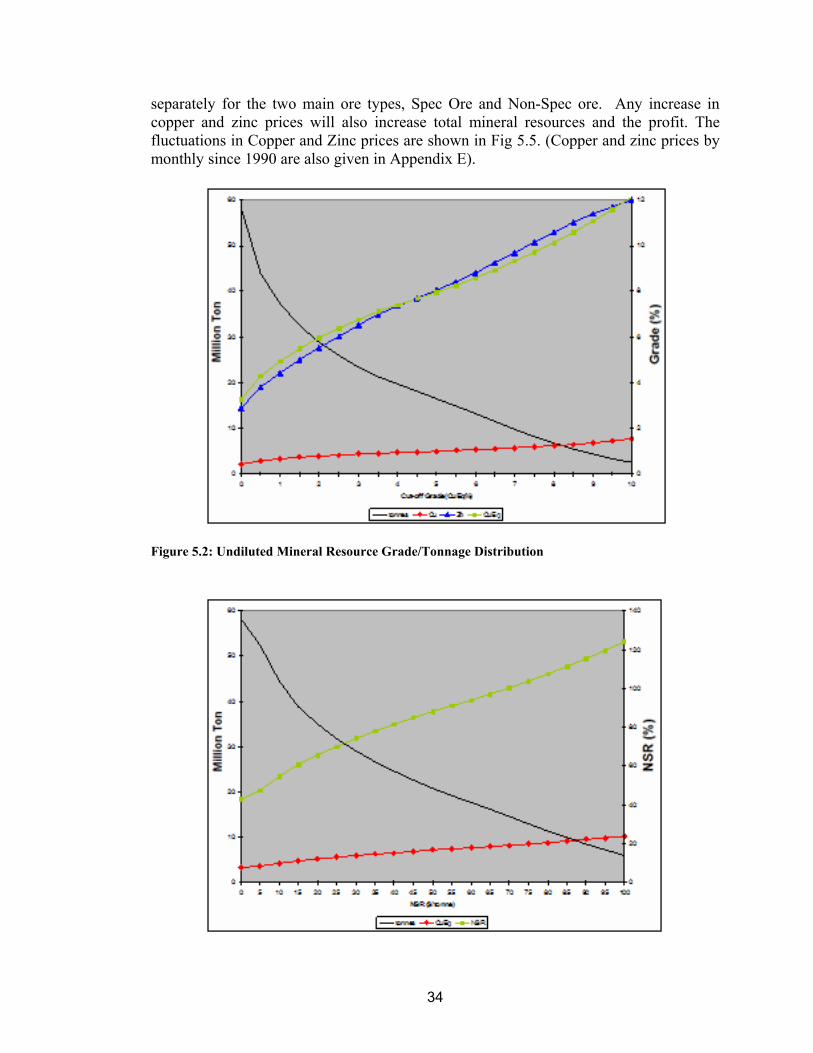
NSR and tonnage curves are also shown in Fig 5.3 (see APPENDIX C, Table C2
for NSR and tonnage table). However, when comparison made between NSR and CuEq, resource tonnages are higher according to NSR estimations than the estimations according to CuEq. This is because resource tonnages are calculated for each block of the model on the basis of its grades (Cu, Zn, Ag, and Au) and metal recoveries in NSR system while the calculations are done for only Cu and Zn grades in CuEq system. Therefore, a block which provides a profit with respect to NSR may not provide same profit with respect to CuEq.
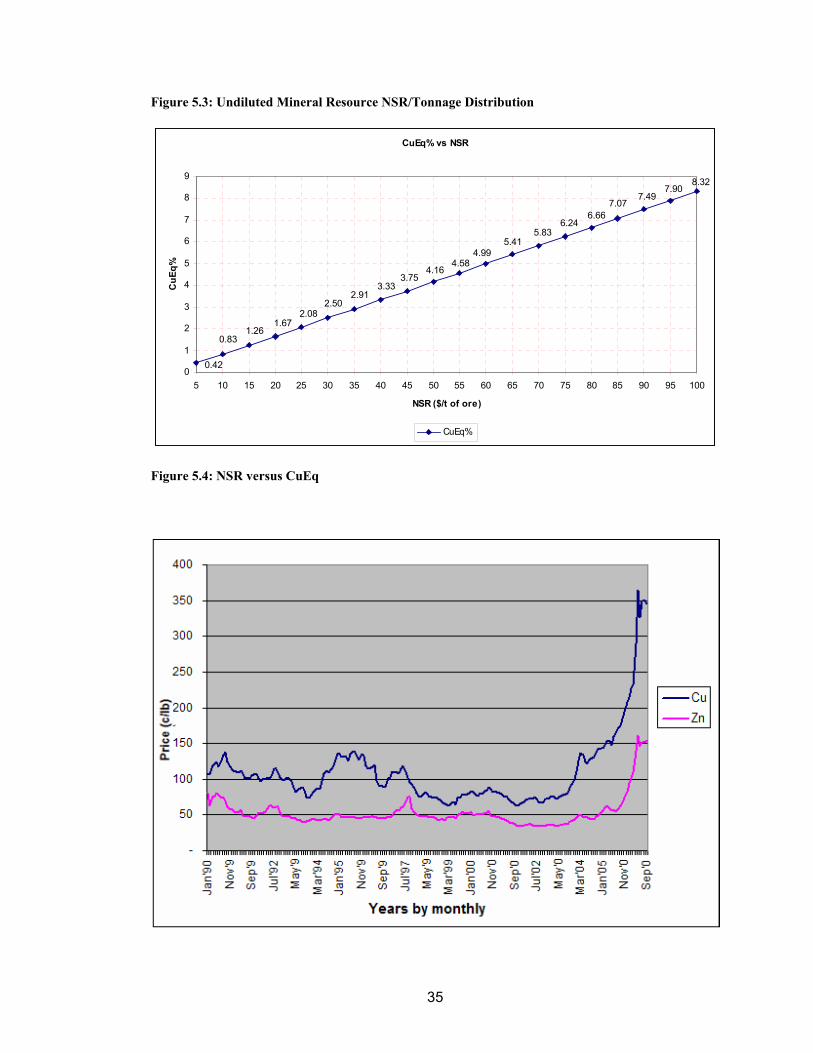
The relationship between NSR and CuEq is also shown in Fig 5.4 (see
APPENDIX D for the database table). The calculations are basically according to the long term copper and zinc prices and the mining costs. Also the calculations prepared
34
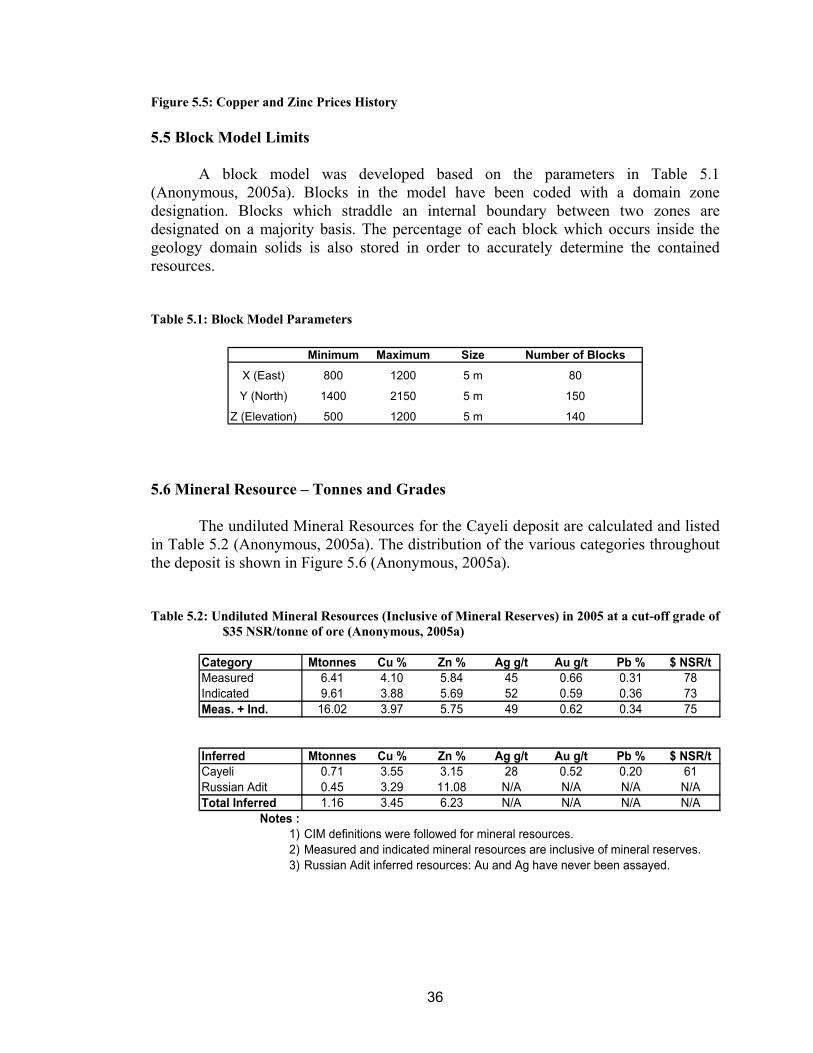
separately for the two main ore types, Spec Ore and Non-Spec ore. Any increase in copper and zinc prices will also increase total mineral resources and the profit. The fluctuations in Copper and Zinc prices are shown in Fig 5.5. (Copper and zinc prices by monthly since 1990 are also given in Appendix E).
Figure 5.2: Undiluted Mineral Resource Grade/Tonnage Distribution
35
Figure 5.3: Undiluted Mineral Resource NSR/Tonnage Distribution
CuEq% vs NSR
8.327.90
7.077.49
6.666.24
5.835.41
4.994.58
4.163.75
3.332.91
2.502.08
1.671.26
0.83
0.420
1
2
3
4
5
6
7
8
9
5 10 15 20 25 30 35 40 45 50 55 60 65 70 75 80 85 90 95 100
NSR ($/t of ore)
CuE
q%
CuEq%
Figure 5.4: NSR versus CuEq
36
Figure 5.5: Copper and Zinc Prices History 5.5 Block Model Limits
A block model was developed based on the parameters in Table 5.1 (Anonymous, 2005a). Blocks in the model have been coded with a domain zone designation. Blocks which straddle an internal boundary between two zones are designated on a majority basis. The percentage of each block which occurs inside the geology domain solids is also stored in order to accurately determine the contained resources.
Table 5.1: Block Model Parameters
Minimum Maximum Size Number of Blocks
X (East) 800 1200 5 m 80
Y (North) 1400 2150 5 m 150
Z (Elevation) 500 1200 5 m 140
5.6 Mineral Resource – Tonnes and Grades The undiluted Mineral Resources for the Cayeli deposit are calculated and listed
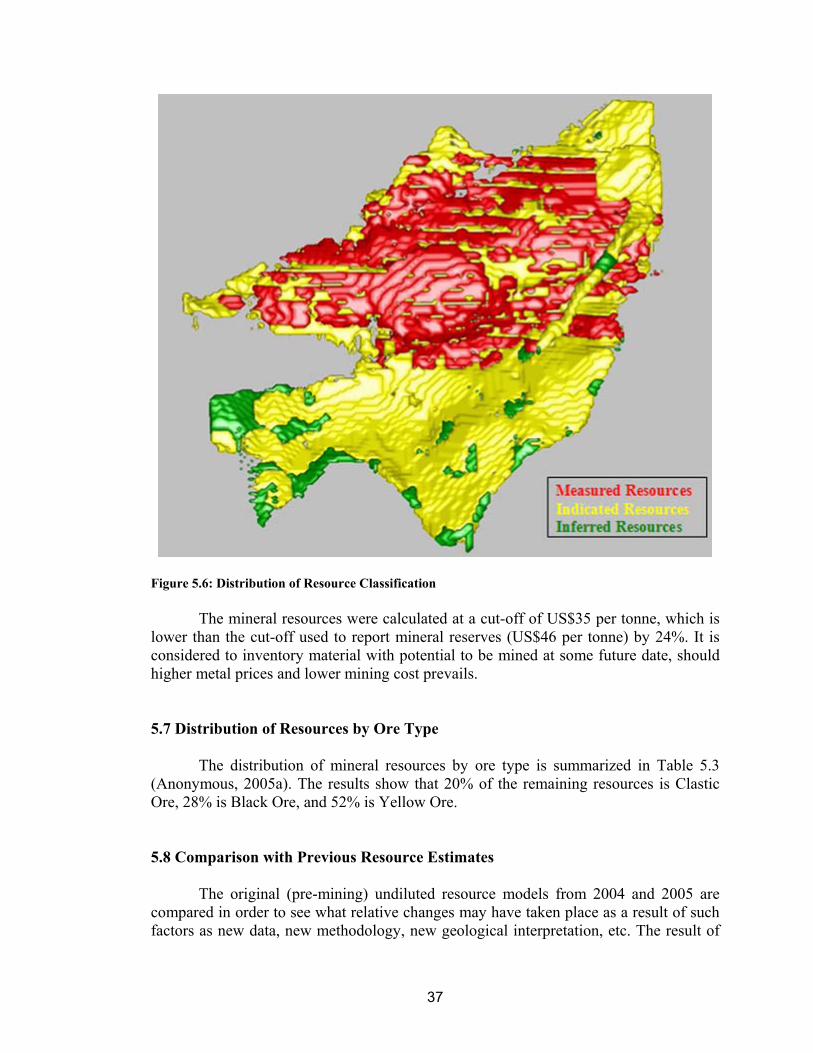
in Table 5.2 (Anonymous, 2005a). The distribution of the various categories throughout the deposit is shown in Figure 5.6 (Anonymous, 2005a).
Table 5.2: Undiluted Mineral Resources (Inclusive of Mineral Reserves) in 2005 at a cut-off grade of $35 NSR/tonne of ore (Anonymous, 2005a)
Category Mtonnes Cu % Zn % Ag g/t Au g/t Pb % $ NSR/tMeasured 6.41 4.10 5.84 45 0.66 0.31 78Indicated 9.61 3.88 5.69 52 0.59 0.36 73Meas. + Ind. 16.02 3.97 5.75 49 0.62 0.34 75
Inferred Mtonnes Cu % Zn % Ag g/t Au g/t Pb % $ NSR/tCayeli 0.71 3.55 3.15 28 0.52 0.20 61Russian Adit 0.45 3.29 11.08 N/A N/A N/A N/ATotal Inferred 1.16 3.45 6.23 N/A N/A N/A N/A
Notes :1) CIM definitions were followed for mineral resources.2) Measured and indicated mineral resources are inclusive of mineral reserves.3) Russian Adit inferred resources: Au and Ag have never been assayed.
37
Figure 5.6: Distribution of Resource Classification
The mineral resources were calculated at a cut-off of US$35 per tonne, which is
lower than the cut-off used to report mineral reserves (US$46 per tonne) by 24%. It is considered to inventory material with potential to be mined at some future date, should higher metal prices and lower mining cost prevails.
5.7 Distribution of Resources by Ore Type
The distribution of mineral resources by ore type is summarized in Table 5.3 (Anonymous, 2005a). The results show that 20% of the remaining resources is Clastic Ore, 28% is Black Ore, and 52% is Yellow Ore.
5.8 Comparison with Previous Resource Estimates The original (pre-mining) undiluted resource models from 2004 and 2005 are
compared in order to see what relative changes may have taken place as a result of such factors as new data, new methodology, new geological interpretation, etc. The result of
38
the comparison is shown at a cut-off grade of $35 NSR/tonne of ore in Table 5.4 (Anonymous, 2005a). Table 5.3: Mineral Resources by Ore Type in 2005 at a cut-off grade of $35 NSR/tonne of ore
Ore Type Mtonnes Cu % Zn % Ag g/t Au g/t Pb % $ NSR/tClastic 3.36 5.45 9.81 115 1.14 0.73 101Black 4.73 3.33 9.77 65 0.68 0.50 78Yellow 8.63 3.70 1.76 14 0.36 0.09 62Total 16.73 3.95 5.64 48 0.61 0.34 74
Table 5.4: Comparison of Mineral Resources: December 31, 2005 vs. 2004
Category December 31, 2005 December 31, 2004 Difference % (2005-2004)Mtonnes Cu % Zn % Mtonnes Cu % Zn % Mtonnes Cu % Zn %
Measured 6.41 4.10 5.84 7.67 4.26 5.90 -16.4 -3.6 -1.0Indicated 9.61 3.88 5.69 8.16 3.65 5.91 17.8 6.2 -3.7Meas. + Ind. 16.02 3.97 5.75 15.82 3.94 5.91 1.3 0.6 -2.6
Inferred Mtonnes Cu % Zn % Mtonnes Cu % Zn % Mtonnes Cu % Zn %Cayeli 0.71 3.55 3.15 2.83 4.43 6.08 -75.1 -19.9 -48.2Russian Adit 0.45 3.29 11.08 0.50 4.77 10.54 -10.4 -31.0 5.1Total Inferred 1.15 3.45 6.23 3.33 4.48 6.75 -65.4 -23.1 -7.7
The changes in mineral resources between 2004 and 2005 are due to:
• An update of the interpretation of the mineralized envelope based on diamond drilling carried out this year,
• The removal of isolated blocks, • The mining some 833,600 tonnes of ore in 2005, • The shifting from CuEq to a NSR formula.
39
CHAPTER 6
MINERAL RESERVE ESTIMATES
6.1 Mineral Reserves
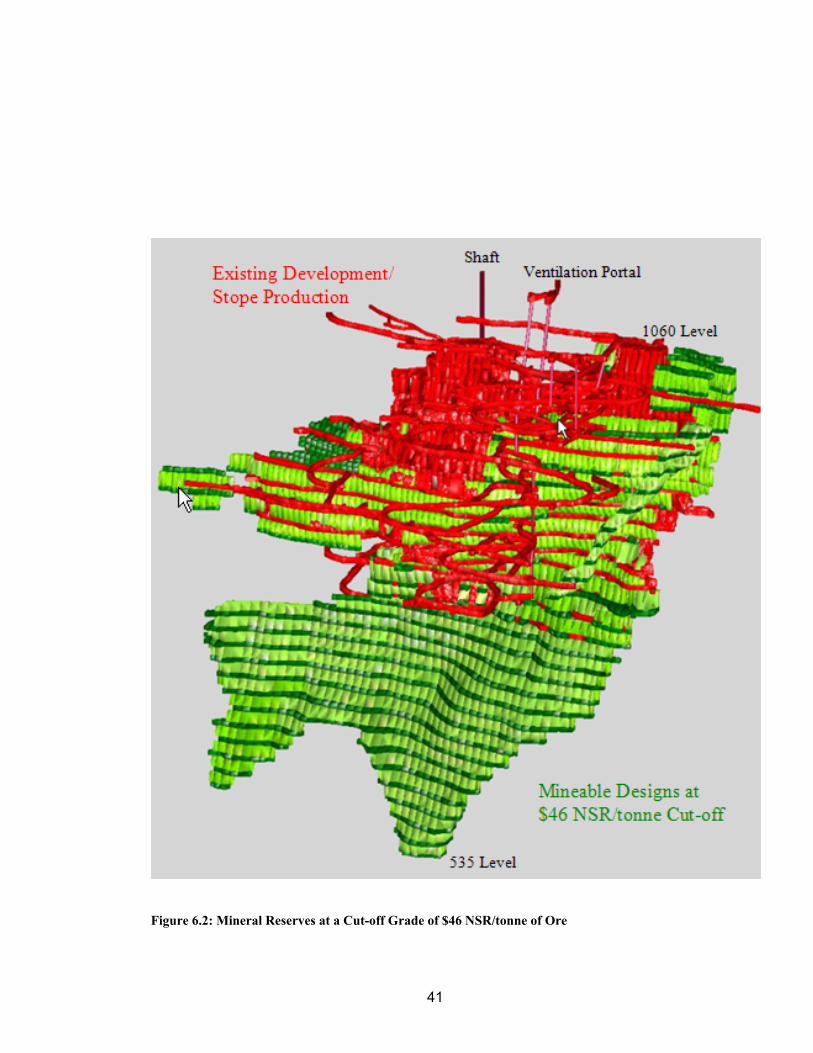
The Mineral Reserves for the Cayeli deposit are calculated and listed in Table 6.1 (Anonymous, 2005a) by category. As it can be seen from this table, 40% of the remaining reserves is Proven and the rest 60% is Probable. Figure 6.1 shows the process of Mineral Reserve Estimation. All reserves have been calculated at a price of 110 c/lb for copper and 55 c/lb for zinc based on average money equivalent of US$46/ton (NSR).
Table 6.1: Mineral Reserves– in 2005 at a cut-off grade of $46 NSR/tonne of ore
Category Mtonnes Cu % Zn % Ag g/t Au g/t Pb % $ NSR/tProven 4.70 3.77 5.85 44 0.59 0.30 73Probable 6.90 3.57 5.88 52 0.53 0.36 69Total 11.60 3.65 5.87 49 0.56 0.34 70
The mineable reserves are derived from measured and indicated resources. All
the designs from Indicated Mineral Resource are categorized as Probable Ore Reserve and the designs from Measured Mineral Resource are categorized as Proven ore Reserve. There are no inferred resources included in the reserve (Figure 6.2).
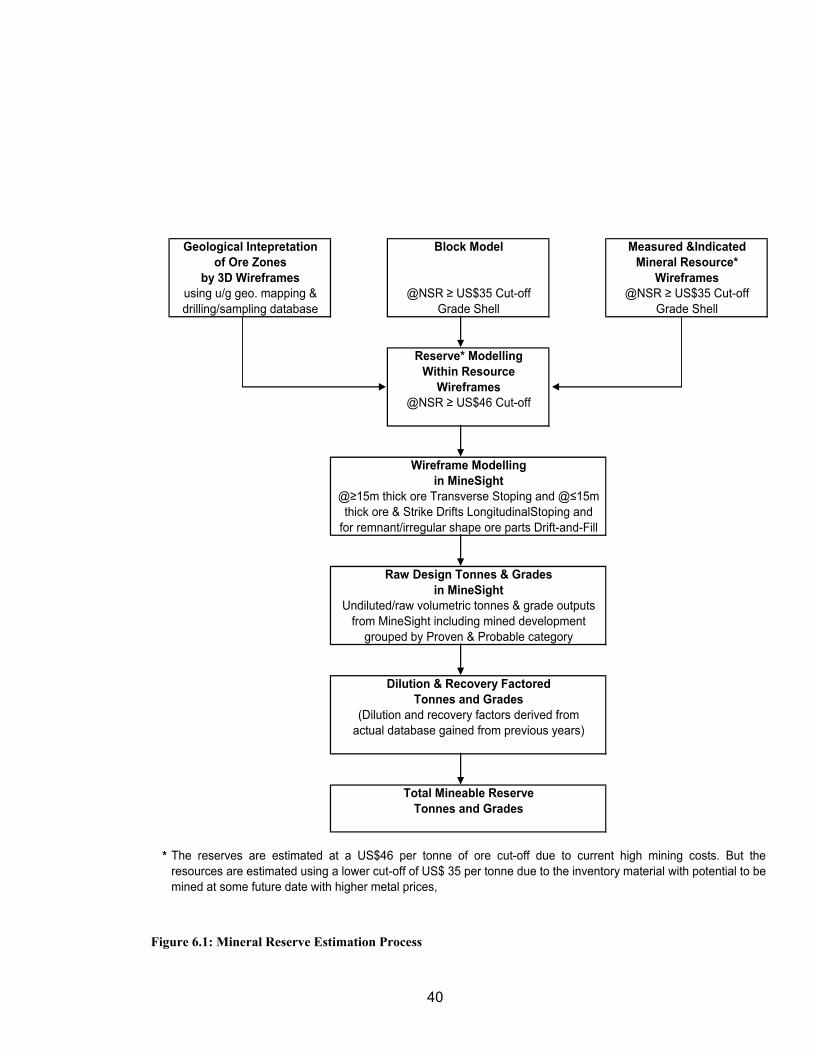
There are three important parameters used to improve reserve estimations at CBI. They are mine design, dilution and recovery. All of these factors are very important because the long-term and short-term mine planning schedules are all derived from the reserve estimations. All the improvements are achieved by using 3-D mine software program, MineSight, which provides users with an easier and more qualitative approach to basically stope reconciliation compared to traditional calculations generally based on some assumptions.
6.2 MineSight 3-D Mine Software
The MineSight modeling software has been developed by Mintec, Inc., based in Tucson, Arizona, USA. MineSight 3-D software is the main component of Mintec’s comprehensive 3-dimensional mine design and geological modeling and evaluation software package, incorporating the MineSight 3-D graphical interface and the MineSight Compass program management interface. This software has been used at CBI since end of 2002. Detailed information can be obtained from the web site www.mintec.com.
40
Geological Intepretation Block Model Measured &Indicatedof Ore Zones Mineral Resource*
by 3D Wireframes Wireframesusing u/g geo. mapping & @NSR ≥ US$35 Cut-off @NSR ≥ US$35 Cut-offdrilling/sampling database Grade Shell Grade Shell
Reserve* ModellingWithin Resource
Wireframes@NSR ≥ US$46 Cut-off
Wireframe Modellingin MineSight
Raw Design Tonnes & Gradesin MineSight
Dilution & Recovery FactoredTonnes and Grades
Total Mineable ReserveTonnes and Grades
* The reserves are estimated at a US$46 per tonne of ore cut-off due to current high mining costs. But theresources are estimated using a lower cut-off of US$ 35 per tonne due to the inventory material with potential to bemined at some future date with higher metal prices,
from MineSight including mined developmentgrouped by Proven & Probable category
(Dilution and recovery factors derived fromactual database gained from previous years)
@≥15m thick ore Transverse Stoping and @≤15mthick ore & Strike Drifts LongitudinalStoping and
for remnant/irregular shape ore parts Drift-and-Fill
Undiluted/raw volumetric tonnes & grade outputs
Figure 6.1: Mineral Reserve Estimation Process
41
Figure 6.2: Mineral Reserves at a Cut-off Grade of $46 NSR/tonne of Ore
42
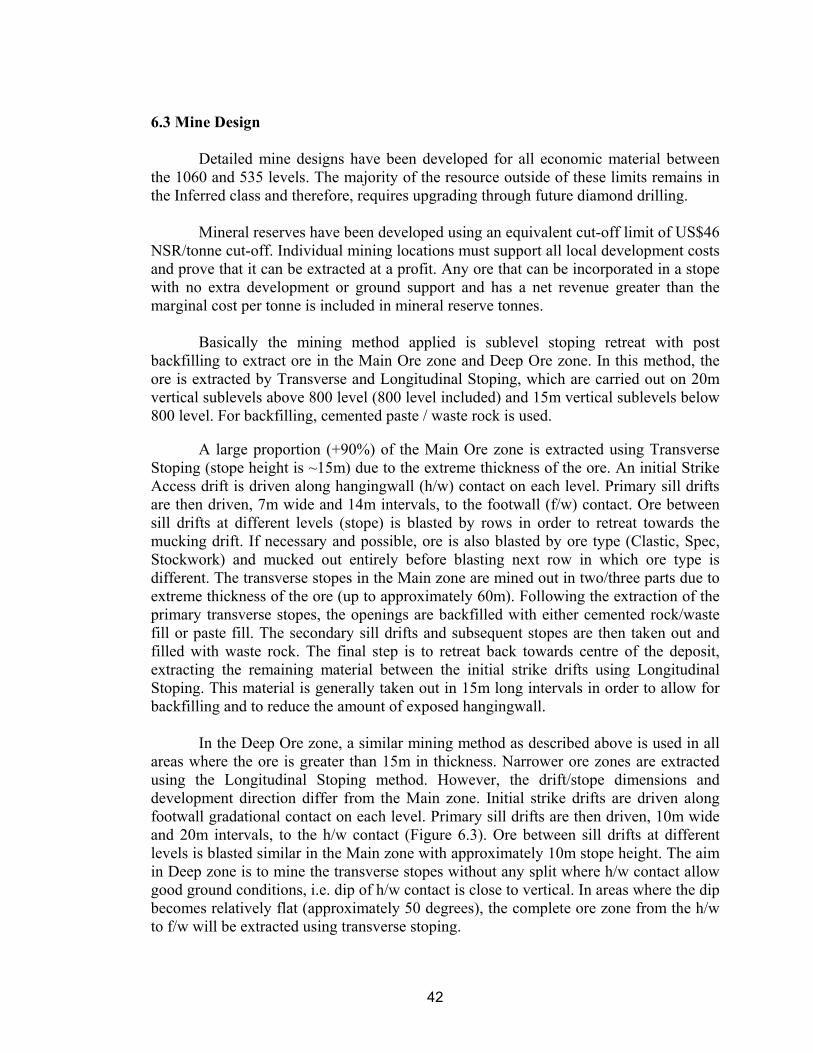
6.3 Mine Design
Detailed mine designs have been developed for all economic material between the 1060 and 535 levels. The majority of the resource outside of these limits remains in the Inferred class and therefore, requires upgrading through future diamond drilling.
Mineral reserves have been developed using an equivalent cut-off limit of US$46
NSR/tonne cut-off. Individual mining locations must support all local development costs and prove that it can be extracted at a profit. Any ore that can be incorporated in a stope with no extra development or ground support and has a net revenue greater than the marginal cost per tonne is included in mineral reserve tonnes.
Basically the mining method applied is sublevel stoping retreat with post backfilling to extract ore in the Main Ore zone and Deep Ore zone. In this method, the ore is extracted by Transverse and Longitudinal Stoping, which are carried out on 20m vertical sublevels above 800 level (800 level included) and 15m vertical sublevels below 800 level. For backfilling, cemented paste / waste rock is used.
A large proportion (+90%) of the Main Ore zone is extracted using Transverse Stoping (stope height is ~15m) due to the extreme thickness of the ore. An initial Strike Access drift is driven along hangingwall (h/w) contact on each level. Primary sill drifts are then driven, 7m wide and 14m intervals, to the footwall (f/w) contact. Ore between sill drifts at different levels (stope) is blasted by rows in order to retreat towards the mucking drift. If necessary and possible, ore is also blasted by ore type (Clastic, Spec, Stockwork) and mucked out entirely before blasting next row in which ore type is different. The transverse stopes in the Main zone are mined out in two/three parts due to extreme thickness of the ore (up to approximately 60m). Following the extraction of the primary transverse stopes, the openings are backfilled with either cemented rock/waste fill or paste fill. The secondary sill drifts and subsequent stopes are then taken out and filled with waste rock. The final step is to retreat back towards centre of the deposit, extracting the remaining material between the initial strike drifts using Longitudinal Stoping. This material is generally taken out in 15m long intervals in order to allow for backfilling and to reduce the amount of exposed hangingwall.
In the Deep Ore zone, a similar mining method as described above is used in all
areas where the ore is greater than 15m in thickness. Narrower ore zones are extracted using the Longitudinal Stoping method. However, the drift/stope dimensions and development direction differ from the Main zone. Initial strike drifts are driven along footwall gradational contact on each level. Primary sill drifts are then driven, 10m wide and 20m intervals, to the h/w contact (Figure 6.3). Ore between sill drifts at different levels is blasted similar in the Main zone with approximately 10m stope height. The aim in Deep zone is to mine the transverse stopes without any split where h/w contact allow good ground conditions, i.e. dip of h/w contact is close to vertical. In areas where the dip becomes relatively flat (approximately 50 degrees), the complete ore zone from the h/w to f/w will be extracted using transverse stoping.
43
As proportion of the remaining reserve, approximately 24% of the Main zone will be extracted through Longitudinal Stoping and the other 76% through Transverse Stoping. The Deep Ore will have 14% Longitudinal and 86% Transverse Stopes.
6.4 Creating Strings and Wireframes for the Mining Block
The NSR cut-off grades in the block model were used to control the extent of development during the mine design process. Three-dimensional wireframes have been developed which represent all planned strike and sill drifts and stope designs. There are several criteria for the creation of the wireframes:
• A cut-off grade of $46 NSR/tonne of ore, • The angle of stope not shallower than 50°,
• Wireframes designed as longitudinal stopes where ore thickness is less
than 15m horizontally,
• In cases where isolated patches of resources exist, an economic analysis is conducted in order to ensure the ore mined supports the additional development costs.
Figure 6.3: Ore Development in Deep Ore Zone (Plan View)
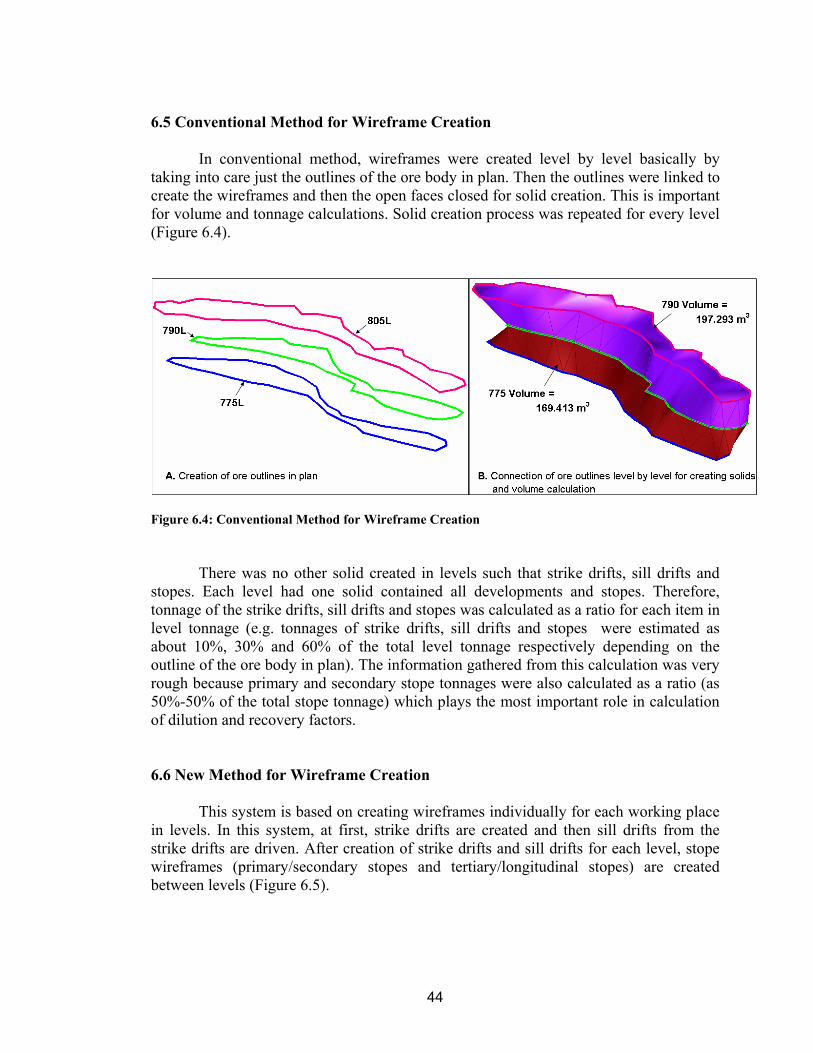
44
6.5 Conventional Method for Wireframe Creation
In conventional method, wireframes were created level by level basically by taking into care just the outlines of the ore body in plan. Then the outlines were linked to create the wireframes and then the open faces closed for solid creation. This is important for volume and tonnage calculations. Solid creation process was repeated for every level (Figure 6.4).
Figure 6.4: Conventional Method for Wireframe Creation There was no other solid created in levels such that strike drifts, sill drifts and stopes. Each level had one solid contained all developments and stopes. Therefore, tonnage of the strike drifts, sill drifts and stopes was calculated as a ratio for each item in level tonnage (e.g. tonnages of strike drifts, sill drifts and stopes were estimated as about 10%, 30% and 60% of the total level tonnage respectively depending on the outline of the ore body in plan). The information gathered from this calculation was very rough because primary and secondary stope tonnages were also calculated as a ratio (as 50%-50% of the total stope tonnage) which plays the most important role in calculation of dilution and recovery factors. 6.6 New Method for Wireframe Creation
This system is based on creating wireframes individually for each working place in levels. In this system, at first, strike drifts are created and then sill drifts from the strike drifts are driven. After creation of strike drifts and sill drifts for each level, stope wireframes (primary/secondary stopes and tertiary/longitudinal stopes) are created between levels (Figure 6.5).
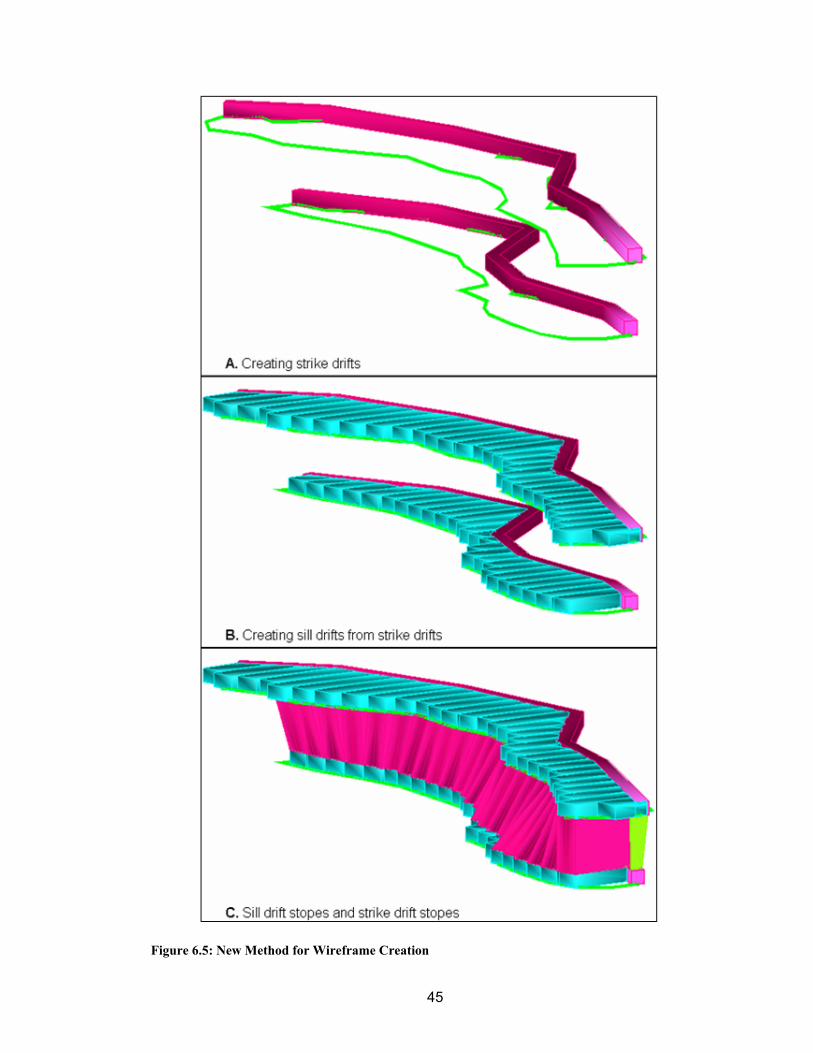
45
Figure 6.5: New Method for Wireframe Creation
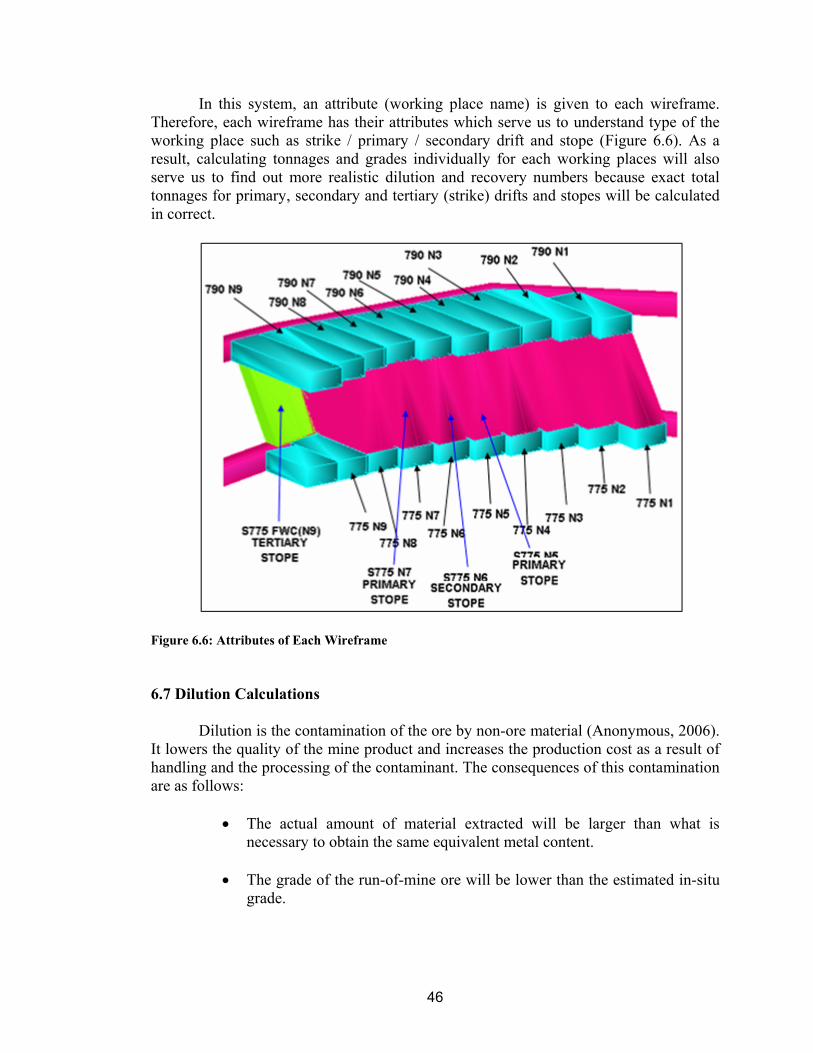
46
In this system, an attribute (working place name) is given to each wireframe. Therefore, each wireframe has their attributes which serve us to understand type of the working place such as strike / primary / secondary drift and stope (Figure 6.6). As a result, calculating tonnages and grades individually for each working places will also serve us to find out more realistic dilution and recovery numbers because exact total tonnages for primary, secondary and tertiary (strike) drifts and stopes will be calculated in correct.
Figure 6.6: Attributes of Each Wireframe
6.7 Dilution Calculations Dilution is the contamination of the ore by non-ore material (Anonymous, 2006).
It lowers the quality of the mine product and increases the production cost as a result of handling and the processing of the contaminant. The consequences of this contamination are as follows:
• The actual amount of material extracted will be larger than what is
necessary to obtain the same equivalent metal content. • The grade of the run-of-mine ore will be lower than the estimated in-situ
grade.
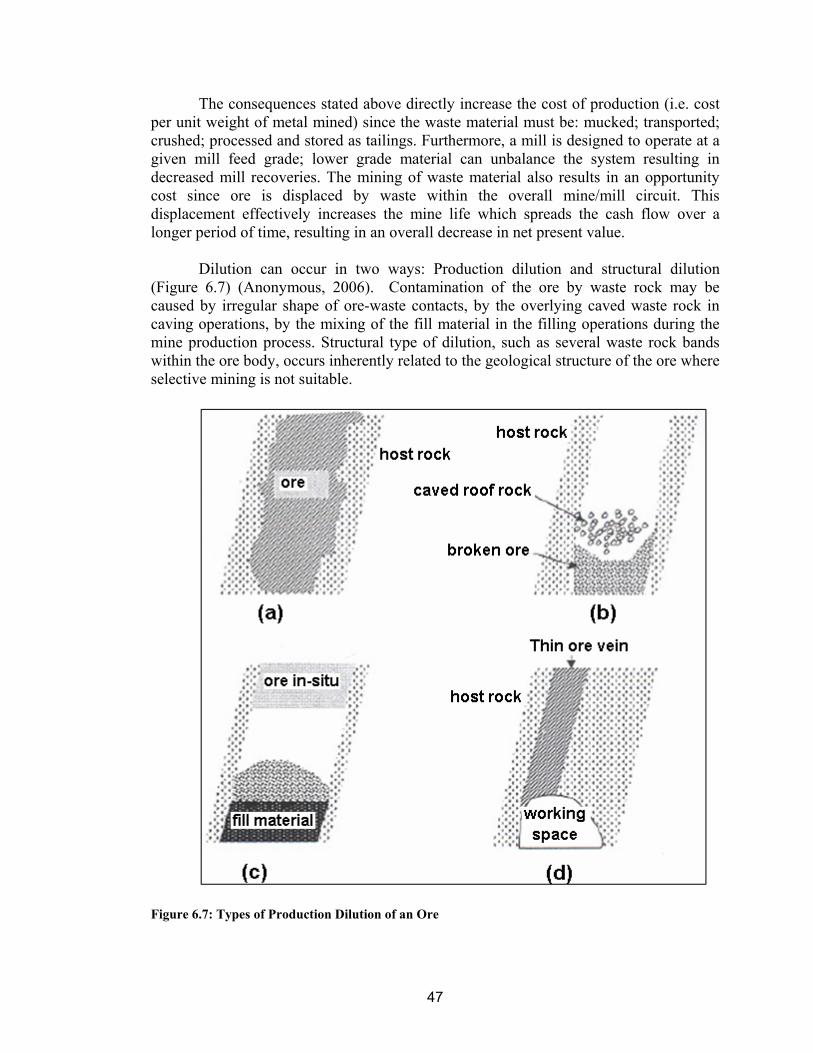
47
The consequences stated above directly increase the cost of production (i.e. cost per unit weight of metal mined) since the waste material must be: mucked; transported; crushed; processed and stored as tailings. Furthermore, a mill is designed to operate at a given mill feed grade; lower grade material can unbalance the system resulting in decreased mill recoveries. The mining of waste material also results in an opportunity cost since ore is displaced by waste within the overall mine/mill circuit. This displacement effectively increases the mine life which spreads the cash flow over a longer period of time, resulting in an overall decrease in net present value.
Dilution can occur in two ways: Production dilution and structural dilution
(Figure 6.7) (Anonymous, 2006). Contamination of the ore by waste rock may be caused by irregular shape of ore-waste contacts, by the overlying caved waste rock in caving operations, by the mixing of the fill material in the filling operations during the mine production process. Structural type of dilution, such as several waste rock bands within the ore body, occurs inherently related to the geological structure of the ore where selective mining is not suitable.
Figure 6.7: Types of Production Dilution of an Ore
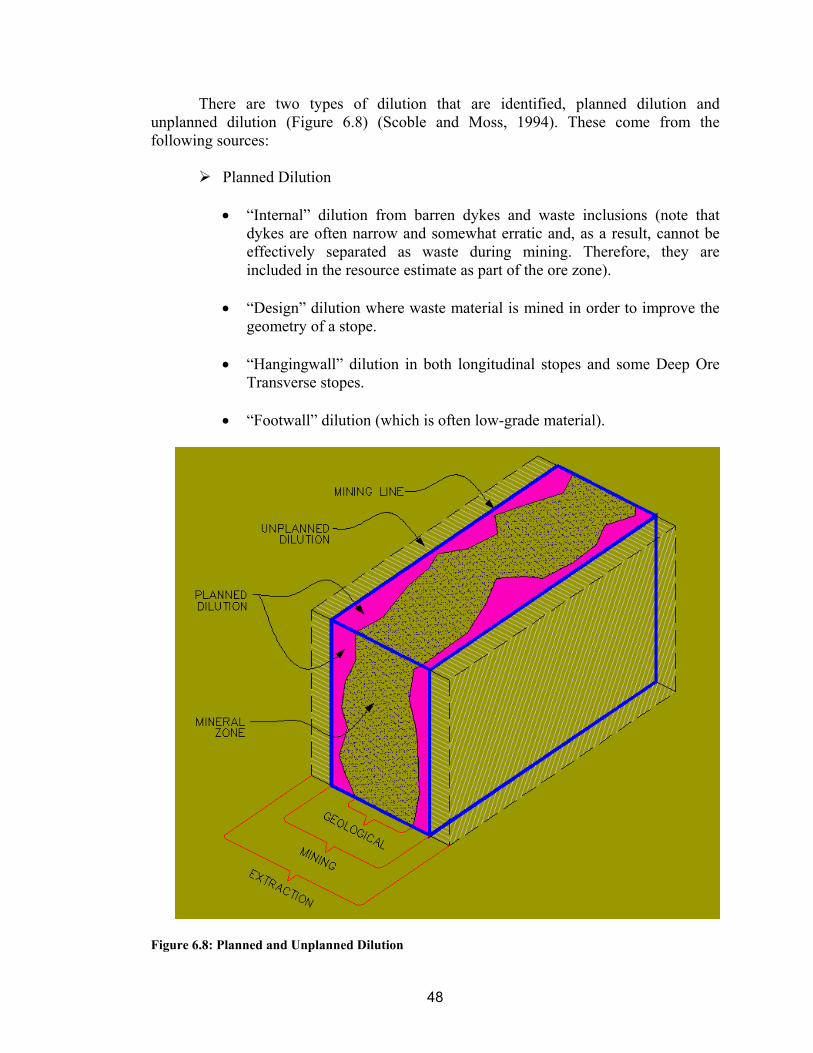
48
There are two types of dilution that are identified, planned dilution and unplanned dilution (Figure 6.8) (Scoble and Moss, 1994). These come from the following sources:
Planned Dilution
• “Internal” dilution from barren dykes and waste inclusions (note that
dykes are often narrow and somewhat erratic and, as a result, cannot be effectively separated as waste during mining. Therefore, they are included in the resource estimate as part of the ore zone).
• “Design” dilution where waste material is mined in order to improve the
geometry of a stope.
• “Hangingwall” dilution in both longitudinal stopes and some Deep Ore Transverse stopes.
• “Footwall” dilution (which is often low-grade material).
Figure 6.8: Planned and Unplanned Dilution
49
Unplanned Dilution
• “Backfill” dilution from sidewalls (adjacent stopes) during extraction of secondary and tertiary stopes and from back of blind primary and secondary stopes.
• “Overbreak and/or sloughing” dilution from unstable wall rock induced
by blasting of stope.
There are various methods for dilution calculation. Some important definition of dilutions is summarized as follows (Pakalnis, Poulin and Hadjigeorgiou, 1995):
EQ1 Dilution = (Waste mined) / (Ore mined) * 100 EQ2 Dilution = (Waste mined) / (Ore mined + Waste mined)* 100 EQ3 Dilution = (Undiluted in-situ grade reserves) / (Mill head grades obtained
from same tonnage) *100 EQ2 Dilution definition is used in CBI for dilution calculations. This can also be
expressed as: Waste D = * 100 Ore + Waste
6.8 Old System - Dilution and Recovery Calculations
In the past, dilution was applied to individual workplaces based on the following assumptions:
• The orebody was divided into two areas for the purposes of applying dilution
(Above the 820 level-Main Ore Zone and below the 820 level-Deep Ore Zone).
• All dilution factors are calculated by tonnage (as opposed to volume).
• All dilution is included at zero grade. • Average stope sizes for the Main Ore Zone and Deep Ore Zone were
40mx7mx15m and 30mx7mx15m respectively.
• At least one end of all the Transverse stopes is exposed to the H/W or F/W (or both, in case of some Deep Ore Transverse stopes). 0.8m of overbreak during stope blasting was assumed for the primary stopes.
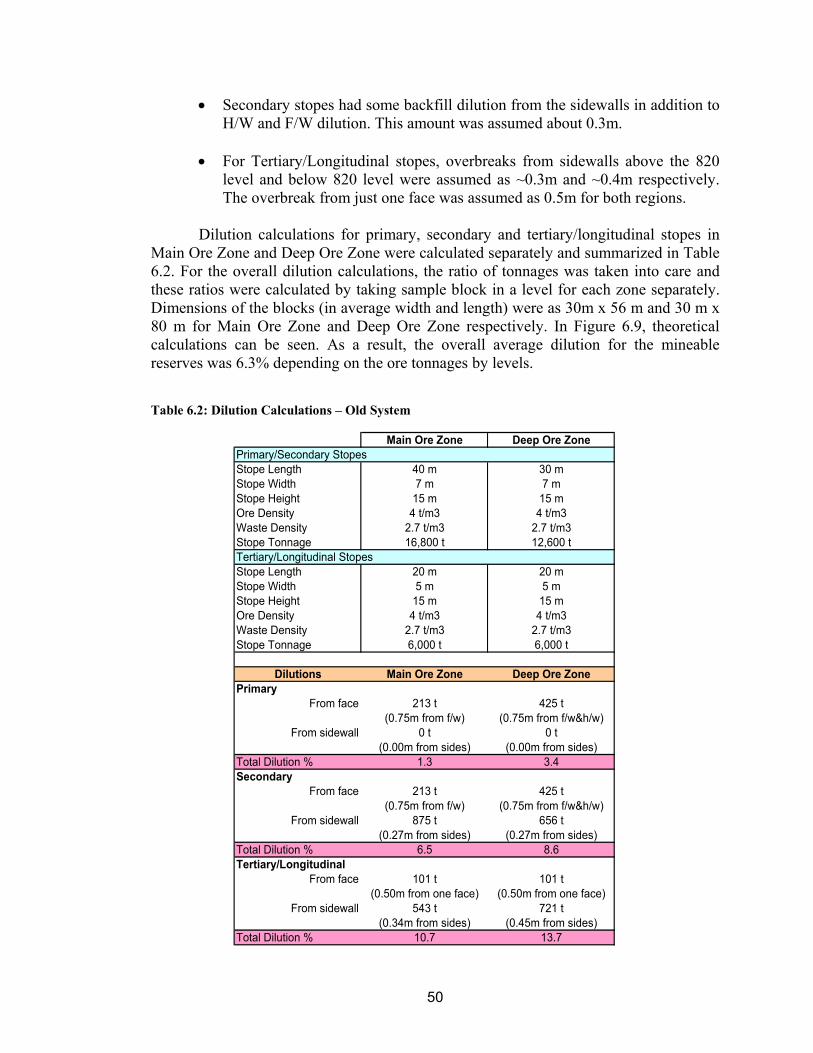
50
• Secondary stopes had some backfill dilution from the sidewalls in addition to H/W and F/W dilution. This amount was assumed about 0.3m.
• For Tertiary/Longitudinal stopes, overbreaks from sidewalls above the 820
level and below 820 level were assumed as ~0.3m and ~0.4m respectively. The overbreak from just one face was assumed as 0.5m for both regions.
Dilution calculations for primary, secondary and tertiary/longitudinal stopes in
Main Ore Zone and Deep Ore Zone were calculated separately and summarized in Table 6.2. For the overall dilution calculations, the ratio of tonnages was taken into care and these ratios were calculated by taking sample block in a level for each zone separately. Dimensions of the blocks (in average width and length) were as 30m x 56 m and 30 m x 80 m for Main Ore Zone and Deep Ore Zone respectively. In Figure 6.9, theoretical calculations can be seen. As a result, the overall average dilution for the mineable reserves was 6.3% depending on the ore tonnages by levels. Table 6.2: Dilution Calculations – Old System
Main Ore Zone Deep Ore ZonePrimary/Secondary StopesStope Length 40 m 30 mStope Width 7 m 7 mStope Height 15 m 15 mOre Density 4 t/m3 4 t/m3Waste Density 2.7 t/m3 2.7 t/m3Stope Tonnage 16,800 t 12,600 tTertiary/Longitudinal StopesStope Length 20 m 20 mStope Width 5 m 5 mStope Height 15 m 15 mOre Density 4 t/m3 4 t/m3Waste Density 2.7 t/m3 2.7 t/m3Stope Tonnage 6,000 t 6,000 t
Dilutions Main Ore Zone Deep Ore ZonePrimary
From face 213 t 425 t(0.75m from f/w) (0.75m from f/w&h/w)
From sidewall 0 t 0 t(0.00m from sides) (0.00m from sides)
Total Dilution % 1.3 3.4Secondary
From face 213 t 425 t(0.75m from f/w) (0.75m from f/w&h/w)
From sidewall 875 t 656 t(0.27m from sides) (0.27m from sides)
Total Dilution % 6.5 8.6Tertiary/Longitudinal
From face 101 t 101 t(0.50m from one face) (0.50m from one face)
From sidewall 543 t 721 t(0.34m from sides) (0.45m from sides)
Total Dilution % 10.7 13.7
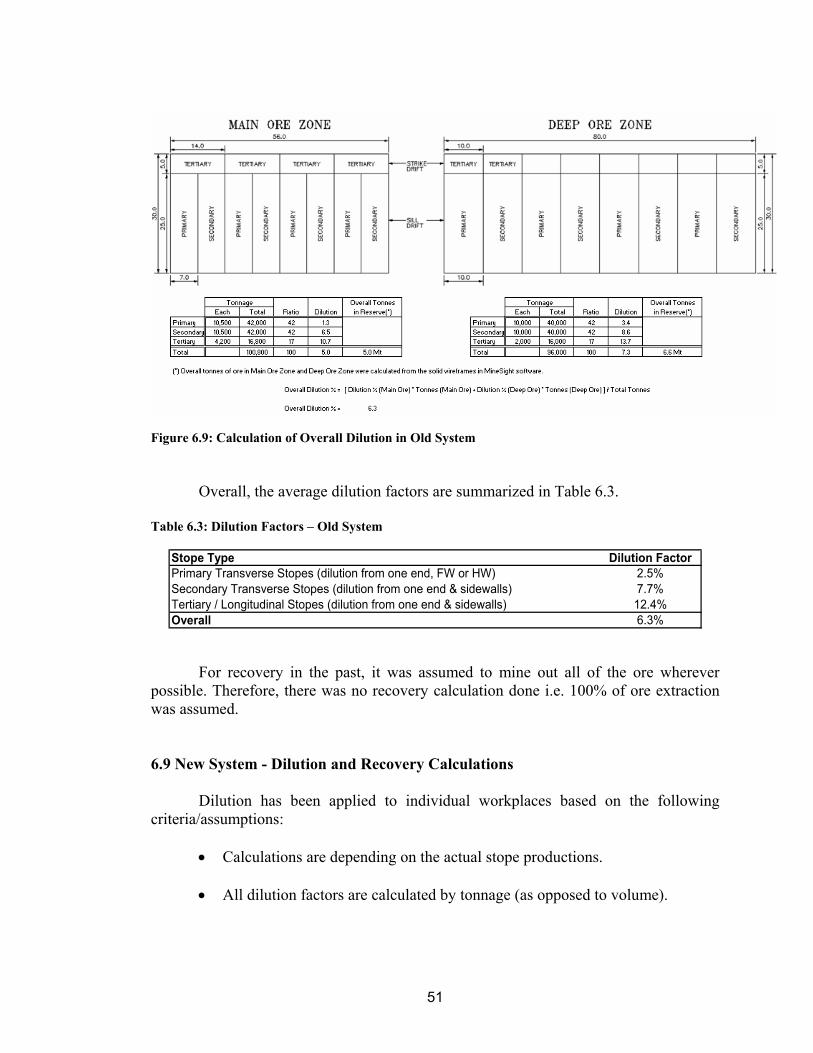
51
Figure 6.9: Calculation of Overall Dilution in Old System
Overall, the average dilution factors are summarized in Table 6.3. Table 6.3: Dilution Factors – Old System
Stope Type Dilution FactorPrimary Transverse Stopes (dilution from one end, FW or HW) 2.5%Secondary Transverse Stopes (dilution from one end & sidewalls) 7.7%Tertiary / Longitudinal Stopes (dilution from one end & sidewalls) 12.4%Overall 6.3%
For recovery in the past, it was assumed to mine out all of the ore wherever
possible. Therefore, there was no recovery calculation done i.e. 100% of ore extraction was assumed. 6.9 New System - Dilution and Recovery Calculations
Dilution has been applied to individual workplaces based on the following
criteria/assumptions: • Calculations are depending on the actual stope productions. • All dilution factors are calculated by tonnage (as opposed to volume).
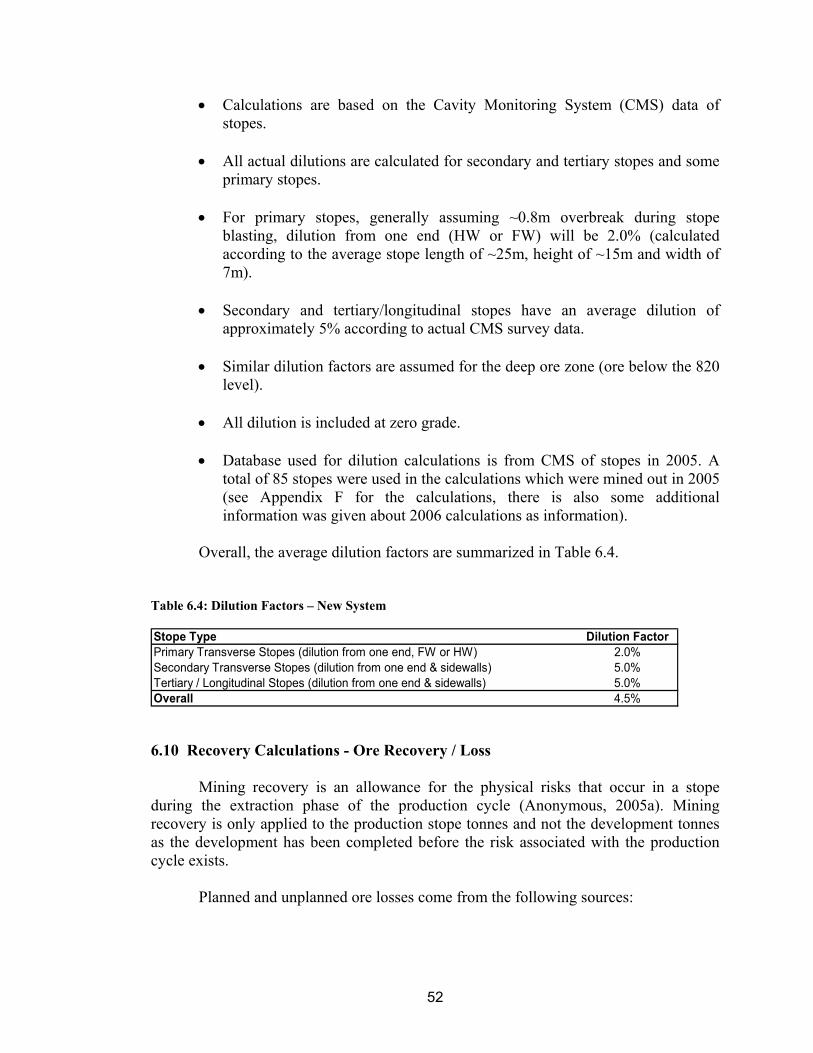
52
• Calculations are based on the Cavity Monitoring System (CMS) data of stopes.
• All actual dilutions are calculated for secondary and tertiary stopes and some
primary stopes.
• For primary stopes, generally assuming ~0.8m overbreak during stope blasting, dilution from one end (HW or FW) will be 2.0% (calculated according to the average stope length of ~25m, height of ~15m and width of 7m).
• Secondary and tertiary/longitudinal stopes have an average dilution of
approximately 5% according to actual CMS survey data.
• Similar dilution factors are assumed for the deep ore zone (ore below the 820 level).
• All dilution is included at zero grade.
• Database used for dilution calculations is from CMS of stopes in 2005. A
total of 85 stopes were used in the calculations which were mined out in 2005 (see Appendix F for the calculations, there is also some additional information was given about 2006 calculations as information).
Overall, the average dilution factors are summarized in Table 6.4.
Table 6.4: Dilution Factors – New System
Stope Type Dilution FactorPrimary Transverse Stopes (dilution from one end, FW or HW) 2.0%Secondary Transverse Stopes (dilution from one end & sidewalls) 5.0%Tertiary / Longitudinal Stopes (dilution from one end & sidewalls) 5.0%Overall 4.5%
6.10 Recovery Calculations - Ore Recovery / Loss
Mining recovery is an allowance for the physical risks that occur in a stope during the extraction phase of the production cycle (Anonymous, 2005a). Mining recovery is only applied to the production stope tonnes and not the development tonnes as the development has been completed before the risk associated with the production cycle exists. Planned and unplanned ore losses come from the following sources:
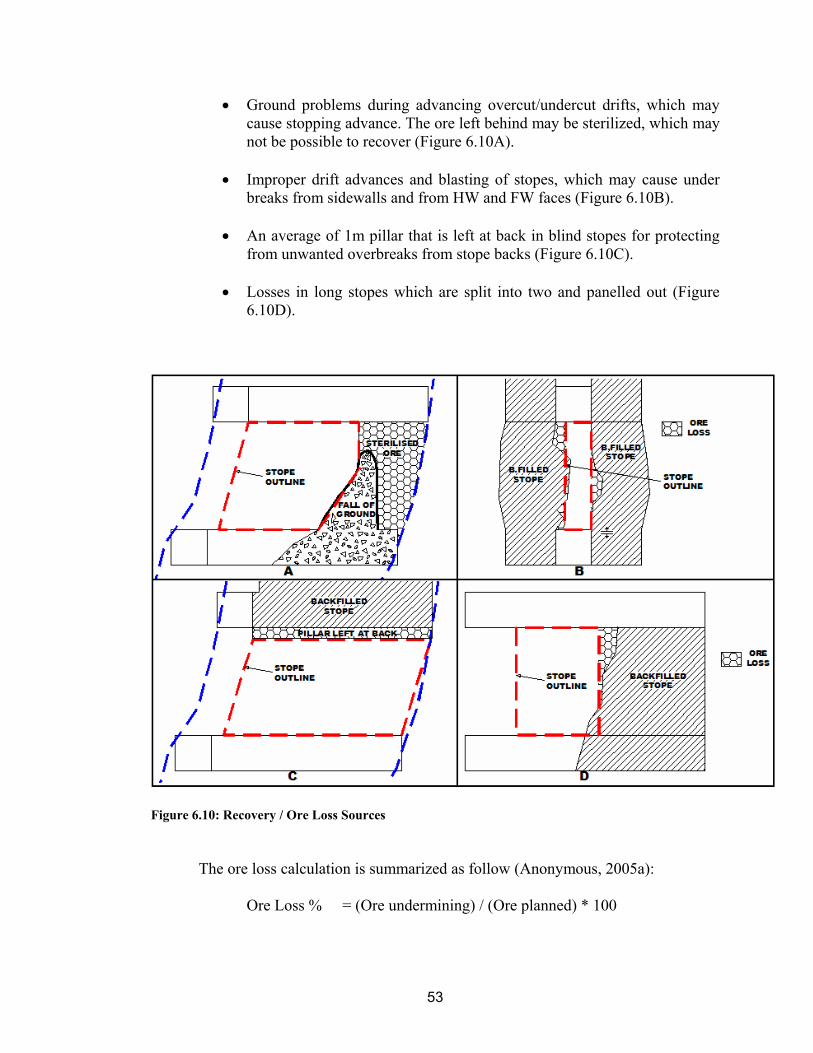
53
• Ground problems during advancing overcut/undercut drifts, which may cause stopping advance. The ore left behind may be sterilized, which may not be possible to recover (Figure 6.10A).
• Improper drift advances and blasting of stopes, which may cause under
breaks from sidewalls and from HW and FW faces (Figure 6.10B).
• An average of 1m pillar that is left at back in blind stopes for protecting from unwanted overbreaks from stope backs (Figure 6.10C).
• Losses in long stopes which are split into two and panelled out (Figure
6.10D).
Figure 6.10: Recovery / Ore Loss Sources
The ore loss calculation is summarized as follow (Anonymous, 2005a):
Ore Loss % = (Ore undermining) / (Ore planned) * 100
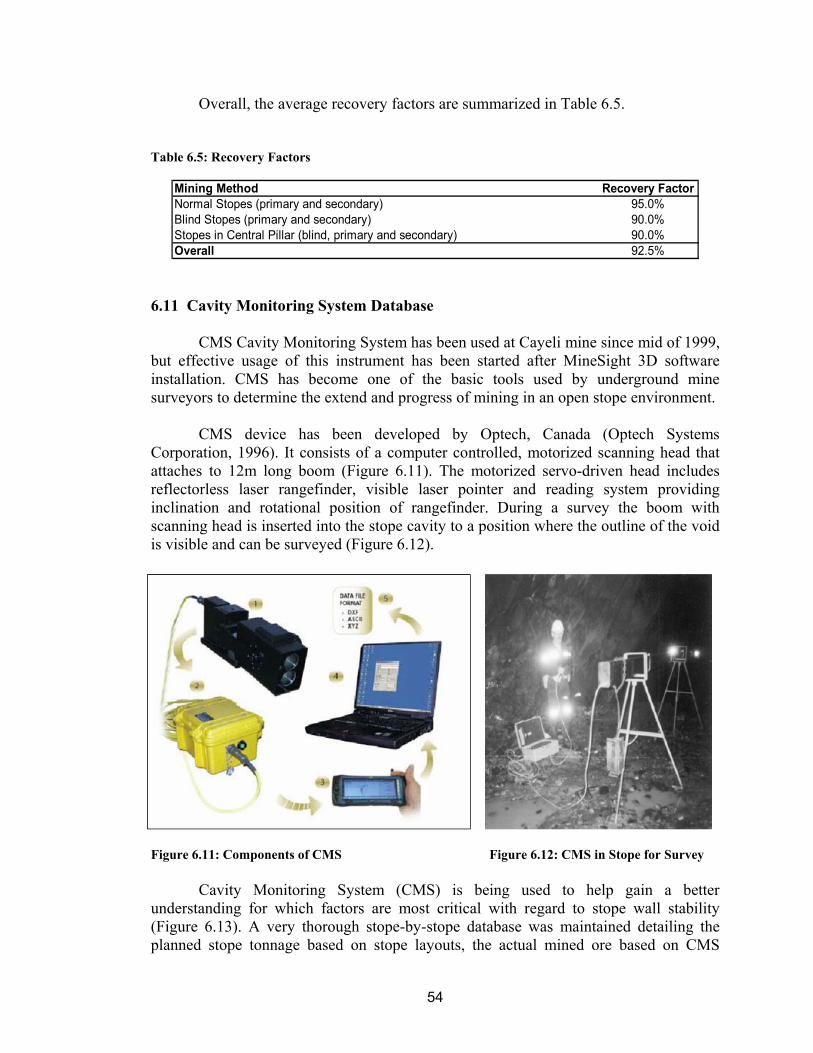
54
Overall, the average recovery factors are summarized in Table 6.5. Table 6.5: Recovery Factors
Mining Method Recovery FactorNormal Stopes (primary and secondary) 95.0%Blind Stopes (primary and secondary) 90.0%Stopes in Central Pillar (blind, primary and secondary) 90.0%Overall 92.5%
6.11 Cavity Monitoring System Database CMS Cavity Monitoring System has been used at Cayeli mine since mid of 1999,
but effective usage of this instrument has been started after MineSight 3D software installation. CMS has become one of the basic tools used by underground mine surveyors to determine the extend and progress of mining in an open stope environment.
CMS device has been developed by Optech, Canada (Optech Systems
Corporation, 1996). It consists of a computer controlled, motorized scanning head that attaches to 12m long boom (Figure 6.11). The motorized servo-driven head includes reflectorless laser rangefinder, visible laser pointer and reading system providing inclination and rotational position of rangefinder. During a survey the boom with scanning head is inserted into the stope cavity to a position where the outline of the void is visible and can be surveyed (Figure 6.12).
Figure 6.11: Components of CMS Figure 6.12: CMS in Stope for Survey Cavity Monitoring System (CMS) is being used to help gain a better
understanding for which factors are most critical with regard to stope wall stability (Figure 6.13). A very thorough stope-by-stope database was maintained detailing the planned stope tonnage based on stope layouts, the actual mined ore based on CMS
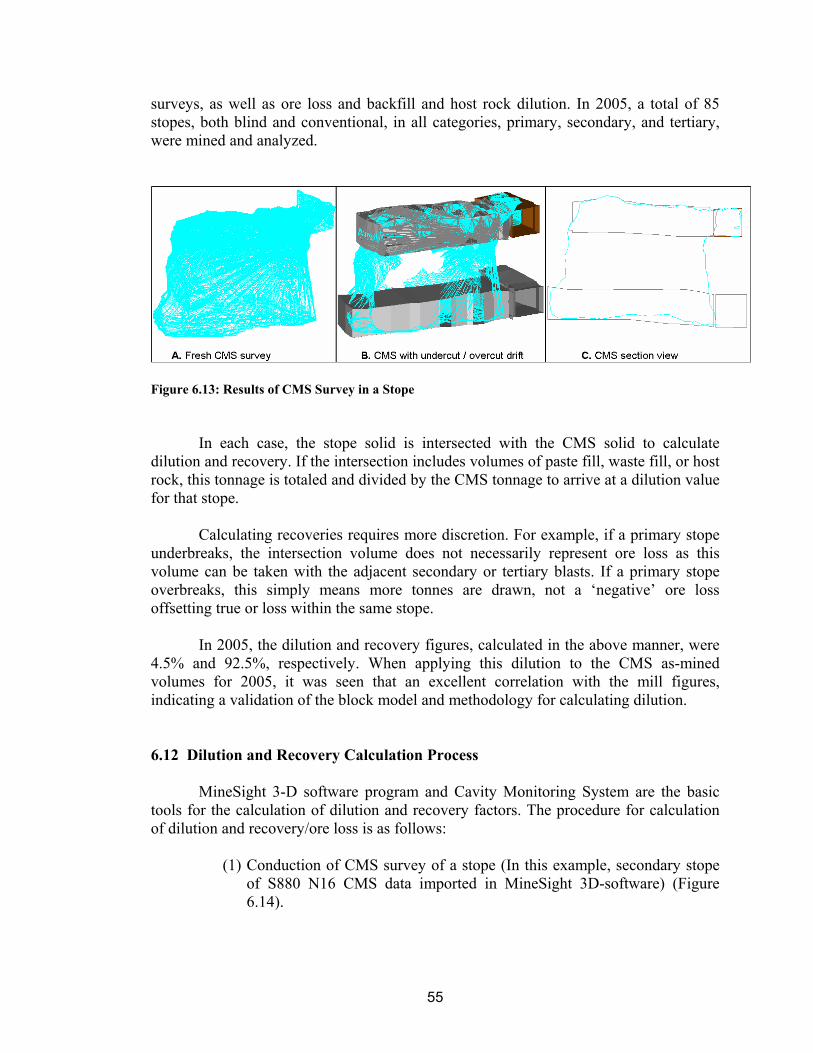
55
surveys, as well as ore loss and backfill and host rock dilution. In 2005, a total of 85 stopes, both blind and conventional, in all categories, primary, secondary, and tertiary, were mined and analyzed.
Figure 6.13: Results of CMS Survey in a Stope
In each case, the stope solid is intersected with the CMS solid to calculate dilution and recovery. If the intersection includes volumes of paste fill, waste fill, or host rock, this tonnage is totaled and divided by the CMS tonnage to arrive at a dilution value for that stope.
Calculating recoveries requires more discretion. For example, if a primary stope
underbreaks, the intersection volume does not necessarily represent ore loss as this volume can be taken with the adjacent secondary or tertiary blasts. If a primary stope overbreaks, this simply means more tonnes are drawn, not a ‘negative’ ore loss offsetting true or loss within the same stope.
In 2005, the dilution and recovery figures, calculated in the above manner, were
4.5% and 92.5%, respectively. When applying this dilution to the CMS as-mined volumes for 2005, it was seen that an excellent correlation with the mill figures, indicating a validation of the block model and methodology for calculating dilution.
6.12 Dilution and Recovery Calculation Process MineSight 3-D software program and Cavity Monitoring System are the basic
tools for the calculation of dilution and recovery factors. The procedure for calculation of dilution and recovery/ore loss is as follows:
(1) Conduction of CMS survey of a stope (In this example, secondary stope of S880 N16 CMS data imported in MineSight 3D-software) (Figure 6.14).
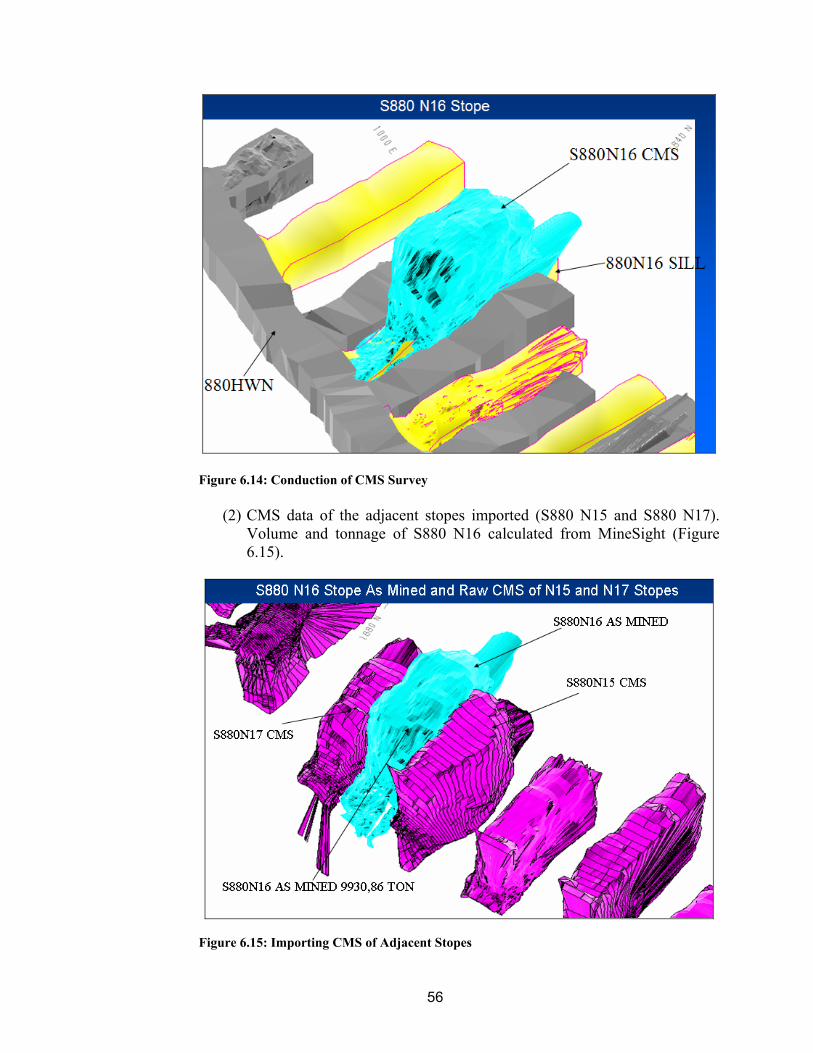
56
Figure 6.14: Conduction of CMS Survey
(2) CMS data of the adjacent stopes imported (S880 N15 and S880 N17).
Volume and tonnage of S880 N16 calculated from MineSight (Figure 6.15).
Figure 6.15: Importing CMS of Adjacent Stopes
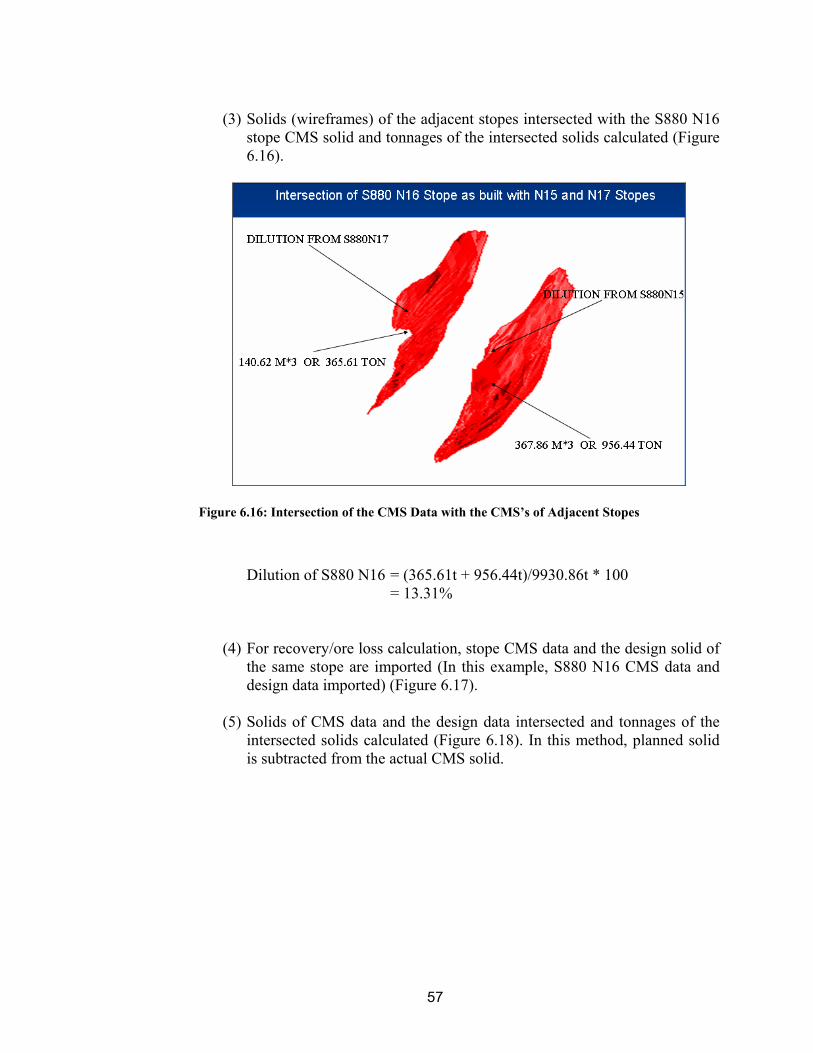
57
(3) Solids (wireframes) of the adjacent stopes intersected with the S880 N16
stope CMS solid and tonnages of the intersected solids calculated (Figure 6.16).
Figure 6.16: Intersection of the CMS Data with the CMS’s of Adjacent Stopes
Dilution of S880 N16 = (365.61t + 956.44t)/9930.86t * 100 = 13.31%
(4) For recovery/ore loss calculation, stope CMS data and the design solid of the same stope are imported (In this example, S880 N16 CMS data and design data imported) (Figure 6.17).
(5) Solids of CMS data and the design data intersected and tonnages of the
intersected solids calculated (Figure 6.18). In this method, planned solid is subtracted from the actual CMS solid.
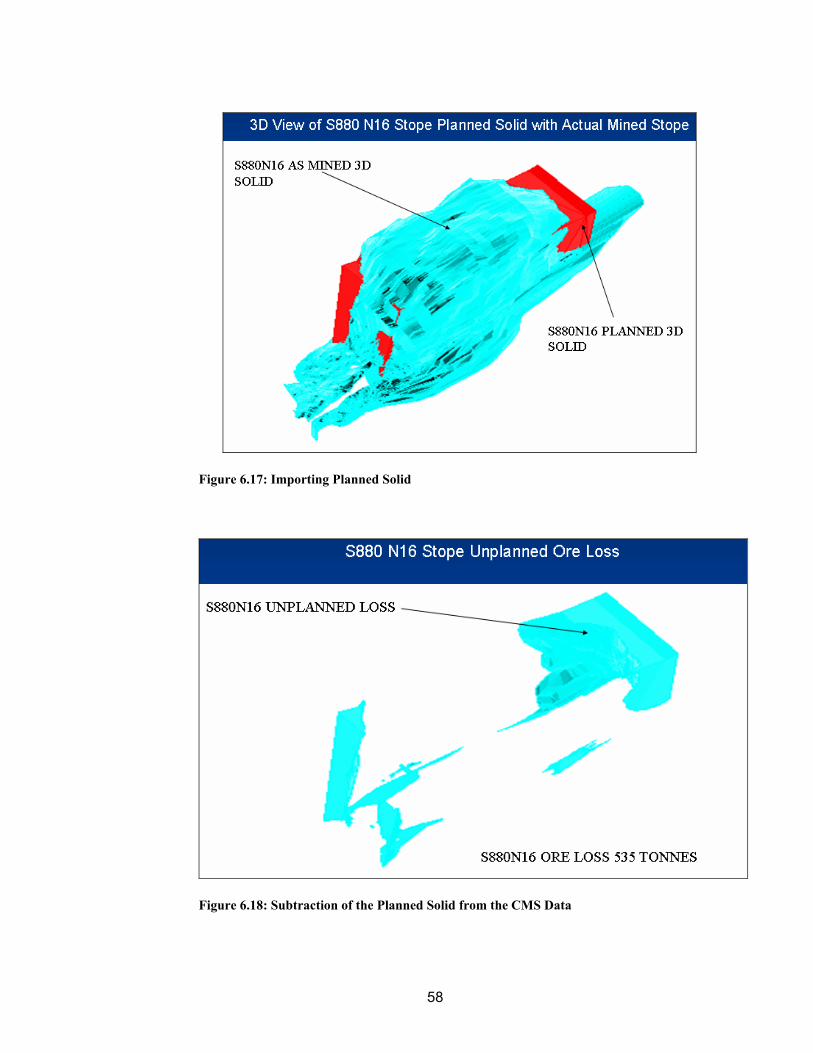
58
Figure 6.17: Importing Planned Solid
Figure 6.18: Subtraction of the Planned Solid from the CMS Data
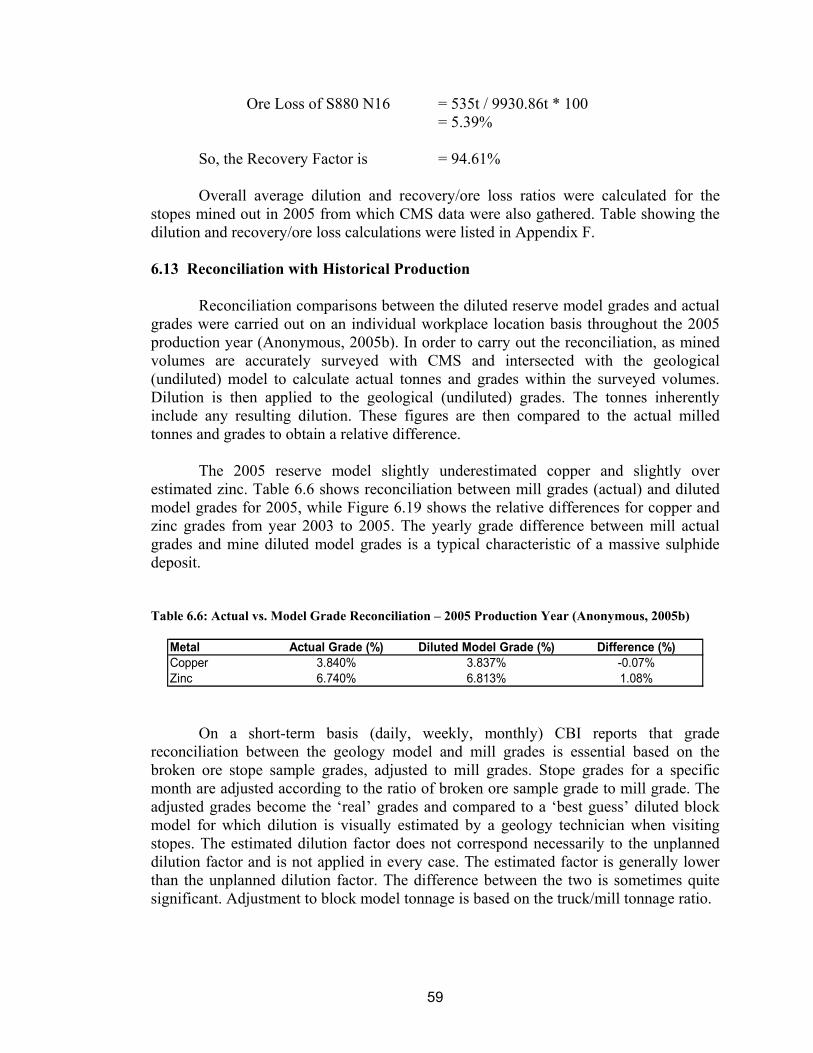
59
Ore Loss of S880 N16 = 535t / 9930.86t * 100 = 5.39%
So, the Recovery Factor is = 94.61% Overall average dilution and recovery/ore loss ratios were calculated for the
stopes mined out in 2005 from which CMS data were also gathered. Table showing the dilution and recovery/ore loss calculations were listed in Appendix F.
6.13 Reconciliation with Historical Production
Reconciliation comparisons between the diluted reserve model grades and actual
grades were carried out on an individual workplace location basis throughout the 2005 production year (Anonymous, 2005b). In order to carry out the reconciliation, as mined volumes are accurately surveyed with CMS and intersected with the geological (undiluted) model to calculate actual tonnes and grades within the surveyed volumes. Dilution is then applied to the geological (undiluted) grades. The tonnes inherently include any resulting dilution. These figures are then compared to the actual milled tonnes and grades to obtain a relative difference.
The 2005 reserve model slightly underestimated copper and slightly over
estimated zinc. Table 6.6 shows reconciliation between mill grades (actual) and diluted model grades for 2005, while Figure 6.19 shows the relative differences for copper and zinc grades from year 2003 to 2005. The yearly grade difference between mill actual grades and mine diluted model grades is a typical characteristic of a massive sulphide deposit.
Table 6.6: Actual vs. Model Grade Reconciliation – 2005 Production Year (Anonymous, 2005b)
Metal Actual Grade (%) Diluted Model Grade (%) Difference (%)Copper 3.840% 3.837% -0.07%Zinc 6.740% 6.813% 1.08%
On a short-term basis (daily, weekly, monthly) CBI reports that grade
reconciliation between the geology model and mill grades is essential based on the broken ore stope sample grades, adjusted to mill grades. Stope grades for a specific month are adjusted according to the ratio of broken ore sample grade to mill grade. The adjusted grades become the ‘real’ grades and compared to a ‘best guess’ diluted block model for which dilution is visually estimated by a geology technician when visiting stopes. The estimated dilution factor does not correspond necessarily to the unplanned dilution factor and is not applied in every case. The estimated factor is generally lower than the unplanned dilution factor. The difference between the two is sometimes quite significant. Adjustment to block model tonnage is based on the truck/mill tonnage ratio.
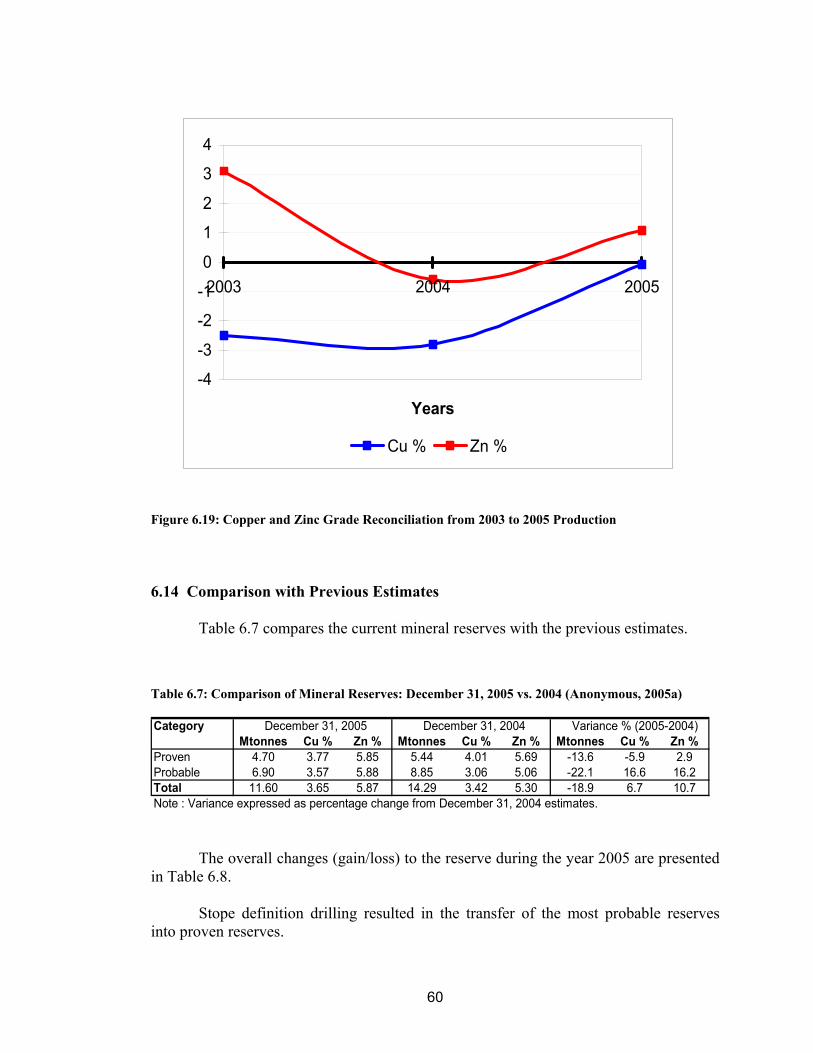
60
-4
-3
-2
-1
0
1
2
3
4
2003 2004 2005
Years
Cu % Zn %
Figure 6.19: Copper and Zinc Grade Reconciliation from 2003 to 2005 Production 6.14 Comparison with Previous Estimates
Table 6.7 compares the current mineral reserves with the previous estimates.
Table 6.7: Comparison of Mineral Reserves: December 31, 2005 vs. 2004 (Anonymous, 2005a)
Category December 31, 2005 December 31, 2004 Variance % (2005-2004)Mtonnes Cu % Zn % Mtonnes Cu % Zn % Mtonnes Cu % Zn %
Proven 4.70 3.77 5.85 5.44 4.01 5.69 -13.6 -5.9 2.9Probable 6.90 3.57 5.88 8.85 3.06 5.06 -22.1 16.6 16.2Total 11.60 3.65 5.87 14.29 3.42 5.30 -18.9 6.7 10.7Note : Variance expressed as percentage change from December 31, 2004 estimates.
The overall changes (gain/loss) to the reserve during the year 2005 are presented in Table 6.8.
Stope definition drilling resulted in the transfer of the most probable reserves
into proven reserves.
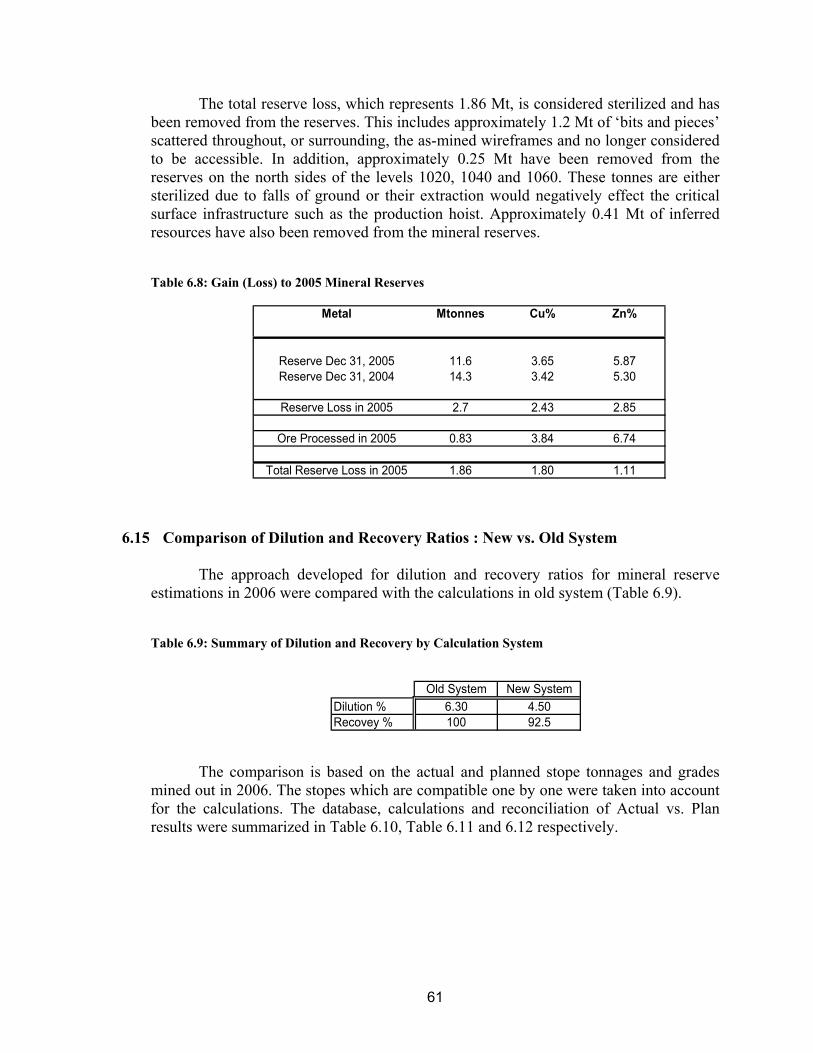
61
The total reserve loss, which represents 1.86 Mt, is considered sterilized and has been removed from the reserves. This includes approximately 1.2 Mt of ‘bits and pieces’ scattered throughout, or surrounding, the as-mined wireframes and no longer considered to be accessible. In addition, approximately 0.25 Mt have been removed from the reserves on the north sides of the levels 1020, 1040 and 1060. These tonnes are either sterilized due to falls of ground or their extraction would negatively effect the critical surface infrastructure such as the production hoist. Approximately 0.41 Mt of inferred resources have also been removed from the mineral reserves. Table 6.8: Gain (Loss) to 2005 Mineral Reserves
Metal Mtonnes Cu% Zn%
Reserve Dec 31, 2005 11.6 3.65 5.87Reserve Dec 31, 2004 14.3 3.42 5.30
Reserve Loss in 2005 2.7 2.43 2.85
Ore Processed in 2005 0.83 3.84 6.74
Total Reserve Loss in 2005 1.86 1.80 1.11
6.15 Comparison of Dilution and Recovery Ratios : New vs. Old System The approach developed for dilution and recovery ratios for mineral reserve
estimations in 2006 were compared with the calculations in old system (Table 6.9).
Table 6.9: Summary of Dilution and Recovery by Calculation System
Old System New SystemDilution % 6.30 4.50Recovey % 100 92.5
The comparison is based on the actual and planned stope tonnages and grades
mined out in 2006. The stopes which are compatible one by one were taken into account for the calculations. The database, calculations and reconciliation of Actual vs. Plan results were summarized in Table 6.10, Table 6.11 and 6.12 respectively.
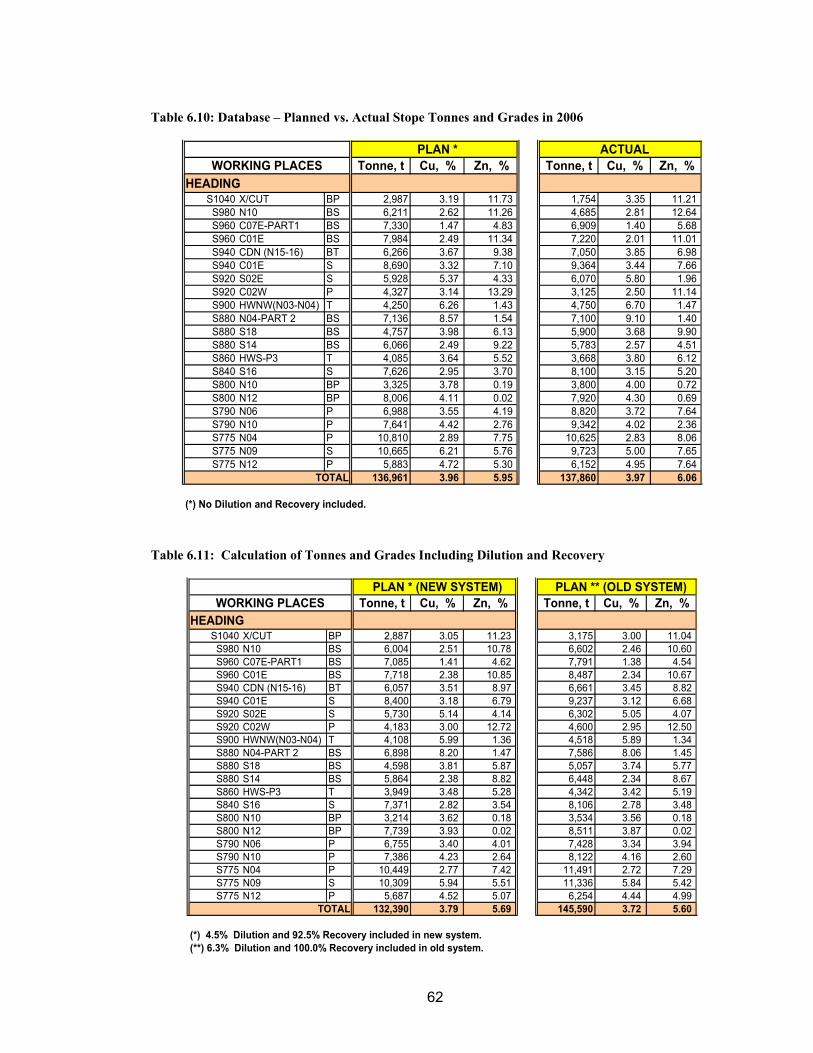
62
Table 6.10: Database – Planned vs. Actual Stope Tonnes and Grades in 2006
PLAN * ACTUALWORKING PLACES Tonne, t Cu, % Zn, % Tonne, t Cu, % Zn, %
HEADINGS1040 X/CUT BP 2,987 3.19 11.73 1,754 3.35 11.21
S980 N10 BS 6,211 2.62 11.26 4,685 2.81 12.64S960 C07E-PART1 BS 7,330 1.47 4.83 6,909 1.40 5.68S960 C01E BS 7,984 2.49 11.34 7,220 2.01 11.01S940 CDN (N15-16) BT 6,266 3.67 9.38 7,050 3.85 6.98S940 C01E S 8,690 3.32 7.10 9,364 3.44 7.66S920 S02E S 5,928 5.37 4.33 6,070 5.80 1.96S920 C02W P 4,327 3.14 13.29 3,125 2.50 11.14S900 HWNW(N03-N04) T 4,250 6.26 1.43 4,750 6.70 1.47S880 N04-PART 2 BS 7,136 8.57 1.54 7,100 9.10 1.40S880 S18 BS 4,757 3.98 6.13 5,900 3.68 9.90S880 S14 BS 6,066 2.49 9.22 5,783 2.57 4.51S860 HWS-P3 T 4,085 3.64 5.52 3,668 3.80 6.12S840 S16 S 7,626 2.95 3.70 8,100 3.15 5.20S800 N10 BP 3,325 3.78 0.19 3,800 4.00 0.72S800 N12 BP 8,006 4.11 0.02 7,920 4.30 0.69S790 N06 P 6,988 3.55 4.19 8,820 3.72 7.64S790 N10 P 7,641 4.42 2.76 9,342 4.02 2.36S775 N04 P 10,810 2.89 7.75 10,625 2.83 8.06S775 N09 S 10,665 6.21 5.76 9,723 5.00 7.65S775 N12 P 5,883 4.72 5.30 6,152 4.95 7.64
TOTAL 136,961 3.96 5.95 137,860 3.97 6.06
(*) No Dilution and Recovery included. Table 6.11: Calculation of Tonnes and Grades Including Dilution and Recovery
PLAN * (NEW SYSTEM) PLAN ** (OLD SYSTEM)WORKING PLACES Tonne, t Cu, % Zn, % Tonne, t Cu, % Zn, %
HEADINGS1040 X/CUT BP 2,887 3.05 11.23 3,175 3.00 11.04S980 N10 BS 6,004 2.51 10.78 6,602 2.46 10.60S960 C07E-PART1 BS 7,085 1.41 4.62 7,791 1.38 4.54S960 C01E BS 7,718 2.38 10.85 8,487 2.34 10.67S940 CDN (N15-16) BT 6,057 3.51 8.97 6,661 3.45 8.82S940 C01E S 8,400 3.18 6.79 9,237 3.12 6.68S920 S02E S 5,730 5.14 4.14 6,302 5.05 4.07S920 C02W P 4,183 3.00 12.72 4,600 2.95 12.50S900 HWNW(N03-N04) T 4,108 5.99 1.36 4,518 5.89 1.34S880 N04-PART 2 BS 6,898 8.20 1.47 7,586 8.06 1.45S880 S18 BS 4,598 3.81 5.87 5,057 3.74 5.77S880 S14 BS 5,864 2.38 8.82 6,448 2.34 8.67S860 HWS-P3 T 3,949 3.48 5.28 4,342 3.42 5.19S840 S16 S 7,371 2.82 3.54 8,106 2.78 3.48S800 N10 BP 3,214 3.62 0.18 3,534 3.56 0.18S800 N12 BP 7,739 3.93 0.02 8,511 3.87 0.02S790 N06 P 6,755 3.40 4.01 7,428 3.34 3.94S790 N10 P 7,386 4.23 2.64 8,122 4.16 2.60S775 N04 P 10,449 2.77 7.42 11,491 2.72 7.29S775 N09 S 10,309 5.94 5.51 11,336 5.84 5.42S775 N12 P 5,687 4.52 5.07 6,254 4.44 4.99
TOTAL 132,390 3.79 5.69 145,590 3.72 5.60
(*) 4.5% Dilution and 92.5% Recovery included in new system.(**) 6.3% Dilution and 100.0% Recovery included in old system.
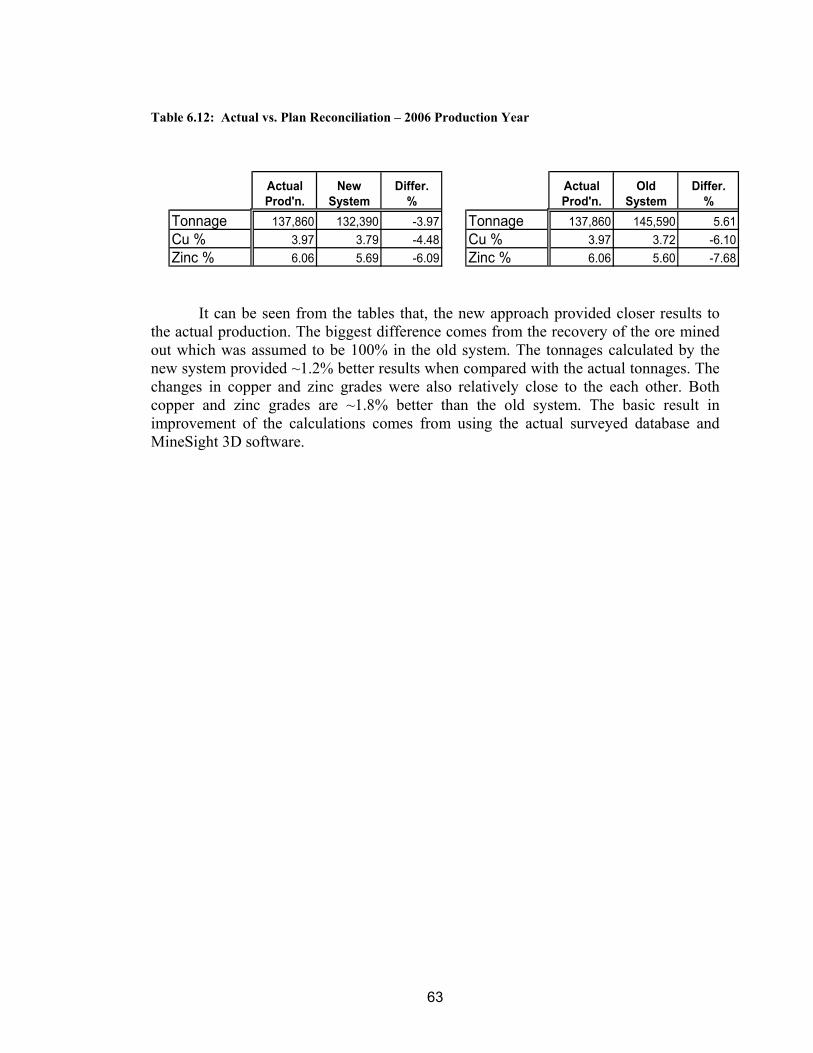
63
Table 6.12: Actual vs. Plan Reconciliation – 2006 Production Year
Actual New Differ. Actual Old Differ.Prod'n. System % Prod'n. System %
Tonnage 137,860 132,390 -3.97 Tonnage 137,860 145,590 5.61Cu % 3.97 3.79 -4.48 Cu % 3.97 3.72 -6.10Zinc % 6.06 5.69 -6.09 Zinc % 6.06 5.60 -7.68
It can be seen from the tables that, the new approach provided closer results to
the actual production. The biggest difference comes from the recovery of the ore mined out which was assumed to be 100% in the old system. The tonnages calculated by the new system provided ~1.2% better results when compared with the actual tonnages. The changes in copper and zinc grades were also relatively close to the each other. Both copper and zinc grades are ~1.8% better than the old system. The basic result in improvement of the calculations comes from using the actual surveyed database and MineSight 3D software.
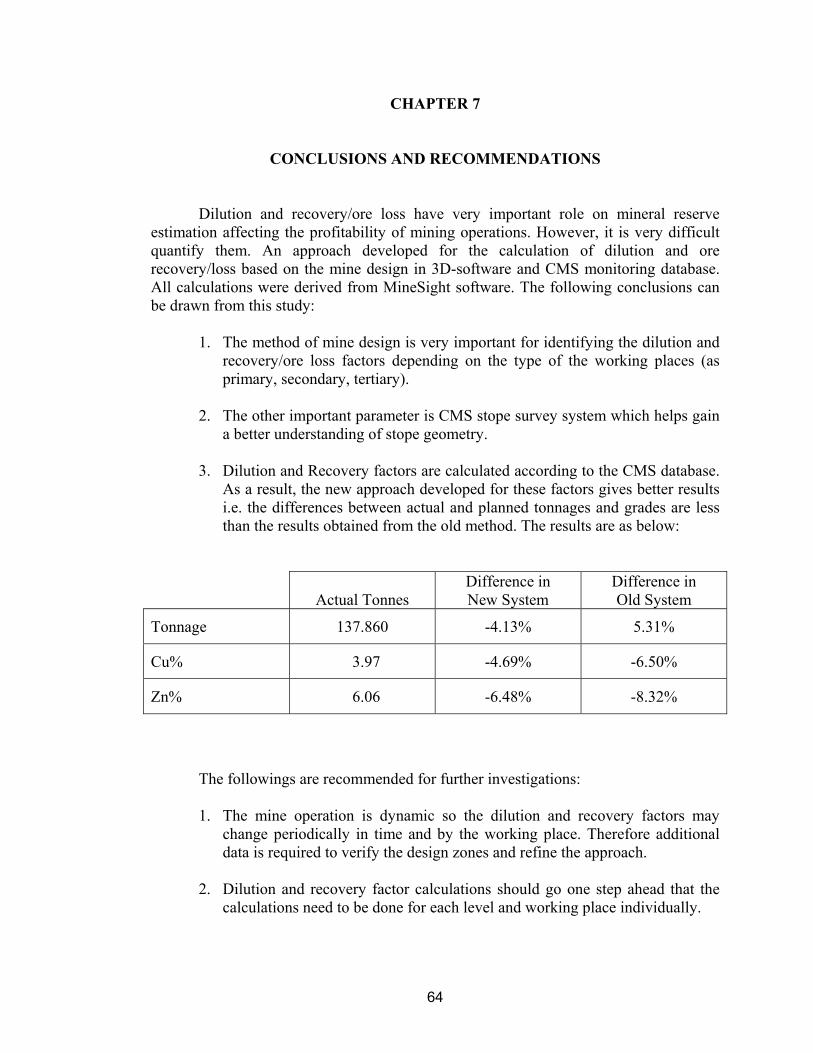
64
CHAPTER 7
CONCLUSIONS AND RECOMMENDATIONS
Dilution and recovery/ore loss have very important role on mineral reserve estimation affecting the profitability of mining operations. However, it is very difficult quantify them. An approach developed for the calculation of dilution and ore recovery/loss based on the mine design in 3D-software and CMS monitoring database. All calculations were derived from MineSight software. The following conclusions can be drawn from this study:
1. The method of mine design is very important for identifying the dilution and
recovery/ore loss factors depending on the type of the working places (as primary, secondary, tertiary).
2. The other important parameter is CMS stope survey system which helps gain
a better understanding of stope geometry.
3. Dilution and Recovery factors are calculated according to the CMS database. As a result, the new approach developed for these factors gives better results i.e. the differences between actual and planned tonnages and grades are less than the results obtained from the old method. The results are as below:
Actual Tonnes Difference in New System
Difference in Old System
Tonnage 137.860 -4.13% 5.31%
Cu% 3.97 -4.69% -6.50%
Zn% 6.06 -6.48% -8.32%
The followings are recommended for further investigations: 1. The mine operation is dynamic so the dilution and recovery factors may
change periodically in time and by the working place. Therefore additional data is required to verify the design zones and refine the approach.
2. Dilution and recovery factor calculations should go one step ahead that the
calculations need to be done for each level and working place individually.
65
REFERENCES Anonymous, 1994. “Technical Report on the Mine Geology at the Cayeli Mine”, Inmet
Mining Corporation ,Turkey. Anonymous, 2005a. “Technical Report on the Mineral Resource and Mineral Reserve
Estimates at the Cayeli Mine”, Inmet Mining Corporation ,Turkey. Anonymous, 2005b. “Monthly Reconciliation and Report Preparation Procedure”, Inmet
Mining Corporation, Turkey. Anonymous, 2006. “Mine Valuation Lecture Notes”, METU Mining Engineering
Department, Turkey. Clark, L. M. and Pakalnis, R. C., 1997. “An Empirical Design Approach for Estimating
Unplanned Dilution from Open Stope Hangingwalls and Footwalls”, Canada. Optech Systems Corporation, 1996. “Cavity Monitoring System (CMS)”, User Manual,
Version 2.3, May 1996, North York (Toronto), Ontario, Canada. Ohmoto, H. and Skinner, B. J., 1983. “The Kuroko and Related Volcanogenic Massive
Sulphide Deposits”, The Economic Geology Publishing Company, New Heaven, CT., p.604.
Pakalnis, R. C., Poulin, R. and Hadjigeorgiou, J., 1995.“Quantifying the Cost of Dilution
in Underground Mines, SME Annual Meeting, Denver, CO. Parker, H., 2006. “Resource Audits: Visions for the Future”, Mintec User Seminar,
March 2006, Tucson-Arizona. Postle, J., Haystead, B., Clow, G., Hora, D., Vallee, M. and Jensen, M., 2000. “CIM
Standards on Mineral Resources and Reserves, Canadian Institute of Mining, Metallurgy and Petroleum, Canada.
Scoble, M. J. and Moss, A., 1994. “Dilution in Underground Bulk Mining: Implications
for Production Management”, Geological Society Special Publication, No.79, Canada.
Yumlu, M., 2001. “Cayeli Underground Cu-Zn Mine”, IMCET 2001, 17th International
Mining Congress and Exhibition of Turkey, June 19-22, 2001, Ankara-Turkey.
66
APPENDIX A
CANADIAN INSTITUTE OF MINING, METALLURGY AND PETROLEUM
CIM STANDARDS ON MINERAL RESOURCES AND RESERVES
DEFINITIONS AND GUIDELINES
Prepared By The
CIM Standing Committee
On Reserve Definitions
Adopted by CIM;' Council August 20, 2000
John Postle Bernie Haystead
Graham Clow Dan Hora
Marcel Vallee
Maureen Jensen
67
INTRODUCTION The Committee's proposed standards establish definitions and guidelines for the reporting of Exploration Information, Mineral Resources and Mineral Reserves in Canada and are identified as the "CIM Standards" and referred to as such hereafter in this document. To provide additional clarification to Qualified Persons, guidelines have been included with the respective definitions. All definitions are printed in bold text, whereas the guidelines are printed in italics. The CIM Standards are applicable to all minerals including industrial minerals, diamonds and other gemstones. Reserve definitions for bitumen, natural gas and oil are not included in these Standards. The CIM Standards are not intended to cover mineral inventory estimates that will be reported to government agencies. CIM STANDARDS The CIM Standards presented herein provide guidelines for the classification of Mineral Resource and Mineral Reserve estimates into various categories. The category of an estimate implies confidence in the geological information available on the mineral deposit; the quality and quantity of data available on the deposit; the level of detail of the technical and economic information which has been generated about the deposit, and the interpretation of the data and information. HISTORY The Canadian Institute of Mining, Metallurgy and Petroleum (CIM) published "Mineral Resource Reserve Classification: Categories, Definitions, and Guidelines" in September 1996. This report, prepared by the CIM Ad Hoc Committee on Reserve Definitions, is now widely used as a reference and a system for classifying and reporting Resources and Reserves in Canada. Since the publication of that report there have been several meetings sponsored by the Council of Mining and Metallurgical Institutes (CMMI) of which CIM is a member, to develop a Resource/Reserve classification, definition and reporting system that would be similar in Australia, Canada, Great Britain, South Africa and the United States.
68
The recent history of the development of Resource and Reserve definitions in Canada was discussed in the Ad Hoc Committee Report and is summarized as follows:
• The most widely accepted Canadian reserve classification system through the
period 1970 to date has been the one required by the Canadian Securities
Administrators (CSA) under National Policy 2-A.
• Geological Circular 831, Principles of a Resource/Reserve Classification for
Minerals, which was published in 1980 by the U.S. Bureau of Mines and the U.S. Geological Survey, introduced a classification system that distinguished between resources and reserves.
• The Australian Code for Reporting of Identified Mineral Resources and Ore
Reserves (the JORC code), first published in 1989, was similar to the U.S. system in structure but included some important modifications, particularly by including reference to the competence of the person responsible for a resource or reserve estimate. This code prescribed reporting requirements.
• In 1991, CIM, through its Mineral Economics Society, formed a Special
Committee on Reserve Definitions. The report of the Special Committee was presented to CIM Council in May 1994 and published in October 1994. In June 1994, CIM established an Ad Hoc Committee to review and revise the Special
Committee Report.
• The Society of Mining Engineers in the United States issued “A Guide for Reporting Exploration Information, Resources and Reserves” in 1994.
The Ad Hoc Committee report was accepted by CIM Council in February 1996 and at that time Council established a Standing Committee (the Committee) on Reserve Definitions administered by the Mineral Economics Society. The Ad Hoc Committee Report was published in the September 1996 CIM Bulletin. In 1993, CMMI sponsored an initiative to obtain consensus on the resource/reserve
69
definitions used in Australia, Canada, Great Britain, South Africa and the United States. The CMMI reserve definition committee met in 1994 and again in November 1997 in Denver, Colorado. At the Denver meeting in 1997, the representatives agreed on definitions for the major Mineral Resource and/or Reserve categories. The proposed CMMI definitions were published in the CIM Bulletin in February 1998.
The Australasian Institute of Mining and Metallurgy (AusIMM) and the Joint Ore Reserves Committee (JORC) of the AusIMM, the Australian Institute of Geoscientists and the Minerals Council of Australia published a revised draft JORC Code in July 1998. This document proposed the use of the CMMI definitions, with some wording changes. In January 1999, the JORC Code was published, to take effect in September 1999. The SME published revised definitions in January 1999 which follows the CMMI definitions. These definitions have not been adopted for use in the United States by the Securities and Exchange Commission, at this point. The United Nations Economic Commission for Europe (UN-ECE) published a "United Nations International Framework - Classification for Reserves/Resources" in November 1996. This report is very complex and utilizes ten different categories for classifying resources and reserves. In October 1998, CMMI and UN-ECE representatives met and agreed to use the CMMI definitions in the UN-ECE classification system for the five categories of resources and reserves with the UN-ECE definitions for the remaining UN-ECE categories being retained and used for reporting national mineral inventories. In Canada in June 1997, the Ontario Securities Commission (OSC) and the Toronto Stock Exchange (TSE) established the Mining Standards Task Force (MSTF). The MSTF released a draft report in June 1998 and a final report entitled "Setting New Standards" in January 1999. One of the primary recommendations of the MSTF Report was the "adoption, by the Canadian Securities Administrators in National Instrument 43-101, of the CIM guidelines for the estimation, classification and reporting of resources and reserves, as amended from time to time". On July 3, 1998, the Canadian Security Administrators (CSA) published a first draft of National Instrument 43-101 (NI 43-101) as the replacement for National Policy 2-A and National Policy 22. A second draft was published on March 27, 2000. The CIM
70
and the CIM Standing Committee have provided substantial commentary on the 43-101 drafts, particularly in the area of Mineral Resource and Mineral Reserve definitions. The following proposed CIM standards include many significant changes to the CIM Ad Hoc Committee Report including the inclusion of modified CMMI definitions for Resource and Reserve categories and the elimination of the Possible Reserve category. In addition, these proposed standards have used the JORC Code description material for guidelines for reports that include discussion of tonnage and grades of mine fill, stockpiles, remnants, pillars and low grade mineralization with appropriate modifications. The proposed CIM Standards also reference Paper 88 -21 of the Geological Survey of Canada for the reporting of coal resources and reserves and the report, Reporting of Diamond Exploration Results, Identified Mineral Resources and Ore Reserves published by the Association of Professional Engineers, Geologists and Geophysicists of the Northwest Territories. DEFINITIONS Throughout the CIM Standards, where appropriate, 'quality' may be substituted for 'grade' and 'volume' may be substituted for 'tonnage' Qualified Person Mineral Resource and Mineral Reserve estimates and resulting Technical Reports must be prepared by or under the direction of, and dated and signed by, a Qualified Person. A "Qualified Person" means an individual who is an engineer or geoscientist with at least five years of experience in mineral exploration, mine development, production activities and project assessment, or any combination thereof, including experience relevant to the subject matter of the project or report and is a member in good standing of a Self-Regulating Organization. The Qualified Person(s) should be clearly satisfied that they could face their peers and demonstrate competence and relevant experience in the commodity, type of deposit and
71
situation under consideration. If doubt exists, the person must either seek or obtain opinions from other colleagues or demonstrate that he or she has obtained assistance from experts in areas where he or she lacked the necessary expertise. Determination of what constitutes relevant experience can be a difficult area and common sense has to be exercised. For example, in estimating Mineral Resources for vein gold mineralization, experience in a high-nugget, vein-type mineralization such as tin, uranium etc. should be relevant whereas experience in massive base metal deposits may not be. As a second example, for a person to qualify as a Qualified Person in the estimation of Mineral Reserves for alluvial gold deposits, he or she would need to have relevant experience in the evaluation and extraction of such deposits. Experience with placer deposits containing minerals other than gold, may not necessarily provide appropriate relevant experience for gold. In addition to experience in the style of mineralization, a Qualified Person preparing or taking responsibility for Mineral Resource estimates must have sufficient experience in the sampling, assaying, or other property testing techniques that are relevant to the deposit under consideration in order to be aware of problems that could affect the reliability of the data. Some appreciation of extraction and processing techniques applicable to that deposit type might also be important. Estimation of Mineral Resources is often a team effort, for example, involving one person or team collecting the data and another person or team preparing the Mineral Resource estimate. Within this team, geologists usually occupy the pivotal role. Estimation of Mineral Reserves is almost always a team effort involving a number of
technical disciplines, and within this team mining engineers have an important role. Documentation for a Mineral Resource and Mineral Reserve estimate must be compiled by, or under the supervision of, a Qualified Person(s), whether a geologist, mining engineer or member of another discipline. It is recommended that, where there is a clear
division of responsibilities within a team, each Qualified Person should accept responsibility for his or her particular contribution. For example, one Qualified Person could accept responsibility for the collection of Mineral Resource data, another for the Mineral Reserve estimation process, another for the mining study, and the project leader
72
could accept responsibility for the overall document. It is important that the Qualified Person accepting overall responsibility for a Mineral Resource and/or Mineral Reserve estimate and supporting documentation, which has been prepared in whole or in part by others, is satisfied that the other contributors are Qualified Persons with respect to the work for which they are taking responsibility and such persons are provided adequate documentation. Preliminary Feasibility Study The CIM Standards describe completion of a Preliminary Feasibility Study as the minimum prerequisite for the conversion of Mineral Resources to Mineral Reserves. A Preliminary Feasibility Study is a comprehensive study of the viability of a mineral project that has advanced to a stage where the mining method, in the case of underground mining, or the pit configuration, in the case of an open pit, has been established, and where an effective method of mineral processing has been determined. This Study must include a financial analysis based on reasonable assumptions of technical, engineering, operating, and economic factors and evaluation of other relevant factors which are sufficient for a Qualified Person acting reasonably, to determine if all or part of the Mineral Resource may be classified as a Mineral Reserve.
Exploration Information For the purposes of this report, Exploration Information is a term used to describe information derived from initial activities undertaken to locate and investigate a prospect or deposit and resulting estimates of tonnage and grade that cannot be classified as a Mineral Resource or a Mineral Reserve. If a Qualified Person reports Exploration Information in the form of tonnage and grade, it must be clearly stated that these estimates are conceptual or order of magnitude. It is recognized that in the review and compilation of data on a project or property, previous or historical estimates of tonnage and grade, not meeting the minimum
73
requirement for Mineral Resources, may be encountered. If these estimates are referenced, it must be clearly stated that these estimates are order-of-magnitude and expressed so as not to misrepresent them as an estimate of Mineral Resources or Mineral Reserves. Mineral Resource Mineral Resources are sub-divided, in order of increasing geological confidence, into Inferred, Indicated and Measured categories. An Inferred Mineral Resource has a lower level of confidence than that applied to an Indicated Mineral Resource. An Indicated Mineral Resource has a higher level of confidence than an Inferred Mineral Resource but has a lower level of confidence than a Measured Mineral Resource. A Mineral Resource is a concentration or occurrence of natural, solid, inorganic or fossilized organic material in or on the Earth's crust in such form and quantity and of such a grade or quality that it has reasonable prospects for economic extraction. The location, quantity, grade, geological characteristics and continuity of a Mineral Resource are known, estimated or interpreted from specific geological evidence and knowledge. The term Mineral Resource covers mineralization and natural material of intrinsic economic interest which has been identified and estimated through exploration and sampling and within which Mineral Reserves may subsequently be defined by the consideration and application of technical, economic, legal, environmental, socio-economic and governmental factors. The phrase 'reasonable prospects for economic extraction' implies a judgement by the Qualified Person in respect of the technical and economic factors likely to influence the prospect of economic extraction. A Mineral Resource is an inventory of mineralization that under realistically assumed and justifiable technical and economic conditions, might become economically extractable. These assumptions must be presented explicitly in both public and technical reports. Inferred Mineral Resource An 'Inferred Mineral Resource' is that part of a Mineral Resource for which
74
quantity and grade or quality can be estimated on the basis of geological evidence and limited sampling and reasonably assumed, but not verified, geological and grade continuity. The estimate is based on limited information and sampling gathered through appropriate techniques from locations such as outcrops, trenches, pits, workings and drill holes. Due to the uncertainty which may attach to Inferred Mineral Resources, it cannot be assumed that all or any part of an Inferred Mineral Resource will be upgraded to an Indicated or Measured Mineral Resource as a result of continued exploration. Confidence in the estimate is insufficient to allow the meaningful application of technical and economic parameters or to enable an evaluation of economic viability worthy of public disclosure. Inferred Mineral Resources must be excluded from estimates forming the basis of feasibility or other economic studies. Indicated Mineral Resource An 'Indicated Mineral Resource' is that part of a Mineral Resource for which quantity, grade or quality, densities, shape and physical characteristics, can be estimated with a level of confidence sufficient to allow the appropriate application of technical and economic parameters, to support mine planning and evaluation of the economic viability of the deposit. The estimate is based on detailed and reliable exploration and testing information gathered through appropriate techniques from locations such as outcrops, trenches, pits, workings and drill holes that are spaced closely enough for geological and grade continuity to be reasonably assumed. Mineralization may be classified as an Indicated Mineral Resource by the Qualified Person when, the nature, quality, quantity and distribution of data are such as to allow confident interpretation of the geological framework and to reasonably assume the continuity of mineralization. The Qualified Person must recognize the importance of the Indicated Mineral Resource category to the advancement of the feasibility of the project. An Indicated Mineral Resource estimate is of sufficient quality to support a Preliminary Feasibility Study which can serve as the basis for major development decisions.
75
Measured Mineral Resource A 'Measured Mineral Resource' is that part of a Mineral Resource for which quantity, grade or quality, densities, shape, physical characteristics are so well established that they can be estimated with confidence sufficient to allow the appropriate application of technical and economic parameters, to support production planning and evaluation of the economic viability of the deposit. The estimate is based on detailed and reliable exploration, sampling and testing information gathered through appropriate techniques from locations such as outcrops, trenches, pits, workings and drill holes that are spaced closely enough to confirm both geological and grade continuity. Mineralization or other natural material of economic interest may be classified as a Measured Mineral Resource by the Qualified Person when the nature, quality, quantity and distribution of data are such that the tonnage and grade of the mineralization can be estimated to within close limits and that variation from the estimate would not significantly affect potential economic viability. This category requires a high level of confidence in, and understanding of, the geology and controls of the mineral deposit. Mineral Reserve Mineral Reserves are sub-divided in order of increasing confidence into Probable Mineral Reserves and Proven Mineral Reserves. A Probable Mineral Reserve has a lower level of confidence than a Proven Mineral Reserve. A Mineral Reserve is the economically mineable part of a Measured or Indicated Mineral Resource demonstrated by at least a Preliminary Feasibility Study. This Study must include adequate information on mining, processing, metallurgical, economic and other relevant factors that demonstrate, at the time of reporting, that economic extraction can be justified. A Mineral Reserve includes diluting materials and allowances for losses that may occur when the material is mined.
76
Mineral Reserves are those parts of Mineral Resources which, after the application of all mining factors, result in an estimated tonnage and grade which, in the opinion of the Qualified Person(s) making the estimates, is the basis of an economically viable project after taking account of all relevant processing, metallurgical, economic, marketing, legal, environment, socio-economic and government factors. Mineral Reserves are inclusive of diluting material that will be mined in conjunction with the Mineral Reserves and delivered to the treatment plant or equivalent facility. The term 'Mineral Reserve' need not necessarily signify that extraction facilities are in place or operative or that all governmental approvals have been received. It does signify that there are reasonable expectations of such approvals. Probable Mineral Reserve A 'Probable Mineral Reserve' is the economically mineable part of an Indicated, and in some circumstances a Measured Mineral Resource demonstrated by at least a Preliminary Feasibility Study. This Study must include adequate information on mining, processing, metallurgical, economic, and other relevant factors that demonstrate, at the time of reporting, that economic extraction can be justified. Proven Mineral Reserve A 'Proven Mineral Reserve' is the economically mineable part of a Measured Mineral Resource demonstrated by at least a Preliminary Feasibility Study. This Study must include adequate information on mining, processing, metallurgical, economic, and other relevant factors that demonstrate, at the time of reporting, that economic extraction is justified. Application of the Proven Mineral reserve category implies t at the Qualified Person has the highest degree of confidence in the estimate with the consequent expectation in the minds of the readers of the report. The term should be restricted to that part of the deposit where production planning is taking place and for which any variation in the estimate would not significantly affect potential economic viability.
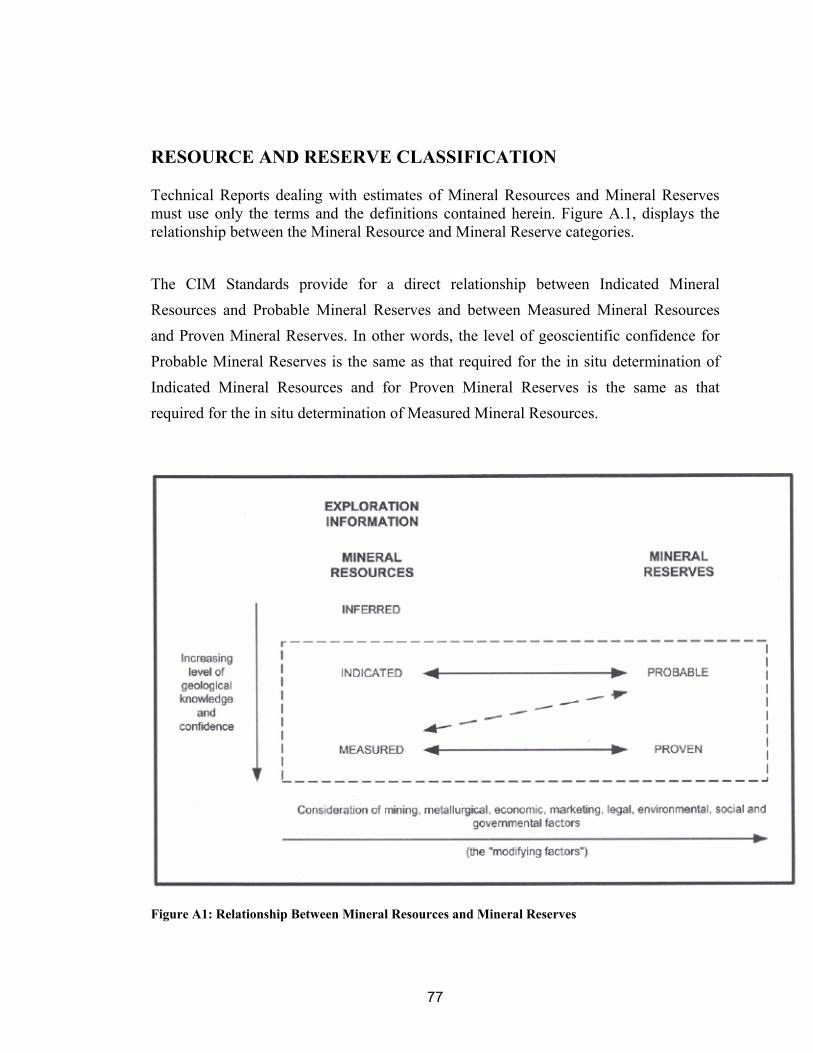
77
RESOURCE AND RESERVE CLASSIFICATION Technical Reports dealing with estimates of Mineral Resources and Mineral Reserves must use only the terms and the definitions contained herein. Figure A.1, displays the relationship between the Mineral Resource and Mineral Reserve categories.
The CIM Standards provide for a direct relationship between Indicated Mineral Resources and Probable Mineral Reserves and between Measured Mineral Resources and Proven Mineral Reserves. In other words, the level of geoscientific confidence for Probable Mineral Reserves is the same as that required for the in situ determination of Indicated Mineral Resources and for Proven Mineral Reserves is the same as that required for the in situ determination of Measured Mineral Resources.
Figure A1: Relationship Between Mineral Resources and Mineral Reserves
78
Figure A.1 sets out the framework for classifying tonnage and grade estimates so as to reflect different levels of geological confidence and different degrees of technical and economic evaluation. Mineral Resources can be estimated by a Qualified Person, with input from persons in other disciplines, as necessary, on the basis of geoscientific information and reasonable assumptions of technical and economic factors likely to influence the prospect of economic extraction. Mineral Reserves, which are a modified sub-set of the Indicated and Measured Mineral Resources (shown within the dashed outline in Figure A.1), require consideration of factors affecting profitable extraction, including mining, processing, metallurgical, economic, marketing, legal, environmental, socio-economic and governmental factors, and should be estimated with input from a range of disciplines. Additional testwork, e.g. metallurgy, mining, environmental is required to classify a resource as a reserve. In certain situations, Measured Mineral Resources could convert to Probable Mineral Reserves because of uncertainties associated with the modifying factors that are taken into account in the conversion from Mineral Resources to Mineral Reserves. This relationship is shown by the dashed arrow in Figure A.1 (although the trend of the dashed arrow includes a vertical component, it does not, in this instance, imply a reduction in the level of geological knowledge or confidence). In such a situation these modifying factors should be fully explained. Under no circumstances can an Indicated Resources convert directly to Proven Reserves. In certain situations previously reported Mineral Reserves could revert to Mineral Resources. It is not intended that re-classification from Mineral Reserves to Mineral Resources should be applied as a result of changes expected to be of a short term or temporary nature, or where company management has made a deliberate decision to operate in the short term on a noneconomic basis. Examples of such situations might be a commodity price drop expected to be of short duration, mine emergency of a non-permanent nature, transport strike etc.
79
GUIDANCE FOR REPORTING MINERAL RESOURCE AND MINERAL RESERVE INFORMATION Qualified Persons preparing public reports must follow the requirements in Form 43-101Fl of National Instrument 43-101, a preliminary draft of which was published by the Canadian Securities Administrators on March 24, 2000. A copy of the draft Form is available on the following websites: www.osc.gov.ca; www.bcsc.bc.ca; www.albertasecurities.com and www.cvmq.com. The following discussion is included for additional guidance when preparing a Technical Report. For the CIM Standards a Technical Report is defined as a report that contains the relevant supporting documentation, estimation procedures and description of the Exploration Information, or the Mineral Resources/and Mineral Reserve estimate. The CIM standards recognize the importance of quality Resource and Reserve estimates to the profitable operation of a mine. The CIM Standards encourage practitioners to strive for excellence in the preparation of these estimates. A Technical Report, with documentation describing the estimates of Mineral Resources and Mineral Reserves must be prepared by or under the direction of, and dated and signed by, a Qualified Person(s). When undertaking exploration programs and generating information required to prepare Mineral Resource and Mineral Reserve estimates, Qualified Persons must comply with the Mineral Exploration "Best Practices" Guidelines prepared by the Mineral Industry Best Practices Committee (Table A2). Qualified Persons are encouraged to provide information that is as comprehensive as possible in their Technical Reports on Exploration Information, Mineral Resources and Mineral Reserves. Table A1 provides, in a summary form, a list of the main criteria which should be considered when reporting Exploration Information, Mineral Resources and Mineral Reserve estimates. All of these criteria need not be discussed unless they materially affect estimation or classification of the Mineral Resources and Mineral Reserves. Certain fundamental data such as commodity price used, cut-off grade (where applicable) must be disclosed. Table A1 is a checklist, and is not prescriptive. While it may not be necessary to
80
comment on each item in the table, the need for comment on each item should be considered. It is essential to discuss any matters that might materially affect the reader's understanding of the estimates being reported. Problems encountered in the collection of data or with the sufficiency of data must be clearly disclosed at all times, particularly when they affect directly the reliability of, or confidence in, a statement of Exploration Information or an estimate of Mineral Resources and Mineral Reserves; for example, poor sample recovery, poor repeatability of assay or laboratory results, limited information on tonnage factors etc. Mineral Resource or Mineral Reserve estimates are sometimes reported after adjustment by cutting of high grades or after the application of modifying factors arising from reconciliation with mill data. If any of the data are materially adjusted or modified for the purpose of making the estimate, the nature of the adjustment or modification should be clearly described. Mineral Resource and Mineral Reserve estimates are not precise calculations, being dependent on the interpretation of limited information on the location, shape and continuity of the occurrence and on the available sampling results. To emphasize the imprecise nature of a Mineral Resource or Mineral Reserve estimate, the final result should always be referred to as an estimate, not a calculation. Reporting of tonnage and grade figures should reflect the order of accuracy of the estimate by rounding off to appropriately significant figures. There will be occasions, however, where rounding to one significant figure may be necessary in order to convey properly the uncertainties in estimation. This would usually be the case with Inferred Mineral Resources. Technical Reports of a Mineral Resource must specify one or more of the categories of ‘Inferred’, ‘Indicated’ and ‘Measured’ and Technical Reports of Mineral Reserves must specify one or both of the categories of ‘Proven’ and ‘Probable’. Categories must not be reported in a combined form unless details for the individual categories are also provided. Inferred Mineral Resources cannot be combined with other categories and must always be reported separately. Mineral Resources must never be added to Mineral
81
Reserves and reported as total Resources and Reserves. Mineral Resources and Mineral Reserves must not be reported in terms of contained metal or mineral content unless corresponding tonnages, grades and mining, mineral processing and metallurgical recoveries are also presented.
In situations where estimates for both Mineral Resources and Mineral Reserves are reported, a clarifying statement must be included in the report that clearly indicates whether Mineral Reserves are part of the Mineral Resource or if they have been removed from the Mineral Resources. Mineral Resources and Mineral Reserves must be reported on a site by site basis. The CIM Standards recognize that there are legitimate reasons, in some situations, for reporting Mineral Resources inclusive of Mineral Reserves (the Australian approach) and, in other situations, for reporting Mineral Resources additional to Mineral Reserves (the South African and United States approach). The CIM Standards do not express a preference but do require that reporting companies make it clear which form of reporting has been adopted. A single form of reporting should be used in a report. Appropriate forms of clarifying statements may be:
‘The Measured and Indicated Mineral Resources are inclusive of those Mineral
Resources modified to produce the Mineral Reserves.’
or ‘The Measured and Indicated Mineral Resources are additional to the Mineral Reserves.’ Inferred Mineral Resources are, by definition, always additional to Mineral Reserves.
Mineral Reserves may incorporate material (dilution) which is not part of the original Mineral Resource or exclude material (mining losses) that is included in the original Mineral Resource. It is essential that these fundamental differences between Mineral Resources and Mineral Reserves be noted and caution exercised when attempting to
draw conclusions from a comparison of the two.
82
In preparing a Mineral Reserve report, the relevant Mineral Resource report on which it is based should first be developed. This can be reconciled with the Mineral Resource report estimated for the previous comparable period and differences (due, for example, to mine production, exploration, etc.) identified. The application of mining and- other criteria to the Mineral Resource can then be made to develop the Mineral Reserve statement that can also be reconciled with the previous comparable report. A detailed account of differences between estimates is not essential, but sufficient comment should be made to enable significant variances to be understood by the reader. Reconciliation of estimates with production whenever possible is required. Where Mineral Reserve estimates are reported, information on assumed metal or mineral prices, operating costs and mineral processing/metallurgical recovery factors is very important, and should always be included in Technical Reports. Reports must continue to refer to the appropriate category or categories of Mineral Resources until technical feasibility and economic viability have been established. If re-evaluation indicates that the Mineral Reserves are no longer viable, the Mineral Reserves may be reclassified as Mineral Resources, if appropriate, or removed from Mineral Resource and Mineral Reserve statements. The Committee is generally opposed to the reporting of metal equivalence. However, if reporting is carried out in this way, the appropriate correlation formulae including assumed metal prices, metallurgical recovery, comparative smelter charges, likely losses, payable metals, etc. must be included. Mineralized stope fill and stockpiles of mineralized material should be considered to be similar to in situ mineralization when reporting Mineral Resources and Mineral Reserves. Consequently the Qualified Person assessing the fill or stockpiles must use the basis of classification outlined in the CIM Standards. In most cases, the opinion of a mining engineer should be sought when making judgements about the mineability of fill, remnants and pillars. If there are not reasonable prospects for the eventual economic extraction of a particular portion of the fill or stockpile, this material cannot be classified as either Mineral Resources or Mineral Reserves. If some portion is currently sub-economic but there is a reasonable expectation that it will become economic, then
83
this material may be classified as a Mineral Resource. Such stockpile material may include old dumps and tailings material. If technical and economic studies of at least a Preliminary Feasibility Study standard have demonstrated that economic extraction could reasonably be justified under realistically assumed conditions, the material may be classified as a Mineral Reserve. The above guidelines apply equally to low grade in situ mineralization, sometimes referred to as 'mineralized waste' or 'marginal grade material’, and often intended for stockpiling and treatment towards the end of mine life. For clarity of understanding, it is recommended that tonnage and grade estimates of such material be itemized separately in Technical Reports, although they may be aggregated with total Mineral Resource and Mineral Reserve figures. Stockpiles are defined to include both surface and underground stockpiles, including broken ore in stopes, and can include ore currently in the ore storage system. Mineralized material being processed (including leaching), if reported, should be reported separately. Mineralized remnants, shaft pillars and mining pillars which are potentially mineable are in situ mineralization and consequently are included in the CIM Standards definitions of Mineral Resources and Mineral Reserves. Mineralized remnants, shaft pillars and mining pillars which are not potentially mineable must not be included in Mineral Resource and Mineral Reserve statements. REPORTING OF COAL RESERVES Coal resource and reserve estimates should conform to the definitions and guidelines on Paper 88-21 of the Geological Survey of Canada: "A Standardized Coal Resource/Reserve Reporting System for Canada". REPORTING OF INDUSTRIAL MINERALS When reporting Mineral Resource and Mineral Reserve estimates relating to an
84
industrial mineral site, the Qualified Person(s) must make the reader aware of certain special properties of these commodities. An Industrial Mineral is any rock, mineral or other naturally occurring substance of economic value, exclusive of metallic ores, mineral fuels and gemstones; that is one of the non-metallic minerals. To assist Qualified Persons, the following guidelines are presented. The quality of industrial mineral deposits is typically measured by physical and/or chemical properties. The properties may be defined by standard industry specifications that must be considered in the classification of Mineral Resources and/or Mineral Reserves. Before a tonnage and quality and/or value per tonne estimate of an industrial mineral deposit can be classified as a Mineral Resource, there must be recognition by the Qualified Person preparing the tonnage and quality estimate that there is a viable market for the product or that a market can be reasonably developed. Before any part of an industrial mineral deposit can be classified as a Mineral Reserve the Qualified Person preparing the tonnage and quality and/or value per tonne estimate must assure himself or herself that the mineral can be sold at a profit through review of specific and identifiable markets for the product. When the quality of any industrial minerals is defined by standard industry specifications and these specifications are used to estimate the value of a tonne of product or products, the industry standard used must be identified. The methods for estimating the value must be explained. REPORTING OF DIAMONDS AND GEMSTONES Mineral Resource and Reserves estimates of diamonds or gemstones must conform to the definitions and guidelines found in "Reporting of Diamond Exploration Results, Identified Mineral Resources and Ore Reserves" published by the Association of Professional Engineers, Geologists and Geophysicists of the Northwest Territories.
85
Reports of diamonds or gemstones recovered from sampling programs must specify the number and total weight of stones (in carats for diamonds) recovered. Details of the type and size of samples which produced the diamonds must also be specified including the lower cut-off sieve size and type of sieve used in the recovery. Of equal or greater importance to the total weight of diamonds is diamond value which depends on the colour, size, and proportion of gem and near gem quality of stones recovered. The weight of diamonds recovered may only be omitted from the report when the diamonds are less than 0.5 mm in size (i.e. when the diamonds recovered are microdiamonds). For Technical Reports dealing with diamond or other gemstone mineralization, it is also a requirement of the ClM Standards that, if a valuation(s) of a parcel of diamonds or gemstones is reported, the person(s) or organization valuing the parcel must be named in the report and their professional valuation experience, competency and independence must be stated. If a valuation of a parcel of diamonds is reported, the weight in carats and size range of the contained diamonds must be stated and the value of the diamonds must be estimated in US dollars per carat. If the valuation(s) is not independent, this must be clearly stated. Diamond valuation is a highly specialized process and value can only be reliably estimated for large parcels (at least 2,000 carats) of diamonds from a single deposit. The reliability of valuations of parcels smaller than 2,000 carats decreases as the size of the parcels decreases to the point where valuations placed on a small number of diamonds from exploration samples are likely to be misleading.
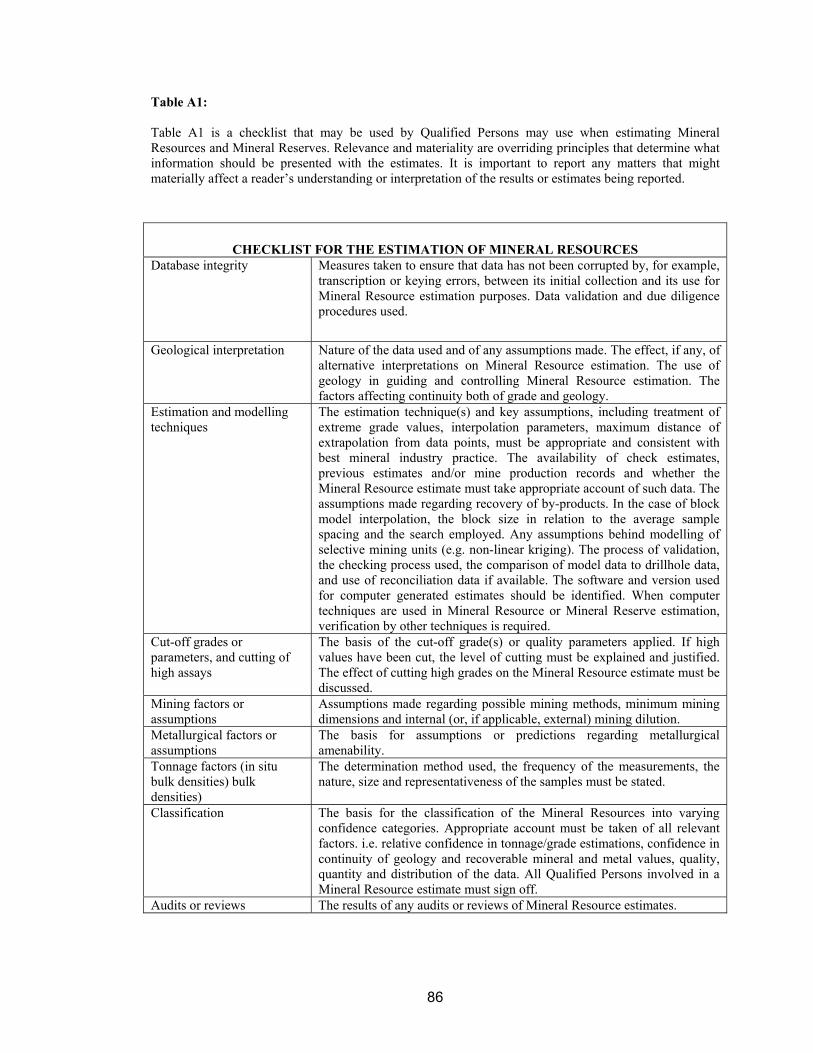
86
Table A1: Table A1 is a checklist that may be used by Qualified Persons may use when estimating Mineral Resources and Mineral Reserves. Relevance and materiality are overriding principles that determine what information should be presented with the estimates. It is important to report any matters that might materially affect a reader’s understanding or interpretation of the results or estimates being reported.
CHECKLIST FOR THE ESTIMATION OF MINERAL RESOURCES
Database integrity Measures taken to ensure that data has not been corrupted by, for example, transcription or keying errors, between its initial collection and its use for Mineral Resource estimation purposes. Data validation and due diligence procedures used.
Geological interpretation Nature of the data used and of any assumptions made. The effect, if any, of alternative interpretations on Mineral Resource estimation. The use of geology in guiding and controlling Mineral Resource estimation. The factors affecting continuity both of grade and geology.
Estimation and modelling techniques
The estimation technique(s) and key assumptions, including treatment of extreme grade values, interpolation parameters, maximum distance of extrapolation from data points, must be appropriate and consistent with best mineral industry practice. The availability of check estimates, previous estimates and/or mine production records and whether the Mineral Resource estimate must take appropriate account of such data. The assumptions made regarding recovery of by-products. In the case of block model interpolation, the block size in relation to the average sample spacing and the search employed. Any assumptions behind modelling of selective mining units (e.g. non-linear kriging). The process of validation, the checking process used, the comparison of model data to drillhole data, and use of reconciliation data if available. The software and version used for computer generated estimates should be identified. When computer techniques are used in Mineral Resource or Mineral Reserve estimation, verification by other techniques is required.
Cut-off grades or parameters, and cutting of high assays
The basis of the cut-off grade(s) or quality parameters applied. If high values have been cut, the level of cutting must be explained and justified. The effect of cutting high grades on the Mineral Resource estimate must be discussed.
Mining factors or assumptions
Assumptions made regarding possible mining methods, minimum mining dimensions and internal (or, if applicable, external) mining dilution.
Metallurgical factors or assumptions
The basis for assumptions or predictions regarding metallurgical amenability.
Tonnage factors (in situ bulk densities) bulk densities)
The determination method used, the frequency of the measurements, the nature, size and representativeness of the samples must be stated.
Classification The basis for the classification of the Mineral Resources into varying confidence categories. Appropriate account must be taken of all relevant factors. i.e. relative confidence in tonnage/grade estimations, confidence in continuity of geology and recoverable mineral and metal values, quality, quantity and distribution of the data. All Qualified Persons involved in a Mineral Resource estimate must sign off.
Audits or reviews The results of any audits or reviews of Mineral Resource estimates.
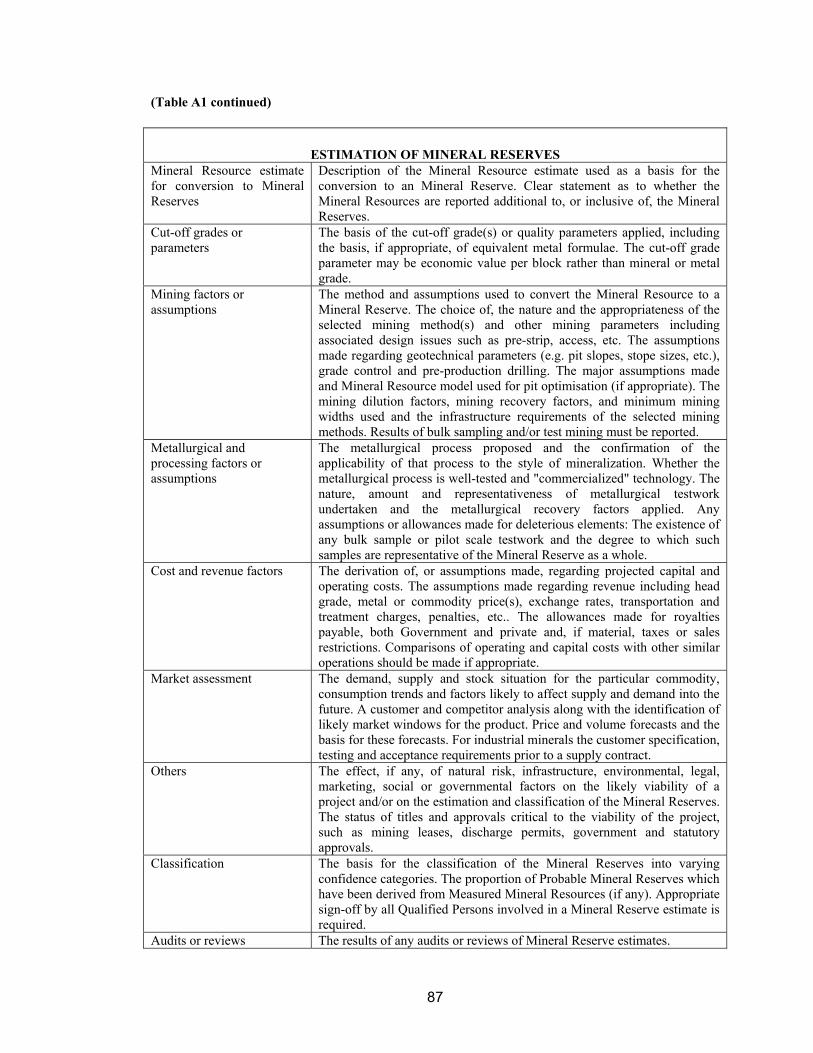
87
(Table A1 continued)
ESTIMATION OF MINERAL RESERVES
Mineral Resource estimate for conversion to Mineral Reserves
Description of the Mineral Resource estimate used as a basis for the conversion to an Mineral Reserve. Clear statement as to whether the Mineral Resources are reported additional to, or inclusive of, the Mineral Reserves.
Cut-off grades or parameters
The basis of the cut-off grade(s) or quality parameters applied, including the basis, if appropriate, of equivalent metal formulae. The cut-off grade parameter may be economic value per block rather than mineral or metal grade.
Mining factors or assumptions
The method and assumptions used to convert the Mineral Resource to a Mineral Reserve. The choice of, the nature and the appropriateness of the selected mining method(s) and other mining parameters including associated design issues such as pre-strip, access, etc. The assumptions made regarding geotechnical parameters (e.g. pit slopes, stope sizes, etc.), grade control and pre-production drilling. The major assumptions made and Mineral Resource model used for pit optimisation (if appropriate). The mining dilution factors, mining recovery factors, and minimum mining widths used and the infrastructure requirements of the selected mining methods. Results of bulk sampling and/or test mining must be reported.
Metallurgical and processing factors or assumptions
The metallurgical process proposed and the confirmation of the applicability of that process to the style of mineralization. Whether the metallurgical process is well-tested and "commercialized" technology. The nature, amount and representativeness of metallurgical testwork undertaken and the metallurgical recovery factors applied. Any assumptions or allowances made for deleterious elements: The existence of any bulk sample or pilot scale testwork and the degree to which such samples are representative of the Mineral Reserve as a whole.
Cost and revenue factors The derivation of, or assumptions made, regarding projected capital and operating costs. The assumptions made regarding revenue including head grade, metal or commodity price(s), exchange rates, transportation and treatment charges, penalties, etc.. The allowances made for royalties payable, both Government and private and, if material, taxes or sales restrictions. Comparisons of operating and capital costs with other similar operations should be made if appropriate.
Market assessment The demand, supply and stock situation for the particular commodity, consumption trends and factors likely to affect supply and demand into the future. A customer and competitor analysis along with the identification of likely market windows for the product. Price and volume forecasts and the basis for these forecasts. For industrial minerals the customer specification, testing and acceptance requirements prior to a supply contract.
Others The effect, if any, of natural risk, infrastructure, environmental, legal, marketing, social or governmental factors on the likely viability of a project and/or on the estimation and classification of the Mineral Reserves. The status of titles and approvals critical to the viability of the project, such as mining leases, discharge permits, government and statutory approvals.
Classification The basis for the classification of the Mineral Reserves into varying confidence categories. The proportion of Probable Mineral Reserves which have been derived from Measured Mineral Resources (if any). Appropriate sign-off by all Qualified Persons involved in a Mineral Reserve estimate is required.
Audits or reviews The results of any audits or reviews of Mineral Reserve estimates.
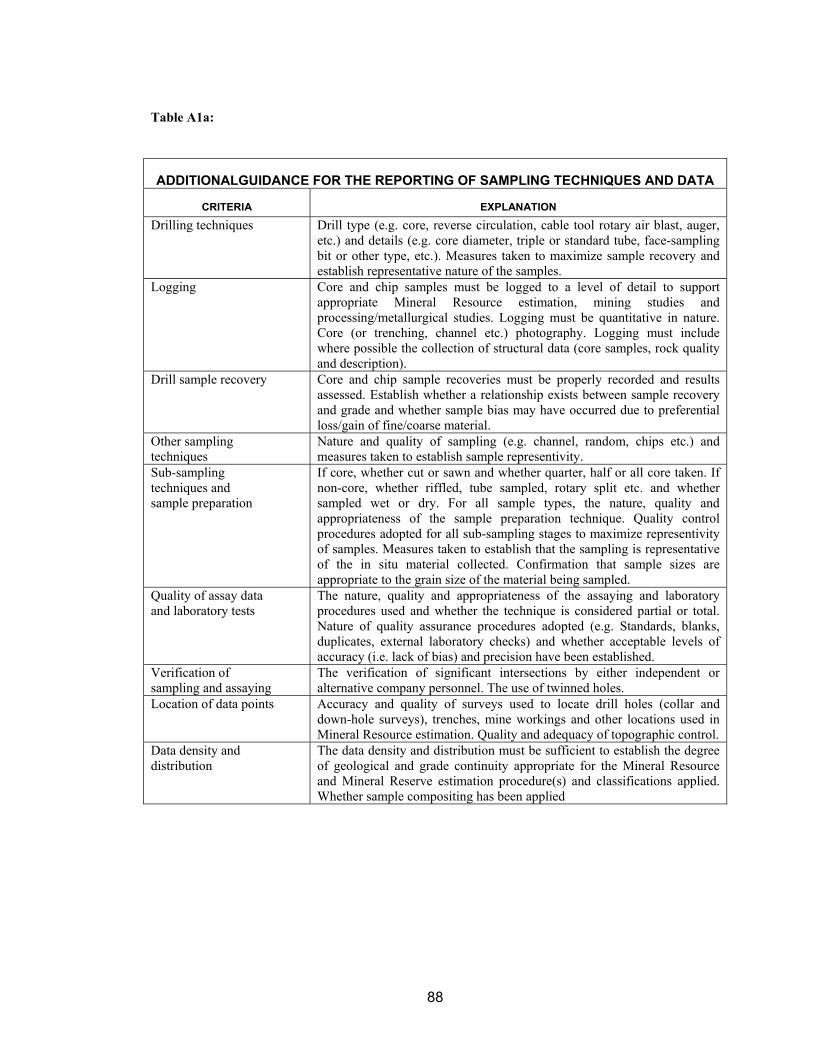
88
Table A1a:
ADDITIONALGUIDANCE FOR THE REPORTING OF SAMPLING TECHNIQUES AND DATA
CRITERIA
EXPLANATION
Drilling techniques
Drill type (e.g. core, reverse circulation, cable tool rotary air blast, auger, etc.) and details (e.g. core diameter, triple or standard tube, face-sampling bit or other type, etc.). Measures taken to maximize sample recovery and establish representative nature of the samples.
Logging
Core and chip samples must be logged to a level of detail to support appropriate Mineral Resource estimation, mining studies and processing/metallurgical studies. Logging must be quantitative in nature. Core (or trenching, channel etc.) photography. Logging must include where possible the collection of structural data (core samples, rock quality and description).
Drill sample recovery
Core and chip sample recoveries must be properly recorded and results assessed. Establish whether a relationship exists between sample recovery and grade and whether sample bias may have occurred due to preferential loss/gain of fine/coarse material.
Other sampling techniques
Nature and quality of sampling (e.g. channel, random, chips etc.) and measures taken to establish sample representivity.
Sub-sampling techniques and sample preparation
If core, whether cut or sawn and whether quarter, half or all core taken. If non-core, whether riffled, tube sampled, rotary split etc. and whether sampled wet or dry. For all sample types, the nature, quality and appropriateness of the sample preparation technique. Quality control procedures adopted for all sub-sampling stages to maximize representivity of samples. Measures taken to establish that the sampling is representative of the in situ material collected. Confirmation that sample sizes are appropriate to the grain size of the material being sampled.
Quality of assay data and laboratory tests
The nature, quality and appropriateness of the assaying and laboratory procedures used and whether the technique is considered partial or total. Nature of quality assurance procedures adopted (e.g. Standards, blanks, duplicates, external laboratory checks) and whether acceptable levels of accuracy (i.e. lack of bias) and precision have been established.
Verification of sampling and assaying
The verification of significant intersections by either independent or alternative company personnel. The use of twinned holes.
Location of data points
Accuracy and quality of surveys used to locate drill holes (collar and down-hole surveys), trenches, mine workings and other locations used in Mineral Resource estimation. Quality and adequacy of topographic control.
Data density and distribution
The data density and distribution must be sufficient to establish the degree of geological and grade continuity appropriate for the Mineral Resource and Mineral Reserve estimation procedure(s) and classifications applied. Whether sample compositing has been applied
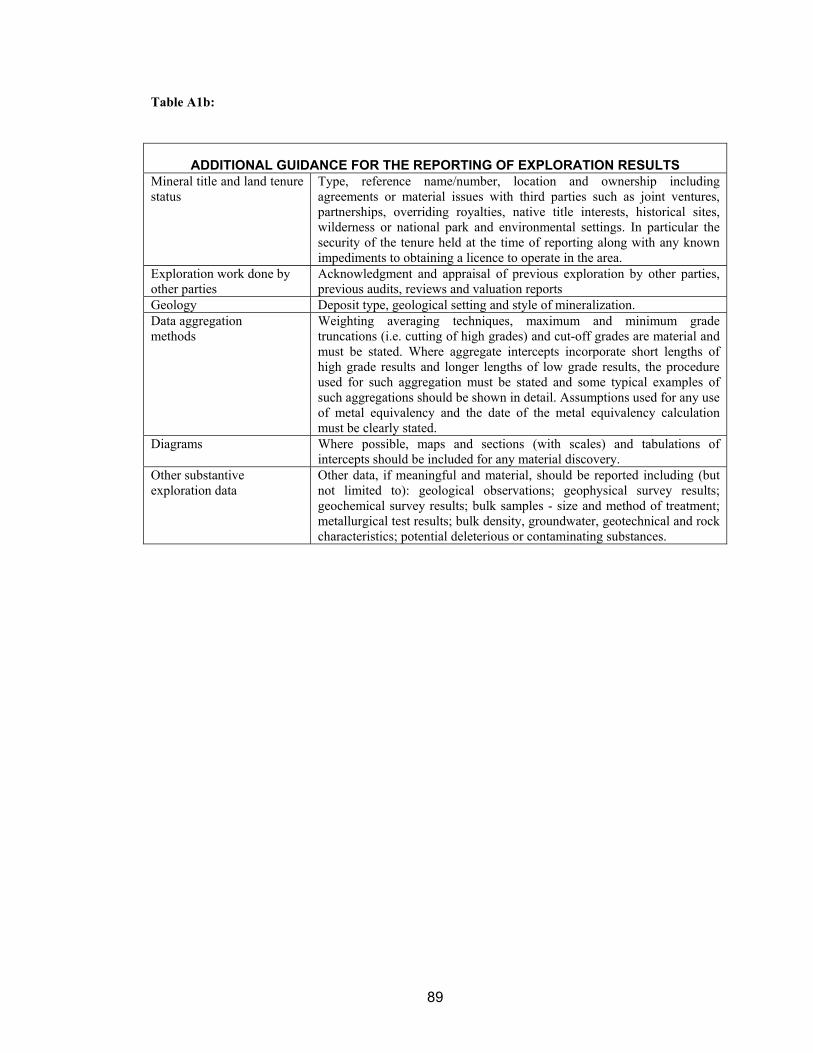
89
Table A1b:
ADDITIONAL GUIDANCE FOR THE REPORTING OF EXPLORATION RESULTS
Mineral title and land tenure status
Type, reference name/number, location and ownership including agreements or material issues with third parties such as joint ventures, partnerships, overriding royalties, native title interests, historical sites, wilderness or national park and environmental settings. In particular the security of the tenure held at the time of reporting along with any known impediments to obtaining a licence to operate in the area.
Exploration work done by other parties
Acknowledgment and appraisal of previous exploration by other parties, previous audits, reviews and valuation reports
Geology Deposit type, geological setting and style of mineralization. Data aggregation methods
Weighting averaging techniques, maximum and minimum grade truncations (i.e. cutting of high grades) and cut-off grades are material and must be stated. Where aggregate intercepts incorporate short lengths of high grade results and longer lengths of low grade results, the procedure used for such aggregation must be stated and some typical examples of such aggregations should be shown in detail. Assumptions used for any use of metal equivalency and the date of the metal equivalency calculation must be clearly stated.
Diagrams Where possible, maps and sections (with scales) and tabulations of intercepts should be included for any material discovery.
Other substantive exploration data
Other data, if meaningful and material, should be reported including (but not limited to): geological observations; geophysical survey results; geochemical survey results; bulk samples - size and method of treatment; metallurgical test results; bulk density, groundwater, geotechnical and rock characteristics; potential deleterious or contaminating substances.
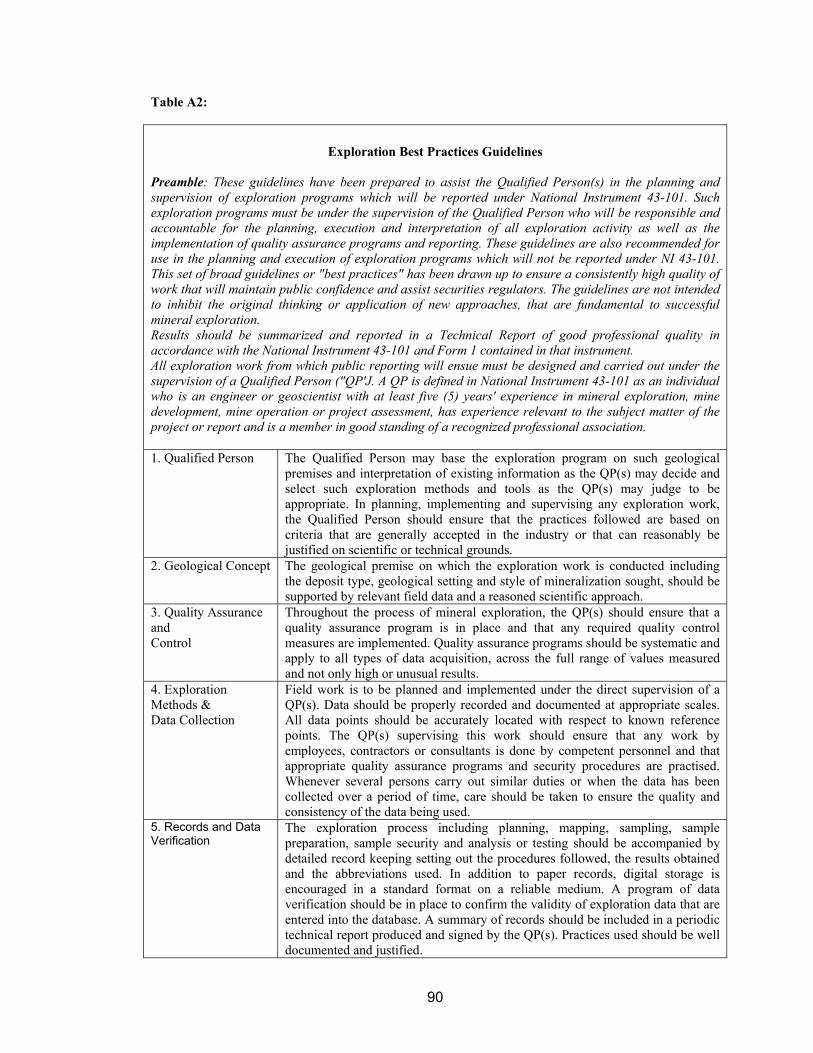
90
Table A2:
Exploration Best Practices Guidelines
Preamble: These guidelines have been prepared to assist the Qualified Person(s) in the planning and supervision of exploration programs which will be reported under National Instrument 43-101. Such exploration programs must be under the supervision of the Qualified Person who will be responsible and accountable for the planning, execution and interpretation of all exploration activity as well as the implementation of quality assurance programs and reporting. These guidelines are also recommended for use in the planning and execution of exploration programs which will not be reported under NI 43-101. This set of broad guidelines or "best practices" has been drawn up to ensure a consistently high quality of work that will maintain public confidence and assist securities regulators. The guidelines are not intended to inhibit the original thinking or application of new approaches, that are fundamental to successful mineral exploration. Results should be summarized and reported in a Technical Report of good professional quality in accordance with the National Instrument 43-101 and Form 1 contained in that instrument. All exploration work from which public reporting will ensue must be designed and carried out under the supervision of a Qualified Person ("QP'J. A QP is defined in National Instrument 43-101 as an individual who is an engineer or geoscientist with at least five (5) years' experience in mineral exploration, mine development, mine operation or project assessment, has experience relevant to the subject matter of the project or report and is a member in good standing of a recognized professional association. 1. Qualified Person The Qualified Person may base the exploration program on such geological
premises and interpretation of existing information as the QP(s) may decide and select such exploration methods and tools as the QP(s) may judge to be appropriate. In planning, implementing and supervising any exploration work, the Qualified Person should ensure that the practices followed are based on criteria that are generally accepted in the industry or that can reasonably be justified on scientific or technical grounds.
2. Geological Concept
The geological premise on which the exploration work is conducted including the deposit type, geological setting and style of mineralization sought, should be supported by relevant field data and a reasoned scientific approach.
3. Quality Assurance and Control
Throughout the process of mineral exploration, the QP(s) should ensure that a quality assurance program is in place and that any required quality control measures are implemented. Quality assurance programs should be systematic and apply to all types of data acquisition, across the full range of values measured and not only high or unusual results.
4. Exploration Methods & Data Collection
Field work is to be planned and implemented under the direct supervision of a QP(s). Data should be properly recorded and documented at appropriate scales. All data points should be accurately located with respect to known reference points. The QP(s) supervising this work should ensure that any work by employees, contractors or consultants is done by competent personnel and that appropriate quality assurance programs and security procedures are practised. Whenever several persons carry out similar duties or when the data has been collected over a period of time, care should be taken to ensure the quality and consistency of the data being used.
5. Records and Data Verification
The exploration process including planning, mapping, sampling, sample preparation, sample security and analysis or testing should be accompanied by detailed record keeping setting out the procedures followed, the results obtained and the abbreviations used. In addition to paper records, digital storage is encouraged in a standard format on a reliable medium. A program of data verification should be in place to confirm the validity of exploration data that are entered into the database. A summary of records should be included in a periodic technical report produced and signed by the QP(s). Practices used should be well documented and justified.
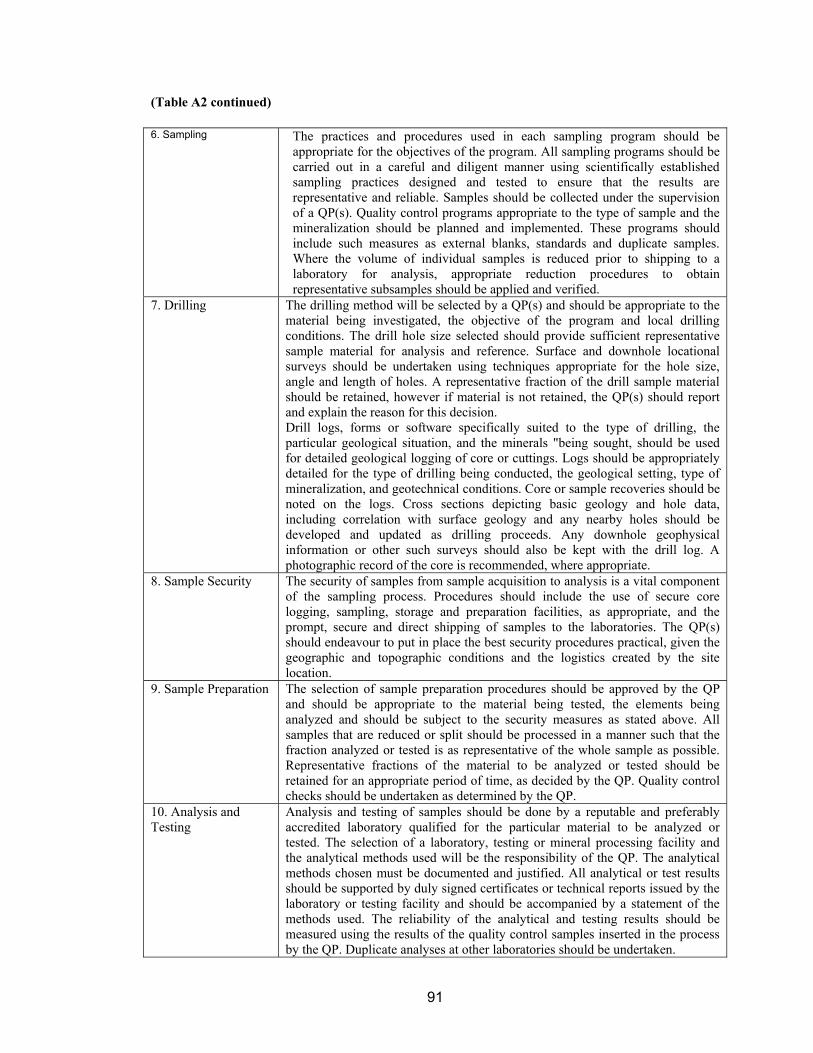
91
(Table A2 continued) 6. Sampling
The practices and procedures used in each sampling program should be appropriate for the objectives of the program. All sampling programs should be carried out in a careful and diligent manner using scientifically established sampling practices designed and tested to ensure that the results are representative and reliable. Samples should be collected under the supervision of a QP(s). Quality control programs appropriate to the type of sample and the mineralization should be planned and implemented. These programs should include such measures as external blanks, standards and duplicate samples. Where the volume of individual samples is reduced prior to shipping to a laboratory for analysis, appropriate reduction procedures to obtain representative subsamples should be applied and verified.
7. Drilling
The drilling method will be selected by a QP(s) and should be appropriate to the material being investigated, the objective of the program and local drilling conditions. The drill hole size selected should provide sufficient representative sample material for analysis and reference. Surface and downhole locational surveys should be undertaken using techniques appropriate for the hole size, angle and length of holes. A representative fraction of the drill sample material should be retained, however if material is not retained, the QP(s) should report and explain the reason for this decision. Drill logs, forms or software specifically suited to the type of drilling, the particular geological situation, and the minerals "being sought, should be used for detailed geological logging of core or cuttings. Logs should be appropriately detailed for the type of drilling being conducted, the geological setting, type of mineralization, and geotechnical conditions. Core or sample recoveries should be noted on the logs. Cross sections depicting basic geology and hole data, including correlation with surface geology and any nearby holes should be developed and updated as drilling proceeds. Any downhole geophysical information or other such surveys should also be kept with the drill log. A photographic record of the core is recommended, where appropriate.
8. Sample Security
The security of samples from sample acquisition to analysis is a vital component of the sampling process. Procedures should include the use of secure core logging, sampling, storage and preparation facilities, as appropriate, and the prompt, secure and direct shipping of samples to the laboratories. The QP(s) should endeavour to put in place the best security procedures practical, given the geographic and topographic conditions and the logistics created by the site location.
9. Sample Preparation
The selection of sample preparation procedures should be approved by the QP and should be appropriate to the material being tested, the elements being analyzed and should be subject to the security measures as stated above. All samples that are reduced or split should be processed in a manner such that the fraction analyzed or tested is as representative of the whole sample as possible. Representative fractions of the material to be analyzed or tested should be retained for an appropriate period of time, as decided by the QP. Quality control checks should be undertaken as determined by the QP.
10. Analysis and Testing
Analysis and testing of samples should be done by a reputable and preferably accredited laboratory qualified for the particular material to be analyzed or tested. The selection of a laboratory, testing or mineral processing facility and the analytical methods used will be the responsibility of the QP. The analytical methods chosen must be documented and justified. All analytical or test results should be supported by duly signed certificates or technical reports issued by the laboratory or testing facility and should be accompanied by a statement of the methods used. The reliability of the analytical and testing results should be measured using the results of the quality control samples inserted in the process by the QP. Duplicate analyses at other laboratories should be undertaken.
92
(Table A2 continued) 11. Interpretation
A comprehensive and ongoing interpretation of all the exploration data is an essential activity at all stages of the project and should be undertaken to assess the results of the work.
This interpretation should be based on all of the information collected to date, be systematic and thorough, describe and document the interpretation and discuss any information that appears at variance with the selected interpretation. The density of the exploration data should be critically assessed as to its ability to support the qualitative and quantitative conclusions.
12. Mineral Resource and Reserve Estimation
Estimation of a mineral resource and a mineral reserve are both fundamental steps in project development. The classification and categorization of these estimates must be done in accordance with National Instrument 43-101 and be prepared by a QP(s). The methods and parameters used in making these estimates should be in accordance with the principles generally accepted in Canada and should be presented and justified with the estimate. A mineral resource can be estimated for material where the geological characteristics and the continuity are known or reasonably assumed and where there is the potential for production at a profit. Reserves can be estimated when a positive prefeasibility or feasibility study as defined by NI 43-101 has established the technical, economic and other relevant factors that indicate that these resources can be produced at a profit. Reserve estimates should be based on input and information from a multidisciplinary team under the direction of QP(s).
13. Environment, Safety and Community Relations
All field work should be conducted in a safe, professional manner with due regard for the environment, the concerns of local communities and with regulatory requirements. An environmental program, including baseline studies, appropriate to the stage of the project should be carried out.
14. Recommendations The interpretation and assessment of the program results at the end of each phase should determine if the program objectives have been met and if further work is justified. Any plan for further work should identify exploration targets, recommend an exploration program and present a budget and schedule. Any changes in working hypotheses and objectives should be recorded.
15. Technical Reporting
A comprehensive technical report signed by the QP(s) should be prepared on completion of a particular phase or stage of work following the format presented in Form 1 of the National Instrument 43-101.
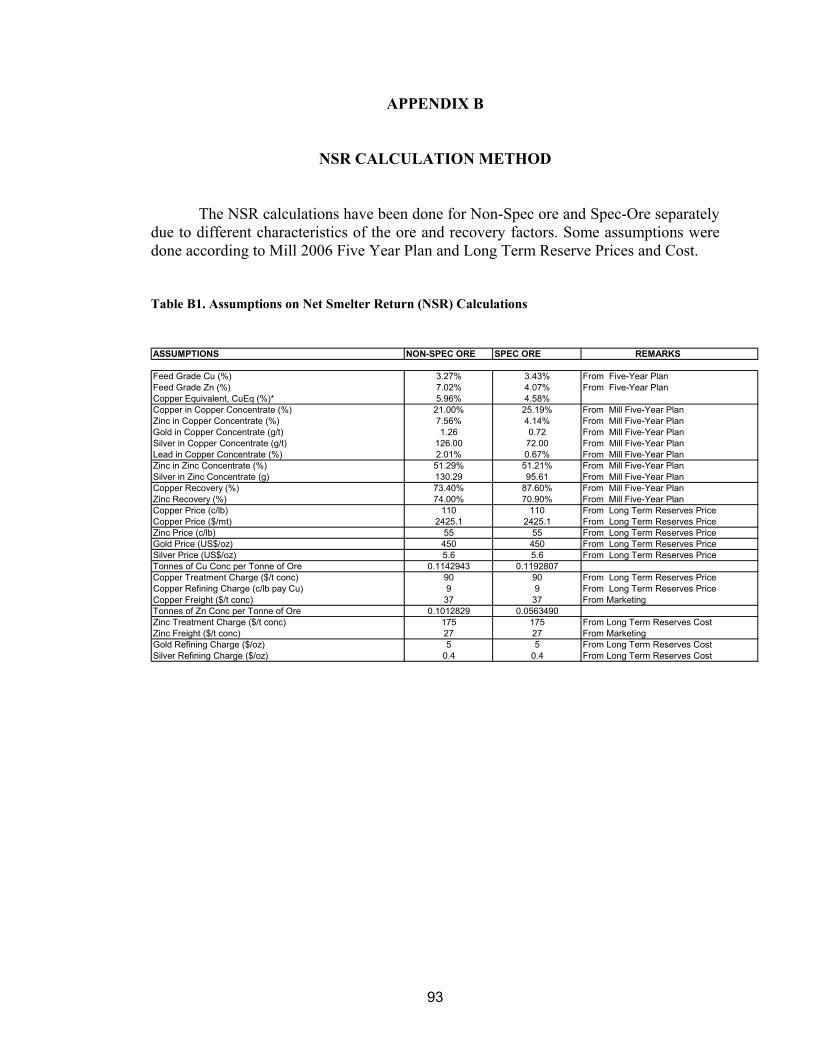
93
APPENDIX B
NSR CALCULATION METHOD
The NSR calculations have been done for Non-Spec ore and Spec-Ore separately due to different characteristics of the ore and recovery factors. Some assumptions were done according to Mill 2006 Five Year Plan and Long Term Reserve Prices and Cost.
Table B1. Assumptions on Net Smelter Return (NSR) Calculations ASSUMPTIONS NON-SPEC ORE SPEC ORE REMARKS
Feed Grade Cu (%) 3.27% 3.43% From Five-Year PlanFeed Grade Zn (%) 7.02% 4.07% From Five-Year PlanCopper Equivalent, CuEq (%)* 5.96% 4.58%Copper in Copper Concentrate (%) 21.00% 25.19% From Mill Five-Year PlanZinc in Copper Concentrate (%) 7.56% 4.14% From Mill Five-Year PlanGold in Copper Concentrate (g/t) 1.26 0.72 From Mill Five-Year PlanSilver in Copper Concentrate (g/t) 126.00 72.00 From Mill Five-Year PlanLead in Copper Concentrate (%) 2.01% 0.67% From Mill Five-Year PlanZinc in Zinc Concentrate (%) 51.29% 51.21% From Mill Five-Year PlanSilver in Zinc Concentrate (g) 130.29 95.61 From Mill Five-Year PlanCopper Recovery (%) 73.40% 87.60% From Mill Five-Year PlanZinc Recovery (%) 74.00% 70.90% From Mill Five-Year PlanCopper Price (c/lb) 110 110 From Long Term Reserves PriceCopper Price ($/mt) 2425.1 2425.1 From Long Term Reserves PriceZinc Price (c/lb) 55 55 From Long Term Reserves PriceGold Price (US$/oz) 450 450 From Long Term Reserves PriceSilver Price (US$/oz) 5.6 5.6 From Long Term Reserves PriceTonnes of Cu Conc per Tonne of Ore 0.1142943 0.1192807Copper Treatment Charge ($/t conc) 90 90 From Long Term Reserves PriceCopper Refining Charge (c/lb pay Cu) 9 9 From Long Term Reserves PriceCopper Freight ($/t conc) 37 37 From MarketingTonnes of Zn Conc per Tonne of Ore 0.1012829 0.0563490Zinc Treatment Charge ($/t conc) 175 175 From Long Term Reserves CostZinc Freight ($/t conc) 27 27 From MarketingGold Refining Charge ($/oz) 5 5 From Long Term Reserves CostSilver Refining Charge ($/oz) 0.4 0.4 From Long Term Reserves Cost
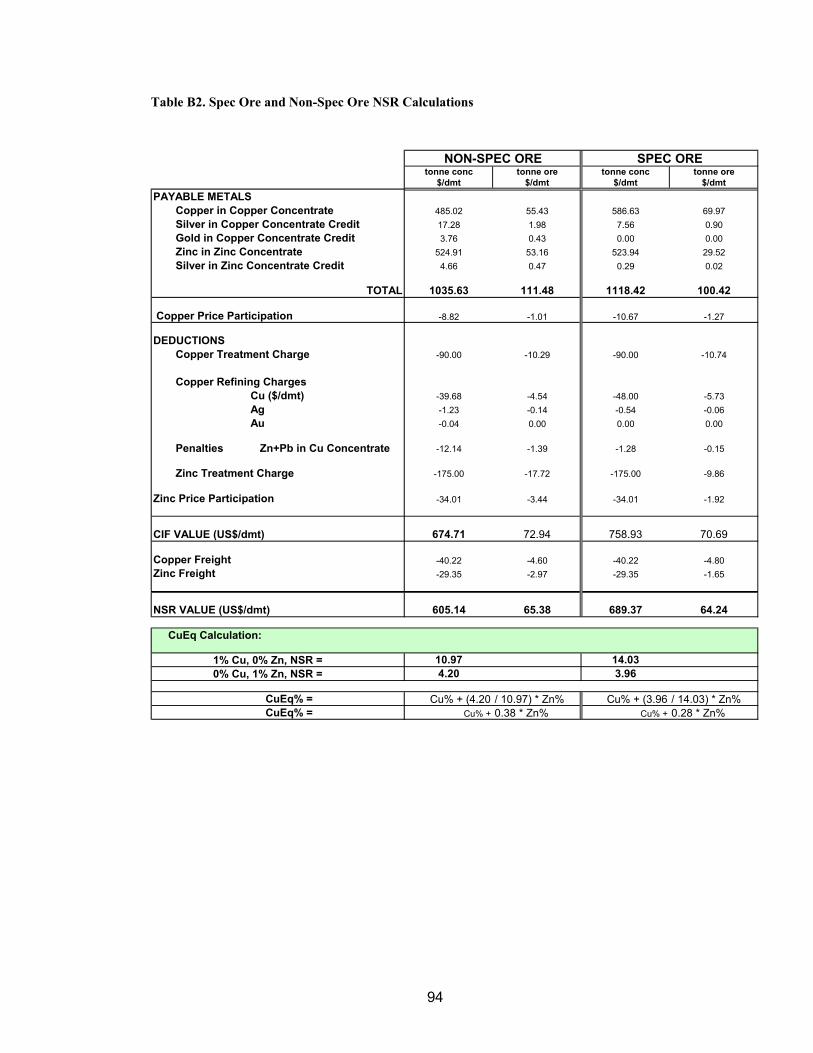
94
Table B2. Spec Ore and Non-Spec Ore NSR Calculations
tonne conc tonne ore tonne conc tonne ore$/dmt $/dmt $/dmt $/dmt
PAYABLE METALSCopper in Copper Concentrate 485.02 55.43 586.63 69.97Silver in Copper Concentrate Credit 17.28 1.98 7.56 0.90Gold in Copper Concentrate Credit 3.76 0.43 0.00 0.00Zinc in Zinc Concentrate 524.91 53.16 523.94 29.52Silver in Zinc Concentrate Credit 4.66 0.47 0.29 0.02
TOTAL 1035.63 111.48 1118.42 100.42
Copper Price Participation -8.82 -1.01 -10.67 -1.27
DEDUCTIONSCopper Treatment Charge -90.00 -10.29 -90.00 -10.74
Copper Refining ChargesCu ($/dmt) -39.68 -4.54 -48.00 -5.73Ag -1.23 -0.14 -0.54 -0.06Au -0.04 0.00 0.00 0.00
Penalties Zn+Pb in Cu Concentrate -12.14 -1.39 -1.28 -0.15
Zinc Treatment Charge -175.00 -17.72 -175.00 -9.86
Zinc Price Participation -34.01 -3.44 -34.01 -1.92
CIF VALUE (US$/dmt) 674.71 72.94 758.93 70.69
Copper Freight -40.22 -4.60 -40.22 -4.80Zinc Freight -29.35 -2.97 -29.35 -1.65
NSR VALUE (US$/dmt) 605.14 65.38 689.37 64.24
CuEq Calculation:
1% Cu, 0% Zn, NSR = 10.97 14.030% Cu, 1% Zn, NSR = 4.20 3.96
CuEq% = Cu% + (4.20 / 10.97) * Zn% Cu% + (3.96 / 14.03) * Zn%CuEq% = Cu% + 0.38 * Zn% Cu% + 0.28 * Zn%
NON-SPEC ORE SPEC ORE
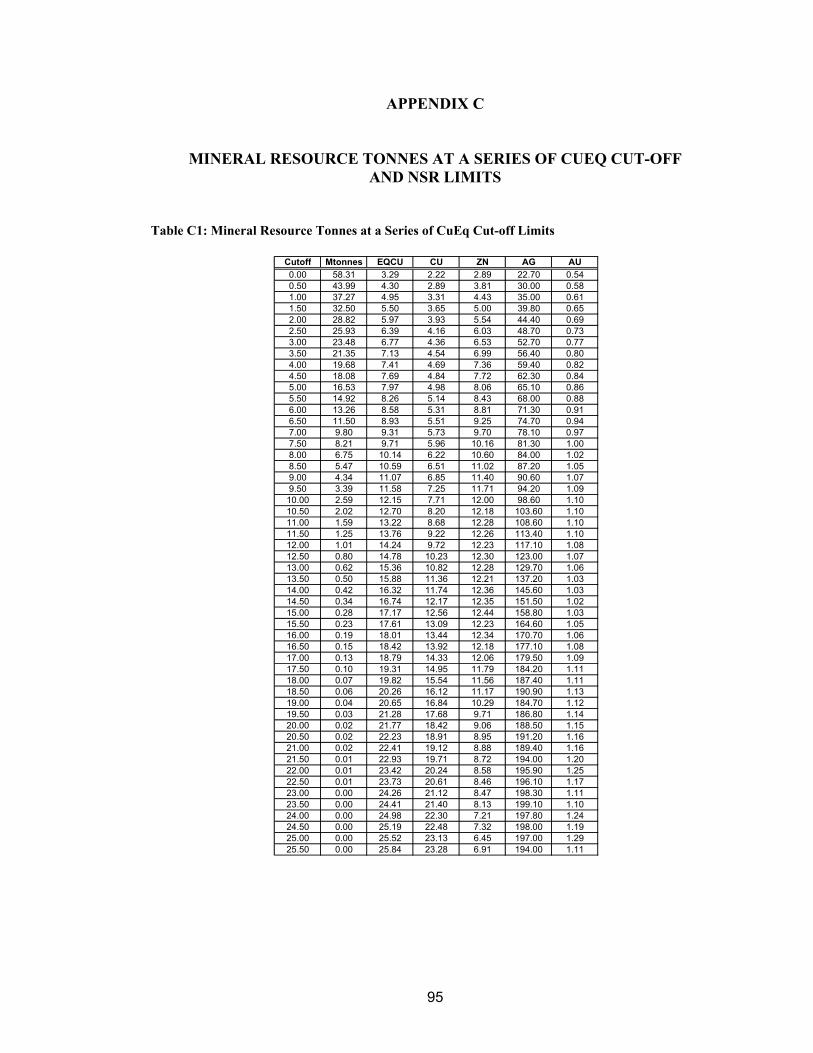
95
APPENDIX C
MINERAL RESOURCE TONNES AT A SERIES OF CUEQ CUT-OFF AND NSR LIMITS
Table C1: Mineral Resource Tonnes at a Series of CuEq Cut-off Limits
Cutoff Mtonnes EQCU CU ZN AG AU0.00 58.31 3.29 2.22 2.89 22.70 0.540.50 43.99 4.30 2.89 3.81 30.00 0.581.00 37.27 4.95 3.31 4.43 35.00 0.611.50 32.50 5.50 3.65 5.00 39.80 0.652.00 28.82 5.97 3.93 5.54 44.40 0.692.50 25.93 6.39 4.16 6.03 48.70 0.733.00 23.48 6.77 4.36 6.53 52.70 0.773.50 21.35 7.13 4.54 6.99 56.40 0.804.00 19.68 7.41 4.69 7.36 59.40 0.824.50 18.08 7.69 4.84 7.72 62.30 0.845.00 16.53 7.97 4.98 8.06 65.10 0.865.50 14.92 8.26 5.14 8.43 68.00 0.886.00 13.26 8.58 5.31 8.81 71.30 0.916.50 11.50 8.93 5.51 9.25 74.70 0.947.00 9.80 9.31 5.73 9.70 78.10 0.977.50 8.21 9.71 5.96 10.16 81.30 1.008.00 6.75 10.14 6.22 10.60 84.00 1.028.50 5.47 10.59 6.51 11.02 87.20 1.059.00 4.34 11.07 6.85 11.40 90.60 1.079.50 3.39 11.58 7.25 11.71 94.20 1.0910.00 2.59 12.15 7.71 12.00 98.60 1.1010.50 2.02 12.70 8.20 12.18 103.60 1.1011.00 1.59 13.22 8.68 12.28 108.60 1.1011.50 1.25 13.76 9.22 12.26 113.40 1.1012.00 1.01 14.24 9.72 12.23 117.10 1.0812.50 0.80 14.78 10.23 12.30 123.00 1.0713.00 0.62 15.36 10.82 12.28 129.70 1.0613.50 0.50 15.88 11.36 12.21 137.20 1.0314.00 0.42 16.32 11.74 12.36 145.60 1.0314.50 0.34 16.74 12.17 12.35 151.50 1.0215.00 0.28 17.17 12.56 12.44 158.80 1.0315.50 0.23 17.61 13.09 12.23 164.60 1.0516.00 0.19 18.01 13.44 12.34 170.70 1.0616.50 0.15 18.42 13.92 12.18 177.10 1.0817.00 0.13 18.79 14.33 12.06 179.50 1.0917.50 0.10 19.31 14.95 11.79 184.20 1.1118.00 0.07 19.82 15.54 11.56 187.40 1.1118.50 0.06 20.26 16.12 11.17 190.90 1.1319.00 0.04 20.65 16.84 10.29 184.70 1.1219.50 0.03 21.28 17.68 9.71 186.80 1.1420.00 0.02 21.77 18.42 9.06 188.50 1.1520.50 0.02 22.23 18.91 8.95 191.20 1.1621.00 0.02 22.41 19.12 8.88 189.40 1.1621.50 0.01 22.93 19.71 8.72 194.00 1.2022.00 0.01 23.42 20.24 8.58 195.90 1.2522.50 0.01 23.73 20.61 8.46 196.10 1.1723.00 0.00 24.26 21.12 8.47 198.30 1.1123.50 0.00 24.41 21.40 8.13 199.10 1.1024.00 0.00 24.98 22.30 7.21 197.80 1.2424.50 0.00 25.19 22.48 7.32 198.00 1.1925.00 0.00 25.52 23.13 6.45 197.00 1.2925.50 0.00 25.84 23.28 6.91 194.00 1.11
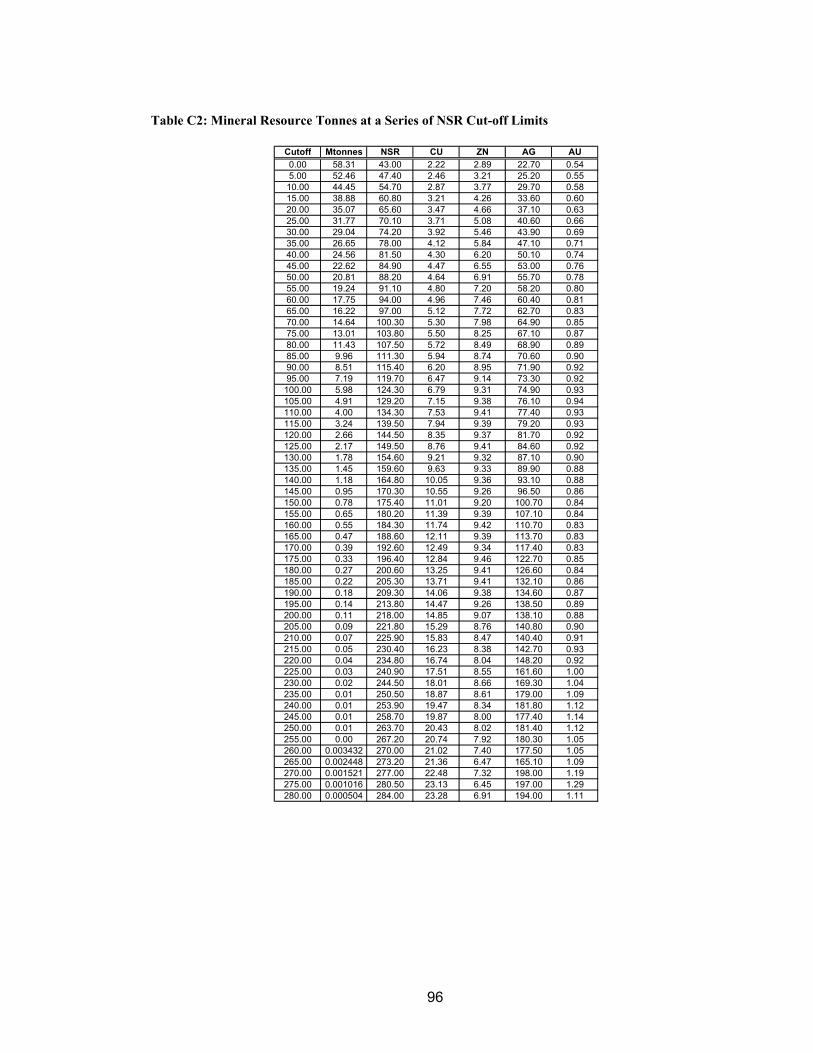
96
Table C2: Mineral Resource Tonnes at a Series of NSR Cut-off Limits
Cutoff Mtonnes NSR CU ZN AG AU0.00 58.31 43.00 2.22 2.89 22.70 0.545.00 52.46 47.40 2.46 3.21 25.20 0.5510.00 44.45 54.70 2.87 3.77 29.70 0.5815.00 38.88 60.80 3.21 4.26 33.60 0.6020.00 35.07 65.60 3.47 4.66 37.10 0.6325.00 31.77 70.10 3.71 5.08 40.60 0.6630.00 29.04 74.20 3.92 5.46 43.90 0.6935.00 26.65 78.00 4.12 5.84 47.10 0.7140.00 24.56 81.50 4.30 6.20 50.10 0.7445.00 22.62 84.90 4.47 6.55 53.00 0.7650.00 20.81 88.20 4.64 6.91 55.70 0.7855.00 19.24 91.10 4.80 7.20 58.20 0.8060.00 17.75 94.00 4.96 7.46 60.40 0.8165.00 16.22 97.00 5.12 7.72 62.70 0.8370.00 14.64 100.30 5.30 7.98 64.90 0.8575.00 13.01 103.80 5.50 8.25 67.10 0.8780.00 11.43 107.50 5.72 8.49 68.90 0.8985.00 9.96 111.30 5.94 8.74 70.60 0.9090.00 8.51 115.40 6.20 8.95 71.90 0.9295.00 7.19 119.70 6.47 9.14 73.30 0.92
100.00 5.98 124.30 6.79 9.31 74.90 0.93105.00 4.91 129.20 7.15 9.38 76.10 0.94110.00 4.00 134.30 7.53 9.41 77.40 0.93115.00 3.24 139.50 7.94 9.39 79.20 0.93120.00 2.66 144.50 8.35 9.37 81.70 0.92125.00 2.17 149.50 8.76 9.41 84.60 0.92130.00 1.78 154.60 9.21 9.32 87.10 0.90135.00 1.45 159.60 9.63 9.33 89.90 0.88140.00 1.18 164.80 10.05 9.36 93.10 0.88145.00 0.95 170.30 10.55 9.26 96.50 0.86150.00 0.78 175.40 11.01 9.20 100.70 0.84155.00 0.65 180.20 11.39 9.39 107.10 0.84160.00 0.55 184.30 11.74 9.42 110.70 0.83165.00 0.47 188.60 12.11 9.39 113.70 0.83170.00 0.39 192.60 12.49 9.34 117.40 0.83175.00 0.33 196.40 12.84 9.46 122.70 0.85180.00 0.27 200.60 13.25 9.41 126.60 0.84185.00 0.22 205.30 13.71 9.41 132.10 0.86190.00 0.18 209.30 14.06 9.38 134.60 0.87195.00 0.14 213.80 14.47 9.26 138.50 0.89200.00 0.11 218.00 14.85 9.07 138.10 0.88205.00 0.09 221.80 15.29 8.76 140.80 0.90210.00 0.07 225.90 15.83 8.47 140.40 0.91215.00 0.05 230.40 16.23 8.38 142.70 0.93220.00 0.04 234.80 16.74 8.04 148.20 0.92225.00 0.03 240.90 17.51 8.55 161.60 1.00230.00 0.02 244.50 18.01 8.66 169.30 1.04235.00 0.01 250.50 18.87 8.61 179.00 1.09240.00 0.01 253.90 19.47 8.34 181.80 1.12245.00 0.01 258.70 19.87 8.00 177.40 1.14250.00 0.01 263.70 20.43 8.02 181.40 1.12255.00 0.00 267.20 20.74 7.92 180.30 1.05260.00 0.003432 270.00 21.02 7.40 177.50 1.05265.00 0.002448 273.20 21.36 6.47 165.10 1.09270.00 0.001521 277.00 22.48 7.32 198.00 1.19275.00 0.001016 280.50 23.13 6.45 197.00 1.29280.00 0.000504 284.00 23.28 6.91 194.00 1.11
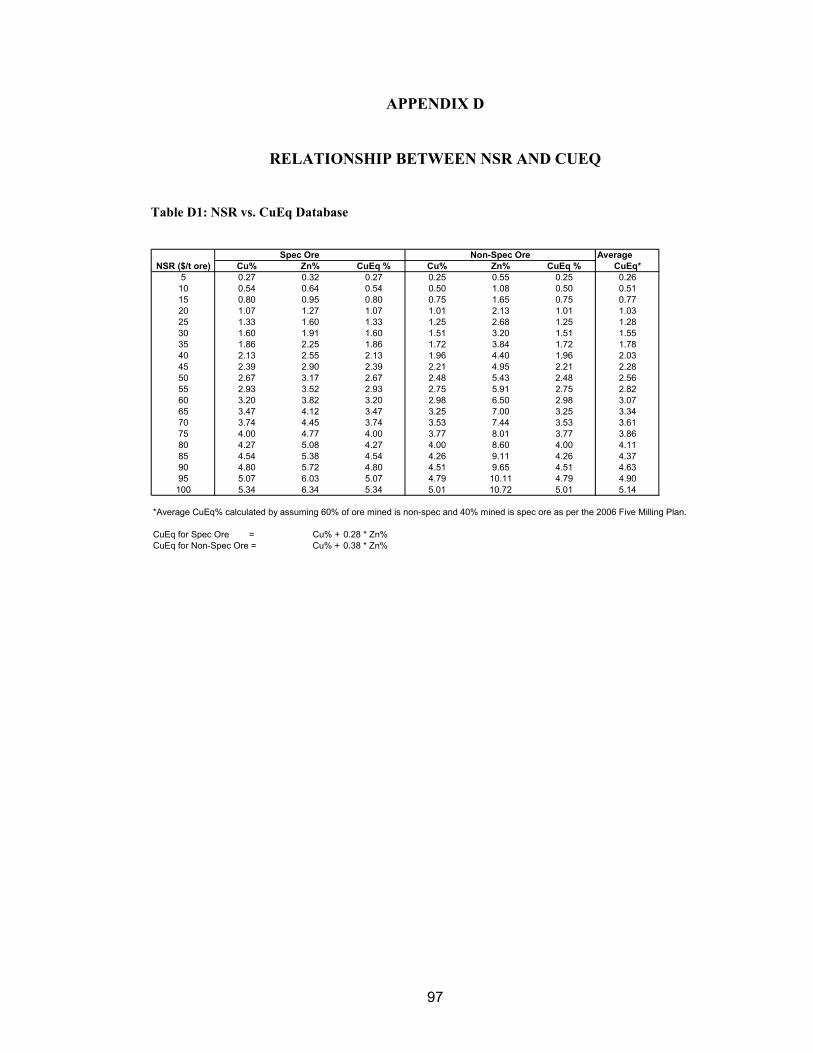
97
APPENDIX D
RELATIONSHIP BETWEEN NSR AND CUEQ
Table D1: NSR vs. CuEq Database
Spec Ore Non-Spec Ore AverageNSR ($/t ore) Cu% Zn% CuEq % Cu% Zn% CuEq % CuEq*
5 0.27 0.32 0.27 0.25 0.55 0.25 0.2610 0.54 0.64 0.54 0.50 1.08 0.50 0.5115 0.80 0.95 0.80 0.75 1.65 0.75 0.7720 1.07 1.27 1.07 1.01 2.13 1.01 1.0325 1.33 1.60 1.33 1.25 2.68 1.25 1.2830 1.60 1.91 1.60 1.51 3.20 1.51 1.5535 1.86 2.25 1.86 1.72 3.84 1.72 1.7840 2.13 2.55 2.13 1.96 4.40 1.96 2.0345 2.39 2.90 2.39 2.21 4.95 2.21 2.2850 2.67 3.17 2.67 2.48 5.43 2.48 2.5655 2.93 3.52 2.93 2.75 5.91 2.75 2.8260 3.20 3.82 3.20 2.98 6.50 2.98 3.0765 3.47 4.12 3.47 3.25 7.00 3.25 3.3470 3.74 4.45 3.74 3.53 7.44 3.53 3.6175 4.00 4.77 4.00 3.77 8.01 3.77 3.8680 4.27 5.08 4.27 4.00 8.60 4.00 4.1185 4.54 5.38 4.54 4.26 9.11 4.26 4.3790 4.80 5.72 4.80 4.51 9.65 4.51 4.6395 5.07 6.03 5.07 4.79 10.11 4.79 4.90100 5.34 6.34 5.34 5.01 10.72 5.01 5.14
*Average CuEq% calculated by assuming 60% of ore mined is non-spec and 40% mined is spec ore as per the 2006 Five Milling Plan.
CuEq for Spec Ore = Cu% + 0.28 * Zn%CuEq for Non-Spec Ore = Cu% + 0.38 * Zn%
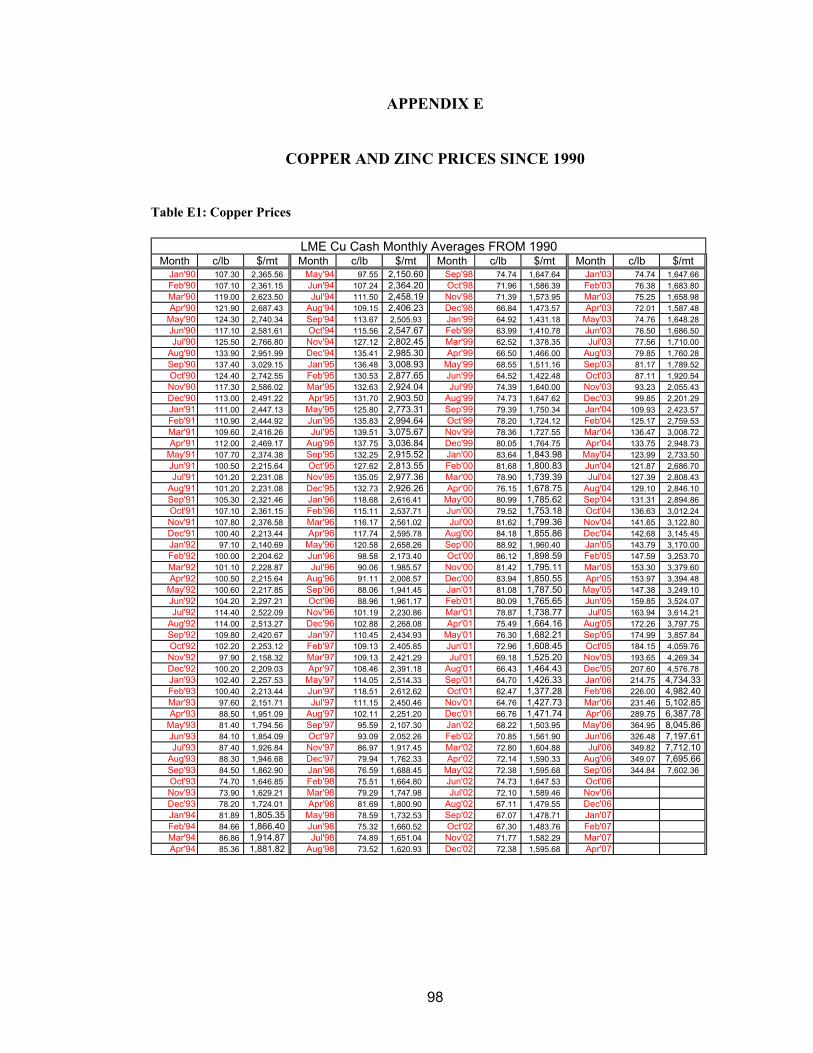
98
APPENDIX E
COPPER AND ZINC PRICES SINCE 1990
Table E1: Copper Prices
Month c/lb $/mt Month c/lb $/mt Month c/lb $/mt Month c/lb $/mtJan'90 107.30 2,365.56 May'94 97.55 2,150.60 Sep'98 74.74 1,647.64 Jan'03 74.74 1,647.66Feb'90 107.10 2,361.15 Jun'94 107.24 2,364.20 Oct'98 71.96 1,586.39 Feb'03 76.38 1,683.80Mar'90 119.00 2,623.50 Jul'94 111.50 2,458.19 Nov'98 71.39 1,573.95 Mar'03 75.25 1,658.98Apr'90 121.90 2,687.43 Aug'94 109.15 2,406.23 Dec'98 66.84 1,473.57 Apr'03 72.01 1,587.48
May'90 124.30 2,740.34 Sep'94 113.67 2,505.93 Jan'99 64.92 1,431.18 May'03 74.76 1,648.28Jun'90 117.10 2,581.61 Oct'94 115.56 2,547.67 Feb'99 63.99 1,410.78 Jun'03 76.50 1,686.50Jul'90 125.50 2,766.80 Nov'94 127.12 2,802.45 Mar'99 62.52 1,378.35 Jul'03 77.56 1,710.00
Aug'90 133.90 2,951.99 Dec'94 135.41 2,985.30 Apr'99 66.50 1,466.00 Aug'03 79.85 1,760.28Sep'90 137.40 3,029.15 Jan'95 136.48 3,008.93 May'99 68.55 1,511.16 Sep'03 81.17 1,789.52Oct'90 124.40 2,742.55 Feb'95 130.53 2,877.65 Jun'99 64.52 1,422.48 Oct'03 87.11 1,920.54Nov'90 117.30 2,586.02 Mar'95 132.63 2,924.04 Jul'99 74.39 1,640.00 Nov'03 93.23 2,055.43Dec'90 113.00 2,491.22 Apr'95 131.70 2,903.50 Aug'99 74.73 1,647.62 Dec'03 99.85 2,201.29Jan'91 111.00 2,447.13 May'95 125.80 2,773.31 Sep'99 79.39 1,750.34 Jan'04 109.93 2,423.57Feb'91 110.90 2,444.92 Jun'95 135.83 2,994.64 Oct'99 78.20 1,724.12 Feb'04 125.17 2,759.53Mar'91 109.60 2,416.26 Jul'95 139.51 3,075.67 Nov'99 78.36 1,727.55 Mar'04 136.47 3,008.72Apr'91 112.00 2,469.17 Aug'95 137.75 3,036.84 Dec'99 80.05 1,764.75 Apr'04 133.75 2,948.73
May'91 107.70 2,374.38 Sep'95 132.25 2,915.52 Jan'00 83.64 1,843.98 May'04 123.99 2,733.50Jun'91 100.50 2,215.64 Oct'95 127.62 2,813.55 Feb'00 81.68 1,800.83 Jun'04 121.87 2,686.70Jul'91 101.20 2,231.08 Nov'95 135.05 2,977.36 Mar'00 78.90 1,739.39 Jul'04 127.39 2,808.43
Aug'91 101.20 2,231.08 Dec'95 132.73 2,926.26 Apr'00 76.15 1,678.75 Aug'04 129.10 2,846.10Sep'91 105.30 2,321.46 Jan'96 118.68 2,616.41 May'00 80.99 1,785.62 Sep'04 131.31 2,894.86Oct'91 107.10 2,361.15 Feb'96 115.11 2,537.71 Jun'00 79.52 1,753.18 Oct'04 136.63 3,012.24Nov'91 107.80 2,376.58 Mar'96 116.17 2,561.02 Jul'00 81.62 1,799.36 Nov'04 141.65 3,122.80Dec'91 100.40 2,213.44 Apr'96 117.74 2,595.78 Aug'00 84.18 1,855.86 Dec'04 142.68 3,145.45Jan'92 97.10 2,140.69 May'96 120.58 2,658.26 Sep'00 88.92 1,960.40 Jan'05 143.79 3,170.00Feb'92 100.00 2,204.62 Jun'96 98.58 2,173.40 Oct'00 86.12 1,898.59 Feb'05 147.59 3,253.70Mar'92 101.10 2,228.87 Jul'96 90.06 1,985.57 Nov'00 81.42 1,795.11 Mar'05 153.30 3,379.60Apr'92 100.50 2,215.64 Aug'96 91.11 2,008.57 Dec'00 83.94 1,850.55 Apr'05 153.97 3,394.48
May'92 100.60 2,217.85 Sep'96 88.06 1,941.45 Jan'01 81.08 1,787.50 May'05 147.38 3,249.10Jun'92 104.20 2,297.21 Oct'96 88.96 1,961.17 Feb'01 80.09 1,765.65 Jun'05 159.85 3,524.07Jul'92 114.40 2,522.09 Nov'96 101.19 2,230.86 Mar'01 78.87 1,738.77 Jul'05 163.94 3,614.21
Aug'92 114.00 2,513.27 Dec'96 102.88 2,268.08 Apr'01 75.49 1,664.16 Aug'05 172.26 3,797.75Sep'92 109.80 2,420.67 Jan'97 110.45 2,434.93 May'01 76.30 1,682.21 Sep'05 174.99 3,857.84Oct'92 102.20 2,253.12 Feb'97 109.13 2,405.85 Jun'01 72.96 1,608.45 Oct'05 184.15 4,059.76Nov'92 97.90 2,158.32 Mar'97 109.13 2,421.29 Jul'01 69.18 1,525.20 Nov'05 193.65 4,269.34Dec'92 100.20 2,209.03 Apr'97 108.46 2,391.18 Aug'01 66.43 1,464.43 Dec'05 207.60 4,576.78Jan'93 102.40 2,257.53 May'97 114.05 2,514.33 Sep'01 64.70 1,426.33 Jan'06 214.75 4,734.33Feb'93 100.40 2,213.44 Jun'97 118.51 2,612.62 Oct'01 62.47 1,377.28 Feb'06 226.00 4,982.40Mar'93 97.60 2,151.71 Jul'97 111.15 2,450.46 Nov'01 64.76 1,427.73 Mar'06 231.46 5,102.85Apr'93 88.50 1,951.09 Aug'97 102.11 2,251.20 Dec'01 66.76 1,471.74 Apr'06 289.75 6,387.78
May'93 81.40 1,794.56 Sep'97 95.59 2,107.30 Jan'02 68.22 1,503.95 May'06 364.95 8,045.86Jun'93 84.10 1,854.09 Oct'97 93.09 2,052.26 Feb'02 70.85 1,561.90 Jun'06 326.48 7,197.61Jul'93 87.40 1,926.84 Nov'97 86.97 1,917.45 Mar'02 72.80 1,604.88 Jul'06 349.82 7,712.10
Aug'93 88.30 1,946.68 Dec'97 79.94 1,762.33 Apr'02 72.14 1,590.33 Aug'06 349.07 7,695.66Sep'93 84.50 1,862.90 Jan'98 76.59 1,688.45 May'02 72.38 1,595.68 Sep'06 344.84 7,602.36Oct'93 74.70 1,646.85 Feb'98 75.51 1,664.80 Jun'02 74.73 1,647.53 Oct'06Nov'93 73.90 1,629.21 Mar'98 79.29 1,747.98 Jul'02 72.10 1,589.46 Nov'06Dec'93 78.20 1,724.01 Apr'98 81.69 1,800.90 Aug'02 67.11 1,479.55 Dec'06Jan'94 81.89 1,805.35 May'98 78.59 1,732.53 Sep'02 67.07 1,478.71 Jan'07Feb'94 84.66 1,866.40 Jun'98 75.32 1,660.52 Oct'02 67.30 1,483.76 Feb'07Mar'94 86.86 1,914.87 Jul'98 74.89 1,651.04 Nov'02 71.77 1,582.29 Mar'07Apr'94 85.36 1,881.82 Aug'98 73.52 1,620.93 Dec'02 72.38 1,595.68 Apr'07
LME Cu Cash Monthly Averages FROM 1990
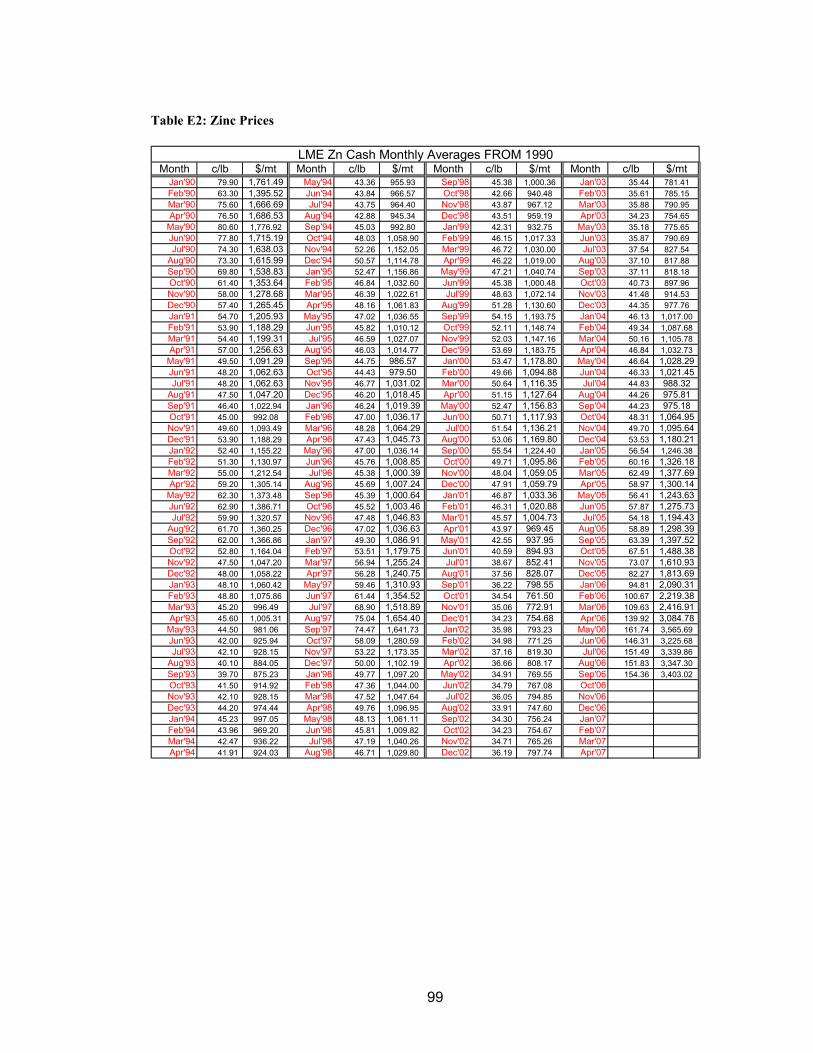
99
Table E2: Zinc Prices
Month c/lb $/mt Month c/lb $/mt Month c/lb $/mt Month c/lb $/mtJan'90 79.90 1,761.49 May'94 43.36 955.93 Sep'98 45.38 1,000.36 Jan'03 35.44 781.41Feb'90 63.30 1,395.52 Jun'94 43.84 966.57 Oct'98 42.66 940.48 Feb'03 35.61 785.15Mar'90 75.60 1,666.69 Jul'94 43.75 964.40 Nov'98 43.87 967.12 Mar'03 35.88 790.95Apr'90 76.50 1,686.53 Aug'94 42.88 945.34 Dec'98 43.51 959.19 Apr'03 34.23 754.65
May'90 80.60 1,776.92 Sep'94 45.03 992.80 Jan'99 42.31 932.75 May'03 35.18 775.65Jun'90 77.80 1,715.19 Oct'94 48.03 1,058.90 Feb'99 46.15 1,017.33 Jun'03 35.87 790.69Jul'90 74.30 1,638.03 Nov'94 52.26 1,152.05 Mar'99 46.72 1,030.00 Jul'03 37.54 827.54
Aug'90 73.30 1,615.99 Dec'94 50.57 1,114.78 Apr'99 46.22 1,019.00 Aug'03 37.10 817.88Sep'90 69.80 1,538.83 Jan'95 52.47 1,156.86 May'99 47.21 1,040.74 Sep'03 37.11 818.18Oct'90 61.40 1,353.64 Feb'95 46.84 1,032.60 Jun'99 45.38 1,000.48 Oct'03 40.73 897.96Nov'90 58.00 1,278.68 Mar'95 46.39 1,022.61 Jul'99 48.63 1,072.14 Nov'03 41.48 914.53Dec'90 57.40 1,265.45 Apr'95 48.16 1,061.83 Aug'99 51.28 1,130.60 Dec'03 44.35 977.76Jan'91 54.70 1,205.93 May'95 47.02 1,036.55 Sep'99 54.15 1,193.75 Jan'04 46.13 1,017.00Feb'91 53.90 1,188.29 Jun'95 45.82 1,010.12 Oct'99 52.11 1,148.74 Feb'04 49.34 1,087.68Mar'91 54.40 1,199.31 Jul'95 46.59 1,027.07 Nov'99 52.03 1,147.16 Mar'04 50.16 1,105.78Apr'91 57.00 1,256.63 Aug'95 46.03 1,014.77 Dec'99 53.69 1,183.75 Apr'04 46.84 1,032.73
May'91 49.50 1,091.29 Sep'95 44.75 986.57 Jan'00 53.47 1,178.80 May'04 46.64 1,028.29Jun'91 48.20 1,062.63 Oct'95 44.43 979.50 Feb'00 49.66 1,094.88 Jun'04 46.33 1,021.45Jul'91 48.20 1,062.63 Nov'95 46.77 1,031.02 Mar'00 50.64 1,116.35 Jul'04 44.83 988.32
Aug'91 47.50 1,047.20 Dec'95 46.20 1,018.45 Apr'00 51.15 1,127.64 Aug'04 44.26 975.81Sep'91 46.40 1,022.94 Jan'96 46.24 1,019.39 May'00 52.47 1,156.83 Sep'04 44.23 975.18Oct'91 45.00 992.08 Feb'96 47.00 1,036.17 Jun'00 50.71 1,117.93 Oct'04 48.31 1,064.95Nov'91 49.60 1,093.49 Mar'96 48.28 1,064.29 Jul'00 51.54 1,136.21 Nov'04 49.70 1,095.64Dec'91 53.90 1,188.29 Apr'96 47.43 1,045.73 Aug'00 53.06 1,169.80 Dec'04 53.53 1,180.21Jan'92 52.40 1,155.22 May'96 47.00 1,036.14 Sep'00 55.54 1,224.40 Jan'05 56.54 1,246.38Feb'92 51.30 1,130.97 Jun'96 45.76 1,008.85 Oct'00 49.71 1,095.86 Feb'05 60.16 1,326.18Mar'92 55.00 1,212.54 Jul'96 45.38 1,000.39 Nov'00 48.04 1,059.05 Mar'05 62.49 1,377.69Apr'92 59.20 1,305.14 Aug'96 45.69 1,007.24 Dec'00 47.91 1,059.79 Apr'05 58.97 1,300.14
May'92 62.30 1,373.48 Sep'96 45.39 1,000.64 Jan'01 46.87 1,033.36 May'05 56.41 1,243.63Jun'92 62.90 1,386.71 Oct'96 45.52 1,003.46 Feb'01 46.31 1,020.88 Jun'05 57.87 1,275.73Jul'92 59.90 1,320.57 Nov'96 47.48 1,046.83 Mar'01 45.57 1,004.73 Jul'05 54.18 1,194.43
Aug'92 61.70 1,360.25 Dec'96 47.02 1,036.63 Apr'01 43.97 969.45 Aug'05 58.89 1,298.39Sep'92 62.00 1,366.86 Jan'97 49.30 1,086.91 May'01 42.55 937.95 Sep'05 63.39 1,397.52Oct'92 52.80 1,164.04 Feb'97 53.51 1,179.75 Jun'01 40.59 894.93 Oct'05 67.51 1,488.38Nov'92 47.50 1,047.20 Mar'97 56.94 1,255.24 Jul'01 38.67 852.41 Nov'05 73.07 1,610.93Dec'92 48.00 1,058.22 Apr'97 56.28 1,240.75 Aug'01 37.56 828.07 Dec'05 82.27 1,813.69Jan'93 48.10 1,060.42 May'97 59.46 1,310.93 Sep'01 36.22 798.55 Jan'06 94.81 2,090.31Feb'93 48.80 1,075.86 Jun'97 61.44 1,354.52 Oct'01 34.54 761.50 Feb'06 100.67 2,219.38Mar'93 45.20 996.49 Jul'97 68.90 1,518.89 Nov'01 35.06 772.91 Mar'06 109.63 2,416.91Apr'93 45.60 1,005.31 Aug'97 75.04 1,654.40 Dec'01 34.23 754.68 Apr'06 139.92 3,084.78
May'93 44.50 981.06 Sep'97 74.47 1,641.73 Jan'02 35.98 793.23 May'06 161.74 3,565.69Jun'93 42.00 925.94 Oct'97 58.09 1,280.59 Feb'02 34.98 771.25 Jun'06 146.31 3,225.68Jul'93 42.10 928.15 Nov'97 53.22 1,173.35 Mar'02 37.16 819.30 Jul'06 151.49 3,339.86
Aug'93 40.10 884.05 Dec'97 50.00 1,102.19 Apr'02 36.66 808.17 Aug'06 151.83 3,347.30Sep'93 39.70 875.23 Jan'98 49.77 1,097.20 May'02 34.91 769.55 Sep'06 154.36 3,403.02Oct'93 41.50 914.92 Feb'98 47.36 1,044.00 Jun'02 34.79 767.08 Oct'06Nov'93 42.10 928.15 Mar'98 47.52 1,047.64 Jul'02 36.05 794.85 Nov'06Dec'93 44.20 974.44 Apr'98 49.76 1,096.95 Aug'02 33.91 747.60 Dec'06Jan'94 45.23 997.05 May'98 48.13 1,061.11 Sep'02 34.30 756.24 Jan'07Feb'94 43.96 969.20 Jun'98 45.81 1,009.82 Oct'02 34.23 754.67 Feb'07Mar'94 42.47 936.22 Jul'98 47.19 1,040.26 Nov'02 34.71 765.26 Mar'07Apr'94 41.91 924.03 Aug'98 46.71 1,029.80 Dec'02 36.19 797.74 Apr'07
LME Zn Cash Monthly Averages FROM 1990
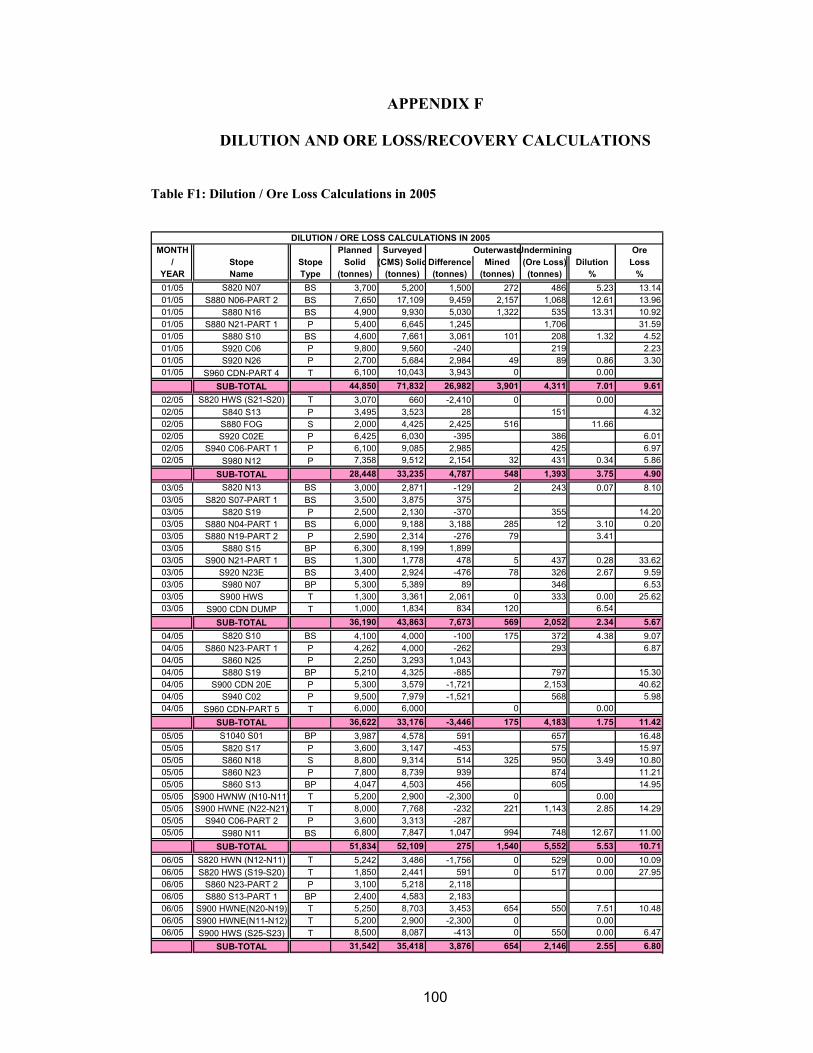
100
APPENDIX F
DILUTION AND ORE LOSS/RECOVERY CALCULATIONS
Table F1: Dilution / Ore Loss Calculations in 2005
DILUTION / ORE LOSS CALCULATIONS IN 2005MONTH Planned Surveyed OuterwasteUndermining Ore
/ Stope Stope Solid (CMS) SolidDifference Mined (Ore Loss) Dilution LossYEAR Name Type (tonnes) (tonnes) (tonnes) (tonnes) (tonnes) % %01/05 S820 N07 BS 3,700 5,200 1,500 272 486 5.23 13.1401/05 S880 N06-PART 2 BS 7,650 17,109 9,459 2,157 1,068 12.61 13.9601/05 S880 N16 BS 4,900 9,930 5,030 1,322 535 13.31 10.9201/05 S880 N21-PART 1 P 5,400 6,645 1,245 1,706 31.5901/05 S880 S10 BS 4,600 7,661 3,061 101 208 1.32 4.5201/05 S920 C06 P 9,800 9,560 -240 219 2.2301/05 S920 N26 P 2,700 5,684 2,984 49 89 0.86 3.3001/05 S960 CDN-PART 4 T 6,100 10,043 3,943 0 0.00
SUB-TOTAL 44,850 71,832 26,982 3,901 4,311 7.01 9.6102/05 S820 HWS (S21-S20) T 3,070 660 -2,410 0 0.0002/05 S840 S13 P 3,495 3,523 28 151 4.3202/05 S880 FOG S 2,000 4,425 2,425 516 11.6602/05 S920 C02E P 6,425 6,030 -395 386 6.0102/05 S940 C06-PART 1 P 6,100 9,085 2,985 425 6.9702/05 S980 N12 P 7,358 9,512 2,154 32 431 0.34 5.86
SUB-TOTAL 28,448 33,235 4,787 548 1,393 3.75 4.9003/05 S820 N13 BS 3,000 2,871 -129 2 243 0.07 8.1003/05 S820 S07-PART 1 BS 3,500 3,875 37503/05 S820 S19 P 2,500 2,130 -370 355 14.2003/05 S880 N04-PART 1 BS 6,000 9,188 3,188 285 12 3.10 0.2003/05 S880 N19-PART 2 P 2,590 2,314 -276 79 3.4103/05 S880 S15 BP 6,300 8,199 1,89903/05 S900 N21-PART 1 BS 1,300 1,778 478 5 437 0.28 33.6203/05 S920 N23E BS 3,400 2,924 -476 78 326 2.67 9.5903/05 S980 N07 BP 5,300 5,389 89 346 6.5303/05 S900 HWS T 1,300 3,361 2,061 0 333 0.00 25.6203/05 S900 CDN DUMP T 1,000 1,834 834 120 6.54
SUB-TOTAL 36,190 43,863 7,673 569 2,052 2.34 5.6704/05 S820 S10 BS 4,100 4,000 -100 175 372 4.38 9.0704/05 S860 N23-PART 1 P 4,262 4,000 -262 293 6.8704/05 S860 N25 P 2,250 3,293 1,04304/05 S880 S19 BP 5,210 4,325 -885 797 15.3004/05 S900 CDN 20E P 5,300 3,579 -1,721 2,153 40.6204/05 S940 C02 P 9,500 7,979 -1,521 568 5.9804/05 S960 CDN-PART 5 T 6,000 6,000 0 0.00
SUB-TOTAL 36,622 33,176 -3,446 175 4,183 1.75 11.4205/05 S1040 S01 BP 3,987 4,578 591 657 16.4805/05 S820 S17 P 3,600 3,147 -453 575 15.9705/05 S860 N18 S 8,800 9,314 514 325 950 3.49 10.8005/05 S860 N23 P 7,800 8,739 939 874 11.2105/05 S860 S13 BP 4,047 4,503 456 605 14.9505/05 S900 HWNW (N10-N11) T 5,200 2,900 -2,300 0 0.0005/05 S900 HWNE (N22-N21) T 8,000 7,768 -232 221 1,143 2.85 14.2905/05 S940 C06-PART 2 P 3,600 3,313 -28705/05 S980 N11 BS 6,800 7,847 1,047 994 748 12.67 11.00
SUB-TOTAL 51,834 52,109 275 1,540 5,552 5.53 10.7106/05 S820 HWN (N12-N11) T 5,242 3,486 -1,756 0 529 0.00 10.0906/05 S820 HWS (S19-S20) T 1,850 2,441 591 0 517 0.00 27.9506/05 S860 N23-PART 2 P 3,100 5,218 2,11806/05 S880 S13-PART 1 BP 2,400 4,583 2,18306/05 S900 HWNE(N20-N19) T 5,250 8,703 3,453 654 550 7.51 10.4806/05 S900 HWNE(N11-N12) T 5,200 2,900 -2,300 0 0.0006/05 S900 HWS (S25-S23) T 8,500 8,087 -413 0 550 0.00 6.47
SUB-TOTAL 31,542 35,418 3,876 654 2,146 2.55 6.80
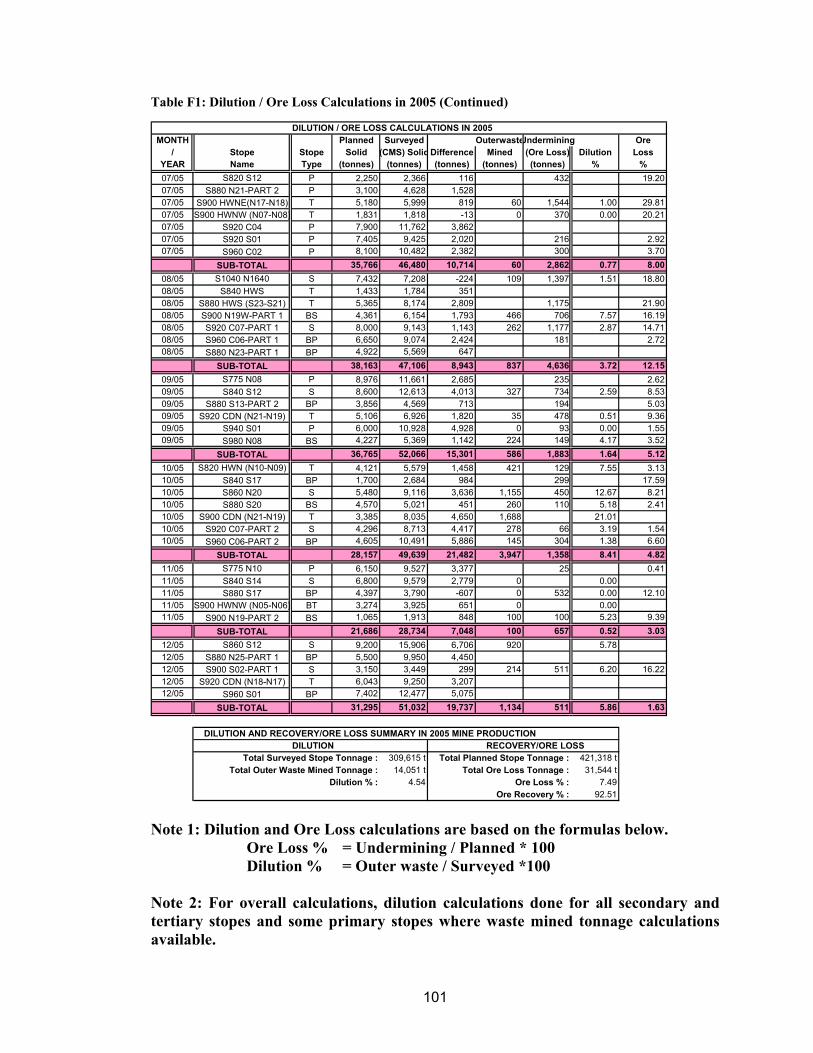
101
Table F1: Dilution / Ore Loss Calculations in 2005 (Continued)
DILUTION / ORE LOSS CALCULATIONS IN 2005MONTH Planned Surveyed OuterwasteUndermining Ore
/ Stope Stope Solid (CMS) Solid Difference Mined (Ore Loss) Dilution LossYEAR Name Type (tonnes) (tonnes) (tonnes) (tonnes) (tonnes) % %07/05 S820 S12 P 2,250 2,366 116 432 19.2007/05 S880 N21-PART 2 P 3,100 4,628 1,52807/05 S900 HWNE(N17-N18) T 5,180 5,999 819 60 1,544 1.00 29.8107/05 S900 HWNW (N07-N08) T 1,831 1,818 -13 0 370 0.00 20.2107/05 S920 C04 P 7,900 11,762 3,86207/05 S920 S01 P 7,405 9,425 2,020 216 2.9207/05 S960 C02 P 8,100 10,482 2,382 300 3.70
SUB-TOTAL 35,766 46,480 10,714 60 2,862 0.77 8.0008/05 S1040 N1640 S 7,432 7,208 -224 109 1,397 1.51 18.8008/05 S840 HWS T 1,433 1,784 35108/05 S880 HWS (S23-S21) T 5,365 8,174 2,809 1,175 21.9008/05 S900 N19W-PART 1 BS 4,361 6,154 1,793 466 706 7.57 16.1908/05 S920 C07-PART 1 S 8,000 9,143 1,143 262 1,177 2.87 14.7108/05 S960 C06-PART 1 BP 6,650 9,074 2,424 181 2.7208/05 S880 N23-PART 1 BP 4,922 5,569 647
SUB-TOTAL 38,163 47,106 8,943 837 4,636 3.72 12.1509/05 S775 N08 P 8,976 11,661 2,685 235 2.6209/05 S840 S12 S 8,600 12,613 4,013 327 734 2.59 8.5309/05 S880 S13-PART 2 BP 3,856 4,569 713 194 5.0309/05 S920 CDN (N21-N19) T 5,106 6,926 1,820 35 478 0.51 9.3609/05 S940 S01 P 6,000 10,928 4,928 0 93 0.00 1.5509/05 S980 N08 BS 4,227 5,369 1,142 224 149 4.17 3.52
SUB-TOTAL 36,765 52,066 15,301 586 1,883 1.64 5.1210/05 S820 HWN (N10-N09) T 4,121 5,579 1,458 421 129 7.55 3.1310/05 S840 S17 BP 1,700 2,684 984 299 17.5910/05 S860 N20 S 5,480 9,116 3,636 1,155 450 12.67 8.2110/05 S880 S20 BS 4,570 5,021 451 260 110 5.18 2.4110/05 S900 CDN (N21-N19) T 3,385 8,035 4,650 1,688 21.0110/05 S920 C07-PART 2 S 4,296 8,713 4,417 278 66 3.19 1.5410/05 S960 C06-PART 2 BP 4,605 10,491 5,886 145 304 1.38 6.60
SUB-TOTAL 28,157 49,639 21,482 3,947 1,358 8.41 4.8211/05 S775 N10 P 6,150 9,527 3,377 25 0.4111/05 S840 S14 S 6,800 9,579 2,779 0 0.0011/05 S880 S17 BP 4,397 3,790 -607 0 532 0.00 12.1011/05 S900 HWNW (N05-N06) BT 3,274 3,925 651 0 0.0011/05 S900 N19-PART 2 BS 1,065 1,913 848 100 100 5.23 9.39
SUB-TOTAL 21,686 28,734 7,048 100 657 0.52 3.0312/05 S860 S12 S 9,200 15,906 6,706 920 5.7812/05 S880 N25-PART 1 BP 5,500 9,950 4,45012/05 S900 S02-PART 1 S 3,150 3,449 299 214 511 6.20 16.2212/05 S920 CDN (N18-N17) T 6,043 9,250 3,20712/05 S960 S01 BP 7,402 12,477 5,075
SUB-TOTAL 31,295 51,032 19,737 1,134 511 5.86 1.63
DILUTION AND RECOVERY/ORE LOSS SUMMARY IN 2005 MINE PRODUCTIONDILUTION RECOVERY/ORE LOSS
Total Surveyed Stope Tonnage : 309,615 t Total Planned Stope Tonnage : 421,318 tTotal Outer Waste Mined Tonnage : 14,051 t Total Ore Loss Tonnage : 31,544 t
Dilution % : 4.54 Ore Loss % : 7.49Ore Recovery % : 92.51
Note 1: Dilution and Ore Loss calculations are based on the formulas below. Ore Loss % = Undermining / Planned * 100 Dilution % = Outer waste / Surveyed *100 Note 2: For overall calculations, dilution calculations done for all secondary and tertiary stopes and some primary stopes where waste mined tonnage calculations available.
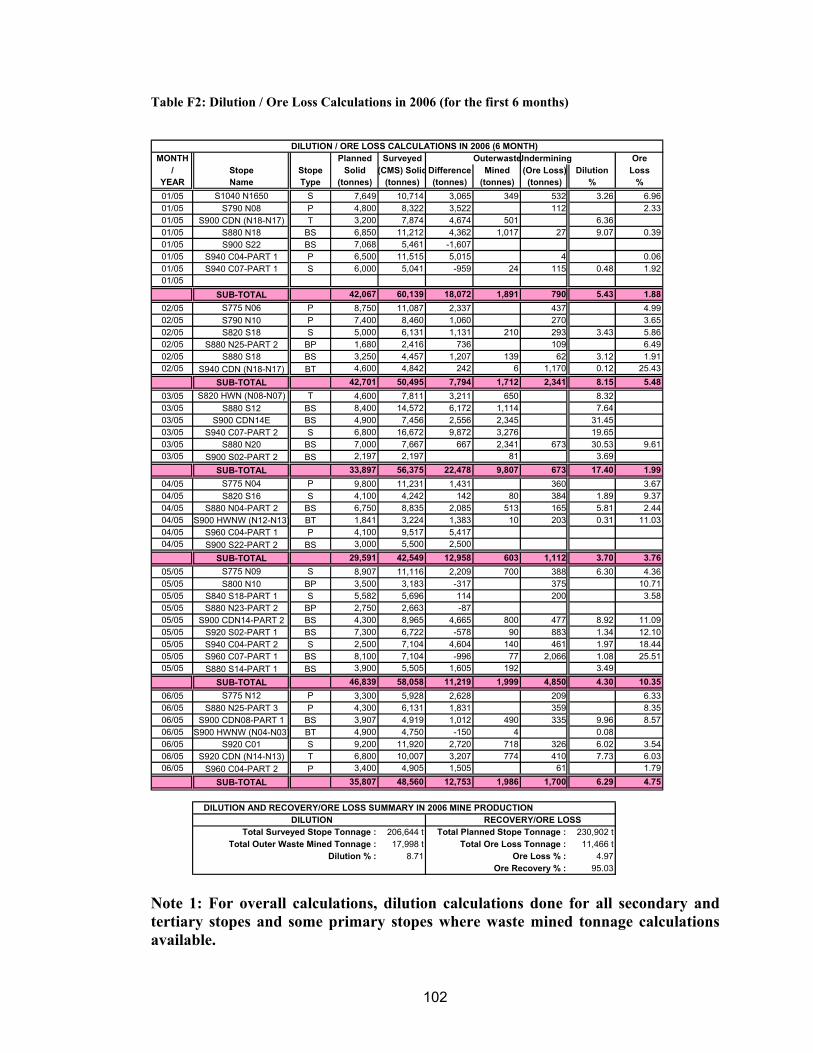
102
Table F2: Dilution / Ore Loss Calculations in 2006 (for the first 6 months)
DILUTION / ORE LOSS CALCULATIONS IN 2006 (6 MONTH)MONTH Planned Surveyed OuterwasteUndermining Ore
/ Stope Stope Solid (CMS) SolidDifference Mined (Ore Loss) Dilution LossYEAR Name Type (tonnes) (tonnes) (tonnes) (tonnes) (tonnes) % %01/05 S1040 N1650 S 7,649 10,714 3,065 349 532 3.26 6.9601/05 S790 N08 P 4,800 8,322 3,522 112 2.3301/05 S900 CDN (N18-N17) T 3,200 7,874 4,674 501 6.3601/05 S880 N18 BS 6,850 11,212 4,362 1,017 27 9.07 0.3901/05 S900 S22 BS 7,068 5,461 -1,60701/05 S940 C04-PART 1 P 6,500 11,515 5,015 4 0.0601/05 S940 C07-PART 1 S 6,000 5,041 -959 24 115 0.48 1.9201/05
SUB-TOTAL 42,067 60,139 18,072 1,891 790 5.43 1.8802/05 S775 N06 P 8,750 11,087 2,337 437 4.9902/05 S790 N10 P 7,400 8,460 1,060 270 3.6502/05 S820 S18 S 5,000 6,131 1,131 210 293 3.43 5.8602/05 S880 N25-PART 2 BP 1,680 2,416 736 109 6.4902/05 S880 S18 BS 3,250 4,457 1,207 139 62 3.12 1.9102/05 S940 CDN (N18-N17) BT 4,600 4,842 242 6 1,170 0.12 25.43
SUB-TOTAL 42,701 50,495 7,794 1,712 2,341 8.15 5.4803/05 S820 HWN (N08-N07) T 4,600 7,811 3,211 650 8.3203/05 S880 S12 BS 8,400 14,572 6,172 1,114 7.6403/05 S900 CDN14E BS 4,900 7,456 2,556 2,345 31.4503/05 S940 C07-PART 2 S 6,800 16,672 9,872 3,276 19.6503/05 S880 N20 BS 7,000 7,667 667 2,341 673 30.53 9.6103/05 S900 S02-PART 2 BS 2,197 2,197 81 3.69
SUB-TOTAL 33,897 56,375 22,478 9,807 673 17.40 1.9904/05 S775 N04 P 9,800 11,231 1,431 360 3.6704/05 S820 S16 S 4,100 4,242 142 80 384 1.89 9.3704/05 S880 N04-PART 2 BS 6,750 8,835 2,085 513 165 5.81 2.4404/05 S900 HWNW (N12-N13) BT 1,841 3,224 1,383 10 203 0.31 11.0304/05 S960 C04-PART 1 P 4,100 9,517 5,41704/05 S900 S22-PART 2 BS 3,000 5,500 2,500
SUB-TOTAL 29,591 42,549 12,958 603 1,112 3.70 3.7605/05 S775 N09 S 8,907 11,116 2,209 700 388 6.30 4.3605/05 S800 N10 BP 3,500 3,183 -317 375 10.7105/05 S840 S18-PART 1 S 5,582 5,696 114 200 3.5805/05 S880 N23-PART 2 BP 2,750 2,663 -8705/05 S900 CDN14-PART 2 BS 4,300 8,965 4,665 800 477 8.92 11.0905/05 S920 S02-PART 1 BS 7,300 6,722 -578 90 883 1.34 12.1005/05 S940 C04-PART 2 S 2,500 7,104 4,604 140 461 1.97 18.4405/05 S960 C07-PART 1 BS 8,100 7,104 -996 77 2,066 1.08 25.5105/05 S880 S14-PART 1 BS 3,900 5,505 1,605 192 3.49
SUB-TOTAL 46,839 58,058 11,219 1,999 4,850 4.30 10.3506/05 S775 N12 P 3,300 5,928 2,628 209 6.3306/05 S880 N25-PART 3 P 4,300 6,131 1,831 359 8.3506/05 S900 CDN08-PART 1 BS 3,907 4,919 1,012 490 335 9.96 8.5706/05 S900 HWNW (N04-N03) BT 4,900 4,750 -150 4 0.0806/05 S920 C01 S 9,200 11,920 2,720 718 326 6.02 3.5406/05 S920 CDN (N14-N13) T 6,800 10,007 3,207 774 410 7.73 6.0306/05 S960 C04-PART 2 P 3,400 4,905 1,505 61 1.79
SUB-TOTAL 35,807 48,560 12,753 1,986 1,700 6.29 4.75
DILUTION AND RECOVERY/ORE LOSS SUMMARY IN 2006 MINE PRODUCTIONDILUTION RECOVERY/ORE LOSS
Total Surveyed Stope Tonnage : 206,644 t Total Planned Stope Tonnage : 230,902 tTotal Outer Waste Mined Tonnage : 17,998 t Total Ore Loss Tonnage : 11,466 t
Dilution % : 8.71 Ore Loss % : 4.97Ore Recovery % : 95.03
Note 1: For overall calculations, dilution calculations done for all secondary and tertiary stopes and some primary stopes where waste mined tonnage calculations available.