Embed Size (px)
Citation preview

An Approach and Case Study
The Right KPIs, Metrics for High-performing, Cost-saving Space Management

Speakers
Mayu Roy Managing Director, Strategic Consulting, Computerized Facilities Integration, LLC Marian Carter Senior Business Consultant, Strategic Consulting, Computerized Facilities Integration, LLC

Agenda • PROBLEM: Unable to get to the right KPIs
• Actionable KPIs (Align with Strategy, objectives and Goals)
• Align with Mature Business Process
• Value of Data Analytics
• Optimize the Business
• Case Studies

Challenges - From Tactical Data to Strategic Decisions
Individual Applications • Data may be incomplete • Data may not be accurately maintained • Data may reside in multiple sources • Data may not be standardized
Data Aggregation • Data consolidated and organized, using data
marts or BI tool directly
Decision Support • Actionable information presented intuitively
Dashboard • The right data is available at the right level
• Inability to extract information from applications • Information is not aggregated • Information is not aligned to strategic goals • Information does not include all KPI data points
Individual Applications • Transaction and Master Data Input

Sample Executive Dashboard
Capital Projects Operations &Maintenance
Capital Budgets
Space Management

What are Key Performance Indicators (KPI) and why are they important…….
• KPIs are quantifiable measurements – Data Driven – Standard Formula with specific units of measure – Actionable – Directional
• KPIs reflect the critical success factors of organizations goals – SMART goals derived from organization mission
• Specific • Measurable • Actionable • Relevant • Time Bound

.
FINANCIAL
EXTERNAL
FOCUS
INTERNAL
FOCUS
GROWTH / INNOVATION
Scorecard Perspectives The points of view from which we will measure performance
The Balanced Scorecard
Define Actionable KPIs tied to Business Objectives

.
FINANCIAL
EXTERNAL
FOCUS
INTERNAL
FOCUS
GROWTH / INNOVATION
"How do we look to shareholders?"
"How do customers see us?"
"What must we excel at?”
"How can we continue to improve and create value?“
Different perspectives encourage the identification of measures that help to inform the answer to the following questions:

.
FINANCIAL
EXTERNAL
FOCUS
INTERNAL
FOCUS
GROWTH / INNOVATION
Enterprise Strategy
RE & F Strategy
Planning Dept Objectives
KPIs & Metrics
Scorecard Levels of Focus The levels within the organization from which we will document strategy and objectives
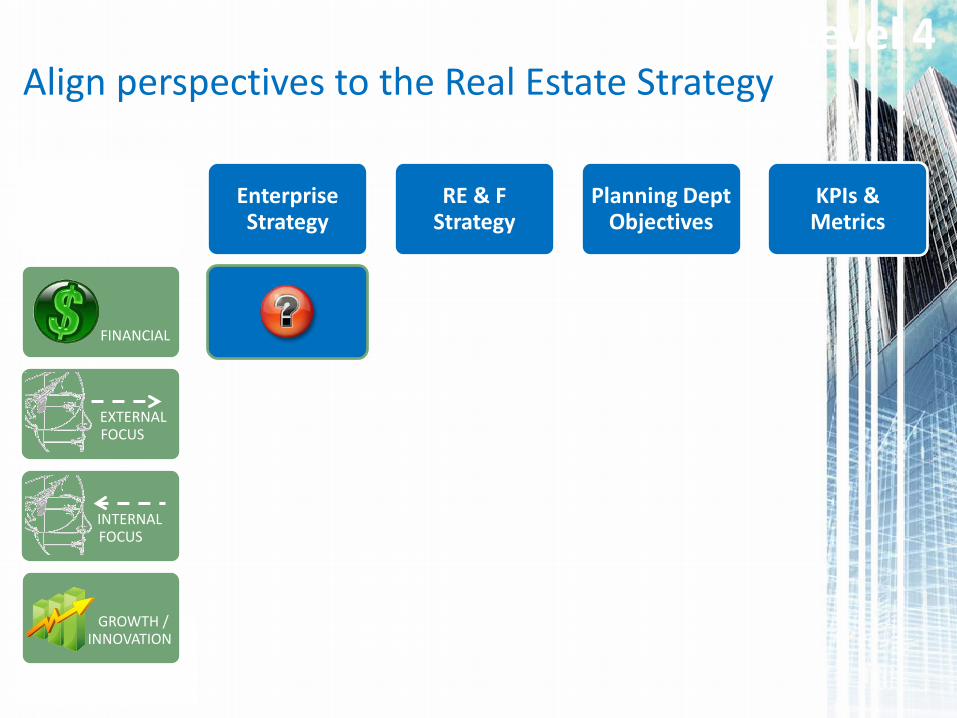
Level 4 Align perspectives to the Real Estate Strategy

Level 4
.
FINANCIAL
EXTERNAL
FOCUS
INTERNAL
FOCUS
GROWTH / INNOVATION
Enterprise Strategy
RE & F Strategy
Planning Dept Objectives
KPIs & Metrics
Align perspectives to the Real Estate Strategy

Level 4
.
FINANCIAL
EXTERNAL
FOCUS
INTERNAL
FOCUS
GROWTH / INNOVATION
Enterprise Strategy
RE & F Strategy
Planning Dept Objectives
KPIs & Metrics
Align perspectives to the Real Estate Strategy
Level 4
.
FINANCIAL
EXTERNAL
FOCUS
INTERNAL
FOCUS
GROWTH / INNOVATION
Enterprise Strategy
RE & F Strategy
Planning Dept Objectives
KPIs & Metrics
Align perspectives to the Real Estate Strategy

.
FINANCIAL
EXTERNAL
FOCUS
INTERNAL
FOCUS
GROWTH / INNOVATION
Enterprise Strategy
RE & F Strategy
Planning Dept Objectives
KPIs & Metrics
Financial > Enterprise Strategic Goal _____________________
“To maximize return on investments and to enable faster M&A integrations”
Level 4 Align perspectives to the Real Estate Strategy

.
FINANCIAL
EXTERNAL
FOCUS
INTERNAL
FOCUS
GROWTH / INNOVATION
Enterprise Strategy
To maximize return on investments and to enable faster M&A integrations
RE & F Strategy
Planning Dept Objectives
KPIs & Metrics
Financial > RE & F Strategic Goal _____________________
“Continually optimize real estate portfolio and reduce cost by effective planning”
Level 4 Align perspectives to the Real Estate Strategy

.
FINANCIAL
EXTERNAL
FOCUS
INTERNAL
FOCUS
GROWTH / INNOVATION
Enterprise Strategy
To maximize return on investments and to enable faster M&A integrations
RE & F Strategy
Continually optimize real estate portfolio and reduce cost by effective planning
Planning Dept Objectives
KPIs & Metrics
Financial > Business Unit Objective _____________________
• Aggressive cost reduction • Reduction of RE footprint • ROI on Refurb or dispositions
Level 4 Align perspectives to the Real Estate Strategy

.
FINANCIAL
EXTERNAL
FOCUS
INTERNAL
FOCUS
GROWTH / INNOVATION
Enterprise Strategy
To maximize return on investments and to enable faster M&A integrations
RE & F Strategy
Continually optimize real estate portfolio and reduce cost by effective planning
Planning Dept Objectives
- Aggressive cost reduction - Reduction of RE footprint - ROI on Refurb on dispositions
KPIs & Metrics
Financial > KPIs & Metrics _____________________
• Rental Cost per S.F. • Depreciation Cost • Revenue / Business Group
Level 4 Align perspectives to the Real Estate Strategy

.
FINANCIAL
EXTERNAL
FOCUS
INTERNAL
FOCUS
GROWTH / INNOVATION
Enterprise Strategy
To maximize return on investments and to enable faster M&A
integrations
To deliver services excellence at reduced
costs
To enhance business performance through
actionable information
To support business growth
RE & F Strategy
To continually optimize real estate portfolio and reduce cost by effective
planning
To deliver globally compliant facilities and
services
To develop framework and tools to implement
the Enterprise Vision
To develop world class leadership and technical capability with the right
behaviours to ensure RE&F success
Planning Dept Objectives
- Aggressive cost reduction - Reduction of RE footprint - ROI on Refurbishments or dispositions
Provide Accurate Timely and Efficient Reporting of Relevant Information
Delivery of integrated workplace solutions Assurance of compliant & resilient facilities
Development of our people
KPIs & Metrics
- Cost of Occupancy - Depreciation Cost - Revenue / Business Group - Churn
- Time to respond to requests
- % of Vacancy - Design Capacity v. Actual Capacity - Shared v. Dedicated Space - Space per Person
- Data Quality Index
Level 4 Align perspectives to the Real Estate Strategy

Capability Maturity Model
Undefined Business Process
Defined Business Process
Automated Business Process
Measured Business Process
Optimized Business Process
Documented Processes, Reportable,
Standardized, and
Communicated
Level 3
Reactive ad hoc Process
Level 2
Dysfunctional Processes,
Unpredictable, Chaotic
Level 1
Managed and Measured Processes
Level 4
Self-Optimizing Processes
Continuous Improvement
Level 5
Maturity
Capa
bilit
y
High Productivity High Quality Lower Cost
Ad Hoc Trial and Error Low Productivity
The term "maturity" relates to the degree of formality and optimization of processes

Ope
ratio
nal
Man
agem
ent
Exec
utiv
e Re
al E
stat
e &
Fac
ilitie
s Org
aniza
tion
Requestors Service Providers
EXAMPLE PROCESS: Move Request
Undefined Business Process
Defined Business Process
Automated Business Process
Measured Business Process
Optimized Business Process
Process Maturity

Ope
ratio
nal
Man
agem
ent
Exec
utiv
e Re
al E
stat
e &
Fac
ilitie
s Org
aniza
tion
Requestors Service Providers
EXAMPLE PROCESS: Move Request
Undefined Business Process
Defined Business Process
Automated Business Process
Measured Business Process
Optimized Business Process
Process Maturity

Ope
ratio
nal
Man
agem
ent
Exec
utiv
e Re
al E
stat
e &
Fac
ilitie
s Org
aniza
tion
Requestors Service Providers
EXAMPLE PROCESS: Move Request
Undefined Business Process
Defined Business Process
Automated Business Process
Measured Business Process
Optimized Business Process
Satisfaction
Closeout
Approval
Auto Assignment
IWMS APPLICATION
Process Maturity

Ope
ratio
nal
Man
agem
ent
Exec
utiv
e Re
al E
stat
e &
Fac
ilitie
s Org
aniza
tion
Requestors Service Providers
EXAMPLE PROCESS: Move Request
Undefined Business Process
Defined Business Process
Automated Business Process
Measured Business Process
Optimized Business Process
IWMS APPLICATION
Satisfaction
Closeout
Approval
Establish Objective
Increase customer satisfaction ratings
Establish Measure
Time to complete Moves Target Benchmark
Process Maturity

Better correlation of data to business measures
Data Quality Metrics
Accuracy
Completeness
Timeliness
Operational Metrics
Customer Satisfaction
Productivity
Utilization
Financial Metrics
Cost per Unit
Revenue per Unit
RE Data
Space Data
Financial data
HR Data
Business Process
Maintenance Data
Infrastructure Data
Sour
ce S
yste
ms

From data source to KPI
Supply Chain Asset Management
Diagnostic Metrics
Data in Silos
Aggregated and Distributed Metrics
1 1
Strategic KPIs
Management-Level (Performance Indicators)
Operational Metrics (Indicators)
Total Amount of Space Cost per Area (sf) or Headcount
Total RE Obligations per building Lease Costs
Cost of Operations
Δ Costs Δ Revenue
Total Headcount per Building/Floor Total Capacity per Building/Floor
Total Expense per Cost center Amount of vacant or unoccupied space for entire property
portfolio (Sq. feet / sq. meters and average %
Total % Utilization (by Building by Floor) Space Supply versus Demand (forecasted)
Area (sf) per person per Building Space Cost per RSF ($) (before/after planning)
Organizational Profile of Space (past/present/future) Churn rate

Area (s. f.) per Person
417
225 -46%
Cost per Area (s. f.)
$55.00
$48.40 -12%
Maximize
Space Efficiency
Maximize
Personnel Utilization
Increase Process
Efficiencies
Maximize
Space Use Economics
Identify consolidation Opportunities
Maximize disposition cycle times Implement space Standards
Execute alternative workplace strategies
Move from Class A Space to Class B/C (where appropriate)
Implement selective outsourcing strategies Reduce headcount (where appropriate)
Reduce service levels (where appropriate)
Reduce energy expenses
Leverage technology to improve workflow
DRIVER: Reduce Costs by 50%
Key Performance Drivers
Actions
(Operations)
Total Cost per Person $22,935
$10,890 -53%
Undefined Business Process
Defined Business Process
Automated Business Process
Measured Business Process
Optimized Business Process
Decision Support and Data Analytics

Global Real Estate Scorecard Current
Target

CASE STUDY 1 GlaxoSmithKline

Knowledge Management Strategic Goal:
Goal: • Optimizing real estate and facility asset performance
by ensuring data transparency to support strategic decisions and performance measurement
Components: • Data Aggregation: Develop information streams to
consistently obtain key data from various and disparate source systems.
• Decision Support: Utilize data to understand and actively manage the performance of WREF assets and RE holdings
Scope: • Key information required by COER to actively manage
the property portfolio
Benefits (Value Proposition): • Informed real estate and facility decision-making • Single-point of data access/one interface • Seamless data sharing between processes and teams • Quality control on the information • Tight Integration to other corporate systems • All site facility data in place with high degree of
accuracy

GSK Project Approach and Outcomes
Approach
KPIS and Metrics
Where are these data points? Who owns them? Are
systems/processes that can manage these data?
Areas of Focus to execute strategy
Implementation program with process, resource and
technology
Outcomes
Prioritization of critical metrics
Gaps identified Operational and Financial measures
Strategic roadmap that clearly lays out an approach to close
the gaps identified
Financial and operational benefits of access to more
accurate data
Assessment
Analysis
Roadmap and benefits
Plan and budget

Assessment and Planning Assessment Analysis Strategy Action Plan
Baseline KPIs and Metrics
Prioritization
Data
Management Practices
•Occupancy Cost – Gross profit •Total Facility Cost •Revenue / Business Group
Strategic Level
• Shared Space v. Dedicated Space Ratio • Space per Person •Building Efficiency Ratio
Management Level
•Contractor-Occupied Space •Utilization/Workstation •Vacancy count •Designed Capacity v. Actual
Capacity
Operational Level
•Exception Reports •Data policies •Data Standards •Performance Monitoring
Data Management Level

0
1
2
3
4
5
Utilization /Workstation
Vacancy
DesignedCapacity v.
Actual Capacity
BuildingEfficiency Ratio
Shared Space v.Dedicated Space
Ratio
Space per Person Office toConferenceRoom Ratio
RedundantSupport Space
GSK Data / Process
TRIRIGA Schema
Target UL
Target LL
Assessment and Planning Assessment Analysis Strategy Action Plan
Data Gap Analysis • Availability /Accessibility • Standardization • Policies /Performance monitoring

Assessment and Planning Assessment Analysis Strategy Action Plan
Strategy Initiatives and Projects
Enterprise Strategic Goals
RE&F Strategic Data Goals Key Measures Gaps Focus Areas
Deliv
er m
ore
prod
ucts
of v
alue
• Focusing on excellence in service delivery
• Understanding and meeting our GSK customers needs
• Provide Accurate Timely and Efficient Reporting of Relevant Information
• Delivery of integrated workplace solutions
Operational Measures • Alternative Use Environment
Usage (e.g., SMART Working) • Ratio of Enclosed Space to
Open Office • Time-Motion Studies to
Identify Fluctuations of Use
Operational Measures • Time-Motion Studies to
Identify Fluctuations of Use
• Space Occupancy and Utilization
Sim
plify
ope
ratin
g th
e
mod
el
• Driving innovation and continuous improvement
• Aggressive cost reduction and financial governance
• Reduction of real estate footprint
• ROI on refurbishing buildings /Dispositions
• Financial Savings • Occupancy Evaluation
Efficiency Measures • Utilization/Workstation
vacancy • Designed Capacity v. Actual
Capacity • Building Efficiency Ratio • Shared Space v. Dedicated
Space Ratio • Redundant Support Space
Efficiency Measures • NO GAPS
• Reporting
Build
Tru
st
• Leverage our expertise and relationships to affect change and efficiencies in our real estate footprint
• Aggressive cost reduction and financial governance
• Reduction of real estate footprint
• ROI on refurbishing buildings /Dispositions
• Financial Savings • Occupancy Evaluation
Economic Measures • Rental cost per sqft or sqm • Depreciation cost • Churn Rate • Occupancy Cost – Revenue • Occupancy Cost – Gross
profit
Economic Measures • Depreciation cost • Revenue / Business
Group • Churn Rate • Occupancy Cost –
Revenue • Occupancy Cost – Gross
profit
• Financial Data – Occupancy Costs and Rental costs

Key Components per Work Stream Business Impact
Space Occupancy and Utilization
Occupancy Costs
Key Components
1. Space Utilization Team 2. Process Documentation 3. Data Collection process 4. System (tool) selection /
Implementation
1. Occupancy Cost Team 2. Integration Specifications
Business Impact
• Trending space efficiencies >> Footprint reduction and optimize operations
• Accurate data on utilization >> Cost reduction with effective planning
• Targeted financial savings
>> Efficiency in capturing and analyzing Occupancy Costs
Work Stream
Summary: Strategic Components

Key Components per Work Stream Business Impact
Financial and Decision Support
Data Governance / Data Quality
Key Components
1. Financial Data Team 2. Cost Data Analysis 3. Integration Specifications 4. Reporting and Analytical Tools 5. Total Facility Cost (TFC)
1. Standards Documentation 2. Policy Adherence 3. Audit Processes 4. Data Quality Index 5. Data Visualization Tool
Business Impact
• Access to financial costs and revenue >> Opportunities for cost reduction and increased productivity
• Easy access to data >> Significant increase in customer satisfaction. Facility information to support M&A
Work Stream
Summary: Strategic Components

Lease Revenue
Payment - Receivable
Payment - Payable
Assessment and Planning Assessment Analysis Strategy Action Plan
Short Term
Medium Term
Long Term
1Q 2Q 3Q 4Q 1Q 2Q 3Q 4Q 1Q 2Q 3Q 4Q
Phas
es
1 2 3 In
dica
tive
Initi
ativ
es
Lease Payment and Measures
Performance Measurement
Lease Cost and Measure
Data Visualization -Platform
Space Cost and Measures
RE Customer Satisfaction
Data Visualization -Prototypes
Data Governance - Data Standards Data Governance – Process/Controls
RE Industry Performance
Metrics
Non-WREF Sites Conversion Planning
RE Operations Industry Reporting
Mea
sure
s Res
ultin
g fr
om In
itiat
ives
Rent Obligation (current)
Footprint Reduction
Critical Dates
Cost per Person (base rent)
Non-rent Occupancy Cost
Churn Rate
Cost per Area (s.f/m)
Space Utilization
Rent Obligation (term)
Space Occupancy
Cost to Revenue
Cost to Gross Profit
Asset Valuation
Design Capacity vs. Actual Capacity
Shared Space vs. Dedicated Space
Revenue per Business Group/Entity
Initiatives
KPIs

New York Presbyterian Hospital– Case Study 2
Space Management • Risk of incomplete planning
information and missed revenue opportunities:
Infrastructure Management • Reputational Risk resulting from
poor visual appearance: Regulatory Compliance • Life Safety Risk resulting from non-
compliance with regulatory standards:
Work Order Management • Client/Patient Satisfaction Risk with
poor work management processes: Business Intelligence • Lack of unified Business Process
Measurement and Management:
Benefits/Results Business Challenge
‒ Productivity increased by 30 %. ‒ Patient satisfaction scores shows an
overall improvement in the patient experience related to the physical environment.
‒ Decrease in Fire/Smoke incidents by 25% (high priority)
‒ Average work request response time reduced by 64%
‒ Scored a 100 % during the Joint Commission survey with $1.6 M savings in the first year

1. Align KPIs to RE&F business drivers and enterprise wide objectives • Align goal, objectives and actionable measures • Enable performance management and decision
support
2. Focus on data accuracy and accessibility • Measure your performance and optimize the
business to decrease cost
3. Focus on process maturity • Increase efficiencies in operations • Increase customer satisfaction
Summary : The Tradeline Three