Embed Size (px)
Citation preview
AN APPLICATION OF THE RAIL-SERVQUAL MODEL FOR IMPROVING SERVICE QUALITY AT A SELECTED RAIL ORGANISATION IN SOUTH AFRICA
ZUKO LUKROZO
of Technology: Business Administration
Business and Management Sciences
Dr Bingwen Yan Dr Samuel O. Olutuase
September 2020
ii
DECLARATION
I, Zuko Lukrozo, Student Number 213094991, declare that the contents of this thesis represent
my unaided work and that the dissertation/thesis has not previously been submitted for
academic examination towards any qualification. Furthermore, it represents my own opinions
and not necessarily those of the Cape Peninsula University of Technology.
Signed Date
iii
ABSTRACT
Transport availability and accessibility impact global development designs and can be a lift or
a snag to the financial development of the country. Therefore, it’s important to continuously
evaluate the service quality of any transport service to increase customer satisfaction.
Customers are becoming more conscious of their needs. Customer preferences and attitudes
are rapidly changing, making it more difficult for service providers to effectively and efficiently
assess and operate services. The purpose of the study was to measure the quality of service
delivered by the railway organisation, using the modified SERVQUAL approach
(RAILSERVQUAL), in South Africa for passenger rail to monitor and improve its services and
increase competitiveness among the transport industry. The study discussed the importance
of service quality within public transport, particularly the railway industry. The methods and
instruments applicable to evaluate the level of service quality within the railway industry were
also addressed.
This study employed a quantitative methodology to investigate the phenomena being
investigated. This research was undertaken ethically to protect all participants as well as the
integrity of the University which granted the ethical clearance before data collection proceeded.
A survey method was used to collect quantitative data from 110 respondents at different
junction stations. The survey aimed to identify the participant’s opinions regarding the service
quality of the passenger railway. The questionnaires were administered to conveniently
selected respondents based on their willingness to participate in the study. The data were
stored on the Microsoft Office Excel sheet before being imported into the statistic software kit
SPSS version 26. Thereafter a factor analysis and one-sample t-test were used to analyse
datasets for this study.
The key finding is that passengers perceived that the rail transport network in the Western
Cape did not meet their expectations. Passengers identified variables such as reliability, safety
and comfort which they perceive are of poor service. The RAILSERVQUAL measuring
instrument was tested in this study and it can be used for all the railway organisations in various
regions of South Africa. It further provides railway managers guidelines on how to monitor,
control, and enhance the service quality or performance and attractiveness. The study,
therefore, recommends that the railway organisation put strategies in place to address these
variables to improve customer satisfaction.
iv
ACKNOWLEDGEMENTS
This research project is a synergistic product of many minds. I am grateful for the inspiration
and wisdom of many thinkers and sources of this wisdom.
I am also grateful to many students, friends and colleagues at the Cape Peninsula University
of Technology who have given feedback and encouragement. For the development and
production of this thesis itself, I feel a deep sense of gratitude.
I wish to thank:
My supervisor, Prof Bingwen Yan for his support. Thank you for reassuring me in my
pursuit of a completed thesis. I could not have done this without you.
My co-supervisor, Dr Samuel O. Olutuase for his support and assistance. This thesis
could not have been in this quality without his guidance.
v
TABLE OF CONTENTS DECLARATION ..................................................................................................................... ii
ABSTRACT ........................................................................................................................... iii
ACKNOWLEDGEMENTS ..................................................................................................... iv
ABBREVIATIONS AND ACRONYMS ................................................................................... xii
GLOSSARY ......................................................................................................................... xiii
CHAPTER 1 : SCOPE OF STUDY ........................................................................................ 1
1.1 Introduction .............................................................................................................. 1
1.2 Background to service quality .................................................................................. 1
1.3 Problem statement ................................................................................................... 2
1.4 Rationale and significance of the study .................................................................... 4
1.5 Aim and objectives of the study ............................................................................... 4
1.6 Research Objectives ................................................................................................ 4
1.7 Research questions ................................................................................................. 5
1.8 Research process .................................................................................................... 5
1.9 Research design and methodology .......................................................................... 6
1.10 Population and sampling.......................................................................................... 7
1.11 Ethical consideration ................................................................................................ 8
1.12 Demarcation/Limitation of the study ......................................................................... 8
1.13 Theoretical contribution ........................................................................................... 9
1.14 Chapter Outline ..................................................................................................... 10
1.15 Conclusion ............................................................................................................. 11
CHAPTER 2 : LITERATURE REVIEW ................................................................................. 12
2.1 Introduction and Background ................................................................................. 12
2.2 Public Transportation ............................................................................................. 12
2.2.1 Railway public transportation .......................................................................... 13
2.3 Description of services ........................................................................................... 13
2.4 Description of quality ............................................................................................. 14
2.5 Conceptual framework of service quality ................................................................ 14
vi
2.5.1 Defining service quality ................................................................................... 15
2.5.2 History of service quality ................................................................................. 16
2.5.3 Service quality gap model ............................................................................... 16
2.5.3.1 Gap 1: Customer expectation vs management perception ....................... 17
2.5.3.2 Gap 2: Service quality specification vs management perception .............. 18
2.5.3.3 Gap 3: Service delivery vs service quality specifications .......................... 18
2.5.3.4 Gap 4: Service delivery vs external communication ................................. 19
2.5.3.5 Gap 5: Perceived service vs expected service ......................................... 19
2.5.4 Indication of service quality ............................................................................. 20
2.5.4.1 Customer satisfaction .............................................................................. 20
2.5.5 Determinants of service quality ....................................................................... 21
2.5.6 Need for service quality .................................................................................. 22
2.5.7 Benefits of service quality ............................................................................... 23
2.5.8 Detriments of poor service quality ................................................................... 23
2.6 Measuring service quality ...................................................................................... 23
2.6.1 Five dimensions of service quality .................................................................. 24
2.6.1.1 Reliability ................................................................................................. 25
2.6.1.2 Responsiveness ...................................................................................... 25
2.6.1.3 Assurance ............................................................................................... 26
2.6.1.4 Empathy .................................................................................................. 26
2.6.1.5 Tangibles ................................................................................................. 26
2.6.2 Limitations to SERVQUAL .............................................................................. 26
2.7 Measuring service quality in railway public transportation ...................................... 27
2.7.1 Measuring service quality using SERVQUAL .................................................. 29
2.7.2 Measuring service quality using RAILQUAL.................................................... 29
2.7.3 Measuring service quality using RECSA ......................................................... 30
2.7.4 Six dimensions of the RAIL-SERVQUAL model .............................................. 30
2.7.5 The modifications of the SERVQUAL model ................................................... 31
2.8 Areas to improve service quality ............................................................................ 33
2.9 Conclusion ............................................................................................................. 35
CHAPTER 3 : RESEARCH DESIGN AND METHODOLOGY .............................................. 36
3.1 Introduction ............................................................................................................ 36
vii
3.2 Research Paradigm, methods, and methodology .................................................. 36
3.3 Research approach ............................................................................................... 37
3.4 Research population and selection of the sample .................................................. 37
3.4.1 Sampling ........................................................................................................ 37
3.4.2 Sampling technique ........................................................................................ 38
3.4.3 Sampling size ................................................................................................. 38
3.5 Data collection ....................................................................................................... 38
3.5.1 Pilot study ....................................................................................................... 39
3.5.2 Data collection for the main study ................................................................... 39
3.6 Data Analysis ......................................................................................................... 39
3.6.1 Validity ............................................................................................................ 40
3.6.2 Reliability ........................................................................................................ 40
3.7 Ethical consideration .............................................................................................. 40
3.8 Conclusion ............................................................................................................. 41
CHAPTER 4 : RESULTS AND DISCUSSION OF FINDINGS .............................................. 42
4.1 Introduction ............................................................................................................ 42
4.2 Demographic profile ............................................................................................... 42
4.2.1 Gender ........................................................................................................... 43
4.2.2 Age ................................................................................................................. 44
4.2.3 Occupation ..................................................................................................... 45
4.2.4 Purpose of using railway service..................................................................... 45
4.2.5 Section of travel .............................................................................................. 46
4.2.6 Frequency of use ............................................................................................ 46
4.3 Variables in the Study ............................................................................................ 47
4.4 Normality Test ....................................................................................................... 47
4.5 Exploratory and Confirmatory Analysis .................................................................. 48
4.6 Confirmatory Factor Analysis ................................................................................. 50
4.6.1 Construct Validity ............................................................................................ 50
4.6.2 Discriminant validity ........................................................................................ 51
4.6.3 Convergent validity ......................................................................................... 52
viii
4.6.4 Composite Reliability ...................................................................................... 52
4.7 Results .................................................................................................................. 52
4.7.1 Objective One ................................................................................................. 53
4.7.2 Objective Two ................................................................................................. 54
4.7.2.1 Reliability dimension ................................................................................ 55
4.7.2.2 Safety and security dimension ................................................................. 56
4.7.2.3 Comfort dimension .................................................................................. 57
4.7.2.4 Affordability, access and service coverage dimensions ........................... 59
4.7.2.5 Customer services and professionalism dimension ................................. 60
4.7.3 Objective Three .............................................................................................. 60
4.8 Discussion of Findings ........................................................................................... 61
4.8.1 Determinants of Railway Service Quality ........................................................ 61
4.8.2 The Overall Service Quality ............................................................................ 62
4.8.3 Top Priority Areas of Railway Service Quality ................................................. 63
4.9 Conclusion ............................................................................................................. 65
CHAPTER 5 : CONCLUSION AND RECOMMENDATIONS ................................................ 66
5.1 Introduction ............................................................................................................ 66
5.2 Key findings ........................................................................................................... 66
5.2.1 Addressing research questions ....................................................................... 66
5.2.2 The determinants of passenger satisfaction of service quality ........................ 66
5.2.2.1 The level of customer experience on the service quality .......................... 67
5.2.2.2 The areas in service quality improvement ................................................ 67
5.2.3 Overall key findings ........................................................................................ 67
5.3 Study limitations .................................................................................................... 68
5.4 Recommendation for practice and future study ...................................................... 68
5.5 Conclusion ............................................................................................................. 68
REFERENCES .................................................................................................................... 70
ix
LIST OF FIGURES
Figure 1.1: Western Cape Region railway network ................................................................ 9
Figure 2.1: Service Quality Gap Model ................................................................................ 17
Figure 2.2: SERVQUAL Dimension ...................................................................................... 25
Figure 2.3: Structure of the proposed methodology ............................................................. 28
Figure 2.4: Conceptual framework for measuring railway passenger service quality ............ 29
Figure 2.5: Railway Service Quality (RAILSERVQUAL) Model ............................................ 31
Figure 2.6: Model for improving service quality measurement .............................................. 35
Figure 4.1: Gender of the respondents ................................................................................ 44
Figure 4.2: Age of respondents ............................................................................................ 44
Figure 4.3: Occupation of respondents ................................................................................ 45
Figure 4.4 Respondent’s purpose of using railway service ................................................... 45
Figure 4.5: Respondent’s’ section of travel .......................................................................... 46
Figure 4.6: Respondent’s frequency of use of the railway services ...................................... 47
Figure 4.7: RAILSERVQUAL Confirmatory Factor Model ..................................................... 50
Figure 4.8: Passenger experience on provision of on-time train service (punctuality)........... 55
Figure 4.9: Passenger experience on regular train service with no breakdown and accidents
............................................................................................................................................ 56
Figure 4.10: Level of customer experience on the visibility of security personnel on trains .. 56
Figure 4.11: Level of customer experience on the visibility of security personnel on trains .. 57
Figure 4.12: Level of customer experience on the tidiness of trains ..................................... 58
Figure 4.13: Level of customer experience on seat conditions of the trains .......................... 58
Figure 4.14: Level of customer experience on stability and comfort during the ride .............. 59
Figure 4.15: the level of customer experience on the rate on which ticket price increase ..... 59
Figure 4.16: Research model for determinants of passenger satisfaction on Railway service
quality .................................................................................................................................. 62
Figure 4.17: Benefits derived from improved contact/communication ................................... 64
x
LIST OF TABLES Table 4-1: Demographics of study participants (N=100)....................................................... 43
Table 4-2: Variable of the study ........................................................................................... 47
Table 4-3: Descriptive statistics and normality estimates of construct indicators .................. 48
Table 4-4: Pattern matrix for extracted factors and items ..................................................... 49
Table 4-5: Critical and obtained model fit indices ................................................................. 51
Table 4-6: Critical and obtained mode fit indices .................................................................. 51
Table 4-7: Master validity output for study constructs ........................................................... 52
Table 4-8: Extracted indicators of service quality constructs (variables) ............................... 53
Table 4-9: One-sample t-Test of customer’s experience of service railway quality ............... 54
Table 4-10: Estimated improvement and performance in Service quality indicators ............. 61

xi
APPENDICES APPENDIX A: REQUEST FOR DATA COLLECTION ....................................................... 76
APPENDIX B : LETTER OF CONSENT FROM THE INSTITUTION ................................... 77
APPENDIX C: ETHICS FORM ............................................................................................ 79
APPENDIX D: STUDY QUESTIONNAIRE .......................................................................... 80
xii
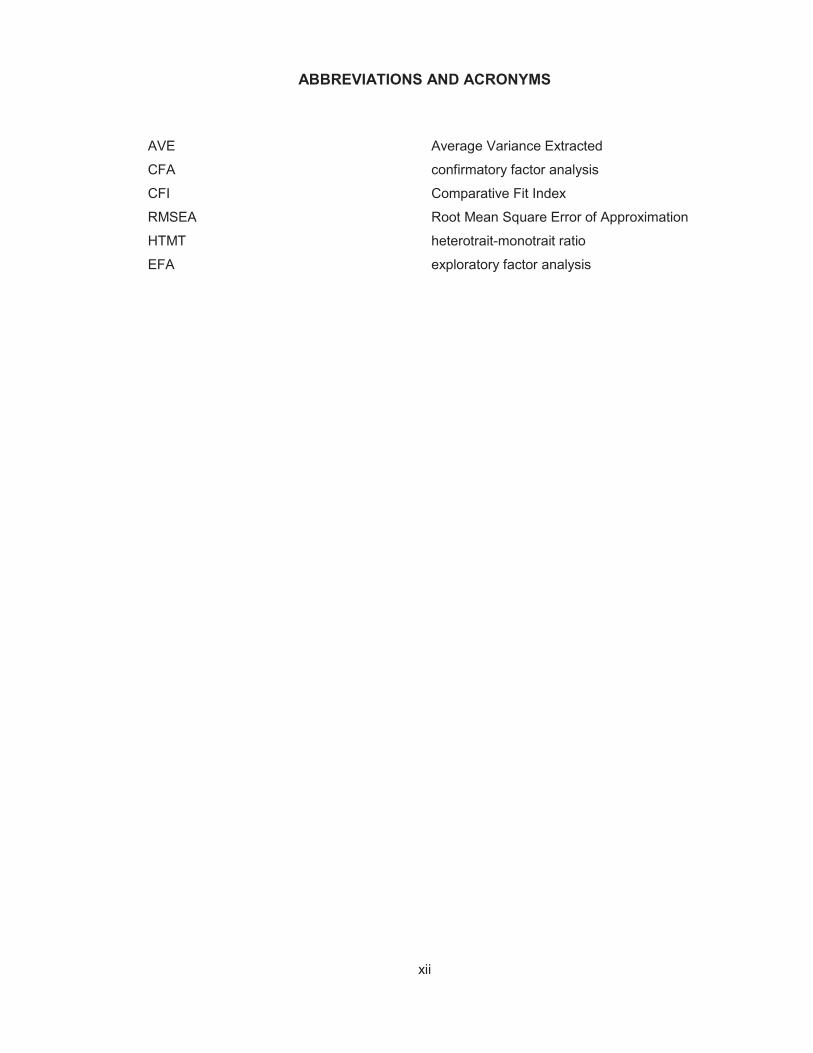
ABBREVIATIONS AND ACRONYMS
AVE Average Variance Extracted
CFA confirmatory factor analysis
CFI Comparative Fit Index
RMSEA Root Mean Square Error of Approximation
HTMT heterotrait-monotrait ratio
EFA exploratory factor analysis
xiii
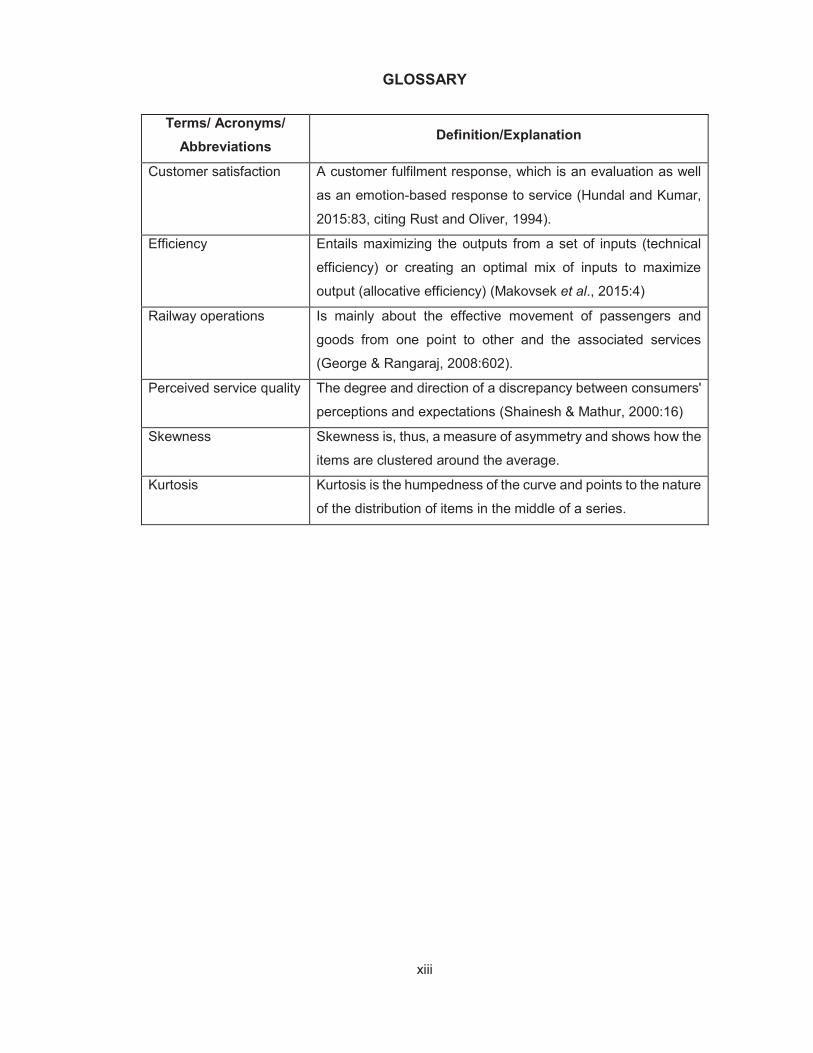
GLOSSARY
Terms/ Acronyms/ Abbreviations
Definition/Explanation
Customer satisfaction A customer fulfilment response, which is an evaluation as well
as an emotion-based response to service (Hundal and Kumar,
2015:83, citing Rust and Oliver, 1994).
Efficiency Entails maximizing the outputs from a set of inputs (technical
efficiency) or creating an optimal mix of inputs to maximize
output (allocative efficiency) (Makovsek et al., 2015:4)
Railway operations Is mainly about the effective movement of passengers and
goods from one point to other and the associated services
(George & Rangaraj, 2008:602).
Perceived service quality The degree and direction of a discrepancy between consumers'
perceptions and expectations (Shainesh & Mathur, 2000:16)
Skewness Skewness is, thus, a measure of asymmetry and shows how the
items are clustered around the average.
Kurtosis Kurtosis is the humpedness of the curve and points to the nature
of the distribution of items in the middle of a series.
1
CHAPTER 1: SCOPE OF STUDY
1.1 Introduction
Studies have shown that the standard of service has become a distinct and important feature
of the provision of goods and services to enhance an institution's customer satisfaction
(Wisniewski. 2001; Miranda, 2018; Rozaq, 2018). The statistics have shown a decline in
customer satisfaction, revenue collection, and the number of customers transported. The
number of passenger travels in November 2019 decreased by 16.6% compared to November
2018 (Statistics SA, 2020). This chapter highlights the importance of public transport especially
rail transport on improving the economy of the country. It also points out various railway
parameters to be evaluated to increase its customer satisfaction and its competitive advantage
against other public transport modes. This chapter also introduces the research focus,
research framework and service quality methods. Furthermore, the research design and
research methodology used, and finally summary of key procedures and chapter layout of the
thesis were provided.
1.2 Background to service quality
Over the past years, the passenger railway system in South Africa has come under scrutiny
and criticism in the media and society with many people complaining in the media about its
service delivery. According to Adriaan Kruger (2019), the latest report from the Passenger Rail
Agency of South Africa reveals that it is worse than we thought. One useful approach to
improving service quality is to determine the level of customer’s satisfaction with services
rendered. The current service provided has also led to a decrease in customer satisfaction and
passenger journeys. Prasa (2019) reported that the Customer Satisfaction Score representing
the success of Metrorail and Autopax products decreased by 8.89 per cent in 2018/19.
Transport availability and accessibility impact global development designs and can be a lift or
a snag to the financial development of the country (Ranjan et al, 2016:79). Therefore, it’s
important to continuously examine the service quality of any transport service to increase
customer satisfaction. This also allows for critical input from customers as the main stakeholder
into a new service package thereby making the product more customer-centric in design and
delivery. According to Awasthi et al. (2011:637), all transportation organisations continuously
carry service quality evaluation. Various parameters such as efficiency, reliability, safety
comfort, responsiveness, etc. are evaluated.
2
Customer satisfaction is a mission all service organisations strive to achieve. To attain this, the
business strives to continuously provide high-quality services to its customers as well as new
customers. The Passenger Rail Agency of South Africa (2019:41) stated that by placing the
customer needs at the centre of the organisation’s activities it would increase the rail share of
public transport. It is therefore critical to assess the administration of this nature of an
association from the client's perspective. The customer experience and expectations of service
quality help organisations to define and package their services close to the one expected by
the customers. Gupta and Datta (2010:223) claimed that service providers are faced with two
important issues and challenges, that is, providing excellent service quality and high customer
satisfaction.
Studies in service quality have been undertaken by many researchers worldwide in the railway
industry but scant evidence has been found on studies done in a South African context. The
SERVQUAL approach, which was developed by Parasuraman in 1985, is the most popular
instrument used to measure and evaluate service quality. According to Parasuraman et al.
(1988), the model is about measuring the difference between the customer's expectations and
the evaluation of the perceptions about the service (Miranda, Tavares and Queiró, 2018:371).
Cronin and Taylor (1992) developed the SERVPERF approach which measures the quality of
service by only using the customer’s perception of quality. Maruvada and Bellamkonda (2010)
developed a comprehensive instrument RAILQUAL which was a modification of SERVQUAL
to be used in measuring rail transport quality. Three of the models/instruments have been
mostly tested internationally on both passenger rail and freight rail. However, there are scant
studies that have been done in a South African context.
Vilakazi and Govender (2014) note that the standard of service in South Africa's public
transport sector has remained an elusive and often overlooked area of study. The data on
quality and performance metrics of public transport services in South Africa is largely defined
and, in fact, virtually non-existent according to their argument. Thus, this study examines the
service quality of the commuter rail in the Western Cape Region in South Africa from the
passenger’s experience on the journey. The significance of the study can be clarified in the
way that it will help the commuter railway operator in examining service quality of various
sections, monitoring and improving its services, and increasing competitiveness based on
customer perception.
1.3 Problem statement
Rail transportation is considered one of the most effective and efficient means of public
transportation. The main objective of the commuter rail is to guarantee, in line with the
3
Department of Transport, the reliable, available, safe and quality rail services inside, to and
from the Republic in the public interest. However, the quality of service rendered by the railway
system in South Africa has declined and the public has complained about the media, and
studies are published in the extant literature as well. The National Household Travel Survey
indicates that only 9% of commuters had no transportation problems, meaning a significant
91% have transportation problems (Heyns & Luke, 2018:472). They further argued that rail
transport, which is usually a successful option for moving large numbers of people in urban
areas in South Africa is considered to be problematic in terms of quality of service. Shainesh
and Mathur (2000:15) claimed that the biggest headache of service providers is to control
quality and offer consistent service. The image of the railway service in South Africa has been
painted very badly due to poor service delivery. Lack of service quality can lead to loss of
revenue and customers. Monsuur et al. (2017:3) noted that disappointed travellers may
change to elective travel modes if they are available or generally choose to quit travelling.
However, satisfied customers will always be loyal to railway transport.
Transport and the requirement for transport are a fundamental need of the day to day lives of
South Africans. The expanded rate of movement and population development has a huge
impact on urban infrastructure and transport benefits, particularly rail transport as it is the least
expensive and moderate method of transport. The fuel value climbs likewise have a huge effect
in the transport system where individuals use train services. A successful and quality public
transport system that adds to the development of individuals, encourages work and work drive
investments along these lines expanding worker and traveller numbers and social
socioeconomics. Transport availability impacts worldwide advancement designs and can be a
lift or a deterrent to the monetary development of the country (Ranjan et al., 2016:79).
The decrease in service performance of the passenger rail came because of increased
analysis by the media and workers. The decrease in service performance of the railway system
additionally expands the traffic on the road and influences the nation's economy. It along these
lines that this current study examines the quality of service of railways in South Africa becomes
significant particularly as the railway plays a definitive and noteworthy job in the general
development of the economy. Sharma et al. (2016:642) indicate that, instead of merely
comparing performance and scorecards which will not produce new insights, railway
organisations should strive to understand the reasons behind any superior or inferior
performance. The South African Railway system must understand the desires for the
customers and to what degree their desires are met. According to Yuda Bakti and Sumaedi
(2015:534), public transport operators should focus on service quality to improve their
competitiveness. It is in this regard that the evaluation of service quality in the railway transport
4
service becomes important. Hence Eboli and Mazzulla (2012:97) claimed that consumer
loyalty is the key determinant to quantify service quality. The problem this study seeks to
address is the decline in both service quality and customer satisfaction.
1.4 Rationale and significance of the study
The study seeks to examine the service quality of a commuter rail in the Western Cape Region
in South Africa. The strategic intent of a commuter rail is to be a modern organisation and to
become a leader in the public transport industry by being able to give excellent traveller
benefits on a feasible premise (Passenger Rail Agency of South Africa, 2019:12). However,
the current state of the service is so dire that the user statistics have declined. By examining
the passenger experience in terms of service quality the organisation will know the customer
needs and will be better able to service them.
Extensive research has been conducted in evaluating and examining the service quality using
the SERVQUAL instrument (Barabino, 2012; Siami, 2012; Hundal, 2015; Priyadharshini,
2016). The other purpose of studying service quality is to gain a wider perspective of customer
satisfaction by surveying the extant literature to learn about it from the work of other
researchers.
1.5 Aim and objectives of the study
One useful approach to improving service quality is to determine the level of customers’
satisfaction with services rendered. This allows for critical input from customers as the main
stakeholder into a new service package, making the product more customer-centric in design
and delivery. According to Maruvada and Bellamkonda (2012:42), the degree of satisfaction
which the passengers develop from the services offered should be determined to evaluate
service quality for improvement. Examining customers’ satisfaction, therefore, is critical to
determining the areas needing improvement for service firms. This is possible because
satisfaction or otherwise reflects the gap between expectation and experience of service. This
study applies the derived RAIL-SERVQUAL model to ascertain the areas needing
improvement in the rail services rendered by the commuter rail between 2018 and 2019.
1.6 Research Objectives
To address the research problem, this study aimed at achieving the following research
objectives:
To identify the determinants of customer satisfaction on service quality.
5
To find out the level of customer experience of the service quality provided by the
commuter railway organisation.
To determine the areas that need the most improvement in service quality offered by
the commuter railway transportation in South Africa.
1.7 Research questions
In seeking a better understanding of the phenomena, the study addressed the following three
questions:
What are the determinants of passenger satisfaction on service quality?
What is the level of customer experience of the service quality provided by the
commuter railway organisation?
What are the areas that need the most improvement in service quality offered by the
commuter railway transportation in South Africa?
1.8 Research process
The research process offers insight into the cycle of 'how' the study should be done from the
proposal creation to the final dissertation submission. "Research phase consists of a sequence
of actions or steps needed to carry out research effectively and the appropriate sequencing of
those steps" (Kothari, 2004). According to Kothari (2004), the research steps are:
Formulate research problem and research question;
An extensive survey of literature;
Hypothesis developing;
Determining sample design;
Data gathering;
Project execution;
Data Analysis;
Hypothesis testing;
Generalisations and interpretation; and
Formal write-up of conclusions reached
Mouton (2001), argued that all empirical analysis is compatible with normative theory,
irrespective of the study and independent of the methods employed. Mouton (2001) refers to
the logic as the social science ProDEC framework, which stands for:
Research problem (Pro);
Research design (D);
Empirical evidence (E); and
6
Conclusion (C)
The research method that the current study will follow is introduced by (Greener, 2008), based
on the two work processes mentioned above. The research process chosen focuses on this
research analysis as a type of Business management research, which offers knowledge to
direct management in various service delivery decision-making processes and is outlined
below:
Analysis and identify a research issue;
Recognize study limitations;
Literature read-up and review;
Creation of a research process;
Designing the research methods
Sampling and Conducting the research
Data preparation and analysing data
Data interpretation; Conclusions and recommendations.
1.9 Research design and methodology
The term paradigm of research and philosophy of research is used interchangeably. Saunders,
Lewis and Adrian (2016:134) refer to the term philosophy of study as a set of creeds and
assumptions about knowledge creation. In this study sense, a paradigm refers to the entire set
of beliefs, principles, and techniques expressed by the train's commuters. They note that
ontology explores the type of truth that exists, what this reality looks like, how the entities live
inside the reality and how they interact.
Ontology offers researchers a tool for formulating research. The ontological approach taken
by the researcher was the position of objectivism, as he claims that he is normally an objective
observer. In the positivism paradigm, the researcher utilised the quantitative approach to
conduct the research. The literature claims that the main weakness of such quantitative
research design is that even if it is important, reliable, and effective, it cannot determine the
deeper inner meaning and explanation of social phenomena. Therefore, the choice of which
method to use most of the time reflects the interests of the people who conduct the research
or benefit from the research, and the purpose of the application of the research results.
Positivism is important to research methods that focus on quantitative analysis, investigation,
and experimentation.
Methods of research are often divided into two main types: quantitative and qualitative.
Bhawna & Gobind, (2015) citing (Creswell, 1994) described qualitative research as a model of
7
development that takes place in a characteristic setting that empowers the scientist to build a
degree of detail from the high association in genuine meetings. Quantitative work includes
studies that use statistical analysis to obtain their conclusions, where main features include
formal and systematic calculation and statistical application (Marczyk et al., 2005:17).
Quantitative analysis has been used to collect facts and statistics as it uses quantitative
methods like SPSS for data analysis and hence is less time-consuming.
The quantitative approach was found appropriate for this study, as its purpose was to
determine the need and capture participant’s views on the quality of service provided by the
selected railway operator in the Western Cape Province. The quantitative method was also
chosen because of the researcher's epistemological, that is, positivist position. Saunders et al.
(2016:166) note that quantitative analysis is generally linked to positivism, especially when
used with predetermined, highly organized data collection techniques.
1.10 Population and sampling
Etikan (2016:1), describes a population as the total amount of items or cases that are the study
subject that the researcher wants to test. The sample population was the entire train users in
the Metropolitan Cape Region. According to Etikan (2016:1), a sample is the subset of the
entire population currently being analysed by a researcher, and the features of which would
be generalized to the entire population. Sampling techniques may be probability and
nonprobability sampling. The probability of inclusion of every element of the population can be
calculated for probability sampling. In comparison, non-probability sampling cannot determine
the likelihood that each variable of the population will be included in a sample. The reason for
choosing non-probability sampling over probability sampling was related to cost, human
resources and time. According to Saunders et al. (2016:304), more planning and repeated
follow-up calls are required for probability sampling to ensure each member in the selected
sample is contacted. This has the potential to become expensive.
Convenience sampling was used for study purposes, and a test survey was taken to assess
client perception. At various times various classes of passengers were surveyed on multiple
service quality attributes offered by the passenger rail company. Specifically, the three
categories times for data collection focused on were an off-peak hour, regular hour, and peak
time. According to Etikan (2016:1), convenience sampling is often chosen due to accessibility,
geographic proximity, availability at a given time and willingness of the respondents to
participate in the survey. A disadvantage of convenience sampling is that generalisation from
the results of this research is impaired. "This approach has clear benefits in terms of cost and
8
convenience but suffers from serious bias problems because the sites to which they have easy
access do not reflect the population" (Watson, 2015:40).
Only primary sources of data were used and analysed for study purposes. The questionnaire,
therefore, was the primary data collection tool to obtain primary quantitative data for further
analysis. The purpose of the survey was to obtain the opinions of participants regarding the
passenger railway's quality of service. The research tool was developed using established
literature, observations, pilot testing, and expert opinion.
1.11 Ethical consideration
The researcher ensured that the permission to conduct the research was granted by the
organisation. All the participants, customers, in this case, remained anonymous and their
opinions are confidential and their privacy is protected. The researcher advised the participants
of the type of study and the purpose of the research being conducted and signed consent was
provided as requested. The information will only be used for its intended research purpose.
The research was also conducted following the ethical and professional guidelines as specified
in the Cape Peninsula University of Technology (CPUT) ethical policy.
CPUT and The Passenger Railway Company granted ethical approval for this work. The study
followed the rules and guidelines laid down by the Ethics Committee of the Cape Peninsula
University of Technology. The following procedures were observed to maintain high ethical
standards:
Voluntary participation, i.e., no participant was required to participate, and participants
were told that the study was for academic purposes only and that their involvement
was entirely voluntary.
Right to privacy, i.e., participants' identities and views were handled confidentially, and
no names were registered during the data collection process.
Integrity, i.e., ensuring that: the integrity of all participants has been upheld and not
been exposed to humiliation or improper behaviour.
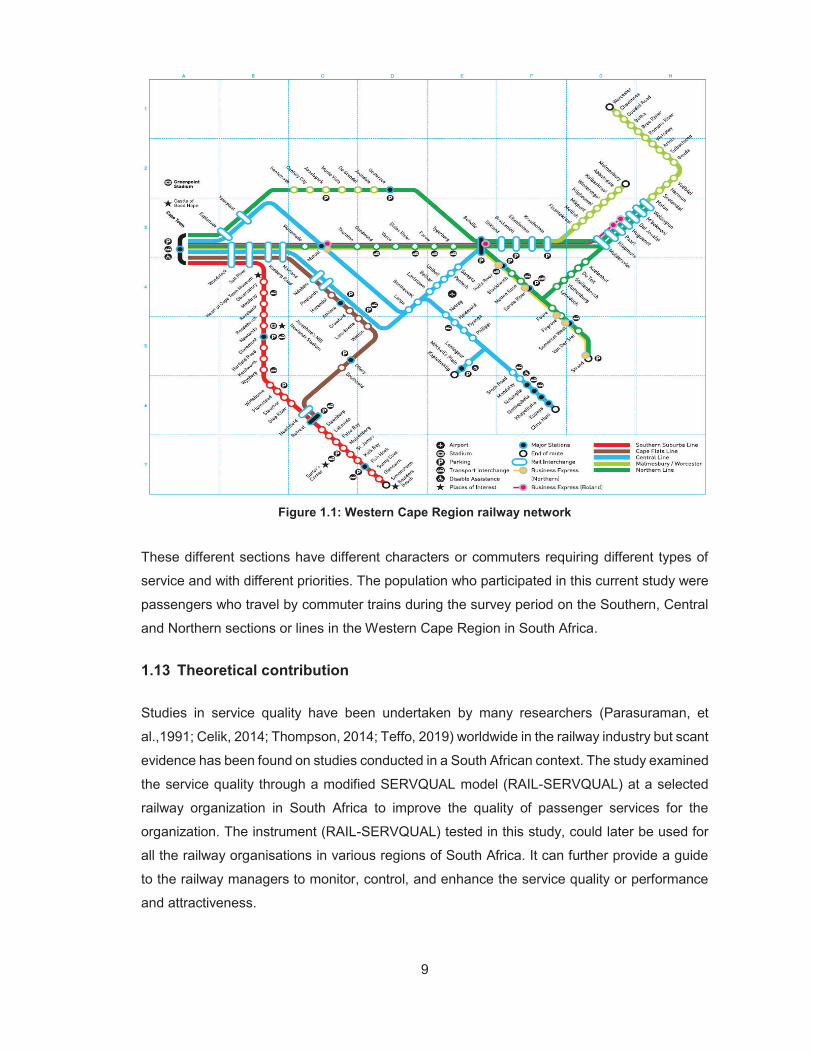
1.12 Demarcation/Limitation of the study
The study was conducted in the Western Cape Region of South Africa. Railway stations and
railway sections are of several categories. There are railways sections located on the either
the Northern, Central and Southern section as shown in the legend in Figure 1.1 and denoted
with different line colours.
9
Figure 1.1: Western Cape Region railway network
These different sections have different characters or commuters requiring different types of
service and with different priorities. The population who participated in this current study were
passengers who travel by commuter trains during the survey period on the Southern, Central
and Northern sections or lines in the Western Cape Region in South Africa.
1.13 Theoretical contribution
Studies in service quality have been undertaken by many researchers (Parasuraman, et
al.,1991; Celik, 2014; Thompson, 2014; Teffo, 2019) worldwide in the railway industry but scant
evidence has been found on studies conducted in a South African context. The study examined
the service quality through a modified SERVQUAL model (RAIL-SERVQUAL) at a selected
railway organization in South Africa to improve the quality of passenger services for the
organization. The instrument (RAIL-SERVQUAL) tested in this study, could later be used for
all the railway organisations in various regions of South Africa. It can further provide a guide
to the railway managers to monitor, control, and enhance the service quality or performance
and attractiveness.
10
1.14 Chapter Outline
Chapter One: indicates the research aim and objectives as well as the primary
questions to be addressed by the study. This chapter also suggests the purpose and
goals of the analysis, as well as the study's primary issue. The chapter outlines the
importance of the research project, describes some ethical considerations, and offers
a chapter breakdown of the study as a whole. It presents the study context and
describes the statement of the issue. The research design and methodology is briefly
discussed, and an outline of the project is presented. The research is delineated, ethical
matters clarified and the proposed analysis was established.
Chapter Two: outlines the recent and past conference papers, government
documents, reports and journal articles on service quality particularly for public
transport mainly in the railway industry. The chapter served as a source of information
to drive the research further. It concluded with a review on areas for improvement and
ways to improve service quality offered by railway transportation. The researcher
collected knowledge about the research questions and a questionnaire through a study
of previous research on the quality of service in the railway industry and related fields.
In this section, the researcher surveyed literature relating to areas needing change and
ways of enhancing the level of service delivered by rail transport.
Chapter Three: This chapter (research methodology) outlines the research design and
the research strategy, including the methodology (sampling). The philosophical
principles for describing and predicting the level of service were those of positivism.
Hence the writer adopted the quantitative method for this current study and used a
positivist model. The researcher followed a quantitative approach and explored in-
depth on how to use research methods, and an explanation of the development of the
questionnaire used. Data were gathered through a survey. The simplest and quickest
way of gathering data has been by questionnaires. The questionnaires were limited to
train passengers on the Western Cape Metrorail. Ethics, Trust and Validity were also
be discussed in this chapter.
Chapter Four: In this chapter, the statistical data is analysed, presented and
discussed. The results were interpreted with the aid of tables, graphs and maps after
calculations in confidence intervals were conducted. Whilst the presentation of the
findings is also in the form of tables and graphs which summarise the responses of the
respondents. This chapter was devoted to the presentation and interpretation of the
results where the statistical data were analysed and presented. The responses
collected from the survey were analysed using Factor analysis and a one-sample test.
SPPS version 26 (IBM, date) was used to perform one-sample t-test. Data analysis
11
was preceded by case and variable screening. The experience and attitudes of
respondents were evaluated by a developed RAIL-SERVQUAL instrument which
consists of six dimensions.
Chapter Five: Drawing of conclusions and recommendations based on the entire
research study is made in this chapter. The conclusion offers answers and practical
solutions to the research problem. Whilst recommendations offer what the next studies
could focus on.
1.15 Conclusion
This chapter covered various research sections, including the research summary, research
history, research problem statement, research goals, research intent and reasoning, research
methodology, research significance, and delineation. The next chapter addresses current and
past customer satisfaction studies from the extant literature specifically on the quality of service
and service quality improvement programmes.
12
CHAPTER 2: LITERATURE REVIEW
2.1 Introduction and Background
The literature informs that excellent quality of service is where most companies have and will
achieve a competitive edge in the market in recent times and in the future. It is important to
have a theoretical or conceptual framework for assessing a railway organization's quality of
service in terms of what it has to offer the public. Therefore, in this section, a brief literature
review is presented, considering service quality in public transportation and customer
satisfaction in public transportation viewpoints. Included in this literature review are common
ways to improve service quality in identified areas in the railway industry. Therefore, as a point
of departure understanding public transportation in South Africa is required.
2.2 Public Transportation
As with other developing countries, South Africa is experiencing rapid population growth, with
a growing demand for travel or transportation. To gain access to economic, financial,
educational, medical, recreational and cultural activities, most residents still rely on public
transportation. Public transport remains an absolute necessity for low-income residents.
However, Teffo et al. (2019) assert that parts of the South African public transport system are
in a bad state. Furthermore, Teffo et al. (2019) elaborate on four key causes for the level of
transport poverty in South Africa today, namely; (a) poor access to public and private transport
services, (b) affordability problems related to over-reliance on minibus taxis, (c) the impact of
apartheid policy on contemporary housing projects and (d) over-reliance on walks. Urban
transport problems in South Africa are exacerbated by the past, where the apartheid system
left a legacy of social exclusion and a highly distorted separation of people from both their
places of work and the majority of social services needed to lead a productive life (Heyns &
Luke, 2018).
Although the public transport system in the South might be seen as bad, the transport quality
and safety in the public transport system is significant in a variety of ways in the daily lives of
low-income earners. Ugo (2014:1) concurs that, regardless of how bad or potentially
dangerous the public transport system might be in South Africa, it is equally important to
recognize the important role it plays in the daily lives of low-income earners and the poor. The
governments of developing countries should concentrate on developing specific analysis
techniques in this field because public transport services are an important element for a
nation's economic and social development (Machado-León et al., 2017:175).
13
2.2.1 Railway public transportation
Railway transport is one of the alternative modes of transportation. It has become a priority for
developing countries to improve the environment, economic and social well-being to improve
the quality of urban life. Many officials, countries and researchers see rail transport as one of
the most significant ways of public transportation. It is regarded as a natural, energy-saving,
viable alternative to private car use (Haron et al., 2016). The significance of the railways has
been how vast quantities of goods and passengers are transported over long distances.
However, security and customer satisfaction, as well as punctuality and reliability, are critical
criteria for success in the railway industry. Thus, it is crucial to ensure that the railway
organisation provides excellent service quality to achieve success.
Some of the most critical problems for public transport companies is to introduce higher service
quality rates of public transport to minimize discontent arising from the immoderate use of
private cars in urban areas. Improving the efficiency of the commuter rail transport services
will significantly reduce the number of people commuting by car and support passengers as a
result. According to Isikli et al. (2017:66), operators of public transport services aim to reduce
the use of private cars by implementing quality management strategies that will promote higher
satisfaction of customers.
Analysis of the quality of service in rail transport is vital for operators and public transport
authorities alike. Guirao et al. (2016), opine that the improvement in the quality of public
transport services has been shown to play a key role in attracting new passengers from private
cars to the public transport network and, as a consequence, in reducing road pollution.
Increasing customer satisfaction or service quality levels of commuter rail transportation
contributes to higher service usage, new customer engagement and a stronger public image
(Isikli et al., 2017:66). Van Hagen and van Oort (2019) note that the objective of quality service
in rail transport is to provide services that allow passengers to experience their travel time in a
comfortable and friendly manner; they will experience positive emotions and even be
enthusiastic about the journey by train.
2.3 Description of services
Products are intangible because they are ultimately used and cannot be preserved for future
usage. The distinction between a product and a service is that all the services are delivered
and consumed simultaneously (van Hagen & Oort, 2019). Moreover, each service is special
and particular to a service provider, making it truly difficult to define service. However, many
authors believe that there is a sufficiently clear distinction between services and real objects
to encourage people to think that goods and services are multidimensional.
14
Berry and Parasuraman (1991:15) state that services rendered must be executed accurately
and reliably all the time as this will lead the passenger to know what to expect as they use
provided services. Correctly rendering the services will also allow the passenger, when faced
with the decision making, to easily choose what form of public transport to use regularly. A
major concern in the service sector is recognizing the needs and expectations of the customer,
and being able to deliver the right service (Zeybek, 2018).
When the customer has patronized a specific mode of public transport and the service delivery
is acceptable or has surpassed their standards, there is a good likelihood that this particular
mode of public transport will once again receive his patronage. If service quality is not
consistent or dependable, this loyal customer could quite easily be lost to competition. It is
therefore required that service quality standards presented to the passengers is consistent.
2.4 Description of quality
Quality is one of the fundamental principles used for characterizing the success of human
beings, organisations and communities in many ways. The ISO (2015a) defines quality as the
“degree to which a set of inherent characteristics of an object fulfils requirements”. According
to Anttila and Jussila (2017), the concept refers to all interested parties' needs and desires and
the fulfilment of such quality is based on the logical, non-rational and irrational interpretation
of the persons. This implies the satisfaction of both parties in a clear situation of contact
between two people, that is, the rail commuter and a railway organization. Quality is one of the
elements of almost all service products that passengers need most.
High and exclusive quality in public transport is a way of attracting passengers and ensuring
their loyalty into perpetuity. From a Japanese perspective, Parasuraman et al. (1985) describe
quality as having zero defects; thus, quality occurs when a function or service is performed
correctly the first time. This refers to the fact that quality is achieved when the service is seen
as being per requirements, in particular customer specifications. There is seemingly an attitude
among service providers of public transport in Cape Town that good customer service is not
crucial to their survival or success in the competitive business environment in which they
operate. They tend to believe that there will always be passengers who will be willing to use
their services, irrespective of the quality of service that they provide. This leads to service
providers often offering ordinary, if not dissatisfactory service.
2.5 Conceptual framework of service quality
Service quality is the subject of this study and so it is important to understand what it means,
why it is needed, and what benefits it can offer. Krishnamani (2015), describes service quality
15
as service conformance to the requirements and estimates of the customers. On the other
hand, perceived service quality can be described as the passenger’s assessment of the overall
excellence or uniqueness of the service provided by the commuter rail operators. Therefore,
the level of service depends on the ability of the railway organisation to meet the passenger’s
needs or to satisfy perceptions. Satisfactory service experience not only allows consumers to
have pleasant memories but draws more consumers as well. According to Taghavi et al.
(2020), managing service experience clues are critical to creating a satisfactory service
experience to influence the rational and emotional expectations of customers of the services.
Nonetheless, in the realistic assessment of consumer satisfaction, the complexity and
ambiguity of the subjective emotions and experience of the consumer in the decision-making
process makes it difficult for them to judge concrete aspects with accuracy (Wang et al., 2018).
Given that this study revolves around public transport, in particular railway transportation,
knowledge of service quality within the context of railway transport is also discussed in the
section below. It is also important to have a theoretical or conceptual framework to evaluate
the service quality of a passenger railway organisation as it provides services to the millions.
The section will commence by defining service quality.
2.5.1 Defining service quality
Service quality is the degree and direction of a discrepancy between consumer perception and
expectation (Shainesh & Mathur, 2000:16). Wisniewski (2001:381) defines service quality as
the difference between customer expectations of service and perceived service. If expectations
exceed performance, then perceived quality is less than satisfactory and customer
unhappiness occurs (Parasuraman et al., 1985). According to Monsuur et al. (2017:4), the
quality of service is defined as an attitude; a long-term evaluation of the service provided to
the client. The authors also differentiate the quality of service from that of satisfaction. Where
he claims that satisfaction is seen as a measure on the latest use of the service provided and
the customer assesses the degree of consistency between the expected quality of service and
the actual service provided.
Alzaydi et al.'s (2018) analysis of service quality and service delivery showed that service
delivery is both complex and challenging, especially when considering the specific
characteristics of the service and the high degree of customer participation in its development.
Effective service is more than standardization activities, it's a state of mind. It is important to
inform the individual service provider of the need to provide quality, both individually and in the
larger organizational sense. In general terms, the quality of service can be defined as the ability
of transit operators to provide a service based on current and potential users' wishes (Kuo &
Tang, 2011:820).
16
2.5.2 History of service quality
The evaluation of the quality of railway public transport service has been of academic interest
for more than thirty years, and since the beginning of the new millennium, many research
studies have been mentioned in the scientific literature. According to Eboli et al. (2018), the
growing interest of transit companies and authorities in this topic is due to the awareness that
transit service performance knowledge can be used to monitor services and identify potential
weak points. The goal is to increase passenger satisfaction and ultimately attract new transit
users and retain regular users.
Before addressing whether a service that has been rendered should be graded as either "good
service" or "quality service," it must be noted once again that this is simply a perception, and
this perception of the essence of service quality differs from person to person. Therefore,
service providers are led by the perception of what good quality is by the customer and this is
not an easy task as the quality is always measured against expectation. Without quantitative
tests, a useful and acceptable approach to evaluating the quality of the services of a company
would be to evaluate the expectations of the quality of the customers (Vilakazi & Govender,
2014). If the expectations are surpassed then the service is viewed as excellent, but if the
expectations are not met, the service is viewed as poor. The basic concept, according to
Zeybek (2018), is that customer perceptions of quality arise from the difference between results
and expectations, where the quality of service is calculated by subtracting perception scores
from customer expectation scores (Q = P – E).
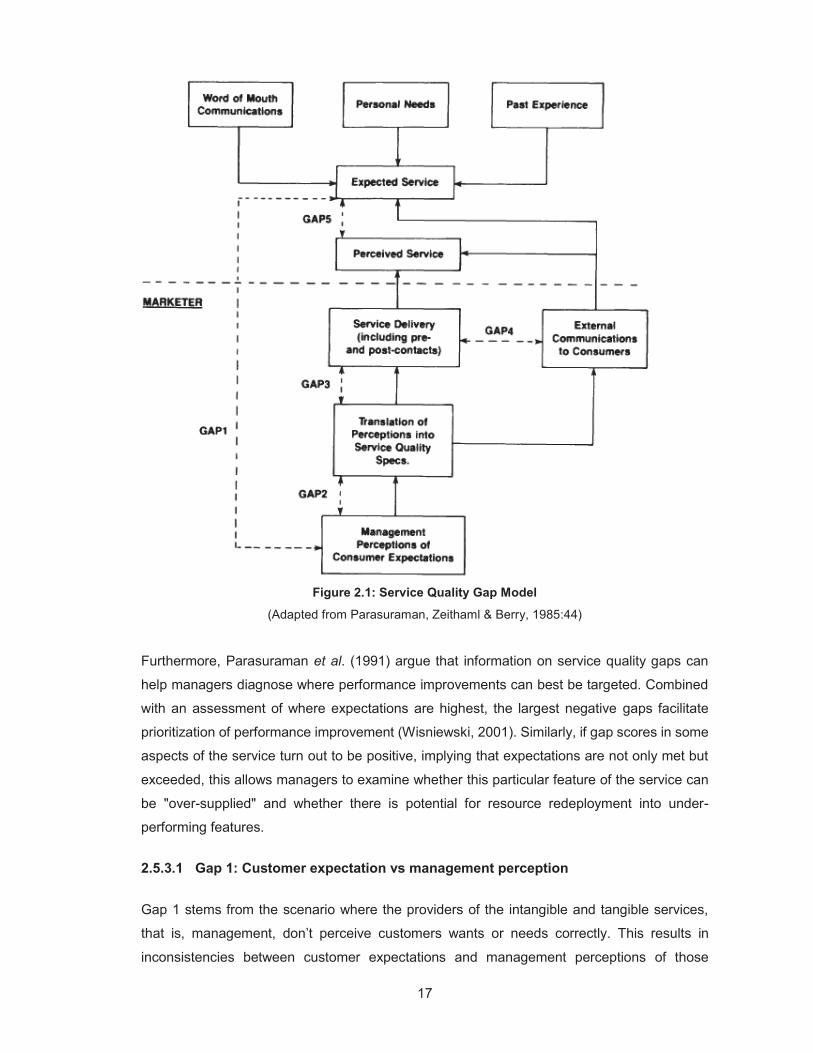
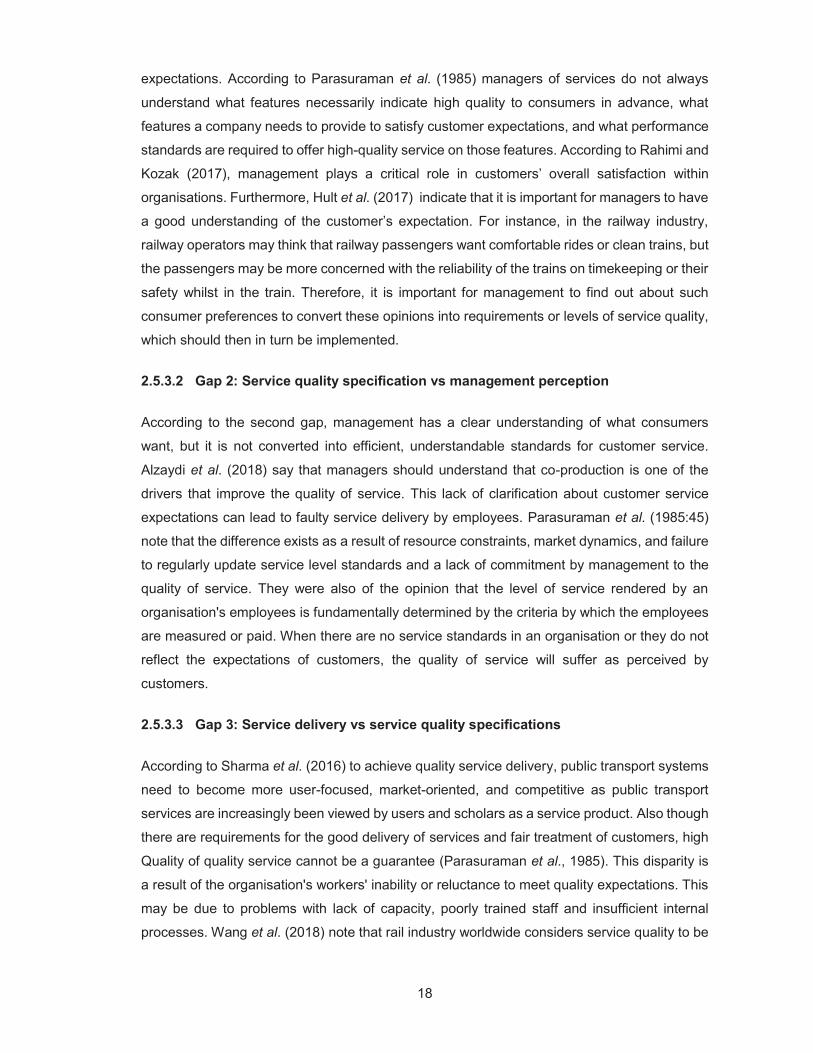
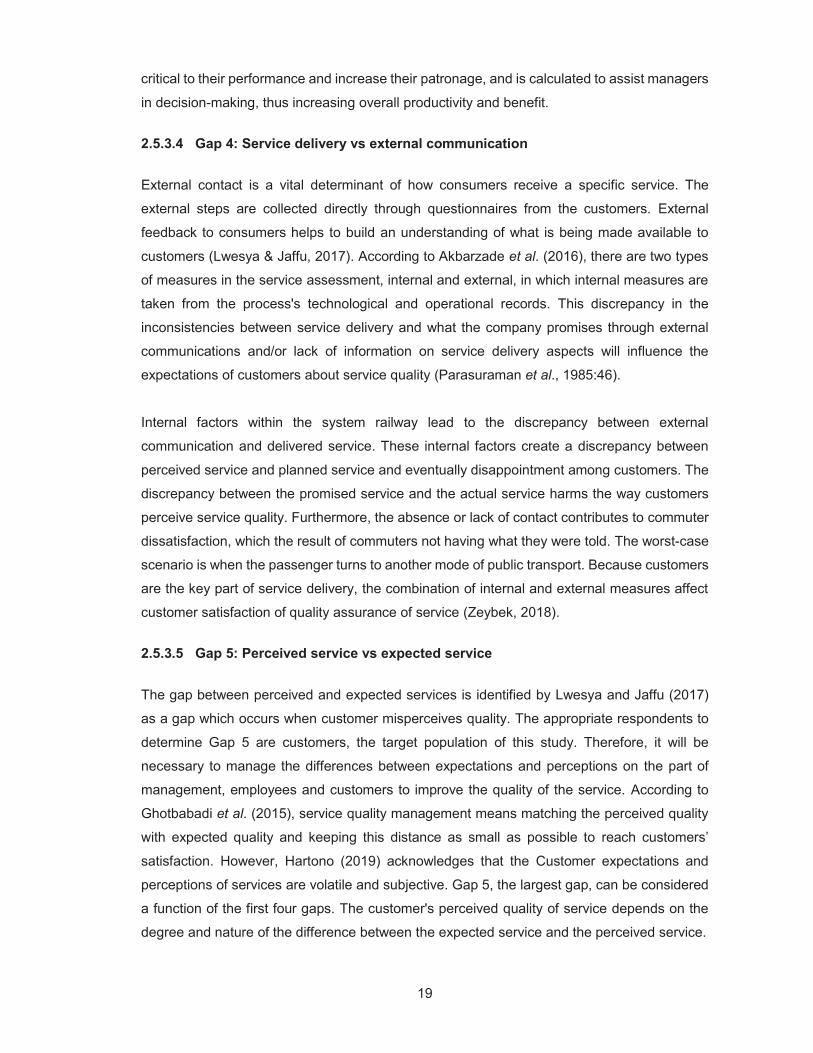
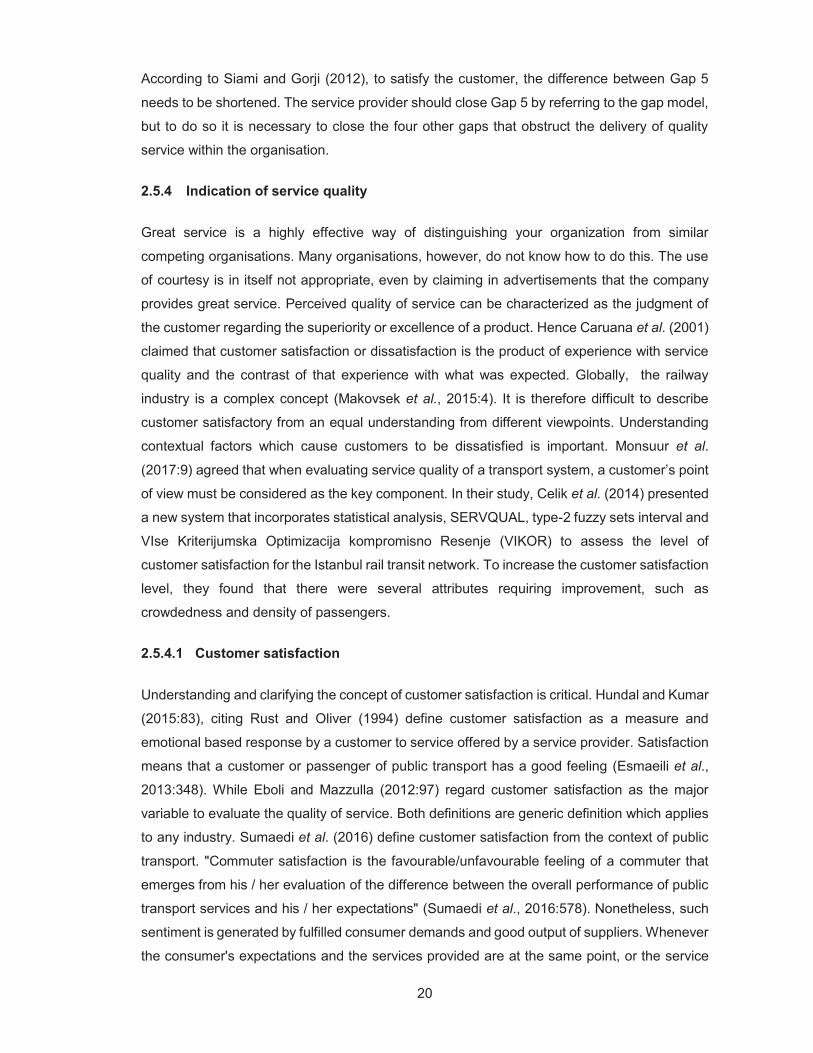
2.5.3 Service quality gap model
Parasuramann et al. (1985) proposed a new model for measuring service quality by measuring
the difference between service perceived and service expected. The development of their
theory for use of the service quality gap analysis is shown in Figure 2.1 and the gaps will be
explained. These gaps are:
The difference between what management perceived the client was expecting and
what clients expected;
The difference between consumer expectations perceptions of the management and
the conversion of those perceptions into service quality specifications;
The difference between proposed service quality requirements and the delivery to
customers;
The difference between customer service deliveries and external company
communications; and
The difference between customer expectations and perceptions.
17
Figure 2.1: Service Quality Gap Model
(Adapted from Parasuraman, Zeithaml & Berry, 1985:44)
Furthermore, Parasuraman et al. (1991) argue that information on service quality gaps can
help managers diagnose where performance improvements can best be targeted. Combined
with an assessment of where expectations are highest, the largest negative gaps facilitate
prioritization of performance improvement (Wisniewski, 2001). Similarly, if gap scores in some
aspects of the service turn out to be positive, implying that expectations are not only met but
exceeded, this allows managers to examine whether this particular feature of the service can
be "over-supplied" and whether there is potential for resource redeployment into under-
performing features.
2.5.3.1 Gap 1: Customer expectation vs management perception
Gap 1 stems from the scenario where the providers of the intangible and tangible services,
that is, management, don’t perceive customers wants or needs correctly. This results in
inconsistencies between customer expectations and management perceptions of those
18
expectations. According to Parasuraman et al. (1985) managers of services do not always
understand what features necessarily indicate high quality to consumers in advance, what
features a company needs to provide to satisfy customer expectations, and what performance
standards are required to offer high-quality service on those features. According to Rahimi and
Kozak (2017), management plays a critical role in customers’ overall satisfaction within
organisations. Furthermore, Hult et al. (2017) indicate that it is important for managers to have
a good understanding of the customer’s expectation. For instance, in the railway industry,
railway operators may think that railway passengers want comfortable rides or clean trains, but
the passengers may be more concerned with the reliability of the trains on timekeeping or their
safety whilst in the train. Therefore, it is important for management to find out about such
consumer preferences to convert these opinions into requirements or levels of service quality,
which should then in turn be implemented.
2.5.3.2 Gap 2: Service quality specification vs management perception
According to the second gap, management has a clear understanding of what consumers
want, but it is not converted into efficient, understandable standards for customer service.
Alzaydi et al. (2018) say that managers should understand that co-production is one of the
drivers that improve the quality of service. This lack of clarification about customer service
expectations can lead to faulty service delivery by employees. Parasuraman et al. (1985:45)
note that the difference exists as a result of resource constraints, market dynamics, and failure
to regularly update service level standards and a lack of commitment by management to the
quality of service. They were also of the opinion that the level of service rendered by an
organisation's employees is fundamentally determined by the criteria by which the employees
are measured or paid. When there are no service standards in an organisation or they do not
reflect the expectations of customers, the quality of service will suffer as perceived by
customers.
2.5.3.3 Gap 3: Service delivery vs service quality specifications
According to Sharma et al. (2016) to achieve quality service delivery, public transport systems
need to become more user-focused, market-oriented, and competitive as public transport
services are increasingly been viewed by users and scholars as a service product. Also though
there are requirements for the good delivery of services and fair treatment of customers, high
Quality of quality service cannot be a guarantee (Parasuraman et al., 1985). This disparity is
a result of the organisation's workers' inability or reluctance to meet quality expectations. This
may be due to problems with lack of capacity, poorly trained staff and insufficient internal
processes. Wang et al. (2018) note that rail industry worldwide considers service quality to be
19
critical to their performance and increase their patronage, and is calculated to assist managers
in decision-making, thus increasing overall productivity and benefit.
2.5.3.4 Gap 4: Service delivery vs external communication
External contact is a vital determinant of how consumers receive a specific service. The
external steps are collected directly through questionnaires from the customers. External
feedback to consumers helps to build an understanding of what is being made available to
customers (Lwesya & Jaffu, 2017). According to Akbarzade et al. (2016), there are two types
of measures in the service assessment, internal and external, in which internal measures are
taken from the process's technological and operational records. This discrepancy in the
inconsistencies between service delivery and what the company promises through external
communications and/or lack of information on service delivery aspects will influence the
expectations of customers about service quality (Parasuraman et al., 1985:46).
Internal factors within the system railway lead to the discrepancy between external
communication and delivered service. These internal factors create a discrepancy between
perceived service and planned service and eventually disappointment among customers. The
discrepancy between the promised service and the actual service harms the way customers
perceive service quality. Furthermore, the absence or lack of contact contributes to commuter
dissatisfaction, which the result of commuters not having what they were told. The worst-case
scenario is when the passenger turns to another mode of public transport. Because customers
are the key part of service delivery, the combination of internal and external measures affect
customer satisfaction of quality assurance of service (Zeybek, 2018).
2.5.3.5 Gap 5: Perceived service vs expected service
The gap between perceived and expected services is identified by Lwesya and Jaffu (2017)
as a gap which occurs when customer misperceives quality. The appropriate respondents to
determine Gap 5 are customers, the target population of this study. Therefore, it will be
necessary to manage the differences between expectations and perceptions on the part of
management, employees and customers to improve the quality of the service. According to
Ghotbabadi et al. (2015), service quality management means matching the perceived quality
with expected quality and keeping this distance as small as possible to reach customers’
satisfaction. However, Hartono (2019) acknowledges that the Customer expectations and
perceptions of services are volatile and subjective. Gap 5, the largest gap, can be considered
a function of the first four gaps. The customer's perceived quality of service depends on the
degree and nature of the difference between the expected service and the perceived service.
20
According to Siami and Gorji (2012), to satisfy the customer, the difference between Gap 5
needs to be shortened. The service provider should close Gap 5 by referring to the gap model,
but to do so it is necessary to close the four other gaps that obstruct the delivery of quality
service within the organisation.
2.5.4 Indication of service quality
Great service is a highly effective way of distinguishing your organization from similar
competing organisations. Many organisations, however, do not know how to do this. The use
of courtesy is in itself not appropriate, even by claiming in advertisements that the company
provides great service. Perceived quality of service can be characterized as the judgment of
the customer regarding the superiority or excellence of a product. Hence Caruana et al. (2001)
claimed that customer satisfaction or dissatisfaction is the product of experience with service
quality and the contrast of that experience with what was expected. Globally, the railway
industry is a complex concept (Makovsek et al., 2015:4). It is therefore difficult to describe
customer satisfactory from an equal understanding from different viewpoints. Understanding
contextual factors which cause customers to be dissatisfied is important. Monsuur et al.
(2017:9) agreed that when evaluating service quality of a transport system, a customer’s point
of view must be considered as the key component. In their study, Celik et al. (2014) presented
a new system that incorporates statistical analysis, SERVQUAL, type-2 fuzzy sets interval and
VIse Kriterijumska Optimizacija kompromisno Resenje (VIKOR) to assess the level of
customer satisfaction for the Istanbul rail transit network. To increase the customer satisfaction
level, they found that there were several attributes requiring improvement, such as
crowdedness and density of passengers.
2.5.4.1 Customer satisfaction
Understanding and clarifying the concept of customer satisfaction is critical. Hundal and Kumar
(2015:83), citing Rust and Oliver (1994) define customer satisfaction as a measure and
emotional based response by a customer to service offered by a service provider. Satisfaction
means that a customer or passenger of public transport has a good feeling (Esmaeili et al.,
2013:348). While Eboli and Mazzulla (2012:97) regard customer satisfaction as the major
variable to evaluate the quality of service. Both definitions are generic definition which applies
to any industry. Sumaedi et al. (2016) define customer satisfaction from the context of public
transport. "Commuter satisfaction is the favourable/unfavourable feeling of a commuter that
emerges from his / her evaluation of the difference between the overall performance of public
transport services and his / her expectations" (Sumaedi et al., 2016:578). Nonetheless, such
sentiment is generated by fulfilled consumer demands and good output of suppliers. Whenever
the consumer's expectations and the services provided are at the same point, or the service
21
falls higher or lower than customer expectations, a feeling of anticipation or disappointment is
observed. The definition of customer satisfaction applies to both a content customer and more
challenging ways of satisfying the passenger.
Throughout the private sector, customer satisfaction and loyalty are seen as necessary for
sustainability and growth, secured by high-quality goods and services that satisfy consumer
expectations and offer value for money. Unlike in a private company where it has only the
commercial undertaking that matters, the public sector has both a commercial role and delivery
of public utility service (Wisniewski, 2001:380). Public sector organizations have to ensure that
their services are soundly based on the needs and expectations of their stakeholders,
communities, citizens and customers and are seen as providing quality service (Wisniewski,
2001:380). The performance measurement system is focused on factors associated with
customer satisfaction. In modern-day organizations, in particular, in public transportation,
customer satisfaction has become a commonly known concept. Some authors refer to
customer satisfaction as a typical measure of the level of business performance concerning
the products and services of a company, and a particular focus on the consumer. Consumer
satisfaction is seen as a vital part of the company's business strategy in a competitive
environment and often used as a key performance measure (KPI).
2.5.5 Determinants of service quality
Parasuraman et al. (1985) developed a service quality structure by defining ten main
determinants of quality of service as viewed by customers and service providers, namely:
reliability, responsiveness, competence, access, courtesy, communication, reputation,
protection, customer understanding and tangibility. Later in 1988, the structure was updated
to five determinants: reliability, assurance, tangibility, empathy and responsiveness.
Monsuur et al. (2017) investigated factors that impact passenger satisfaction in a railway
organisation. They identified various factors such as crowdedness, reliability, and speed and
train cleanliness as the impacting factors of customer satisfaction. Similar to those factors were
factors identified by Eboli and Mazzulla (2015), which included punctuality, regularity and
frequency of runs, and cleanliness. Miranda et al. (2018) investigated the different
combinations of service quality dimensions, that is, comfort, connection, and convenience
which affected customer satisfaction in the Portuguese railway company. Miranda et al. (2018)
found that customer satisfaction is highly captured by both comfort and connection. The
combination is also a reflection of what was suggested by Maruvada and Bellamkonda (2012)
including the travel cost, convenience, comfort, reliable travel time and security. The general
consumer loyalty is inferred by three unique blends of the service quality dimensions.
22
The determinants of the quality of service are not just tested on the quality of service
encountered during transit or inside the train. Geetika and Nandan (2010) conducted studies
on the identification of Indian Railways service quality components at railway platforms.
Researchers found that the determinants of quality of service are availability and quality of
refreshments, information system efficiency and railway staff behaviour, basic platform
facilities, and safety and security. Refreshments and factors of conduct were deemed more
significant than other factors, however.
2.5.6 Need for service quality
In this current competitive environment, most companies promote service quality as an integral
component of their corporate strategy. Business organizations are now continually searching
for sources of competitive advantage, but as product quality improves and products are less
distinguishable from each other, businesses are finding competitive advantage through their
product's service elements. Organizations delivering intangible services compete with each
other to achieve greater profits by supplying their existing clients with excellent service in a
highly competitive climate. This has contributed to a greater emphasis on the standard of
service. Machado-León et al. (2017) stipulate that providing affordable, high-quality public
transport facilities ensures the sustainability of the networks with a view to financial growth and
social inclusion. It needs a detailed evaluation of the programmes that are offered based on
perceptions and preferences of the users. Improving service quality means not only investing
resources in new technology but also prioritizing behaviour that affects the level of quality that
customers perceive. Customers’ needs are generally changing and their expectations are also
increasing as service providers compete with each other for the patronage of these customers
to maintain their market share. All organisations (including the railway organisations) need to
keep enhancing their programmes. In general, programmes that constantly and reliably satisfy
consumers are assumed to keep them happy and fulfilled. They are loyal customers in such a
situation and will continue to seek the service that will in turn result in an organization's income
and development (William et al., 2016).
When customer services are not enhanced continually, the company may lose them to another
organization that offers excellence in service. The railway organisations like any other
organisation that provides services, must continually ask their customers including their
employees how it can improve its services. Service providers should then implement the
answers, suggestions and recommendations. The use of these techniques will ensure
continuous improvement in service quality. The weight given by passengers to each of the
attributes, and the measure of their satisfaction with them, helps improve the quality of service
and prepare better investment plans; this aim is increasingly important lately due to the growing
worldwide cost reduction trend (Eboli & Mazzulla, 2012:104).
23
2.5.7 Benefits of service quality
It is important to consider customer needs and expectations so that it becomes possible to
provide public transport systems that consumers perceive to be viable alternatives to their
vehicles. Improving the quality of service is one of the ways the Railway Passenger Business
can improve its competitiveness (Banu, 2018:359). George and Rangaraj (2008:599) agree
that the key goals of performance evaluation in the public sector, as stated by Radnor and
McGuire (2004), are to enhance public services through improved competitiveness and service
delivery capacity and to strengthen transparency such that organizations are explicitly
accountable for the tools they use and the results they achieve. Organisations have perceived
numerous potential benefits obtained from actualising service quality ventures, including
increasing customer fulfilment, company maintenance, customer dependability, representative
benefits, enhanced corporate image, revenue picks up, and monetary execution. The value of
customer and customer loyalty in public transportation is often ignored. However, the entire
field revolves around the passengers. Therefore, the focus of any customer service approach
will be required to be on the passengers of public transportation.
2.5.8 Detriments of poor service quality
To make service quality measurement an effective management tool, the organization must
clarify why such measurements are being carried out and what the benefits of measurement
are to them. The decrease in customer satisfaction hampers the performance of the
organisation both financially and its image as confirmed by Monsuur et al. (2017:10). Research
has demonstrated that poor satisfaction is a qualification of long-term reputation damage. They
further argued that, in the long term, it may harm patronage levels. Ranjan et al. (2016:94)
recommended that, in improving customer satisfaction, decision-makers of railway
organisations must focus on building proper infrastructure. The passengers require better
service than they experience. If public transportation service is not successful, it will be able to
temporarily decrease the level of satisfaction, in the end, thereby reducing the quality of life
(Putra & Sitanggang, 2016).
2.6 Measuring service quality
Managing and measuring the quality of service is different from managing and measuring the
quality of a tangible product. When measuring the quality of a product, the technical
specifications of the product are considered. However, services quality is more complicated;
service attributes are not tangible (Khorshidi et al., 2016).
24
The first step towards increasing customer satisfaction in any system starts with assessing the
quality of the service. The evaluation process, therefore, plays a very important part in
increasing customer satisfaction (Aydin et al., 2015:63). Hundal and Kumar (2015:87) note that
quality assurance of service is one of the important factors to be established to improve the
competitiveness of the railways. There are various explanations for why companies often want
to measure service quality such as knowing their consumer expectations and experience over
the service provided. Ugo (2014) investigated customer satisfaction levels with 30 service
quality variables on a self-rated questionnaire, using a quantitative research methodology and
found that passengers are no longer satisfied with the transport fare and the availability or
accessibility of ticket sales outlets.
Customer Satisfactory Surveys are very important to assist the decision-makers. Various
instruments such as SERVQUAL, RAILQUAL, RECSA, etc. which will be discussed in the
subsection below, have been utilised in public transportation to collect data to measure
customer satisfaction. The results of Customer satisfactory surveys help managers choose
from a long list of service attributes (e.g. cleanliness, on-time performance, quality, comfort, or
security) so that they can more efficiently focus their organization's attention and resources
(Guirao et al., 2016:69). The concept of services quality is measured in various ways.
2.6.1 Five dimensions of service quality
The most used method to evaluate service quality across the service industry is the
SERVQUAL, developed by Parasuraman et al. (1985). SERVQUAL offers a conceptualisation
of service quality based on gaps. Actual service performance and customer expectations are
specifically calculated to determine the 'gap’. Conceptually, this gap measurement suggests
that a customer tests the assertion of the desired value rate for the performance of the service.
As described in Figure 2.2, the SERVQUAL instrument comprises of 22 statements used to
assess service quality across five dimensions (Tangibles, Reliability, Responsiveness,
Assurance, and Empathy) with each statement used twice. One to measure expectations and
one to measure perceptions. Parasuraman et al.(1991), argued that SERVQUAL could be
adapted to any service organisation, including public transport, with slight modifications.
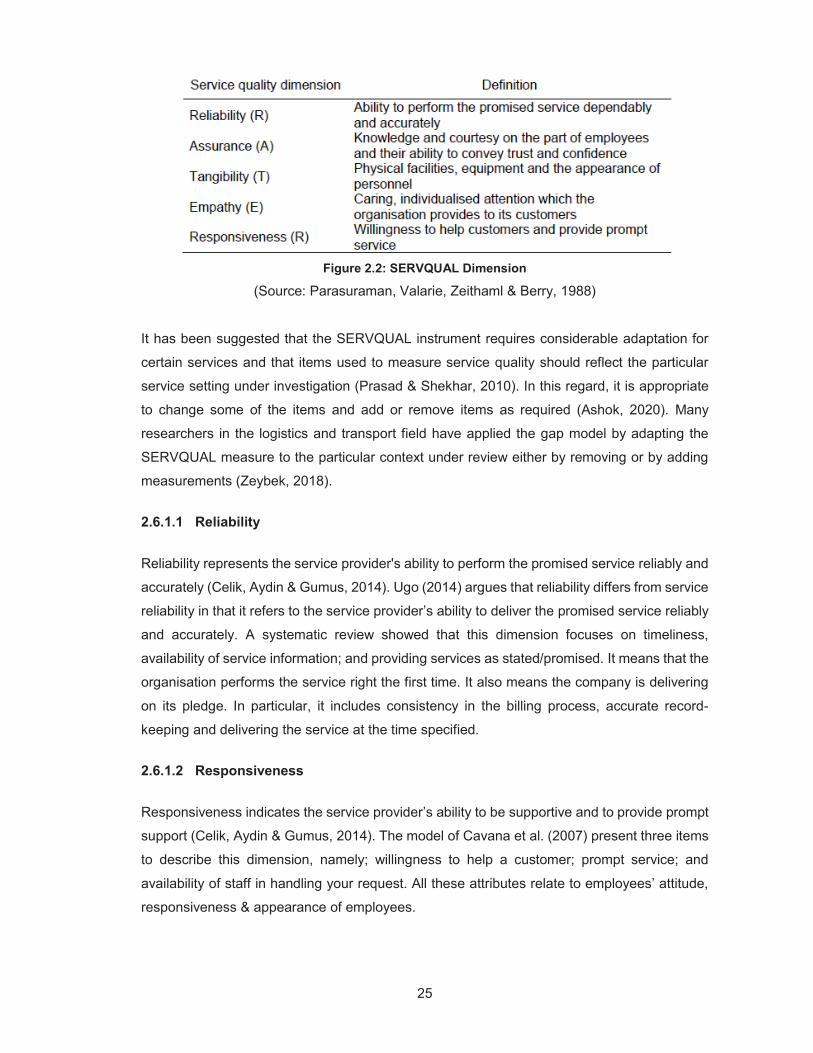
25
Figure 2.2: SERVQUAL Dimension
(Source: Parasuraman, Valarie, Zeithaml & Berry, 1988)
It has been suggested that the SERVQUAL instrument requires considerable adaptation for
certain services and that items used to measure service quality should reflect the particular
service setting under investigation (Prasad & Shekhar, 2010). In this regard, it is appropriate
to change some of the items and add or remove items as required (Ashok, 2020). Many
researchers in the logistics and transport field have applied the gap model by adapting the
SERVQUAL measure to the particular context under review either by removing or by adding
measurements (Zeybek, 2018).
2.6.1.1 Reliability
Reliability represents the service provider's ability to perform the promised service reliably and
accurately (Celik, Aydin & Gumus, 2014). Ugo (2014) argues that reliability differs from service
reliability in that it refers to the service provider’s ability to deliver the promised service reliably
and accurately. A systematic review showed that this dimension focuses on timeliness,
availability of service information; and providing services as stated/promised. It means that the
organisation performs the service right the first time. It also means the company is delivering
on its pledge. In particular, it includes consistency in the billing process, accurate record-
keeping and delivering the service at the time specified.
2.6.1.2 Responsiveness
Responsiveness indicates the service provider’s ability to be supportive and to provide prompt
support (Celik, Aydin & Gumus, 2014). The model of Cavana et al. (2007) present three items
to describe this dimension, namely; willingness to help a customer; prompt service; and
availability of staff in handling your request. All these attributes relate to employees’ attitude,
responsiveness & appearance of employees.
26
2.6.1.3 Assurance
Assurance is the degree of learning and graciousness held by an organisation’s employees.
According to Celik et al. (2014), assurance concerns staff’s awareness and politeness and
their willingness to disclose confidence, faith and trust. Assurance refers to employees'
knowledge and courtesy, and their ability to inspire confidence and trust (Khathutshelo &
Mudzanani, 2019:159).
2.6.1.4 Empathy
Cavana et al. (2007) described empathy as dealing with customers in a caring fashion when
you make inquiries, understanding customer needs when they make inquiries and having
customer’s best interests at heart. These items relate more to customer care service and/or a
customer-centric ethos. Empathy signifies customer service and the employees’ attention
(Celik et al., 2014). Service consumers want empathy; this service aspect means that
customers want a service company's loving, individualized attention (Ugo, 2014).
2.6.1.5 Tangibles
Tangibility is the condition of physical facilities owned or used to a service, such as physical
facilities, equipment, and appearance of personnel. Tangibles include the physical design of
the service station, the equipment, personnel, and the means for communication (Celik et al.,
2014:284). First, we see that these items are more of attributes of physical items, but in actual
sense and not tangibles because they are simply attributes. Thus, with respect to semantics,
the word tangible is not considered most appropriate.
2.6.2 Limitations to SERVQUAL
While the SERVQUAL instrument has been used in studies of different types of service
industries (Wisniewski, 2001; Prasad, 2012; Siami, 2012; Khorshidi, 2016; Miranda, 2018), it
has been criticized in terms of certain aspects, as shown below:
SERVQUAL model has some drawbacks over other methodologies because it uses
the preferences and opinions of passengers at the same time (which can be frustrating
for passengers) and it is important to increase the length of the surveys to obtain this
information (which could reduce the overall response rate and the accuracy of the
survey) (Machado-León et al., 2017).
SERVQUAL is much more humanistic, or customer-related, while most of the methods
used in the public transportation sector are much more mechanistic, or technologically
oriented, or more objective (Cavana, Corbett & lo, 2007).
27
Kuo and Tang (2011) conclude that definitions of consumers' desires may be
ambiguous, as consumers can use various meanings of desires.
The general SERVQUAL instruments (one or two-column formats) have been tested and used
by many researchers in various research settings, including public transportation, in the area
of service quality. Barabino et al. (2012:240) claimed that the SERVQUAL technique,
developed and improved by Parasuraman et al. (1985, 1988, 1991), is the most commonly
used approach for assessing the perceived quality of customers across the service sector.
According to Maruvada and Bellamkonda (2012:479), SERVQUAL is much more humanistic
or customer-related, whereas most of the interventions used in the public transport sector are
much more mechanistic, technological, or more objective.
2.7 Measuring service quality in railway public transportation
Gupta and Datta (2010:225) note that the level of service rendered by rail service providers
can be assessed by measuring the health of the services and facilities offered to its passengers
at the railway stations. Both the control boundary model and categorical judgment law were
used to determine the level of importance and satisfaction from data collected using a five-
point Likert scale. The researcher found that the use of a categorical assessment provides a
real measure of the degree of disappointment by translating the rating scale data into an
interval scale. The research conducted by Aydin et al. (2015) presented a hierarchical structure
for customer satisfaction to assess the efficiency of rail transit lines in Istanbul, by proposing a
hybrid statistical analysis, FAHP, trapezoidal fuzzy sets, and integral system of Choquet.
Figure 2.3 presents the proposed methodology utilised by Gupta and Datta (2016) to evaluate
the component-level contributions for individual attributes of service quality at Indian railway
stations.
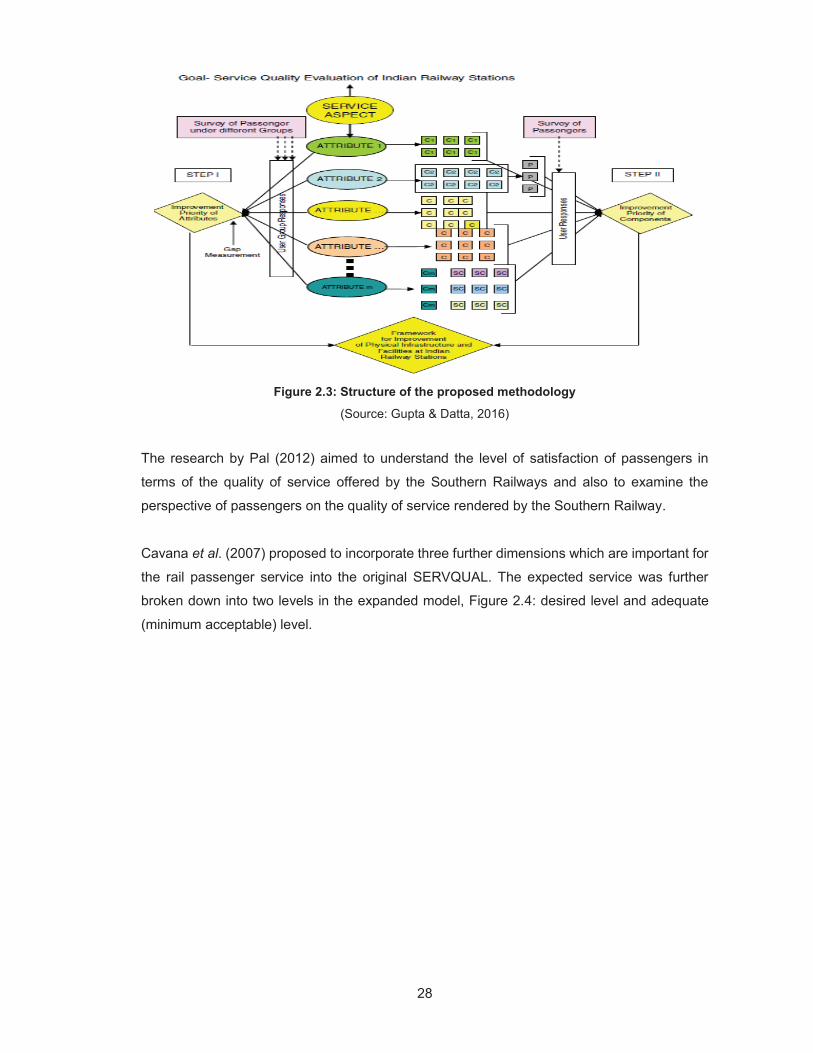
28
Figure 2.3: Structure of the proposed methodology
(Source: Gupta & Datta, 2016)
The research by Pal (2012) aimed to understand the level of satisfaction of passengers in
terms of the quality of service offered by the Southern Railways and also to examine the
perspective of passengers on the quality of service rendered by the Southern Railway.
Cavana et al. (2007) proposed to incorporate three further dimensions which are important for
the rail passenger service into the original SERVQUAL. The expected service was further
broken down into two levels in the expanded model, Figure 2.4: desired level and adequate
(minimum acceptable) level.
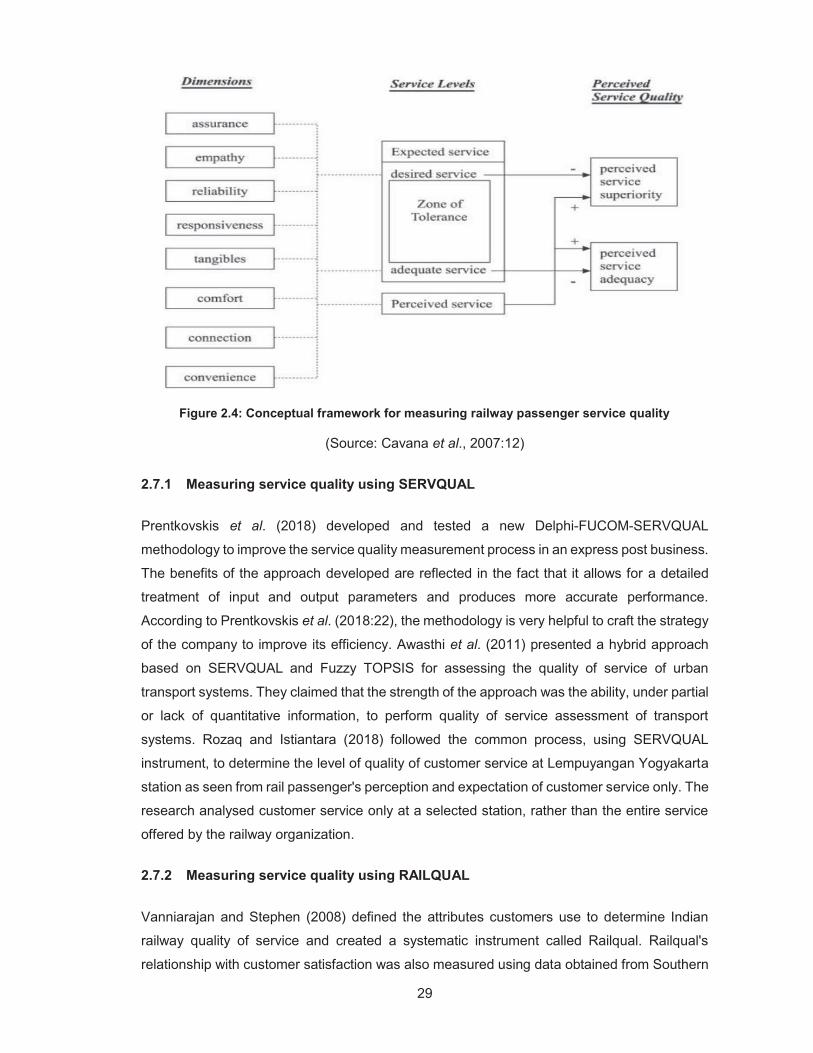
29
Figure 2.4: Conceptual framework for measuring railway passenger service quality
(Source: Cavana et al., 2007:12)
2.7.1 Measuring service quality using SERVQUAL
Prentkovskis et al. (2018) developed and tested a new Delphi-FUCOM-SERVQUAL
methodology to improve the service quality measurement process in an express post business.
The benefits of the approach developed are reflected in the fact that it allows for a detailed
treatment of input and output parameters and produces more accurate performance.
According to Prentkovskis et al. (2018:22), the methodology is very helpful to craft the strategy
of the company to improve its efficiency. Awasthi et al. (2011) presented a hybrid approach
based on SERVQUAL and Fuzzy TOPSIS for assessing the quality of service of urban
transport systems. They claimed that the strength of the approach was the ability, under partial
or lack of quantitative information, to perform quality of service assessment of transport
systems. Rozaq and Istiantara (2018) followed the common process, using SERVQUAL
instrument, to determine the level of quality of customer service at Lempuyangan Yogyakarta
station as seen from rail passenger's perception and expectation of customer service only. The
research analysed customer service only at a selected station, rather than the entire service
offered by the railway organization.
2.7.2 Measuring service quality using RAILQUAL
Vanniarajan and Stephen (2008) defined the attributes customers use to determine Indian
railway quality of service and created a systematic instrument called Railqual. Railqual's
relationship with customer satisfaction was also measured using data obtained from Southern
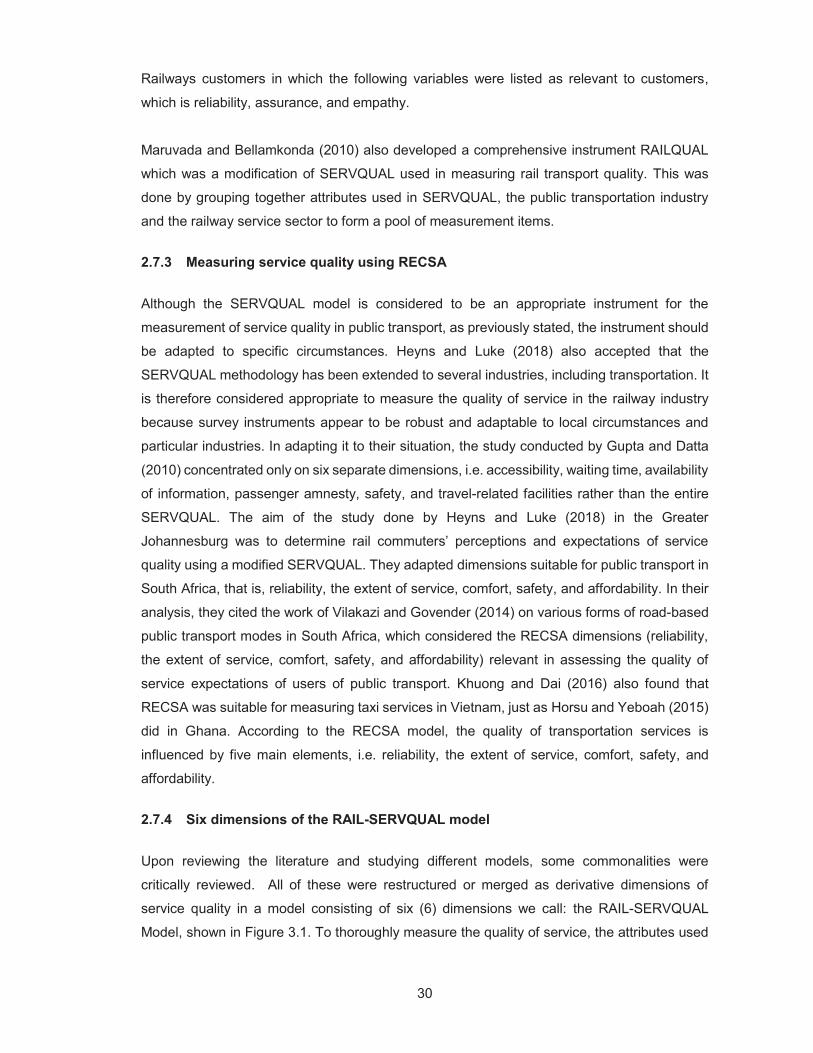
30
Railways customers in which the following variables were listed as relevant to customers,
which is reliability, assurance, and empathy.
Maruvada and Bellamkonda (2010) also developed a comprehensive instrument RAILQUAL
which was a modification of SERVQUAL used in measuring rail transport quality. This was
done by grouping together attributes used in SERVQUAL, the public transportation industry
and the railway service sector to form a pool of measurement items.
2.7.3 Measuring service quality using RECSA
Although the SERVQUAL model is considered to be an appropriate instrument for the
measurement of service quality in public transport, as previously stated, the instrument should
be adapted to specific circumstances. Heyns and Luke (2018) also accepted that the
SERVQUAL methodology has been extended to several industries, including transportation. It
is therefore considered appropriate to measure the quality of service in the railway industry
because survey instruments appear to be robust and adaptable to local circumstances and
particular industries. In adapting it to their situation, the study conducted by Gupta and Datta
(2010) concentrated only on six separate dimensions, i.e. accessibility, waiting time, availability
of information, passenger amnesty, safety, and travel-related facilities rather than the entire
SERVQUAL. The aim of the study done by Heyns and Luke (2018) in the Greater
Johannesburg was to determine rail commuters’ perceptions and expectations of service
quality using a modified SERVQUAL. They adapted dimensions suitable for public transport in
South Africa, that is, reliability, the extent of service, comfort, safety, and affordability. In their
analysis, they cited the work of Vilakazi and Govender (2014) on various forms of road-based
public transport modes in South Africa, which considered the RECSA dimensions (reliability,
the extent of service, comfort, safety, and affordability) relevant in assessing the quality of
service expectations of users of public transport. Khuong and Dai (2016) also found that
RECSA was suitable for measuring taxi services in Vietnam, just as Horsu and Yeboah (2015)
did in Ghana. According to the RECSA model, the quality of transportation services is
influenced by five main elements, i.e. reliability, the extent of service, comfort, safety, and
affordability.
2.7.4 Six dimensions of the RAIL-SERVQUAL model
Upon reviewing the literature and studying different models, some commonalities were
critically reviewed. All of these were restructured or merged as derivative dimensions of
service quality in a model consisting of six (6) dimensions we call: the RAIL-SERVQUAL
Model, shown in Figure 3.1. To thoroughly measure the quality of service, the attributes used
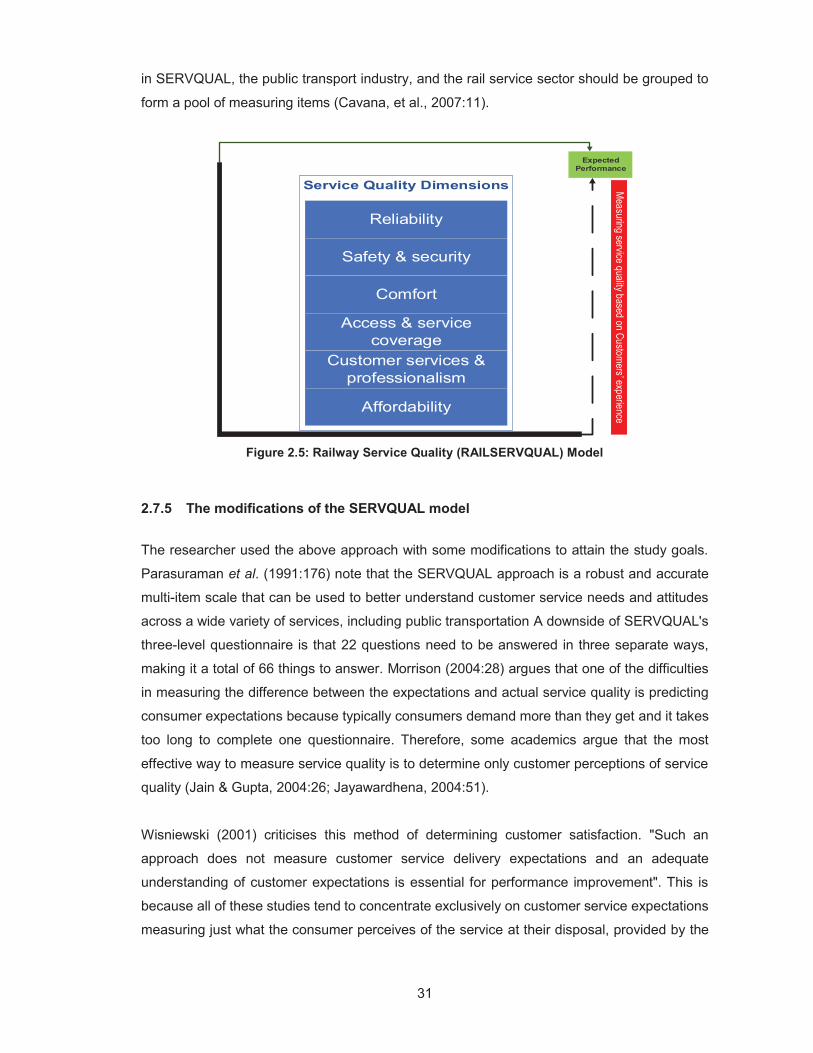
31
in SERVQUAL, the public transport industry, and the rail service sector should be grouped to
form a pool of measuring items (Cavana, et al., 2007:11).
Figure 2.5: Railway Service Quality (RAILSERVQUAL) Model
2.7.5 The modifications of the SERVQUAL model
The researcher used the above approach with some modifications to attain the study goals.
Parasuraman et al. (1991:176) note that the SERVQUAL approach is a robust and accurate
multi-item scale that can be used to better understand customer service needs and attitudes
across a wide variety of services, including public transportation A downside of SERVQUAL's
three-level questionnaire is that 22 questions need to be answered in three separate ways,
making it a total of 66 things to answer. Morrison (2004:28) argues that one of the difficulties
in measuring the difference between the expectations and actual service quality is predicting
consumer expectations because typically consumers demand more than they get and it takes
too long to complete one questionnaire. Therefore, some academics argue that the most
effective way to measure service quality is to determine only customer perceptions of service
quality (Jain & Gupta, 2004:26; Jayawardhena, 2004:51).
Wisniewski (2001) criticises this method of determining customer satisfaction. "Such an
approach does not measure customer service delivery expectations and an adequate
understanding of customer expectations is essential for performance improvement". This is
because all of these studies tend to concentrate exclusively on customer service expectations
measuring just what the consumer perceives of the service at their disposal, provided by the
Expected Performance
Measuring service quality based on Custom
ers’ experience
Reliability
Safety & security
Comfort
Access & service coverage
Customer services & professionalism
Affordability
32
service provider at present. However, the study attempts to measure customer perception
levels (Morrison, 2004).
In line with this perspective, the purpose of this study was to determine only one side of the
quality of service gap – perceptions of customers, in this study known as customer experience,
and the method of calculating gaps per se was not used. Instead, they used cumulative
frequency tables to analyse the data. The changes to the SERVQUAL model were made in
such a way that the model would be suitable for evaluating the level of service in railway
organisations. The original SERVQUAL model structure has been retained with only the
Reliability Dimension held to its original name. The model measures the experience of a
customer upon the service received from using the passenger rail service. There is a
theoretical opportunity to decrease the number of questions while the questionnaire remains
reliable (Khorshidi et al., 2016). The RAILSERVQUAL dimensions applied in the study are
discussed below.
Reliability Reliability indicates the degree to which passengers get the service that they expect (van
Hagen & van Oort, 2019). This dimension focuses on timeliness of train services, availability
of service information; and providing services as stated/promised. Reliability implies output
continuity and dependability. This indicates the organisation's first time delivering the service
correctly. This also means the company is delivering on its pledge. In particular, it includes
consistency in the billing process, accurate record-keeping, and delivering the service at the
time specified.
Safety and security
Trains are driven carefully according to speed limits and other safety rules publicly
displayed.
Visible security features to prevent, detect, and/or control criminal activities/individuals
in waiting areas and on coaches.
Other safety rules, signs, signals publicly displayed.
Safety gadgets, fire alarms are installed in case of unforeseen circumstances
Comfort Comfortable seating, drive, the temperature on coaches and in waiting areas
Access & service coverage Availability, flexibility, and a wide range of service options with respect to time, stations, and
connections. Accessibility to services/stations as well as other supporting services. Access
33
and service coverage requires simplicity and ease of access to railway services. It ensures the
service is readily accessible for people with disabilities, similar to many public transit links and
malls.
Customer service and professionalism Professionalism focuses on the neatness of physical facilities, appearance, and attitude of
staff, cleanliness of trains, etc. Customer care service includes willingness to support
customers; attention to customer needs, customer-centric operations; availability and ability of
staff to handle customer inquiries, etc. Customer service and professionalism include courtesy,
loyalty, consideration, and friendliness of contact staff (including security, ticket verifiers, ticket
sales staff, etc.). It requires consideration of passenger grievances and managing issues
relating to customer relations. It includes explaining the service itself, explaining the quality of
the service, explaining the trade-offs between value and product, and ensuring that an issue
is addressed.
Affordability
Daily, weekly, monthly, seasonal, or yearly train fares/tickets can be afforded by all
categories of income earners.
Train fares/tickets are relatively cheaper compared to other modes of transportation
Increases in fares/tickets can be afforded by all categories of income earners.
2.8 Areas to improve service quality
Service organizations generally strive to achieve customer loyalty, thereby ensuring a more
sound long-term future for the organization, while also enjoying the repeat business offered by
loyal customers. Building customer loyalty, however, is not an isolated task and is an integral
part of every business.
Railways have to revolve around passengers for the customers to be satisfied with the service
(Maruvada & Bellamkonda, 2012:45). Railway passengers must be seen as consumers with
privileges instead of being treated as a captive user with limited choices. Prioritising customers
when designing public transport policies may align passengers' and managers' qualitative
perceptions (Barabino et al., 2012:239). Once organizational objectives are set based on the
needs and desires of their passengers, the company must publicly evaluate their success
against those objectives. Heyns and Luke (2018:473) suggest that to improve the service, it is
important that the perception of the quality of the current service be established and to
determine the factors that commuters value and those where they believe that service
expectations are not being met. Improvement in service quality comes from the organization
knowing where it is, compared to where it wants to be or should be and then taking steps to
34
improve service performance, based on the measurements. Therefore, a holistic approach to
improving the quality of service in the public transport systems is needed, particularly in
identifying the needs and expectations of customers, including the use of complaints and
feedback to determine the appropriate indicators of service quality (Ugo, 2014:3).
Perhaps the most critical element of enhancing customer service is the right people or workers
and that opinion is held by many writers. First of all, if an organization is to be successful in
changing its ways, someone must prove that this is feasible, and secondly, a motivational
factor must be sufficiently strong to encourage commitment.
The understanding of service by the consumer is often more influenced by how staff treats
their grievances. Under these circumstances, the customer is more likely to formulate a
perception of service quality based on how the incident is being handled. These conditions
appear to linger for a longer period in the customer's mind, as opposed to others. Hundal and
Kumar (2015:87) suggest that for the railway operators to be more responsive towards
passenger's requirements & needs, they need training of time management of trains. The
improvements in operational performance dimensions, especially quality and reliability will
result in improved business performance that may lead to sustainable organisation
performance (Maruvada & Bellamkonda, 2010) citing (Nabass & Abdallah 2018:7).
According to Thompson and Bente (2014:12) efficiency in railway can change only if the
railways are willing to do so and the political will exists. The most popular way to improve
efficiency which will then improve service quality is through increasing investments. Celik,
Aydin and Gumus (2014) advised that adding a new rail transit line, increasing the number of
carriages per trip can reduce the crowdedness. A methodology for improving the quality of the
service, shown in Figure 2.4 was verified in an express post company by (Prentkovskis et al.,
2018).
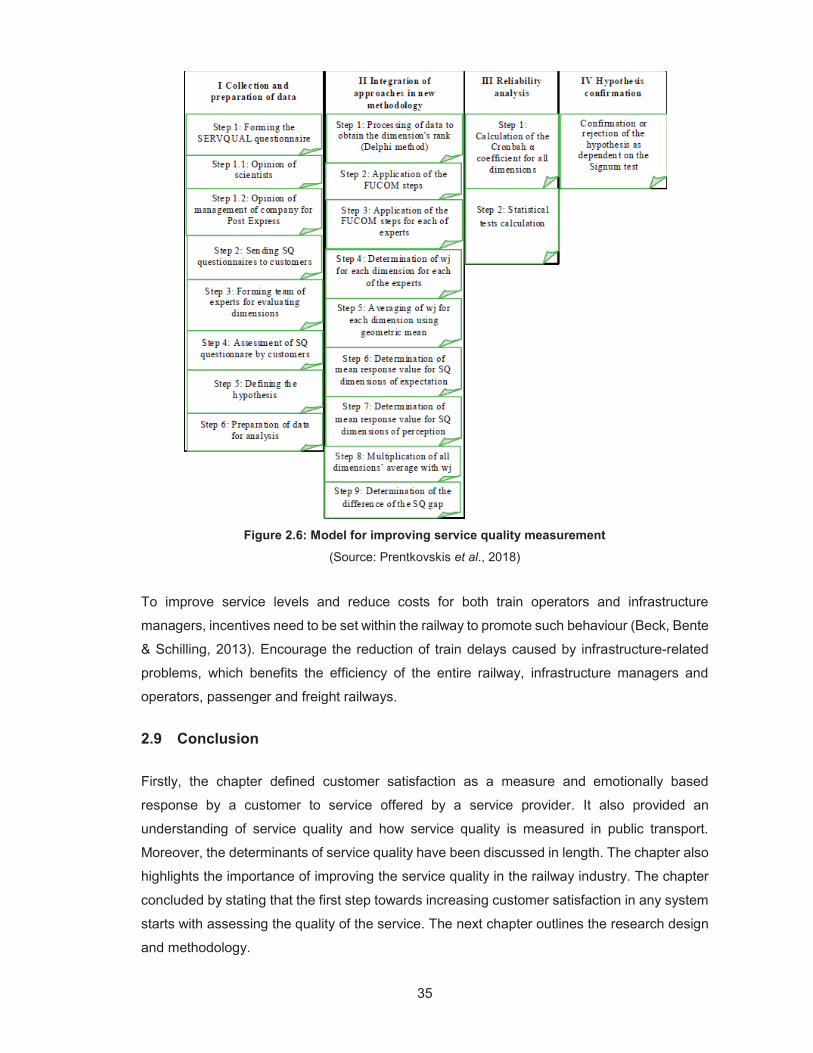
35
Figure 2.6: Model for improving service quality measurement
(Source: Prentkovskis et al., 2018)
To improve service levels and reduce costs for both train operators and infrastructure
managers, incentives need to be set within the railway to promote such behaviour (Beck, Bente
& Schilling, 2013). Encourage the reduction of train delays caused by infrastructure-related
problems, which benefits the efficiency of the entire railway, infrastructure managers and
operators, passenger and freight railways.
2.9 Conclusion
Firstly, the chapter defined customer satisfaction as a measure and emotionally based
response by a customer to service offered by a service provider. It also provided an
understanding of service quality and how service quality is measured in public transport.
Moreover, the determinants of service quality have been discussed in length. The chapter also
highlights the importance of improving the service quality in the railway industry. The chapter
concluded by stating that the first step towards increasing customer satisfaction in any system
starts with assessing the quality of the service. The next chapter outlines the research design
and methodology.

36
CHAPTER 3: RESEARCH DESIGN AND METHODOLOGY
3.1 Introduction
In the previous chapter, the researcher reviewed the literature relevant to the study following
the research questions and problem statement. This chapter undertakes a description and
discussion of the design and methodology of this research. A survey method was employed to
collect quantitative data from the passengers of the railway organisation in the Western Cape
region. This chapter will clarify further the study design, methodology of science, study method,
population, sampling process, data collection, validity, reliability, and ethical considerations.
3.2 Research Paradigm, methods, and methodology
The term research paradigm and research philosophy are used interchangeably. Saunders,
Philip, and Adrian (2016:124) refer to the term research philosophy as a system of beliefs and
assumptions about the development of knowledge. A paradigm in this context of the study
refers to the entire constellation of beliefs, values, and techniques shared by the commuters
of the train. Ontology relates to issues such as whether there is an objective reality; described
as the science of being (Tronvoll et al., 2011) citing Burrell and Morgan( 1985). They note that
ontology examines the form of reality that exists, what this reality looks like, the entities reside
within the reality, and how these entities interact (Tronvoll et al., 2011). Ontology provides
researchers with a lens to formulate their research questions and helps guide their selection
and use of theories and research methods. The ontological position that the researcher took
was the objectivist position as he believes that he is ideally an objective observer that does not
participate or rather influence what is being studied. According to Saunders et al. (2016:128),
objectivism argues that the social reality that we research is external to us. The ontological
position was taken because the researcher has no influence on what consumers of the product
perceive about the quality of the product.
On taking an objectivist approach, the researcher’s epistemological position was a positivist
rather than an interpretivist lens. According to Schulze (2003:9), positivists believe that there
is an objective real world beyond the individual's body which can be known and described. All
conclusions about reality are based on empirical observations that can be publicly verified
(seen, heard, touched, smelled, and measured). Positivism gives importance to research
methods focusing on quantitative analysis, surveys, and experiments. Tronvoll et al.
(2011:468) described service research as positivist when using formal proposals, quantifiable
37
variables tests, testing hypotheses, and inferences about a phenomenon from a representative
sample of the specified population.
3.3 Research approach
Research methods are often divided into two main types in education and the other social
sciences: quantitative and qualitative methods. Bhawna & Gobind (2015) portrayed qualitative
research as a developing model that happens in a characteristic setting that empowers the
scientist to build up a degree of detail from the high association in genuine encounters.
Quantitative research involves studies that make use of statistical analyses to obtain their
findings where key features include formal and systematic measurement and the use of
statistics (Marczyk et al., 2005:17). Quantitative research was used to collect facts and figures
as it uses mathematical tools such as SPSS and it is less time-consuming. The quantitative
approach was also chosen due to the epistemological position taken by the researcher, i.e.,
positivist. Saunders et al. (2016:166) note that quantitative research is generally associated
with positivism, especially when used with predetermined, highly structured techniques of data
collection.
3.4 Research population and selection of the sample
Etikan (2016:1) defines a population as the total quantity of the items or cases that are the
focus of the study that the researcher wishes to test. The population for sampling was the
whole train users in the Cape Metropolitan region.
3.4.1 Sampling
According to Etikan (2016:1), a sample is the subset of the entire population that a researcher
is currently studying and the features of which will be applied to the entire population. For the
study, convenience sampling was used and a research sample was taken to measure the
interpretation of the clients. Different groups of passengers were surveyed at different times
on several attributes of service quality delivered by the passenger rail service. The three
groups were specifically selected based on off-peak hour, normal hour, and peak hour.
Convenience or availability sampling was used because of the accessibility, geographical
closeness, availability at a given time, and the willingness of respondents to participate in the
survey (Etikan, 2016:1). A disadvantage of convenience sampling is that generalisation from
the results of this research is impaired. Watson (2015:40) notes: "this approach has clear cost
and convenience benefits but suffers from severe bias issues, as the sites to which they have
easy access may not be representative of the population". Since the sample of this study only
involved the passengers from a commuter rail in the Western Cape region, thus, the study
results do not represent the service quality of entire commuter rail sector of the country.
38
3.4.2 Sampling technique
Sampling techniques may be classified as probability and nonprobability sampling. The
probability of inclusion of every element of the population can be calculated for probability
sampling. In comparison, non-probability sampling cannot determine the likelihood that each
variable of the population will be included in a sample. The reason for choosing non-probability
sampling instead of probability sampling was related to cost, human resources, and time.
According to Saunders et al. (2016:304), more planning and repeated follow-up calls are
required for probability sampling to ensure each member in the selected sample is contacted.
This has the potential to become expensive.
3.4.3 Sampling size
It would be superfluous to use the entire population in any type of research, but in most cases,
it is not feasible to include every subject because the population is nearly finite (Etikan, 2016:2).
Studying a representative sample allowed the researcher to draw valid population inferences.
A sample size of 100 respondents was selected. However, due to several available
respondents, the actual number was 110 respondents.
3.5 Data collection
Only primary data sources were used for study purposes, and/or analysed. Consequently, the
questionnaire was the primary data collection tool to obtain quantitative primary data for further
study. The survey aimed to identify the participant’s opinions regarding the service quality of
the passenger railway. The questionnaire was developed using information from existing
literature, findings from the pilot research, and expert opinion.
The questionnaire is better for this type of study since it minimizes the researcher's
involvement. A survey using questionnaires is common because they provide a highly
economical way of collecting standardised data from a large population, allowing for easy
comparison (Saunders et al., 2016:181). The SERVQUAL model was adapted and modified
to form the RAIL-SERVQUAL as a questionnaire to collect data. The SERVQUAL model may
be the most appropriate tool for service quality measurement because it is extremely easy to
understand. The key reason it was chosen for use in this study is that it was designed for
measuring the quality of service in a variety of industries. The model's reliability and precision
are also among the reasons why it was chosen as a method to assess the level of service in
railway organisations. A five-point Likert scale ranging from “poor service” quality to “excellent
service” was used to get the level of experience associated with each service quality criterion.
39
Section A consists of demographic questions about the purpose of riding, the
characteristics of travel, etc.
Section B contained 31 items that measured the responses on a five-point Likert scale
for customers’ experience on the service quality provided by the passenger rail.
3.5.1 Pilot study
The modified RAIL-SERVQUAL model was tested to make sure the respondents understood
the different statements beforehand. A pilot study was conducted with 30 participants to ensure
the data collection method was in no way ambiguous. The pilot study was also to test the
questionnaire and ensure the study was validated, for accuracy and ease of interpretation. The
length of the survey was also tested. Several questions that are assumed to have some overlap
with others in the questionnaire were omitted to reduce the time required to fill in the
questionnaire so that a better response rate and better response quality could be obtained.
Furthermore, some rewording of questions was necessary to raise the interest of the
respondent in completing the questionnaire. After focus group discussions, 43 attributes were
established while 12 were removed after expert opinions were solicited.
3.5.2 Data collection for the main study
After making the relevant adjustments in the instrument of data collection as indicated by the
results of the pilot study, the researcher proceeded to collect data for the main study. The data
were gathered through an on-board survey and assessing passengers on the platforms at
different times of day, on every day of the week, over four weeks. One hundred questionnaires
were administered manually. The three categories of passengers are incoming passengers,
outgoing passengers, and on journey passengers. The survey was carried out in November
2019 at various major junction stations in both the Southern and Northern sections. After the
survey was conducted all the questionnaires for tabulation and interpretation were collected.
More questionnaires were then completed leaving a total of 110 questionnaires classified as
complete and accurate for review.
3.6 Data Analysis
Factor analysis and one-sample t-test were used to analyse the dataset for this study. The
next step after conducting the study and gathering the data included analysing the data, which
generally requires the use of statistical techniques. The primary data are those that are new
and therefore original (Kothari, 2004). Primary information was collected from the completed
questionnaires which were distributed and administered manually on paper. The data were
entered on the Microsoft Office Excel sheet before being imported into the statistic software kit
SPSS version 26 (IBM, 2019). Statistical methods often mean that the analysis is considered
40
reliable, suitable for situations where systematic, standardized comparisons are necessary.
Marczyk et al. (2005) note that statistics help researchers reduce the probability of arriving at
a false conclusion about the relationship between the variables being studied. Data analysis
was preceded by case and variable screening. The aim was to have a clean dataset for further
analysis. After initial data exploration, all 110 cases were retained.
3.6.1 Validity
“Validity simply involves how we measure what we want to measure and is probably the most
important single measurement factor” (Watson, 2015:82). Consequently, validity is the degree
to which differences found with a measuring instrument indicate true differences between
those tested. Construct validity test, discriminant validity, and convergent validity was tested.
Construct validity test for the six latent variables was done based on indices such as Relative
Chi-Square (χ2/df); Comparative Fit Index (CFI); Root Mean Square Error of Approximation
(RMSEA); PCLOSE and SRMR. The obtained indices show that there is good construct
validity. To measure convergent validity, Average Variance Extracted (AVE) and results
showed that all AVE estimates are greater 0.5 prove that our CFA model has good convergent
validity. There is validity when the findings of the research reflect the perceptions of the people
under study. Validity is probably the single most important feature of any measuring instrument
design in research (Watson, 2015:66).
3.6.2 Reliability
Reliability refers to the degree to which the test scores are error-free (Watson, 2015:71).
Credible analysis of the research should be accurate and consistent. Accurate data is accurate,
reliable, unerring, trustworthy, and reputable. The reliability of the responses has been tested
using Cronbach alpha and SPSS for the current study. It is commonly accepted that
Cronbach's alpha scores above 0.69 are measures of reliability. The reliability of the responses
has been tested using Cronbach alpha and SPSS for the current study. Consequently, the
reliability test was confirmed using the critical Cronbach alpha value of 0.7.
3.7 Ethical consideration
In conducting the research, the researcher was required to maintain the highest ethical
standards, especially when human subjects are involved. Having maintained the highest
ethical standards, it remained the researcher’s duty to comply with all applicable regulations in
this regard, including those of the institution at which the work is performed, the Cape
Peninsula University of Technology. The researcher established ethical principles by first
ensuring the company grants permission to perform the study and to survey the participants.
41
The consent letter was then signed and approved by the Regional Manager upon consultation
with the Institution’s head office.
An ethical clearance certificate was submitted to the institution concerning data collection, and
the letter of consent, data collection request, approval letter, and confidentiality agreement
were requested and submitted to the public sector organization by the researcher (evidence
attached as appendices). The researcher physically administered the questionnaires, where
participants were given the freedom to either choose to take part or not. The researcher
advised the participants of the type and purpose of the research being conducted, and the
participants were asked to sign the consent form. All participants were ensured of
confidentiality and their privacy was safeguarded. One of the major risks associated with the
research project is the confidentiality and trust breach. This risk was immediately mitigated as
the researcher was not required to keep any personal information of the participants. The
collected data was used for its intended research purpose. The research was conducted
following the ethical and professional guidelines as specified in CPUT’s ethical policy.
3.8 Conclusion
In this chapter, the study methodology and design were deliberated, as well as the specified
sample size. \the research site and the data collection techniques that were used were
discussed. The quantitative method was used to collect a thorough analysis of the knowledge
and experiences of the participants in the research area. Data were collected through a survey.
The administration of the questionnaires was limited to Western Cape Metro area train
passengers. Data were analysed and discussed. Ethics, reliability, and validity were also
discussed in this chapter. The chapter ended with an explanation of the upholding of the ethos
of integrity and anonymity and ethical security for the participants. The next segment
summarizes and presents the findings of the study.
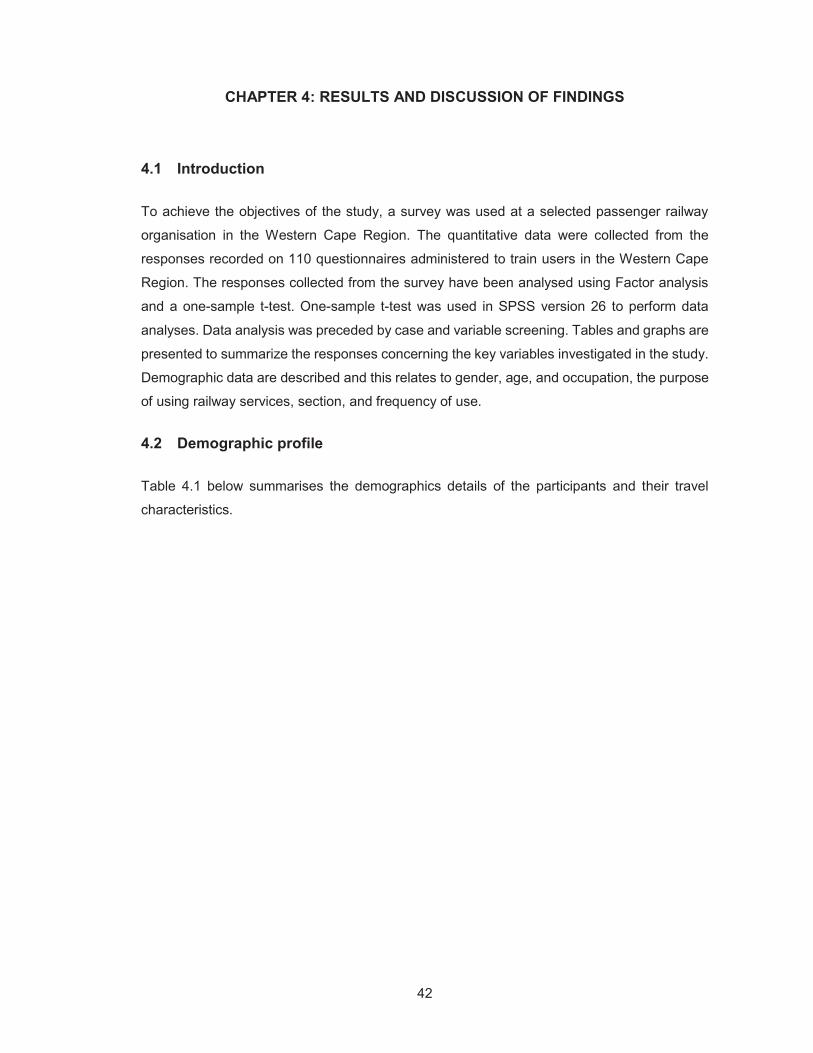
42
CHAPTER 4: RESULTS AND DISCUSSION OF FINDINGS
4.1 Introduction
To achieve the objectives of the study, a survey was used at a selected passenger railway
organisation in the Western Cape Region. The quantitative data were collected from the
responses recorded on 110 questionnaires administered to train users in the Western Cape
Region. The responses collected from the survey have been analysed using Factor analysis
and a one-sample t-test. One-sample t-test was used in SPSS version 26 to perform data
analyses. Data analysis was preceded by case and variable screening. Tables and graphs are
presented to summarize the responses concerning the key variables investigated in the study.
Demographic data are described and this relates to gender, age, and occupation, the purpose
of using railway services, section, and frequency of use.
4.2 Demographic profile
Table 4.1 below summarises the demographics details of the participants and their travel
characteristics.
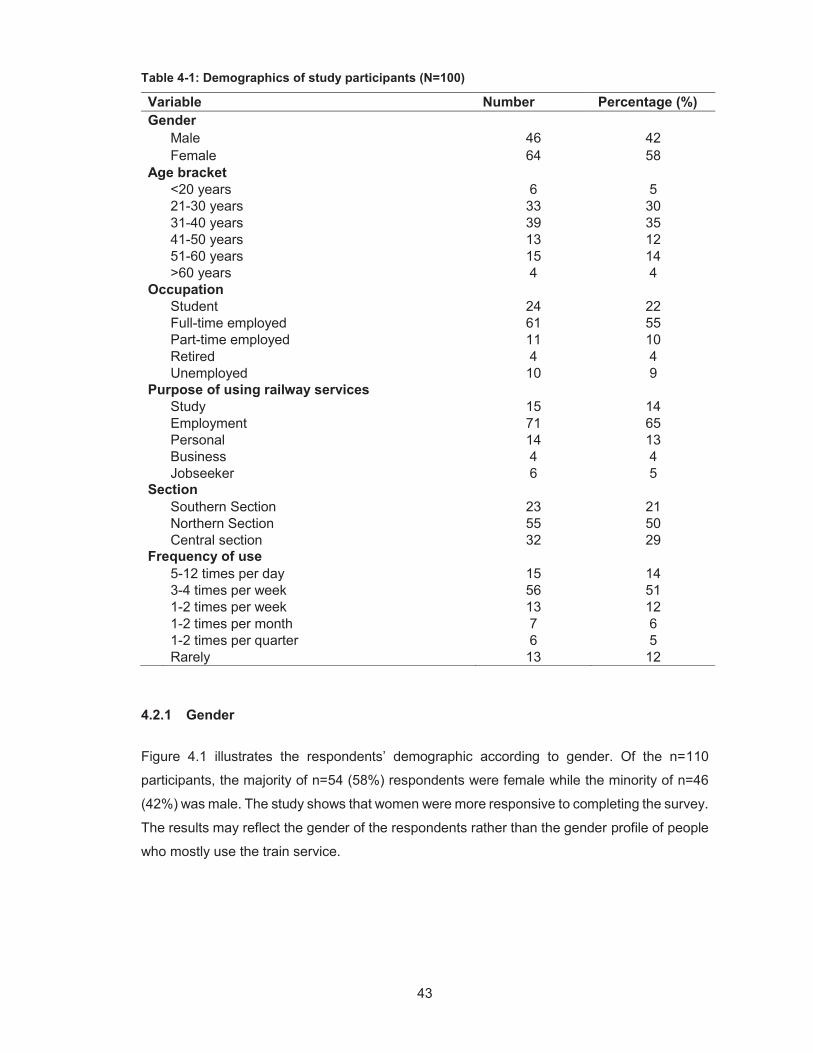
43
Table 4-1: Demographics of study participants (N=100)
Variable Number Percentage (%) Gender Male 46 42 Female 64 58 Age bracket <20 years 6 5 21-30 years 33 30 31-40 years 39 35 41-50 years 13 12 51-60 years 15 14 >60 years 4 4 Occupation Student 24 22 Full-time employed 61 55 Part-time employed 11 10 Retired 4 4 Unemployed 10 9 Purpose of using railway services Study 15 14 Employment 71 65 Personal 14 13 Business 4 4 Jobseeker 6 5 Section Southern Section 23 21 Northern Section 55 50 Central section 32 29 Frequency of use 5-12 times per day 15 14 3-4 times per week 56 51 1-2 times per week 13 12 1-2 times per month 7 6 1-2 times per quarter 6 5 Rarely 13 12
4.2.1 Gender
Figure 4.1 illustrates the respondents’ demographic according to gender. Of the n=110
participants, the majority of n=54 (58%) respondents were female while the minority of n=46
(42%) was male. The study shows that women were more responsive to completing the survey.
The results may reflect the gender of the respondents rather than the gender profile of people
who mostly use the train service.
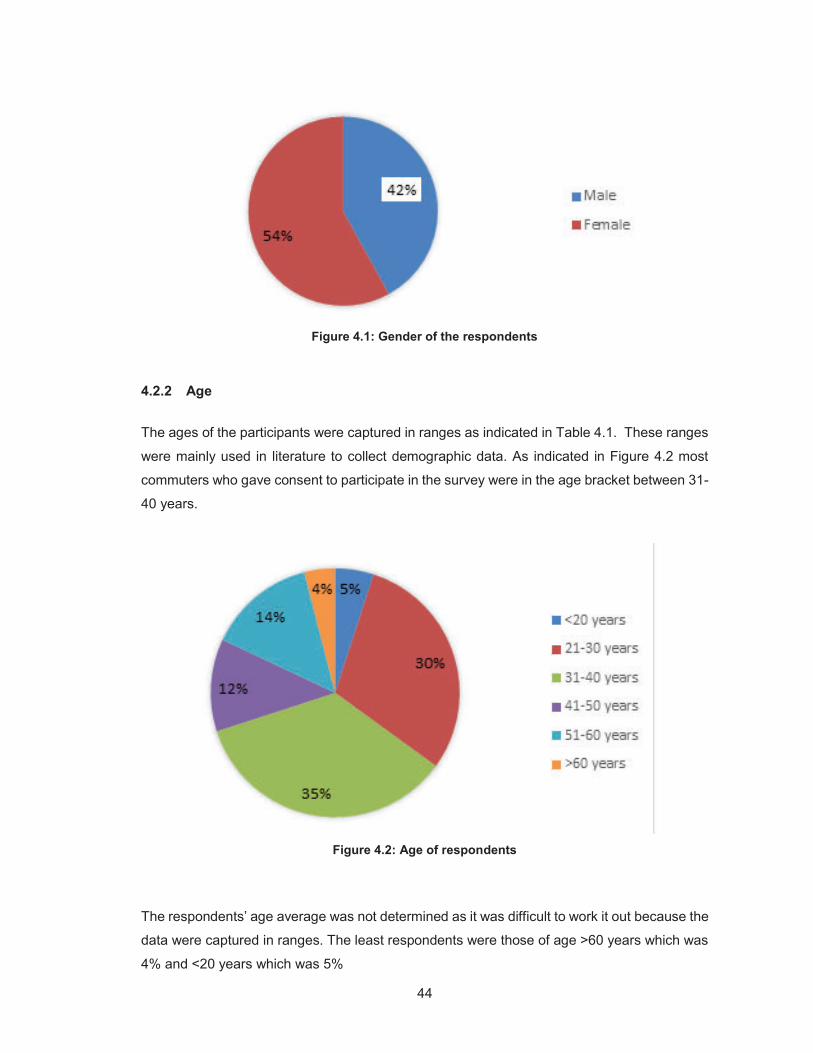
44
Figure 4.1: Gender of the respondents
4.2.2 Age
The ages of the participants were captured in ranges as indicated in Table 4.1. These ranges
were mainly used in literature to collect demographic data. As indicated in Figure 4.2 most
commuters who gave consent to participate in the survey were in the age bracket between 31-
40 years.
Figure 4.2: Age of respondents
The respondents’ age average was not determined as it was difficult to work it out because the
data were captured in ranges. The least respondents were those of age >60 years which was
4% and <20 years which was 5%
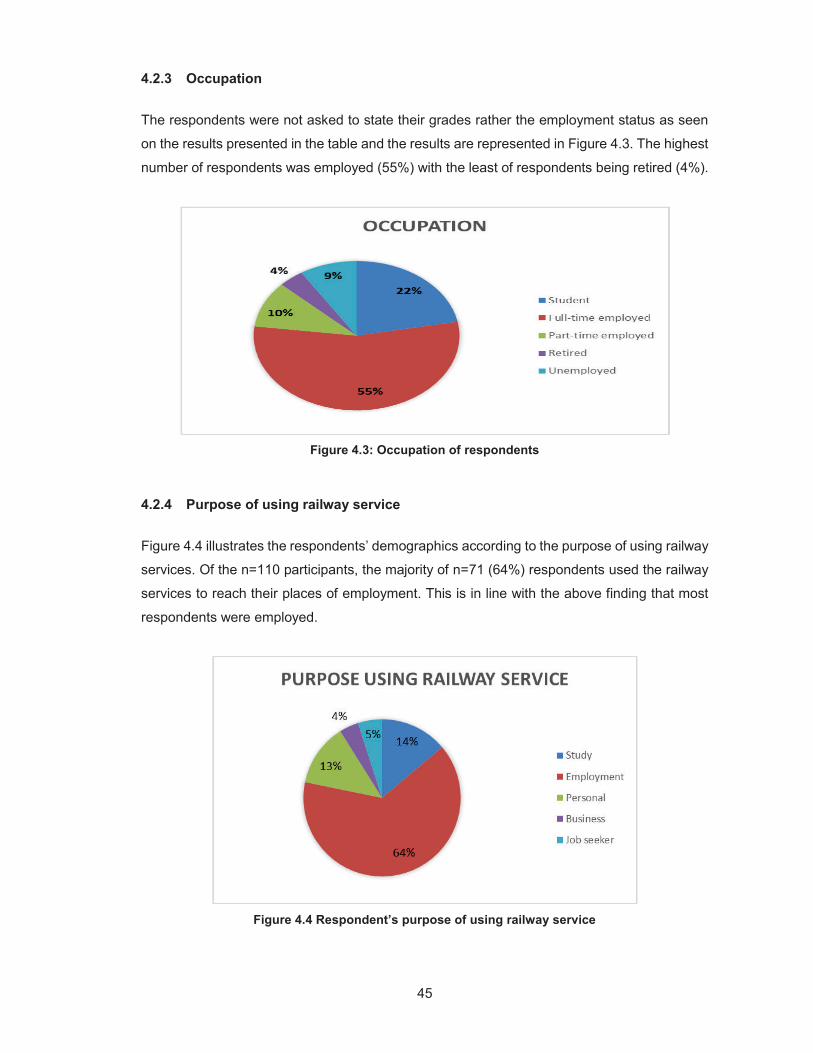
45
4.2.3 Occupation
The respondents were not asked to state their grades rather the employment status as seen
on the results presented in the table and the results are represented in Figure 4.3. The highest
number of respondents was employed (55%) with the least of respondents being retired (4%).
Figure 4.3: Occupation of respondents
4.2.4 Purpose of using railway service
Figure 4.4 illustrates the respondents’ demographics according to the purpose of using railway
services. Of the n=110 participants, the majority of n=71 (64%) respondents used the railway
services to reach their places of employment. This is in line with the above finding that most
respondents were employed.
Figure 4.4 Respondent’s purpose of using railway service
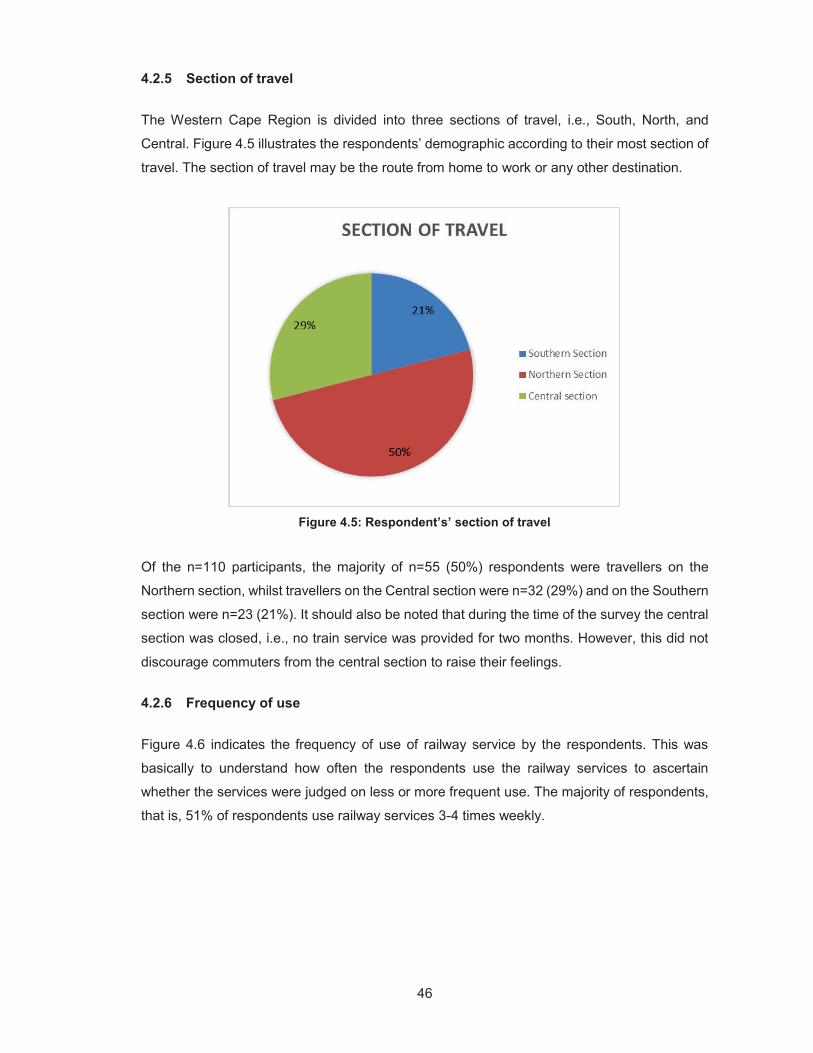
46
4.2.5 Section of travel
The Western Cape Region is divided into three sections of travel, i.e., South, North, and
Central. Figure 4.5 illustrates the respondents’ demographic according to their most section of
travel. The section of travel may be the route from home to work or any other destination.
Figure 4.5: Respondent’s’ section of travel
Of the n=110 participants, the majority of n=55 (50%) respondents were travellers on the
Northern section, whilst travellers on the Central section were n=32 (29%) and on the Southern
section were n=23 (21%). It should also be noted that during the time of the survey the central
section was closed, i.e., no train service was provided for two months. However, this did not
discourage commuters from the central section to raise their feelings.
4.2.6 Frequency of use
Figure 4.6 indicates the frequency of use of railway service by the respondents. This was
basically to understand how often the respondents use the railway services to ascertain
whether the services were judged on less or more frequent use. The majority of respondents,
that is, 51% of respondents use railway services 3-4 times weekly.
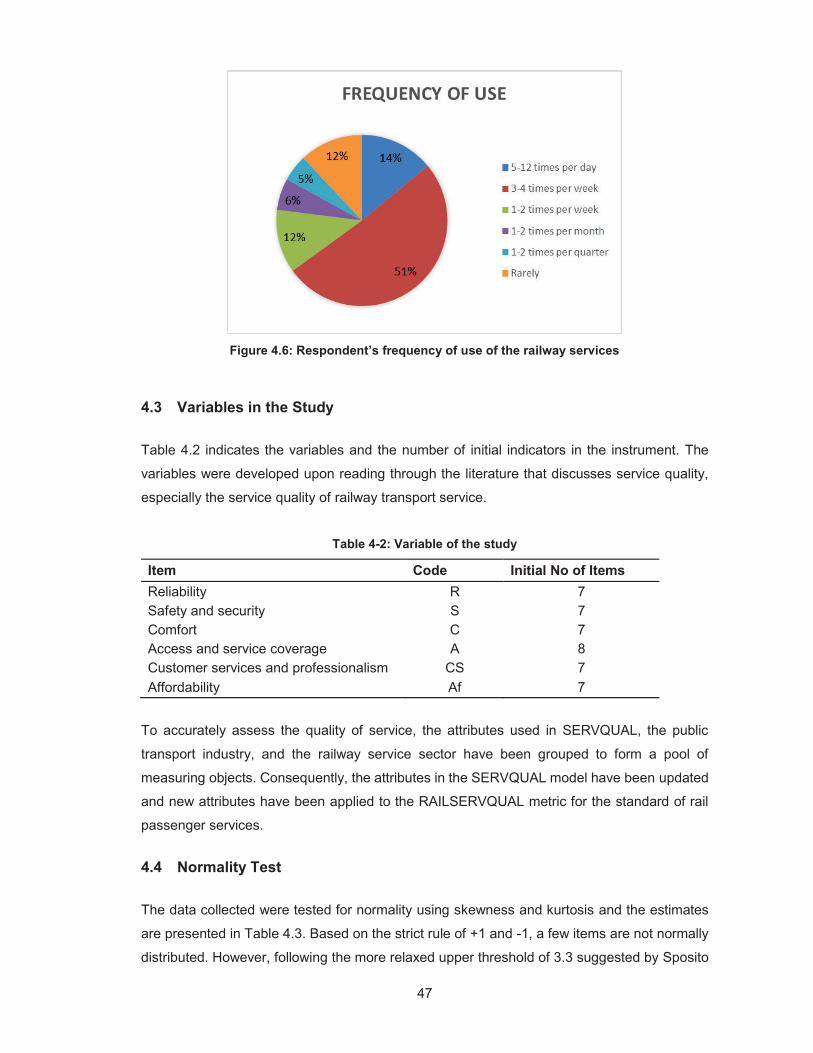
47
Figure 4.6: Respondent’s frequency of use of the railway services
4.3 Variables in the Study
Table 4.2 indicates the variables and the number of initial indicators in the instrument. The
variables were developed upon reading through the literature that discusses service quality,
especially the service quality of railway transport service.
Table 4-2: Variable of the study
Item Code Initial No of Items Reliability R 7 Safety and security S 7 Comfort C 7 Access and service coverage A 8 Customer services and professionalism CS 7 Affordability Af 7
To accurately assess the quality of service, the attributes used in SERVQUAL, the public
transport industry, and the railway service sector have been grouped to form a pool of
measuring objects. Consequently, the attributes in the SERVQUAL model have been updated
and new attributes have been applied to the RAILSERVQUAL metric for the standard of rail
passenger services.
4.4 Normality Test
The data collected were tested for normality using skewness and kurtosis and the estimates
are presented in Table 4.3. Based on the strict rule of +1 and -1, a few items are not normally
distributed. However, following the more relaxed upper threshold of 3.3 suggested by Sposito
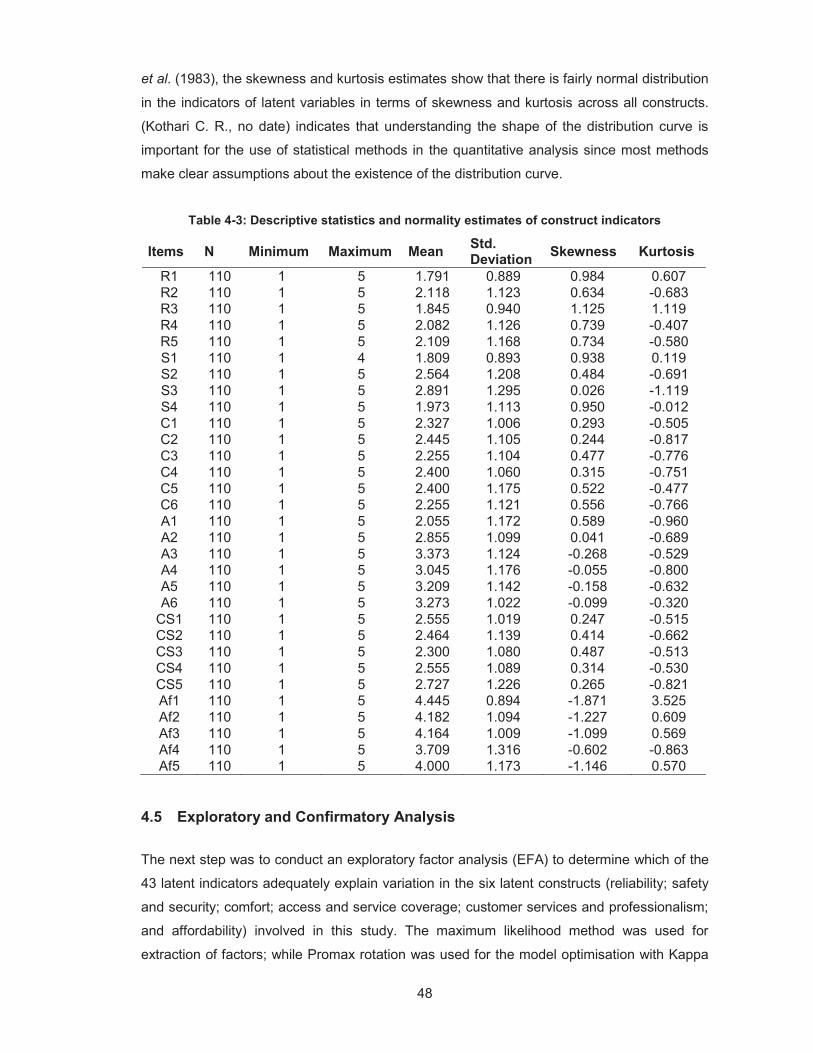
48
et al. (1983), the skewness and kurtosis estimates show that there is fairly normal distribution
in the indicators of latent variables in terms of skewness and kurtosis across all constructs.
(Kothari C. R., no date) indicates that understanding the shape of the distribution curve is
important for the use of statistical methods in the quantitative analysis since most methods
make clear assumptions about the existence of the distribution curve.
Table 4-3: Descriptive statistics and normality estimates of construct indicators
Items N Minimum Maximum Mean Std. Deviation Skewness Kurtosis
R1 110 1 5 1.791 0.889 0.984 0.607 R2 110 1 5 2.118 1.123 0.634 -0.683 R3 110 1 5 1.845 0.940 1.125 1.119 R4 110 1 5 2.082 1.126 0.739 -0.407 R5 110 1 5 2.109 1.168 0.734 -0.580 S1 110 1 4 1.809 0.893 0.938 0.119 S2 110 1 5 2.564 1.208 0.484 -0.691 S3 110 1 5 2.891 1.295 0.026 -1.119 S4 110 1 5 1.973 1.113 0.950 -0.012 C1 110 1 5 2.327 1.006 0.293 -0.505 C2 110 1 5 2.445 1.105 0.244 -0.817 C3 110 1 5 2.255 1.104 0.477 -0.776 C4 110 1 5 2.400 1.060 0.315 -0.751 C5 110 1 5 2.400 1.175 0.522 -0.477 C6 110 1 5 2.255 1.121 0.556 -0.766 A1 110 1 5 2.055 1.172 0.589 -0.960 A2 110 1 5 2.855 1.099 0.041 -0.689 A3 110 1 5 3.373 1.124 -0.268 -0.529 A4 110 1 5 3.045 1.176 -0.055 -0.800 A5 110 1 5 3.209 1.142 -0.158 -0.632 A6 110 1 5 3.273 1.022 -0.099 -0.320
CS1 110 1 5 2.555 1.019 0.247 -0.515 CS2 110 1 5 2.464 1.139 0.414 -0.662 CS3 110 1 5 2.300 1.080 0.487 -0.513 CS4 110 1 5 2.555 1.089 0.314 -0.530 CS5 110 1 5 2.727 1.226 0.265 -0.821 Af1 110 1 5 4.445 0.894 -1.871 3.525 Af2 110 1 5 4.182 1.094 -1.227 0.609 Af3 110 1 5 4.164 1.009 -1.099 0.569 Af4 110 1 5 3.709 1.316 -0.602 -0.863 Af5 110 1 5 4.000 1.173 -1.146 0.570
4.5 Exploratory and Confirmatory Analysis
The next step was to conduct an exploratory factor analysis (EFA) to determine which of the
43 latent indicators adequately explain variation in the six latent constructs (reliability; safety
and security; comfort; access and service coverage; customer services and professionalism;
and affordability) involved in this study. The maximum likelihood method was used for
extraction of factors; while Promax rotation was used for the model optimisation with Kappa
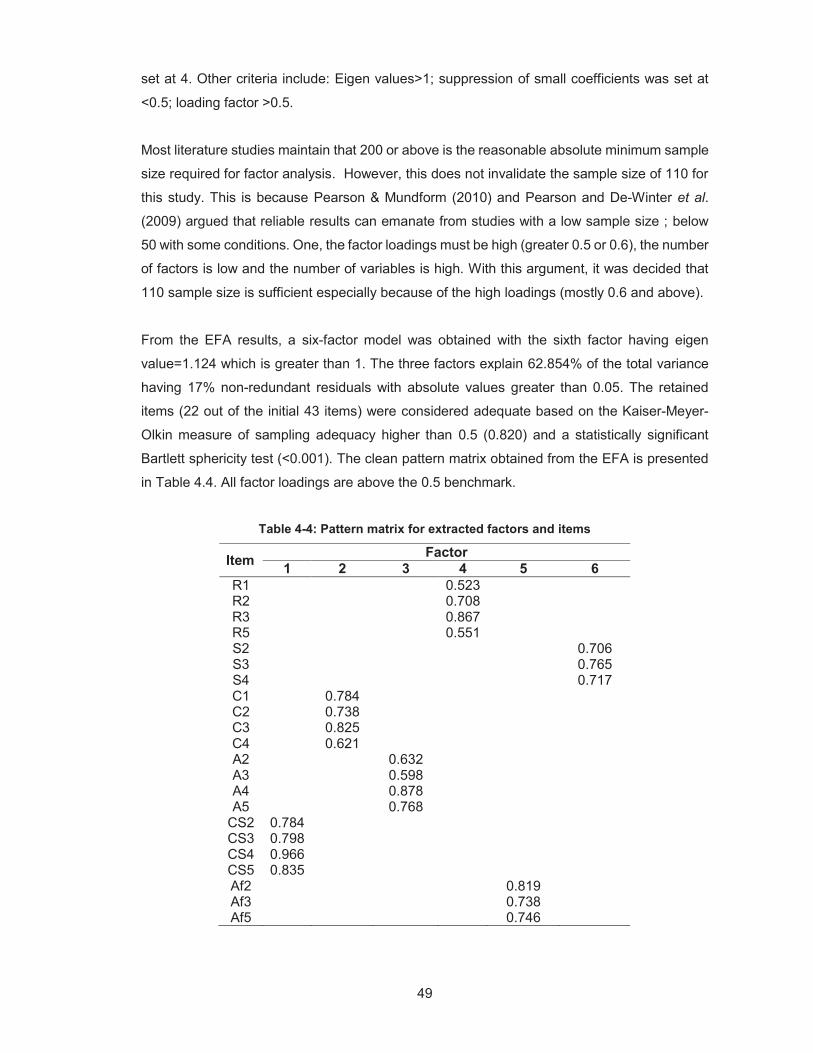
49
set at 4. Other criteria include: Eigen values>1; suppression of small coefficients was set at
<0.5; loading factor >0.5.
Most literature studies maintain that 200 or above is the reasonable absolute minimum sample
size required for factor analysis. However, this does not invalidate the sample size of 110 for
this study. This is because Pearson & Mundform (2010) and Pearson and De-Winter et al.
(2009) argued that reliable results can emanate from studies with a low sample size ; below
50 with some conditions. One, the factor loadings must be high (greater 0.5 or 0.6), the number
of factors is low and the number of variables is high. With this argument, it was decided that
110 sample size is sufficient especially because of the high loadings (mostly 0.6 and above).
From the EFA results, a six-factor model was obtained with the sixth factor having eigen
value=1.124 which is greater than 1. The three factors explain 62.854% of the total variance
having 17% non-redundant residuals with absolute values greater than 0.05. The retained
items (22 out of the initial 43 items) were considered adequate based on the Kaiser-Meyer-
Olkin measure of sampling adequacy higher than 0.5 (0.820) and a statistically significant
Bartlett sphericity test (<0.001). The clean pattern matrix obtained from the EFA is presented
in Table 4.4. All factor loadings are above the 0.5 benchmark.
Table 4-4: Pattern matrix for extracted factors and items
Item Factor 1 2 3 4 5 6
R1
0.523
R2
0.708
R3
0.867
R5
0.551
S2
0.706 S3
0.765
S4
0.717 C1
0.784
C2
0.738
C3
0.825
C4
0.621
A2
0.632
A3
0.598
A4
0.878
A5
0.768
CS2 0.784
CS3 0.798
CS4 0.966
CS5 0.835
Af2
0.819
Af3
0.738
Af5
0.746
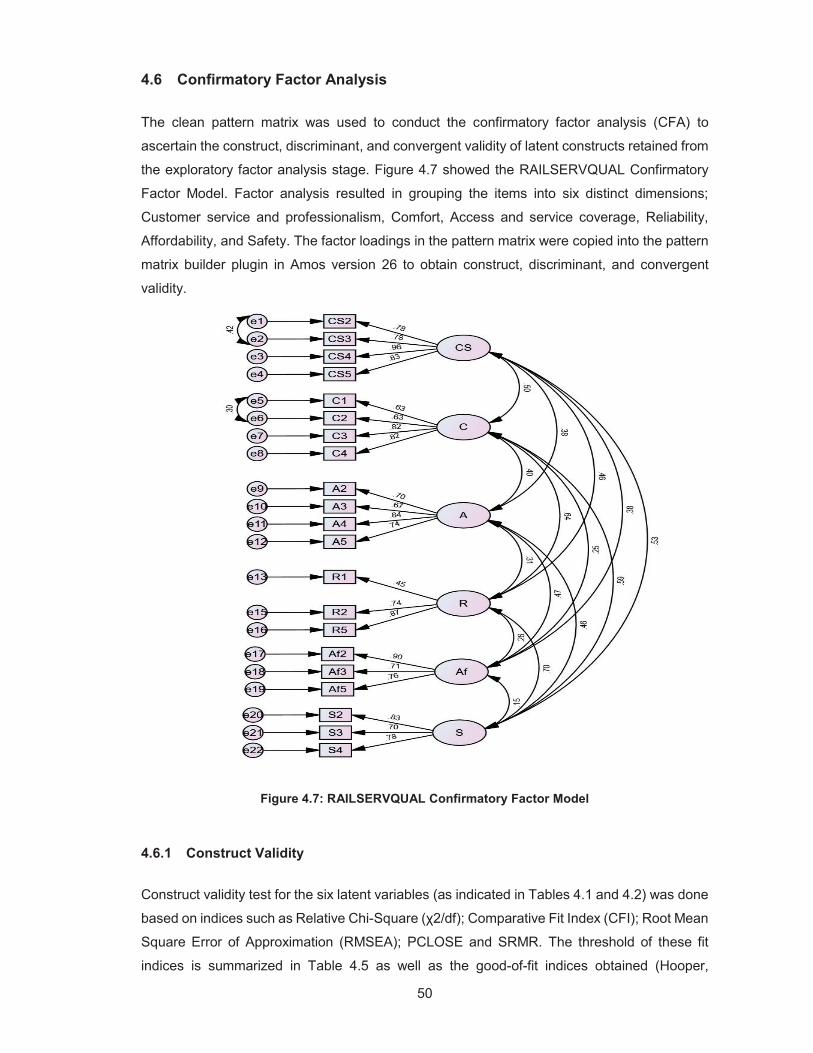
50
4.6 Confirmatory Factor Analysis
The clean pattern matrix was used to conduct the confirmatory factor analysis (CFA) to
ascertain the construct, discriminant, and convergent validity of latent constructs retained from
the exploratory factor analysis stage. Figure 4.7 showed the RAILSERVQUAL Confirmatory
Factor Model. Factor analysis resulted in grouping the items into six distinct dimensions;
Customer service and professionalism, Comfort, Access and service coverage, Reliability,
Affordability, and Safety. The factor loadings in the pattern matrix were copied into the pattern
matrix builder plugin in Amos version 26 to obtain construct, discriminant, and convergent
validity.
Figure 4.7: RAILSERVQUAL Confirmatory Factor Model
4.6.1 Construct Validity
Construct validity test for the six latent variables (as indicated in Tables 4.1 and 4.2) was done
based on indices such as Relative Chi-Square (χ2/df); Comparative Fit Index (CFI); Root Mean
Square Error of Approximation (RMSEA); PCLOSE and SRMR. The threshold of these fit
indices is summarized in Table 4.5 as well as the good-of-fit indices obtained (Hooper,
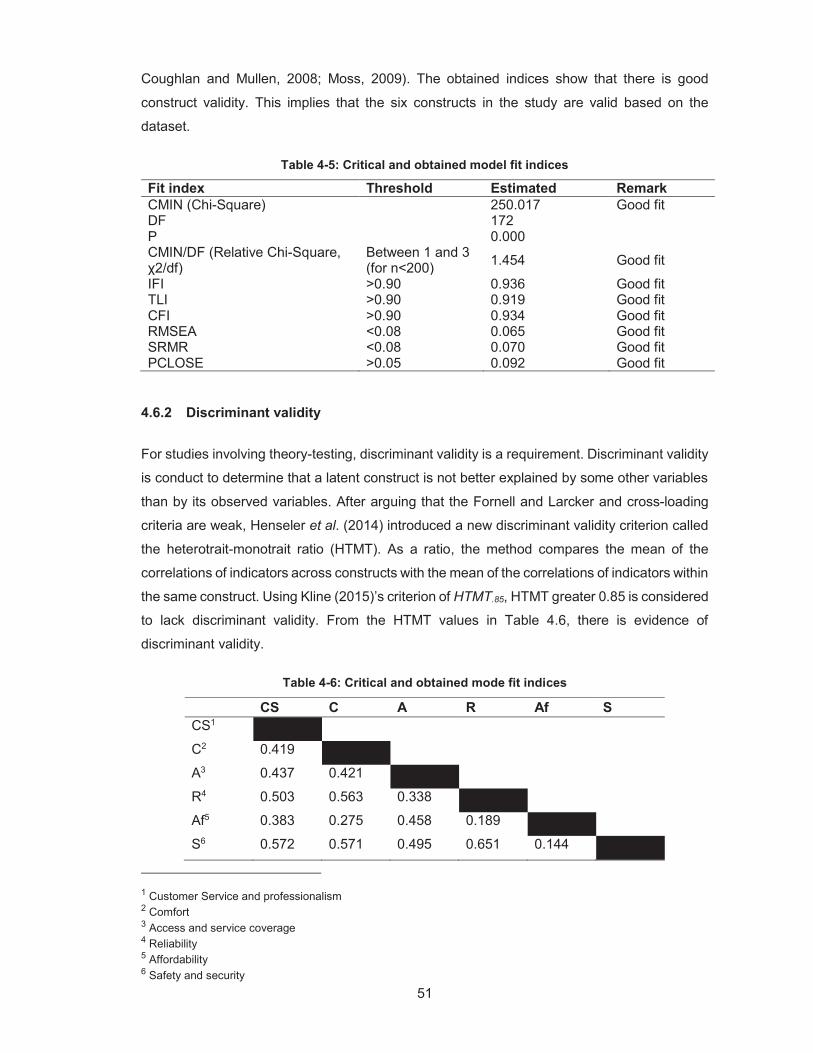
51
Coughlan and Mullen, 2008; Moss, 2009). The obtained indices show that there is good
construct validity. This implies that the six constructs in the study are valid based on the
dataset.
Table 4-5: Critical and obtained model fit indices
Fit index Threshold Estimated Remark CMIN (Chi-Square) 250.017 Good fit DF 172 P 0.000 CMIN/DF (Relative Chi-Square, χ2/df)
Between 1 and 3 (for n<200) 1.454 Good fit
IFI >0.90 0.936 Good fit TLI >0.90 0.919 Good fit CFI >0.90 0.934 Good fit RMSEA <0.08 0.065 Good fit SRMR <0.08 0.070 Good fit PCLOSE >0.05 0.092 Good fit
4.6.2 Discriminant validity
For studies involving theory-testing, discriminant validity is a requirement. Discriminant validity
is conduct to determine that a latent construct is not better explained by some other variables
than by its observed variables. After arguing that the Fornell and Larcker and cross-loading
criteria are weak, Henseler et al. (2014) introduced a new discriminant validity criterion called
the heterotrait-monotrait ratio (HTMT). As a ratio, the method compares the mean of the
correlations of indicators across constructs with the mean of the correlations of indicators within
the same construct. Using Kline (2015)’s criterion of HTMT.85, HTMT greater 0.85 is considered
to lack discriminant validity. From the HTMT values in Table 4.6, there is evidence of
discriminant validity.
Table 4-6: Critical and obtained mode fit indices
CS C A R Af S CS1
C2 0.419
A3 0.437 0.421
R4 0.503 0.563 0.338
Af5 0.383 0.275 0.458 0.189
S6 0.572 0.571 0.495 0.651 0.144
1 Customer Service and professionalism 2 Comfort 3 Access and service coverage 4 Reliability 5 Affordability 6 Safety and security
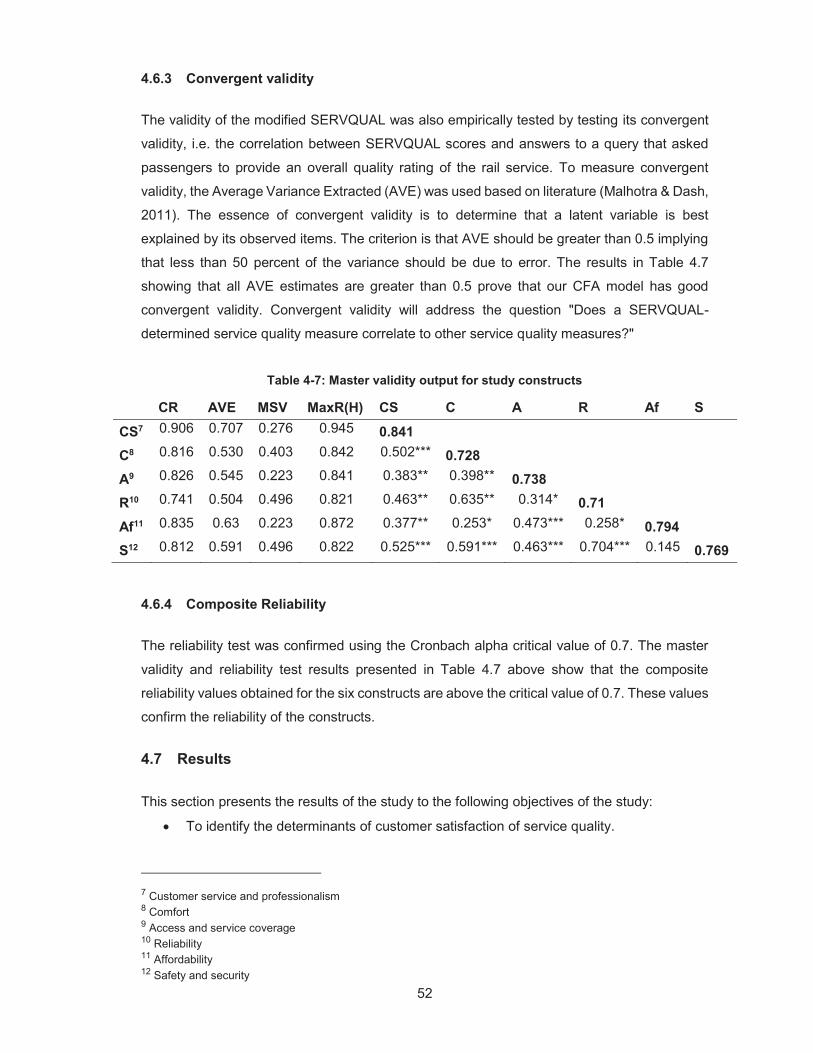
52
4.6.3 Convergent validity
The validity of the modified SERVQUAL was also empirically tested by testing its convergent
validity, i.e. the correlation between SERVQUAL scores and answers to a query that asked
passengers to provide an overall quality rating of the rail service. To measure convergent
validity, the Average Variance Extracted (AVE) was used based on literature (Malhotra & Dash,
2011). The essence of convergent validity is to determine that a latent variable is best
explained by its observed items. The criterion is that AVE should be greater than 0.5 implying
that less than 50 percent of the variance should be due to error. The results in Table 4.7
showing that all AVE estimates are greater than 0.5 prove that our CFA model has good
convergent validity. Convergent validity will address the question "Does a SERVQUAL-
determined service quality measure correlate to other service quality measures?"
Table 4-7: Master validity output for study constructs
CR AVE MSV MaxR(H) CS C A R Af S CS7 0.906 0.707 0.276 0.945 0.841
C8 0.816 0.530 0.403 0.842 0.502*** 0.728
A9 0.826 0.545 0.223 0.841 0.383** 0.398** 0.738
R10 0.741 0.504 0.496 0.821 0.463** 0.635** 0.314* 0.71
Af11 0.835 0.63 0.223 0.872 0.377** 0.253* 0.473*** 0.258* 0.794
S12 0.812 0.591 0.496 0.822 0.525*** 0.591*** 0.463*** 0.704*** 0.145 0.769
4.6.4 Composite Reliability
The reliability test was confirmed using the Cronbach alpha critical value of 0.7. The master
validity and reliability test results presented in Table 4.7 above show that the composite
reliability values obtained for the six constructs are above the critical value of 0.7. These values
confirm the reliability of the constructs.
4.7 Results
This section presents the results of the study to the following objectives of the study:
To identify the determinants of customer satisfaction of service quality.
7 Customer service and professionalism 8 Comfort 9 Access and service coverage 10 Reliability 11 Affordability 12 Safety and security
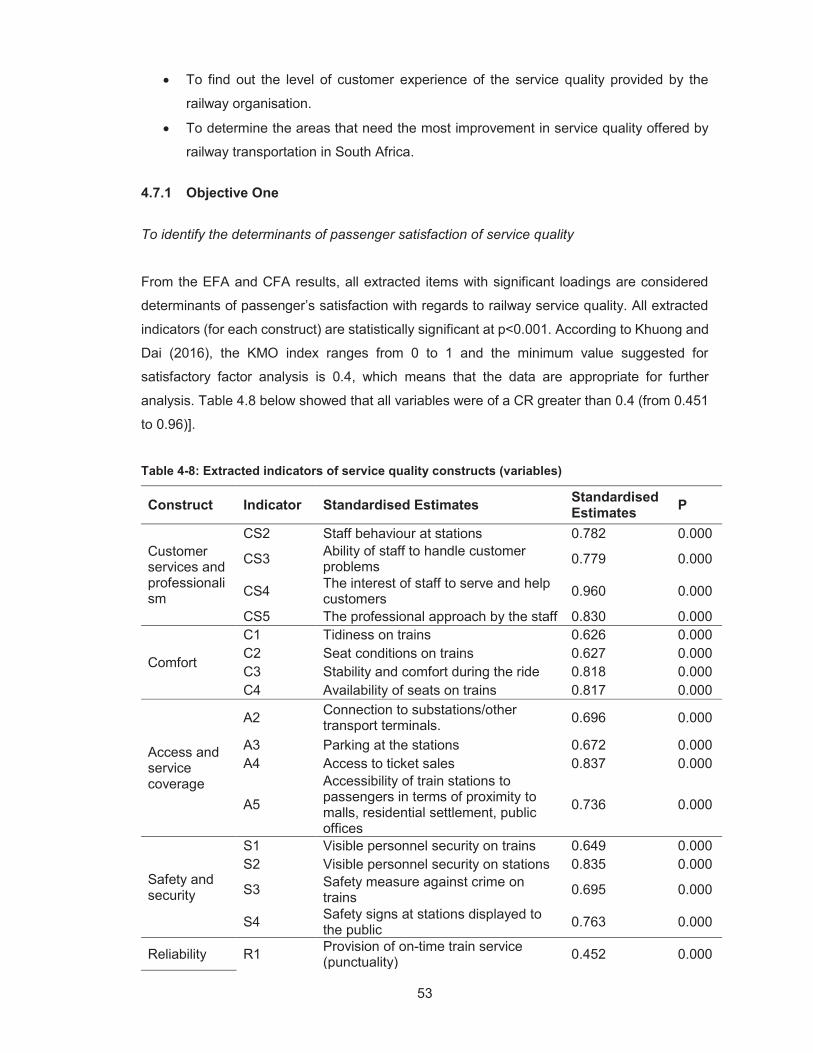
53
To find out the level of customer experience of the service quality provided by the
railway organisation.
To determine the areas that need the most improvement in service quality offered by
railway transportation in South Africa.
4.7.1 Objective One
To identify the determinants of passenger satisfaction of service quality
From the EFA and CFA results, all extracted items with significant loadings are considered
determinants of passenger’s satisfaction with regards to railway service quality. All extracted
indicators (for each construct) are statistically significant at p<0.001. According to Khuong and
Dai (2016), the KMO index ranges from 0 to 1 and the minimum value suggested for
satisfactory factor analysis is 0.4, which means that the data are appropriate for further
analysis. Table 4.8 below showed that all variables were of a CR greater than 0.4 (from 0.451
to 0.96)].
Table 4-8: Extracted indicators of service quality constructs (variables)
Construct Indicator Standardised Estimates Standardised Estimates P
Customer services and professionalism
CS2 Staff behaviour at stations 0.782 0.000
CS3 Ability of staff to handle customer problems 0.779 0.000
CS4 The interest of staff to serve and help customers 0.960 0.000
CS5 The professional approach by the staff 0.830 0.000
Comfort
C1 Tidiness on trains 0.626 0.000 C2 Seat conditions on trains 0.627 0.000 C3 Stability and comfort during the ride 0.818 0.000 C4 Availability of seats on trains 0.817 0.000
Access and service coverage
A2 Connection to substations/other transport terminals. 0.696 0.000
A3 Parking at the stations 0.672 0.000 A4 Access to ticket sales 0.837 0.000
A5
Accessibility of train stations to passengers in terms of proximity to malls, residential settlement, public offices
0.736 0.000
Safety and security
S1 Visible personnel security on trains 0.649 0.000 S2 Visible personnel security on stations 0.835 0.000
S3 Safety measure against crime on trains 0.695 0.000
S4 Safety signs at stations displayed to the public 0.763 0.000
Reliability R1 Provision of on-time train service (punctuality) 0.452 0.000
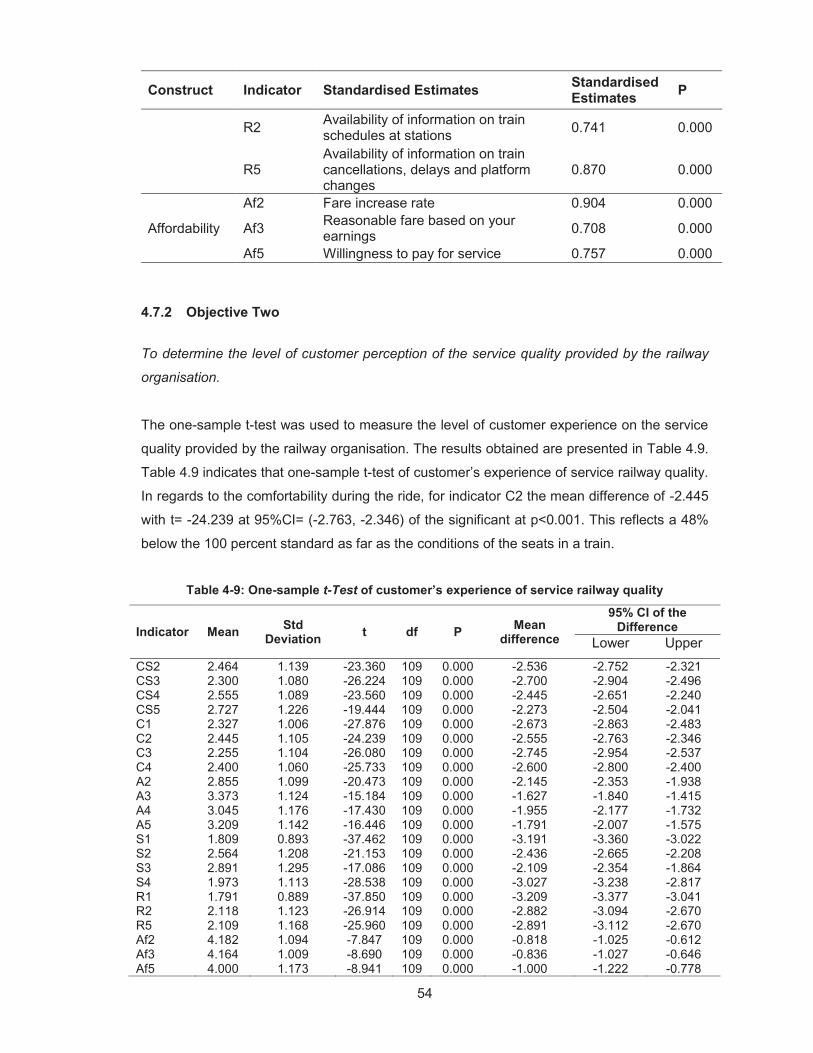
54
Construct Indicator Standardised Estimates Standardised Estimates P
R2 Availability of information on train schedules at stations 0.741 0.000
R5 Availability of information on train cancellations, delays and platform changes
0.870 0.000
Affordability
Af2 Fare increase rate 0.904 0.000
Af3 Reasonable fare based on your earnings 0.708 0.000
Af5 Willingness to pay for service 0.757 0.000
4.7.2 Objective Two
To determine the level of customer perception of the service quality provided by the railway
organisation.
The one-sample t-test was used to measure the level of customer experience on the service
quality provided by the railway organisation. The results obtained are presented in Table 4.9.
Table 4.9 indicates that one-sample t-test of customer’s experience of service railway quality.
In regards to the comfortability during the ride, for indicator C2 the mean difference of -2.445
with t= -24.239 at 95%CI= (-2.763, -2.346) of the significant at p<0.001. This reflects a 48%
below the 100 percent standard as far as the conditions of the seats in a train.
Table 4-9: One-sample t-Test of customer’s experience of service railway quality
Indicator Mean Std Deviation t df P Mean
difference
95% CI of the Difference
Lower Upper CS2 2.464 1.139 -23.360 109 0.000 -2.536 -2.752 -2.321 CS3 2.300 1.080 -26.224 109 0.000 -2.700 -2.904 -2.496 CS4 2.555 1.089 -23.560 109 0.000 -2.445 -2.651 -2.240 CS5 2.727 1.226 -19.444 109 0.000 -2.273 -2.504 -2.041 C1 2.327 1.006 -27.876 109 0.000 -2.673 -2.863 -2.483 C2 2.445 1.105 -24.239 109 0.000 -2.555 -2.763 -2.346 C3 2.255 1.104 -26.080 109 0.000 -2.745 -2.954 -2.537 C4 2.400 1.060 -25.733 109 0.000 -2.600 -2.800 -2.400 A2 2.855 1.099 -20.473 109 0.000 -2.145 -2.353 -1.938 A3 3.373 1.124 -15.184 109 0.000 -1.627 -1.840 -1.415 A4 3.045 1.176 -17.430 109 0.000 -1.955 -2.177 -1.732 A5 3.209 1.142 -16.446 109 0.000 -1.791 -2.007 -1.575 S1 1.809 0.893 -37.462 109 0.000 -3.191 -3.360 -3.022 S2 2.564 1.208 -21.153 109 0.000 -2.436 -2.665 -2.208 S3 2.891 1.295 -17.086 109 0.000 -2.109 -2.354 -1.864 S4 1.973 1.113 -28.538 109 0.000 -3.027 -3.238 -2.817 R1 1.791 0.889 -37.850 109 0.000 -3.209 -3.377 -3.041 R2 2.118 1.123 -26.914 109 0.000 -2.882 -3.094 -2.670 R5 2.109 1.168 -25.960 109 0.000 -2.891 -3.112 -2.670 Af2 4.182 1.094 -7.847 109 0.000 -0.818 -1.025 -0.612 Af3 4.164 1.009 -8.690 109 0.000 -0.836 -1.027 -0.646 Af5 4.000 1.173 -8.941 109 0.000 -1.000 -1.222 -0.778
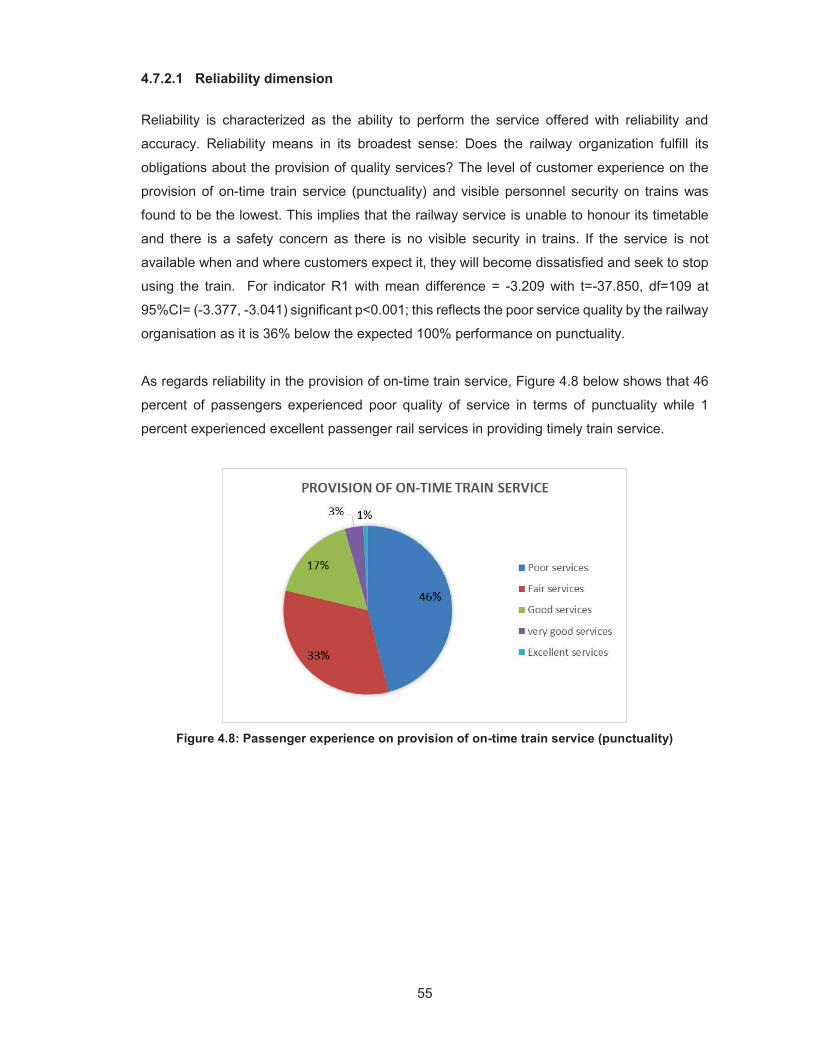
55
4.7.2.1 Reliability dimension
Reliability is characterized as the ability to perform the service offered with reliability and
accuracy. Reliability means in its broadest sense: Does the railway organization fulfill its
obligations about the provision of quality services? The level of customer experience on the
provision of on-time train service (punctuality) and visible personnel security on trains was
found to be the lowest. This implies that the railway service is unable to honour its timetable
and there is a safety concern as there is no visible security in trains. If the service is not
available when and where customers expect it, they will become dissatisfied and seek to stop
using the train. For indicator R1 with mean difference = -3.209 with t=-37.850, df=109 at
95%CI= (-3.377, -3.041) significant p<0.001; this reflects the poor service quality by the railway
organisation as it is 36% below the expected 100% performance on punctuality.
As regards reliability in the provision of on-time train service, Figure 4.8 below shows that 46
percent of passengers experienced poor quality of service in terms of punctuality while 1
percent experienced excellent passenger rail services in providing timely train service.
Figure 4.8: Passenger experience on provision of on-time train service (punctuality)
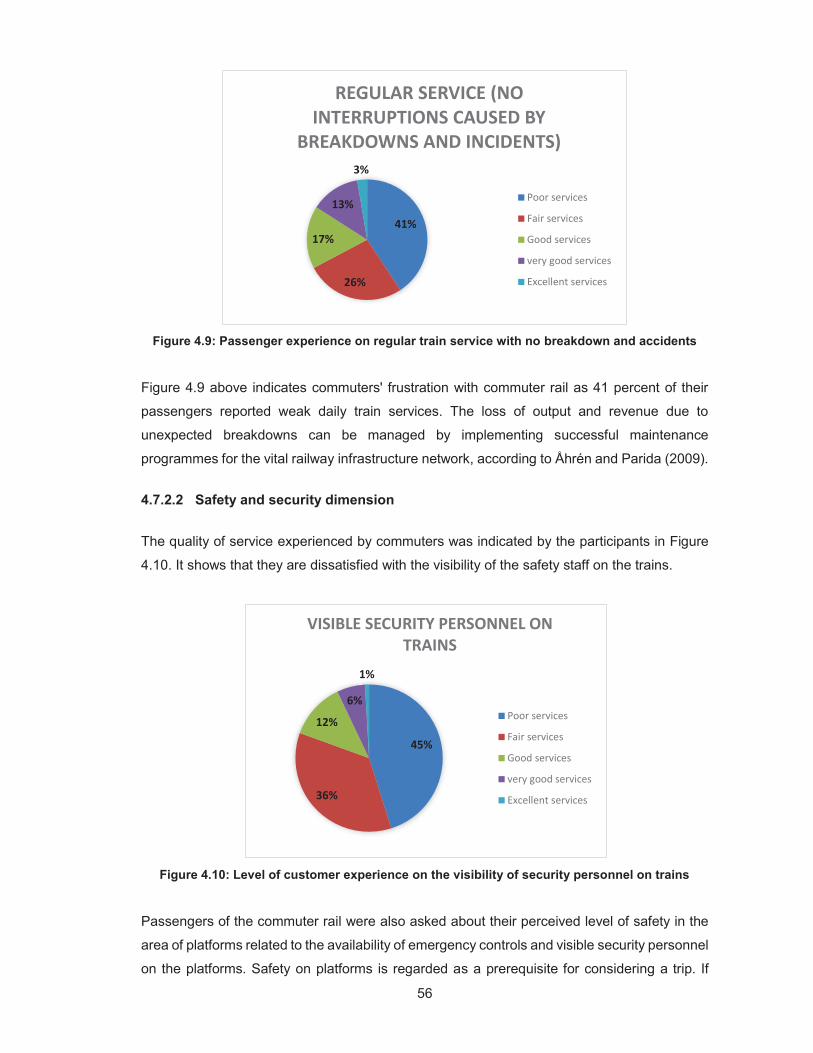
56
Figure 4.9: Passenger experience on regular train service with no breakdown and accidents
Figure 4.9 above indicates commuters' frustration with commuter rail as 41 percent of their
passengers reported weak daily train services. The loss of output and revenue due to
unexpected breakdowns can be managed by implementing successful maintenance
programmes for the vital railway infrastructure network, according to Åhrén and Parida (2009).
4.7.2.2 Safety and security dimension
The quality of service experienced by commuters was indicated by the participants in Figure
4.10. It shows that they are dissatisfied with the visibility of the safety staff on the trains.
Figure 4.10: Level of customer experience on the visibility of security personnel on trains
Passengers of the commuter rail were also asked about their perceived level of safety in the
area of platforms related to the availability of emergency controls and visible security personnel
on the platforms. Safety on platforms is regarded as a prerequisite for considering a trip. If
41%
26%
17%
13%
3%
REGULAR SERVICE (NO INTERRUPTIONS CAUSED BY
BREAKDOWNS AND INCIDENTS)
Poor services
Fair services
Good services
very good services
Excellent services
45%
36%
12%
6%
1%
VISIBLE SECURITY PERSONNEL ON TRAINS
Poor services
Fair services
Good services
very good services
Excellent services
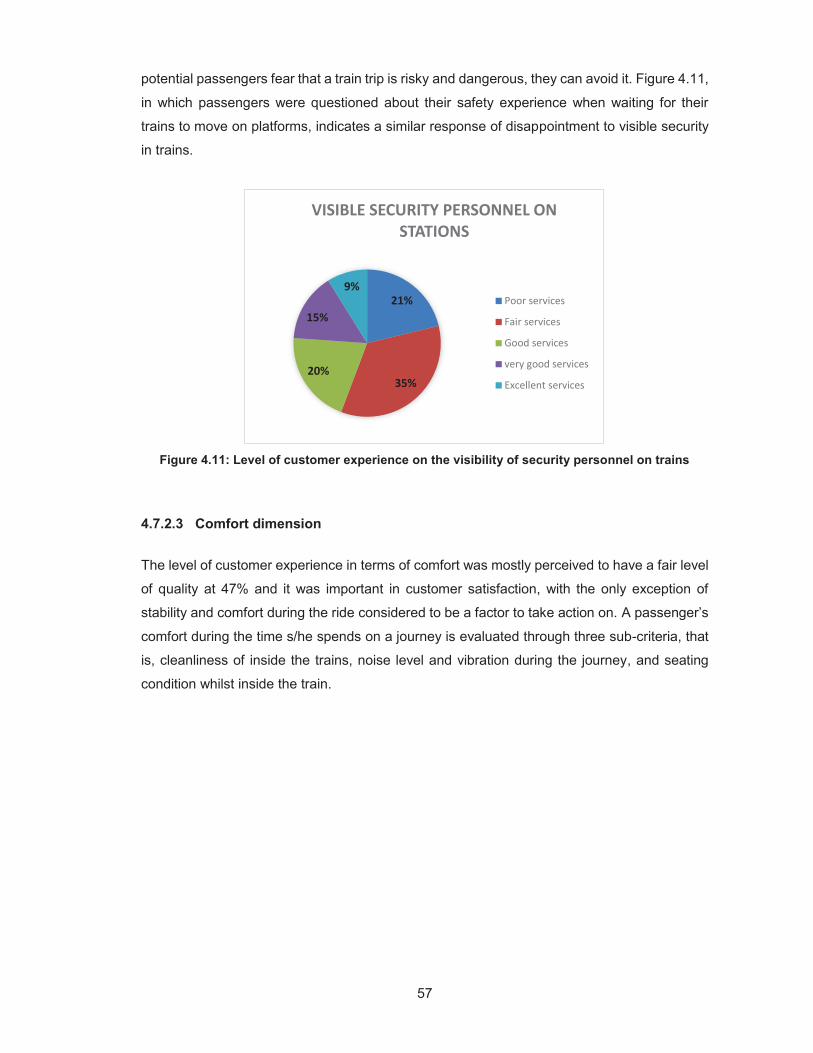
57
potential passengers fear that a train trip is risky and dangerous, they can avoid it. Figure 4.11,
in which passengers were questioned about their safety experience when waiting for their
trains to move on platforms, indicates a similar response of disappointment to visible security
in trains.
Figure 4.11: Level of customer experience on the visibility of security personnel on trains
4.7.2.3 Comfort dimension
The level of customer experience in terms of comfort was mostly perceived to have a fair level
of quality at 47% and it was important in customer satisfaction, with the only exception of
stability and comfort during the ride considered to be a factor to take action on. A passenger’s
comfort during the time s/he spends on a journey is evaluated through three sub-criteria, that
is, cleanliness of inside the trains, noise level and vibration during the journey, and seating
condition whilst inside the train.
21%
35%20%
15%
9%
VISIBLE SECURITY PERSONNEL ON STATIONS
Poor services
Fair services
Good services
very good services
Excellent services
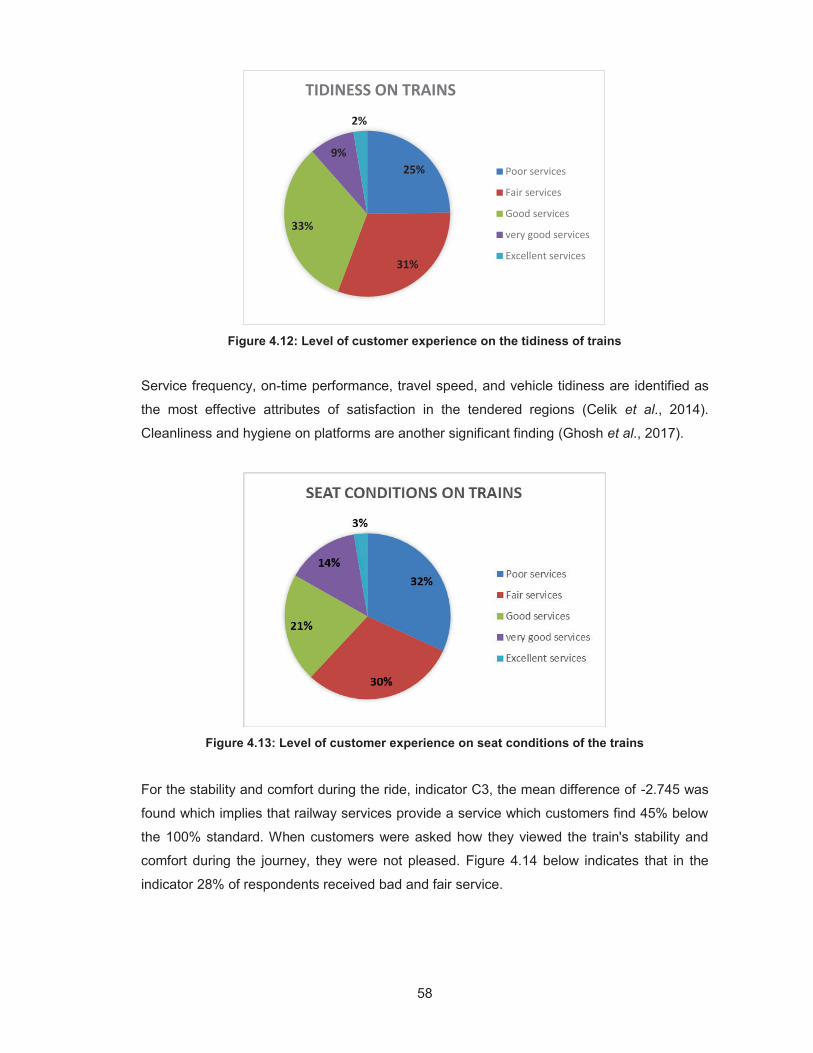
58
Figure 4.12: Level of customer experience on the tidiness of trains
Service frequency, on-time performance, travel speed, and vehicle tidiness are identified as
the most effective attributes of satisfaction in the tendered regions (Celik et al., 2014).
Cleanliness and hygiene on platforms are another significant finding (Ghosh et al., 2017).
Figure 4.13: Level of customer experience on seat conditions of the trains
For the stability and comfort during the ride, indicator C3, the mean difference of -2.745 was
found which implies that railway services provide a service which customers find 45% below
the 100% standard. When customers were asked how they viewed the train's stability and
comfort during the journey, they were not pleased. Figure 4.14 below indicates that in the
indicator 28% of respondents received bad and fair service.
25%
31%
33%
9%
2%
TIDINESS ON TRAINS
Poor services
Fair services
Good services
very good services
Excellent services
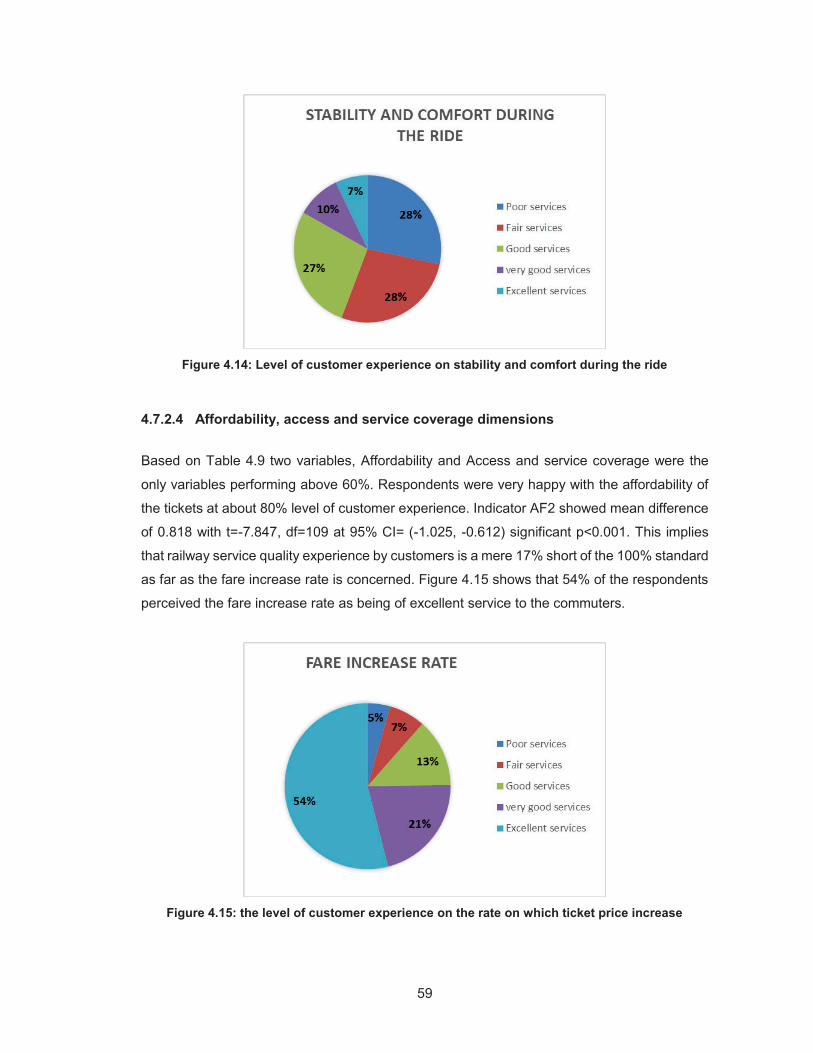
59
Figure 4.14: Level of customer experience on stability and comfort during the ride
4.7.2.4 Affordability, access and service coverage dimensions
Based on Table 4.9 two variables, Affordability and Access and service coverage were the
only variables performing above 60%. Respondents were very happy with the affordability of
the tickets at about 80% level of customer experience. Indicator AF2 showed mean difference
of 0.818 with t=-7.847, df=109 at 95% CI= (-1.025, -0.612) significant p<0.001. This implies
that railway service quality experience by customers is a mere 17% short of the 100% standard
as far as the fare increase rate is concerned. Figure 4.15 shows that 54% of the respondents
perceived the fare increase rate as being of excellent service to the commuters.
Figure 4.15: the level of customer experience on the rate on which ticket price increase
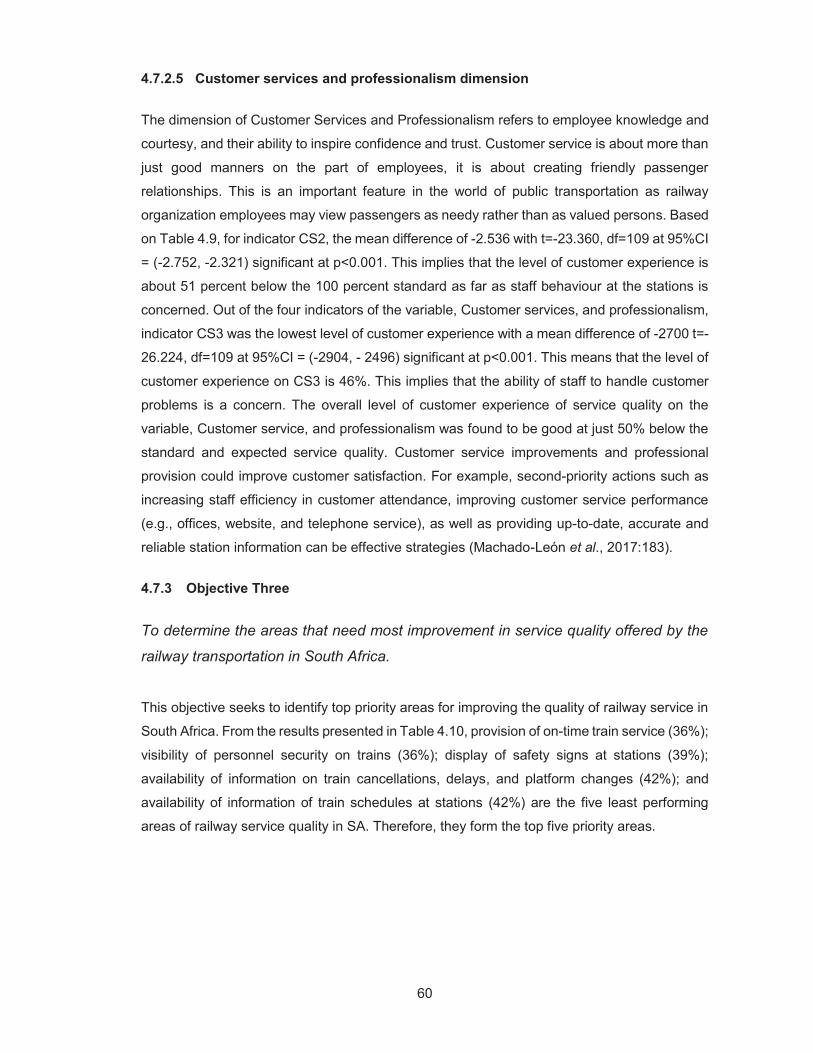
60
4.7.2.5 Customer services and professionalism dimension
The dimension of Customer Services and Professionalism refers to employee knowledge and
courtesy, and their ability to inspire confidence and trust. Customer service is about more than
just good manners on the part of employees, it is about creating friendly passenger
relationships. This is an important feature in the world of public transportation as railway
organization employees may view passengers as needy rather than as valued persons. Based
on Table 4.9, for indicator CS2, the mean difference of -2.536 with t=-23.360, df=109 at 95%CI
= (-2.752, -2.321) significant at p<0.001. This implies that the level of customer experience is
about 51 percent below the 100 percent standard as far as staff behaviour at the stations is
concerned. Out of the four indicators of the variable, Customer services, and professionalism,
indicator CS3 was the lowest level of customer experience with a mean difference of -2700 t=-
26.224, df=109 at 95%CI = (-2904, - 2496) significant at p<0.001. This means that the level of
customer experience on CS3 is 46%. This implies that the ability of staff to handle customer
problems is a concern. The overall level of customer experience of service quality on the
variable, Customer service, and professionalism was found to be good at just 50% below the
standard and expected service quality. Customer service improvements and professional
provision could improve customer satisfaction. For example, second-priority actions such as
increasing staff efficiency in customer attendance, improving customer service performance
(e.g., offices, website, and telephone service), as well as providing up-to-date, accurate and
reliable station information can be effective strategies (Machado-León et al., 2017:183).
4.7.3 Objective Three
To determine the areas that need most improvement in service quality offered by the
railway transportation in South Africa.
This objective seeks to identify top priority areas for improving the quality of railway service in
South Africa. From the results presented in Table 4.10, provision of on-time train service (36%);
visibility of personnel security on trains (36%); display of safety signs at stations (39%);
availability of information on train cancellations, delays, and platform changes (42%); and
availability of information of train schedules at stations (42%) are the five least performing
areas of railway service quality in SA. Therefore, they form the top five priority areas.
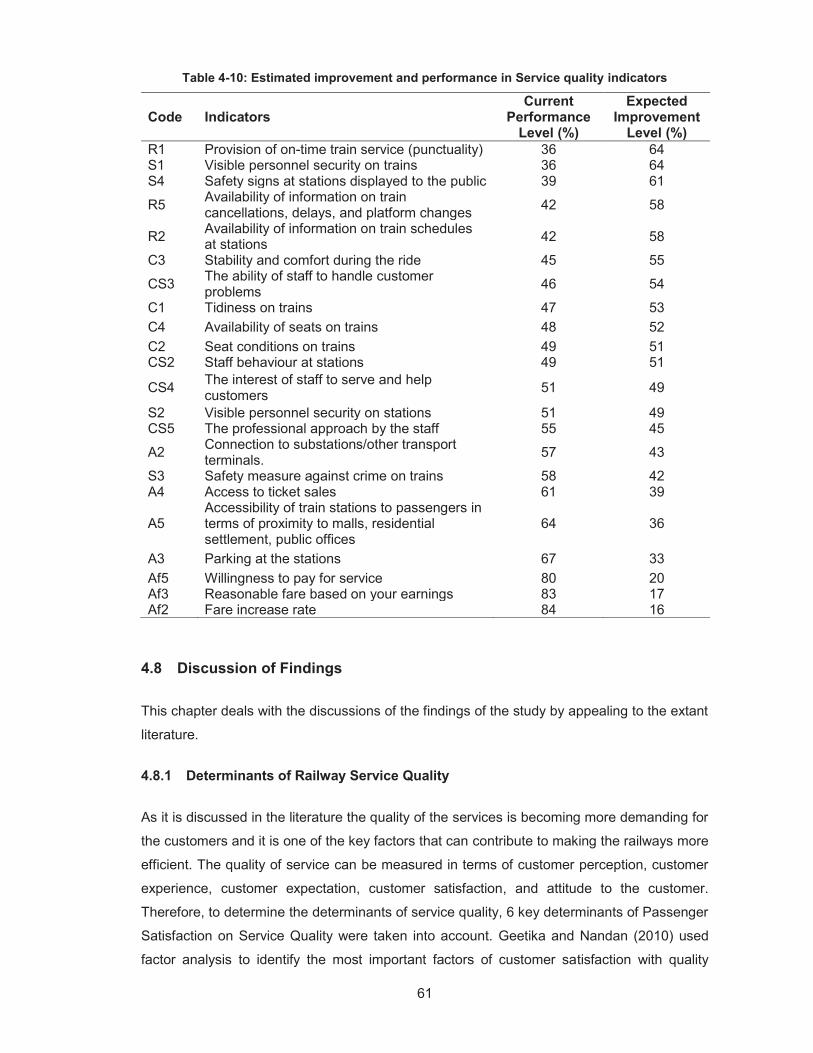
61
Table 4-10: Estimated improvement and performance in Service quality indicators
Code Indicators Current
Performance Level (%)
Expected Improvement
Level (%) R1 Provision of on-time train service (punctuality) 36 64 S1 Visible personnel security on trains 36 64 S4 Safety signs at stations displayed to the public 39 61
R5 Availability of information on train cancellations, delays, and platform changes 42 58
R2 Availability of information on train schedules at stations 42 58
C3 Stability and comfort during the ride 45 55
CS3 The ability of staff to handle customer problems 46 54
C1 Tidiness on trains 47 53 C4 Availability of seats on trains 48 52 C2 Seat conditions on trains 49 51 CS2 Staff behaviour at stations 49 51
CS4 The interest of staff to serve and help customers 51 49
S2 Visible personnel security on stations 51 49 CS5 The professional approach by the staff 55 45
A2 Connection to substations/other transport terminals. 57 43
S3 Safety measure against crime on trains 58 42 A4 Access to ticket sales 61 39
A5 Accessibility of train stations to passengers in terms of proximity to malls, residential settlement, public offices
64 36
A3 Parking at the stations 67 33 Af5 Willingness to pay for service 80 20 Af3 Reasonable fare based on your earnings 83 17 Af2 Fare increase rate 84 16
4.8 Discussion of Findings
This chapter deals with the discussions of the findings of the study by appealing to the extant
literature.
4.8.1 Determinants of Railway Service Quality
As it is discussed in the literature the quality of the services is becoming more demanding for
the customers and it is one of the key factors that can contribute to making the railways more
efficient. The quality of service can be measured in terms of customer perception, customer
experience, customer expectation, customer satisfaction, and attitude to the customer.
Therefore, to determine the determinants of service quality, 6 key determinants of Passenger
Satisfaction on Service Quality were taken into account. Geetika and Nandan (2010) used
factor analysis to identify the most important factors of customer satisfaction with quality
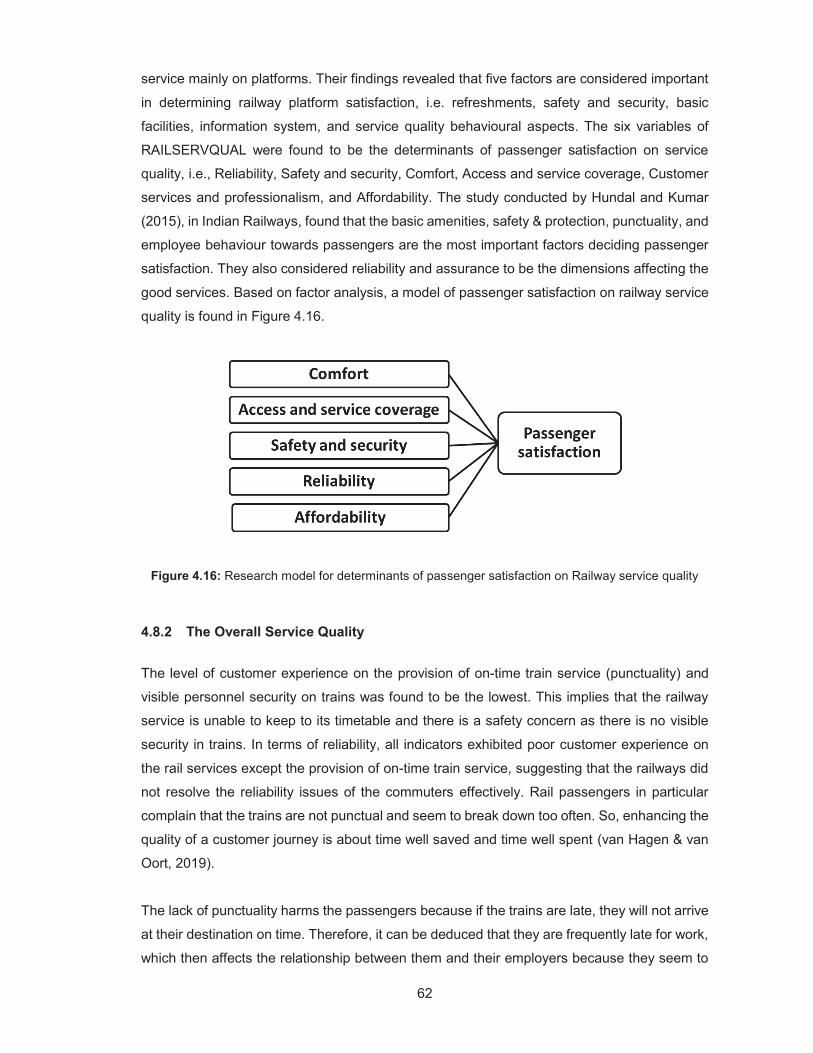
62
service mainly on platforms. Their findings revealed that five factors are considered important
in determining railway platform satisfaction, i.e. refreshments, safety and security, basic
facilities, information system, and service quality behavioural aspects. The six variables of
RAILSERVQUAL were found to be the determinants of passenger satisfaction on service
quality, i.e., Reliability, Safety and security, Comfort, Access and service coverage, Customer
services and professionalism, and Affordability. The study conducted by Hundal and Kumar
(2015), in Indian Railways, found that the basic amenities, safety & protection, punctuality, and
employee behaviour towards passengers are the most important factors deciding passenger
satisfaction. They also considered reliability and assurance to be the dimensions affecting the
good services. Based on factor analysis, a model of passenger satisfaction on railway service
quality is found in Figure 4.16.
Figure 4.16: Research model for determinants of passenger satisfaction on Railway service quality
4.8.2 The Overall Service Quality
The level of customer experience on the provision of on-time train service (punctuality) and
visible personnel security on trains was found to be the lowest. This implies that the railway
service is unable to keep to its timetable and there is a safety concern as there is no visible
security in trains. In terms of reliability, all indicators exhibited poor customer experience on
the rail services except the provision of on-time train service, suggesting that the railways did
not resolve the reliability issues of the commuters effectively. Rail passengers in particular
complain that the trains are not punctual and seem to break down too often. So, enhancing the
quality of a customer journey is about time well saved and time well spent (van Hagen & van
Oort, 2019).
The lack of punctuality harms the passengers because if the trains are late, they will not arrive
at their destination on time. Therefore, it can be deduced that they are frequently late for work,
which then affects the relationship between them and their employers because they seem to
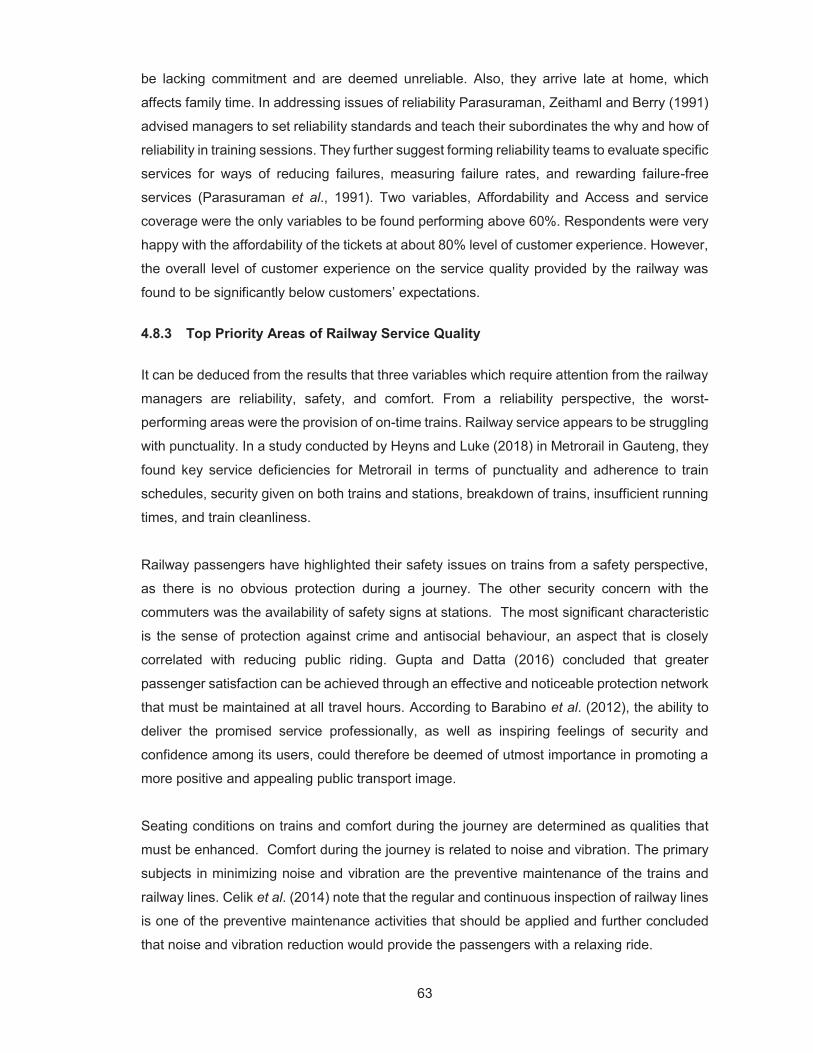
63
be lacking commitment and are deemed unreliable. Also, they arrive late at home, which
affects family time. In addressing issues of reliability Parasuraman, Zeithaml and Berry (1991)
advised managers to set reliability standards and teach their subordinates the why and how of
reliability in training sessions. They further suggest forming reliability teams to evaluate specific
services for ways of reducing failures, measuring failure rates, and rewarding failure-free
services (Parasuraman et al., 1991). Two variables, Affordability and Access and service
coverage were the only variables to be found performing above 60%. Respondents were very
happy with the affordability of the tickets at about 80% level of customer experience. However,
the overall level of customer experience on the service quality provided by the railway was
found to be significantly below customers’ expectations.
4.8.3 Top Priority Areas of Railway Service Quality
It can be deduced from the results that three variables which require attention from the railway
managers are reliability, safety, and comfort. From a reliability perspective, the worst-
performing areas were the provision of on-time trains. Railway service appears to be struggling
with punctuality. In a study conducted by Heyns and Luke (2018) in Metrorail in Gauteng, they
found key service deficiencies for Metrorail in terms of punctuality and adherence to train
schedules, security given on both trains and stations, breakdown of trains, insufficient running
times, and train cleanliness.
Railway passengers have highlighted their safety issues on trains from a safety perspective,
as there is no obvious protection during a journey. The other security concern with the
commuters was the availability of safety signs at stations. The most significant characteristic
is the sense of protection against crime and antisocial behaviour, an aspect that is closely
correlated with reducing public riding. Gupta and Datta (2016) concluded that greater
passenger satisfaction can be achieved through an effective and noticeable protection network
that must be maintained at all travel hours. According to Barabino et al. (2012), the ability to
deliver the promised service professionally, as well as inspiring feelings of security and
confidence among its users, could therefore be deemed of utmost importance in promoting a
more positive and appealing public transport image.
Seating conditions on trains and comfort during the journey are determined as qualities that
must be enhanced. Comfort during the journey is related to noise and vibration. The primary
subjects in minimizing noise and vibration are the preventive maintenance of the trains and
railway lines. Celik et al. (2014) note that the regular and continuous inspection of railway lines
is one of the preventive maintenance activities that should be applied and further concluded
that noise and vibration reduction would provide the passengers with a relaxing ride.
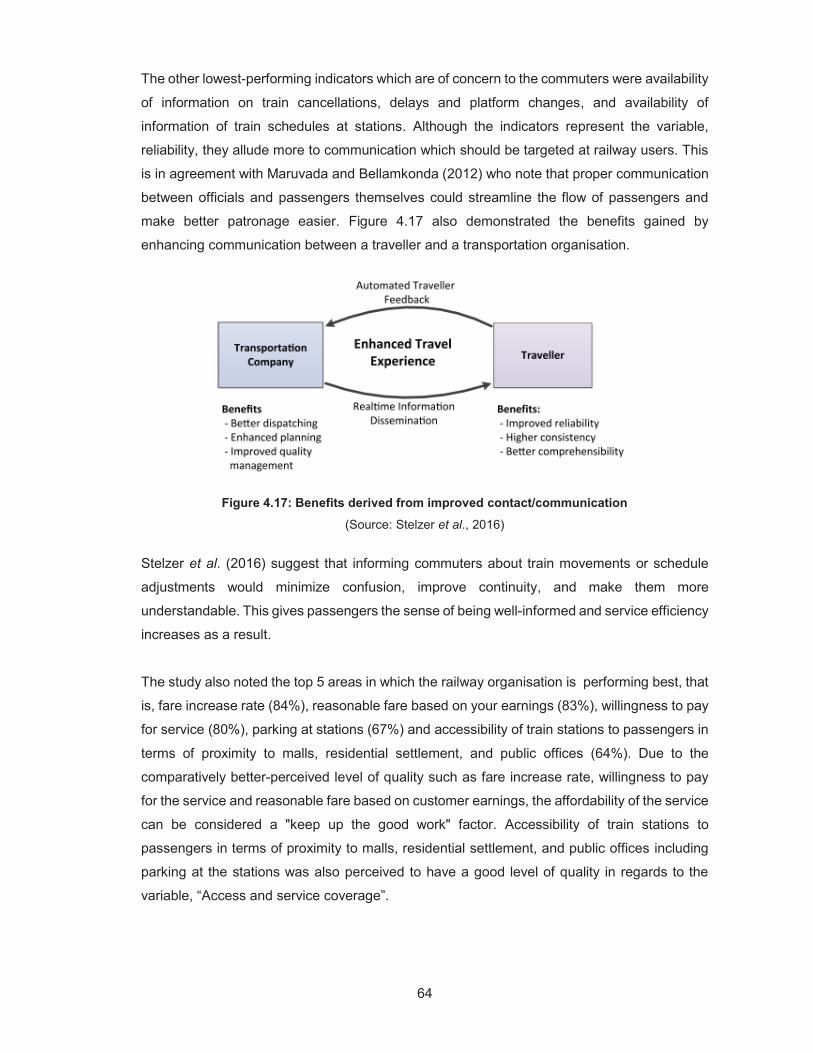
64
The other lowest-performing indicators which are of concern to the commuters were availability
of information on train cancellations, delays and platform changes, and availability of
information of train schedules at stations. Although the indicators represent the variable,
reliability, they allude more to communication which should be targeted at railway users. This
is in agreement with Maruvada and Bellamkonda (2012) who note that proper communication
between officials and passengers themselves could streamline the flow of passengers and
make better patronage easier. Figure 4.17 also demonstrated the benefits gained by
enhancing communication between a traveller and a transportation organisation.
Figure 4.17: Benefits derived from improved contact/communication
(Source: Stelzer et al., 2016)
Stelzer et al. (2016) suggest that informing commuters about train movements or schedule
adjustments would minimize confusion, improve continuity, and make them more
understandable. This gives passengers the sense of being well-informed and service efficiency
increases as a result.
The study also noted the top 5 areas in which the railway organisation is performing best, that
is, fare increase rate (84%), reasonable fare based on your earnings (83%), willingness to pay
for service (80%), parking at stations (67%) and accessibility of train stations to passengers in
terms of proximity to malls, residential settlement, and public offices (64%). Due to the
comparatively better-perceived level of quality such as fare increase rate, willingness to pay
for the service and reasonable fare based on customer earnings, the affordability of the service
can be considered a "keep up the good work" factor. Accessibility of train stations to
passengers in terms of proximity to malls, residential settlement, and public offices including
parking at the stations was also perceived to have a good level of quality in regards to the
variable, “Access and service coverage”.
65
4.9 Conclusion
Chapter presented the main results and discussion of the findings based on the analyses of
data collected via the questionnaire and the theoretical constructs found in the
RAILSERVQUAL framework. It also highlighted the methods that were used to collect the
survey data, namely, the questionnaire and direct observation. Factor analysis resulted in
grouping of the items into six distinct dimensions; Customer service and professionalism,
Comfort, Access and service coverage, Reliability, Affordability, and Safety. The reliability and
validity of the constructs measure very highly and hence the findings are reliable and the
instrument measured accurately. Based on these key findings, the next chapter will provide an
overall conclusion and useful recommendations for the railway organisation. Moreover, a
direction for future research will be pointed out.
66
CHAPTER 5: CONCLUSION AND RECOMMENDATIONS
5.1 Introduction
In the previous chapter data analysis, interpretation, and findings were discussed. This study
aimed to measure the quality of service delivered by the railway industry, using the modified
SERVQUAL approach (RAILSERVQUAL), in South Africa for passenger rail to monitor and
improve its services and increase competitiveness among the transport industry. Hence, the
primary objective of this study was to determine the level of customer experience on the service
quality provided by the railway organisation. This chapter concludes and suggests certain
recommendations based on the research findings. This chapter starts by illustrating the scale
of the previous chapter by aligning the important aspect of each chapter. Following this, the
chapter then expands by describing what was encountered as limitations and addressing the
research questions. The later section concludes and puts forward recommendations as well
as possible further areas of study.
5.2 Key findings
The key findings were determined through the achievement of the research questions
highlighted below:
5.2.1 Addressing research questions
This section addressed the findings of the main questions of the research to clarify the
study.
The research questions are revisited as the following:
What are the determinants of passenger satisfaction of service quality?
What is the level of customer experience of the service quality provided by the
commuter railway organisation?
What are the areas that need the most improvement in service quality offered by the
commuter railway transportation system in South Africa?
The following sections conclude the study findings in line with the research questions.
5.2.2 The determinants of passenger satisfaction of service quality
All extracted indicators (for each construct) were statistically significant at p<0.001. According
to Khuong and Dai (2016), the KMO index ranges from 0 to 1 and the minimum value
suggested for satisfactory factor analysis is 0.4, which means that the data are appropriate for
67
further analysis. The six variables of RAILSERVQUAL were found to be the determinants of
passenger satisfaction on service quality, i.e., Reliability, Safety and security, Comfort, Access
and service coverage, Customer services and professionalism, and Affordability.
5.2.2.1 The level of customer experience on the service quality
The level of customer experience on the provision of on-time train service (punctuality) and
visible personnel security on trains was found to be the lowest. This implies that the railway
service is unable to keep to its timetable and there is a safety concern as there is no visible
security in trains. Two variables, Affordability and Access and service coverage were the only
variables to be found performing above 60%. Respondents were very happy with the
affordability of the tickets at about 80% level of customer experience. However, the overall
level of customer experience on the service quality provided by the railway was found to be
significantly below customers’ expectations.
5.2.2.2 The areas in service quality improvement
For the railway organisation to improve the overall customer expectation they should focus on
the worst-performing areas, that is, provision of on-time train service; visibility of personnel
security on trains; display of safety signs at stations; availability of information on train
cancellations, delays, and platform changes; and availability of information of train schedules
at stations. It was noted that the railway organisation had to put strategies in place to address
three variables which were found to be below customer expectations, namely, reliability, safety,
and comfort. The study also highlighted areas in which the railway organisation is the best
performing. These areas are aligned with the ‘keep up the good work’ factor; affordability and
Access and service coverage.
5.2.3 Overall key findings
Overall, the empirical results from this study indicate that passengers perceived that the rail
transport network, the Western Cape's main public transport sector, is not providing high-
quality services to meet their expectations. Through systematically evaluating and defining the
determinants of service quality through using a customer survey and assessing the degree of
customer experiences of using railway facilities, the empirical investigation study was able to
achieve its research goals. Priyadharshini and Selladurai (2016), advised that rail and other
organizations should continue to receive at least three to six months of regular feedback from
passengers on their trains. In that case, the railway will have to put strategies in place to
improve the quality of the service. The network services and security have to be strengthened
in both trains and railway stations. Once the basic facilities are in order, customers will be
satisfied (van Hagen & van Oort, 2019).
68
5.3 Study limitations
Since the dataset generated and used for this study is self-reported, there are some inherent
limitations such as recall bias, among others. This study's limitations are largely related to the
short period in which the research was conducted. Findings may differ if the study is conducted
over a longer duration.
A further limitation lies in the respondents' composition. Non-users are not included and their
view of rail transport is also not known. The impression of non-users is very important, as one
of the goals of enhancing the quality of service is to attract new passengers.
5.4 Recommendation for practice and future study
From a strategic viewpoint, these results provide specific guidance for future initiatives aimed
at improving railway organisations’ service rates. It is evident from the study that to better
match their service offerings with customer preferences, Metrorail needs to concentrate its
quality enhancement efforts on the basic questions of reliability and health. The following
recommendations might assist the railway organisation when managing the service quality:
The management of public transport service providers should emphasize marketing and
operational strategy that can improve passengers’ perceived value, perceived usefulness, and
the image of the public transport service (Sumaedi et al., 2016).
To ensure continuous improvement, electronic survey pads hosting these quality indicators
should be installed around outlets accessible to customers to collect similar datasets for
analysis. This will enable railway companies to constantly determine the top service quality
priorities each month or quarter.
The above recommendations can lead to research projects which can be informative for
railway management but also to add to the body of literature in terms of among others,
operational and marketing concerning railway management practices to improve customer
satisfaction.
5.5 Conclusion
The researcher has summarized all of the preceding chapters in this chapter (chapter six),
addressed the main findings, and provided some recommendations. The results of this
research offer some operational consequences in assessing the satisfaction of passengers by
the managers of the public transport service providers. The results indicate that suppliers of
69
public transport services should control the subjective experience of their passengers
concerning the reliability, comfort, and protection of the train services. Therefore, commuter
rail service provider management should emphasize an operational strategy that may improve
passenger satisfaction in terms of reliability, comfort, and safety. Commuter rail managers may
also categorize their passengers in each portion of the network, based on their satisfaction.
This is because passenger needs in the North section cannot be the same as passengers in
the Southern section. Therefore, it is appropriate for the commuter rail to recognize these
differences instead of focusing on a certain aspect when that area's passengers do not find it
relevant. The study's shortcomings were illustrated, and suggestions were made for future
studies.
70
REFERENCES
Adriaan Kruger (2019) Why Ramaphosa got stuck on a train, Money Web. Available at: https://www.moneyweb.co.za/news/south-africa/why-ramaphosa-got-stuck-on-a-train/ (Accessed: 6 February 2020).
Alzaydi, Z. M. et al. (2018) ‘A Review of Service Quality and Service Delivery: Towards A Customer Co-Production and Customer-Integration Approach’, Business Process Management Journal.
Awasthi, A. et al. (2011) ‘A hybrid approach based on SERVQUAL and fuzzy TOPSIS for evaluating transportation service quality’, Computers and Industrial Engineering. Elsevier Ltd, 61(3), pp. 637–646. doi: 10.1016/j.cie.2011.04.019.
Aydin, N., Celik, E. and Gumus, A. T. (2015) ‘A hierarchical customer satisfaction framework for evaluating rail transit systems of Istanbul’, Transportation Research Part A: Policy and Practice. Elsevier Ltd, 77, pp. 61–81. doi: 10.1016/j.tra.2015.03.029.
Banu, I. P. (2018) ‘Determinants of Passenger Satisfaction on Service Quality in Southern Railways with Reference to Salem Division’, International Journal of EngineeringTechnology Science and Research, 5(1), p. 389.
Barabino, B., Deiana, E. and Tilocca, P. (2012) ‘Measuring service quality in urban bus transport: A modified SERVQUAL approach’, International Journal of Quality and Service Sciences, 4(3), pp. 238–252. doi: 10.1108/17566691211269567.
Beck, A. et al. (2013) ‘Railway Efficiency – An Overview and a Look at Opportunities for Improvement’, The International Transport Forum’s Discussion Paper Series. International Transport Forum, Paris. Available at: http://dx.doi.org/10.1787/5k46bj46ptkb-en%0AThis Version is available at: http://hdl.handle.net/10419/97105%0AStandard-Nutzungsbedingungen:%0ADie Dokumente auf EconStor dürfen zu eigenen wissenschaftlichen Zwecken und zum Privatgebrauch gespeichert und ko.
Bhawna and Gobind (2015) ‘Research Methodology and Communication’, IOSR Journal of Research & Method in Education, 5(3), pp. 48–51. doi: 10.9790/7388-05344851.
Caruana, A., Money, A. H. and Berthon, P. R. (2001) ‘Service quality and satisfaction – the moderating role of value’, Measuring Business Excellence, 5(1), p. 25. doi: 10.1108/mbe.2001.26705aaf.015.
Cavana, R. Y., Corbett, L. M. and lo, Y. L. G. (2007) ‘Developing zones of tolerance for managing passenger rail service quality’, International Journal of Quality & Reliability Management, 24(1), pp. 7–31. doi: 10.1108/02656710710720303.
Celik, E., Aydin, N. and Gumus, A. T. (2014) ‘A multiattribute customer satisfaction evaluation approach for rail transit network: A real case study for Istanbul, Turkey’, Transport Policy. Elsevier, 36, pp. 283–293. doi: 10.1016/j.tranpol.2014.09.005.
De-Winter, J. C. F., Dodou, D. and Wieringa, P. A. (2009) ‘Exploratory Factor Analysis With Small Sample Sizes’, Multivariate Behavioral Research, 44, pp. 147–181. doi: 10.1080/00273170902794206.
Eboli, L., Forciniti, C. and Mazzulla, G. (2018) ‘Spatial variation of the perceived transit service quality at rail stations’, Transportation Research Part A: Policy and Practice. Elsevier, 114(February), pp. 67–83. doi: 10.1016/j.tra.2018.01.032.
Eboli, L. and Mazzulla, G. (2012) ‘Structural Equation Modelling for Analysing Passengers’
71
Perceptions about Railway Services’, Procedia - Social and Behavioral Sciences, 54, pp. 96–106. doi: 10.1016/j.sbspro.2012.09.729.
Eboli, L. and Mazzulla, G. (2015) ‘Relationships between rail passengers’ satisfaction and service quality: a framework for identifying key service factors’, Public Transport. Springer Berlin Heidelberg, 7(2), pp. 185–201. doi: 10.1007/s12469-014-0096-x.
Esmaeili, A. A., Manesh, M. A. and Golshan, E. (2013) ‘Service Quality , Customer Satisfaction and Customer Loyaltyin RAJA Rail Transportation Company’, 5(3), pp. 347–352.
Etikan, I. (2016) ‘Comparison of Convenience Sampling and Purposive Sampling’, American Journal of Theoretical and Applied Statistics, 5(1), p. 1. doi: 10.11648/j.ajtas.20160501.11.
Geetika and Nandan, S. (2010) ‘Determinants of Customer Satisfaction on Service Quality: A Study of Railway Platforms in India’, Journal of Public Transportation, 13(1), pp. 97–113. doi: 10.5038/2375-0901.13.1.6.
George, S. A. and Rangaraj, N. (2008) ‘A performance benchmarking study of Indian Railway zones’, Benchmarking, 15(5), pp. 599–617. doi: 10.1108/14635770810903178.
Ghosh, P., Ojha, M. K. and Geetika (2017) ‘Determining passenger satisfaction out of platform-based amenities: A study of Kanpur Central Railway Station’, Transport Policy. Elsevier Ltd, 60(August), pp. 108–118. doi: 10.1016/j.tranpol.2017.09.007.
Ghotbabadi, A. R., Feiz, S. and Baharun, R. (2015) ‘Service Quality Measurements: A Review’, International Journal of Academic Research in Business and Social Sciences, 5(2), pp. 267–286. doi: 10.6007/ijarbss/v5-i2/1484.
Greener, S. (2008) Business Research Methods.[e-book] Dr, Sue Greener and Ventus Publishing ApS. Available through:< http://www. bookbon. com>[Accessed 9 May 2011]. Available at: http://gent.uab.cat/diego_prior/sites/gent.uab.cat.diego_prior/files/02_e_01_introduction-to-research-methods.pdf.
Guirao, B., García-Pastor, A. and López-Lambas, M. E. (2016) ‘The importance of service quality attributes in public transportation: Narrowing the gap between scientific research and practitioners’ needs’, Transport Policy. Elsevier, 49, pp. 68–77. doi: 10.1016/j.tranpol.2016.04.003.
Gupta, S. and Datta, R. (2010) ‘A comparative study of two different techniques for evaluating service quality’, Asian Journal on Quality, 11(3), pp. 223–235. doi: 10.1108/15982681011093989.
Gupta, S. and Datta, R. (2016) A methodology for component level improvement of passenger facilities at the Howrah railway station in India, TQM Journal. doi: 10.1108/TQM-03-2013-0037.
van Hagen, M. and van Oort, N. (2019) ‘Improving Railway Passengers Experience: Two Perspectives’, Journal of Traffic and Transportation Engineering, 7(3). doi: 10.17265/2328-2142/2019.03.001.
Haron, S., Nasir, M. S. B. and Mohamad, S. S. (2016) ‘Rail transport service performance indicators in Klang Valley’, AIP Conference Proceedings, 1774(October 2016). doi: 10.1063/1.4965078.
Hartono, S. S. (2019) ‘The effect of expected and perceived service quality on customer satisfaction: Optical retail in Indonesia.’, International Journal of Business and Administrative Studies, 5(2), pp. 186–198.
72
Henseler, J., Ringle, C. M. and Sarstedt, M. (2014) ‘A new criterion for assessing discriminant validity in variance-based structural equation modeling’, Journal of the Academy of Marketing Science, 43(1), pp. 115–135. doi: 10.1007/s11747-014-0403-8.
Heyns, G. J. and Luke, R. (2018) ‘Rail Commuter Service Quality in South Africa : Results From a Longitudinal Study’, (July).
Hooper, D., Coughlan, J. and Mullen, M. (2008) ‘Structural Equation Modelling: Guidelines for Determining Model Fit’, The Electronic Journal of Business Research Methods, 6(1), pp. 53–60.
Horsu, E. N. and Yeboah, S. T. (2015) ‘Influence of Service Quality on Customer Satisfaction: A Study of Minicab Taxi Services in Cape Coast, Ghana’, International Journal of Economics, Commerce and Management, III(5), pp. 1451–1464. Available at: http://ijecm.co.uk/wp-content/uploads/2015/05/3595.pdf.
Hult, G. T. M. et al. (2017) ‘Do managers know what their customers think and why?’, Journal of the Academy of Marketing Science, 45(1), pp. 37–54.
Hundal, B. S. and Kumar, V. (2015) ‘Assessing the service quality of Northern Railway by using SERVQUAL model’, Pacific Business Review International, 8(2), pp. 82–88. Available at: www.pbr.co.in.
Isikli, E. et al. (2017) ‘Identifying key factors of rail transit service quality: An empirical analysis for Istanbul’, Journal of Public Transportation, 20(1), pp. 63–90. doi: 10.5038/2375-0901.20.1.4.
ISO (2015) ‘ISO 9000:2015, Quality Management Systems – Fundamentals and Vocabulary’.
Khathutshelo, E. M. and Mudzanani, E. T. (2019) ‘Analysing Commuters’ Perceptions of Service Quality on A PUTCO Bus Route in the City Of Tshwane.’, African Journal of Business and Economic Research, 14(2), pp. 149–165. doi: 10.31920/1750-4562/2019/14n2a8.
Khorshidi, H. A., Nikfalazar, S. and Gunawan, I. (2016) ‘Statistical process control application on service quality using SERVQUAL and QFD with a case study in trains’ services’, The TQM Journal, 28(2), pp. 195–215. Available at: https://doi-org.libproxy.cput.ac.za/10.1108/TQM-02-2014-0026.
Khuong, M. N. and Dai, N. Q. (2016) ‘The Factors Affecting Customer Satisfaction and Customer Loyalty — A Study of Local Taxi Companies in Ho Chi Minh City, Vietnam’, International Journal of Innovation, Management and Technology, 7(5), pp. 228–233. doi: 10.18178/ijimt.2016.7.5.678.
Kline, R. B. (2015) Principles and practice of structural equation modeling. Guilford publications.
Kothari, C. (2004) Research Methodology Methods and Techniques. Second Rev. India: New Age International (P) Ltd.
Krishnamani, R. (2015) ‘Service quality in Banking sector in India - A Theoretical Framework’, Shanlax International Journal of Management, 3(2), pp. 70–76.
Kuo, C.-W. and Tang, M.-L. (2011) ‘Survey and empirical evaluation of nonhomogeneous arrival process models with taxi data’, Journal of Advanced Transportation, 47(June 2010), pp. 512–525. doi: 10.1002/atr.
Lwesya, F. and Jaffu, R. (2017) ‘Customer service quality management in public transport: The case of rail transport in Tanzania’, International Review, (3–4), pp. 102–117. doi:
73
10.5937/intrev1704102l.
Machado-León, J. L. et al. (2017) ‘Railway transit services in Algiers: priority improvement actions based on users perceptions’, Transport Policy. Elsevier, 53(September 2016), pp. 175–185. doi: 10.1016/j.tranpol.2016.10.004.
Makovsek, D., Benezech, V. and Perkins, S. (2015) Efficiency in Railway Operations and Infrastructure Management. 12. Paris.
Malhotra, N. K. and Dash, S. (2011) Marketing Research an Applied Orientation. London: Pearson Publishing.
Maluleke, K. (2013) ‘Instilling safety culture in the passenger rail transport industry within the South African context’, Journal of Transport and Supply Chain Management, 7(1), pp. 6–11. doi: 10.4102/jtscm.v7i1.84.
Marczyk, G., DeMatteo, D. and Festinger, D. (2005) Essentials of Research Design & Methodology.
Maruvada, D. P. and Bellamkonda, R. S. (2010) ‘Analyzing the Passenger Service Quality of the Indian Railways using Railqual: Examining the applicability of Fuzzy Logic’, International journal of innovation, management and technology, 1(5), p. 478.
Maruvada, D. P. and Bellamkonda, R. S. (2012) ‘The Effects of Individual Dimensions of Railway Service Quality: Findings from Indian Railway Passenger Services through Developing RAILQUAL’, International Journal of Innovation, Management and Technology, 3(1), pp. 42–45.
Miranda, S., Tavares, P. and Queiró, R. (2018) ‘Perceived service quality and customer satisfaction: A fuzzy set QCA approach in the railway sector’, Journal of Business Research. Elsevier, 89(July 2017), pp. 371–377. doi: 10.1016/j.jbusres.2017.12.040.
Monsuur, F. et al. (2017) ‘Impact of train and station types on perceived quality of rail service’, Transportation Research Record, 2648(1), pp. 51–59. doi: 10.3141/2648-06.
Morrison, C. L. J. (2004) ‘Measuring service quality’, International Journal of Market Research, 46(3), pp. 34–39.
Moss, S. (2009) Fit indices for structural equation modeling.
Mouton, J. (2001) How to succed in your Master’s & Doctoral Studies. First Edit. Pretoria: Van Schaik Publishers.
Pal, R. (2012) ‘A study on customer satisfaction in airlines industry’, 119(10), pp. 1–33. Available at: https://rajatpal43.files.wordpress.com/2013/03/customer-satisfaction.docx.
Parasuraman, A., Zeithaml, V. A. and Berry, L. L. (1985) ‘A Conceptual Model Service Its Quality and Implications for Future Research’, Research Paper, 49(4), pp. 41–50. doi: 10.1016/S0148-2963(99)00084-3.
Parasuraman, A., Zeithaml, V. and Berry, L. (1991) ‘Understanding Customer Expectations of Service Understanding Customer Expectations of Service Parasuraman , A .; Berry , Leonard L .; Zeithaml , Valarie A .’, Sloan Management Review, 32(3), p. 39.
Passenger Rail Agency of South Africa (2019a) Annual report 2018/19. Available at: www.prasa.com › Annual Reports › Prasa Annual Report 2018-19.
Passenger Rail Agency of South Africa (2019b) Annual report 2018/19.
74
Pearson, R. H. and Mundform, D. J. (2010) ‘Recommended Sample Size for Conducting Exploratory Factor Analysis on Dichotomous Data’, Journal of Modern Applied Statistical Methods, 9(2), pp. 359–368. doi: 10.22237/jmasm/1288584240.
Prasad, M. D. and Shekhar, B. R. (2010) ‘Impact of Service Quality Management (SQM) Practices on Indian Railways - A Study of South Central Railways’, International Journal of Business and Management, 5(9), pp. 139–146. doi: 10.5539/ijbm.v5n9p139.
Prentkovskis, O. et al. (2018) ‘A new methodology for improving service quality measurement: Delphi-FUCOM-SERVQUAL model’, Symmetry, 10(12). doi: 10.3390/sym10120757.
Priyadharshini, J. and Selladurai, M. (2016) ‘Service Quality and Passengers Satisfaction of Southern Railways by ServQual Model’, International Journal of Trend in Research and Development, 3(6), pp. 3–6. Available at: www.ijtrd.com.
Putra, K. E. and Sitanggang, J. M. (2016) ‘The Effect of Public Transport Services on Quality of Life in Medan City’, Procedia - Social and Behavioral Sciences. Elsevier B.V., 234, pp. 383–389. doi: 10.1016/j.sbspro.2016.10.255.
Rahimi, R. and Kozak, M. (2017) ‘Impact of customer relationship management on customer satisfaction: The case of a budget hotel chain’, Journal of Travel & Tourism Marketing, 34(1), pp. 40–51.
Ranjan, R., Chatterjee, P. and Chakraborty, S. (2016) ‘Performance evaluation of Indian Railway zones using DEMATEL and VIKOR methods’, Benchmarking, 23(1), pp. 78–95. doi: 10.1108/BIJ-09-2014-0088.
Rozaq, F. and Istiantara, D. T. (2018) ‘The Customer Service Quality of Railway Station in Yogyakarta’, IOP Conference Series: Materials Science and Engineering, 407(1). doi: 10.1088/1757-899X/407/1/012037.
Saunders, M., Lewis, P. and Adrian, T. (2016) Research Methods for Business Students.
Schulze, S. (2003) ‘Views on the combination of quantitative and qualitative research approaches’, Zitteliana, 19(8), pp. 159–170.
Shainesh, G. and Mathur, M. (2000) ‘Service Quality Measurement: The Case of Railway Freight Services’, Vikalpa, 25(3), pp. 15–22. doi: 10.1177/0256090920000303.
Sharma, M. G. et al. (2016) ‘Benchmarking of rail transport service performance through DEA for Indian railways’, International Journal of Logistics Management, 27(3), pp. 629–649. doi: 10.1108/IJLM-08-2014-0122.
Siami, S. and Gorji, M. (2012) ‘The measurement of service quality by using SERVQUAL and quality gap model’, Indian Journal of Science and Technology, 5(1), pp. 1956–1960.
Sposito, V. A., Hand, M. L. and Skarpness, B. (1983) ‘On the efficiency of using the sample kurtosis in selecting optimal lpestimators’, Communications in Statistics-simulation and Computation, 12(3), pp. 265–272.
Statistics SA (2020) Land transport ( Preliminary ). Pretoria. Available at: http://www.statssa.gov.za/publications/P7162/P7162November2019.pdf.
Stelzer, A. et al. (2016) ‘Improving service quality in public transportation systems using automated customer feedback’, Transportation Research Part E: Logistics and Transportation Review. Elsevier Ltd, 89, pp. 259–271. doi: 10.1016/j.tre.2015.05.010.
Sumaedi, S. et al. (2016) ‘Factors influencing public transport passengers’ satisfaction: a new
75
model’, Management of Environmental Quality: An International Journal, 27(5), pp. 585–597. doi: 10.1108/MEQ-05-2015-0084.
Taghavi, M. et al. (2020) ‘Two-stage game theoretical framework for iaas market share dynamics’, Future Generation Computer Systems, 10(2), pp. 173–189.
Teffo, M., Earl, A. and Zuidgeest, M. H. P. (2019) ‘Understanding public transport needs in Cape Town’s informal settlements: A Best-Worst-Scaling approach’, Journal of the South African Institution of Civil Engineering, 61(2), pp. 39–50. doi: 10.17159/2309-8775/2019/v61n2a4.
Thompson, L. and Bente, H. (2014) ‘What is Rail Efficiency and How Can it Be Changed?’, International Transport Forum, 23(December), pp. 1–43.
Tronvoll, B. et al. (2011) ‘Paradigms in service research’, Journal of Service Management, 22(5), pp. 560–585. doi: 10.1108/09564231111174951.
Ugo, P. D. (2014) ‘The bus rapid transit system: A service quality dimension of commuter uptake in Cape Town, South Africa’, Journal of Transport and Supply Chain Management, 8(1), pp. 1–10. doi: 10.4102/jtscm.v8i1.145.
Vanniarajan, T. and Stephen, A. (2008) ‘Railqual and Passengers Satisfaction: An Empirical Study in Southern Railways’, Asia Pacific Business Review, 4(1), pp. 64–75. Available at: https://doi.org/10.1177/097324700800400107.
Vilakazi, A. M. and Govender, K. K. (2014) ‘Exploring public bus service quality in South Africa: A structural equation modelling approach’, Journal of Transport and Supply Chain Management, 8(1), pp. 1–10. doi: 10.4102/jtscm.v8i1.127.
Wang, Y., Zhang, Z. and Sun, H. (2018) ‘Assessing Customer Satisfaction of Urban Rail Transit Network in Tianjin Based on Intuitionistic Fuzzy Group Decision Model’, Discrete Dynamics in Nature and Society, 2018(1986). doi: 10.1155/2018/4205136.
Watson, R. (2015) Quantitative research, Nursing standard (Royal College of Nursing (Great Britain) : 1987). doi: 10.7748/ns.29.31.44.e8681.
Wisniewski, M. (2001) ‘Using SERVQUAL to assess customer satisfaction with public sector services’, Managing Service Quality: An International Journal, 11(6), pp. 380–388. doi: 10.1108/EUM0000000006279.
Yuda Bakti, I. G. M. and Sumaedi, S. (2015) ‘Quality paper P-TRANSQUAL: A service quality model of public land transport services’, International Journal of Quality and Reliability Management, 32(6), pp. 534–558. doi: 10.1108/IJQRM-06-2013-0094.
Zeybek, H. (2018) ‘Service Quality and its Importance for Rail Freight Customers’, International Journal of Transportation Engineering, 7(2), p. 2019.
76
APPENDIX A: REQUEST FOR DATA COLLECTION
77
APPENDIX B : LETTER OF CONSENT FROM THE INSTITUTION
78
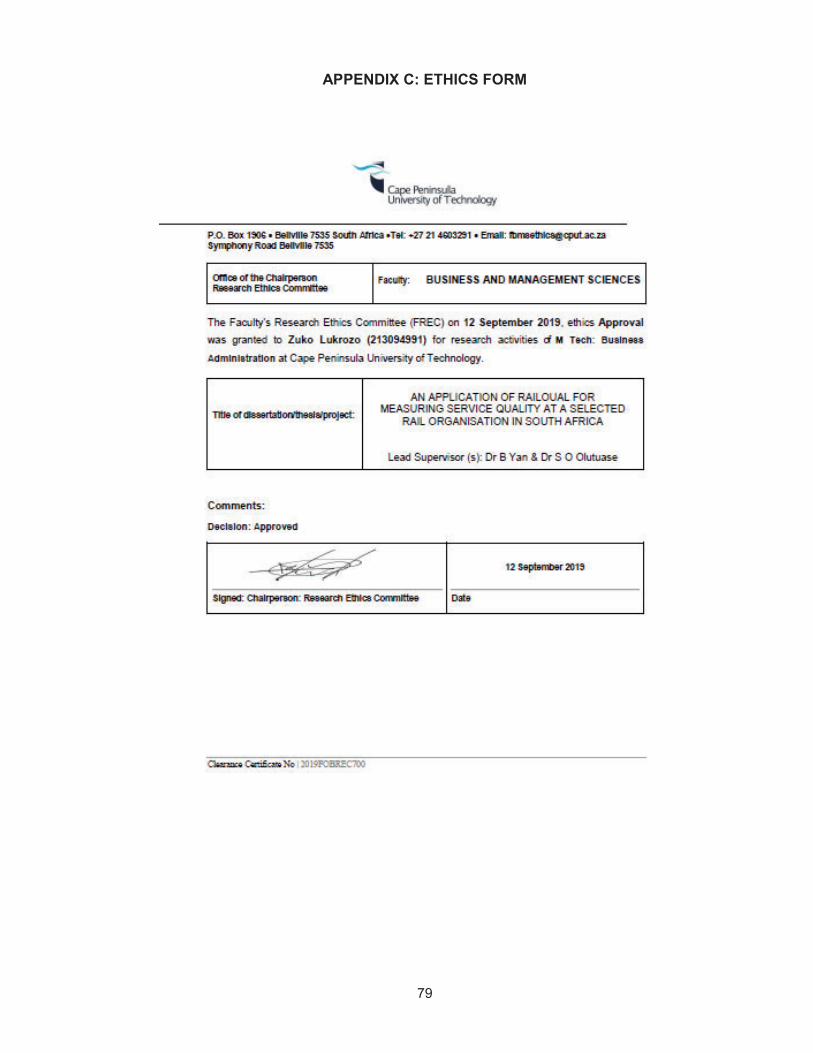
79
APPENDIX C: ETHICS FORM
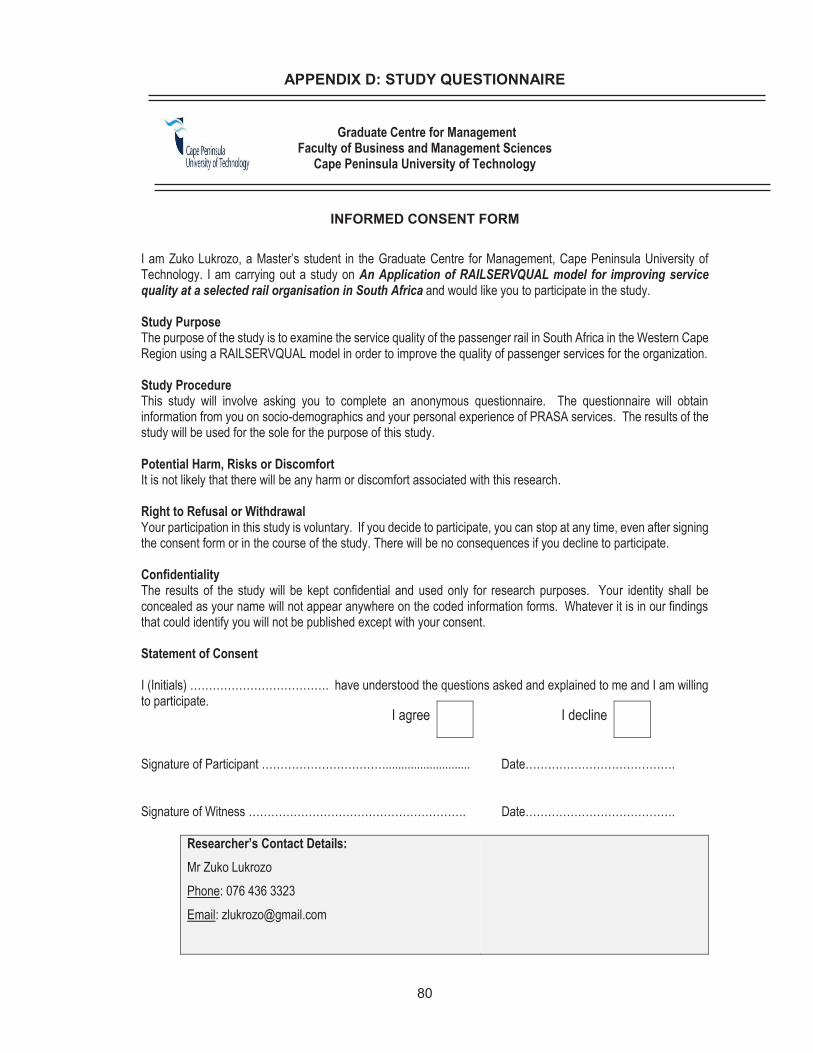
80
APPENDIX D: STUDY QUESTIONNAIRE
Graduate Centre for Management Faculty of Business and Management Sciences
Cape Peninsula University of Technology
INFORMED CONSENT FORM
I am Zuko Lukrozo, a Master’s student in the Graduate Centre for Management, Cape Peninsula University of Technology. I am carrying out a study on An Application of RAILSERVQUAL model for improving service quality at a selected rail organisation in South Africa and would like you to participate in the study. Study Purpose The purpose of the study is to examine the service quality of the passenger rail in South Africa in the Western Cape Region using a RAILSERVQUAL model in order to improve the quality of passenger services for the organization. Study Procedure This study will involve asking you to complete an anonymous questionnaire. The questionnaire will obtain information from you on socio-demographics and your personal experience of PRASA services. The results of the study will be used for the sole for the purpose of this study. Potential Harm, Risks or Discomfort It is not likely that there will be any harm or discomfort associated with this research. Right to Refusal or Withdrawal Your participation in this study is voluntary. If you decide to participate, you can stop at any time, even after signing the consent form or in the course of the study. There will be no consequences if you decline to participate. Confidentiality The results of the study will be kept confidential and used only for research purposes. Your identity shall be concealed as your name will not appear anywhere on the coded information forms. Whatever it is in our findings that could identify you will not be published except with your consent. Statement of Consent I (Initials) ………………………………. have understood the questions asked and explained to me and I am willing to participate. Signature of Participant ……………………………........................... Date…………………………………. Signature of Witness …………………………………………………. Date………………………………….
Researcher’s Contact Details: Mr Zuko Lukrozo Phone: 076 436 3323 Email: [email protected]
I agree I decline
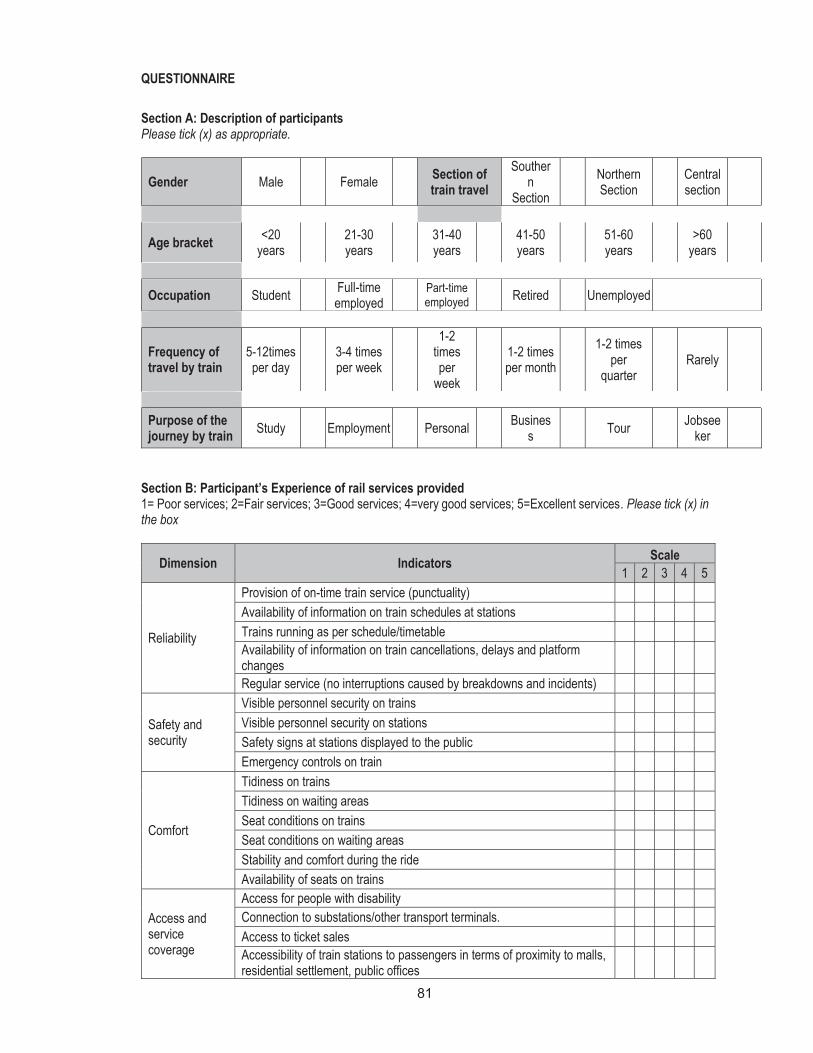
81
QUESTIONNAIRE Section A: Description of participants Please tick (x) as appropriate.
Gender Male Female
Section of train travel
Southern
Section Northern
Section Central section
Age bracket <20 years 21-30
years 31-40 years 41-50
years 51-60 years >60
years
Occupation Student Full-time employed Part-time
employed Retired Unemployed
Frequency of travel by train
5-12times per day 3-4 times
per week 1-2
times per
week 1-2 times
per month 1-2 times
per quarter
Rarely
Purpose of the journey by train Study Employment Personal Busines
s Tour Jobseeker
Section B: Participant’s Experience of rail services provided 1= Poor services; 2=Fair services; 3=Good services; 4=very good services; 5=Excellent services. Please tick (x) in the box
Dimension Indicators Scale 1 2 3 4 5
Reliability
Provision of on-time train service (punctuality) Availability of information on train schedules at stations Trains running as per schedule/timetable Availability of information on train cancellations, delays and platform changes
Regular service (no interruptions caused by breakdowns and incidents)
Safety and security
Visible personnel security on trains Visible personnel security on stations Safety signs at stations displayed to the public Emergency controls on train
Comfort
Tidiness on trains Tidiness on waiting areas Seat conditions on trains Seat conditions on waiting areas Stability and comfort during the ride Availability of seats on trains
Access and service coverage
Access for people with disability Connection to substations/other transport terminals. Access to ticket sales Accessibility of train stations to passengers in terms of proximity to malls, residential settlement, public offices
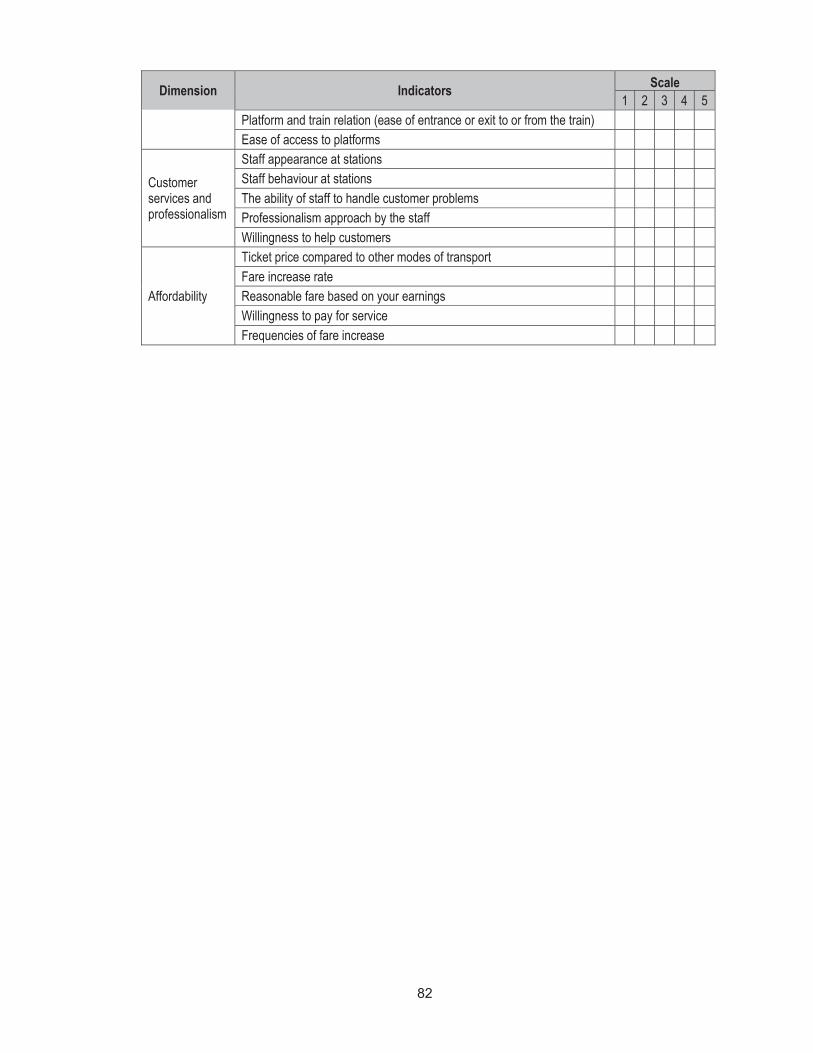
82
Dimension Indicators Scale 1 2 3 4 5
Platform and train relation (ease of entrance or exit to or from the train) Ease of access to platforms
Customer services and professionalism
Staff appearance at stations Staff behaviour at stations The ability of staff to handle customer problems Professionalism approach by the staff Willingness to help customers
Affordability
Ticket price compared to other modes of transport Fare increase rate Reasonable fare based on your earnings Willingness to pay for service Frequencies of fare increase