Embed Size (px)
Citation preview
Walden UniversityScholarWorks
Walden Dissertations and Doctoral Studies Walden Dissertations and Doctoral StudiesCollection
2017
An ANOVA Analysis of Education Inequities UsingParticipation and Representation in EducationSystemsBruce Jerome CarterWalden University
Follow this and additional works at: https://scholarworks.waldenu.edu/dissertations
Part of the Social and Behavioral Sciences Commons
This Dissertation is brought to you for free and open access by the Walden Dissertations and Doctoral Studies Collection at ScholarWorks. It has beenaccepted for inclusion in Walden Dissertations and Doctoral Studies by an authorized administrator of ScholarWorks. For more information, pleasecontact [email protected].
Walden University
College of Social and Behavioral Sciences
This is to certify that the doctoral dissertation by
Bruce J. Carter
has been found to be complete and satisfactory in all respects, and that any and all revisions required by the review committee have been made.
Review Committee Dr. Anne Hacker, Committee Chairperson, Public Policy and Administration Faculty
Dr. Amanda Deerfield, Committee Member,
Public Policy and Administration Faculty
Dr. Tanya Settles, University Reviewer, Public Policy and Administration Faculty
Chief Academic Officer Eric Riedel, Ph.D.
Walden University 2017
Abstract
An ANOVA Analysis of Education Inequities Using Participation and Representation in
Education Systems
by
Bruce J. Carter
MA, Webster University, 2000
BBA, Savannah State University, 1997
Dissertation Submitted in Partial Fulfillment
of the Requirements for the Degree of
Doctor of Philosophy
Public Policy Administration
Walden University
November 2017
Abstract
A problem recognized in the United States is that a K-12 public education in urban
communities is more likely to support existing patterns of inequality than to serve as a
pathway to opportunity. The specific focus of this research was on the poor academic
performance in U.S K-12 urban communities. Using Benet’s polarities of democracy
theory as the foundation, the purpose of this correlational study was to determine which
independent variables, enrollment rates, high school graduation rates, property tax
funding rates for schools, teacher quality, and youth literacy rates are statistically
associated with quality education outcomes by using the polarities of democracy
participation and representation tenets as proxy variables. Secondary data spanning a 5-
year aggregate period, 2010-2015, was compared for both Massachusetts and the United
States, using Germany as the benchmark. Data were acquired from the Programme for
International Student Assessment from the Organisation for Economic Cooperation and
Development. The total sample included 150 cases randomly selected from 240 schools
in Massachusetts and 150 schools in Germany. Data were analyzed using ANOVA. The
results of this study indicate a statistically significant (p < .001) pairwise association
between each of the 5 independent variables and the dependent variable. The 5
independent variables had a positive statistically significant effect on education quality.
The implication for social change from this study includes insight and recommendations
to the U.S Department of Education into best practices for reducing educational
inequality and improving educational quality as measured by achievement in the United
States.
An ANOVA Analysis of Education Inequities Using Participation and Representation in
Education Systems
by
Bruce J. Carter
MA, Webster University, 2000
BBA, Savannah State University, 1997
Dissertation Submitted in Partial Fulfillment
of the Requirements for the Degree of
Doctor of Philosophy
Public Policy Administration
Walden University
November 2017

Dedication
That which is written. To my deceased parents who have always taught me while
raising me on the farm that through perseverance all things are achievable and to give it
all to the Lord who will make it all possible. To my sibling who served 22 years in the
Navy and always shared with me that only the strong will survive and the weak will
perish, that life isn’t always fair, it is what you make of it. To my military elite family
from whom I learned that in the end, we win. Because of my upbringing, the Lord is the
captain of my ship, he will order my steps, lead me, and guide me in all that I do.
Through it all, I learned this is a marathon and not a sprint. God Speed!
Acknowledgement
Foremost to my beautiful wife Sheri, I want to thank you for having faith in me,
encouraging me to go beyond the boundaries, to learn to live, and to follow my
endeavors. Granted, I did not complete my dissertation within the timeline I original
established, but if it was not for your patience, strategic guidance, and encouragement
throughout the process, I would not have finished the task.
I would like to acknowledge my chair and committee for their support and
constructive criticism throughout the various arduous stages of my dissertation, as well as
for the guidance they provided without which I would have never been able to complete
this research. Also, I would like to take this opportunity to recognize my friends and
family for the support they provided and their belief in me in accomplishing this
milestone.
i
Table of Contents
List of Tables .......................................................................................................................v
List of Figures .................................................................................................................... vi
Chapter 1: Introduction to the Study ....................................................................................1
Introduction ....................................................................................................................1
Background ....................................................................................................................4
Problem Statement .........................................................................................................6
Purpose of the Study ......................................................................................................8
Research Question and Hypotheses ...............................................................................8
Theoretical Framework ................................................................................................11
Nature of the Study ......................................................................................................12
Definitions....................................................................................................................14
Assumptions .................................................................................................................16
Scope and Delimitations ..............................................................................................16
Limitations ...................................................................................................................17
Significance..................................................................................................................18
Summary ......................................................................................................................19
Chapter 2: Literature Review .............................................................................................21
Introduction ..................................................................................................................21
Relevance of the Problem ............................................................................................23
Literature Search Strategy............................................................................................23
Theoretical Foundation ................................................................................................25
ii
Polarities of Democracy ........................................................................................ 25
Independent Variables for Polarities of Democracy ............................................. 38
Proxy Variables ..................................................................................................... 41
Educational Inequalities in the United States ....................................................... 45
Historical Overview of United States Policies to Combat Educational
Inequality .................................................................................................. 47
The Structure of Public Education-Residential Segregation ................................ 51
Overview of Germany Exemplar Policies to Combat Educational
Inequality .................................................................................................. 53
Corollary Economic Perspectives ......................................................................... 55
Risk Aversion Perspective .................................................................................... 57
Prestige and Power of Democracy ........................................................................ 58
Restated Key Variables and Concepts .........................................................................59
Property Tax Funding Rates for Schools .............................................................. 64
Teacher Quality ..................................................................................................... 64
High School Graduation Rate ............................................................................... 66
Enrollment Rate .................................................................................................... 67
Youth Literacy Rate .............................................................................................. 68
Restated Research Question and Hypotheses Summary ..............................................69
Summary ......................................................................................................................76
Chapter 3: Research Methodology.....................................................................................79
Introduction ..................................................................................................................79
iii
Research Design and Rationale ...................................................................................80
Research Design...........................................................................................................83
Methodology and Data Collection ...............................................................................84
Unit of Analysis ...........................................................................................................86
Data Analysis Plan / Data Collection...........................................................................88
Measure of Analysis / Study Sample Size ...................................................................88
Sampling and Eligibility Criteria Procedures ..............................................................89
Instrumentation and Operationalization of Constructs ................................................90
Restated Research Questions and Hypothesis .............................................................91
Research Questions ............................................................................................... 91
Construct Validity and Reliability ...............................................................................93
Confidentiality Assurance ............................................................................................94
Summary ......................................................................................................................95
Chapter 4: Results ..............................................................................................................97
Introduction ..................................................................................................................97
Secondary Data Collection ..........................................................................................99
Main Analysis ............................................................................................................101
Independent Variables ........................................................................................ 102
Results for Central Research Question ......................................................................112
Statistical Assumptions ....................................................................................... 112
Independent Variables ........................................................................................ 112
Linear Relationship and Constant Variance ....................................................... 113
iv
No Significant Outlier ......................................................................................... 113
Residuals ............................................................................................................. 113
Correlation Coefficient ....................................................................................... 113
Summary and Transition to Chapter 5 .......................................................................114
Chapter 5: Discussion ......................................................................................................117
Introduction ................................................................................................................117
Interpretation of the Findings.....................................................................................118
Enrollment Rate .................................................................................................. 118
High School Graduation Rate ............................................................................. 119
Property Tax Funding for Schools ...................................................................... 120
Teacher Quality ................................................................................................... 120
Youth Literacy Rate ............................................................................................ 120
Relating the Study to Previous Studies Discussed .....................................................121
Relating the Study Findings to the Theoretical Framework ......................................122
Potential Bias and Limitations of the Study ..............................................................123
Recommendations for Future Research .....................................................................123
Implications for Social Change ..................................................................................125
Summary and Conclusion ..........................................................................................126
References ........................................................................................................................128
Appendix A: Terms and Acronyms .................................................................................144
Appendix B: NIH Certificate ...........................................................................................145
v
List of Tables
Table 1. Descriptive Summary of the Independent Variables .........................................103
Table 2. Pearson’s r Correlation Analysis of the Independent Variables ........................105
Table 3. ANOVA of Independent Variables ....................................................................106
Table 4. Descriptive Summary of the Youth Literacy Rate Scores .................................107
Table 5. ANOVA of Youth Literacy Rate Scores ...........................................................108
Table 6. T-test of Youth Literacy Rate Scores by Gender ...............................................109
Table 7. Regression Analysis ...........................................................................................110
vi
List of Figures
Figure 1. The polarities of democracy model to include the 10 elements .........................26
Figure 2. Required sample size ..........................................................................................90
1
Chapter 1: Introduction to the Study
Introduction
Along with industrialization and economic development, education plays an
increasingly important role in the success of individuals in a society, community, or
country. The process by which this success is achieved is sometimes called the status
attainment process. However, research in many countries has shown that an increased
allocation of resources to education has done little to mitigate existing patterns of K-12
public education inequality. This quantitative research was needed educational
performance in urban areas of the United States, particularly for ages 15-18, are more
likely to reinforce existing patterns of inequality than to serve as a pathway to
opportunity. A 2017 report by the Programme for the International Assessment of Adult
Competencies (PIAAC) compared 2008-2015 data by testing millennials in reading,
math, and science. The authors reported that K-12 primary education in the United States
ranks last out of 34 countries in academic performance in mathematics, reading, and
science (Organisation for Economic Cooperation and Development [OECD], 2015; U.S.
Department of Education, Institute of Education Sciences, National Center for Education
Statistics [NCES], 2015).
Using polarities of democracy as the theoretical framework of participation and
representation as proxy variables, I examined which independent variables were
statistically associated while comparing education performance to the larger population
cities in the State of Massachusetts against the overall education system in the United
States, utilizing German education rates as the benchmark. Pathways to opportunities can
be defined by a country’s having an impartial public education system for all ethnic and
2
gender students, such as in enrollment rate, high school graduation rate, property tax
funding rates for school, teacher quality, and youth literacy rate, which can assist in
narrowing the academic urban achievement gap in underprivileged urban communities
(Association for Supervision and Curriculum Development [ASCD], 2017). The ASCD
(2017) defined academic achievement as the performance in education outcome when an
institution, teacher, and student have obtained educational goals. The independent
variables of enrollment rate, high school graduation rate, property tax funding rates for
school, teacher quality, and youth literacy rate in Massachusetts were compared to those
in Germany. Massachusetts has similar educational policies to those found in Germany,
the number of school districts per student are comparable, and they share a similar
democratic structure.
According to a 2013 OECD report, Germany implemented equality-driven
policies that create advantages in the attainment and application of education for skill
jobs. The OECD initiated a national assessment in 2000 and conducted an international
assessment every three years. The 2011, 2012, and 2015 OECD reports stated that
Germany was unmatched in its model education system, as the nation provided free
public fundamental education to all citizens. There are several significant outcome
characteristics of the German model that may contribute to K-12 academic achievement.
The success of the German educational system can be partially attributed to a strong
national reform for rapid federal and state Länder policy improvements (OECD, 2013).
The restructured German-model educational system is rapidly growing in Germany and
other surrounding Eastern and Western European Countries (OECD, 2013).
3
In contrast, the United States’ education system is experiencing a decline of
academic achievement and performance among graduating students (OECD, 2011). The
United States has implemented numerous laws and policies to address the educational
urban achievement gap between groups of different socioeconomic status (SES), but
reform is still needed. Massachusetts has ranked first in academic achievement in the
United States since 2008 (OECD, 2012). The Education Week Research Center (2014), a
nonpartisan think tank, measured indicators such as state and local policies, high school
graduation rate, enrollment rate, and youth literacy rate linked to Massachusetts
educational achievement (OECD, 2012). The outcome of the measurement provided
insight into why Massachusetts met high academic achievement standards. It was
because, at least in part, the state’s education policies emphasized attending to the
independent variables.
The German education system, which appears to have successfully addressed
educational inequality, may serve as a model in the reconstruction or enhancement of the
U.S. education policies. To add to the body of education research, I analyzed policies,
enrollment rates, high school graduation rates, property tax funding rates for school,
teacher quality, and youth literacy rates as the independent variables, which served as
proxy variables for participation and representation. This study may inform best practices
regarding reducing educational inequality and improving educational quality as measured
by the independent variables. The results may positively affect existing patterns of
inequality in urban areas and serve as a pathway to opportunity. This research may also
enhance understanding of participation and representation in relation to the polarities of
democracy, thereby supplementing the current body of literature.
4
Background
In this section, I briefly outline education functions in a society and explain the
importance of education knowledge through nonpartisan organizations and spending cap
per country. Education in any country is one of the most essential service functions that
can be provided by the government to its people because it helps the country and its
citizens to compete on a global scale and in diverse markets (OECD, 2013). Cordes and
Miller (2001) proposed that efforts should be made in the United States to improve
education quality. The OECD (2013) asserted that once students were literate, they could
have brighter futures (OECD, 2013). In 2017 in the United States, a successful future can
only be attained through a solid educational background and development of a
comprehensive twenty-first-century skill. The roots of the urban achievement gap
between the haves and have-nots may possibly lie in access to healthcare, property tax
funding rates for schools, and teacher quality. Ceci and Papierno (2005) define haves as
those who have more wealth, income that allow them to go to any university of choice
which in terms will have a quality education and higher income. They define have nots as
those who have little wealth, income, and tend to be at a disadvantage in having a quality
education that widened the academic achievement gap.
The urban achievement gap between the haves and have-nots is constantly
growing, a development that threatens the foundations of society (OECD, 2013). The
Programme for International Student Assessment (PISA) researchers drew a probability
sample of American and German citizens to identify literacy rates for a population
between the ages 16 and 65 (OECD, 2013). The average student in the United States
scored 492 out of 2,000 in reading literacy, math, and science per category, which was
5
lower than the OECD average of 497 (OECD, 2013). By contrast, German students
scored, on average, 515 in reading literacy, math, and science (OECD, 2013). In this
study, I examined the nature of the relationship among the independent variables of
enrollment rate, high school graduation rate, property tax funding rates for school,
teacher quality, and youth literacy rate, which served as proxy variables for participation
and representation. By doing this, I determined what combination of variables were more
important to focus on in urban education policies.
Massachusetts and Germany were the target sample size of secondary data.
Germany was used as the benchmark because both are governmental entities with similar
forms of governance, which includes the individual subdivisions of the government,
because the United States assisted in creating the Federal Republic of Germany after
WWII (Merryman, 1998). Studies pertaining to educational inequality and the systems of
educational achievement are illustrated below.
The Lincoln Institute (2014), a nonpartisan think tank, reported on the distribution
of public tax dollars for education in the United States and Germany. German policies
allow for more equitable distribution of tax dollars, which benefits the lower class
(OECD, 2013). In this study, I hypothesized that in low-income public school districts in
the United States, where lower property values result in less tax revenue, there is less
money available for education. A significant resource problem is funding public
education through property taxes. United States federal contributions account for only
about 10% of revenues, on average, for public school systems (Lincoln Institute, 2014).
These funds add to both local and state level resources, thereby enabling the state
government to administer federal education appropriations (Lincoln Institute, 2014). The
6
amount of education funding and spending among states is necessary to reduce
inequalities in education (Lincoln Institute, 2014). For instance, in the United States,
states are responsible for administering funds for public education (Lincoln Institute,
2014). Hence, an equal distribution of financial resources to urban communities’ school
districts across the country may improve equality of education nationwide.
The average annual funding per student in K-12 in the United States is about
$1,348.00. The average difference in per pupil spending for wealthy states is $1,200.00
per student, while poor states spend $13,375.00 annually per pupil, which is 25% less
than the average of $10,700.00 (ASCD, 2014; Williams, 2015). The ASCD (2014)
defined wealth in terms of the result of the generation of income as it pertains to the
evolvement of assets from both human and physical capital (ASCD, 2014). The ASCD
(2014) defined poverty as income-poverty, more commonly referred to as consumption-
poverty; and the lack of possessing wealth or having a low quality of assets, including
clothing, personal transport, shelter, and human capital capabilities. The differences in
education funding cause some learning institutions to have better facilities than others
(ASCD, 2014). The allocation of sufficient funds provides the basic resources and the
right academic environment for students to succeed. A school without sufficient funds is
less able to adequately and effectively teach its students. Research in educational
inequality is needed to ensure that the United States urban primary education serves as a
pathway to opportunity.
Problem Statement
The problem addressed in this quantitative study is that K-12 public education in
urban communities in the United States, specifically among 15-18 year olds, is more
7
likely to reinforce existing patterns of inequality than to serve as a pathway to
opportunity. In this study, I considered the relationships among five independent
variables related to educational quality in the state of Massachusetts, which ranks as the
best state in the United States in education, while using Germany as the benchmark for
comparison (ASCD, 2014; Education Week Research Center, 2014). All five independent
variables, enrollment rate, high school graduation rate, property tax funding rates for
school, teacher quality, and youth literacy rate were determined during the result to be
important to focus on in education policies in urban areas (OECD, 2013).
The German education policy model diminishes stratification in the educational
system. The OECD (2013) survey report illustrated that German students performed
better than the U.S. students on tests in math, literacy, technology, and problem-solving,
indicating superior education for its citizens. Education inequality needs to be addressed
because it will impede the United States’ ability to compete in the global labor
marketplace, which could weaken our democracy (Kozol, 1991). I hypothesized that each
independent variable was correlated with reduced educational inequality outcomes. Thus,
this study may provide policy-makers and educators with data that will enable them to
advocate for stronger educational systems. The independent variables served as proxy
variables for participation and representation of two of the pillars of polarities of
democracy (Benet, 2013). Potentially this could assist in bridging the urban achievement
gap in research.
The five independent variables were determined to be statistically associated for
Germany and the State of Massachusetts. A significant correlation was identified, which
suggests that there is a relationship between the independent variables that could assist
8
the United States in developing education policies that improve education and make it a
pathway for opportunities in other U.S. urban communities (Sherman & Poirier, 2007).
Reduction of educational inequality could improve overall educational quality and
maintain the nation’s economic competitiveness in a global market.
Purpose of the Study
The purpose of this quantitative empirical study was to ascertain whether there
was a statistically significant association of the five independent variables by using the
polarities of democracy participation and representation tenets as proxy variables. The
theoretical framework served as a means to compare the Massachusetts education system
with the United States, utilizing Germany as the benchmark. The finding from the
analysis determined that there is a statistically significant association among independent
variables, and all five variables were important to focus on in education policies for urban
communities of the United States. Many other factors play an integral role in identifying
the root causes of educational inequality (Sherman & Poirier, 2007). These will be
discussed in Chapter 2.
Research Question and Hypotheses
The central research question was:
RQ: Comparing two equivalent urban groups (n = 150 cases) of full time high
school students from Massachusetts and from Germany, which variables
(enrollment rate, high school graduation rate, property tax funding rates for
school, teacher quality, and youth literacy rate) are statistically significant as
associated with quality education pathways of opportunities in U.S. urban
communities?
9
H0: Comparing two equivalent urban groups (n = 150 cases) of full time high
school students from Massachusetts and one from Germany, there is no
statistically significant association with quality education as a pathway of
opportunities in U.S. urban communities.
Ha: Comparing two equivalent urban groups (n = 150 cases) of full time high
school students from Massachusetts and from Germany, there is a statistically
significant association with quality education as a pathway of opportunities in
U.S. urban communities.
The central research question for this quantitative study was developed to
determine what combination of independent variables may be more important to focus
education policies on in urban areas of the United States. The PISA secondary data
sample population consisted of 240 schools from Massachusetts and 150 randomly
selected schools from Germany. Thus, I used a total sample size of 150 cases randomly
generated from the PIAAC student survey. The PISA used the probability proportional to
size (PPS) sampling method for their data collection (OECD, 2017). The PISA
researchers used the unit of measurement of five main variables that were implemented to
categorize the sampling frame (OECD, 2017). For the United States, the PISA
researchers looked at three states, and Massachusetts ranked first out of the three states,
as well as overall in the country, in having the best education system. The PISA analysis
coding consists of (a) five groupings of school grades, location of populace, race, and
gender (> 95% female). Forty-two 15-year-old students from each school were sampled
randomly (OECD, 2017). However, if there were fewer than the targeted number of
10
students available to meet age eligibility criteria, all were subsequently selected (OECD,
2017).
A school sampling size of 150 was the minimum size set internationally to
counterbalance possible nonresponses (OECD, 2017). Nonetheless, the 2015 United
States PISA exceeded the sample size with 240 schools (OECD, 2017). Data was
collected from two sources, public (2012-2013) and private schools (2011-2012), using
Common Core of Data and Private School Universe Survey, respectively (OECD, 2017).
Schools were selected in the sampling size if at least one grade (7th-12th) was a
component of the school. Moreover, schools participating in the study submitted a list of
eligible 15-year-old students (OECD, 2017). From this list, the sample size was compiled
using IBM’s Statistical Program for the Social Sciences (SPSS) software version 21
developed by an international contractor.
The intent of the central research question was to generate testable hypotheses
using appropriate descriptive and inferential statistical methods. This research question
outlines the correlative nature of the five independent variables: (X1) enrollment rate, (X2)
high school graduation rate, (X3) property tax funding rate for schools, (X4) teacher
quality, and (X5) youth literacy rate. The central research question also focuses on the
PISA secondary data by comparing academic achievement in the Massachusetts
education system to the United States overall and to the German model.
The PISA analysis described high school graduation as an estimated percentage of
students who graduate from an education level (OECD, 2017). The unit of measurement
that was utilized was coded for gender, age, and race. PISA divided the number of
students into specific gender and age groups for enrolled education levels; the size of the
11
group enrollment rates were expressed in net enrollment rates (OECD, 2017). According
to the PISA data results, the youth literacy rate was calculated by taking the mean score
of students to ensure they can formulate evaluative statements, read, and write to a
specific global economic standard (OECD, 2017). The PISA population size was 240
Massachusetts schools and 150 for schools from Germany. The PISA database used PPS
sampling. I used ANOVA to define and tests for the difference in the five independent
variables. The unit of measurement was n = 150 cases taken randomly, which were
surveyed through PIAAC. G*Power was used for gender, 0 = male, 1 = female, * p < .05.
Theoretical Framework
In the following section, polarities of democracy participation and representation
tenets serve as proxy variables. Parents are responsible for providing cultural, social,
human, and physical resources that impact their children’s quality of education and
ultimate employability (Orji, 2011). To broaden the continuum and scope of the research,
I incorporated a concise analysis of the key thinkers in the theoretical framework,
including Benet’s (2013) polarities of democracy theory. However, in Chapter 2 I
compared in-depth the differences between Benet’s (2013), and Johnson’s (1998)
polarities of management concepts. The key elements of polarities of democracy are
pivotal in education attainment; hence, this theory could assist in researching educational
inequality outcomes related to the predictor variables.
The theoretical framework for this research was informed by Benet’s (2013)
polarities of democracy. The polarities of democracy feature ten elements, which exist as
five tenants of polarities: freedom and authority, justice and due-process, diversity and
equality, human rights and communal obligations, and participation and representation.
12
According to Benet (2013), the purpose of any democracy is to positively construct a
productive and sustainable society that will not oppress or deny its citizens a quality
education.
In comparison, Johnson’s (1998) polarities of management illustrated a positive
aspect of a society ensuring its citizens of having a quality education and a society that
will remain economically and globally competitive. A quality education also guarantees
that the independent variables of enrollment rate, high school graduation rate, property
tax funding rates for schools, teacher quality, and youth literacy rate will remain linked to
national goals; the five independent variables may assist in creating a pathway of
opportunities in urban areas (Colby, & Witt, 2000). A society without quality education
will fail to remain economically competitive globally.
In Chapter 1, I discussed why Germany could be an exemplar for education in the
United States. I examined the United States and Germany regarding their histories of
education inequality through their legislation and policies. The presumption of polarities
of democracy as used in this study were that there are structural forces that lead to the
existence of conditions of oppression. I examined and used the lens of polarities of
democracy theory regarding the relationships between the five independent variables.
Nature of the Study
The nature of this study was quantitative as I explored the differences in
educational outcomes and any possible correlations of enrollment rate, high school
graduation rate, property tax funding rates for school, teacher quality, and youth literacy
rate between Massachusetts and Germany. I utilized secondary data from OECD-PISA,
13
and PIACC archival databases to evaluate the five predictor variables in the state of
Massachusetts.
I used ANOVA and descriptive statistics to test the hypotheses for this study.
Considering that the hypotheses were associated with the independent variables group, I
used the two-tailed t test to determine if there is a statistically significant relationship of
the United States’ five independent variables. A box plot is typically used to identify
outlier data points. Descriptive statistics were used to illustrate the distribution and
standard deviation to examine for statistically significant association between the five
independent variables. In Chapter 3, I discuss the PISA, Teaching and Learning
International Survey (TALIS), and Trends in International Mathematics and Science
Study (TIMSS) measurement instruments.
Secondary data sets I used in this study came mainly from the PISA, OECD, and
PIACC nongovernmental organizations database. Additionally, other data was accessed
from previously published resources such as journals, magazines, and books. In general,
to determine the validity of the historical national dataset, records databases were
validated by OECD. The target sample of this study was identified by secondary data
pulled from OECD PISA database (N = 240 for Massachusetts schools and N = 150 for
schools from Germany), where historical records utilizing the PPS sampling
methodology were relevant to this study. As discussed in depth in Chapter 3, the specific
data source was archival, and the two sample sizes were for Massachusetts and Germany
K-12 primary public school districts, which, according to the PISA study, could skew the
weightings (OECD, 2017). I used SPSS version 23 to organize, store, and analyze the raw
data using ANOVA to test the direction and strength of the correlation, with the intent of
14
decreasing the differences between the experimental outcome in some random dataset
and the reaction predicted by the linear estimation of the information (Noreen, 1988).
There has been a large body of research completed utilizing these two sample sizes.
These datasets are the standard when studying education globally.
Definitions
Bond: The German word for the federal government (OECD, 2011).
Education inequality: The existing urban achievement gap between individuals
who have acquired specific skills and those perceived to have not. The variable is
measured using the Gini coefficient, which measures inequality in income (U.S.
Department of Education [DOE], 2016).
Education reform: For the purposes of this study, it is a means to enhance all
student’s education regardless of age, race, economic status, and sex (DOE, 2016).
Typically, education reform refers to the process of decentralizing leadership so that
governance in public educational institutions becomes flatter and less hierarchical.
Enrollment differences: Differences in the number of children enrolled in K-12 in
Massachusetts schools.
Equality driven policies: Urgent action to tackle growing inequality and promote
quality employment (Rue, 2016)
International Adult Literacy Survey (IALS): This was a worldwide evaluation
carried out from 2009-2012 that was designed to measure a range of economic and social
skills of individuals across and within nations (NCES, 2014a). As societies become more
data-oriented, adults will need a broad set of work skills to participate effectively in the
political process in the community and labor market. It is imperative that citizens be
15
literate, numerate, capable of problem solving, and familiar with communications and
data technologies (NCES, 2014b).
Land: The German word for municipal and local county (OECD, 2013).
Länder: The German word for state government (OECD, 2013).
Literacy: The IALS defined literacy as an all-encompassing collection of
aptitudes, which are assembled by three domains (NCES, 2014a) as follows:
1. Document literacy: The ability to read and use transportation schedules, maps,
job applications, tables, and graphs (NCES, 2014a).
2. Prose literacy: The ability to utilize text data from fiction and nonfiction
sources, such as texts, news stories, and poems (NCES, 2014a).
3. Quantitative literacy: The ability to use arithmetic operations, such as
balancing a checkbook, computing a tip, or determining the amount of interest
on a loan from a bank (NCES, 2014b).
Organization for Economic Cooperation and Development (OECD): This
organization is a consortium in which government officials come together to share
solutions and experiences to assist in solving common issues (OECD, 2012). The OECD
works with governments to understand social, environmental, and economic change.
They measure productivity and worldwide flows of investment and trade. In addition,
they compare and analyze information to determine future trends (OECD, 2012).
The Program for the International Assessment of Adult Competencies (PIAAC):
This is a household research study established under the sponsorship of OECD. In the
United States, the research was conducted between 2010 and 2012, and consisted of a
nationwide sample of 5,000 Americans adults between the ages of 16 and 65 (OECD,
16
2013). Parallel samples of adults were surveyed in 24 different participating countries
(OECD, 2013). The aim of PIAAC was to compare and assess the broad range and
essential skills of adults worldwide.
Assumptions
There are several assumptions associated with this study. Assumptions can be
defined as effects outside of a researcher’s power and, if they vanish, the research will be
unsuitable (Simon, & Goes 2013). For instance, education quality will continue to be a
pivotal factor in societies. The secondary database sample population represents the
population I researched. Anecdotal test performance accuracy in subjects such as the
predictor and outcome variables represent the quality of education provided by a
country’s educational system. Testing performance will continue to play an essential role
in academic achievement. Policy makers will continue to make positive changes in
education policies to urban communities to achieve a pathway to opportunities.
Scope and Delimitations
This study explored the nature of the relationship between the independent
variables. Scope and delimitations can be defined as effects that are in a researcher’s
control and/or characteristics which can marginalize the scope boundaries in one’s
research (Simon, & Goes 2013). The delimitations include objectives such as the
geographic population, the professional organizations involved, the variables’ interest,
theoretical perspectives being used, and research questions (Simon, & Goes 2013). I
analyzed various contributions of these polarities at various levels in the history of the
education sector. I evaluated how various democratic policies have contributed to
ensuring education equality at various levels in the United States. I assessed the current
17
level of education inequality, where it will give the recommendations on how best to
reduce it over time. The research demographics focused on education equality in the state
of Massachusetts, and using Germany as an overall exemplar model, in relation to the
five independent variables of enrollment rate, high school graduation rate, property tax
funding rates for school, teacher quality, and youth literacy rate. The research was limited
to five-year period. I utilized organizational data from the bureau of statistics and
government education program managers in both countries such as the OECD, PISA,
PIAAC, TALIS, and TIMSS. Furthermore, I used cross-reference essential findings,
namely the education-tracking method, with archival dataset records using the OECD,
PISA, and PIACC database. The OECD, PISA, PIAAC, TALIS, and TIMSS data are
accessible in the public domain which are available in electronic format.
Limitations
The study was based on quantitative statistics regarding the level of education
achieved by K-12 students, and the independent variables relationship and serve as proxy
variables for participation and representation. Limitations are defined as weakness of the
research that are out of the researcher’s control (Simon, & Goes 2013). Some of the
factors, however, may not be accurately quantifiable and time could play as a factor for
the research (Simon, & Goes 2013). Such factors for this research include determining
the knowledge of an individual at any education level or the effect of academic education
performance of an individual. The education systems in other countries vary from that of
the United States. It may, therefore, not be correct to compare education inequality of the
United States with that of other countries. Additionally, I developed my own
interpretation based on my experience of having lived in both the United States and
18
Germany (for 10 years) to account for the accuracy regarding the educational
inequalities. I cross-referenced essential findings including the education tracking method
with secondary data such as the OECD.
The most salient constraint/limitation of the study was that some of the data in the
OECD, PISA, and PIACC databases were very large files encompassing data from over
36 countries. The process was lengthy as I sorted through some of the findings.
Moreover, a shortage of secondary data from the OECD, PISA, and PIACC database
source imposed minor limitations. I used the OECD, PISA, and PIACC historical
databases record sets from both countries to analyze and assist in generating this research
reports. It is possible that the OECD, who collected the data, made some data collection
errors. Those errors are beyond my control. However, checking the validity and
reliability potentially could be used to cross-check the data. The other limitation was the
correlation nature of the data that limits the validity of descriptive, correlational of the
independent variables in the study.
Significance
The significance of the study is that it may inform efforts United States
government officials to ensure equal educational opportunities across social strata and
better educational quality overall. Scholarly research has demonstrated that education
inequality in the United States is in a state of crisis (Farkas, 2006). Comparing the
American and German models with respect to enrollment rate, high school graduation
rate, property tax funding rates for school, teacher quality, and youth literacy rate may
point the way to stimulate a change in government’s approach to how we educate and
assess American high school student’s academic performance in urban areas.
19
President Lyndon Johnson asserted that learning should not be impeded by
poverty, and that learning is pivotal to provide an escape from poverty (Ginsberg, &
Solow, 1976). In this quantitative research, I addressed data that may be necessary to
guide policy makers in developing guidelines that promote educational equality in the
United States (Farkas, 2006). Moreover, the outcome from this research will contribute
the current body of literature, in which more trans-national and cross-cultural analysis are
needed.
The implication for social change from this study may provide insight into best
practices regarding reducing educational inequality and improving educational quality, as
measured by achievement. The results may influence intergenerational mobility of
polarities affecting adult skills attainment, and ultimately influence the earnings
distributions within the global market. This research may also enhance understanding of
the polarities of democracy theory, thereby contributing to the current body of literature.
Additionally, this study may provide information to guide policy changes for the United
States Labor Department, Department of Education, and Department of Health and
Human Services. It may also provide a starting point from which the Brooking Institute,
Lincoln Institute for Policy and Land, Institute for the Study of Labor, Education without
Borders, and Center for American Progress might conduct future research.
Summary
This retrospective quantitative research study was designed to promote an
understanding Massachusetts’ educational top performance and to use Germany as a
model to assist to enhance United States overall education system. In Chapter 1, I
outlined the relevant background research, rationale of the study, and introduced the
20
theoretical framework, as well as identifying assumptions that underpin the research and
the scope and potential limitations of the study. Additionally, I hope to inform public
policy efforts for social change to reduce educational inequalities in the United States
along with promoting awareness to stimulate a change in society’s perspective on how
we educate and assess Massachusetts’ children’s academic performance. In Chapter 2, I
present a review of the pertinent literature on educational outcome and how teachers, and
students’ education is related to the different social strata acquire different levels of
academic performance. Furthermore, the literature review illustrates the different
techniques that have been used to examine the research problems and their findings, and
using polarities of democracy theory and potentially influence the overall United States
education system. In Chapter 2, I illustrate the use of Germany as the example for the
model in the literature review and then use the data that the PISA researcher conducted
on Massachusetts, as the population for the research, followed by Chapter 3, I focus on
the quantitative research design, sampling methodology, research instrument, and data
analysis plans. In Chapter 4, I provided the results of the ANOVA analysis and concluded
with the interpretations and recommendations in Chapter 5.
21
Chapter 2: Literature Review
Introduction
The problem in the United States is that K-12 public education does not appear to
be helping the country to be economically competitive on a global scale. The purpose of
this quantitative empirical study was to ascertain whether there was a statistically
associated by using the polarities of democracy participation and representation tenets as
proxy variables.
The objective of this chapter is to review the literature related to Benet’s (2013)
polarities of democracy theory and to establish the potential contribution of this study to
the existing body of research on positive educational outcome policies in urban school
systems. Also, this chapter provides a comprehensive review of democracy and its
polarities before reviewing the progress of the education sector in the United States.
While educational inequality outcomes have raised many concerns for planners and
policy makers, little attention has been paid to those educational inequality outcomes
(Araujo, Ferreira, & Schady, 2004). However, over the last two decades, scholarly
researchers have recognized the significance of putting more emphasis on educational
inequalities (Araujo et al., 2004). Thus, a recent and rapidly growing body of literature on
educational inequality has emerged (Castello, 2010; Castello & Domenech, 2002;
Checchi, 2004; Foldvari & Van Leeuwen, 2011; Lim & Tang, 2008). A comparison of
international surveys has been beneficial for political leaders worldwide who seek to
outline a holistic framework for national assessment.
22
This study focused on the academic urban achievement gap between haves and
have-nots to measure the success of the nation’s education. I will discuss in-depth under
historical overview the United States’ and Germany’s education outcomes.
The OECD assessments have become popular with researchers and policy makers
from 1996-2016, primarily because of global markets are often precipitated by conflict of
resolution (OECD, 2011). Consequently, the standard for making an assessment for
public policy in educational outcome is not about making gains on national educational
policies, but rather on making gains or progress in comparison to other successful
education systems globally (OECD, 2011). However, most empirical research on factors
related to educational outcomes uses a one-dimensional economic perspective that may
not be sufficient to capture the full scope of this multidimensional phenomenon.
This review of the existing body of research on polarities of democracy
contributes to the understanding of the relationship of enrollment rate, high school
graduation rate, property tax funding rates for schools, teacher quality, and youth literacy
rate to educational inequality in urban areas of the United States. It consists of several
sections that frame this research: the polarity origin of educational policies in Germany
and the United States; the polarities of information on educational inequality in the
United States; the theoretical framework of the study; and a comparative overview
regarding the polarities of the independent variables mentioned above.
No study of this nature has previously illustrated if there is a relationship between
property tax funding rates for schools, teacher quality, high school graduation rate,
enrollment rate, and youth literacy rate and educational inequality in urban areas in
Massachusetts while using Germany as a model. The political environment of education
23
has changed in the past two decades, signifying a need for public education reform
(Education Week, 2014).
Relevance of the Problem
According to Durkheim (1984), Dewey (2012), and Smith (1776), education
quality and democracy were among the few forces that could bring about a semblance of
equality in society. However, there are varying opinions on how each of them results in a
change in society. Education is a field in which there are high levels of unfairness, with
access being limited by several factors including but not limited to poverty, culture, and
religion (Eide & Showalter, 2011). Democracy is a commonly misunderstood term with
different people interpreting it in their own ways. This chapter is a summary of the
literature providing an overview of what various scholars have said about the polarities of
democracy model and its impact on education disparity and democratic organization in
urban areas of the United States.
Literature Search Strategy
In searching for peer-reviewed scholarly studies on educational inequality in the
United States and using Germany as an exemplar, I reviewed EPI, ICSPR, PISA, Lincoln
Institute, EURO stat, and data from 360 electronic databases in education, psychology,
and economics. I searched several electronic databases to compile data on the research
question. The three main search strategies were garnered from SAGE Journal, an
independent publishing corporation, OECD, an exclusive environment of 34 democracies
with global economics market, and the DOE, which creates public policies and
coordinates and administers federal support for education (DOE, 2016; OECD, 2015).
The United States educational system is designed to serve America’s learners and
24
promote learner preparation and achievement for global competitiveness, along with
nurturing educational brilliance and guaranteeing fair and equal access (DOE, 2016).
Technical literature consists of a variety of manuals that provide insight into
realistic matters. The manuals include the OECD Library, which houses an expansive list
of publications; DOE literature; the Library of Congress database; the Lincoln Institute
database; the Chronicle of Higher Education literature; UNESCO literature; Google
Scholar database; Institute for the Study of Labor (German literature); and JSTAR/JTOR
Social Science Research Network.
The search criteria I used included key cross-referenced terms and phrases such as
Germany, United States, differences in enrollment rate, high school graduation rate,
property tax funding rates for schools, teacher quality, and youth literacy rate, which will
serve as proxy variables for participation and representation. Literature published over
the time period of five-years, including peer-reviewed journals, as well as books by
seminal authors, were included. Research was considered between the 1940s and 2013
because healthcare and educational policies in both Germany and United States were
altered significantly during this time due to the crises of World War II. I did not include
any research in the review on the validity of accessibility to healthcare, property tax
funding rate for schools, and teacher quality variables relating to educational outcome
that had not been submitted for peer review. Lastly, I used the literature retrieval
transitions to a review of research on control measures such as polarities of democracy
relevant to the theoretical framework.
The section of the literature review is divided into three subsections examining
enrollment rate, high school graduation rate, property tax funding rates for schools,
25
teacher quality, and youth literacy rate, the independent variables for the study. The first
part begins by presenting the state of the research on factors relating to educational
inequality in the United States. The second part examines the research on educational
outcome and addresses the differences between Germany and the United States. The
chapter closes by drawing from polarities of democracy and the existing body of research
a set of claims about the interrelationships between variables relating to educational
inequality and public policies in the United States and Germany.
Theoretical Foundation
Polarities of Democracy
There have been several theories put forward to explain the interrelationship
between education and democracy and their impact on building cohesive, sustainable,
and socially fair communities (Eide & Showalter, 2011). Two such models are Johnson’s
(1996) polarities of management and Benet’s (2013) polarities of democracy. These
theorists attempted to explain the interrelationship between factors such as poverty,
culture, and religion, and how they combined to influence the way societies are
organized. Benet (2013) developed the polarities of democracy theoretical model to assist
in creating affluent, sustainable, and just communities. The author was inspired to
develop the theory by the increase in the challenges that were threatening to societies.
Additionally, this theory was an attempt to unify efforts that had been put forward to
bring about democracy in the world (Benet, 2013). Benet proposed that there are ten
aspects of democracy organized into five points of authority, which are referred to as
pairs of polarity. These pairs are freedom and authority, justice and following due
process, diversity and equality, human rights and community roles, and participation and
26
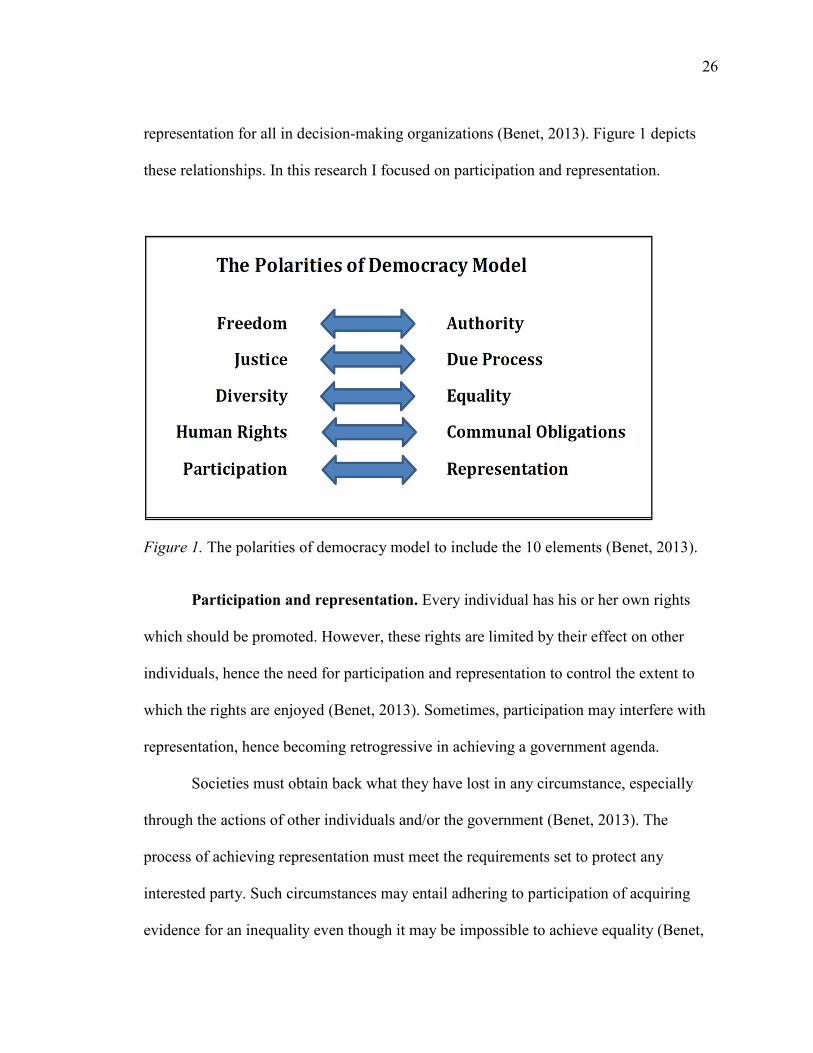
representation for all in decision-making organizations (Benet, 2013). Figure 1 depicts
these relationships. In this research I focused on participation and representation.
Figure 1. The polarities of democracy model to include the 10 elements (Benet, 2013).
Participation and representation. Every individual has his or her own rights
which should be promoted. However, these rights are limited by their effect on other
individuals, hence the need for participation and representation to control the extent to
which the rights are enjoyed (Benet, 2013). Sometimes, participation may interfere with
representation, hence becoming retrogressive in achieving a government agenda.
Societies must obtain back what they have lost in any circumstance, especially
through the actions of other individuals and/or the government (Benet, 2013). The
process of achieving representation must meet the requirements set to protect any
interested party. Such circumstances may entail adhering to participation of acquiring
evidence for an inequality even though it may be impossible to achieve equality (Benet,
27
2013). Hence, people have different ideologies and expectations in the society such that
the efforts towards achieving their total satisfaction may be futile, especially in the efforts
to ensure equality in the society. Consequently, efforts that meet the expectations of each
group in the society may be promoted by balancing diverse expectations of the people.
Such an example recognizes the fact that people have different levels of income and
consequently cannot be taxed at the same rate even though they all benefit from the social
utilities equally.
The two tenets elements have a positive and negative aspects; while each element
has an opposite effect on the other (Benet, 2013). Therefore, it is in the best interest of the
affected parties to work towards strengthening the positive aspects they consider
beneficial to them in achieving democracy. This may involve sufficiently suppressing
some aspects while providing the opportunities for others to thrive (Benet, 2013).
Nonetheless, at times, one element of the pair may need to be compared to the other to
dwell concomitantly and harmoniously. The two sides entirely supplement each other.
This upholds the aspects of both elements that promote socio-economic development.
Benet (2013) further proposed that these are the attributes that make democratic
societies prosper. In addition, the author asserted that there is a strong link between
education and democracy, as the two concepts combine to bring about positive changes in
a society. Likewise, United States education scholars have advocated for the
strengthening of education for the public, and propose that a massive investment should
be made in public education because this is the best way to strengthen democracy in a
society (Couto & Eken, 2002). The United States scholars identified bad governance and
powerful capitalist organizations as threats to thriving democracies in the world and
28
suggested that these should be combated as a way of strengthening democracy (Benet,
2013). The forces that pose a threat to democracy are like those that pose a threat to
education. For example, a properly educated citizenry will demand a change to the way
things are done, which in some cases will mean the loss of power for the ruling regime
(Benet, 2013). Selfishness and dictatorial tendencies are therefore threats to both
education and democracy.
Democracy is a term that has been coined repeatedly in almost every part of the
world, yet very little is known about its meaning and why it should be sustained (Benet,
2013). As such, the United States has developed neo-liberal policies that only benefit a
few people in the society while leaving the majority stuck in abject poverty (Chicosky,
2015). Moreover, most of the developed nations’ government administrations in the
modern political environment are intolerant to pure democracy.
Bergan, Gallagher, and Harkavy (2016) postulated that the most important
function of education is to transform students into responsible citizens, a factor he says is
essential for a properly functioning democracy. Without the citizens being properly
educated, it is almost impossible to inculcate the culture of democracy (Benet, 2013).
Bergan et al. asserted that societies in which education is well-grounded develop strong
democratic institutions, while those that have less educated citizens have difficulty
engendering a democratic culture. In addition, Couto and Eken (2002) argued that higher
educational institutions need to spend more time in designing academic material
specifically meant for the strengthening of democratic institutions of a country. That is,
higher education must take the lead in building a strong democracy for any country.
29
The other benefits of education such as a healthy population, increased incomes,
and an informed society, can only be realized if the democracy of that society is sound,
meaning the two cannot be divorced. To properly achieve this, democracy should be
instilled in the students by handling education matters democratically, including the
measuring and assessment of learning outcomes. Bergan et al. (2016) proposed that
school is the best environment in which children can be taught the culture of democracy.
The authors also suggested that schools should be run on democratic systems;
consequently, the children will grow up knowing that every institution should be run on
democratic grounds. When such children eventually join the society, they become
champions of democracy and positive change. Bergan et al. argued that it is almost
impossible to separate education from democracy because if children are taught without
understanding the difference between education and democracy at school, they would
master dictatorship as the ideal way of doing things which are the factors that kill
democracy.
Currently, democracy has been a trending topic in the world, especially because
of the democratization efforts which have been happening across countries in the Middle
East. There have been unprecedented uprisings among the Arab and Northern African
countries, which has led to a debate as to whether democracy is the right prescription for
every country (Benet, 2013). For a long time, it had been perceived that what the Arab
countries needed was democracy; the proponents of this school of thought insisted that
the social inequalities being experienced in the region were a result of absence of
democracy. Scholars have tried to link democracy to such concepts as capitalism,
30
socialism or postmodernism (Benet, 2013). However, other researchers have disagreed on
the definition of democracy (Brumberg & Heddeman, 2013; Reilly 2014).
Johnson (1998) explained that the polarities of management theory is built on the
belief that in management, there are problems that are created by traditional frameworks
that should be handled from a more liberal framework, which plays a role in socio-
economic development. Johnson whose concepts were on a micro application level also
used as the conceptual framework that Benet developed polarities of democracy theory,
which was viewed on a macro application level as both consulted with each other
(Meiksins, 1995).
The polarity of management was developed for presenting unique solutions to
management issues that hitherto presented difficult moments to the managers. According
to Johnson (1998), each management problem has both positive and negative effects, and
it is the role of the manager to leverage the positive effects to help the company
overcome management issues (Dubrow, 2014). Dubrow (2014) proposed that there are
clichés or truisms about the political inequalities in democratic countries. One lecture
contended that many modern nations have instilled the ideals of democracy in their
national laws and constitutions among other legislation produced by their respective
parliaments. Many of these nations consider democracy to be the only system that can
unlock the vast potential of humanity with many people dying for the ideals of
democracy.
It is important to note that political equality is a crucial element of democracy, yet
many democracies have political inequalities for different groups (Benet, 2013). There is
always some marginalization and existence of marginalized groups. Dubrow (2014)
31
described political inequality to be the unequal influence over decisions and choices
made by political institutions as well as the unequal outcomes of such decisions.
Polarities of Management addresses the existing and future of the notion of political
inequality from cross-national and multidisciplinary perspectives. His research has nine
theoretical, empirical and methodological chapters which also comprise of an edited
collection of original works from various social scientists (Dubrow, 2014). Dubrow’s
research is primarily political in nature and captures the realities of democracies that have
adopted a majoritarian approach to governance. Indeed, it is true that in many
democracies, those who win, also known as the haves always seek their way and ignore
the needs, wishes and interests of the have-nots.
Johnson (1998) indicated that the polarities of management theory has developed
principles that assist the managers in making decisions that increase the positive effects
of the challenges faced by the organization. For example, Johnson (1998) proposed if a
company wants to establish a presence overseas, it should choose between two or more
entry strategies with different effects on the revenue of the organization. Hence, by using
the polarities of management model, the manager shall have the capacity to make the
right decision and increase the capacity of the firm to benefit from the international
venture (Johnson, 1998). For instance, a firm may choose to pursue the strategic alliance
that reduces the risk of trading in a foreign market by creating partnership with a
company, which is already trading in the foreign market. The reduced amount of risk is
critical in ensuring safety of operations in the global market. The bottom line is that
Johnson (1998) developed the polarity of management theory to assist managers in
32
making decisions which have more positive effects that are more beneficial to the
organization than making decisions resulting in more negative effects.
Johnson’s (1998) polarities of management theory and political inequality in an
age of democracy by Dubrow (2014) highlight current issues and propose ways in which
such issues can be resolved using new principles of thinking and by understanding the
current scenario. While Dubrow focused on political issues and public administration
concepts, Johnson examined decision making through a model that applies to both
business and political managers. Both theories borrow heavily from other writers and
scholars making them worthy of reference in capturing modern day learning concepts for
a society (Meiksins, 1995).
A society, like an organism, consists of various organs that conduct functions and
operations to ensure the stability and survival of the society or organism. Society can be
viewed as an organization on its surface while it is a living organism at its core (Eide &
Showalter, 2011). Durkheim (1984) proposed socio economics development culture,
politics, and economics as three core activities of an organization’s DNA. An
organization focus point is concentrated by an external power, whereas an organism can
be a self-directed integral component (Eide & Showalter, 2011). Cultures consist of
billions of families whose wants are met by manufacture in factories supported by an
institute of circulation through services and trade (Eide & Showalter, 2011). The
educational and cultural needs are also satisfied by several micro units of organizations,
such as schools and performing arts. However, there are billions of organized activities
that establish the society. These are traditional activities outside the space of centrally
organized direction. This means that society is an existing organism like the human body.
33
When threatened, a nation rises like one man, which is known to man in a revolution
(Eide & Showalter, 2011). To maximize the effect of the democratization process, all
these interrelated concepts should be well-managed. Polarities of democracy describes
the structure of the society as an interconnection of major frameworks that help in
creating stability and ensuring survival (Benet, 2013). However, the polarities of
democracy theory present contemporary society as a compact structure with various
frameworks that are structured to function in unison for the entire full development of the
society in all the critical aspects of life.
Each community has a unique structure and specific functions. In his polarities of
democracy theory, Benet (2013) explained that environments are equally significant in
the society and each is structured in such a way that its functions aim to strengthen and
help in the overall survival, development, and growth of the entire society. Hence, using
participation and representation will also account for independent variables bias, such as
democracy of education equality. However, the environment tends to be interconnected,
and all have a common goal of creating efficient functioning and integration of the entire
societal structure.
Education as an institution is a vital part of the whole structure and functioning of
the society (Benet, 2013). Education has a structure and policies that govern its
functioning. The functioning of the educational institution mainly aims at empowering
individuals to provide the community with an intellectual workforce. Education as a
social institution has a relationship with all other institutions and communities. The
workforce provided by education institutions enables active economic development,
intellectual governing of the society, understanding of religious virtues and behaviors,
34
and effective family development and integration. The polarities of democracy, therefore,
explains the various social institutions together with their unique polarity and features
and how they integrate to work together for overall society development, growth, survival
and stability (Benet, 2013; Johnson, 1998). Because of education functioning, other
institutions are empowered to conduct their functions resulting in an elite, economically
stable, and integrated society (Benet, 2013; Johnson, 1998).
For a long time, democracy has been touted as the ultimate solution to most of the
problems facing mankind, and scholars have said it is the best system of governing the
world. Those who vouch for democracy as the ultimate system of running the affairs of
the world are full of praise for the system (Mandelbaum, 2007). Fukuyama, & Pierre,
(1992) asserted that democracy is the form of administration for which humanity itself
should strive, and that when it is applied well, it has the potential of transforming
previously docile and dormant societies into vibrant economic powers. Apple (2015)
proposed a system in which both democracy and socialism are incorporated.
Postmodernists, on the other hand, believed that theirs is the most advanced and abstract
form of democracy, such as education and economics (Quinnan, 1997). The argument
that democracy is good for a society is not a new development, but it has been proposed
by scholars from as early as the twentieth century.
According to Durkheim (1984), democracy is the ideal form of government, as it
not only benefits the society but individuals raised and educated in free societies grow
into better people than those brought up in dictatorial set ups (Barnes, 1966). Durkheim
argued that while human beings are naturally egoistic, the collective good of the entire
society is the force that eventually creates order and maintains a level of equality in the
35
society (Barnes, 1966). Barnes (1966) views of individuals are usually varied and mainly
selfish, and the only way a society can move forward is through establishing what he
refers to as collective consciousness. Consequently, he proposes the need to have the
majority view have its way in the same way current democratic institutions are supposed
to work. Without establishing this collective consciousness, Durkheim asserted that the
society cannot work in harmony, and what is referred to as a society is simply a
collection of individuals, each with varied opinions and suggestions on how things should
be done (Barnes, 1966). Therefore, the only way to bring some order is to establish what
is good for the majority.
Another scholar who argues very strongly against the powerful, authoritarian
regimes that were in control at that time was German sociologist Karl Emil Maximilian.
Maximilian asserted that properly organized parliamentary democracy is the only way in
which society can move forward (Waters, & Waters, 2015). The author championed the
right of every individual to be allowed some freedom if such freedoms do not harm
others. Maximilian was among the first people to demand individual rights (Waters, &
Waters, 2015). In addition, Weber singled out the interests of the society, such as health
care and education, which are also interests of the individual as much as they are interests
of the community (Waters, & Waters, 2015). These forces play a significant role in
making the society a better place just as they make individuals better human beings
(Waters, & Waters, 2015). Every society should therefore struggle to strengthen these
interests if it hopes to achieve development.
Karwowski (2001) listed education, security, community health, and social
security as the greatest interests of a community. If a community intends to advance in
36
human welfare, the author argued, it must adequately address these issues and, notably,
the community must make them widely accessible to much of its citizens, especially the
poor. Junker, Gassert, Mausbach, and Morris (2004) drew parallels between some of the
most developed countries of the world and their investment in education and democracy.
The authors argued that after the Second World War, the United States decided to help
develop the democratic aspect of some countries, and those that cooperated, such as
Germany, have realized massive development (Junker et al., 2004). To help develop
Germany, the United States invested in education, which was done through establishment
of an exchange program between the two countries. This resulted in many German
students being educated in the United States, and in a short period, Germany had a strong
labor force that was cultivated with the education and democratic values of the United
States (Junker et al., 2004).
Polarities of democracy is a result of the seminal thinking of many scholars and
political activists who felt that there was a need to change the way society was being
governed and run (Benet, 2013). There was a need to pursue positive change and,
consequently, some people took it upon themselves to push such change, and their
thinking led to the coining of this theory (Benet, 2013). The approach taken by these
proponents was of a confrontational nature; the forces that they perceived to be opposed
to the changes they sought put up a lot of resistance to change the initiative (Benet,
2013). Benet (2013) polarities of democracy sought to put in an organized manner such
efforts and argued that the aim of any theory is to help increase human emancipation and
to lead to an increase in the freedoms a human being enjoys. (Dewey, 2012) argued that
the public has various problems and that these must be confronted by the public, though
37
this must be led by individuals. Dewey (2012) distinguished between the state and the
public, stating that the state is represented by such people as leaders and elected
lawmakers while the public refers to common citizens (Dewey, 2012). Dewey (2012)
argued that a public only comes into being when certain common needs force the people
to come together for their common good (Dewey, 2012). A society is thus born when
people realize that they can only deal with their problems as groups and not as separate
entities. However, there are government extreme conservative forces that will always try
to limit the public access to the liberties that they seek, and Dewey identified powerful
corporate entities as some of the forces that will always stand in the way of a public that
seeks better operating environments (Dewey, 2012). To strengthen democracy, there will
be a need to increase public communication through interaction, and, in so doing, a
common ground between the different players in a cause will be found.
In general, Freire (2012) concurred with Dewey, stating that many of the
common people around the world are oppressed, and it is upon them to fight this
oppression. Freire (2012) suggested that one of the strategies to achieve freedom from
this oppression is education for the masses. Freire taught poor Brazilian adults to learn
how to read and write, an asset he asserted as very powerful regarding the fight for basic
freedoms (Freire, 2012). Freire (2012) distinguished between the oppressor and the
oppressed while highlighting the plight of the oppressed. The oppressor takes various
forms, including employers, rulers, the rich, and the colonizers, and they are always
fighting to ensure that the oppressed do not overcome oppression in any way (Freire,
2012). Freire concluded that freedom will never be given as a gift, but must be something
for which one fights (Freire, 2012). One of his most outstanding arguments was that the
38
students should be taken as active partners in the education initiative, unlike in the
previous learning environments in which students were taken to be naive individuals
without any contribution to the learning process. An education process that treats the
learners with respect would result in individuals who value the society in return, unlike
one in which they are treated with contempt (Freire, 2012). Lastly, education scholars
have advocated for increased respect for both students and their teachers, arguing that
they had greatly been dehumanized before.
Many studies have applied both statistical and theoretical approaches to assess the
effects of inequality in education. In fact, some researchers have specifically analyzed the
effects of education on an individual’s earning potential in relation to the national
distribution of wealth and earnings (Araujo et al., 2004). Although research into
educational inequality has raised concerns for planners and policymakers, few
transnational comparisons have been carried out relating to educational outcomes (Araujo
et al., 2004). In addition, in many studies, the empirical perspective was concrete. I will
explain comprehensive review of democracy and its polarities before reviewing the
progress in the education sector in the United States.
Independent Variables for Polarities of Democracy
The primary goal of K-12 public education in a democratic society is to turn
students into responsible citizens. The DOE (2016) argued that education is the key that
opens every door of success for every child (Cavanagh, 2012). Education does not limit
chances of success but can only widen the sphere to ensure every citizen has the
opportunity required for self-development as well as the development of the nation
(Cavanagh, 2012). For instance, education trains doctors and medical staff to develop
39
skills needed to treat people and to eliminate diseases in the society. If doctors and
medical staff experts were not there, perhaps diseases would have the opportunity to
destroy humanity. Conversely, if diseases can run their course and destroy the weak, the
disease would also wipe itself out.
In addition to doctors, scholars believe studying in the science, technology,
engineer, and math (STEM) are enabling leaners to play a pivotal role in the
enhancement of technology, as well as in constructing a strong and efficient structure in
which people can live (Cavanagh, 2012). In fact, STEM education is the reason why the
world has been turned into a global village (Cavanagh, 2012). For example, a manager no
longer needs to travel all the way to China to meet suppliers when they can exchange
documents over the internet. Education develops the world, but the world has developed
education to a point where it is no longer serving its primary purpose in the United States
due to influence by neoliberal and conservative policies. The founding fathers of the
United States believed that the purpose of primary education was to bring citizens to the
understanding of what it means to be a human being and a productive member of society
(Sloan, 2012). Also, they believed that a productive citizen would serve the social needs
of society, contribute to the economy, create an effective work force, and develop the
intellect (Sloan, 2012).
If one posed the question of the purpose of education to U.S. university
administrators, educators, parents, students, policymakers, community members, and
entrepreneurs, the answers would vary (Sloan, 2012). The primary purpose of education
has focused on preparing students to live in democracy, integrating immigrants into
society, preparing workers for the industrialized twentieth century, and teaching religious
40
doctrine. Education institutions in the twenty-first century are preparing learners for the
future in a society that is rapidly being alternated to develop skilled adults to be lifelong
learners, to develop emotionally healthy adults who can engage in meaningful
relationships, and to compete in a global economy society (Sloan, 2012).
Today in the United States neoliberal and conservative policies have given
corporate bodies a wonderful opportunity to turn education into a place where they
process employees to be obedient to the corporate bodies’ policies and to have limited
rights to change the scenario (Sloan, 2012). Lastly, education in urban communities seem
to be failing in its purpose to produce citizens who are productive and responsible in a
democratic society (Sloan, 2012). Meiksins (1995) proposed that education cannot
produce responsible citizens in a democratic society if the education system does not
train students in the knowledge, understanding, and commitment needed values that are
necessary to sustain a democratic society. If the society expects students to know,
understand, and commit themselves to values that promote democracy, then the education
system should be realigned to include policies or strategies which enhance commitment
to democracy.
Furthermore, in most cases, teachers merely follow the directions that are
provided in the circulars supplied to every school by the government. The government is
responsible for regulating the improvement of education because of the policies that are
used by the management to instruct teachers on how to conduct themselves. Chicosky
(2015) argued that neoliberal policies have interfered with the primary goal of education
through the creation of policies and strategies such as the charter schools that are treated
differently from other schools. Neoliberal policies have created a scenario in which
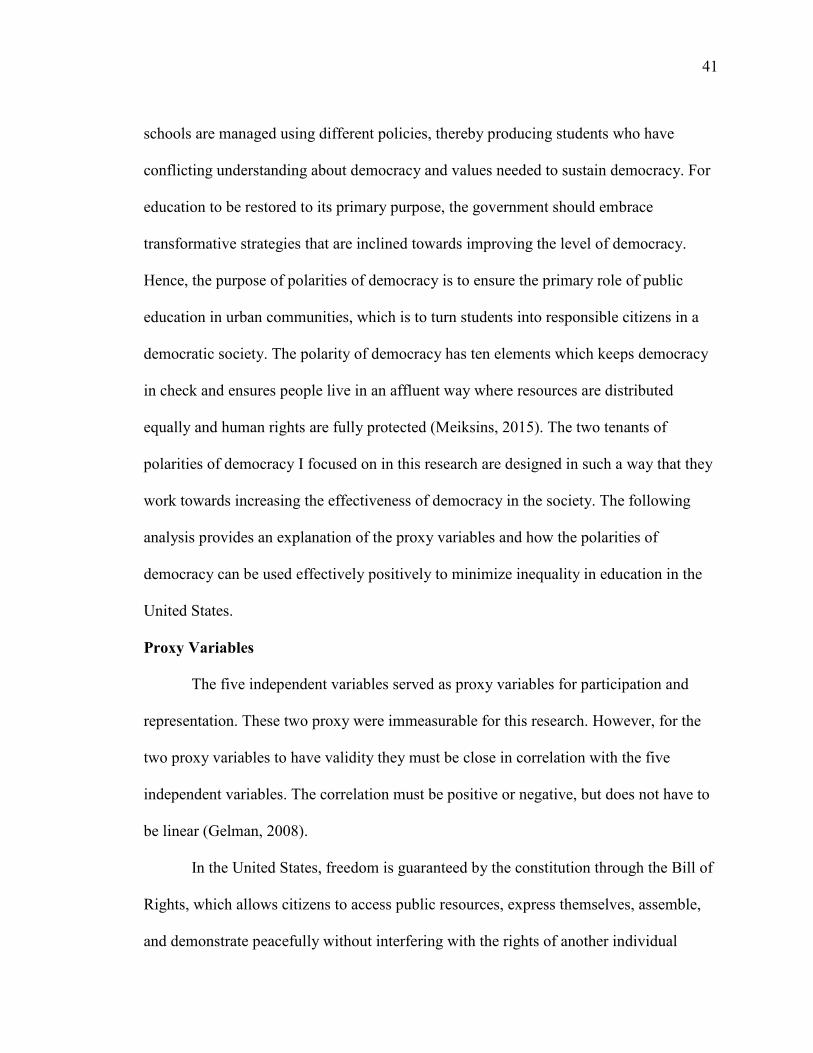
41
schools are managed using different policies, thereby producing students who have
conflicting understanding about democracy and values needed to sustain democracy. For
education to be restored to its primary purpose, the government should embrace
transformative strategies that are inclined towards improving the level of democracy.
Hence, the purpose of polarities of democracy is to ensure the primary role of public
education in urban communities, which is to turn students into responsible citizens in a
democratic society. The polarity of democracy has ten elements which keeps democracy
in check and ensures people live in an affluent way where resources are distributed
equally and human rights are fully protected (Meiksins, 2015). The two tenants of
polarities of democracy I focused on in this research are designed in such a way that they
work towards increasing the effectiveness of democracy in the society. The following
analysis provides an explanation of the proxy variables and how the polarities of
democracy can be used effectively positively to minimize inequality in education in the
United States.
Proxy Variables
The five independent variables served as proxy variables for participation and
representation. These two proxy were immeasurable for this research. However, for the
two proxy variables to have validity they must be close in correlation with the five
independent variables. The correlation must be positive or negative, but does not have to
be linear (Gelman, 2008).
In the United States, freedom is guaranteed by the constitution through the Bill of
Rights, which allows citizens to access public resources, express themselves, assemble,
and demonstrate peacefully without interfering with the rights of another individual
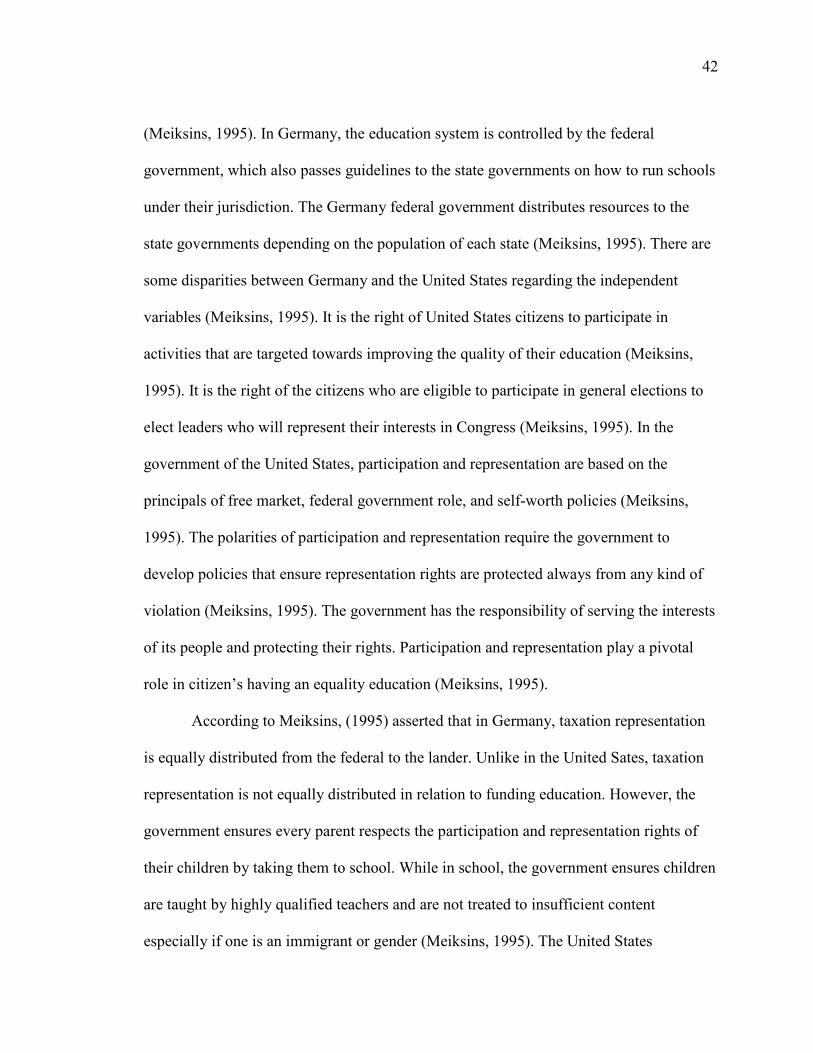
42
(Meiksins, 1995). In Germany, the education system is controlled by the federal
government, which also passes guidelines to the state governments on how to run schools
under their jurisdiction. The Germany federal government distributes resources to the
state governments depending on the population of each state (Meiksins, 1995). There are
some disparities between Germany and the United States regarding the independent
variables (Meiksins, 1995). It is the right of United States citizens to participate in
activities that are targeted towards improving the quality of their education (Meiksins,
1995). It is the right of the citizens who are eligible to participate in general elections to
elect leaders who will represent their interests in Congress (Meiksins, 1995). In the
government of the United States, participation and representation are based on the
principals of free market, federal government role, and self-worth policies (Meiksins,
1995). The polarities of participation and representation require the government to
develop policies that ensure representation rights are protected always from any kind of
violation (Meiksins, 1995). The government has the responsibility of serving the interests
of its people and protecting their rights. Participation and representation play a pivotal
role in citizen’s having an equality education (Meiksins, 1995).
According to Meiksins, (1995) asserted that in Germany, taxation representation
is equally distributed from the federal to the lander. Unlike in the United Sates, taxation
representation is not equally distributed in relation to funding education. However, the
government ensures every parent respects the participation and representation rights of
their children by taking them to school. While in school, the government ensures children
are taught by highly qualified teachers and are not treated to insufficient content
especially if one is an immigrant or gender (Meiksins, 1995). The United States
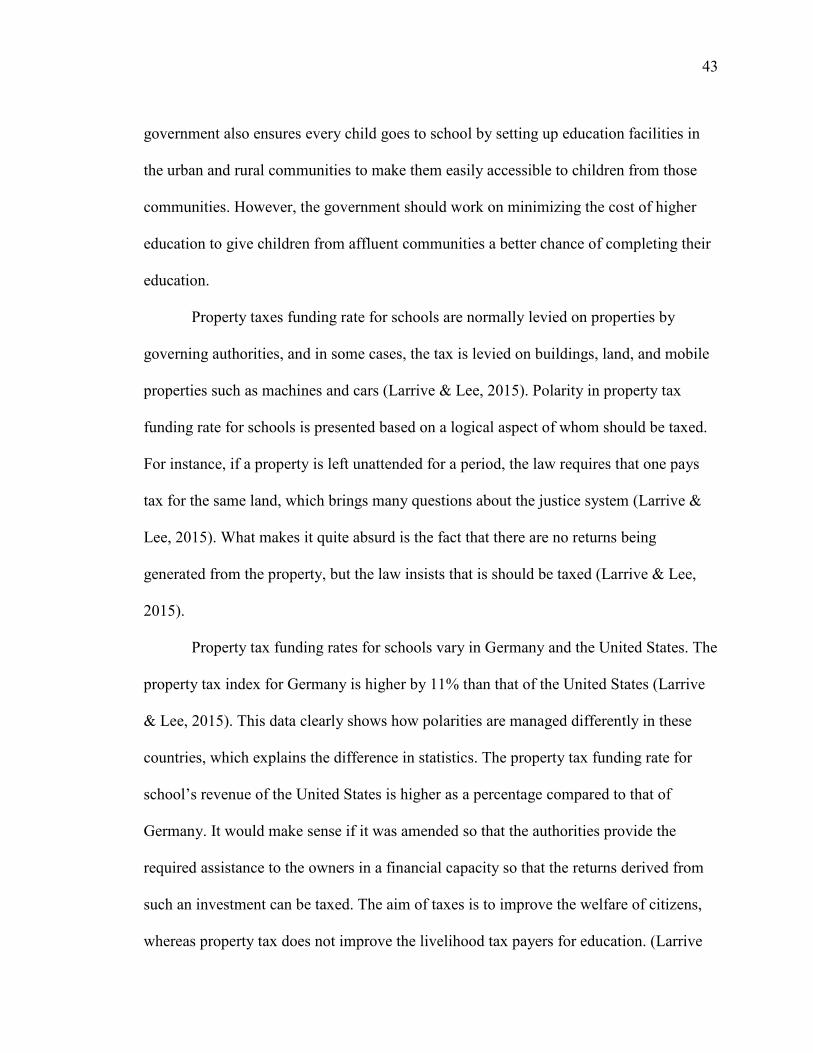
43
government also ensures every child goes to school by setting up education facilities in
the urban and rural communities to make them easily accessible to children from those
communities. However, the government should work on minimizing the cost of higher
education to give children from affluent communities a better chance of completing their
education.
Property taxes funding rate for schools are normally levied on properties by
governing authorities, and in some cases, the tax is levied on buildings, land, and mobile
properties such as machines and cars (Larrive & Lee, 2015). Polarity in property tax
funding rate for schools is presented based on a logical aspect of whom should be taxed.
For instance, if a property is left unattended for a period, the law requires that one pays
tax for the same land, which brings many questions about the justice system (Larrive &
Lee, 2015). What makes it quite absurd is the fact that there are no returns being
generated from the property, but the law insists that is should be taxed (Larrive & Lee,
2015).
Property tax funding rates for schools vary in Germany and the United States. The
property tax index for Germany is higher by 11% than that of the United States (Larrive
& Lee, 2015). This data clearly shows how polarities are managed differently in these
countries, which explains the difference in statistics. The property tax funding rate for
school’s revenue of the United States is higher as a percentage compared to that of
Germany. It would make sense if it was amended so that the authorities provide the
required assistance to the owners in a financial capacity so that the returns derived from
such an investment can be taxed. The aim of taxes is to improve the welfare of citizens,
whereas property tax does not improve the livelihood tax payers for education. (Larrive
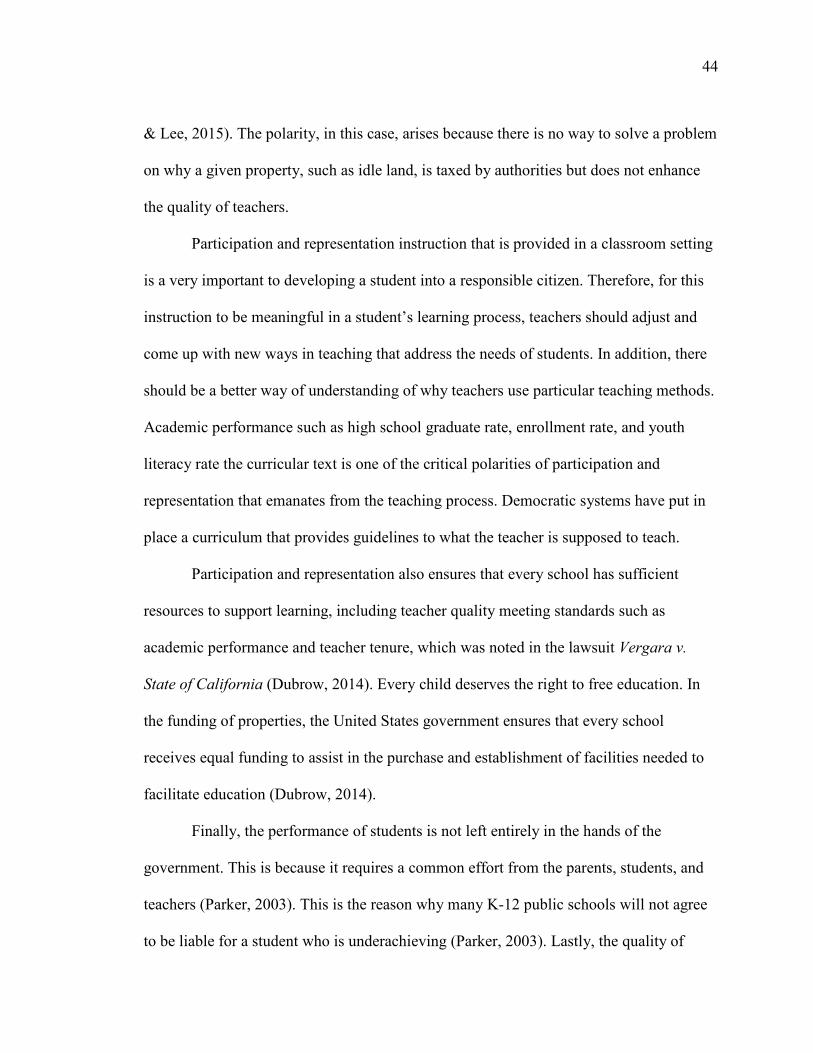
44
& Lee, 2015). The polarity, in this case, arises because there is no way to solve a problem
on why a given property, such as idle land, is taxed by authorities but does not enhance
the quality of teachers.
Participation and representation instruction that is provided in a classroom setting
is a very important to developing a student into a responsible citizen. Therefore, for this
instruction to be meaningful in a student’s learning process, teachers should adjust and
come up with new ways in teaching that address the needs of students. In addition, there
should be a better way of understanding of why teachers use particular teaching methods.
Academic performance such as high school graduate rate, enrollment rate, and youth
literacy rate the curricular text is one of the critical polarities of participation and
representation that emanates from the teaching process. Democratic systems have put in
place a curriculum that provides guidelines to what the teacher is supposed to teach.
Participation and representation also ensures that every school has sufficient
resources to support learning, including teacher quality meeting standards such as
academic performance and teacher tenure, which was noted in the lawsuit Vergara v.
State of California (Dubrow, 2014). Every child deserves the right to free education. In
the funding of properties, the United States government ensures that every school
receives equal funding to assist in the purchase and establishment of facilities needed to
facilitate education (Dubrow, 2014).
Finally, the performance of students is not left entirely in the hands of the
government. This is because it requires a common effort from the parents, students, and
teachers (Parker, 2003). This is the reason why many K-12 public schools will not agree
to be liable for a student who is underachieving (Parker, 2003). Lastly, the quality of
45
education in these two countries can be modeled in such a way that students in their early
childhood are encouraged and given curriculum that will make them value the importance
of education (Parker, 2003). This is by following the instructions provided in a classroom
setting. The polarities bring about tension in the form of responsibility, professional
culture, and a more proactive focus in the learning process.
Educational Inequalities in the United States
Public policy issues surrounding educational inequality have been in the political
forefront only a few decades since the beginning of the American educational system
(Zirkel & Cantor, 2004). The United States GI Bill of 1944 represents an early piece of
federal legislation aimed at remediating educational inequalities, which has had a lasting
impact for American citizen (Adamczyk, n,d). The GI Bill was a great source of
opportunity for veterans as it provided funding to go to college or to obtain training to
enter the workforce. The GI Bill also contributed to economic and social justice by
making higher education affordable to less wealthy citizens (Adamczyk, n,d)). However,
it has still been problematic as most GIs who have benefitted from the bill were men,
rather than women or underrepresented minorities. In fact, as Merryman
(1998) pointed out, although female Air Force service pilots flew and trained gunnery
recruits in WWII, but were not recognized as military personnel, and, therefore, were not
eligible for veterans’ benefits. African American veterans also struggled to secure their
right to educational benefits. Herbold (1994) wrote, “Staffed almost entirely by whites
empowered to deny or grant the claims of black GIs, the Veterans Administration (VA)
became a formidable foe to many blacks in search of an education” (p. 106). In addition,
this policy, meant to open American schools to more citizens, did not grant the schools
46
themselves autonomy. With the VA acting as a gatekeeper to education, the schools’ only
authority within this policy was to admit and educate the GIs who came through their
doors. This type of injustice changed the way civil rights were viewed.
In the 1952 presidential elections, education was a key issue in Eisenhower's
platform; this was a bold move given that, in 1950, the members of the National
Association for the Advancement of Colored People (NAACP), Topeka, Kansas, chapter,
challenged the separate but equal doctrine governing public education (Munger & Fenno,
1962, p. 193). Some authors have suggested that Eisenhower's presidency marked
the beginning of an era in which the politics of the civil rights movement could no longer
be avoided by the federal government (Munger & Fenno, 1962). The NAACP challenge
soon found its way into the United States Supreme Court docket with the Brown v. The
Board of Education of Topeka (1954) (Zirkel & Cantor, 2004). This case resulted in a
four-year battle that ended with the unanimous Supreme Court decision to desegregate all
schools (Zirkel & Cantor, 2004). The decision met with rejection and an escalation of
violence at some schools, the recently elected President Eisenhower (with the help of the
National Guard) forcefully executed the Court's decision (Zirkel & Cantor, 2004). This
highlights the potential for conflict between the macro- and micro-levels of education
policy. While federal policy mandated desegregation, district policy mandated
segregation. This landmark U.S. Supreme Court ruling would set off a socially tense
environment of political resistance that would need to address both civil rights and the
future of education (Zirkel & Cantor, 2004). Zirkel & Cantor, (2004) agreed with
President Johnson that, in response to this climate, citizens, regardless of race, should be
allowed their constitutional rights and took considerable steps at the federal level to
47
secure those rights, including educational rights, for all Americans. Thus, the
unprecedented efforts of President Eisenhower set the foundation for President Johnson
to continue to put equal education at center stage, despite the racial undertones of the
issue (Zirkel & Cantor, 2004).
Historical Overview of United States Policies to Combat Educational Inequality
Civil Rights Act of 1964. Rosenberg (2004) suggested that President Johnson
work with Congress to pass the Civil Rights Act of 1964, thus making the unequal
application of the law based on race illegal. The act ensured that education was to be free
of racial discrimination, and it further emphasized the need for desegregation.
Monumental for its time, the Civil Rights Act faced many criticisms before and after its
passage (Rosenberg, 2004). President Johnson had an approval rating of 80% in March
1964—the year the Civil Rights Act was passed (Rosenberg, 2004). President Kennedy's
popularity, before and after his death, was among the highest for any president and
garnered enough support to enable Johnson to advance this controversial, yet significant,
legislation.
Another key policy affecting education was the Elementary and Secondary
Education Act (ESEA) of 1965. According to Thomas and Brady (2005), the mission of
the ESEA was to provide equitable educational opportunities to the disadvantaged. The
legislation provided economic resources to enhance the learning of disadvantaged
students. The ESEA remains the principal financial source of federal support for
educationally-vulnerable schoolchildren (Thomas & Brady, 2005). However, since its
creation, the ESEA has been revisited nearly every five years. In 2001, it was revised to
its present form, the No Child Left Behind Act and came back to present form as ESEA
48
(NCLB, 2001; Thomas & Brady, 2005). This was the first piece of major educational
legislation to highlight not only the need to address inequalities in education, but also the
role of special interest groups, such as the National Education Association, and how those
groups play a part in the development and implementation of education policy (Thomas
& Brady, 2005). With the Civil Rights Act being enacted (1957 and 1964), the politics
surrounding race had been mitigated briefly after the passage of these pieces of
legislation (Rosenberg, 2004). Nevertheless, with the simple extension of ESEA failing to
pass in 1969, and subsequently passing in 1970, political tensions increased as President
Nixon sought to tackle the school busing issue (Berenyi, 2008). The administration took a
monumental step forward but continued to be confronted with issues of segregation
amongst race and ability.
1972-1975 legislative acts. The Nixon presidency spent considerable energy
promoting the Equal Educational Opportunities Act (1974), which prohibited the
segregation of students based on race, color, and national origin (Berenyi, 2008). The act
sought to restrict the busing of children to achieve racial balance and proposed not to
deny the assignment of a child to a neighborhood school (Berenyi, 2008). Eventually, the
act passed in 1974 but not before other key issues related to education (Berenyi, 2008).
While the legislative language seemingly sought to promote equality and racial balance,
the act did not deal with issues of disparity between different communities and allowed
significant segregation to continue.
The passage of Public Law 94-142 and the Education of All Handicapped
Children Act (1975) authorized institutions to receive federal funding to develop and
implement policies to provide children with disabilities free and appropriate public
49
education. The Nixon presidency also pursued Title IX legislation in 1972 and the
Rehabilitation Act of 1973 (Berenyi, 2008). Even though the 1964 Civil Rights Act
ended discrimination based on color, this legislation took those ideas a step further by
requiring all school-based programs that received federal funding not to differentiate
between students based on national origin, color, or race (Rosenberg, 2004).
Significant changes took place in 1975 regarding the U.S. education policies for
children with disabilities (Berenyi, 2008). All of them were aimed at providing equity of
educational access and outcomes for these children. These changes included major
improvements in the mainstreaming and inclusion of students with disabilities (Berenyi,
2008). While the policy was geared toward fostering access, the 1970s-ideology seemed
for students with disabilities to want the nation's education system to take a different
philosophical approach (Berenyi, 2008). Education would now take a change in its
approach to educating United States children.
Of note, one state that did change its approach towards restructuring its education
system was Massachusetts who currently is ranked first in education. Berenyi, (2008)
pointed out that, during the 1970s, there was a shift away from the philosophical
foundation that viewed learning as a means for enriching the total life experience to a
view that placed far more emphasis upon education as a value-added experience
(Berenyi, 2008). The value of education is often associated with enhanced socioeconomic
mobility, social-cultural attainment, and with the opportunity to obtain a myriad of
careers (Berenyi, 2008). By emphasizing this type of philosophy, constituents,
educational administrators, and politicians have added pressure to deliver the promises
associated with value, as well as a transparent accountability (Berenyi, 2008). Moreover,
50
as the national economy suffered and greater cries of tax relief ensued, it was inevitable
that the Reagan presidency would need to make drastic changes to attempt to provide
some amount of relief for constituents.
1981 Title I Act. According to Tillman and Scheurich (2013), the beginning of
the Reagan Presidency, in 1980, was a crucial moment in the policy of education in the
United States. The actions of the administration launched changes which involved the
federal government playing less of a vital role in providing both educational services and
public policy legislation, particularly as it pertained to education (Tillman, & Scheurich,
2013). Moreover, these changes were noted in 1981 when Title I was deregulated by the
Education Consolidation and Improvement Act. State and local governments were now
called upon to fund education (Tillman, & Scheurich, 2013). By 1983, out of concern for
a perceived failing educational system in the United States, the National Commission on
Excellence in Education was motivated to devise and publish the landmark A Nation at
Risk report (Tillman, & Scheurich, 2013). There was a dire necessity to not only
restructure and revise the training of teachers in the United States but also the standards
for higher education (Tillman, & Scheurich, 2013). Subsequently, these new standards
had a profound effect as well as positive implications for the future educational
performance of the nation (Tillmand, & Scheurich, 2013). Educational standards
continued in 1988 and 1989 with President George H. W. Bush placing high on his
priority list this point on contingency (Tillmand, & Scheurich, 2013). In 1989, the
President and state governors held an educational summit. The objective of the summit
was to create national goals for education and raise student academic achievement
(Tillmand, & Scheurich, 2013). Furthermore, this shifted the paradigm toward
51
prioritizing education and creating goals that would shape the Clinton Presidency
(Fritzberg, 2001). Education became critical on Clinton’s political agenda and marked the
continued need for inclusive legislation and policymaking.
The 2000 Goals Initiative. Clinton was well-known for his education policy
called Goals 2000 initiative (Fritzberg, 2001). The aim for 2000 was the Educate
America Act of 1994 (Fritzberg, 2001). The legislation provided resources to states and
communities to ensure that all students reached their full potential. Symbolic of the
standardization movement, this act moved the country towards a standardized view of
education in which the federal government played a more pronounced role (Fritzberg,
2001). Thus, a federal effort towards improving student learning through a long-term and
broad-based effort promoted both coherent and coordinated improvements in the system
of education throughout the nation at the state and local levels Educate America Act,
1994 (Fritzberg, 2001). This act encouraged states to develop standards that articulated
what each child in the state can do. In addition, it also supported state- and district-wide
implementation of school improvement plans that incorporate those standards. The act
called upon states to accomplish these tasks through competitive statewide grants
Educate America Act, 1994 (Fritzberg, 2001). The Republican Party was opposed to the
Act, Title III and considered it as an intrusion.
The Structure of Public Education-Residential Segregation
The United States educational system does not provide opportunities directly to
individuals, but instead first through districts, then schools, and finally through
classrooms and/or to groups of students. The economic segregation of the communities in
which students live and attend school can have the effect of channeling students into
52
social class outcomes (Colclough & Beck, 1986). The American public school system is
primarily established along residential lines, which means students generally attend their
neighborhood schools; however, race and class usually segregate neighborhoods
(Colclough & Beck, 1986). Colclough and Beck (1986) described three major
demographic trends that have had a considerable impact upon education: an absolute
decline in central city population; the poor, black and less-educated remaining in central
cities; and the higher income, highly educated whites moving to the suburbs. This trend
has remained constant in recent years, and the movement of more minorities to the
suburbs has not changed these patterns nor their consequences for education inequalities
(Colclough & Beck, 1986).
Some results of these trends for schools include economic differences and the
stigmatizing of some schools. Residential segregation along race and class lines creates a
differentiated school system with schools reflecting the homogeneity of the areas in
which they are located. United with organizational selection and differentiation within
schools (ability and curriculum tracking), small initial differences in achievement become
accentuated over time (Colclough & Beck, 1986). This produces a cumulative schooling
experience that results in a greater dependency between social origins and academic
performance with each additional year in the system (Colclough & Beck, 1986). Studies
on the effects of race and class structure provide data consistent with a pattern of
mechanisms operating independently from the education system (Colclough & Beck,
1986). Thus, further data suggest that the race and class segregation of school
communities is another mechanism causing class inequalities that continue from
generation to generation (Colclough & Beck, 1986). This study will thus fill the gap in
53
knowledge by comparing Germany to the United States specifically the State of
Massachusetts.
Overview of Germany Exemplar Policies to Combat Educational Inequality
Germany has a policy of segregating children in different schools and colleges
using an early tracking system from the elementary level. Secondary school education is
based on a three-tier school system (Topping, 2011). Even though there are some
comprehensive schools, known as Gesamtschule, most children stream into either the
Gymnasium, which provides a route to the university; the Realschule, where learners
undertake mid-level vocational studies; or the Hauptschule, for a basic secondary
education. Selection to these schools occurs at the end of primary education (Topping,
2011). Unfortunately, disabled children or children from poor backgrounds or immigrant
families may find it difficult to adjust for the five or six years taken at the elementary
stage to register better marks (Topping, 2011). Thus, they often end up in lower
secondary schools even though they may excel in stronger programs. Many students fail,
not because they have low abilities but because of extraneous outcomes. Children from
wealthy families tend to adjust to primary school and register better results. Thus, they
can enroll in the best schools in the country, while those from poor urban families’
grapple with enrollment in low standard schools (Topping, 2011).
The system described above mainly preserves the status quo, in which the affluent
in society have the best resource opportunities in education, while the poor, or otherwise
marginalized, must contend with limited educational opportunities and low standards of
education (Topping, 2011). There are indications that the middle class in Germany
prefers that things remain this way to favor their children (Topping, 2011). Because of
54
this, inequality is rampant in the country. Children from affluent backgrounds are four
times more likely to attend Gymnasium than children with similar grades from a working-
class background (Topping, 2011). Furthermore, according to Kultusministerkonferenz
(KMK), the federal educational body, children from immigrant families attend the
Hauptschule for a basic secondary education at a rate double that of German-born
children, even if they belong to the same socioeconomic class. The system thus
discriminates against children from poor backgrounds, the disabled, and those from
immigrant families (Topping, 2011). The three-tier system and early student selection
promote a social inequality that affects future opportunities pursued by the learner. The
country could reduce inequality, however, by applying a tracking system at a later stage
in the learning process (Topping, 2011). For instance, children could be assessed at the
end of secondary education, when it is possible to make better-informed decisions about
children’s abilities. In this way, the system becomes more accommodative of the learning
needs of all children (Topping, 2011).
The prevailing situation in Germany is quite different from that of the United
States. K-12 school funding schema challenges the United States. In many states, the
funding process is discriminatory. A report by the Schott Foundation for Public
Education, entitled A Rotting Apple: Education Redlining in New York City (2015),
revealed that schools in poorer communities receive fewer resources and employ less
experienced teachers than those located in affluent communities (Topping, 2011).
Schools in the most economically advantaged neighborhoods are funded very well, and
have the highest proportion of experienced teachers (Topping, 2011). The practice
promotes educational inequality. Such trends predispose children to certain educational
55
outcomes that later influence their lives. The funding gap deprives some students in less
funded schools from the platform they need to enhance their abilities, knowledge, and
skills. In the end, this leads to disparity in the achievements of students from the two
school types (Cordes & Miller, 2005). Therefore, society denies less privileged children
the opportunity to improve their socioeconomic status.
This study focused on K-12 primary education age groups 15-18. However, it is
worth noting that a university education is even farther out of bounds for students from
less affluent backgrounds. In recent years, the tuition fees for the country’s highest
quality universities have increased dramatically, in part because of reduced state funding
(Cordes & Miller, 2005). Universities have also prioritized admitting international
students with the capacity to pay higher tuition than in-state students, which has widened
the gap between marginalized students and educational attainment (Cordes & Miller,
2005). In this scenario, inequality only comes about because one is not able to pay tuition
fees. Tuition fees have been on the rise in recent years. This raises the bar for poor
students who find it difficult to pay tuition (Cordes & Miller, 2005). Further research can
be conducted after post-doctoral degree regarding inequality in American’s university
tuition fees.
Corollary Economic Perspectives
The OECD, (2015) published analysis indicated that monetary returns on
education are evident both in the United States and Germany. In the United States, there
is a causal relationship between income and the independent variables of property tax
funding rate, teacher quality, high school graduation rate, enrollment rate, and youth
literacy rate, particularly in the state of Massachusetts. Education is a determinant of
56
income levels. In both countries, employment discrimination is closely linked to
education and skills (OECD, 2015). From the perspective of the labor market, highly
educated people may have better jobs and better incomes than less educated individuals.
Such jobs may also provide health insurance and offer safer work conditions. Individuals
with a stronger financial position have better and equal funding for all schools, and
higher academic performance outcome (OECD, 2015). Such individuals also tend to be
employed in the technology-based, service sectors, where there are fewer employment
opportunities for those with less education (OECD, 2015). However, there are increasing
opportunities for educated individuals to provide quality services for increased wages
(OECD, 2015).
The National Center for Education Statistics conducted a study in 2014a,
regarding young adults ages ranging from 25-34 who worked full time (NCES, 2014a).
The study showed a proportion of young adults who worked full time all the year around
typically higher for those with higher levels of educational achievement (NCES, 2014a).
The authors found that 72% of adults with a degree worked full time, for all of 2013,
compared to 62% of the adults who completed high school, including those who a had
high school diploma or the equivalent (NCES, 2014a).
Although income cannot completely account for property tax funding rate, teacher
quality, high school graduation rate, enrollment rate, and youth literacy rate, it does play
a significant role in influencing one’s ability to achieve a quality education (Cordes &
Miller, 2005). The existing difference between educational groups helps to reinforce the
point that the under-educated lack the financial ability to access quality education
(Cordes & Miller, 2005).
57
Risk Aversion Perspective
Scholarly researchers have indicated that education could affect health, finance
and academics through risk aversion. The empirical relationship between risk aversion
and education points to the fact that people with high levels of education take more risks,
which means that they also may engage in risky behaviors that adversely impact their
academics performance (Rivlin & McClellan, 2014). This is true in both Germany and
the United States. The well-educated are willing to take the risk of investing in their
education, which enhances their academic performance (Rivlin & McClellan, 2014). In
relation to this, as stated previous in this chapter several studies indicate that people who
pursue higher education live longer than those with less education. According to the
OECD (2015) study, at 50 years of age, men in a high education group can live 5.6 years
longer than men in a low education group. This illustrates that the burden of education
inequality is greater for those in the less affluent working class bracket (Rivlin &
McClellan, 2014). For every additional year of education, there is an increased
probability of about 10% of individuals seeking specialist consultation (Rivlin &
McClellan, 2014).
Value for the future is a critical issue in the lives of American and German
citizens. Most people have a desire to live a longer life. Practically, however, this is not
always possible. Various factors contribute to how one perceives life including better
income, health insurance, and other resource outcomes such as education, which may
affect individuals’ incentives to invest in their health and longevity (Rivlin & McClellan,
2014). Since education provides people with a better future by giving them access to
better income, educated people may be happier and have a better economic enhances an
58
individual’s future lifetime utility (Rivlin & McClellan, 2014). From the OECD (2015)
study, based on this premise, better-educated individuals are at a higher likelihood of
investing in the protection of their futures. This is diametrically opposed to people
earning lower incomes who, unfortunately, end up placing less value on longevity and
engaging in uncertain behaviors (Rivlin & McClellan, 2014). Lastly, in such situations, as
people earn higher incomes, they potentially become willing seek quality education.
Prestige and Power of Democracy
Barbalet (2015) proposed that education gives a person a wide array of
serviceable resources that include prestige and power, which become vital in driving
individuals to embrace school funding and academic achievement initiatives. German
sociologist Max Weber created the Three Class Systems with class and party as separate
principle types (Barbalet, 2015). Weber established a multidimensional method to social
stratification, which reflects the interplay among prestige, power, and wealth (Barbalet,
2015).
Prestige and power are critical life elements in Germany and the United States
(Barbalet, 2015). With power, an individual has enhanced, equal school funding
distribution and higher academic performance. Prestige prompts a person to want to
achieve higher, and to enable other beneficial social conditions considered advantageous
to well-educated individuals (Barbalet, 2015).
Usually, those in lower education groups lack the prestige and power that come
with higher career accomplishments (Barbalet, 2015). Prestige and power also enhance
social networks. According to Barbelet (2015) social support systems, people who are
more educated develop larger social networks that enable them to develop better
59
platforms for physical, financial, and emotional support. This has a causal impact on their
health, quality of a paying job, and being able to compete globally.
According to Waters, & Waters (2015) in order to possess power, it must come
from the individual’s aptitude to manage numerous social capital. Equal distribution is
the concept that propels and controls the ideal of exchanging assets from the sphere of
wealth to the sphere of resources, which provides the capitalist purpose and the ability to
distribute directly and/or indirectly in order to have a return on educational quality
(Waters, & Waters, 2015). Friends and families can provide advice that enables one to
invest in health promotion, public school funding, and academic performance initiatives.
Through information sharing, it is much easier for individuals to understand the
importance of remaining educated. Potelly, this could work well in promoting longevity.
Lastly, in both the United States and Germany, education remains an integral component
of socioeconomic status. Therefore, the quality of a person’s education has a significant
influence on his or her overall academic performance (Kozol, 2012). It shapes
opportunity by providing knowledge and skills that allow individuals to gain ready access
not only to good jobs, but also to information and resources for good health.
Restated Key Variables and Concepts
This chapter presented a comprehensive review of the current literature that
outlines studies connected to the chosen secondary methodology and interest method that
are compatible with the scope of this study. The education systems of Germany and the
United States are framed by the values of their societies and their ideas about education.
Thus, these values provide a symbolic measure of the social culture boundaries that
60
surround students and their differences in access to opportunities and resources within the
curriculum of the school system (Powell, 2009).
As research evolves and policies are implemented, educational inequalities
continue to emerge in the classification system. Powell (2009) proposed these systems
affect the growing shifts in the values of education and the state of the society Germany
and the United States utilize different models in how they identify, categorize, and
subsequently provide educational support. The state of Germany’s welfare is primarily
contingent upon family, social insurance, redistribution, and integration (Powell, 2009).
Schooling in Germany serves many purposes including enhancing one’s life while
simultaneously sustaining differences in status to build homogenous groups. A student’s
school placement is heavily dependent on their previous academic achievement and
thereby lends support for the student to develop their natural talent or aptitude regardless
of the level of education (Lenhardt, 2005). German education incorporates the
categorization of students into groups based on the type of secondary school they attend.
They are not designated and separated to receive additional educational support.
Conversely, many United States schools implement gifted, talented or exceptional classes
(Lenhardt, 2005, p. 27). Moreover, German students are characterized less by their
individual persona and more on the type of school that they attend, which is strongly
influenced by the evaluations and recommendations of teachers (Lenhardt, 2005, p. 27).
Several educational scholars, such as Fuchs, Krueger, & Sommer, (2010) provide
insight into the educational systems of the United States and Germany. After World War
II, Germany employed a democratic order that resembles the liberal and individualistic
ethos of America; although America itself has adopted minimal to no change over the
61
past two centuries (Karp, Banducci, & Bowler, 2003). The United States prides itself
more on the system of competitive individualism in which successes or failures are based
on one’s own meritorious performance (Karp et al., 2003, p. 272). This idealization of
individuals having opportunities has led to one of the world’s best funded-school systems
(Karp et al., 2003). The United States makes a concerted effort to provide both primary
and secondary education, and even tertiary education for some groups such as the
military, including its veterans. Karp et al, (2003) asserted compared to Germany, the
United States has more of a financial investment in education as the federal government
has played an integral role in the mandate for increased numbers of both special and
compensatory educational programs, such as Head Start, Start Making a Reader Today
(SMART), and Special Education Program (SEP).
The foundation for government spending on education was laid in the period
between 1850 and 1920, in which the schooling laws that govern and guide America’s
public schools were enacted (Karp et al., 2003). It is one of the most inclusive
educational entities in the world as it welcomes students from varying walks of life
regardless of class, origin, heritage, or religious affiliation (Karp et al., 2003).
Nonetheless, this system is not without flaws. Unfortunately, all children are not afforded
complete access to a high quality public education, which, in turn, results in a difficult
reality for many adults. Historically, education policy-makers, such as Presidents Johnson
and Clinton, have strived to reflect integrative values of equal opportunity to attain
independence as it pertains to education (Karp et al., 2003). The federal government was
subsequently employed to diffuse the conflict and struggle that prevented public school
integration solely based on race (Karp et al., 2003). However, this crucial action was not
62
taken during the timeframe in which this country experienced racial segregation in the
South.
The educational goal of the American school system is to maintain the democratic
values which Thomas Jefferson felt an educated citizenry needed to maintain the
constitutional form of democracy that governs the United States (Coleman, 1968). This
was affirmed in the 1954 landmark case of Brown v. Board of Education. Nonetheless,
issues of integration and diversity continue to be debated as practices focus on either
striving to reach student’s individual goals or ensuring that collective standards are
achieved (Coleman, 1968). This is particularly important in a country in which
immigration brings a unique set of cultural, religious, and even linguistic factors to the
challenge of providing a public-school system that is comprehensive and maintains the
strong belief of equality of educational opportunity (Coleman, 1968). Job opportunities,
tuition cost, and exceptionally large investments rest on striving to level the playing field
for students. Nonetheless, it is difficult to grapple with the fact that unequal education
opportunities are not merely tolerated; they are even celebrated as students receive
rankings for their academic achievements or athletic agility (Coleman, 1968). It is
important to note however, that those to the left or right of a bell curve deserve additional
support. These support services are based on the resources that serve that community.
The United States has experienced a shift in access to healthcare and education
equality, especially in the state of Massachusetts. Currently, the focus is seeking to
develop personality (Coleman, 1968). Students are now encouraged to explore their
potential with the intention that the Massachusetts education system will make it
incumbent to not only acknowledge but also compensate to ensure that the best
63
performance is given. This perspective contradicts the former logic to track students
which, taken to the extreme, might lead to all children being individually tutored
(Carlson, 1993). The federally mandated Individualized Education Program (IEP), under
which every school must develop an IEP for each of its special education students, could
be considered by federal law to be making an idealistic solution that outlines legal terms
for the IEP (Carlson, 1993).
According to Carlson (1993) Germany and the United States share meritocratic
values that are characteristic of Western culture and the premise for capitalism. These
values include success amongst individuals and their ability to perform, with social
justice as a paramount value. The balance of these values not only has relevance but also
is dynamic and fluid and is reflected in the counties’ education systems (Carlson, 1993).
The education obtained in America is designed to provide equal opportunity to stimulate
competition, while German education capitalizes on the historic perspective of attaining
status that is appropriate and that can develop vocational training and occupational
growth (Carlson, 1993).
Educational inequality results in stigmatization in both countries, and the debate
over educational inequality therefore increases in importance. Other factors may be
influential in understanding educational inequality. A clear view of the structural
conditions of students in the United States and Germany necessitates an analysis of
differences and similarities amongst the two sample countries (Powell & Soga, 2010).
Hence, this section also presents and analyzes the empirical research in the existing
literature around the predictor variables for property tax funding rate for schools, teacher
quality, high school graduation rate, enrollment rate, and youth literacy rate.
64
Property Tax Funding Rates for Schools
Taxes are incurred in many aspects including purchased commodities and the
income that individuals earn. For instance, value added taxes are common on retail
products while pay as you earn is deducted from the salaries and wages of employees Re-
Education; an Analysis of the Institutional System of the United States, 1918 (Lincoln
Institute, 2014). Corporate tax is deducted from companies while property taxes are
charged on property ownership. At an individual level, tax has an impact of reducing the
disposable income of the people thereby reducing their expenditures by adjusting their
budgets.
The findings of the Lincoln Institute (2014) study indicated that redistributive
effect of taxes has a positive impact on the quality of education in the United States
(Lincoln Institute, 2014). The Lincoln Institute (2014) study established that most school
programs are funded by property taxes in the United States. However, property owners in
district schools or community schools do not have many funds as compared to their
counterparts in wealthy learning institutions. This means that district schools are poorly
funded because in some instances, the district school property owners do not have enough
funds to finance school programs as compared to wealthy institutions. Therefore,
property taxes contribute to existing differences in the quality of education across regions
both in the United States.
Teacher Quality
Student performance varies in the United States. Achievement is regarded as the
measure of the quality of education in the United States and is said to be influenced by
the level of training and professionalism of the teachers (OECD, 2015). Germany and the
65
United States have grading systems used to determine student performance at each level
of primary education. In Germany, and in the state of Massachusetts, performance and
student achievements in high school graduation rate, enrollment rate, family income, and
youth literacy rate considered because of the necessity of the subjects’ skills in the
current global workforce. On the contrary, students’ progress in primary education is
graded as either fail or pass in the United States primary education structure (Education
Week, 2016). Lastly, the structure of K-12 primary education policy is similar in
Germany and Massachusetts; the aspects of student achievement, the five independent
variables have many related functionalities that result in a strong relationship with
education as a social institution. However, it is different between Germany and the
United States.
The PISA, under the auspice of the OECD, (2015) ranked Massachusetts
education as the best in the United States because of the research analysis they conducted
and used independent variables such as enrollment rate, high school graduation rate,
property tax funding rates for schools, teacher quality and youth literacy rate as the
methodology of measurement. The population of students most likely to enroll in K-12
schools, which is categorized to be between 15 and 18 years of age, was 106.2 million in
the United States. In addition, the United States increased the number of K-12 enrollment
by 6%, whereas Germany’s K-12 population enrollment declined (OECD, 2015). On the
other hand, the subpopulation of five to nineteen-year-olds comprised 20% of students in
America (OCDE, 2015). This is a higher percentage compared to that subpopulation in
Germany. In 2004, the population increase of students in this age group, who are in
primary and secondary school, increased by 6% in the United States while that of
66
Germany of the same year declined by less than 1% since (OCDE, 2015). The United
States has a net percentage gain in this subpopulation of 12%, which is higher than that of
Germany of 3% among students in postsecondary education (OCDE, 2015). In K-12
primary education in Germany, 100% of three- and four-year-old children were enrolled
as compared to 47% in the United States (DOE, 2016). In both the countries, the
enrollment between five and fourteen years of age is significantly relative since at this
age many students are attending schools. However, OECD, (2015) analysis illustrated
that compulsory schooling in Germany ends at the age of 18, and at 17 in the United
States, or when the student obtains a Graduate Equivalent Diploma.
High School Graduation Rate
The PISA defined high school graduation as an estimated percentage of students
graduate from an education level (OECD, 2015, & 2017). The unit of measurement that
was utilized was coded for gender, age, and race. The higher education graduation rates
are higher in Germany in comparison to the United States, but like Massachusetts. The
OECD (2015, & 2017) analysis illustrated number of graduation levels of higher
education below the doctoral level is higher for females than for males. It is pertinent to
note that the OECD (2015) data is from upper secondary as well as higher education.
When considering upper education levels, the United States has 76%, which is relatively
low compared to Germany, which is between 95% and 97% graduation levels. In the
United States, the ratio of male to female students in upper education had a difference of
6%, whereas that of Germany was a 1% difference, and, in both cases, were females
more prevalent. In addition, for the graduation rate of higher education below doctoral
level, the United States had 37% higher rate compared to Germany with 25% (OECD,
67
2015). Hence, the gap between male and females was higher in both countries and higher
in females than in males when compared. In this case, the net graduation rate is
calculated by dividing the number of graduates in each year, and dividing it by the
population at that age (DOE, 2016).
The typical graduation age varies between the two countries because of a
difference in the duration that it takes to complete the courses (OECD, 2013). For the
graduation rates in upper secondary education, by sex, Germany has a higher rate
compared to that of the United States. The big differences in graduation level are based
on policies that govern the education systems in these countries in relation to specific
instructions that help determine who has qualified in upper secondary school and
graduated (DOE, 2016). The nature of the high school graduation experience is because
of diversity and freedom that allows people to decide whether to further their education.
Enrollment Rate
The PISA divides the number of students as a specific gender, and age group for
enrolled education levels to include the size of the group enrollment rates that are
expressed in net enrollment rates (OECD, 2017). OECD (2009) analysis reported that the
higher education enrollment rates in the United States and Germany vary. By 2008, a
greater percentage of 25 to 34-year-old females had successfully completed their higher
education level as compared to that of males (OECD, 2009). The United States education
system uses two indicators to measure the level of achievement from 25 to 34 and 25 to
64-year-old adults who have completed their education levels (OECD, 2013). Within the
age bracket of 25 to 64, students were categorized into lower secondary, upper secondary
68
and higher education levels (OECD, 2013). In both the United States and Germany, a
large percentage of adults have completed their upper secondary education as their
highest level of education (OECD, 2013). Higher education attainment refers to those
programs that are intended to provide a sufficient background to enable students to take
on their first professional degree, bachelor’s and master’s, in the United States (DOE,
2016). In preparation for labor markets, students take programs that provide higher
technical education, whereas students who take on a research thesis as well as dissertation
papers attain doctoral degrees. Among the age groups of students who completed higher
education, the United States had a higher percentage compared to students in Germany
(OECD 2009). In the United States, the number of bachelor’s degree programs awarded
to females is higher than that awarded to male students, whereas in Germany the number
of male students is higher than that of females (OECD, 2013). The percentage of first
time degrees awarded to social sciences, business, and law was higher in the United
States than in Germany (OECD, 2012). Although, Germany utilizes its vocational track
to ensure all students are fully employed after obtaining their degrees or completing their
apprenticeships.
Youth Literacy Rate
The PISA defined youth literacy rate by taking the mean score of students to
ensure they can formulate, read, and write to a specific global economic standard (OECD,
2017). The indicator the OECD (2017) used to measure arithmetic, writing, and reading
comprehension youth is primary/secondary public schools; these comparisons are
represented through primary and upper secondary education. Furthermore, using this
69
indicator, United States Census Bureau’s Current Population Survey (2009) compared the
starting salary to the Gross Domestic Product (GDP) of a given country in question.
Restated Research Question and Hypotheses Summary
RQ: Comparing two equivalent urban groups (n = 150 cases) of full time high
school students from Massachusetts and from Germany, which variables
(enrollment rate, high school graduation rate, property tax funding rates for
school, teacher quality, and youth literacy rate) are statistically significant as
associated with quality education pathways of opportunities in U.S. urban
communities?
The answer to this research question lies in ideology. Philosophy pertains to any
set of ideas that strengthen and support a social, political, economic, or cultural system
(Kohut & Stokes, 2006). Each social stratification system has an ideology that
rationalizes the existing social structures and motivates people to accept it. In the United
States, the major ideology justifying education achievement is the American Dream,
which holds that equality of opportunity exists in the country and that anyone who works
hard enough will get ahead (Kohut & Stokes, 2006). On the other hand, anyone who does
not succeed must have caused his or her own failure. A mindset, whether it’s fixed or
growth can first be seen during early childhood which is fixed. It helps to cultivate one’s
behavior, ability to cope with and handle success or failure and ultimately define an
individual’s aptitude for happiness. Fixed mindsets reflect the premise that character,
intelligence, and even creativity, are static. They are essentially inherent with no
meaningful way in which one may be able to change these attributes. Therefore, success
is reached based on fixed standards that must be measured, if not exceeded, whereas
70
failure is avoided at all costs. On the contrary, growth mindsets permit one to develop.
Challenges often become motivation, and failures are stepping stones (Kohut & Stokes,
2006). Belief in this ideology is stronger in the United States than anyplace else around
the world (Haskins, Isaacs, Kohut & Stokes, 2006; & Sawhill, 2008).
Cavanagh (2012) suggested many United States political officials have a varied
view of the school policies that regulate the educational system, which can have an
impact on global market competitiveness. In fact, many scrutinize the marginal test
results of United States students in comparison to its international counterparts
(Cavanagh, 2012). Thus, many have invested in research to not only analyze but also to
apply the educational curriculums and teaching methods of high performing countries to
United States schools (Cavanagh, 2012). More importantly, as many leaders in the United
States grapple with and voice mixed sentiments regarding the educational performance of
American students, the weaknesses of the educational system in the United States cannot
go unaddressed (Cavanagh, 2012). Hence, the concern lends credence to the possibility of
future economic challenges the United States may need to face if the educational skills
are not effectively managed (Cavanagh, 2012). Stigler, (1999) as a professor of
psychology at the University of California, Los Angeles attested to the overarching
concern of the polarities of the United States educational system in his statement that
education is a complex system. As a professor who has researched the Japanese teaching
model, Stigler, & Hiebert (1999) accounts that it takes more than just looking at one
aspect of a country's educational model. One must be able to both understand how
performance results are produced and then interpret the results (Stigler, & Hiebert, 1999).
71
United States Secretary of Education Arne Duncan in (2012) stated he believes
that United States leaders must use critical thinking when analyzing another country’s
educational system as well as draw inference as to what works well abroad (Cavanagh,
2012). Cavanagh (2012) stated Secretary Duncan further concluded that what may be
practical in one country may not serve as a model for the United States. Nonetheless, the
author argued that if the model works, the United States should copy, adapt, beg, borrow
and steal successful practices (Cavanagh, 2012). Also, Cavanagh (2012) evaluated typical
mistakes that policymakers face when analyzing and interpreting the results of
international countries. They concluded that often only one aspect of the country's
educational system is focused upon and that the international countries’ educational
model was not applicable in the United States structure (Cavanagh, 2012). Cavanagh
(2012) argued that one must look at policies over the full distribution of countries, if you
want lessons. Furthermore, the author proposed that in having a single policy
interpretation approach, many policymakers fail to account for the influence of cultural
norms in both the effectiveness and implication of educational strategies that are often
characteristic of countries that seek and achieve high educational performance
(Cavanagh, 2012).
Given the critical approach from the scholarly analysis above, there is
contradiction in previous research. Hence, a statistical effect is part of a more widespread
concept of quantitative literacy (Golbeck, Ahlers-Schmidt, Paschall, & Dismuke, 2005).
It entails the understanding of the model regarding random analysis, and illustrates how
to execute straightforward results with percentages (Davids, Schapira, McAuliffe, &
Nattinger, 2004). The information is critical for supportive risks connected with unusual
72
health-related factors, and, as a result, for making informed decisions about health
(Cokely & Kelly, 2009; Nelson et al., 2008; Reyna & Brainerd, 2007). More than a few
international and national studies have incorporated items that measure a wider
perception of quantitative literacy: PISA (2003), the TIMSS, the National Assessment of
Adult Literacy (NAAL), and the International Adult Literacy Survey (Gonzales et al.,
2004; Kutner et al., 2006; Tuijnman, 2000). The majority of the research, however, is
inadequate to student populations and do not deal exclusively with statistical differences.
The K-12 grades in Germany, in contrast with the United States; it is possible that a
statistical relationship is likely in Germany (Rindermann, 2007). However, the alternative
hypothesis (H1) could also be true.
High concentrations of people who live in poverty have a different schooling
experience than those who live in more less affluent communities. Kozol (1991)
investigated inequalities and the educational experiences of children in six urban areas
across America, and found many differences. The author found that, in Camden, New
Jersey, schools spent $3,000 on each student, compared to $15,000 per student in the
more affluent neighborhood of Great Neck, Long Island. Kozol concluded that urban
schools are overcrowded and understaffed and have inadequate textbooks and educational
materials, and that in many areas, industrial pollutants are found on school playgrounds.
Due to funding differentials—particularly residential segregation—education systems
were found to be unconstitutional across America (Kozol, 1991). Since 1971, a series of
lawsuits have targeted states for not providing adequate levels of funding (Kozol, 1991).
Since 1980, 45 of the 50 states voiced their complaints to the Supreme Court regarding
unconstitutionality in education, particularly the inadequate funding (Kozol, 1991).
73
Although a more equitable distribution of education is important, critics have shown that
states do so at the expense of other publicly funded projects, such as welfare, health,
hospitals, and general services (Joumard, Mauro, & Debbie, 2012).
Property tax funding rates for schools play an integral role in the development of
educational outcome. The redistributive impact of property taxes value alters less
transverse nations than the nationwide variation in tax-to-GDP/revenues proportion
would suggest (Joumard, et al, 2012). More specifically, the correlation between tax
funding and educational quality is weaker in the United States regarding the property tax
funding rates for schools. Indeed, the United States shows little progressivity for
numerous reasons including: the tax mix favors social security and utilization taxes
donations over more progressive personal income and wealth and inheritance taxes; the
progressivity of tax schedules is limited (in Germany); or constitutional progressivity is
destabilized by tax expenditures that promote high-income groups (Joumard et al., 2012).
Redistribution of property tax funding has an impact on both Germany and the United
States. Additionally, property taxes play a key role in lowering overall income inequality
which will enhance academic urban achievement gap.
In the state of Massachusetts, research conducted by the OECD and PISA
revealed that about 50% of individual United States. Family income and parental
employment can be explained by their parents’ incomes (Isaacs et al., 2008). For
example, two-fifths of those born into the poorest 20% of families and two-fifths of those
born into the richest 20% of families remain in the same bracket as their parents when
they reach adulthood (Isaacs et al., 2008). This provides evidence to support the
alternative hypothesis
74
Ha: Comparing two equivalent urban groups (n = 150 cases) of full time high
school students from Massachusetts and from Germany, there is a statistically
significant association with quality education as a pathway of opportunities in
U.S. urban communities.
Variation in academic achievement, which is often considerable both over time
and cross-nationally, should be attributed overwhelmingly to structural effects: that is, to
shift in the distributions of the populations over the levels of status or the occupational
groups in classes in relation to which achievement is defined.
In Germany and the United States, the most important factor mediating academic
achievement is an individual’s educational outcome and other relevant individual
characteristics such as environment, IQ, and motivation. However, both countries have
not yet become true meritocratic societies in a sense that an individual’s social origins
and destinations are statistically independent once education is controlled (Breen &
Goldthrope, 2001; Marshall, Roberts, Swift, &, 1997). Moreover, the significance of
education in mediating mobility does not steadily increase over time. On the one hand,
the association between origins and academic achievement (controlling for the direct
effects of educational expansion) weakens (if at all) slowly (Breen, 2004). However,
recent studies have shown that the association between education and destinations is now
showing a tendency to strengthen (Breen, 2004). For some, the American Dream is a
reality—as one-third of Americans are upwardly mobile (Isaacs et al., 2008). For
immigrants, the United States remains a land of opportunity. Knowledgeable immigrants
on average earn more, and even poorly educated immigrants typically earn considerably
more than they would have if they stayed in their home countries (Isaacs et al., 2008).
75
Another one-third, roughly 50 million Americans, is downwardly mobile, and the rest
remain in the same social class as their parents (Isaacs et al., 2008). According to Isaacs
et al (2008) a major reason that the American Dream ideology can survive is that there is,
indeed, some upward social mobility. Given all the social forces that hinder mobility,
how can one explain why some people do indeed rise above their parents' social class?
Certainly, intelligence, hard work, and getting an education matter (Isaacs et al., 2008);
however, many intelligent poor children have no chance of going to college, and some of
the hardest-working people earn the lowest incomes.
Bettie (2003) spent nine months intensively observing and interviewing a
predominantly working-class high school. The author found that teachers and schools
treated students in ways that reinforced the students’ class status. Middle-class students
were tracked into advanced classes and celebrated for their academic achievements;
while students from stable, working-class homes were encouraged to take vocational
classes. In addition, minority students of all social classes suffered from discrimination
and low teacher expectations (Bettie, 2003). Students from poorer homes were ignored,
marginalized, and expected to fail. Nonetheless, some working-class students seemed
destined for upward social mobility (Bettie, 2003). These upwardly mobile students were
smart and hard-working, but they also benefited from resources not available to other
working- and lower-class students. Some belonged to mostly middle-class athletic teams,
or attended middle-class elementary schools through which they gained access to middle-
class peer groups and received “middle-class treatment” from teachers (Bettie, 2003, p.
80). Some students had older siblings who had gone to college and could help them both
financially and culturally. In addition, Bettie found that many middle and lower class
76
students benefited from attending a less resourceful high school in which college-track
classes were offered. Although these students lacked the financial resources available to
middle-class students, they still had the cultural resources that come with college-
educated parents (Bettie, 2003). Finally, some students were the children of immigrants
who had belonged to the middle class before emigrating.
In conclusion, there have been many theories that have been put forward to
explain the interrelationship between education and democracy and their impact on
building cohesive, sustainable, and socially fair communities. Bettie (2003) proposed
democratic societies such as the United States need to listen more to the needs of the
people regarding changing of education in urban communities. Provision is always on the
demands that are usually put forward by the society. This creates a link between
democracy and independent variables along with property tax funded rates for schools,
teacher quality, high school graduation rate, enrollment rate, and youth literacy rate.
Higher education must take the lead in building a strong democracy for any country
(Bettie, 2003). The other benefits of education are increased income, and an informed
society can only be realized if the democracy of that society is sound, meaning the two
cannot be divorced (Bettie, 2003). Finally, Bettie (2008) believe to properly achieve this,
democracy should be inculcated in the students by handling education matters
democratically, including in the measuring and assessment of learning outcomes.
Summary
This chapter has shown polarity patterns and trends in variables that may correlate
with educational inequality in United States and Germany. With the use of professional,
primary, and historical documents, the literature shows the importance of further
77
empirical research on the independent variables of enrollment rate, high school
graduation rate, property tax funding rates for schools, teacher quality, and youth literacy
rate. In relation to educational inequality. In relation to public policy, the literature review
showed progress in educational development in both Germany and the United States. As
mention in Chapter 2 scholars believe it is important disparities in education can
compromise the achievement of objectives related to the equality of opportunity.
Although an increasing number of studies have explored the effects of educational
inequality on student achievement and knowledge, policies affecting educational
inequality both in Germany and the United States have not kept pace with recent changes.
Scholars know even less about the effects of policy on the independent variables
examined in this study. This review outlined what is known about educational inequality
and the independent variables, identified literature gaps, and suggested the need for
additional research. In developing this concept, I have built this review on historical
scholarly studies on educational inequality in both countries. This review has considered
how the independent variables, which in turn, affects achievement performance in the
United States urban communities, with positive or negative outcomes.
The final section of this literature review discussed a variety of studies conducted
on the subject under review, and demonstrated that research remains scattered. Several
weaknesses of the research were identified in this review. Most of the studies looked at
only test scores and academics to determine if a society is progressing or declining. In
addition, in many studies, the empirical perspective was misconstrued with reporting of
academic performance scores. Moreover, previous research did not investigate whether
78
the five independent variables correlate and serve as a proxy variable for participation
and representation with educational inequality in the Massachusetts and Germany.
There remains a gap in the literature regarding what is known and has been
examined pertaining to the previously discussed variables. I addressed the United States
urban achievement gap and limitations identified and operationalize analytical concepts
reviewed by using quantitative research design to examine the relationship of the
independent variables of property tax funding rates for schools, teacher quality, high
school graduation rate, enrollment rate, and youth literacy rate. I have bridged this gap
through quantitative analysis. In Chapter 3, I present the details of the study’s
quantitative research design, including the justification for the setting, the design,
historical dataset, instrument, and unit of analysis.
79
Chapter 3: Research Methodology
Introduction
In this chapter I present the five independent and two proxy variables of the
polarities of democracy theoretical framework chosen for this study along with the
research methods and supporting rationale. This chapter also provides descriptions the
sources of data used in this research, data procurement methods, considerations for
sampling used in the research, and methods of analysis. In addition, the variables used in
this research and the rationale to support the use of those variables are presented, defined,
and discussed.
As discussed in Chapter 2, researchers have theorized over the interrelationship
between education and democracy and its impact toward building cohesive, sustainable,
and socially fair communities (Eide & Showalter, 2011). Democracy is a term that has
been used repeatedly in almost every part of the world, yet it is not a static term and is
subject to social evolution, which calls into question its long-term viability. As such, it
appears that the United States has developed neo-liberal policies that only benefit a few
people in the society while the middle and lower class continue to face education
inequalities at a higher rate (Chicosky, 2015).
The purpose of this quantitative empirical study was to ascertain whether there
was a statistically significant difference in the relationship between the independent
variables, which served as proxy variables for the polarities of democracy participation
and representation tenets, and educational inequality in urban areas of the United States.
Massachusetts education system outcomes and general United States outcomes were
compared with those from the benchmark of Germany. Utilizing secondary data, I
80
investigated the independent variables of enrollment rate, high school graduation rate,
property tax funding rates for schools, teacher quality, and youth literacy rate to
determine if a relationship exists between the independent variables and education
achievement in Massachusetts. A review of the literature indicated a need for research on
these variables in relation to educational inequality policies in the United States. The
literature review used Germany as the benchmark because of several factors such as that
Germany federally funds half of the public K-12 education to all citizens. The German
federal government ensures they have qualified teachers along with paying them a
competitive salary (OECD, 2015). In addition, the German education system is
progressive and successful. It is comparable to the United States in terms of the structure
of the democracy and governance (OECD, 2015).
The relationships between the independent variables of enrollment rate, high
school graduation rate, property tax funding rates for schools, teacher quality, and youth
literacy rate and educational inequality in urban areas of the United States were explored
to determine that there was an association among the five independent variables and that
all five variables were important in creating pathways to opportunities. This chapter
illustrates the elements of the research design and the steps that were taken to collect the
information. Considering that I used historical archival data, confidentiality has already
been considered. Validating how the data was analyzed is critical to the credibility of the
research findings.
Research Design and Rationale
In this quantitative study, I analyzed whether the five independent variables were
statistically associated with educational inequality in urban areas of the United States. By
81
doing this, I could determine what combination of variables were more important to focus
education policies on in urban areas. However, there was no statistically significant
difference among the five independent variables.
Participation and representation were used as proxy variables for this research.
The polarities of democracy assessment were advantageous in analyzing education
environment illustrating a positive social development using the independent variables.
Operational definitions of each variable and respective classification as independent
variables are presented below. Secondary data were used in this research. Secondary
sources of data, such as records of various statistical bureaus, were practical for this
research in helping to understand any variation of information collected regarding
independent variables. Additionally, there are no time and/or resource constraints with
the use of such data for this research. The following are the operational definitions of the
independent variables:
Independent variable 1—enrollment rate: PISA divided the number of students
into specific gender and age groups for enrolled education levels; the size of the group
enrollment rates were expressed in net enrollment rates (OECD, 2017).
Independent variable 2—property tax funding rate for schools: This
represented the value of tax that school property owners pay in support of school
programs.
Independent variable 3—high school graduation rate: PISA defined high
school graduation as an estimated percentage of students who graduate from school. The
unit of measurement that was utilized was coded for gender, age, and race (OECD, 2017).
82
Independent variable 4—teacher quality: Teacher quality influences learners’
academic achievement.
Independent variable 5—youth literacy rate: PISA defined this rate by taking
the mean score of students to ensure they can formulate evaluative statements, read, and
write to a specific global economic standard (OECD, 2017).
Property tax funding rates for schools. Property taxes are revenues collected by
government agencies based upon the value of property. The revenue is used for the
fulfillment of the needs of the local communities, including building and maintaining
public schools. The International Tax Competitiveness Index (ITCI) ranks the German
tax system 17th out of 34 nations and 13th in property tax (Pomerleau, 2015). The ITCI
ranked the United States tax system 32nd out of 34 nations overall and 29th in property
tax out of 34 nations (Pomerleau, (2015). Property taxes are predetermined amounts
mandated by government entities based on property value and mill levy for the region
(Pomerleau, 2015). The weight of the property tax variable is scored in comparison to the
property tax rate for schools of other nations in similar economic scenarios, which is a
standard practice (Lincoln Institute, 2014). This factor is important because inequalities
in educational opportunities have been found to have a direct relationship to the scale of
the property tax revenue collected by local government entities in Massachusetts
(Pomerleau, 2015). Comparatively, Germany funds education through the national
government so that all schools receive similar funding. The international tax ranking of
the United States will not change unless there are changes in the policies relating to
allocation of funding for K-12 public schools.
83
Teacher quality and academic achievement. Lincoln Institute (2014) research
has demonstrated that teacher quality and academic achievement (enrollment rate, high
school graduation rate, and youth literacy rate) are related to SES in Massachusetts. For
this research, SES was defined by classes divided into upper, middle, and lower classes.
Research has demonstrated that if children from families classified as lower class do not
achieve a higher level of education than their parents they can become stuck in that SES
level for another generation (Lincoln Institute, 2014). Thus, children from homes of
higher SES attend better learning institutions compared to children from families of lower
SES (Lincoln Institute, 2014). Additionally, students attending better learning institutions
also have higher quality teachers compared to students from poorer families (Lincoln
Institute, 2014). The argument will be made that the German academic system has an
advantage in that they direct students on a vocational or on an academic track. Students in
the vocational track gain valuable skills that enable them to find well-paying jobs and are
more competitive in global employment markets.
Research Design
I used a nonexperimental design framed by ANOVA to evaluate the relationship
between the independent variables previously discussed: enrollment rate, high school
graduation rate, property tax funding for schools, teacher quality, and youth literacy rate
in Massachusetts. I used ANOVA to explore the degree to which the five independent
variables had a statistically significant association with educational inequality in urban
areas of the United States, and to determine what combination of variables were more
important. This analytical approach was previously used to explore the relationships of
these same variables in schools in Germany and in the United States (Shavit, Arum,
84
Gamoran, & Menachem, 2007). McFatter’s (2017) research demonstrated that the
ANOVA model allows for a thorough comparative analysis of the independent variables.
Furthermore, the rationale for this study was based on conclusions drawn from Shavit et
al.’s (2007) research suggesting that there is a need for more comparative educational
research.
Results from this research could support an argument for specific policy changes
that could reduce educational inequality in the United States. Several studies have been
conducted exploring the relationship between educational inequality and the outcomes of
life and work skills among adults in the United States (OECD, 2013). However, the
findings of this research do not reflect current trends presented in the literature. As such,
many of the questions surrounding the large gap in the availability of resources needed
for academic success and achievement in life remain unanswered (OECD, 2013). I have
explored the degree to which the polarities of democracy theory apply to the United
States educational system. One potential outcome of this research by using ANOVA was
a new perspective on how these variables influence educational inequality in the United
States.
Methodology and Data Collection
The OECD started it first national testing and surveys in 2000 and they conduct
this assessment every three years (OECD, 2013). I used secondary data from 2010 thru
2015 to explore the relationship between the independent variables of enrollment rate,
high graduation rate, property tax funding rates for schools, teacher quality, and youth
literacy rate on the ability of people to access educational opportunities in Massachusetts
and in Germany.
85
The PISA secondary data sample populations from both Massachusetts and
Germany were 150 cases data taken from (representing 240 schools from Massachusetts,
and 150 random selected schools from Germany) which PISA used and selected utilizing
the PPS sampling. The PISA analysis coding consists of five groupings of school grades,
location of populace, race, and gender ( > 95% female). The sample consisting of 42
students from each school, aged 15 years, were sampled randomly (OECD, 2017).
Gender was coded as 0 = male, 1 = female, 3 = immigrants, 4 = black, and 5 = white.
However, if there were less than the targeted number of students available to meet age
eligibility criteria, all were subsequently selected (OECD, 2017).
A school sampling size of 150 is the minimum size set internationally to
counterbalance possible non-responses (OECD, 2017). Nonetheless, the 2015 United
States PISA exceeded the sample size with 240 schools (OECD, 2017). Data was
collected from two sources, public (2012-2013) and private schools (2011-2012), using
Common Core of Data and Private School Universe Survey, respectively (OECD, 2017).
Schools were selected in the sampling size if at least one grade (seventh -twelfth) was a
factor of the school. Moreover, schools participating in the study submitted a list of
eligible 15-year-old students (OECD, 2017). From this list, the sample size was compiled
by PISA using SPSS software version 21 developed by an international contractor.
I aggregated data files with the five independent variables and utilized PISA
secondary for the independent variables population size. I used G*Power analysis
utilizing the given secondary data to detect sample size and any Type I or Type II effect
of the sample size I was working with regarding the null hypothesis and the degree of
freedom (Gelman, 2008). Correlational research works to measures the degree to which
86
two variables are related (Gelman, 2008). This method of data collection will make it
possible for researchers to form predictions regarding the behavior of corresponding
variables in similar settings (Gelman, 2008). Specifically, the method focused on a
theoretical framework using a quantitative empirical research approach coupled with the
PISA analysis and dataset. The purpose in choosing these analytical approaches was to
examine the relationship between the independent and proxy variables utilizing the PISA
public school district dataset through ANOVA. The PISA utilized the PPS sampling
census data to gather the population for K-12 public school districts in Massachusetts.
Student achievement data provided a proxy measure of educational inequality. Schools
that provide a better quality of education produce students who achieve at higher levels.
Unit of Analysis
In this study, the unit of analysis in the PISA data set was K-12 public primary
schools in which the performance of students was measured by the independent variables.
The OECD and PISA study data has indicated consistent improvements in student
performance in literacy such as mathematics, sciences, and reading amongst German
students (OECD, 2009; 2011). Conversely, the 2000 PISA report indicated rapid decline
in performance in the United States (OECD, 2009; 2011). The data set I utilized was the
census data analysis by PISA, and PIACC. Lastly, the polarities of democracy theoretical
framework complemented the unit of analysis by illustrating that there is a need to
overcome education inequalities to build healthy pathways opportunities in urban
communities (Benet, 2013).
Property tax funding rates for schools have a considerable impact on the
independent variables development of proficiency in enrollment rate, high school
87
graduation rate, and youth literacy rate, in both the Massachusetts and Germany. Quality
in education enables learners to attain proficiency in the five independent variables.
Quality in education results from efficient modern structures, teachers who are properly
trained, and effective learning materials. Property tax funding rates could have a
significant impact on the education inequality of focus in this study. Additionally,
research has demonstrated that students need affluent opportunities to acquire the
necessary skills taught in school (Lincoln Institute, 2014). Improving pathway to
opportunities could allow students access to a quality education.
I hypothesized that each independent variable is correlated with reduced
educational inequality outcomes. Furthermore, it is hypothesized that the five
independent variables are linked to better educational quality in urban communities.
Should evidence be gathered to support this hypothesis, the argument could be made that
an education quality could affect urban students’ ability to acquire affluent skills through
academic achievement.
The OECD (2015) secondary recent research by has demonstrated a relationship
between teacher quality, academic achievement, and an adult’s ability to find gainful
employment. This research has also suggested that adults who have had more qualified
teachers have better skills than those who have not had any form of schooling (Lincoln
Institute, 2014). These results suggest that if students have better educational
opportunities they are more are contributed to affluent pathways to opportunities.
Independent variables enrollment rate, high school graduation rate, property tax funding
rates for schools, teacher quality, and youth literacy rate contribute to students’ resilience,
satisfaction with self-relationship, and well-being (DOE, 2016). Moreover, it is argued
88
that the independent variables influence the development of proficiency in enrollment
rate, high school graduation rate, and youth literacy rate in the United States. Quality
education enables learners to better attain the skills in reading, mathematics, science.
Quality in education can lead to more holistic outcomes of modern structures, well-
trained teachers, and effective learning materials.
Data Analysis Plan / Data Collection
The PISA data used in the study has been collected and synthesized through
previous research. The PISA data is considered open domain data, which is stated on
their website under terms and conditions. I analyzed the data utilizing SPSS software
version 23, which can carry out the regression analysis. Baker and Corcoran's (2012)
concept was employed to assess levels of property taxes in individual communities.
Given that secondary data was being used, most of the study consisted of analysis,
synthesis, and critique of existing data on educational achievement in Massachusetts and
Germany.
The materials and statistical data included data retrieved from the Bureau of
Statistics in Germany, pre-established groups from the OECD, and the United States’
representative population. The usage of sampling weights, complex multi-stage random
sample designs, and multiple proficiency estimates were required to perform an analysis
on the PIACC data (OECD, 2013). The secondary data collection involved the PISA data
set of a census analysis on public school districts.
Measure of Analysis / Study Sample Size
The polarities of democracy theory concept of seeing, mapping, accessing,
learning, and leveraging archival data from the PISA was utilized in this research. The
89
data sets consist of performance was n = 150 cases data taken randomly from 240 schools
from Massachusetts, and 150 schools from Germany. Given that secondary data was
utilized, no participants were recruited for this research project. The five independent
variables data measures were presented in the data set for both the United States and
Germany. I used ANOVA to determine if there is a statistically significant pairwise
association among the five independent variables and to determine what combination of
variables may be more important to focus education policies in urban communities of the
United States’ education system.
Sampling and Eligibility Criteria Procedures
The sample population was n = 150 cases randomly selected from PISA: 240
schools from Massachusetts, and 150 schools from Germany. The coefficient alpha for
this research was set to .05. In this research, coefficient alpha measured the internal
consistency regarding the reliability of measure for self-reporting measures (Gelman,
2008). For instance, if the alpha is set at 10% there could be a large possibility that the
null hypothesis could be incorrectly rejected, while an alpha of 1% could have a smaller
error in rejecting the null hypothesis (Gelman, 2008). Therefore, if one has a smaller area,
there is more of probability one will not reject the null, when in general one probably
should. This is known as a Type II error level of significance. Meaning, if one tries to
avoid a Type I error, there is more likely a Type II error could happen. Research scientists
have discovered an alpha coefficient level of .05 is normally a suitable balance of the two
challenges (Gelman, 2008). Research in hypothesis testing has two errors: Type I and
Type II errors. Type I errors support the alternate hypothesis if the null hypothesis is
considered true. In addition, a Type II error does not support the alternate hypothesis if
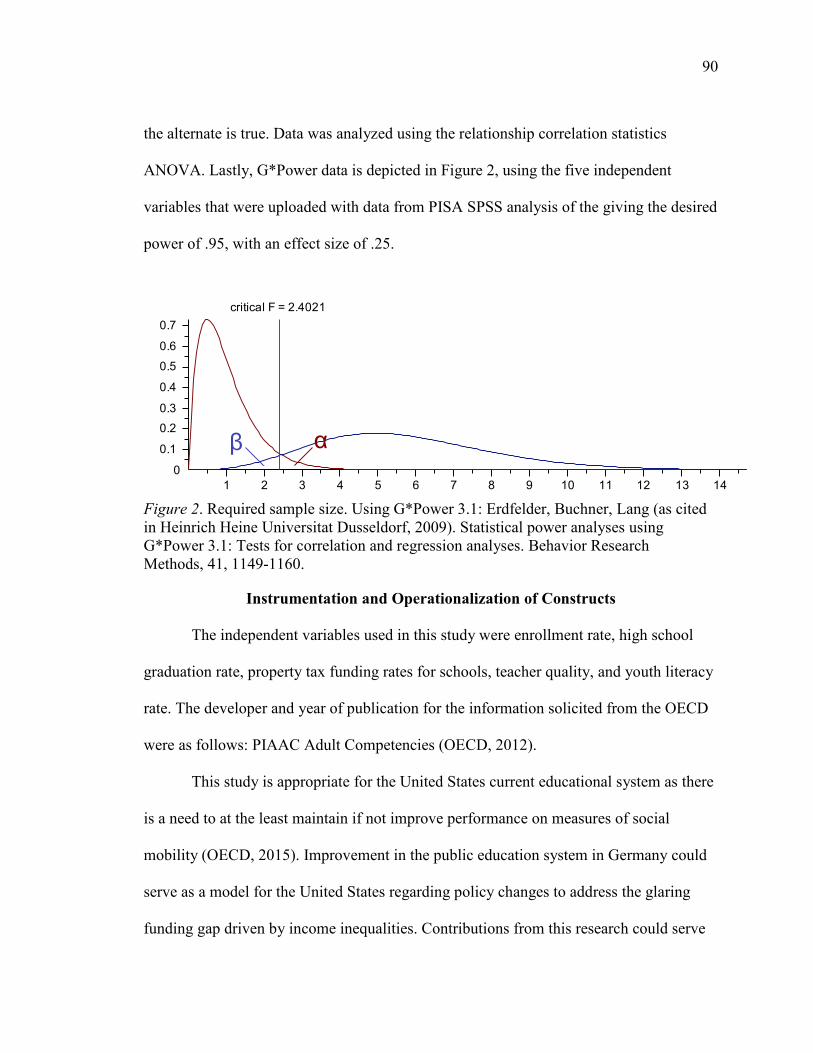
90
the alternate is true. Data was analyzed using the relationship correlation statistics
ANOVA. Lastly, G*Power data is depicted in Figure 2, using the five independent
variables that were uploaded with data from PISA SPSS analysis of the giving the desired
power of .95, with an effect size of .25.
Figure 2. Required sample size. Using G*Power 3.1: Erdfelder, Buchner, Lang (as cited in Heinrich Heine Universitat Dusseldorf, 2009). Statistical power analyses using G*Power 3.1: Tests for correlation and regression analyses. Behavior Research Methods, 41, 1149-1160.
Instrumentation and Operationalization of Constructs
The independent variables used in this study were enrollment rate, high school
graduation rate, property tax funding rates for schools, teacher quality, and youth literacy
rate. The developer and year of publication for the information solicited from the OECD
were as follows: PIAAC Adult Competencies (OECD, 2012).
This study is appropriate for the United States current educational system as there
is a need to at the least maintain if not improve performance on measures of social
mobility (OECD, 2015). Improvement in the public education system in Germany could
serve as a model for the United States regarding policy changes to address the glaring
funding gap driven by income inequalities. Contributions from this research could serve
1 2 3 4 5 6 7 8 9 10 11 12 13 14
0
0.1
0.2
0.3
0.4
0.5
0.6
0.7
critical F = 2.4021
αβ
91
as a catalyst to promote awareness of how we assess academic performance in the United
States. In addition to supplementing the current body of literature, this research may
provide another instance supporting the comparison of the United States to Germany
regarding issues that predict educational achievement. This research could also serve as a
model for policy change for many governmental institutions in the United States.
Difficulties in learning increase over time and are influenced by students’ individual
familial and cultural backgrounds. The above instrumentation data has influenced the
formation of the research questions and hypotheses.
Restated Research Questions and Hypothesis
The research questions for this study were developed with the intent of examining
the relationship between the independent variables. Data collected in K-12 public schools
in both Massachusetts and Germany was used in this research. Germany, as mention in
Chapter 1 was used as comparison data, has a higher international OECD ranking in
academic performance in literacy. I compared the levels of the independent variables to
determine if there is a statistically significant association among the five independent
variables and to determine what combination of variables may be more important to
focus education policies on in urban communities of the United States education system.
Research Questions
The central research question for this study is:
RQ: Comparing two equivalent urban groups (n = 150 cases) of full time high
school students from Massachusetts and from Germany, which variables
(enrollment rate, high school graduation rate, property tax funding rates for
school, teacher quality, and youth literacy rate) are statistically significant as
92
associated with quality education pathways of opportunities in U.S. urban
communities?
H0: Comparing two equivalent urban groups (n = 150 cases) of full time high
school students from Massachusetts and from Germany, there is no
statistically significant association with quality education as a pathway of
opportunities in U.S. urban communities.
Ha: Comparing two equivalent urban groups (n = 150 cases) of full time high
school students from Massachusetts and from Germany, there is a statistically
significant association with quality education as a pathway of opportunities in
U.S. urban communities.
The use of sampling weights. According to Owen, & Zhou (2000) sampling
weights are designed to correct the inadequacies of a sample that could lead to biases in
the data. There are imperfections in data sets that consist of non-coverage of a specific
aspect of a population, units with unequal probabilities, and the need for weighted sample
distribution adjustments of essential variables of interest in a data set (Owen, & Zhou,
2000). In this research, the PISA sampling weights models are complex. The secondary
data sampling is gathered with unequal selection probabilities that are connected to the
variables values after the conditioning of all the design data (Owen, & Zhou, 2000;
OECD, 2012). Disregarding the secondary data sample selection method in the
presumption development may lead to misleading results.
The complex multi-stage random sample design. The multi-stage random
sample design is a multifaceted survey sampling methodology that entails information
gathering of population sample units via several stages or phases of
93
categorization/selection (Owen, & Zhou, 2000). The OECD and PISA developed a
random sample design that involved a random sampling of the population through a
random drawing of subjects (OECD, 2013). Speed and convenience is key for using the
complex multi-stage random sample. Typically, larger data collection efforts will utilize a
multi-stage sampling methodology as the method is less expensive (OECD, 2013).
Lastly, using the polarities of democracy two pillars for this research were beneficially
from the multi-stage sample.
Construct Validity and Reliability
The validity of research depends on the accuracy of the research. The research
methods used in this project are considered valid as they were used to research these
questions (Farkas, 2006). The PISA results have a high measure of validity, and
reliability. The survey was conducted by a reputable organization, the Organization for
Economics and Cooperation Development, which is known for having conducted several
related studies (Farkas, 2006). However, many aspects of the OECD study may contain
biases related the purposes of this research. The PISA/PIAAC study is a nationwide
survey, conducted within countries that are members and non-members of the OECD,
targeted to gage the scholastic performance of young adults, 15 years of age or older, on
measures of youth literacy. Schlosser (2009) contended that in assessing trends in
education and academic achievement researchers should evaluate the fluctuations in
income, inequality and poverty after the Second World War in the United States.
Moreover, the survey design had to take into consideration that the data includes two
countries. While the focus of this study was based on public schools in Massachusetts,
94
the OECD rankings and standards are based upon data collected in several developed
countries.
The definition of poverty varies by region in the United States, and it can be
difficult to establish an agreeable definition for the concept. Researchers have spoken of
the difficulty to define poverty, due to conceptual complexity and the difficulty in
quantitatively measuring the concept (McCall, 2013). The overall education inequality
could be argued as being important predictors of educational quality due to the
relationship of the five independent variables that serves as proxy variables for
participation and representation. Also, the methods used for determining property tax
rates in both countries are difficult given that Germany has different methods for
establishing and valuing property ownership (Schlosser, 2009). Institutional Review
Board (IRB) approval is needed for this research. However, the process will not be
lengthy because the PISA/PIAAC data are open domain sources. Chapter 4 and 5 will
allow readers to imagine how complex education inequality in the United States and what
policies needed to be address to shape this holistic challenge.
Confidentiality Assurance
Considering that PISA/PIAAC database is open domain, the confidentiality
agreement was an issue. Furthermore, only the PISA/PIAAC organization codes were
inserted into the main Excel spreadsheet. I utilized the PISA/PIAAC dataset and the
assigned codes. The PISA, and PIAAC data are open domain. To ensure confidentiality,
PISA, and PIAAC researchers and research supporters were the only ones who had the
right to use both bases of information. Collected information from PISA database are
stored in an external hard and computer drive, along with CD-ROMs. Data collected
95
during this research will be maintained confidentially. Data collected in this research
potentially could be published in peer-reviewed, scholarly, and scientific journals or
displayed at professional, and scientific meetings; nevertheless, no identifying data will
be used in this research for commercial distribution.
Summary
Quantitative research design was selected for this empirical research because the
structure of the central research question (Hunter, & Leahey, 2008). Past research designs
and methodologies have indicated the approach to education in Germany is more efficient
and results in higher levels of educational attainment. The five independent variables
were selected to explore the differences to determine if there is a statistically significant
association among the five independent variables and to determine what combination of
variables may be more important to focus education policies on in urban communities of
the United States education system.
Gautier, Teulings., & Van Vuuren (2009) stated one purpose of researching public
policy issues is to improve the well-being of people by considering potential social or
political reform. Scholarly researchers have stressed the importance of including pathway
to opportunities such as, skilled job-to-job transitions in an analysis of labor market flows
(Gautier et al., 2009). The inability to secure a job to provide income sufficient to sustain
one's self can create many deficits such as a lack of opportunity (Gautier et al., 2009).
Scholarly researchers have debated whether lack of pathway to opportunities, income
inequalities, lack of initiative, or failure to capitalize on available programs as main
causes for education inequality (Gautier et al., 2009).
96
The procedures to data collection and analysis of the said information was
explained in this chapter. When viewing this study in larger context, the assumption has
been made that education has a direct relationship with earning potential. Research has
demonstrated that in the United States, education has a direct relationship with earning
potential (Powell, 2003). White (1982) concluded that there is no significant relationship
between socioeconomic status and academic achievement. Chapter 4 of the study
presented results of the ANOVA and conclusions drawn from the secondary sources of
data. Conclusions from this research and recommendations for further research will be
presented in Chapter 5.
97
Chapter 4: Results
Introduction
In Chapter 4, I present the results of this study consisting of a descriptive analysis,
correlational analysis, statistical assumptions, and ANOVA analysis for the central
research question. A quantitative empirical design was used to ascertain if a significant
statistical association in the relationship between the independent variables as proxy
variables of polarities of democracy participation and representation tenets; the
theoretical frame work was used as a means for comparing the Massachusetts education
system with the larger U.S. system and using Germany as the benchmark. The
quantitative research consisted of an ANOVA model to measure the relationship of the
five independent variables enrollment rate, high graduation rate, property tax funding rate
for schools, teacher quality, and youth literacy rate with educational inequality in urban
areas of the United States. The secondary research sources were used to achieve the key
objectives and to support the empirical portion of the study. The choice of research
design provided a combination of pertinent past research findings to determine if there is
a statistically significant association among independent variables and educational
inequality and to determine what combination of variables may be more important to
focus education policies on in educational systems in urban communities of the United
States. To accomplish the purpose, a central research question was developed as follows:
RQ: Comparing two equivalent urban groups (n = 150 cases) of full time high
school students from Massachusetts and from Germany, which variables
(enrollment rate, high school graduation rate, property tax funding rates for
school, teacher quality, and youth literacy rate) are statistically significant as
98
associated with quality education pathways of opportunities in U.S. urban
communities?
H0: Comparing two equivalent urban groups (n = 150 cases) of full time high
school students from Massachusetts and from Germany, there is no
statistically significant association with quality education as a pathway of
opportunities in U.S. urban communities.
Ha: Comparing two equivalent urban groups (n = 150 cases) of full time high
school students from Massachusetts and from Germany, there is a statistically
significant association with quality education as a pathway of opportunities in
U.S. urban communities.
To broadly answer this central question, I organized this chapter into six sections:
introduction, secondary data collection, independent variables, main analysis, results of
the central research question, and transition to Chapter 5. The introduction consists of an
overview of the chapter organization. In the data collection section, I explain the
procedures used in PISA secondary data collection. Because of the 2015 OECD results
published in March 2017, the secondary data collection encompasses some minute
corrections for adjustment in the five-year research time span, target population, and
sampling data for Germany and the United States. Therefore, some of the data set
analysis was updated to reflect the 2015 results.
Regarding the other four sections, I divided the results section into subsections:
results in Massachusetts and results in Germany. The subsections feature a statistical
assumption trailed by a Pearson’s correlation of analysis. Once I illustrate the
correlational analysis for the five independent variables, I presented the outcome of the
99
ANOVA analysis. However, each section has a dedicated roll to the central research
question. Thus, with some of the data collection being updated with the 2015 results, I
calculated descriptive statistics for all the statements of the research and tested the
hypothesis through ANOVA. The analysis also included descriptive statistics. In the final
section of this chapter, I summarize the results and preview Chapter 5.
Secondary Data Collection
I received Walden University IRB approval (number 06-22-17-0352141) to
conduct the research. I accessed the NCES-PISA/PIACC database and downloaded the
SPSS Excel spreadsheets to sort and filter the needed information for my research. In
addition, I created an Excel database spreadsheet with the central research question and
the five independent variables to calculate and analyze the average and standard deviation
numbers.
In general, this research made use of secondary data obtained from sources such
as Massachusetts Department of Education, United Nations Educational, Scientific and
Central Organization (UNESCO), OECD-NCES, PISA, and PIACC. The OECD, through
the auspice of PISA and PIACC, collected their data using structured online
questionnaires and interviews. The secondary questionnaires and interview techniques are
significant for the study as they enhance my understanding of educational and
professional skills inequalities between the United States and Germany, along with
presenting analysis of the most educationally progressive countries.
The PISA secondary data sample populations from both Massachusetts and
Germany were n = 150 cases data taken from 240 schools in Massachusetts and 150
randomly selected schools from Germany, which they selected utilizing the PPS
100
sampling. The PISA analysis coding consists of five groupings of school grades, location
of populace, race, and gender (> 95% female). The sample consisting of 42 students from
each school, aged 15 years, were sampled randomly (OECD, 2017). Gender was coded as
0 = male, 1 = female, and race as 3 = immigrants, 4 = black, and 5 = white. However, if
there were fewer than the targeted number of students available to meet age eligibility
criteria, all were subsequently selected (OECD, 2017).
A school sampling size of 150 is the minimum size set internationally to
counterbalance possible nonresponses (OECD, 2017). Nonetheless, the 2015 United
States PISA exceeded the sample size with 240 schools (OECD, 2017). Data was
collected from two sources, public (2012-2013) and private schools (2011-2012), using
Common Core of Data and Private School Universe Survey, respectively (OECD, 2017).
Schools were selected in the sampling size if at least one grade (7th-12th) was a
component of the school. Moreover, schools participating in the study submitted a list of
eligible 15-year-old students (OECD, 2017). From this list, the sample size was compiled
by PISA using SPSS software version 21 developed by an international contractor.
I aggregated data files with the five independent variables and utilized PISA
secondary for the independent variables population size. I used G*Power analysis
utilizing the given secondary data to detect sample size and any Type I or Type II effect
of the sample size I was working with regarding the null hypothesis and the degree of
freedom (Gelman, 2008). Correlational research works to measure the degree to which
two variables are related (Gelman, 2008). This method of data collection makes it
possible for researchers to form predictions regarding the behavior of corresponding
variables in similar settings (Gelman, 2008). Specifically, the method focused on a
101
theoretical framework using a quantitative empirical research approach coupled with the
PISA analysis and dataset. The purpose in choosing these analytical approaches was to
examine the relationship between the independent and proxy variables utilizing the PISA
public school district dataset through ANOVA. The PISA utilized the PPS sampling
census data to gather the population for K-12 public school districts in Massachusetts.
Student achievement data provided a proxy measure of educational inequality. Schools
that provide a better quality of education produce students who achieve at higher levels.
Main Analysis
The OECD (2015) PISA analysis report describes the overall performance of 15-
year-olds across all 36 OECD participating countries. The 2015 report identified four
countries that were top performers and had improved in education equity attainment:
Canada, Estonia, Germany, and Hong Kong-China (OECD, 2015). The OECD (2015)
analysis examined the policies of education systems against these four countries. I
filtered only United States and Germany. The report provided an analysis and
recommendation for countries that were below the OECD standard levels. Of note, for
the 2015 report, the United States ranked average and was below OECD standards for
overall academic achievement. One in five (20%) of 15-year-old students for the United
States were low performers in academics, including urban communities (OECD, 2015).
The International Standard Classification of Education assisted in framing statistical data
on international education supported by the United Nations Educational, Scientific and
Cultural Organization. They used the findings to gain an understanding of what is meant
by primary, secondary, and tertiary levels of education, as well as how they matched
against the United States level of education (OECD, 2015).
102
I created a descriptive summary table of enrollment rate, high school graduation
rate, property tax funding for schools, and initial teacher quality (see Table 1). I ran youth
literacy rate scores in a separate analysis because of the three measure of reading, math,
and science. To check the strength of relationship between variables, I incorporated
Pearson’s r correlation (see Table 2). Pearson’s r correlation measures the power of the
linear relationship between two variables at a time (Gelman, 2008). Pearson’s r will
always consist of -1.00 and 1.00 (Gelman, 2008). In Table 3, ANOVA was used to
compare the four independent variables for the sum of squares. Descriptive summary of
the youth literacy rate scores was compared next for Massachusetts, the United States,
and Germany (see Table 4), along with ANOVA youth literacy rate scores for the sum of
squares (see Table 5). Data analysis was conducted to determine the effects of gender on
the youth literacy rate scores using independent sample t test using the Levene’s Test for
Equality of Variance for two or more groups (see Table 6). In addition, I conducted a
regression analysis for beta or standardized coefficient and unstandardized using
academic performance as a simulated dependent variable. Lastly, standardized coefficient
signifies how many standard deviations a dependent will change the variance to 1, as
illustrated in Table 7 (Gelman, 2008).
Independent Variables
An operational definition is given of each variable along with each classification
1. Enrollment rate is defined by dividing the number of students as a specific
gender, and age group for enrolled education levels.
2. High school graduation rate is defined as an estimated percentage of students
that graduate from an education level.
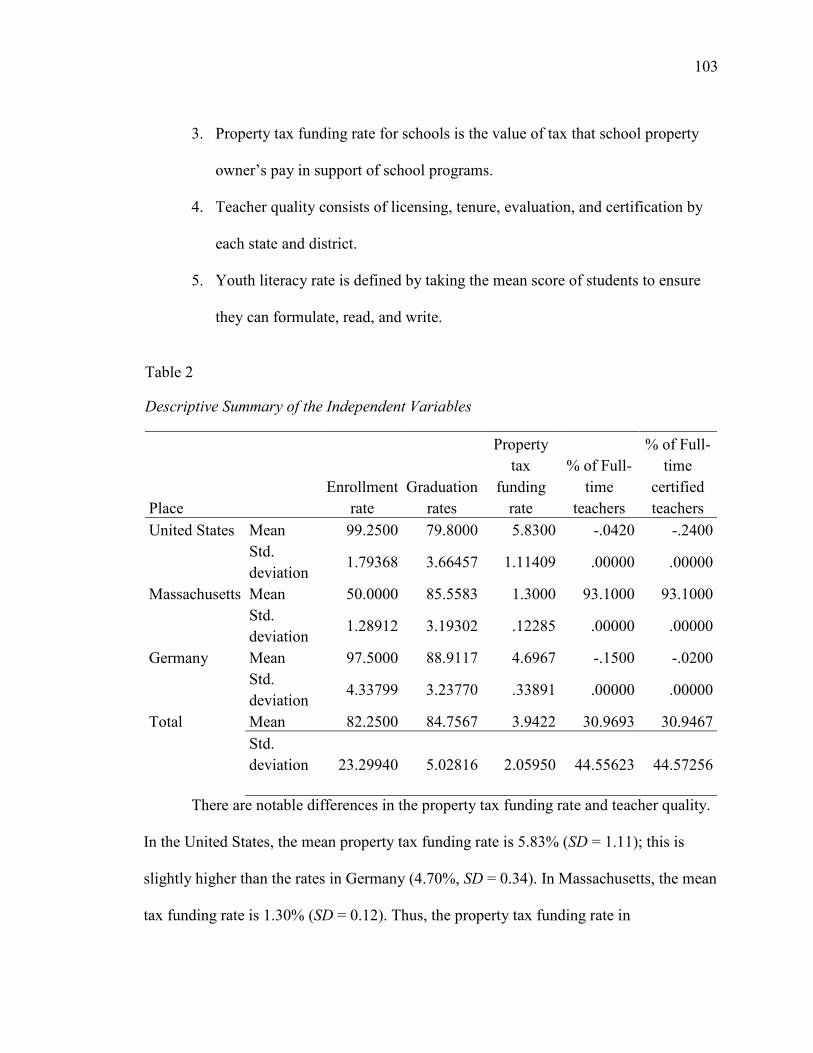
103
3. Property tax funding rate for schools is the value of tax that school property
owner’s pay in support of school programs.
4. Teacher quality consists of licensing, tenure, evaluation, and certification by
each state and district.
5. Youth literacy rate is defined by taking the mean score of students to ensure
they can formulate, read, and write.
Table 2
Descriptive Summary of the Independent Variables
Place
Enrollment
rate
Graduation
rates
Property
tax
funding
rate
% of Full-
time
teachers
% of Full-
time
certified
teachers
United States Mean 99.2500 79.8000 5.8300 -.0420 -.2400
Std.
deviation 1.79368 3.66457 1.11409 .00000 .00000
Massachusetts Mean 50.0000 85.5583 1.3000 93.1000 93.1000
Std.
deviation 1.28912 3.19302 .12285 .00000 .00000
Germany Mean 97.5000 88.9117 4.6967 -.1500 -.0200
Std.
deviation 4.33799 3.23770 .33891 .00000 .00000
Total Mean 82.2500 84.7567 3.9422 30.9693 30.9467
Std.
deviation
23.29940 5.02816 2.05950 44.55623 44.57256
There are notable differences in the property tax funding rate and teacher quality.
In the United States, the mean property tax funding rate is 5.83% (SD = 1.11); this is
slightly higher than the rates in Germany (4.70%, SD = 0.34). In Massachusetts, the mean
tax funding rate is 1.30% (SD = 0.12). Thus, the property tax funding rate in
104
Massachusetts is considerably lower than the national average and in Germany. The next
important consideration is the teacher quality. I measured this variable using the
proportion of full-time teachers and their percentage in full-time certified teachers.
Massachusetts with an average of 93.10% has the highest proportion of certified full-time
teachers. Moreover, the data reveal that the United States and German average proportion
of full-time teachers are both statistically significant.
The results of the correlation analysis presented in Table 2 show the existence of
various relationships of interest in this study. First, there is a significant correlation
between the United States, Massachusetts, and Germany, the graduation rates, r = 0.75,
p<0.001. Secondly, there as a significant correlation between gender and graduation
rates, r = -0.47, p<0.05. Enrollment was significantly positively correlated with property
tax funding rate and significantly negatively correlated with both measures of teacher
quality, p<0.001 for United States, Massachusetts, and Germany.
I conducted ANOVA analysis to determine if there were statistically significant
association between the five independent variables. As illustrated in Table 3, the results
reveal that there was a significant difference in the mean enrollment between Germany,
the United States, and Massachusetts, F (2, 35) = 1186, p < 0.001. There was a
statistically significant difference in the mean graduation rates between Germany, United
States and Massachusetts, F (2, 35) = 22.41, p < 0.001. There was a significant
association in the mean property tax funding rate between Germany, the United States
and Massachusetts, F (2, 35) = 145.90, p < 0.001. There were statistically significant
association in the teacher quality measures between Germany, United States and
Massachusetts, p < 0.001 in both measures.
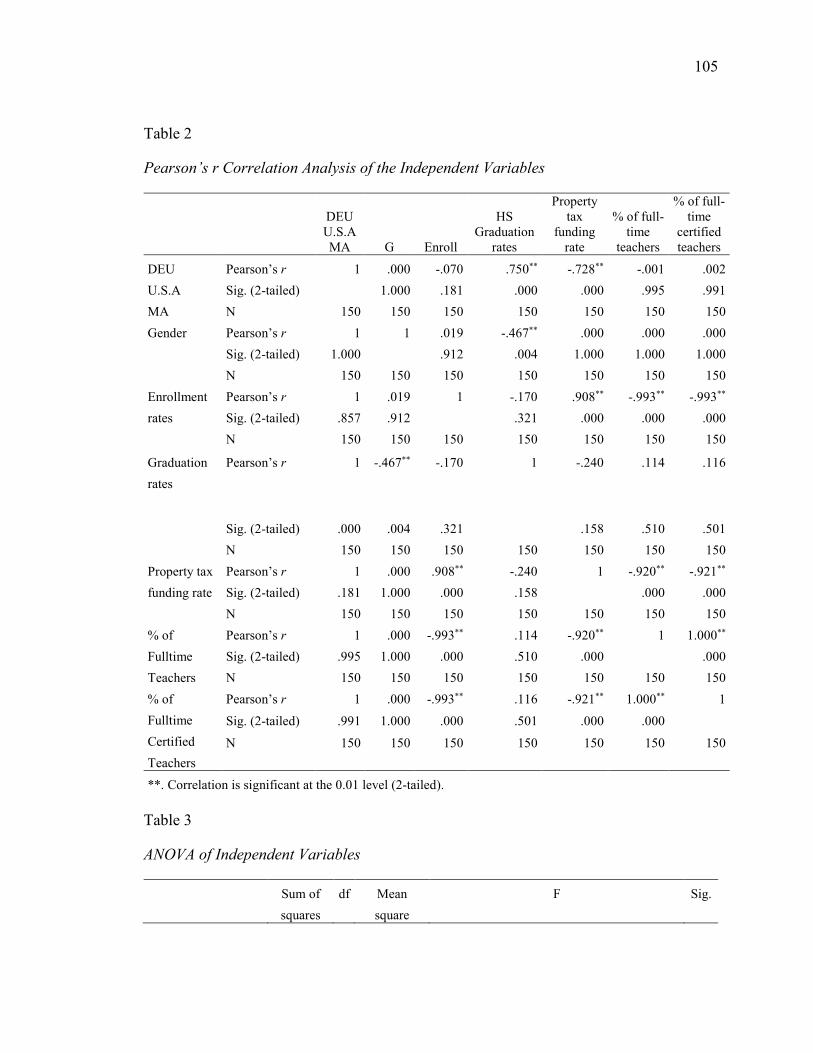
105
Table 2
Pearson’s r Correlation Analysis of the Independent Variables
DEU U.S.A MA G Enroll
HS Graduation
rates
Property tax
funding rate
% of full-time
teachers
% of full-time
certified teachers
DEU
U.S.A
MA
Pearson’s r 1 .000 -.070 .750** -.728** -.001 .002
Sig. (2-tailed) 1.000 .181 .000 .000 .995 .991
N 150 150 150 150 150 150 150
Gender Pearson’s r 1 1 .019 -.467** .000 .000 .000
Sig. (2-tailed) 1.000 .912 .004 1.000 1.000 1.000
N 150 150 150 150 150 150 150
Enrollment
rates
Pearson’s r 1 .019 1 -.170 .908** -.993** -.993**
Sig. (2-tailed) .857 .912 .321 .000 .000 .000
N 150 150 150 150 150 150 150
Graduation
rates
Pearson’s r 1 -.467** -.170 1 -.240 .114 .116
Sig. (2-tailed) .000 .004 .321 .158 .510 .501
N 150 150 150 150 150 150 150
Property tax
funding rate
Pearson’s r 1 .000 .908** -.240 1 -.920** -.921**
Sig. (2-tailed) .181 1.000 .000 .158 .000 .000
N 150 150 150 150 150 150 150
% of
Fulltime
Teachers
Pearson’s r 1 .000 -.993** .114 -.920** 1 1.000**
Sig. (2-tailed) .995 1.000 .000 .510 .000 .000
N 150 150 150 150 150 150 150
% of
Fulltime
Certified
Teachers
Pearson’s r 1 .000 -.993** .116 -.921** 1.000** 1
Sig. (2-tailed) .991 1.000 .000 .501 .000 .000
N 150 150 150 150 150 150 150
**. Correlation is significant at the 0.01 level (2-tailed).
Table 3
ANOVA of Independent Variables
Sum of
squares
df Mean
square
F Sig.
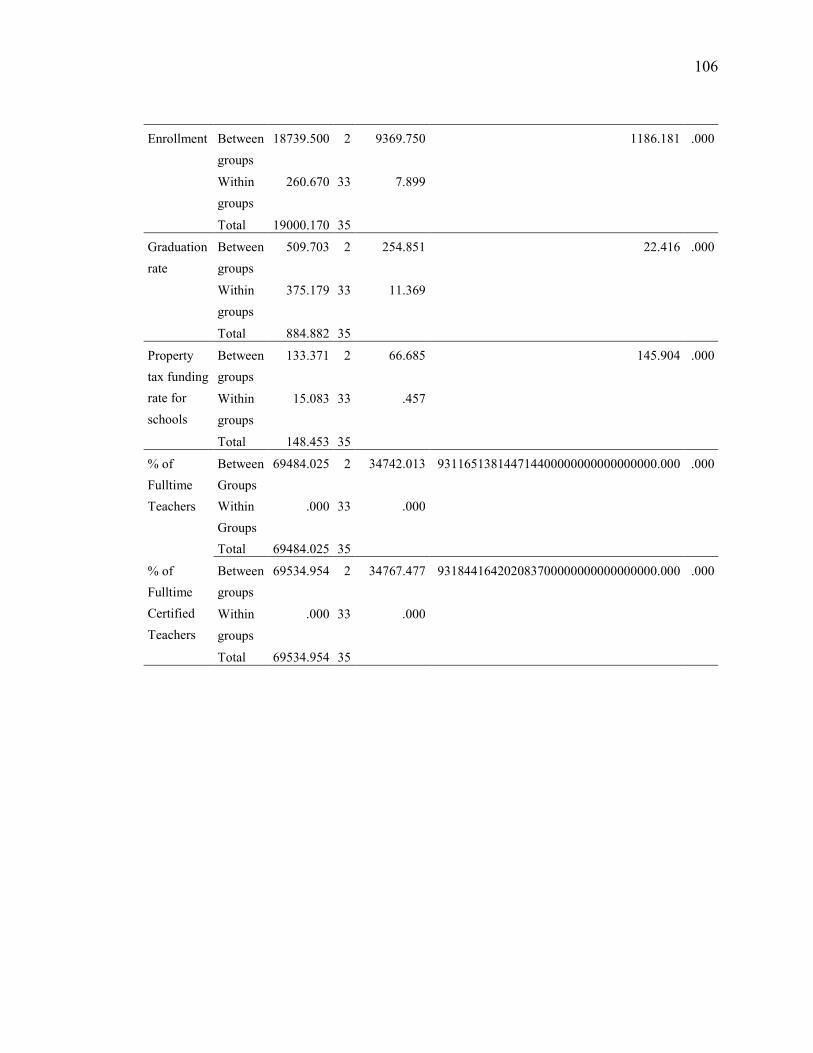
106
Enrollment Between
groups
18739.500 2 9369.750 1186.181 .000
Within
groups
260.670 33 7.899
Total 19000.170 35
Graduation
rate
Between
groups
509.703 2 254.851 22.416 .000
Within
groups
375.179 33 11.369
Total 884.882 35
Property
tax funding
rate for
schools
Between
groups
133.371 2 66.685 145.904 .000
Within
groups
15.083 33 .457
Total 148.453 35
% of
Fulltime
Teachers
Between
Groups
69484.025 2 34742.013 931165138144714400000000000000000.000 .000
Within
Groups
.000 33 .000
Total 69484.025 35
% of
Fulltime
Certified
Teachers
Between
groups
69534.954 2 34767.477 931844164202083700000000000000000.000 .000
Within
groups
.000 33 .000
Total 69534.954 35
107
The results, presented in Table 4, reveal that the mean reading score in the United
States (497, SD = 14.14) was lower than in Massachusetts (M = 527, SD = 12.72) and
Germany (M = 509.50, SD = 14.85). Thus, Massachusetts has the highest mean reading
scores. Analysis of the math scores reveals that Germany (M = 506, SD = 11.31) had a
higher mean score than either United States (M = 469.50, SD = 6.36) and Massachusetts
(M = 498.50, SD = 3.53). The United States (M = 546.50, SD = 65.76) had a higher mean
science score than either Germany (M = 509, SD = 7.07) or Massachusetts (M = 529, SD
= 7.07).
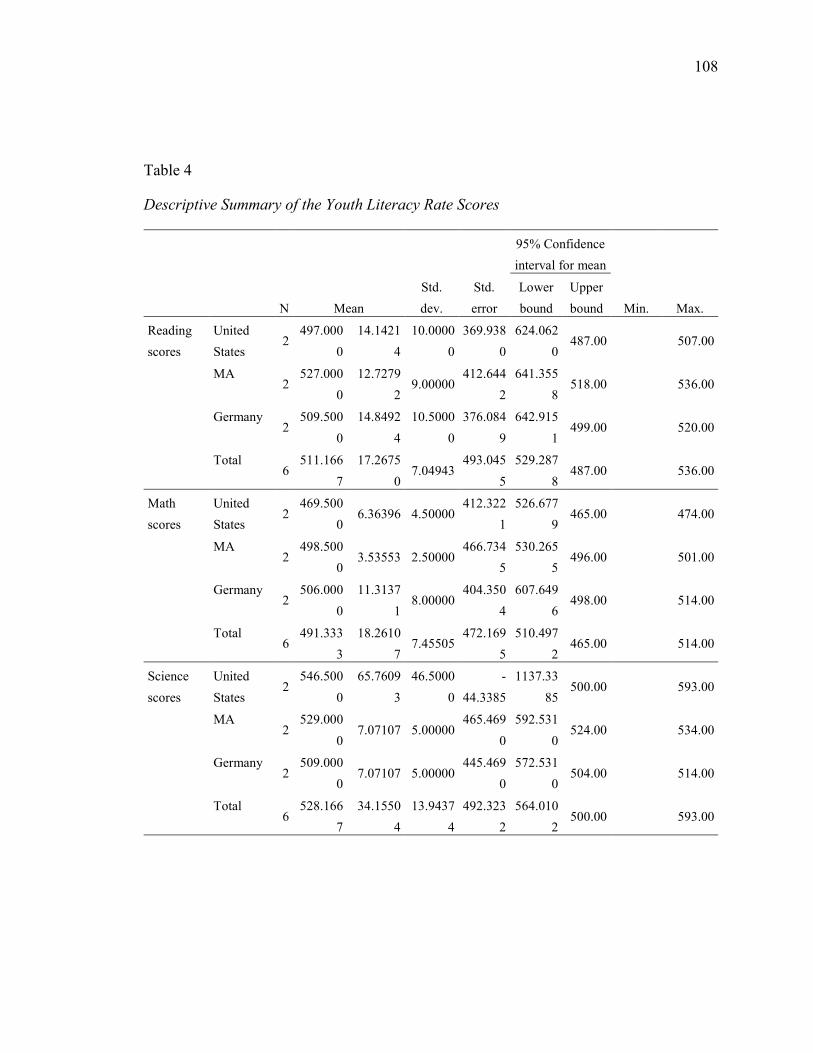
108
Table 4
Descriptive Summary of the Youth Literacy Rate Scores
N Mean
Std.
dev.
Std.
error
95% Confidence
interval for mean
Min. Max.
Lower
bound
Upper
bound
Reading
scores
United
States 2
497.000
0
14.1421
4
10.0000
0
369.938
0
624.062
0 487.00 507.00
MA 2
527.000
0
12.7279
2 9.00000
412.644
2
641.355
8 518.00 536.00
Germany 2
509.500
0
14.8492
4
10.5000
0
376.084
9
642.915
1 499.00 520.00
Total 6
511.166
7
17.2675
0 7.04943
493.045
5
529.287
8 487.00 536.00
Math
scores
United
States 2
469.500
0 6.36396 4.50000
412.322
1
526.677
9 465.00 474.00
MA 2
498.500
0 3.53553 2.50000
466.734
5
530.265
5 496.00 501.00
Germany 2
506.000
0
11.3137
1 8.00000
404.350
4
607.649
6 498.00 514.00
Total 6
491.333
3
18.2610
7 7.45505
472.169
5
510.497
2 465.00 514.00
Science
scores
United
States 2
546.500
0
65.7609
3
46.5000
0
-
44.3385
1137.33
85 500.00 593.00
MA 2
529.000
0 7.07107 5.00000
465.469
0
592.531
0 524.00 534.00
Germany 2
509.000
0 7.07107 5.00000
445.469
0
572.531
0 504.00 514.00
Total 6
528.166
7
34.1550
4
13.9437
4
492.323
2
564.010
2 500.00 593.00
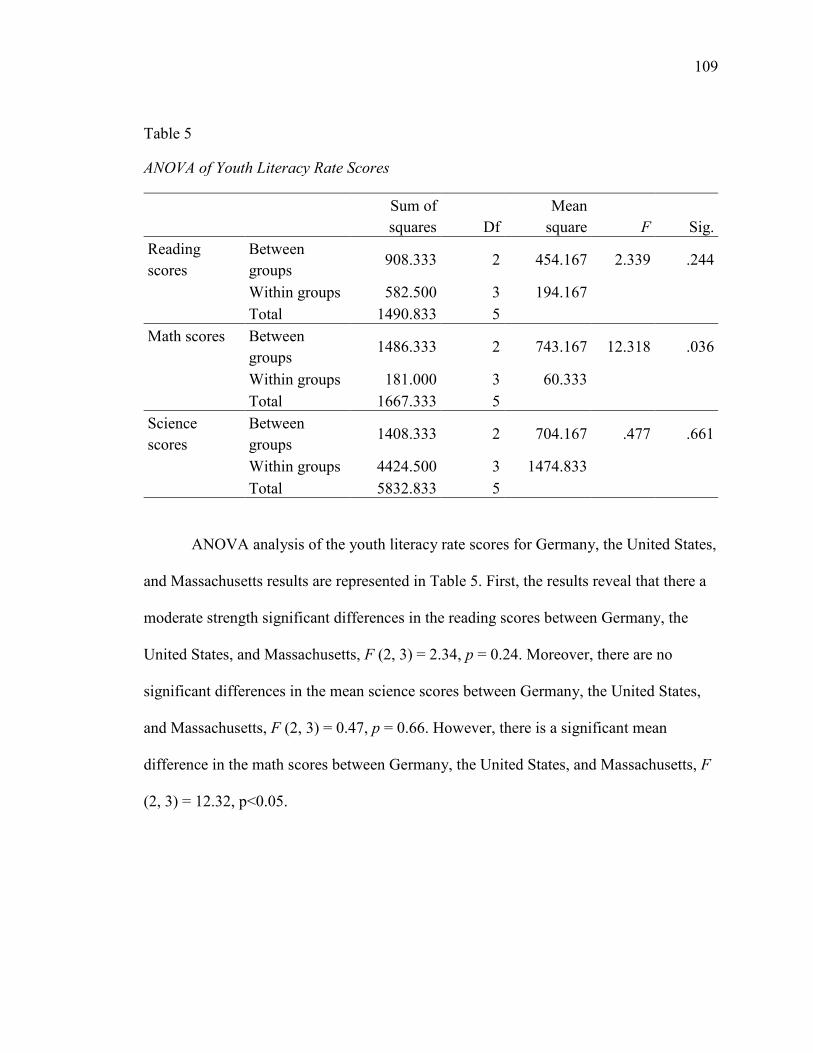
109
Table 5
ANOVA of Youth Literacy Rate Scores
Sum of
squares Df
Mean
square F Sig.
Reading
scores
Between
groups 908.333 2 454.167 2.339 .244
Within groups 582.500 3 194.167
Total 1490.833 5
Math scores Between
groups 1486.333 2 743.167 12.318 .036
Within groups 181.000 3 60.333
Total 1667.333 5
Science
scores
Between
groups 1408.333 2 704.167 .477 .661
Within groups 4424.500 3 1474.833
Total 5832.833 5
ANOVA analysis of the youth literacy rate scores for Germany, the United States,
and Massachusetts results are represented in Table 5. First, the results reveal that there a
moderate strength significant differences in the reading scores between Germany, the
United States, and Massachusetts, F (2, 3) = 2.34, p = 0.24. Moreover, there are no
significant differences in the mean science scores between Germany, the United States,
and Massachusetts, F (2, 3) = 0.47, p = 0.66. However, there is a significant mean
difference in the math scores between Germany, the United States, and Massachusetts, F
(2, 3) = 12.32, p<0.05.
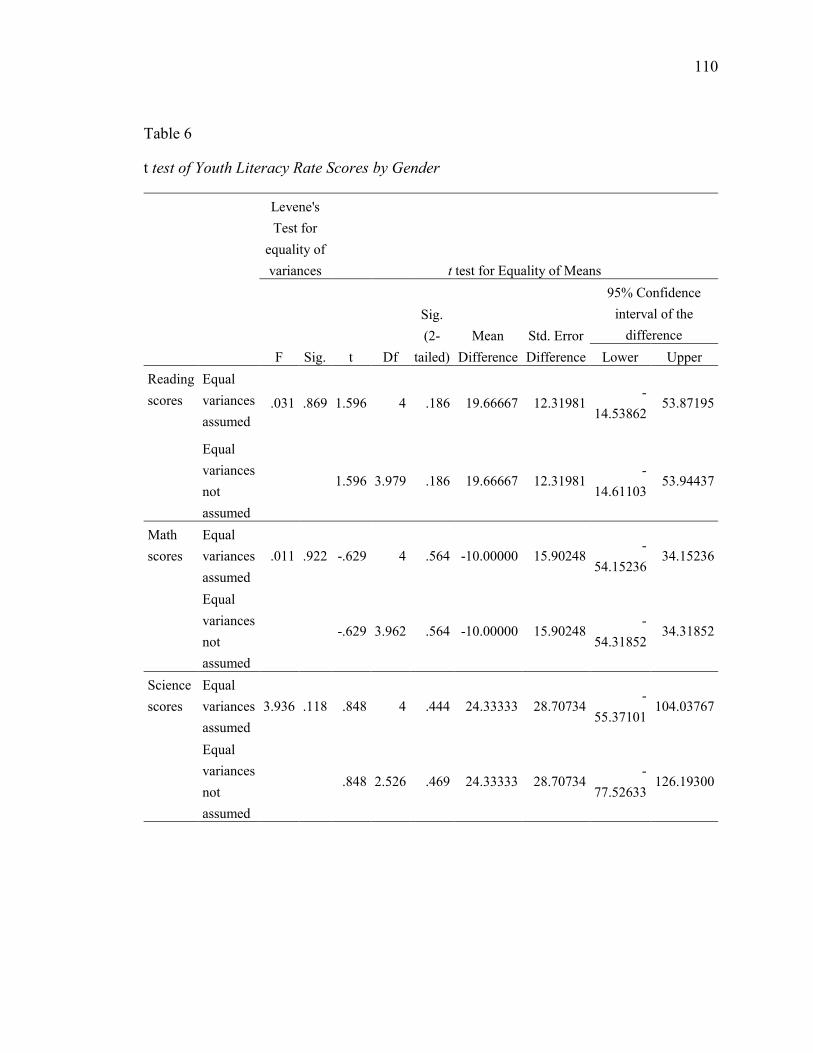
110
Table 6
t test of Youth Literacy Rate Scores by Gender
Levene's
Test for
equality of
variances t test for Equality of Means
F Sig. t Df
Sig.
(2-
tailed)
Mean
Difference
Std. Error
Difference
95% Confidence
interval of the
difference
Lower Upper
Reading
scores
Equal
variances
assumed
.031 .869 1.596 4 .186 19.66667 12.31981 -
14.53862 53.87195
Equal
variances
not
assumed
1.596 3.979 .186 19.66667 12.31981 -
14.61103 53.94437
Math
scores
Equal
variances
assumed
.011 .922 -.629 4 .564 -10.00000 15.90248 -
54.15236 34.15236
Equal
variances
not
assumed
-.629 3.962 .564 -10.00000 15.90248 -
54.31852 34.31852
Science
scores
Equal
variances
assumed
3.936 .118 .848 4 .444 24.33333 28.70734 -
55.37101 104.03767
Equal
variances
not
assumed
.848 2.526 .469 24.33333 28.70734 -
77.52633 126.19300
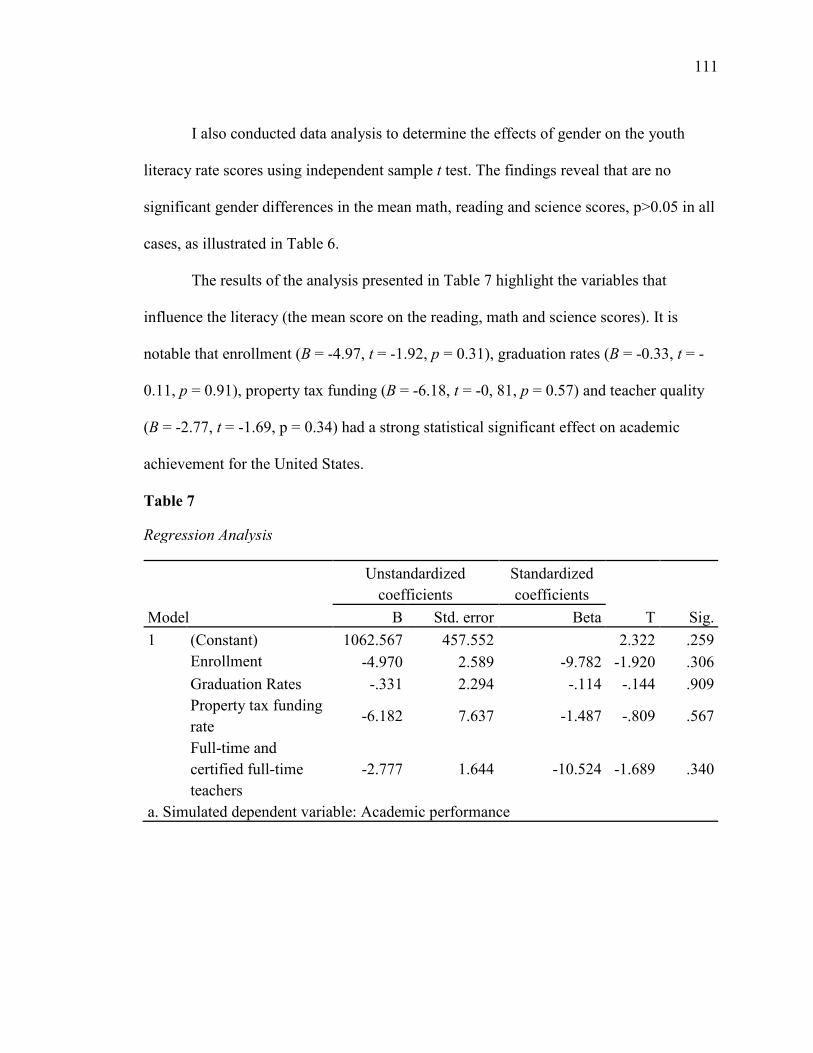
111
I also conducted data analysis to determine the effects of gender on the youth
literacy rate scores using independent sample t test. The findings reveal that are no
significant gender differences in the mean math, reading and science scores, p>0.05 in all
cases, as illustrated in Table 6.
The results of the analysis presented in Table 7 highlight the variables that
influence the literacy (the mean score on the reading, math and science scores). It is
notable that enrollment (B = -4.97, t = -1.92, p = 0.31), graduation rates (B = -0.33, t = -
0.11, p = 0.91), property tax funding (B = -6.18, t = -0, 81, p = 0.57) and teacher quality
(B = -2.77, t = -1.69, p = 0.34) had a strong statistical significant effect on academic
achievement for the United States.
Table 7
Regression Analysis
Model
Unstandardized
coefficients
Standardized
coefficients
T Sig. B Std. error Beta
1 (Constant) 1062.567 457.552 2.322 .259
Enrollment -4.970 2.589 -9.782 -1.920 .306
Graduation Rates -.331 2.294 -.114 -.144 .909
Property tax funding
rate -6.182 7.637 -1.487 -.809 .567
Full-time and
certified full-time
teachers
-2.777 1.644 -10.524 -1.689 .340
a. Simulated dependent variable: Academic performance
112
Results for Central Research Question
Statistical Assumptions
Statistical testing assumptions regarding the relationships of the independent
variables were statistically significant associated to contribute making quality education
pathway of opportunities in urban communities. Disruptions for this statistical
assumption may disrupt the final analysis of the research. Therefore, it will be pivotal to
acknowledge the disruption in the assumptions and take appropriate steps as plausible.
Independent Variables
As discussed in Chapter 3, the independent variables were measured on a
continuous scale at either the interval or ratio level. I measured the first independent
variable, enrollment rate, by dividing the number of students as a specific gender, and age
group for enrolled education levels by there size of the population for that age on a
continuous scale (OECD, 2015). High school graduation rate, is a percentage estimation
of students that graduate from an education level, on a continuous scale (OECD, 2015).
Property tax funding rate for schools in dollars for the GDP, and the value of tax that
school property owner’s pay in support of school programs were measured on a
continuous scale (OECD, 2015). Teacher quality, consist of licensing, tenure, evaluation,
and certification of each state and districts, on a continuous scale (OECD, 2015). Youth
literacy rate is taking the mean score of students to ensure they can formulate, read, and
write, on a continuous scale (OECD, 2015). The scale ranges from 1000 persons to 2000
persons using the OECD data for all five independent variables. This assumption was met
for the five-independent variable.
113
Linear Relationship and Constant Variance
I conducted scatter plot constant variance. I conducted a correlation illustration to
analyze the relationship between the five independent variables utilizing the two-tailed
test of significance. All five of the independent variables had a moderate statistically
significant relationship strength.
No Significant Outlier
I analyzed the presence of significant outliers using simple boxplots. I first
analyzed estimated population and based on the boxplot, determined there are no
significant outliers. I reran the analysis for a second time and the assumption no
significant outliers met.
Residuals
I examined the continuation of normal distribution through the means of a normal
probability-probability plot known as the P-P plot of regression. The P-P plot remains
closely to the diagonal line of verifying the existence of normal distribution. Equally, I
confirmed the normal distribution by a histogram chart which affirmed the P-P Plot
findings. As previously mentioned, I did not have any outliers. So, when I reviewed the
case wire diagnostics, I did not notice any large negative residual numbers nor any cases
outside of the standard deviations. Therefore, I did not notice any major concerns. In final
analysis, the ANOVA for the statistical assumptions were plausible for this model and
met the requirements of the statistical assumptions.
Correlation Coefficient
I conducted a correlational analysis to find the relationship between the
independent variables to assist determining the access into the ANOVA. The
114
correlational analysis results are illustrated in Table 2. The results are depicted in the
following format: I used Pearson’s r confidence intervals, and the p-value. I abbreviated
the actual results in a text format and the numerical values are listed full in the tables.
First, there is a significant correlation between (United States, Germany, and
Massachusetts) for graduation rates, r = 0.75, p<0.001. Secondly, there as a significant
correlation between gender and graduation rates, r = -0.47, p<0.05. Enrollment was
significantly positively correlated with property tax funding rate and significantly
negatively correlated with both measures of teacher quality, p<0.001 in all three cases.
The correlation analysis also reveals the existence of significant negative correlations
between property tax funding rate and the two measures of teacher quality, p<0.001 in
both cases.
Summary and Transition to Chapter 5
To broadly answer the central question, I organized this chapter into six sections
and one subsections: introduction, secondary data collection, independent variables
definition, main analysis, results of the central research questions, and results of chapter
4, and summary. The introduction consisted of an overview of Chapter 4 organization,
whereas in the data collection section described the OECD secondary methodology. The
secondary data collection where applicable, I altered the information to meet the
statistical assumptions. Hence, this being secondary data, the OECD numbers were
correlated and the estimated population per the independent variables demonstrated a
statistically significant correlation between each variable. I ran the Pearson’s r
correlational analysis for the five independent variables with the secondary data to
establish a statistically significant correlation of the independent variables.
115
The null hypothesis (H0), and alternative hypothesis (Ha) are statements
expressing variances and effects that potential can occur in the population assessment
(Gelman, 2008). Hence, I rejected the null hypothesis of the central research question. I
conducted the main analysis to determine a positive statistically significant relationship
for enrollment rate, high school graduation rate, property tax funding rate for schools.
There was a negative association with teacher quality with the previous mention
independent variables. As a result, I accepted the alternate hypothesis that there is a
statistically significant relationship between the independent variables to contribute
making quality education a pathway of opportunities in the United States urban
communities. For the main analysis, I determined a positive and statistically significant
relationship between the estimated population and the five independent variables and
accepted the alternate hypothesis.
The primary goal of the study was to analyze the independent variables influence
United States education quality and determine what variables had a statistically
significant relationship. The results of the analysis presented in Table 7 highlight how the
independent variables influence academic achievement (the mean score on the reading,
math and science scores). For the regression analysis, I used a simulate dependable
variable, academic performance. The simulated dependent variable allowed me to include
a constant in the regression model. Having a constant confirms the residuals have a mean
and/ or average of zero (Gelman, 2008). Therefore, it is notable enrollment (B = -4.97, t =
-1.92, p = 0.31), graduation rates (B = -0.33, t = -0.11, p = 0.91), property tax funding (B
= -6.18, t = -0, 81, p = 0.57) and teacher quality (B = -2.77, t = -1.69, p = 0.34) had a
moderate strength effect on academic achievement for the United States and where
116
Massachusetts was doing admirably. Negative correlation is no different than a positive
correlation regarding to the strength of the variables (Gelman, 2008). Correlation strength
is either (-1 or 1), (Gelman, 2008). If the numbers are close to -1 or 1 the stronger the
variable is to a correlation, (Gelman, 2008). It is possible an increase in enrollment
affects the availability of the available resources for student use, which in turn negatively
affects the quality of education especially in urban communities. The negative effects of
fulltime and certified teachers’ quality on youth literacy rate had a moderate strength
correlation with the other four independent variables. However, OECD analysis
illustrated there is need for improvement for both United States and German teacher
quality. As a result, the negative correlation does depict an inverse slope which could be
attributed to the existence of a significant correlation between the independent variables
and serve to underline the complex nature of education and learning.
In Chapter 5, I will interpret the results of the ANOVA analysis; per the
quantitative checklist, I will reevaluate the limitations of the study, and provide
recommendations for future analysis. Along with discussing the potential social
implications of the results of this study and connect the results to the existent literature.
Finally, I will discuss the outcomes of this study in relation to polarities of democracy.
117
Chapter 5: Discussion
Introduction
As discussed in Chapter 1, the purpose of this proposed quantitative empirical
study was to ascertain whether there was a statistically significant difference in the
relationship between the independent variables using the polarities of democracy
participation and representation tenets as proxy variables. The theoretical framework
served as a lens through which to compare the Massachusetts education system with the
United States and Germany as the benchmark. A fundamental concept of understanding
enrollment rate, high school graduation rate, property tax funding rate for schools,
teacher quality, and youth literacy rate is critical in providing educational opportunities in
urban communities.
I conducted this quantitative study to address some of the academic achievement
education inequities, which were challenges for this complex research. However, the data
collection method presented only minor obstacles. I collected most of the secondary data
from two databases within one week. Some of the DOE and OECD numbers for
enrollment rate, high school graduation rate, and youth literacy rate did not always match.
OECD has conducted their international analysis every three years starting in 2000. The
in between years do not change until they resurvey and analyze the new raw data. Thus,
youth literacy rate data was only populated starting in 2003 and every three years
afterwards. Therefore, I used five years from 2010-2015. For the years of 2013 – 2014
the 2012 data was assessed the same for those years, per OECD methodology. Also, the
gender comparisons were a challenge to find and to be consistent for Massachusetts and
Germany. However, OECD and my findings for teacher quality need work for the United
118
States and Germany. The OECD (2015) findings suggest that both countries may want to
review Canada’s teacher quality practice and policies in that Canada had the highest
teacher quality among all 36 countries. All five independent variables had a statistically
significant association to educational opportunity.
Interpretation of the Findings
The rationale for this study was extracted from Shavit et al.’s (2007) conclusion
that there was a need for both previous and new research to be analyzed regarding
unequal educational outcomes that currently exist in different countries. Studies have
been conducted regarding educational inequality and adult life and work skills in the past
few decades; however, the findings do not reflect trends of today’s societies for K-12
public education in urban communities. Many of the questions surrounding the large
academic achievement gap identified in the literature regarding the availability of
resources are needed for society to progress remain unanswered. The results and
interpretation of the analysis in this study may provide fresh answers to the central
research question and a new understanding of the status of educational inequities as
viewed through the five independent variables chosen to conduct this study. All five
independent variables appear to be pivotal in determining what combination of variables
are more important to focus education policies on in urban communities.
Enrollment Rate
The United States overall has a higher enrollment rate (99.24%, SD = 1.79) than
Massachusetts (50%, SD = 1.29) and Germany (97.5%, SD = 4.33). The mean enrollment
rate between Massachusetts and the United States are significantly different. However,
the mean enrollment rate between the United States and Germany are not significantly
119
different. The enrollment rate in Massachusetts (50%) is considerably lower. Enrollment
was significantly positively correlated with property tax funding rate and significantly
negatively correlated with both measures of teacher quality, p < 0.001 in all three cases.
For this research, I had the alpha coefficient established to .05, which allowed a p < 0.05,
0.01 and 0.001 less than 1 in 20 chance in being incorrect (Gelman, 2008). Therefore, the
findings suggest an increase in enrollment is associated with an increase in property tax
funding rate. The results also reveal that there was a statistically significant difference in
the mean enrollment among Germany, the United States, and Massachusetts, F (2, 35) =
1186, p < 0.001. However, an increase in enrollment may be associated with erosion in
the teacher quality. This is supported by the OECD analysis highlighting the value of a
high full-time teacher to student ratio to the quality of teaching and learning.
High School Graduation Rate
Germany (88.91%) had a higher graduation rate than the United States (79.80%,
SD = 3.66) and Massachusetts (85.56%, SD = 3.19), as illustrated in Table 1. The
graduation rates between Massachusetts and Germany are statistically significant
associated; however, there is a significant difference in the graduation rates between
Massachusetts and the United States with the United States overall having lower
graduation rates. In this respect, it is possible that Massachusetts has implemented
effective strategies to reduce student dropout, such as home schooling, thereby ensuring
higher graduation rates. It is also possible that the United States education system has
weaker safeguards against student attrition. The findings highlight the existence of a
significant difference in the property tax funding rate with the rates in Massachusetts
being significantly lower than both Germany and the United States.
120
Property Tax Funding for Schools
In the United States, the mean property tax funding rate is 5.83% (SD = 1.11),
which is slightly higher than the rates in Germany (4.70%, SD = 0.34). In Massachusetts,
the mean tax funding rate is 1.30% (SD = 0.12), as illustrated in Table 1. Property tax
funding rate is a matter of policy. It is possible that the state of Massachusetts is more
lenient and the state government contributes more to public education. Likewise,
Germany public education is funded mostly from the federal government. Lastly, the
alternative hypothesis for the central research question was accepted for this variable.
Teacher Quality
Massachusetts has a significantly higher quality of teachers than either Germany
or the United States. The proportion of full-time teachers is also significantly higher in
Massachusetts than in the United States overall. This is probably a result of a recruitment
policy informed by the value of certified teachers. The more a group of teachers is valued
within an education system the higher the chance they will be recruited and developed
within the system. This is also true for Germany, but both countries need improvement.
The null hypothesis for the central research question was supported for this variable.
Youth Literacy Rate
The youth literacy scores were only conducted for the years of 2015-2010.
However, OECD conduct their analysis and surveys every three years. For the United
States and Massachusetts, 2013-2014 data was same as 2012 because of the triennial
analysis. Hence, analysis of youth literacy scores between the United States,
Massachusetts, and Germany showed significant differences in math scores.
Massachusetts scores were in the 90th percentile for the years observed, while for the
121
United States was lagging behind Massachusetts and the OECD standard. For 2015, the
United States had improved overall in literacy testing. Germany in the OECD analysis
had continued to perform admirably in youth literacy. Despite there being little
improvement for 2015, OECD findings had them ranked highest of all the European
countries. Massachusetts and the United State had very high math testing scores. The
differences for the United States are likely a manifestation of the importance attached to
math in the respective education systems. The more emphasis placed on a subject the
more likely that resources will be directed towards improving performance. The
alternative hypothesis for the central research question was accepted for this variable.
Finally, the findings have several interpretations in relation to the central research
question. The findings reveal four of the five independent variables had statistically
significant correlation, but overall, the five independent variables had a statistically
significant effect on the quality of education in the United States; it is essential to note,
correlation does not equal causation. Since the resultant model had moderate statistically
significant strength based on the r-square values, it is plausible the research needed to
analyze each variable independently for further deep dive policy analysis that may
influence the complexity of education inequities. Importantly, the findings reveal there
are considerable differences in the enrollment rate, graduation rate, property tax funding
rate for schools, and youth literacy rate between the United States, Germany, and
Massachusetts.
Relating the Study to Previous Studies Discussed
No previous studies have been carried out to develop an understanding of the
correlation between enrollment rate, high school graduation rate, property tax funding for
122
schools, teacher quality, and youth literacy rates (Delaney & Yu, 2013). It is imperative
to understand that the current research reveals there is a statistically significant
correlation among the five independent variables. However, there are no significant
differences in the youth literacy rates between United States, Massachusetts, and
Germany except for math scores. To this end, I conclude the analysis supports OECD
findings that Germany outperforms the United States overall in academic achievement.
Relating the Study Findings to the Theoretical Framework
The polarities of democracy model is a theoretical framework developed by Benet
(2013). The model involves five polar relationships: freedom-authority, justice-due
process, diversity-equality, human rights-communal obligations, and participation-
representation (Benet, 2013). Under this model, participation and representation are
important poles in the attainment of a democracy. The current study reveals the five
independent variables associated with participation and representation influence the
quality of education. Moreover, the study reveals that there are positive elements
associated with both representation and participation.
Full-time certified teachers are uniquely trained to deal with disparities in the
urban education system (Carter, & Keiler, 2009). The current study fills the academic
achievement gap in the existing knowledge by highlighting the lack of quality teachers in
both the German and U.S. educational systems. Based on the findings of this study and
OECD, both the United States and Germany have a lot to do to improve the
representation of certified teacher quality.
123
Potential Bias and Limitations of the Study
In Chapter 1, I discussed some limitations to this study. The most notable
limitation of the study is that, because it surveyed 36 nations, some of the data retrieved
from the OECD, PIACC, and PISA databases were large. I had to filtered the information
specific for this research. Also, since the study involved the use of secondary data, errors
were noticeable in the reporting of information from the United States Department of
Education and what was collected and analyzed in the database from OECD findings. In
addition, for the five-year period for this research, Massachusetts data were limited. Thus,
the external validity results of the three models were high.
The causal conclusion of the internal validity is warranted for this research
because of bias and/errors were minimal. To have few errors, I repeated the statistical
analysis for the central research several times to confirm my results were consistent.
Furthermore, the model for this research maintained a 90% variance. Therefore, I can say
the causal conclusion of the internal validity had no concerns.
Recommendations for Future Research
As noted previously there appear to be some discrepancies among findings,
particularly with United States, reporting their ranking standing in graduation rate and
literacy. National Public Radio (2015) report mention a concern among states and schools
gaming the education system to artificially boost their graduation rates. The reporting is
stating that this policy concept is taking at-risk students and putting them into
homeschooling, and excess practice of credit recovery programs for high school
graduation rate getting better is more misconception than reality (NPR, 2015). Also,
previously noted, youth literacy rate was being increase and some areas decreased
124
differently from the OECD analysis for the United States Department of Education NCES
reporting. Further, research and/or post-doctoral should be explored regarding some of
the findings.
According to an interview released by NPR (2017), at the present time, President
Donald. J. Trump and Secretary of Education Betsy DeVos plans to reduce funding to
public schools that will result in overall reduction in federal public education spending.
The plans of the Trump administration include removal of formula-allocated state grants
programs, to assist in paying for private school vouchers (NPR, 2017). The current study
reveals that such plans are ill informed and will result in an education system that is
lopsided (failing public school system and a vibrant private school system). The efforts
are being promoted as a move to take the federal government out of the education process
(National Education Assessment, 2017). Ideally, if each state in the United States had a
system like Massachusetts this might not be an issue.
Darrow (2016) asserted that the Every Student Succeeds Act (ESSA), seeks to
ensure that every child succeeds. This law has the effect of shifting accountability
provision from the federal government to the states (Darrow, 2016). In many respects, the
ESSA seeks to ensure that students have every opportunity to succeed within their
settings. By decentralizing accountability, the law has made it easier to serve the needs of
underserved schools and students (Darrow, 2016). It makes it easier to change policies
relating to the five independent variables. Depending on the state, it will be easier to
address inequalities in education. The downside is that it will be easier for states to ignore
educational inequalities. The voucher system proposed to repeal the elementary and
secondary education act of 1965 is likely to affect the diversity of K-12 public schools
125
(Darrow, 2016). This move could improve access to private education. However, the
proposed strategy could affect funding to public schools (Darrow, 2016). Loss of funds
can affect the capacity to improve graduation and enrollment rates and recruit certified
teachers in urban areas (Darrow, 2016). Further analysis of the new administration will
need continue research to determine what education inequalities and qualities impact
academic achievement for urban communities and for global competiveness as a society
at whole.
Implications for Social Change
The implication for social change from this research hopefully provide insight
into best practices regarding reducing educational inequality and improving educational
quality, as the results and findings have been demonstrated. The results may influence
intergenerational mobility of polarities affecting adult skills attainment, and ultimately
influence the earnings distributions within the global market for United States future
endeavors. Thus, academic achievement is a pathway to opportunities for the betterment
of individuals and entire societies (Zeller-Berkman, 2012). This research may also
enhance understanding of the polarities of democracy, mainly in relation to participation
and representation, thereby supplementing the current body of literature.
The implication comparative analysis of Germany, and Massachusetts have
managed to reduce inequalities in their education systems can provide important insights
into the aspects that should be focused on in the fight against education inequalities
overall for the United States. Secondly, it is evident that there is a need to improve the
levels of academic performance for the United States, for males. The outcome analysis of
women in academic for the United States over the past decades have outperformed the
126
academic performance of males. Investment in education for either females or males fails
to reap the proportionate rewards when the learners drop out or fail to achieve.
Addressing inequalities via the education system requires a thorough understanding of
the complexities within the education and barriers to education inequities. Lastly,
investment in urban communities’ education with the goal of reducing inequalities is
required. The findings of this study show that nations and societies with low inequality
scores have high academic achievement and performance aptitude scores.
Summary and Conclusion
For this chapter, and interpreted the results of the findings I presented in Chapter
4. The independent variables of enrollment rate, high school graduation rate, property tax
funding rates for schools, and youth literacy rate, confirmed a statistically significant
association among four of the independent variables, and all five independent variables
have a statistically significant association to contribute making quality education pathway
of opportunities in urban communities. Hence, the findings of this study show the
existence of significant, and sometimes unexpected, correlations between the independent
variables that previous studies have linked to inequalities.
In conclusion, overcoming inequalities in education involves the establishment of
several education policies that seek to harmonize the existing K-12 public education
differences. For instance, a policy on universal education with funding for children from
economically challenged backgrounds could help minimize the inequalities. Another
important policy would be the upgrading of all public educational institutions so the level
of intake and facilities are similar for all schools. States with casinos or lotteries have
extra funding for publications, if all the funding goes toward public education. However,
127
this should not be a mean for funding education for the most powerful country.
Harmonization of the requirements in the working environment and the school curricular
can also minimize the K-12 public education differences in education urban communities
in the United States.
128
References
Adamczyk, J. (n.d.). GI Bill. Encyclopedia of Activism and Social Justice.
doi:10.4135/9781412956215.n354
Apple, M. W. (2015). Education and political work: Is success possible? In M. Apple
(Ed.), Education and Power (pp. 165-177). London, United Kingdom: Routledge
and Kegan. doi:10.4324/9780203143124
Araujo, C., Ferreira, F., & Schady, N. (2004). Is the world becoming more unequal?
Changes in the world distribution of schooling. Washington, DC: World Bank.
doi:10.1596/1813-9450-4701
Association for Supervision and Curriculum Development. (2014). Retrieved from
http://www.ascd.org/about-ascd.aspx
Baker, B. D., & Corcoran, S. P. (2012). The Stealth Inequities of School Funding:
How State and Local School Finance Systems Perpetuate Inequitable Student Spending.
Center for American Progress. Retrieved from
http://files.eric.ed.gov/fulltext/ED535555.pdf
Barbalet, J. (2015). Book review: Weber’s Rationalism and Modern Society: New
Translations on Politics, Bureaucracy, and Social Stratification T. Waters & D.
Waters (Eds). New York, NY: Palgrave Macmillan. Journal of Classical
Sociology, 16(1), 131–134. doi:10.1177/1468795x15611321
Barnes, J. A. (1966). Durkheim’s Division of Labour in Society. Man 1(2), 158-175.
doi:10.2307/2796343
129
Benet, W. J. (2013). Managing polarities of democracy: A theoretical framework for
positive social change. Journal of Social Change, 5(1) 26-39. Retrieved from
http://scholarworks.waldenu.edu/cgi/viewcontent.cgi?article=1033&context=jsc
Berenyi, J. R. (2008). “Appropriate action,” inappropriately defined: Amending the Equal
Educational Opportunities Act of 1974. Washington and Lee Law Review, 65(2),
639-674. Retrieved from http://law2.wlu.edu/deptimages/Law%20Review/65-
2Berenyi.pdf?origin=publication_detail
Bergan, S., Gallagher, T., & Harkavy, I. (2016). Higher education for democratic
innovation. Strasborg, France: Council of Europe. Retrieved from
https://book.coe.int/eur/en/higher-education-and-research
Bettie, J. (2003). Women without class: Girls, race, and identity. Oakland, CA:
University of California Press. Retrieved from
http://www.jstor.org/stable/10.1525/j.ctt1pnz3q
Breen, R. (2004). Social mobility in Europe. Oxford, United Kingdom: Oxford University
Press. doi10.1093/0199258457.001.0001
Breen, R., & Goldthorpe, J. H. (2001). Class, mobility and merit: The experience of two
British birth cohorts. European Sociological Review, 17, 81-101.
doi:10.1093/esr/17.2.81
Brumberg, D., & Hedemann, S. (2013). Global authoritarians and the Arab Spring: New
challenges for U.S. diplomacy. Democracy & Society, 10(2). Retrieved from
https://government.georgetown.edu/sites/government/files/GU-D%26S-19.pdf
130
Carlson, J. (1993). Book Review: Making All the Difference, by Martha Minow. Ithaca,
NY: Cornell University Press. Social & Legal Studies, 2(2), 247–250.
doi:10.1177/096466399300200211
Carter, J. H., & Keiler, L. S. (2009). Alternatively certified teachers in urban small
schools: Where policy reform meets the road. Urban Review, 41(5), 437–460.
doi:10.1007/s11256-008-0117-7
Castello, A. (2010) Inequality and growth in advance economies: An empirical
investigation Journal of Economic Inequality, 8(3), 293-321. doi:10.1007/s10888-
010-9133-4
Castello, A., & Domenech, R. (2002). Human capital inequality and economic growth:
Some new evidence. Economic Journal 112(478), 187-200.
doi.org/10.1111/1468-0297.00024
Cavanagh, S. (2012) U.S. Education Pressured by International Comparisons. Education
Week, 31(16), 6-10. Retrieved from.
http://www.edweek.org/ew/articles/2012/01/12/16overview.h31.html
Ceci, S. J., & Papierno, P. B. (2005). The Rhetoric and Reality of Gap Closing When the
“Have-Nots” Gain but the “Haves” Gain Even More. Retrieved from.
http://www.human.cornell.edu/hd/circ/publications/upload/The-Rhetoric-and-
Reality-of-Gap-Closing.pdf
Checchi, D. (2004). Does educational achievement help to explain income inequality? In
A. Cornia (Ed.), Inequality, growth and poverty in an era of liberalization and
globalization. New York, NY: Oxford University Press.
doi.org/10.1093/0199271410.003.0004
131
Chicosky, C. L. (2015) Restructuring the modern education system in the United States:
A look at the value of compulsory education laws. Brigham Young University
Education & Law Journal, 2015(1), 1-75. Retrieved from
http://digitalcommons.law.byu.edu/cgi/viewcontent.cgi?article=1355&context=elj
Cokely, E. T., & Kelley, C. M. (2009). Cognitive abilities and superior decision making
under risk: A protocol analysis and process model evaluation. Judgment and
Decision Making 4, 20-33. Retrieved from.
http://journal.sjdm.org/81125/jdm81125.pdf
Colby, J., & Witt, M. (2000). Defining Quality in Education. Paper presented at the
meeting of The International Working Group on Education, June, 200, Florence,
Italy. Retrieved From.
https://www.unicef.org/education/files/QualityEducation.PDF
Coleman, J. S. (1968). The concept of equality of educational opportunity. Harvard
Educational Review, 38, 7-22. doi:10.17763/haer.38.1.m3770776577415m2
Colclough, G., & Beck E. M. (1986). The American educational structure and the
reproduction of social class. Sociological Inquiry, 56(4), 456-476.
doi:10.1111/j.1475-682x.1986.tb01172.x
Cordes, B., & Miller, G. (2001). Inequality of education in the United States. Programs
Quarterly, 6(1), 1-12.
Couto, R. A., & Eken, S. C. (2002). To give their gifts: Health, community and
democracy. Nashville, TN: Vanderbilt University Press. Retrieved from
http://www.socresonline.org.uk/8/3/couto.html
132
Davids, S. L., Schapira, M. M., McAuliffe, T. L., & Nattinger, A. B (2004). Prediction of
pessimistic breast cancer risk perceptions in a primary care population. Journal of
General Internal Medicine, 19, 310-315. doi:10.1111/j.1525-1497.2004.20801.x
Darrow, A. -A. (2016). The Every Student Succeeds Act (ESSA). General Music Today,
30(1), 41–44. doi:10.1177/1048371316658327
Delaney, J. A., & Yu, P. (2013). Policy innovation and tertiary education graduation
rates: A cross-country analysis. Compare, 43(3), 387-409.
doi:10.1080/03057925.2012.728375
Dewey, J. (2012). The Public and Its Problems: An Essay in Political Inquiry. M. L.
Rogers (Ed.). University Park, PA: Penn State University Press. Retrieved from
http://www.jstor.org/stable/10.5325/j.ctt7v1gh
Dubrow, J. K. (2014). Political inequality in an age of democracy: Cross-national
perspectives. Abingdon-on-Thames, United Kingdom: Routledge.
doi:10.4324/9780203797907
Durkheim, E. (1893). 1984. The division of labor in society. New York: Free Press.
Retrieved from.
https://scholar.google.com/citations?view_op=view_citation&hl=en&user=ZCgF
BIMAAAAJ&citation_for_view=ZCgFBIMAAAAJ:u-x6o8ySG0sC
Education Week. (2014). Motivation matters: Engaging students, creating learners.
Retrieved from http://www.edweek.org/ew/toc/2014/06/05/
Farkas, G. (2006). How Educational Inequality Develops. Paper presented at The Colors
of Poverty: Why Racial and Ethnic Disparities Exist conference, University of
Michigan, September 15 – 16, 2005.
133
Foldvari, P., & Van Leeuwen, B. (2011). Should less inequality in education lead to a
more equal income distribution? Education Economics 19(5), 537-554.
doi.org/10.1080/09645292.2010.488472
Freire (as cited in Irwin, 2012). Pedagogy of the oppressed. New York, NY: The
Continuum Publishing Company. doi:10.5040/9781472541222.ch-005
Fuchs-Schuendeln, N. Krueger, D. Sommer, M. (2010). Inequality trends for
Germany in the last two decades: A tale of two countries. Vol. 13, issue 1, pages 103-
132. Retrieved from. http://econpapers.repec.org/article/redissued/09-195.htm
Fukuyama, F., & Pierre, J. A. (1992). The end of history and the last man. New York.
NY: Free Press. doi:10.2307/20045133
Eide, E., & Showalter, M. (2011). Estimating the relation between health and education:
What do we know and what do we need to know? Economics of Education
Review, 30(5), 778-791. doi:10.1016/j.econedurev.2011.03.009
Fritzberg, G. J. (2001). What is Goals 2000: The Educate America Act? Volume: 27 issue: 1,
page(s): 78-80, Issue published: September 1,
1994 doi.org/10.1177/00400599940200117
Gautier, P. A., Teulings, C. N., & Van Vuuren, A. (2009). On-the-Job Search, Mismatch
and Efficiency. Review of Economic Studies, 77(1), 245–272. doi:10.1111/j.1467-
937x.2009.00565.x
Gelman, A, (2008). Variance, analysis of. The new Palgrave dictionary of
economics (2nd ed.). New York, NY: Palgrave Macmillan.
doi:10.1057/9780230226203.1787
134
Ginsberg, E., & Solow, R. M. (Eds.). (1976). The great society: Lessons for the Future.
New York, NY: Basic Books. doi.org/10.1086/643393
Golbeck, A. L., Ahlers-Schmidt, C. R., Paschall, A. M., & Dismuke, S. E. (2005). A
definition and operational framework for health numeracy. American Journal of
Preventive Medicine, 29, 375-376. doi:0.1016/j.amepre.2005.06.012
Haskins, R Isaacs, J. B., &. Sawhill, I. V. (2008). Getting ahead or losing ground:
Economic mobility in America Washington, DC: The Pew Charitable Trusts.
Retrieved from https://www.brookings.edu/research/getting-ahead-or-losing-
ground-economic-mobility-in-america/
Herbold, H. (1994) Never a level playing field: Blacks and the GI Bill Journal of Blacks
in Higher Education, Vol 6, 104-108. doi:10.2307/2962479
Hunter, L., & Leahey, E. (2008). Collaborative Research in Sociology: Trends and
Contributing Factors. The American Sociologist, 39(4), 290–306.
doi:10.1007/s12108-008-9042-1
Isaacs, J. B., Sawhill, I. V., & Haskins, R. (2008). Getting ahead or losing ground:
Economic mobility in America Washington, DC: The Pew Charitable Trusts.
Retrieved from https://www.brookings.edu/research/getting-ahead-or-losing-
ground-economic-mobility-in-america/
Johnson, B. (1998). Polarity management: Identifying and managing unsolvable
problems (60754th ed.). Human Resource Development Press. Retrieved from
http://www.jpr.org.uk/documents/14-06-
19.Barry_Johnson.Polarity_Management.pdf
135
Joumard, I., Mauro, P., & Debbie, B. (2012). Less income inequality and more growth -
are they compatible? Part 3. Income redistribution via taxes and transfers across
OECD countries (Working Paper No. 926). OECD Economic Department.
doi:10.1787/19952856
Junker, D., Gassert, P., Mausbach, W., & Morris, D. B. (2004). The United States and
Germany in the era of the Cold War, 1945-1990. Washington, D. C.: Cambridge
University Press. doi:10.1017/cbo9781139052436
Karp, J. A., Banducci, S. A., & Bowler, S. (2003). To know it is to love it? Satisfaction
with democracy in the European Union. Comparative Political Studies, 36(3),
271-292. doi:10.1177/0010414002250669
Karwowski, W. (Ed.) (2006). International encyclopedia of ergonomics and human
factors (vol. 3). London and New York: Routledge.
doi:10.1201/9780849375477.ch29
Keller (as cited in Education Week, 2011). Teacher quality. Retrieved from
http://www.edweek.org/ew/issues/teacher-quality/
Kohut, A., & Stokes, B. (2006). America against the world: How we are different and
why we are disliked New York, NY: Times Books. doi:10.2307/20031993
Kozol, J. (1991). Savage inequalities: Children in America's schools. New York, NY:
Crown Publishers. doi:10.2307/2076291
Larrive, P., & Lee, C. (2015). Negation and polarity: Experimental perspectives. Cham,
Switzerland: Springer. doi:10.1007/978-3-319-17464-8_8
Lim, A. S. K., & Tang, K. K. (2008). Human capital inequality and the Kuznets curve.
Developing Economics, 46(1), 26-51. doi.org/10.1111/j.1746-1049.2007.00054.x
136
Lincoln Institute. (2014). Retrieved from http://www.lincolninst.edu/news/press-
releases/new-research-role-property-tax-funding-k-12-education
Lenhardt, G. (2005). Hochschulen in Deutschland und in den USA. Wiesbaden,
Germany: VS Verlag fur Sozialwissenschaften. Retrieved from
http://www.springer.com/gp/book/9783531148687
Lloyd S., (2016). Nation earns C, Massachusetts ranks first in “State of the States”
report card. Retrieved from
http://www.edweek.org/media/qualitycounts2016_release.pdf
Mandelbaum, M. (2007). Democracy’s good name: The rise and risks of the world’s most
popular form of government. New York, NY: Public Affairs. Retrieved from
http://www.publicaffairsbooks.com/book/ebook/democracys-good-
name/9781586486303
Marshall, G., Roberts, R., & Swift, A. (1997). Against the odds? Social class and social
justice in industrial societies. Oxford, UK: Clarendon Press. Retrieved from
http://scholarworks.wmich.edu/cgi/viewcontent.cgi?article=2520&context=jssw
McCall, L. (2013.). Beyond the Opposition between Opportunity and Inequality. The
Undeserving Rich, 21–52. doi:10.1017/cbo9781139225687.003
McFatter, R. (2017). Comp formulas ANAOVA. Retrieved from
http://www.ucs.louisiana.edu/~rmm2440/CompFormulasANOVA.pdf
Meiksins E. (1995). Democracy against capitalism: Renewing historical materialism. 96:
Verso, Discovery eBooks. doi:10.1017/cbo9780511558344.001
137
Merryman, M. (1998). Clipped wings: The rise and fall of the women Air Force service
pilots of World War II. New York, NY: New York University Press.
doi.org/10.2307/2650455
Munger, F. J., & Fenno, R. F. (1963). National politics and federal aid to education.
Syracuse, NY: Syracuse University Press. doi:10.1002/ncr.4100520612
National Public Radio. (2015) American high school graduation rate reach all time high.
Retrieved from http://www.npr.org/2016/10/17/498301547/american-high-school-
graduation-rates-reach-all-time-high
National Public Radio. (2017). Education Department Faces Deep Cuts; DeVos Faces
Tough Questions. Retrieved from.
http://www.npr.org/sections/ed/2017/05/27/529867484/education-department-
faces-deep-cuts-devos-faces-tough-questions
Nelson, W., Reyna, V. F., Fagerlin, A., Lipkus, I., & Peters, E. (2008). Clinical
implications of numeracy: Theory and practice. Annals of Behavioral Medicine
35, 261-274. Retrieved from. https://www.ncbi.nlm.nih.gov/pubmed/18677452
Noreen, E. (1988). An empirical comparison of probit and OLS regression hypothesis
tests. Journal of Accounting Research, 26(1), 119-133.
Organisation for Economic Cooperation and Development. (2011), An Overview of
growing income inequalities in OECD countries, Divided We Stand, 21-45.
doi:10.1787/9789264119536-3-en
Organisation for Economic Cooperation and Development. (2012). How pronounced is
income inequality around the world – and how can education help reduce it?
138
Organization of Economics and Cooperation Development.
doi:10.1787/5k97krntvqtf-en
Organisation for Economic Cooperation and Development. (2013). OECD skills outlook
2013: First results from the Survey of Adult Skills Retrieved from
http://skills.oecd.org/OECD_Skills_Outlook_2013.pdf
Organisation for Economic Cooperation and Development. (2014). Society at a glance.
Directorate for Employment, Labour, and Social Affairs, OECD. Retrieved from
https://www.oecd.org/australia/sag2016-australia.pdf
Organisation for Economic Cooperation and Development. (2015). Education at a
Glance 2015. Education at a Glance. doi:10.1787/eag-2015-en
Organisation for Economic Cooperation and Development. (2016, & 2017). Education at
a Glance 2016. Education at a Glance. doi:10.1787/eag-2016-en
Orji, H. O. (2011). Platinum essays in the philosophy of applied economics of
development: Theories, techniques and Practice. New York, NY: AuthorHouse.
Retrieved from http://bookstore.authorhouse.com/Products/SKU-
000419650/platinum-essasys-in-the-philsophy-of-applied-economics-of-
development.aspx
Owen, A., & Zhou, Y. (2000). Safe and Effective Importance Sampling. Journal of the
American Statistical Association, 95(449), 135. doi:10.2307/2669533
Parker, W. C. (2003) Teaching democracy: Unity and diversity in public life. New York:
NY: Teachers College Press. doi:10.4135/9781452218533.n192
Pomerleau, K. (2015). 2015 International tax competitiveness index. Retrieved from
http://taxfoundation.org/article/2015-international-tax-competitiveness-index
139
Powell, J. (2003). Constructing disability and social inequality early in the life course:
The case of special education in Germany and in the United States. Disability
Studies Quarterly Journal, 23(2), 57-75. doi:10.18061/dsq.v23i2.414
Powell, J. W. (2009). To segregate or to separate? Special education expansion and
divergence in the United States and Germany. Comparative Education Review
53(2), 161-187. doi:10.1086/597816
Power, J.J.W., & Solga, H. (2010). Analyzing the nexus of higher education and
vocational training in Europe: A comparative-institutional framework. Studies in
Higher Education 35(6), 705-721. Retrieved from.
http://publications.uni.lu/bitstream/10993/4788/1/PowellSolga2010_NexusVET-
HE.pdf
Programme for the International Assessment of Adult Competencies. (2017).
Assessments and surveys. Retrieved from https://nces.ed.gov/surveys/piaac/
Quinnan, T. W. (1997). Adult students “at-risk”: Culture bias in higher education.
Westport, CT: Bergin and Garvey. doi:10.5860/choice.35-3450
Reilly, B. (2014). Constitutional engineering and ethnic conflict. Retrieved from
https://government.georgetown.edu/sites/government/files/GU-D%26S-22.pdf
Re-Education; an Analysis of the Institutional System of the United States. (1918). JAMA,
70(5), 339. doi:10.1001/jama.1918.02600050061027
Rindermann, H. (2007). The g-factor of international cognitive ability comparisons: The
homogeneity of results in PISA, TIMSS, PIRLS and IQ-tests across nations.
European Journal of Personality, 21, 667-706. doi:10.1002/per.634
140
Rivlin, A. M., & McClellan, M. B. (2014). Health Policy Issue Brief: Improving Health
While Reducing Cost Growth, What is Possible? Retrieved from.
https://www.brookings.edu/research/health-policy-issue-brief-improving-health-
while-reducing-cost-growth-what-is-possible/
Rosenberg, G. (2004). The 1964 civil rights act: The crucial role of social movements in
the enactment and implementation of anti-discrimination law. Saint Louis
University Law Journal 49, 1147-1154. Retrieved from.
http://chicagounbound.uchicago.edu/cgi/viewcontent.cgi?article=2924&context=j
ournal_articles
Rue, J. (2016). EU economic governance must be more social, greener and equality-
driven. Retrieved from the European Public Service Union website:
http://www.epsu.org/article/eu-economic-governance-must-be-more-social-
greener-and-equality-driven
Schlosser, A. (2009). Does Education Really Help? Skill, Work, and Inequality. By
Edward N. Wolff. Economica, 76(302), 406–407. doi:10.1111/j.1468-
0335.2009.00654.x
Shavit, Y., Arum, R., Gamoran, A., & Menachem, G. (2007). Stratification in higher
education: A comparative study. Palo Alto, CA: Stanford University Press.
Simon, M.K. & Goes, J. (2103). Dissertation and Scholarly Research. Retrieved From.
http://www.dissertationrecipes.com/wp-content/uploads/2011/04/Assumptions-
Limitations-Delimitations-and-Scope-of-the-Study.pdf
Sherman, J., & Poirier, J. (2007). Educational equity and public policy: Comparing
results from 16 countries (Working Paper No 6). Montreal, Canada: UNESCO
141
Institute for Statistics. Retrieved from
http://unesdoc.unesco.org/images/0014/001495/149523e.pdf
Sloan, W. M. (2012). What Is the purpose of education? Retrieved from
http://www.ascd.org/publications/newsletters/education-update/jul12/vol54
Smith, A. (1776). An inquiry into the nature and causes of the wealth of nations.
Retrieved from http://www.econlib.org/library/Smith/smWN.html
Stigler, J. W. & Hiebert, J. (1999). The Teaching Gap: Best Ideas from the World’s
Teachers for Improving Education in the Classroom. New York: Press Retrieved
from. http://hepg.org/her-home/issues/harvard-educational-review-volume-71-
issue-4/herbooknote/the-teaching-gap_99
Thomas, J Y., & Brady, K. P. (2005). Chapter 3: The elementary and secondary
education act at 40: Equity, accountability, and the evolving federal role in public
education. Review of Research in Education 29, 51-67.
doi.org/10.3102/0091732X029001051
Tillman, L. C., Scheurich, J. J. (2013). Handbook of Research on Educational Leadership
for Equity and Diversity. (2013). doi:10.4324/9780203076934
Topping, K. (2011). Primary–secondary transition: Differences between teachers’ and
children’s perceptions. Vol: 14 issue: 3, page(s): 268-285 Article first published
online: November 15, 2011; Issue published: November 1, 2011. doi:
https://doi.org/10.1177/1365480211419587
U.S. Department of Education, Census Bureau. (2009). Current Population Survey
https://www.census.gov/mp/www/cat/people_and_households/current_population
_survey.html
142
U.S. Department of Education, Institute of Education Sciences, National Center for
Education Statistics. (2014a). PIACC Skills Outlook 2013 from OECD. Center on
International Education Benchmarking. Retrieved from
http://www.ncee.org/cieb/piaac-skills-outlook-2013-from-oecd/
U.S. Department of Education, Institute of Education Sciences, National Center for
Education Statistics. (2014b). Program for the international assessment of adult
competencies. Retrieved from http://nces.ed.gov/surveys/piaac/
U.S. Department of Education, Institute of Education Sciences, National Center for
Education Statistics. (2015). Trends in International Mathematics and Science
Study: TIMSS participating countries. Retrieved from
https://nces.ed.gov/timss/countries.asp
U.S. Department of Education. (2016). Retrieved from
http://www2.ed.gov/rschstat/catalog/k-12-students-schools.html
U.S. National Library of Medicine National Institutes of Health. (1974). The Great
Society: Lessons for the future. New York, NY: Basic Books. Retrieved from
https://www.ncbi.nlm.nih.gov/pmc/articles/PMC4266933/#R58
Waters, T., & Waters, D. (2015). Bureaucracy. Weber’s Rationalism and Modern
Society, 73–127. doi:10.1057/9781137365866_6
White, K. R. (1982). The relation between socioeconomic status and academic
achievement. Psychological Bulletin, Issue 91, 461-481. doi:10.1037//0033-
2909.91.3.461
143
Williams, D. (2015). Where Adam Smith and Occupy agree: Inequality. Bloomberg
View. Retrieved from http://www.bloombergview.com/articles/2015-09-02/adam-
smith-and-occupy-agree-on-inequality.
Zeller-Berkman, S. (2012). Occupying youth development: The pitfalls and potential of
literacy policies and youth development. Journal of Adolescent & Adult Literacy,
55(8), 748-750. doi:10.1002/JAAL.00090
Zirkel, S., & Cantor, N. (2004). 50 Years After Brown v. Board of Education: The
Promise and Challenge of Multicultural Education. Journal of Social Issues,
60(1), 1–15. doi:10.1111/j.0022-4537.2004.00096.x
144
Appendix A: Terms and Acronyms
1. ANOVA: Analysis of variance
2. EPI: Economic Policy Institute
3. ICSPR: Interuniversity Consortium for Political and Social Research
4. ISCED: The International Standard Classification of Education
5. OECD: Organisation for Economic Cooperation and Development
6. PIAAC: Programme for the International Assessment of Adult Competencies
7. POD: Polarities of Democracy
8. PISA: Programme for International Student Assessment
9. TIMSS: Trends in International Mathematics and Science Study
145
Appendix B: NIH Certificate
Certificate of Completion
The National Institutes of Health (NIH) Office of Extramural Research certifies that
Bruce Carter successfully completed the NIH Web-based training course “Protecting
Human Research Participants.”
Date of completion: 09/20/2012
Certification Number: 977738