Embed Size (px)
Citation preview

An Annual Report of the Construction Industry of China Hong Kong
2002-2003
prepared by AsiaConstruct Team Research Centre for Construction and Real Estate Economics Hong Kong Polytechnic University (www.bre.polyu.edu.hk)
for The 9th AsiaConstruct Conference 8-9 December 2003 Sydney, Australia.
AsiaConstruct9 Team:
Michael Anson1, D. Darshi De Saram2, Edwin HW Chan2, YH Chiang2, Lennon HT Choy2, Eddie CM Hui2 and Stephen WK Mak2 1 Professor Emeritus, Faculty of Construction and Land Use, The Hong Kong Polytechnic University. 2 Department of Building and Real Estate, The Hong Kong Polytechnic University.
About the Research Centre for Construction and Real Estate Economics (RCCREE): The RCCREE is the Hong Kong Polytechnic University Centre for solution oriented research and consultancy in construction and real estate economics. It undertakes internationally relevant multi-disciplinary research that supports the advancement of the construction and real estate industries in the following areas: Economic Policy and Institutional Analysis, Real Estate Economics, Construction Economics, Housing, Human Behaviour in Economic Decision making, and Value Management and Facilities Performance. For further information, please contact Professor William B Seabrook, Director of RCCREE ([email protected]) or Professor Francis K.W. Wong, Deputy Director ([email protected]).
November 2003
1
1 EXECUTIVE SUMMARY............................................................................................................. 3
1.1 Macro Economic Review..................................................................................................... 3
1.2 Recovery of the Construction and Property Sectors ............................................................ 4
1.3 Enhancement and Development of the Construction Industry............................................. 5
1.4 Outlook and Globalisation of the Construction Sector ........................................................ 7
2 MACRO ECONOMIC REVIEW AND OUTLOOK ................................................................ 10
2.1 Main Macroeconomic Indicators ................................................................ ....................... 10 2.1.1 Overview of national economy ............................................................................. 11 2.1.2 Economy in the third quarter of 2003 ................................................................... 12
2.2 Economic outlook in the next 5 years ................................................................ ................ 12
2.3 Construction Industry Outlook in the next 5 years ............................................................ 13 2.3.1 Major Projects in Pipeline................................ ..................................................... 15
2.4 Overview of the Construction industry................................ .............................................. 18 2.4.1 Construction investment (or market) volume ................................ ....................... 18 2.4.2 Property market overview................................ ..................................................... 22 2.4.3 Land market overview .......................................................................................... 25 2.4.4 On Contractors, Professionals, Technical Personnels, Workers, Material and
Machinery Suppliers ............................................................................................. 27
3 ADMINISTRATION AND REGULATION OF CONSTRUCTION INDUSTRY ................ 33
3.1 Structure and Role of Construction Administration........................................................... 33 3.1.1 Provisional Construction Industry Co-ordination Board (PCICB) ....................... 33
3.2 Regulation on construction market access......................................................................... 35 3.2.1 Licensing or Registration Requirements............................................................... 35 3.2.2 Company Capability Evaluation System ................................ .............................. 36 3.2.3 Forms of Tendering for Public and Private Sector................................ ................ 37 3.2.4 Types of Contracts Used................................................................ ....................... 37
3.3 Management System of Public or Government Construction Projects.............................. 38
3.4 Risk Management for Construction Projects ..................................................................... 38
4 ENHANCEMENT AND DEVELOPMENT OF THE CONSTRUCTION INDUSTRY ....... 39
4.1 Productivity........................................................................................................................ 39 4.1.1 Value-Added per Employee.................................................................................. 39 4.1.2 Physical Measurement of Construction Productivity (Production) ...................... 41
4.2 Construction Cost............................................................................................................... 42 4.2.1 Unit Construction Cost ......................................................................................... 42 4.2.2 Average Construction Material Price.................................................................... 43 4.2.3 Construction Industry Salaries and Wages ........................................................... 44 4.2.4 Average Sectoral Wages per Month ..................................................................... 44
4.3 Policy and Initiatives on Construction Quality.................................................................. 45 4.3.1 Enhancement of Quality Assurance...................................................................... 45 4.3.2 Enhancement of Skills Workforce ........................................................................ 47 4.3.3 Enhancement of Supervisory Level ...................................................................... 47 4.3.4 Enhancement of Construction Safety.................................................................... 48
4.4 Development of New Technology in the Construction Sector .......................................... 51

2
4.4.1 Prefabrication technology ................................ ..................................................... 51
4.5 Policy and Initiative on the use of IT in construction........................................................ 52
4.6 Research and Development................................................................................................ 53 4.6.1 Public Sector ......................................................................................................... 54 4.6.2 Construction Research .......................................................................................... 55
4.7 Environmental Conservation................................................................ .............................. 56 4.7.1 Corrective measures................................................................ .............................. 56 4.7.2 Environmental Planning........................................................................................ 58
5 GLOBALISATION OF THE CONSTRUCTION SERVICES................................ ................ 60
5.1 Government Policy on Liberalization................................................................ ................ 60
5.2 Commitments in GATT & WTO...................................................................................... 60
5.3 Rules and Regulations for Participation of Foreign Contractors and Professionals .......... 61
5.4 Foreign Participation in the Domestic Market................................................................... 61
5.5 Impact of Liberalization under the World Trade Organization.......................................... 62
5.6 Strategies Towards Co-operation in the Asian Construction Market ................................ 62
REFERENCES........................................................................................................................................... 65
ANNEX: STRUCTURE OF THE CONSTRUCTION INDUSTRY ..................................................... 67

3
1 EXECUTIVE SUMMARY 1.1 Macro Economic Review
The economy of Hong Kong has been showing signs of recovery in 2nd and 3rd Quarter 2003. After reaching a record height of 8.7% by the end July 2003, the unemployment reduced to 8.3% by the end September 2003. Much of this recovery is attributed to post-SARS (Severe Acute Respiratory Syndrome) epidemic recovery in tourism due to the Chinese Mainland Government’s decision to liberalise tourism restrictions allowing persons to tour Hong Kong on individual basis. It is considered that if these two lagging economic indicators continue to improve during the 4th Quarter 2003, there exists a real economic recovery. Deflation also narrowed to 3.2% in September.
Chart 1.1.a – Deflation persists Chart 1.1.b – Hong Kong’s economy on an upward trend in 2002
Hong Kong has been in deflation for 5 years now. The Composite Consumer Price Index (CCPI) had a fall by 3% in 2002, compared with a drop of 1.6% in 2001. By the end of the 2nd Quarter 2003, it plunged further by 2.8%, probably due to SARS (Severe Acute Respiratory Syndrome) epidemic. In the 3rd Quarter, after a further decrease in July 2003, CCPI improved during the months of August and September.
After a sluggish 2001 when GDP remained virtually stagnant with a growth of just 0.9% at current market prices (compared to the 10.5% growth in 2000) 2002 recorded a negative growth of 0.3%. While the first two quarters of 2003 did not paint any better picture, the recovery trend in the final two quarters is expected to improve the overall figures for the year. The Chief Executive, Mr. Tung Chee-Hwa and his team are cautiously optimistic that the economic downturn has bottomed out and would see further recovery in the coming years.
International perceptions of the local operating environment have also been improving since last year. In the World Competitiveness Yearbook 2003 published by the International Institute for Management Development (IMD) in Switzerland, Hong Kong’s overall competitiveness ranking gained from 10th in 2002 to 4th in 2003. However, this is no major reason to rejoice since Hong Kong ranked 2nd in 2001. There was a sharp decline in Hong Kong’s ranking from the third to the twelfth most significant city in terms of its international business environment in a survey by the Economist Intelligence Unit released in February 2001, which came as a major shock causing great concern to the Government and the local community. However, the rank has since improved to 5th place globally, while Hong Kong is ranked No. 1 in the region. The British magazine maintained that both the rule of law and freedom of speech in the territory had encountered severe challenges and that Hong Kong is the only economy where the business environment is expected to deteriorate in absolute as well as relative terms. Another factor of interest is

4
that the recent public concerns and protests against the ‘Article 23’ legislation on subversion apparently had no adverse effect on the economy.
Apart from the above perceived deterioration due to regulatory and political changes, the mismatch between the skills of the workforce and the demands of the economy are increasingly becoming more apparent. While a systematic deterioration in the regulatory and political institutions may be debatable, the problem of workforce skills is widely recognized, especially as high value added services provision is increasingly considered to be the future direction for Hong Kong. Between 1980 and 1996, contribution to the GDP by the manufacturing sector fell from 23.7% to 7.2%, while the number of manufacturing workers dropped from over 900,000 in 1980 to fewer than 290,000 by the end of 1997. At the same time, employment in major service sectors more than doubled. This structural transformation of the Hong Kong economy is described as “Manhattanization”.
Hong Kong however is continuing to retain its ranking as the world’s freest economy according to the findings of the 2003 Index of Economic Freedom jointly released by The Heritage Foundation and The Wall Street Journal for yet another year. Indeed Hong Kong has been ranked at the top for eight years in a row, ever since the Index was first co-published in 1995. Likewise, Cato Institute’s “Economic Freedom of the World: 2002 Annual Report” again ranked Hong Kong as the world’s freest economy in 2003 also. Hong Kong still provides businesses with a strategic location, a level playing field, excellent infrastructure, a dense network of financial and professional service firms, and political stability. In June 2000, 3,001 foreign firms had established their regional headquarters or offices in the territory, a rise of 20% over 1999, the highest figure in the past six years. Nevertheless, only 855 of them had their regional headquarters based in Hong Kong, still lower than the peak figure of over 900 in 1997. 1.2 Recovery of the Construction and Property Sectors
The slowdown of the Hong Kong economy directly hampers the property and construction sectors; in particular the private sector. Construction investment decreased in the order of 9% during each year 2001 and 2002. However, the performance in the first two quarters of 2003 suggest that the decline for 2003 will be lower, as the recovery trends in the final two quarters make things look more optimistic. The total usable floor area completed, though nose dived in 2000, showed a decline of only 10.6% in year 2001. Then, after showing a sharp rise in 2002, due to some increase in commercial construction, the performance in the first two quarters suggests that 2003 may be similar to 2001.
The Government has accordingly adopted multiple measures to revive the property market, in particular the residential sector. There was a hold-back in the supply of Home Ownership Scheme flats, increase in the home-purchase loans and the relaxation of anti-speculation measures. There was, nevertheless, not much effect on asset prices. Property prices continued to drop in the first quarter of 2002 albeit slightly. Over the year 2001, there were however overall increases in values of Agreements for Sale and Purchase of Building Units, Agreements for Sale and Purchase of Land, and Assignments of Building Units, signifying a pick up in property transactions. For the year 2002-03, total recurrent government expenditure is expected to be $204.9 billion, an increase of 5% in real terms over the revised estimate for 2001-02. Recurrent expenditure for infrastructure is estimated to be $11.8 billion, an increase of 4%. However the housing sector will see a decrease of 1% to $0.6 billion. In the private sector, as noted before, there was an almost 25% reduction in the commencements of building works in 2001 compared with 2000. In 2000, the Buildings Department issued Consents to Commence Work covering 2.122 sq.m. of total usable floor area (both domestic and non domestic). This was about 12.4% less than the 2.423 million sq.m. in 1999. In 2001 this figure dropped to 1.494 million sq. m a drop of 29.5%, when compared with the year 2000. The public housing sector has been lacklustre, after private developers petitioned the Government for a radical cutback of, if not a complete halt to, the subsidized Home Ownership and the Private Sector Participation Schemes. The Government has responded by scaling down these schemes significantly. Yet it remains to be seen whether private development and consequently, private building construction markets, would benefit. The Government, in its 2003 Budget, appears to continue to be emphasizing exclusively on infrastructure works as an agent of economic growth. As the major railway

5
construction projects are coming to a close, the Government is embarking on a number of major bridge and highway projects that may improve transportation between Hong Kong and the Pearl River Delta region.
Source: Architectural Services Department
Chart 1.2.a – Material Index, Labour Index And Building Cost Index (BCI)
Source: http://www.levettandbailey.com/cost-data/ L&B TPI – Private Sector by Levett and Bailey ASD TPI – Public Sector by Architectural Services
Department
Chart 1.2.b –Tender Price Indices
In the construction sector, competition appears to have been getting more and more intense. The Building Cost Index as compiled by the Architectural Services Department had been showing an upward trend ever since 1989, but has been virtually constant since the beginning of 2001. The Building Works Tender Price Indices (BWTPI), compiled by the Architectural Services Department and Housing Department for public buildings and public housing projects respectively, that peaked in the first quarter of 1998 have been on the downward trend ever since. BWTPI registered 16% and 7% fall in 2001 after falls of 12% and 13% in 2000 respectively. Then, after some fluctuation in 2002, some stability has been shown in 2003. There are similar patterns in the private sector, as evidenced by the tender price indices compiled by Levett and Bailey and Davis, Langdon and Seah, the two largest cost consultant firms in Hong Kong. The implication of rising building costs, albeit slightly in the last couple of years, and decreasing tender prices is that the construction market remained competitive for yet another year. The year 2003, however, indicates an encouraging, albeit slight, upward trend in the private sector TPI curve.
No tender price indices have been prepared for the civil engineering sector in Hong Kong, probably due to the heterogeneous nature of projects in that sector. Yet, as the global economy slows down and the problem of over-capacity looms over the international civil and infrastructure construction sector, competition in the civil engineering sector is expected to remain keen in the coming year. 1.3 Enhancement and Development of the Construction Industry
The Provisional Construction Industry Co-ordination Board (PCICB) was set up in 2001 following the Construction Industry Review Committee’s recommendations on measures to improve upon the operation and practices of the construction industry. In a similar move to those of the governments in the UK, Australia and Singapore which have reviewed problems and practices of their construction industries, and suggested strategies and policies for improvements, the Government of Hong Kong set up a high-level Construction Industry Review Committee in April 2000. The Committee published its report (CIRC, 2001) in January 2001. The report lists a total of 109 improvement recommendations to “transform” the construction industry particularly in the following areas: fostering a quality culture through partnering;
Quarter/Year In
dex

6
achieving value in construction procurement; nurturing a professional workforce; developing an efficient, innovative and productive industry; improving safety and environmental performance; and devising a new institutional framework to drive the implementation of the change programme for the industry. Ever since the set up of the PCICB, progress has been made to implement the recommendations of the CIRC.
The Provisional Construction Industry Co-ordination Board
There are 5 Working Groups in the PCICB: (1) Construction Cost and Performance Indicators, (2) Construction Site Safety and Employees’ Compensation Insurance, (3) Management of Subcontracting, (4) Manpower Training and Development, and (5) Statutory Industry Co-ordination Board.
The Working Group on Construction Cost and Performance Indicators lists the following as “first batch of priority items” to bring construction costs down: allocation of risks in construction contracts, re-engineering of the building plan approval process, overall review of the Buildings Ordinance, prefabrication and other innovative construction methods, and life-cycle costing (PCICB, 2002). A consultancy study commissioned by Environment, Transport and Works Bureau (ETWB) found that private residential construction costs in Hong Kong was higher than China and Singapore by 44% and 21% respectively, and by 39% and 22% respectively in the case of private office buildings. A package of measures was suggested by both the PCICB and the consultant to bring down the costs, and compilation of sub-indices for different types of projects was put forward (PCICB, 2003). In the allocation of risk, the ETWB and the Hong Kong Construction Association reached agreement that the “Government would accept the risk of unforeseen ground conditions by adoption of re-measurement type of contract when there is a high degree of uncertainty in ground conditions”. It was also thought not equitable by the PCICB that contractors should continue to bear all financial losses due to interferences from third parties who are not agents of Government (PCICB, 2003b). In addition, the Buildings Department is reviewing the Buildings Ordinance with a view of re-engineering building plan approval process, and a consultancy study was to start in March 2003 to examine how the existing regulatory framework could be streamlined to reduce costs. All these measures when finally implemented would help to reduce the risks borne by the contractors and thus theoretically speaking the construction costs and finally tender prices.
Regarding the management of sub-contracting, a tender requirement for public works contractors to submit subcontractor management plans was imposed since January 2003. It aimed to increase transparency on the selection, performance monitoring and control of sub-contracting. In addition, contractual provisions were made to “render it an obligation for the main contractors to prohibit total subletting by subcontractors and to deploy their own staff for subcontractor management and supervision” (PCICB, 2003c).
Progress was also made in construction procurement and construction workers registration. Guidelines were issued in February 2003 to assist works and Housing departments in identifying and dealing with exceptionally low bids. A bill on construction workers registration was introduced into the Legislative Council on 19 March 2003, with registration planned to start in about one year after its enactment (PCICB, 2003c).
Procurement of Public Works
In procurement of public works, PCICB (2001) reiterates the open competition principles that the public construction sector in Hong Kong has been best known for: open and fair competition (same information for all), value for money (tender price plus past performance of tenderers), transparency in procedures and practices (to provide all necessary information), and public accountability. Contractors are assessed on basis of their global as well as local business activity: whether they meet financial, technical and managerial criteria. They must be ISO 9000 certified. Their continuing obligations include: annual filing of unconsolidated audited accounts and half-yearly submission of management accounts to ETWB to satisfy the employed and working capitals requirement, compliance with all statutory regulations (industrial safety, environmental protection and employment of illegal immigrants in particular). There is quarterly performance assessment for each construction contract, and quality audits on works contracts are done on a surprise basis. Contractors would be suspended after receiving two consecutive adverse reports from tendering.

7
Usually all contractors from an appropriate list are invited but prequalification will be invoked for works contracts which are “extremely complex in nature, high value, subject to very rigid completion programmes, calling for high level of co-ordination, and technically demanding”. Contracts are usually offered to lowest tenderers but not always. In the financial year 2000-01, out of the 101 works contracts awarded on the recommendation of the Central Tender Board, 28 were not awarded to the lowest bidders or the lowest conforming bidders. The reasons for not awarding include: (1) lowest tender does not represent the best value for money having regard to the quality aspects of the tender, (2) recent performance of the lowest tender is not satisfactory and there is every doubt on his ability, and (3) the lowest tenderer has heavy workload already.
Prequalification is usually conducted for contracts of “a high-value, complex, technically demanding… subject to very rigid completion programme and (requiring) a high level of co-ordination”. However, if there is time constraint, a marking scheme may be adopted subject to approval. Tenders will then be assessed according to the criteria previously endorsed by the relevant tender board. Normally, tenders attaining highest overall technical and price score would be accepted. Hong Kong became a signatory to the World Trade Organisation Agreement on Government Procurement (WTO-GPA) in May 1997. According to the Agreement, works contracts must be awarded to a tenderer: (a) who has been determined to be fully capable of undertaking the contract, and (b) whose tender is either the lowest, or the tender which in terms of the specific evaluation criteria set forth in the notices or tender document is determined to be the most advantageous. The marking scheme procurement method complies with WTO-GPA, according to Government legal advisor.
As regards the marking scheme, the CIRC recommends that tenders should be accepted on the basis of quality, price and past performance. That means a wider use of marking scheme. Subsequently, there was a follow-up paper (PCICB, 2002b). It was proposed that the current restriction that marking scheme is adopted only when insufficient time does not permit the use of prequalification should be abolished. Further, to streamline the process, a formula-based standard marking scheme should normally be adopted by departments. Only when a non-standard marking scheme is proposed should the department seek prior approval of the relevant tender board. Past performance has now become a major consideration in tender evaluation. The performance score is based on the existing Contractor’s Performance Rating Index System, whish at present is computed on the basis of the contractor’s average performance over the immediate past 3 years. Heavier weightings to the performance of the immediate past year are proposed to be assigned to better reflect contractor’s recent performance. Now, prequalification should not be normally conducted. For design and build contracts, prequalification will be conducted to shortlist 3 to 4 tenderers to maintain competitiveness but without too much abortive work resulting from unsuccessful tenders.
CEPAS
In various Works departments, there are efforts to implement implementations of the CIRC. The Buildings Department has, in August 2002, commenced a consultancy study to develop CEPAS along the lines envisaged in CIRC recommendations, as a means to upgrade environmental performance of buildings in Hong Kong. The concept of CEPAS will provide an objective method and eventually benchmarks to facilitate the community, the professionals as well as the Government to assess the environmental performance of buildings. CEPAS would be further discussed in Section 4.7.1. 1.4 Outlook and Globalisation of the Construction Sector
The construction industry has had another sluggish year. Yet, business opportunities exist for both local and foreign contractors. There are no institutional barriers for foreigners to enter into the local construction industry. For public contract procurement, foreign and local contractors are treated equally. Their eligibility to tender depends solely on their financial, technological and managerial capacity; and on their track records. In the private sector, firms registered with the Buildings Department can tender freely as main contractors. As land premiums in Hong Kong have fallen by over 50%, opportunities abound for the more established contractors to adopt vertical integration by moving into the upstream property development market.
8
In March 2001, Hong Kong’s largest Bank, the Hong Kong and Shanghai Banking Corporation announced that part of its logistical operations would move to Guangzhou because of the inadequacy of information-technology personnel in Hong Kong. This caused the Government to speed up on its re-structuring of the economy as a major high value-added and high technology services provider in the region. The Digital 21 Information Technology Strategy is the Government’s blue print to make Hong Kong a leading digital city in the 21st Century. The development of IT (information technology) applications in commerce and industry has been stressed particularly following the Construction Industry Review Committee’s recommendations on the wider use of web-based information technology in procurement and contract administration. The government has initiated an industry-wide effort on IT application in all possibilities, especially electronic submission of tenders and web-based project management. Tender documents and invitations for consultancy are already disseminated electronically both on CD-ROM and through the Internet. Tender returns and consultancy submissions can now be submitted on CD-ROMs, while internet submission is likely to commence by the end of 2003/04. In June 2001, the pilot Electronic Building Record Management System was launched to provide the public with convenient online access to the records of private buildings in the Yau Tsim District. There are ample opportunities for foreign investments in applying IT to enhance productivity in design, management and construction of building and civil engineering projects. Active research and development works are being carried out in computer-aided design and drafting, structural analysis, building services analysis, building automation cost planning and control systems, facilities management, property and maintenance management, and smart-card technology. It is anticipated that in the next few years, continuous effort will be made on the application of information technology to enhance the productivity of the construction industry.
Business alliance opportunities exist not only in China Hong Kong but also in China Mainland which one Government official perceives as “opening of a huge domestic market” for Hong Kong. The Government estimated that China’s accession to the WTO will raise Hong Kong’s mainland-related export volume by an additional 15% by 2010, an average of 1.3% yearly. During the same period, Hong Kong’s GDP is expected to grow by an additional 5.5%, an average of 0.5% every year. The local construction sector will also benefit as well. In Hong Kong, as already mentioned, the construction of major infrastructure works needs the participation of foreign contractors. The Government is already investing over $400 billion in more than 1 600 projects, most of which are due to be completed within the next nine years for which local contractors have teamed up with foreigners to form joint ventures. This practice is expected to continue and to expand beyond the Special Administrative Region into China Mainland, where many large-scale construction projects are initiated by Hong Kong developers, contractors and investors. Opportunities exist for foreign contractors and consultants to link up with the Hong Kong side to promote packages of design-and-build and build-operate-transfer projects. In particular, the exploration of the Western region in China Mainland provides good opportunities. In the property market, China Mainland continues to show keen interest in further developing the physical infrastructure, and foreign investment may find ample opportunities especially in the following sectors: luxury office and residential apartments, hotels and affordable housing. The near future looks promising now that preparations for hosting the Games in 2008 are underway. The Chief Executive in his policy address in October 2001, presented policies to embark on major infrastructure links with the neighbouring Guangdong Province as part of Hong Kong’s strategy to strengthen economic co-operation with the Pearl River Delta region.
The Mainland/Hong Kong Closer Economic Partnership Arrangement (CEPA) has been launched to promote the joint economic prosperity and development of the Mainland and the Hong Kong Special Administrative Region and to facilitate the further development of economic links between the two sides and other countries and regions. To achieve these objectives, following measures will be implemented under CEPA:
1. progressively reduce or eliminate tariffs and non-tariff barrier on substantially all the trade in goods between the two sides;
2. progressively achieve liberalization of trade in services through reduction or elimination of substantially all discriminatory measures;

9
3. promote trade and investment facilitation.
CEPA will be discussed in more detail in Section 5.6.

10
2 MACRO ECONOMIC REVIEW AND OUTLOOK 2.1 Main Macroeconomic Indicators
1994 1995 1996 1997 1998 1999 2000 2001 2002 2003 Q2
GDP at constant (2000) market prices (HK$ million)
727,506 755,832 789,753 831,317 785,338 808,826 893,263 894,587 1,323,650 640,035
GDP at current market prices * (HK$ million) 1,029,773 1,096,263 1,210,925 1,344,546 1,279,850 1,246,134 1,288,338 1,269,975 1,259,771 585,621
GDP at factor cost (production–based)
* (HK$ million) 968,900 1,041,072 1,158,963 1,267,489 1,205,349 1,177,796 1,288,897 1,215,354 — —
GDP growth (%) 5.4 3.9 4.5 5.3 – 4.7 – 3.1 10.5 0.9 – 0.3 —
Primary sector (HK$ million) 24,021 25,349 28,743 30,949 35,376 35,835 — — — —
% growth 2.0 – 4.1 – 0.8 – 1.0 — — — — — —
Manufacturing sector * (HK$ million)
88,388 86,114 84,277 81,722 72,601 67,540 71,655 63,519 — —
* % growth – 5.6 – 2.6 – 2.1 – 3.0 – 11.2 – 7.0 6.1 – 11.4 — —
Services sector * (HK$ million) 807,255 871,598 977,107 1,078,943 1,023,836 1,004,335 1,053,202 1,052,582 — —
* % growth 17.4 8.0 12.1 10.4 – 5.1 – 1.9 4.9 – 0.1 — —
Construction sector * (HK$ million)
46,612 55,192 65,822 72,759 71,000 67,232 64,026 58,971 — —
* % growth 7.5 18.4 19.3 10.5 – 2.4 – 5.3 – 4.8 – 7.9 — —
End Year Population 6,119,300 6,270,000 6,421,300 6,617,100 6,689,000 6,711,500 6,724,900 6,759,500 6,786,100 6,818,000
Population growth rate (%) 2.0 2.5 2.4 3.0 1.1 1.0 0.9 0.9 0.9 —
Total labour force 2,929,000 3,000,700 3,093,800 3,216,000 3,358,600 3,342,500 3,402,200 3,439,900 3,487,100 3,519,500
Total Labour force growth rate (%) 2.5 2.4 3.1 3.9 4.4 1.2 1.9 1.1 1.4 —
Unemployment rate (seasonally adjusted)
1.9 3.2 2.8 2.2 4.7 6.3 5.6 6.1 7.3 8.6
Changes in Consumer Price Index (%) 9.5 7.2 6.6 5.2 – 1.6 – 4.0 – 3.8 – 1.6 – 3.0 – 2.8
Changes in GDP deflator (%) 6.9 2.5 5.9 7.2 0.8 – 6.5 – 5.4 – 0.5 0.6 —
Short term interest rate (%) 5.66 5.55 4.45 7.50 5.04 3.77 4.38 2.55 0.75 0.16
Long term interest rate (%) 8.42 6.31 6.70 9.27 6.17 5.76 5.4 2.12 0.16 0.08
Annual average exchange rate with $US(HK$) 7.728 7.736 7.734 7.742 7.745 7.758 7.780 7.791 7.799 7.798
— : Data not available * : Census and statistics Department has done a comprehensive review and revision of GDP calculations
in August 2002 (the sixth of its kind, the previous being in 1980, 1984, 1987, 1991 and 1994). Hence the figures may be slightly different from those reported in previous AsiaConstruct reports.
Sources: Macro-economic review: Census and Statistics Department, Annual Digest of Statistics, various issues
Census and Statistics Department, Monthly Digest of Statistics, various issues Economic Prospects, Govt of the HKSAR, various issues Economic Background, Govt of the HKSAR, various issues Economic Report, Govt of the HKSAR, various issues
GDP and Components: Gross Domestic Product 2003 Demographic Indicators: Government of the HKSAR web-page: http://www.info.gov.hk Financial Indicators: Annual Report on the Consumer Price Index 2002
Hong Kong Monetary Authority, Monthly Statistical Bulletin June 2002 http://www.info.gov.hk/hkma/eng/statistics/msb/index.htm
Table 2.1 – Macro-Economic Indicators

11
2.1.1 Overview of national economy
The economy of Hong Kong suffered a sharp slowdown in 2001, with GDP growth decelerating to a virtually stagnant 0.9% from 10.5% in 2000. The major contributing factors were a drop in exports and a weakening of consumer and business sentiment, stemming from the difficult economic environment worldwide. Amid the deterioration of global growth, total exports of goods and services dropped by 2.1%, reversing a 16.7% surge in 2000. Merchandise exports contracted by 3% from 17.1% expansion in 2000. Within this total exports, domestic exports tumbled by 11%, in contrast to a 7.5% rise in the previous year, and re-exports registered a 2% decrease, after soaring by 18.5% a year earlier. Domestic exports of electronic components registered a marked fall, while re-exports of consumer goods, raw materials, and semi-manufactures also slumped. Domestic demand growth slumped to 0.2% in 2001 from 10% in 2000. Expansion in private consumption fell to 2% from 5.4% over the same period, reflecting consumer sentiment that was undermined by a drop in asset prices and rising uncertainty over employment. Given the bleak business outlook, gross fixed capital formation averaged a 2.1% increase, compared with a 9.8% rise in 2000. While the first two quarters of 2003 followed the same pattern, the recovery trend in the final two quarters, due to increase in tourism, may improve the overall figures for this year. Through out the 3rd Quarter 2003, unemployment rate continued to decline from an all time high of 8.7% in July to 8.3% in September. Gross Domestic Consumption, Consumer Price Index and the number of property transactions registered have begun to increase. CEPA is expected to boost Private consumption 3.4% in 2004. Deflationary trend and the negative growth of GDP are also narrowing down.
Expenditure on building and construction declined further by 2.5%, the fifth consecutive year of contraction following the fall of 7.7% in 2000. Private sector developers remained cautious in view of the overhang of supply in the residential property market while residential public sector projects were also scaled back. Investment on commercial buildings showed a sharp rise in 2002 although the trend was not sustained in 2003. However, with the implementation of CEPA in 2004, private investment is expected to rise.
Labour market conditions deteriorated during the year. The seasonally adjusted unemployment rate, having trended downward from a peak of 6.4% at the beginning of 1999 to 4.4% in the fourth quarter of 2000, edged up to 6.1% by the fourth quarter of 2001. The rise was attributed to increased corporate downsizing and layoffs in the context of slowing aggregate demand and the skills mismatch caused by ongoing economic restructuring. Partly as a result of a sustained fall in import prices, a depreciation of regional currencies against the US dollar, and a benign external inflationary environment, deflation took hold, as the consumer price index fell for the third consecutive year in 2001. Unemployment continued to rise peaked to an all time high at 8.7 by the end of July 2003. However, it has since then encouragingly declined to 8.3%.
The composite consumer index was lower by 1.6% in 2001, considerably reduced from the fall of 3.8% in 2000. Fierce retail price competition and a weak property market that resulted in falling property rentals also put downward pressure on prices. The GDP deflator, a broad measure of overall price change in the economy however rebounded to a 0.5% rise in the fourth quarter of 2001 over a year earlier, attributed to improvement in trade, and eventually recorded an overall rise of 0.6% for the year 2003. For 2001 as a whole GDP deflator fell by 0.5%, much reduced from the 6.5% decrease in 2000. Domestic spending plunged to an all time low due to SARS (Severe Acute Respiratory Syndrome) outbreak in the first two quarter of 2003.
Property apparently ceased to be the economic growth driver in Hong Kong for yet another year, although the number of transactions registered in the 3rd quarter recorded an increase. Since its collapse following the outbreak of the Asia crisis in 1997, property owners are still saddled with diminished wealth and financial hardship caused by negative equity. Consumer confidence plunged and showed no sign of recovery in 2001. With the rise of the service sector (though severely hit by SARS), it is expected to replace the property sector as the economic growth driver in Hong Kong. For example, the Economist Intelligence Unit has suggested that Hong Kong should accept this new reality rather than trying to recreate the past!

12
Under the currency link to the US dollar, and the weakening of the latter, the Hong Kong dollar weakened against most regional currencies in 2003, thus making Hong Kong more competitive. The Hong Kong Dollar continued to remain close to the linked rate throughout the year. Money market interest rates fell drastically, due to aggressive monetary easing by the US Federal Reserve and to excess liquidity in the domestic market and particularly also due to the deregulation of interest rates since July 1 2001. The 2003 budget sets out plans for, among other things, building Hong Kong into a regional metropolis, improving facilities at the boundary crossings, taking the economic down turn as an opportunity to invest substantially on the infrastructure, improve investment opportunities under the “big market, small Government” principle. 2.1.2 Economy in the third quarter of 2003 After peaking with strong double-digit growth in 2000, Hong Kong experienced a severe contraction over the past two years. The SARS (Severe Acute Respiratory Syndrome) outbreak affected the first two quarters of 2003 severely.
The third quarter has brought in hopes that Hong Kong’s economic downturn has bottomed out. Commencing in August, with the influx of tourists from the Mainland, the unemployment rate has reduced from its all time record of 8.7% to 8.3%. Private spending and the number of property transactions registered have increased. The weakening US Dollar has weakened the Hong Kong Dollar (because it is pegged to the former) relative to other currencies in the region, thus positively affecting the competitiveness of Hong Kong. Tourism from the Mainland has also contributed to an upsurge in the property market, especially closer to the land entry points to Hong Kong and the along the cross-border Kowloon Canton Railway line.
The high unemployment rate, persistent lacklustre performance of the stock and property markets, the large proportion of property owners being trapped in negative property equity, and the implementation of the Mandatory Provident Fund continue to be attributed as major causes of this lack of confidence. Prolonged slump in market confidence has led to a growing backlog of unsold residential units. It may be appropriate that the Hong Kong construction industry should look for revival through the construction of infrastructure that complements the fast developing services sector, rather than to seek recreation of the past through a rebounding of property market. 2.2 Economic outlook in the next 5 years
Key indicators 2003 2004 2005 2006 2007 2008 Real GDP growth (%) 2.0 6.2 4.1 3.3 3.4 3.2 Consumer price inflation (av; %) -2.9 -0.9 0.0 1.0 1.5 1.7 Budget balance (% of GDP) -6.8 -4.1 -3.4 -2.8 -1.8 -1.4 Current-account balance (% of GDP) 10.7 10.1 8.8 7.4 5.7 5.3 Commercial banks’ prime rate (av %) 5.0 5.3 7.6 8.0 8.0 7.8 Exchange rate HK$:US$ (av) 7.8 7.8 7.8 7.8 7.8 7.8 Exchange rate HK$:¥100 (av) 6.6 6.6 6.7 6.8 6.8 6.9
Table 2.2 Forecast by the Economist Intelligence Unit (UK)
One of the major factors seen to reverse the deflationary trend, rising unemployment and the downward trends of GDP growth was an increase in tourism from the Mainland due to the Chinese Mainland Government’s decision to liberalise tourism restrictions allowing persons to tour Hong Kong on an individual basis. The Mainland/Hong Kong Closer Economic Partnership Arrangement (CEPA) is expected to provide another major economic boost in the coming years by opening wider business opportunities in the Mainland for Hong Kong based companies. The Economist Intelligence Unit forecasts

13
a higher GDP growth in 2004 and the deflationary trend to end by 2005. Currently, Hong Kong is experiencing a budget deficit. Initially there was a rather ambitious target to end the deficit by 2007. Currently, however, the Financial Secretary Mr. Henry Tang is reviewing this target. Hence, the budget deficit is expected to remain beyond the next 5 years.
Services contributed respectively 86% and 92% of the Hong Kong’s GDP in the years 2001 and 2002. The city’s competitive advantages lie in the creation, maintenance and enhancement of an environment that is conducive to high value-added business by virtue of the critical mass of professionals, professional and management consulting firms, institutional investors and traders doing business, including port business, that help create wealth for Hong Kong. Hong Kong has excelled in free flows of information, people, and capital and in currency convertibility. Together with the established legal framework and the regulatory institutions, these factors have helped Hong Kong to be consistently among the top ranks in various league tables of competitiveness and business-friendliness.
The biggest strength of Hong Kong has been its workforce. Hong Kong people remained very hard working. In 1998, they worked an average 2,400 hours per annum, the highest in the world; in terms of labour effort, but, Hong Kong ranked only twenty-eighth in 1999. The Government has realized the urgency of enhancing Hong Kong’s competitiveness. The push for high-tech development has also implied the Government’s undertaking a greater role, manifested in the efforts to attract a Disneyland theme park and in the blue print for the Cyberport scheme. Public spending grew by 3.5% to HK$290 billion in fiscal year 2001-2002, with education receiving the largest share and social welfare realizing the biggest growth. However, in the coming fiscal year, the Government appears to be forced to cut down spending, including on education, by more than 10% over the next 5 years.
In the construction sector, local contractors in Hong Kong have been active in infrastructure and building projects in the Mainland. The local Trade Development Council has been gearing up its marketing effort to help local contractors to enter the Mainland market, especially now that China is turning her attention to the “Big West”. The Construction Industry Review Committee (CIRC, 2001) has recommended that, “leveraging on the city’s expertise in accounting, financing and legal services, Hong Kong has strong potential to develop into an infrastructure service integrator for the Mainland market and elsewhere”.
In the short to medium term, Hong Kong’s position as the international financial window for the Mainland is unrivalled. Hong Kong and Shanghai (or Shenzhen) are seen to perform complementary roles. Hong Kong is expected to cater for the huge financial needs of China’s state-owned enterprises (SOEs) as they restructure, helping the SOEs raise finance from investors coming from all over the world. A listing in Hong Kong is seen as having complied with stringent international regulations. This has the effect of lowering the cost of money back home. Shanghai, for the time being, will instead help Chinese firms raise finance from within the domestic market. 2.3 Construction Industry Outlook in the next 5 years
The outlook for the construction sector in Hong Kong is good. The Government is already investing over $400 billion in more than 1 600 projects, of which most are due to be completed within the next nine years. Major works in progress include Castle Peak Road improvements, work on Container Terminal 9 back up facilities, Phase I of Hong Kong Disneyland, and the Science Park in Pak Shek Kok. The main focus of the public works programmes is now on transport, land formation, the port, housing, tourism-related developments, education, hospitals and improvements to the environment. The Government also plans to launch shortly projects such as Route 9 Tsing Yi to Sha Tin Section, Route 10 Linking North Lantau and Yuen Long Highway, the South East Kowloon Development and Central Reclamation Phase III.
Another very large construction project potentially in the pipeline is the huge bridge connecting Hong Kong on the eastern side of the Pearl River, and Zhuhai, Zhongshan and Foshan cities, as well as Macao, on the western side of the river. The “Y” form bridge will be 28 kilometers long and some experts have also proposed other designs, such as a combination of bridge and undersea tunnel.

14
Works arising from the Railway Development Strategy, the redevelopment of the Kai Tak Airport and its adjacent areas, the construction of the Cyberport, and the construction of the Disneyland Theme Park development are currently being carried out and should stir construction industry. In the building sector, the public housing programme may have been scaled down, but what is public sector loss is private sector gain. Private sector building activity is likely to perk up as soon as the economy shows some signs of recovery. Hong Kong’s property developers have made bullish plans to develop huge residential projects, but may have to postpone them as the housing market softens.
Railways are one of the most environmentally-friendly and cost-effective modes of transport in Hong Kong. In all, the Government and the two railway corporations will be investing $600 billion in infrastructure to boost and to reflect the confidence in Hong Kong’s long-term prospect as a regional transportation and business hub. Many jobs will be generated in the construction and its related industries. The two railway corporations are currently working on six projects - West Rail, the MTR Tseung Kwan O Extension, the Ma On Shan Line, the KCR Extension to Tsim Sha Tsui, the Penny’s Bay Rail Link and the Sheung Shui to Lok Ma Chau Spur Line. These projects are due to be completed in stages between 2002 and 2007 at a total cost of about $100 billion. Other projects which are in the pipeline or underway are Sha Tin to Central Link, the Island Line Extensions, the Kowloon Southern Link, the Regional Express Line, the Port Rail Line and the Northern Link which will involve expenditure of around $100 billion. Work is expected to be completed in stages from 2008 to 2016.
Meanwhile, the Government is embarking on major infrastructure links with neighbouring Guangdong Province as part of its strategy to strengthen economic co-operation with the Pearl River Delta. There is a mutual agreement on the target for completing the Shenzhen-Hong Kong Western Corridor by 2005. Construction of the Hong Kong side of the Deep Bay Link will begin in 2003. The Sheung Shui to Lok Ma Chau Spur Line is due to be finished by 2007. Besides, the rail service link to Shenzhen and Guangzhou and onward links will offer scope to Hong Kong companies for greater integration with businesses in the Mainland. The Mainland section of the link has already been planned. The Hong Kong section of the express railway from Hung Hom to Shenzhen is now in early design stage. This will connect to the proposed Shenzhen-Guangzhou express line. As the Government has aimed to strengthen Hong Kong’s important role as a gateway to the Mainland, there are ample opportunities for construction firms to undertake such large infrastructure projects as the Deep Bay Link, tunnels and bridges on Routes 9 and 10, new railway lines and sewerage works.
In the private sector, the property market is expected to bottom out as the general economy recovers. Opportunities for builders in the years 2004 and ahead are good with many Chinese Mainland visitors showing strong interests in buying property in Hong Kong. Building and civil engineering construction in both public and private sectors will remain active in the next few years, if not more so. Hong Kong has been an attractive destination for foreign contractors over the years. While this issue is dealt more at length in Section 5, it is important to mention again that in Hong Kong there exists no institutional barrier for foreign contractors to enter the local construction industry. For public contract procurement, foreign and local contractors are treated alike and no distinction is made. In the private sector, firms once registered in the Buildings Department could tender freely as main contractors. Quasi-governmental agencies like KCRC also entertain contractors in the same fashion once registered.
Hong Kong is striving to re-structure its economy into a services provider, and into a high technology and high value-added provider. The development of IT (information technology) applications in commerce and industry continues to be emphasized. The Digital 21 Information Technology Strategy is the Government’s master plan to make Hong Kong a leading digital city in the 21st Century. It presents an all-encompassing strategy based on five key result areas: to enhance the world-class e-business environment in Hong Kong; to ensure that the Hong Kong Government leads by example; to develop Hong Kong’s workforce for the information economy; to strengthen the Hong Kong community for digital exploitation; and to leverage Hong Kong’s strength in exploitation of enabling technologies. In the construction industry in particular the theme of IT is likely to get a huge boost in the coming years particularly by Digital 21 efforts.
15
The construction sector in particular offers ample opportunities for foreign investments in applying IT to enhance productivity in design, management and construction of building and civil engineering projects. Further, the development of intelligent building (IB) provides opportunities for contractors to utilize their expertise in incorporating advanced technologies in construction. The encouragement for producing intelligent buildings is also in line with the territory wide crusade for environmental upgrading. The multinational companies’ increasing allegiance with wider environmental issues is likely to push environmentally sensitive construction materials and techniques. In civil engineering construction however, many sub-sectors still require the participation of foreign contractors for their technology and expertise. Bridge construction and tunnelling, for example, require advanced or proprietary technologies, especially when time budget is tight. Foreign contractors would thus be very much sought after when the massive railways and highways programmes reach the construction stages. 2.3.1 Major Projects in Pipeline
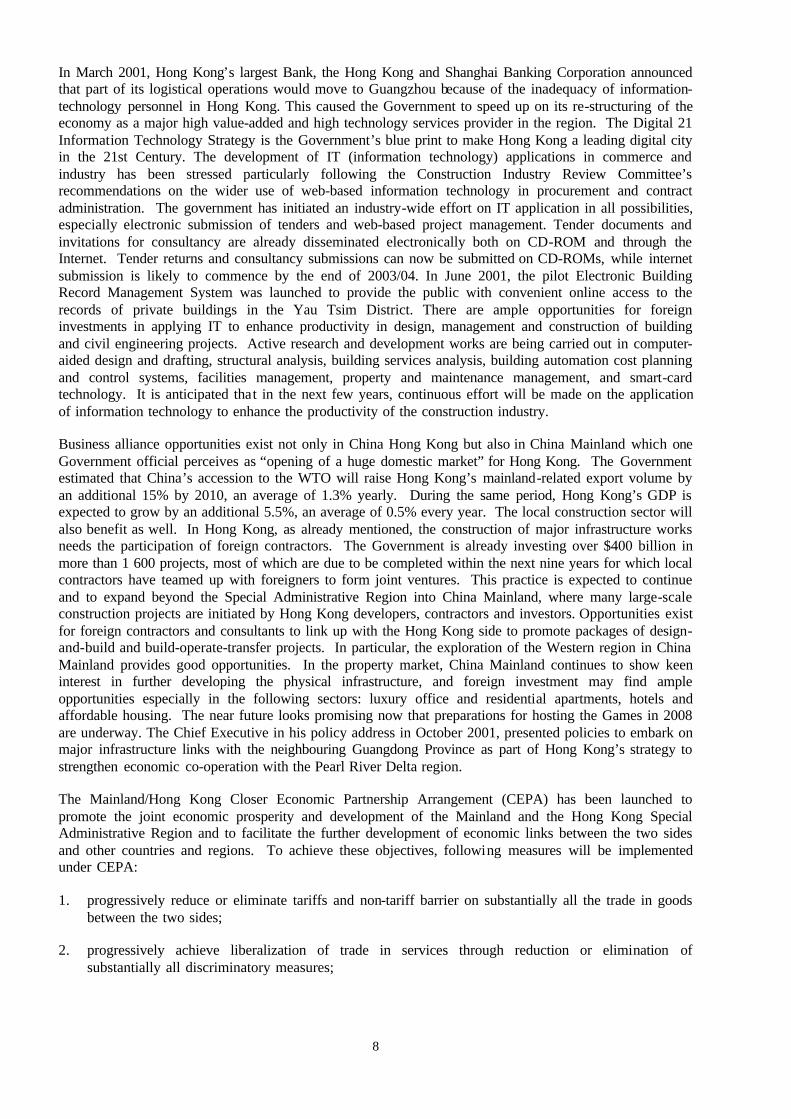
Hong Kong construction industry has offered business opportunities for both local and foreign contractors over the years. A sample of projects, as published by various government departments, coming in the short, medium and long terms are listed below:
Short term (2003-2005)
Name of project Brief description of project Period
Value of project ($ million unless otherwise stated)
Foreign partici-pation needed
Residential
Ma Wan Development Joint venture project, but mainly developed by Sun Hung Kai Properties. Total Gloss Floor Area (TGFA) in sq.ft. is 3,013,900
To be completed in 2000/01 to 2002/03
n.a. n.a.
San Miguel Brewery Site at Sham Tseng
Lot 206 in DD 390. Wheelock & Co. Ltd. Owned 74% of the project. Site Area is 494,700 sq.ft. TGFA is 2,826,000 sq.ft. n.a. n.a. n.a.
Belcher Gardens Redevelopment
Joint venture project, mainly developed by Shun Tak, Sun Hung Kai Properties and New World Development. Site Area is 322,894 sq.ft. TGFA is 2,661,641 sq.ft.
To be completed in 2000/01 to 2002/03 n.a. n.a.
Residential development for Tsuen Wan West Station
Developed by the Kowloon-Canton Railway Corporation (KCRC), the 259,000 sq ft site will comprise seven 40- to 44-storey residential towers to house 1,776 units.
n.a. n.a. n.a.
Tai Kok Tsui residential Phase 1
Henderson Land’s large-scale residential project at Tai Kok Tsui Shipyard. Phase 1 of the project will comprise five residential towers and provide 1,760 units. Sizes of the flats ranging between 500 sq ft and 800 sq ft.
the first quarter of 2003. n.a. n.a.
The Ocean Shores Phase 2 development in Tseung Kwan O
The HK$1.1 billion (US$141.02 million) second phase of development containing more than 1 million sq ft of GFA in four 48-storey residential towers, providing 1,536 units. The development is jointly-developed by Sun Hung Kai Properties and Swire Properties. Gamfield, a joint venture between Gammon Construction and Sanfield, the Building Contractors acts as the management contractor.
To be completed by March 2002. n.a. n.a.
Commercial
Cityplaza 2, Taikoo Shing, 1111 King’s Road
A 34 storey 574,558 sq.ft. office tower above 43,821 sq.ft. retail space on the site of Mount Parker House which is being demolished. Site area is 145,943 sq.ft. TGFA is 618,379 sq.ft. Developed by Swire Properties.
n.a. n.a n.a.
Pacific Forum, One Queen’s Road East, Tower Two
Site area is 22,177 sq.ft. TGFA is 332,475 sq.ft. Developed by Swire Properties. n.a. n.a. n.a.
Pacific Forum, One Queen’s Road East, Tower One
Site area is 10,804 sq.ft TGFA is 172,674 sq.ft. Developed by Swire Properties. n.a. n.a n.a.
Industrial 35-47 Tsing Yi Road, Tsing Yi
Wholly owned by New World Development. Site area is 305,190 sq.ft TGFA is 1,525,958 sq.ft. n.a. n.a. n.a.
15-19 Luk Hop Street, Sun Po Kong,
Wholly owned by New World Development. Site area is 23,788 sq.ft TGFA is 285,456 sq.ft.
n.a. n.a. n.a.
Site at Kwai Hei Street, Kwai Chung.
I/O building 54% owned by Wheelock & Co. Ltd. Site area is 25,489 sq.ft. TGFA is 242,100 sq.ft. n.a. n.a. n.a.
Institutional
Hospital Redevelopment of 2 blocks in Caritas Medical Centre Jan. 1998 - early 2002 $769 n.a.
Other Building -MTR Airport Railway Station Development

16
Name of project Brief description of project Period
Value of project ($ million unless otherwise stated)
Foreign partici-pation needed
Tung Chung Station The site area covers 22 hectares. The development comprises over 10,700 flats (750,000 sq.m.), 15,000 sq.m. of office space, 56,000 sq.m. of retail and one 400-room hotel.
Ongoing - 2002
$10,000 (1st phase) $5,000 (2nd phase)
n.a.
Infrastructure Strategic Road System - Tsing Yi North Coastal Road
This is a 2.1km dual two-lane carriageway linking Tsing Tsuen Bridge and Lantau Link. Construction is expected to start in 1999. Tender documents are under preparation.
1999 – 2002 $1,226 n.a.
Railway - MTR Tseung Kwan O Extension
This is an extension of the existing MTR line from Lam Tin to serve the Tseung Kwan O new town when its population reaches 250,000. Land development programme indicates that the population threshold will be reached by 2001. Construction is expected to commence in early 1999.
1999 – 2002 $25,000 n.a.
Reclamations -Central & Wanchai Reclamation
This Reclamation is divided into 5 phases which altogether provide 110 hectares of land adjoining Hong Kong’s central business district. Central Reclamation Phase 1 is included within the ACP. This reclamation provides land for the Airport Railway, Convention and Exhibition Centre Extension, 22 hectares of new commercial sites, 46 hectares of road links and 29 hectares of open space.
1993 – 2003 $10,005 n.a.
Central Reclamation Phase III
The final phase of reclamation in Central. The project will provide 18 hectares land for essential transport infrastructure and the area will later be developed into a world class waterfront.
2003 (Programme being developed) n.a. n.a.
HK-Shenzhen Western Corridor
Construction of the western passage between Hong Kong and Shenzhen, south China’s Guangdong Province 2003-2005 $12,600 n.a.
Deep Bay Link Construction of a 5.4-kilometre dual three-lane carriageway linking the Shenzhen Western Corridor at its landing point in Ngau Hom Shek with the Yuen Long Highway at Lam Tei
2003-2005 $4,600 n.a.
Permanent Aviation Fuel Facility (PAFF)
Jetty about 575 metres long off the shore of Tuen Mun Area 38. Twin submarine aviation fuel pipelines, each of 500 millimetres diameter and about 4.8 kilometres long, would be required to tie into the existing twin submarine pipelines at the Aviation Fuel Receiving Facility (AFRF) at Sha Chau.
2004-2006 n.a. n.a.
Submarine Gas Pipelines
Submarine Gas Pipelines from Cheng Tou Jiao Liquefied Natural Gas Receiving Terminal, Shenzhen to Tai Po Gas Production Plant, Hong Kong by the The Hong Kong and China Gas Company Limited.
2004-2005 n.a. n.a.
Tung Chung - Ngong Ping Cable Car Project
Construction of a cable car system of about 5.7km long between with associated towers and other supporting structures, two termini, angle station and other associated infrastructure.
2003-2005 HK$750 million n.a.
Medium Term (2006-2008)
Name of project Brief description of project Period
Value of project ($ million unless otherwise stated)
Foreign partici-pation needed
Institutional
Hospital Redevelopment of Castle Road Hospital April 1998 -early 2004
1.47 billion n.a.
Other Building - MTR Airport Railway Station Development
Olympic Station
The whole project in Tai Kok Tsui includes about 390,000 sq.m. of residential floor space (5,250 flats) in 18 housing blocks, 111,000 sq.m. of office in 4 blocks, 65,000 sq.m. of retail space, 2 hotels (1,100 rooms) and about 2,500 carparks. Total site area is 16.54 hectares and is planned to be developed in three phases.
Ongoing - 2004
$10,000 (1st phase) $12,000 (2nd phase) n.a. (3rd phase)
n.a.
Hong Kong Station
This is regarded as the most prestigious site located at the existing commercial core district at Central. The development comprises about 254,190 sq.m. of office in 2 blocks, 59,460 sq.m. of retail space, two hotels (1,200 rooms) and transport facilities. It has been awarded to a consortium comprising Sun Hung Kai Properties, Henderson Land and Bank of China Group.
On-going -2005 $40,000 n.a.
Infrastructure Strategic Road Network - Central & Wanchai Bypass & Island Eastern Corridor Link
It is a proposed 6-lane east-west road link on Hong Kong Island. It is projected to relieve traffic pressure on parallel roads in the urban commercial districts. Construction of this road depends on the timing of the Central & Wanchai Reclamation.
1998 - 2005
$8,989
n.a.

17
Name of project Brief description of project Period
Value of project ($ million unless otherwise stated)
Foreign partici-pation needed
Strategic Road Network - Route 16
This is a proposed dual 3-lane tunnel expressway connecting Shatin with West Kowloon. It will improve traffic flow between Northwest New Territories and Kowloon. Construction is expected to commence in 2001.
2001 - 2004 $8,000 n.a.
Railway - West Rail
This is a new heavy rail link to the Chinese Border. The whole project accommodates three services including a long distance freight service (Port Rail Line), a cross-border passenger line and a sub regional passenger service for the new towns in North West New Territories. KCRC has been appointed to build and operate this railway. Phase 1 construction is expected to art in 1998.
1993 - 2003 $75,000 n.a.
Railway - East Rail
East Rail as the north-south strategic railway corridor in Hong Kong complemented by West Rail as the east-west corridor. In 2000, the Finance Committee announced the approval of a HK$8.5 billion equity injection from the Government to Ma On Shan and Tsim Sha Tsui Extensions. The combined capital cost of these three projects at Money of the Day is HK$26.7 billion.
2005 n.a. n.a.
Lok Ma Chau Spur Line Lok Ma Chau Spur Line will branch off from East rail just north of Sheng Shui Station. It will run 7.4 Km westwards to Lok Ma Chau Station. Administered by KCR.
2004 n.a. n.a.
Route 9 Highway
Route 9 (to be renamed as Route 8) between Tsing Yi and Sha Tin, via Cheung Sha Wan, including a 1.6 km high level bridge, with a centre span of 1,018 m, crossing Rambler Channel and some kilometres of viaducts.
2002 - 2007 n.a. n.a.
Long Term (2009-2012)
Name of project Brief description of project Period
Value of project ($ million unless otherwise stated)
Foreign partici-pation needed
Other Building - MTR Airport Railway Station Development
MTR Airport Railway Station Development -Kowloon Station
This project is planned to be a focal point in the West Kowloon Reclamation area. The whole project will comprise 18 residential towers (4,800 flats), about 264,450 sq.m. office space in three blocks, 80,000 sq.m. of retail space, four hotels (2,400 rooms) and over 6,600 carparks. It will be developed in phases which take about 9 years to complete.
Ongoing - 2006 $71,000 n.a.
Infrastructure
New Airport Related Projects - Tung Chung Development Phase 1
The new town at Tung Chung will have 20,000 residents by the time the airport opens in 1998 and have up to 200,000 persons by 2011. It is intended to be a support community to the new airport. Housing, open space, institutional, community and government facilities will be provided. A sewage treatment work will be built at Siu Ho Wan and a refuse transfer station at Sham Shui Kok.
1989 - 2011
$2,800
n.a.
Port Facilities - Lantau Port (CT10-14)
The new port will occupy over 1,020 hectares and provide up to 24 berths in 5 terminals. Each berth will have a 320-m quayface, a terminal area of 20 hectares supported by 10 hectares of back-up land. Each berth can handle a minimum annual throughput of 400,000 TEUs. Detailed design work for CT10 and CT11 has been completed.
2000 - 2006
$44,000 for CT 10-12 n.a. for CT13-14
n.a.
Reclamations - Green Island Reclamation
This Reclamation will provide some 186 hectares of land at the western end of Hong Kong Island for housing 124,000 persons and facilitating urban renewal in the Western District. Lane use distribution includes 53 hectares for housing, 22 hectares for community uses, 5 hectares for industrial, 19 hectares for open space and 87 hectares for new roads.
1999 - 2011 $10,672 n.a.
Reclamations -South East Kowloon
An area of 340 hectares will be reclaimed around the existing Kai Tak Airport runway after the airport is closed down. This reclamation area, together with the airport site, will be developed into a new ‘city within a city’ for 285,000 persons and to provide 110,000 jobs. The area will provide solution space for restructuring the developed areas in Central and East Kowloon.
1999 - 2011 n.a. n.a.
Strategic Road Network - Route 9
This route connects Tsing Yi with Cheung Sha Wan and is expected to provide traffic relief to the existing Route 3 corridor near container port.
1998 - 2006 $10,000 n.a.

18
Name of project Brief description of project Period
Value of project ($ million unless otherwise stated)
Foreign partici-pation needed
Strategic Road Network - Route 10 (Shan Tseng Link)
This serves as an additional transport infrastructure facility to Northwest New Territories and is intended to alleviate traffic load on Tuen Mun Road. It is a dual-two lane road connecting the eastern part of Lantau Island and Yuen Long West via Tai Lam Chung by a new expressway with bridges and tunnels. Construction is expected to start in 2002.
2002 - 2007 $23,000 n.a.
Strategic Road Network - Central Kowloon Route
This route comprises a dual-two lane tunnel of 2.6km and will help to relieve congestion on the existing east-west roads, principally Lung Cheung Road, Boundary Street, Prince Edward Road, Argyle Street, and the Gascoigne Road flyover. Construction is expected to start in 2003.
2003 - 2007 $3,800 n.a.
Route 10 - North Lantau to Yuen Long Highway
Route 10 - NLYLH is a 12 km (approx.) dual 3-lane expressway from North Lantau to Lam Tei in North West New Territories, including construction of a dual 3-lane suspension bridge.
2003 - 2010 n.a. n.a.
Central - Wan Chai Bypass and Island Eastern Corridor Link
Construction of about 4 km long trunk road connecting the Rumsey Street Flyover at Central and the Island Eastern Corridor at Causeway Bay, including a 2.3 km long dual 3-lane road tunnel, two 0.7 km long 2-lane one-way road tunnels and a 1.0 km long dual 4-lane elevated road
2004 - 2012 n.a. n.a.
Central Kowloon Route 4.7 km trunk road between the West Kowloon reclamation and the future South East Kowloon development, including 3.9 km dual 3-lane tunnel
2007 - 2011 n.a. n.a.
Hong Kong - Zhuhai - Macao Bridge
A huge bridge will be built in south China connecting Hong Kong on the eastern side of the Pearl River, and Zhuhai, Zhongshan and Foshan cities, as well as Macao, on the western side of the river. The “Y” form bridge will be 28 kilometers long and some experts have also proposed other designs, such as a combination of bridge and undersea tunnel.
n.a. (being co-ordinated) $15 billion n.a.
2.4 Overview of the Construction industry
The local construction sector that accounted for 5.4% of GDP throughout the nineties, accounted for 5.3% in 2000. The gross value of investment in construction activities accounted for 35% of total fixed capital formation in 2000. The share of employment by the industry stood at 9.2% in 2001 as compared to 7.7% in 1991. By March 2001 there were 1,008 construction sites in Hong Kong that employed some 87,813 workers. The employment level for the broader building, construction and real estate sectors spreads over 250,000 including such professionals as architects, surveyors, structural engineers, building services engineers and civil engineers. Shrinking of the construction industry, as evidenced by the decline in the number of persons employed and the gross value of work done continued until the 2nd Quarter 2003, although the rate of decline tended to become slower. This negative trend is expected to end and 2004 is expected to show growth, considering the increased tourism and the interest in the property market shown by the Mainland visitors, and economic activities with the Mainland under CEPA.
Construction activities in Hong Kong can broadly be classified into three categories, buildings (residential, commercial, and industrial/storage/service), structures and facilities (transport, utilities and plant, environment, and sports and recreation), and non-site activities (decoration, maintenance and repair, etc.). The residential building sector was the largest end-use group of construction activities in 2000, followed by transport projects and industrial/storage/service building projects. The gross value of non-site activities was in the order of HK$ 32.2 billion according to an estimate in 2000. Major construction-related services provided are project planning, engineering design and project management that collectively contribute to the rapid construction of quality high-rise apartment blocks and office towers. Projects in overseas countries are estimated to account for 10-15% of Hong Kong’s construction business. Most of the export business comes from Asia, particularly the Chinese mainland. Major types of services that are currently being exported include project management, contracting and engineering consulting. 2.4.1 Construction investment (or market) volume
Building and civil engineering construction activities have been steadily rising since early 1990’s. An interesting trend could be observed during this period. While building construction activities were brisk in

19
1990-92, civil engineering projects were stable, which however took a giant leap with the Airport Core Project in the following years. Since 1997 however, civil engineering projects are much in decline but building activities have managed to remain stable.
In terms of construction spending per capita Hong Kong was ranked 9th in 1998 after Japan and Singapore within Asia, with Japan leading at US$4,975 (Bon and Crosthwaite, 2000). Over the years, the total construction market expanded by about half, in real terms, in 1996 when compared with 1990. Since 1996, despite the financial turmoil, the total construction market remained relatively stable for three consecutive years. The adverse effect of the financial turmoil was not felt by the local construction sector until 1998 primarily due to many on-going large scale projects already in the design or construction stages. However, both the Government and the private sector considerably delayed announcing new projects. In 1997, the total value of construction works increased by 5% when compared with a year ago but since then it has followed a downward trend. One year later in 1998, it fell by 5%. In 1999, it fell further by 11%.
Much of the “stability” of the construction market in terms of contract values could be, as stated above, attributable to the building programmes in both private and public sectors. During the period 1992-1997 the building component within the construction sector had a share of over 60%. There were steady increases in residential construction in both private and public sectors in the last decade and noticeably in the 3-year period between 1997 and 1999.
During the same period, on the other hand, the civil engineering sector continued contracting. The Hong Kong Airport Core Programme pushed the volume of public civil engineering construction to the peak in 1996 (accounting for 40.2% of total construction output of HK$116.3b, that in turn represented 12.6% of GDP), when the value was more than double that in 1990. Since then, following the completion of the Programme, the sector contracted by 15% in 1997, 23% in 1998 and a further 7% in 1999. Civil engineering construction in the private sector also contracted in 1997 and 1998, though the size of the private sector was only about one sixth of the public sector in the three years period.
Building and construction activity slackened further in 2001. This was manifested by overall expenditure on building and construction contracting further by 3% in real terms in 2001, following an 8% fall in 2000. The decline in 2001 was more pronounced in public sector projects in the second half of the year. Expenditure on building and construction by the private sector fell by 1% in real terms in 2001. The reduction was much less severe than the 7% fall in 2000, that was attributed to the general slowdown upon completion of several large residential development projects in West Kowloon, Tsuen Kwan O and Hung Hom as well as some commercial development projects in Central, Hung Hom and Tung Chung. The smaller fall this year is also attributable to the robust growth of private sector civil engineering activities brought about by intensive construction work at container terminal 9 and land formation for the Cyberport.
Expenditure on building and construction by the public sector contracted further by 4% in 2001, following a 9% fall in 2000. This decline is more specific to the building projects. There was an abrupt curtailment of public housing development, apart from the completion of several public housing programmes in Tung Chung, Ma On Shan and Yuen Mun. The reduction in building works thus outweighed the sustained pick up in civil engineering works, notably the KCRC East Rail Extension.
Table 3.3.1a shows the values of construction contracts at constant (1990) market prices, together with their percentage changes in 1996, 1997, 1998, 1999 and 2000. The table is followed by Table 3.3.1b, based on the same set of information as Table 3.3.1a. Instead of constant market prices and percentage changes, Table 3.3.1b shows the values of works in different categories at current prices.

20
% Change at Constant (1990) Market Prices % Change at Constant (2000)
Market Prices 1990*
(HK$ m) 1996(%) 1997(%) 1998(%) 1999(%) 2000(%)
2000* (HK$ m)
2001(%) 2002(%) 2003(%) Q1&Q2
Residential Construction
Public 5,100 138.9 140.9 172.7 209.2 n.a. n.a. n.a. n.a. n.a.
Private 18,375 111.9 142.7 163.4 170.5 n.a. n.a. n.a. n.a. n.a.
Total Residential (A)
23,475 117.8 142.3 165.4 178.9 113.5 52,068 82.1 70.7 29.5
Non-residential Construction
A+B
Public 4,153 97.6 106.5 103.5 128.0 n.a. n.a. n.a. n.a. n.a.
Private 16,158 124.1 145.5 134.2 64.1 n.a. n.a. n.a. n.a. n.a.
Total Non-residential (B)
20,311 118.7 137.6 128.0 77.2 42.0 16,659 98.5 100.5 57.6
Civil Engineering Construction
Public 8,889 320.9 272.4 209.1 181.2 n.a. n.a. n.a. n.a. n.a.
Private 4,639 124.0 97.5 54.3 34.4 n.a. n.a. n.a. n.a. n.a.
Total Civil Engineering (C)
13,528 253.4 212.4 156.0 130.9 76.4 20,200 124.1 107.7 49.9
Total Construction Investment
Total Public 18,142 218.6 197.5 174.7 176.9 161.4 50,475 80.3 65.5 34.8
Total Private 39,172 118.4 138.5 138.5 110.5 101.4 39,171 98.8 109.3 50.3
Total Construction Investment (A+B+C)
57,314 150.1 157.2 149.9 131.5 120.4 121,834 65.0 62.3 30.6
Repair and Maintenance (D)
11,769 172.2 176.6 163.7 183.1 181.1 32,176 100.0 102.0 50.6
Total Construction Market (A+B+C+D)
69,083 150.6 151.2 158.1 142.1 n.a. 154,010 72.3 70.6 34.8
n.a. Data not available * HK$ million at current prices Source: Gross Domestic Product 2003
Annual Digest of Statistics, various issues
Table 2.4.1a - Construction Investment (or market) by Type - % Change at Constant (1990) Market Prices
21
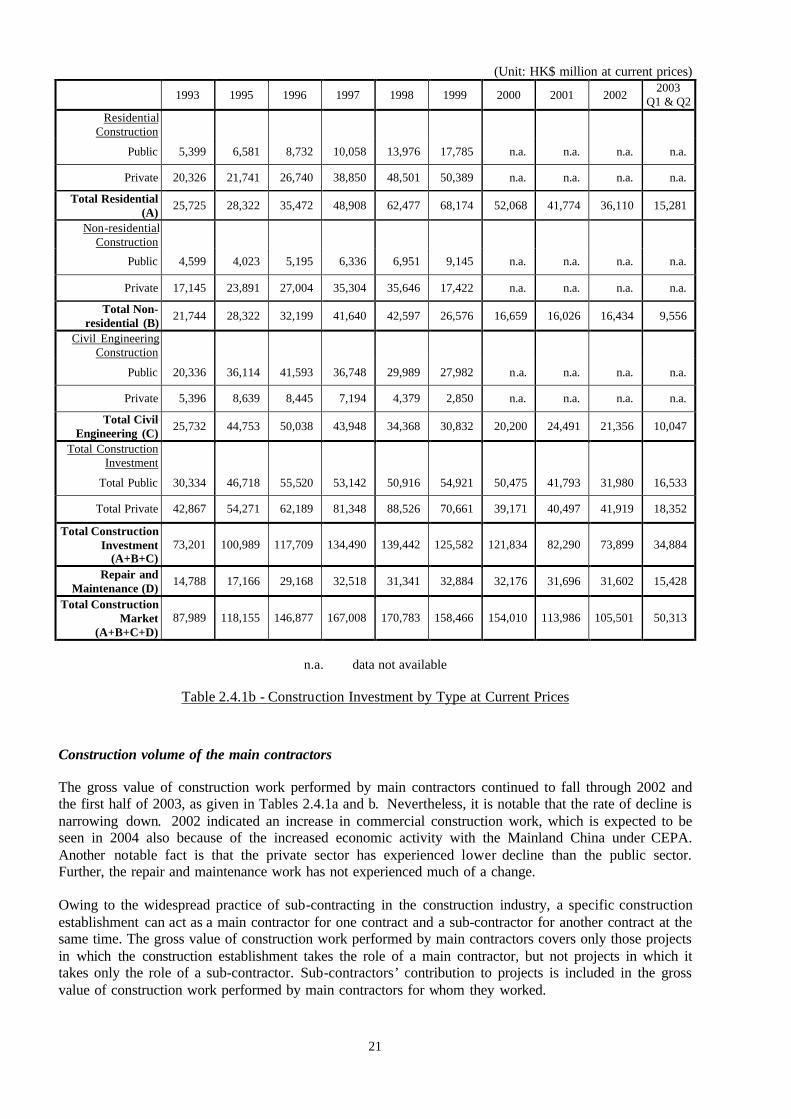
(Unit: HK$ million at current prices)
1993 1995 1996 1997 1998 1999 2000 2001 2002 2003
Q1 & Q2 Residential
Construction
Public 5,399 6,581 8,732 10,058 13,976 17,785 n.a. n.a. n.a. n.a.
Private 20,326 21,741 26,740 38,850 48,501 50,389 n.a. n.a. n.a. n.a.
Total Residential (A)
25,725 28,322 35,472 48,908 62,477 68,174 52,068 41,774 36,110 15,281
Non-residential Construction
Public 4,599 4,023 5,195 6,336 6,951 9,145 n.a. n.a. n.a. n.a.
Private 17,145 23,891 27,004 35,304 35,646 17,422 n.a. n.a. n.a. n.a.
Total Non-residential (B)
21,744 28,322 32,199 41,640 42,597 26,576 16,659 16,026 16,434 9,556
Civil Engineering Construction
Public 20,336 36,114 41,593 36,748 29,989 27,982 n.a. n.a. n.a. n.a.
Private 5,396 8,639 8,445 7,194 4,379 2,850 n.a. n.a. n.a. n.a.
Total Civil Engineering (C)
25,732 44,753 50,038 43,948 34,368 30,832 20,200 24,491 21,356 10,047
Total Construction Investment
Total Public 30,334 46,718 55,520 53,142 50,916 54,921 50,475 41,793 31,980 16,533
Total Private 42,867 54,271 62,189 81,348 88,526 70,661 39,171 40,497 41,919 18,352
Total Construction Investment
(A+B+C) 73,201 100,989 117,709 134,490 139,442 125,582 121,834 82,290 73,899 34,884
Repair and Maintenance (D)
14,788 17,166 29,168 32,518 31,341 32,884 32,176 31,696 31,602 15,428
Total Construction Market
(A+B+C+D) 87,989 118,155 146,877 167,008 170,783 158,466 154,010 113,986 105,501 50,313
n.a. data not available
Table 2.4.1b - Construction Investment by Type at Current Prices
Construction volume of the main contractors
The gross value of construction work performed by main contractors continued to fall through 2002 and the first half of 2003, as given in Tables 2.4.1a and b. Nevertheless, it is notable that the rate of decline is narrowing down. 2002 indicated an increase in commercial construction work, which is expected to be seen in 2004 also because of the increased economic activity with the Mainland China under CEPA. Another notable fact is that the private sector has experienced lower decline than the public sector. Further, the repair and maintenance work has not experienced much of a change.
Owing to the widespread practice of sub-contracting in the construction industry, a specific construction establishment can act as a main contractor for one contract and a sub-contractor for another contract at the same time. The gross value of construction work performed by main contractors covers only those projects in which the construction establishment takes the role of a main contractor, but not projects in which it takes only the role of a sub-contractor. Sub-contractors’ contribution to projects is included in the gross value of construction work performed by main contractors for whom they worked.

22
2.4.2 Property market overview
The downward trend of the property market both in terms of sale price and rent value continued through 2002 and 2003 first two quarters. This was so for all segments of the market, i.e., office, residential, and industrial and in all areas of the territory.
During 2001, the residential property market was characterised by dampening flat prices and a pick up in transaction volume. As a whole, flat prices largely followed a downward trend registering on average a fall of 13%. As compared to the peak levels of the third quarter of 1997, residential property prices in the fourth quarter of 2001 were down by an average of 57%. The rental market for private residential flats also declined on an average by 7% in the year on the back of dampening demands and increased supply of flats for lease from those hitherto on sale. Supply of new private residential flats picked up only slightly by 2% to 26262 units in 2001 after a 27% drop in 2000. Consequently, vacancy rate rose to 5.7% at the end of 2001 as compared to 5.4% during the same time in 2000. Supply of government subsidised flats however rose only by 6% this year after a leap of 25% in 2000.
On the commercial property front, the rental market for office space slackened due to reasons such as corporate downsizing, general slowdown in the economy and partly the “9-11 incident”. However the decline in rent was not substantial, at an average of 5%. Prices for office space, however, declined by 18% in 2001. When compared to the peak levels of 1997, prices and rentals in the fourth quarter of 2001 have nose-dived by 69% and 39% respectively. On supply of office space, completions fell further by 20% to 76,000 sq. m in 2001 after plummeting by 78% in 2000. The vacancy rate rose slightly by 11.1% in 2001 as compared to 10.2% in 2000.
The industrial property rental market registered a 9% decline following precarious economic conditions overseas, consequent to the “9-11 incident” and reduced exports. Industrial property prices likewise fell by 13% in 2001. Against the peak levels of 1994, prices and rentals of industrial space in 2001 declined by 66% and 42% respectively. Vacancy rate rose to a new high of 10.9% in 2001 from 8.5% in 2000 mainly on the back of flatted factory space jumping by 63% to 30,000 sq. m. in 2001 coupled with reduced demand. On the other hand, completions of office cum industrial premises dwindled by over 60% in the same year.
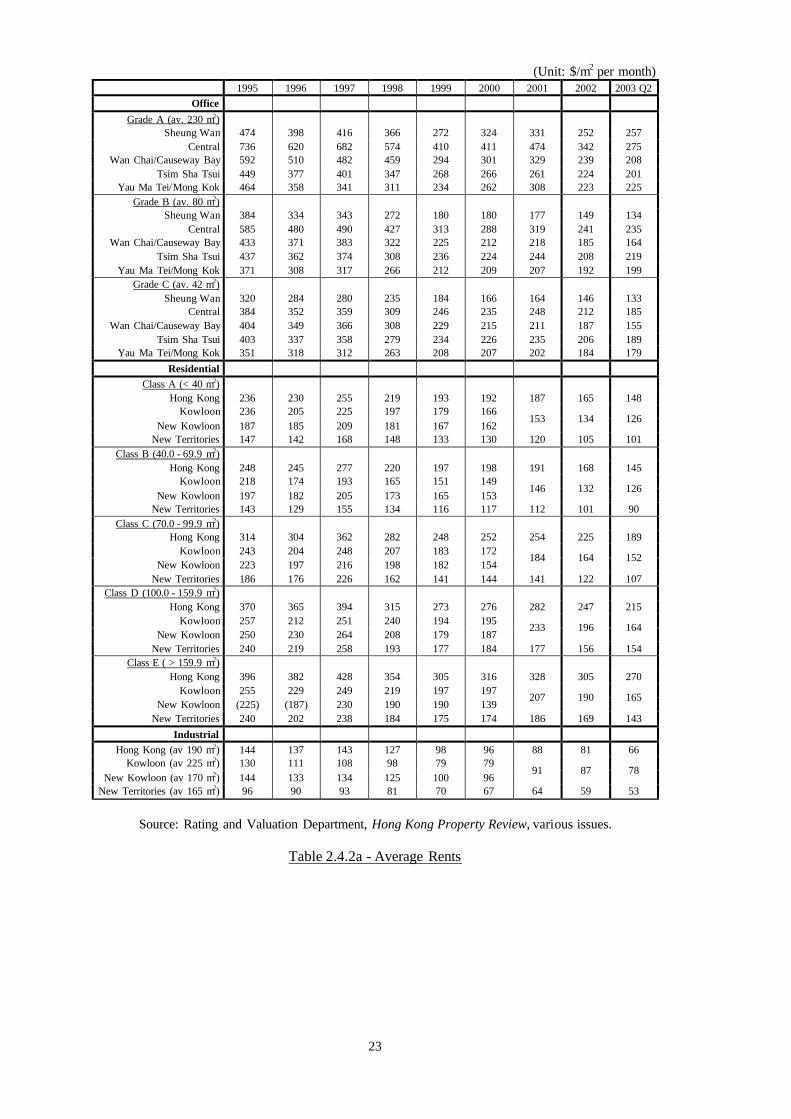
23
(Unit: $/m2 per month) 1995 1996 1997 1998 1999 2000 2001 2002 2003 Q2
Office Grade A (av. 230 m2)
Sheung Wan 474 398 416 366 272 324 331 252 257 Central 736 620 682 574 410 411 474 342 275
Wan Chai/Causeway Bay 592 510 482 459 294 301 329 239 208 Tsim Sha Tsui 449 377 401 347 268 266 261 224 201
Yau Ma Tei/Mong Kok 464 358 341 311 234 262 308 223 225 Grade B (av. 80 m2)
Sheung Wan 384 334 343 272 180 180 177 149 134 Central 585 480 490 427 313 288 319 241 235
Wan Chai/Causeway Bay 433 371 383 322 225 212 218 185 164 Tsim Sha Tsui 437 362 374 308 236 224 244 208 219
Yau Ma Tei/Mong Kok 371 308 317 266 212 209 207 192 199 Grade C (av. 42 m2)
Sheung Wan 320 284 280 235 184 166 164 146 133 Central 384 352 359 309 246 235 248 212 185
Wan Chai/Causeway Bay 404 349 366 308 229 215 211 187 155 Tsim Sha Tsui 403 337 358 279 234 226 235 206 189
Yau Ma Tei/Mong Kok 351 318 312 263 208 207 202 184 179 Residential
Class A (< 40 m2) Hong Kong 236 230 255 219 193 192 187 165 148
Kowloon 236 205 225 197 179 166 New Kowloon 187 185 209 181 167 162
153 134 126
New Territories 147 142 168 148 133 130 120 105 101 Class B (40.0 - 69.9 m2)
Hong Kong 248 245 277 220 197 198 191 168 145 Kowloon 218 174 193 165 151 149
New Kowloon 197 182 205 173 165 153 146 132 126
New Territories 143 129 155 134 116 117 112 101 90 Class C (70.0 - 99.9 m2)
Hong Kong 314 304 362 282 248 252 254 225 189 Kowloon 243 204 248 207 183 172
New Kowloon 223 197 216 198 182 154 184 164 152
New Territories 186 176 226 162 141 144 141 122 107 Class D (100.0 - 159.9 m2)
Hong Kong 370 365 394 315 273 276 282 247 215 Kowloon 257 212 251 240 194 195
New Kowloon 250 230 264 208 179 187 233 196 164
New Territories 240 219 258 193 177 184 177 156 154 Class E ( > 159.9 m2)
Hong Kong 396 382 428 354 305 316 328 305 270 Kowloon 255 229 249 219 197 197
New Kowloon (225) (187) 230 190 190 139 207 190 165
New Territories 240 202 238 184 175 174 186 169 143 Industrial
Hong Kong (av 190 m2) 144 137 143 127 98 96 88 81 66 Kowloon (av 225 m2) 130 111 108 98 79 79
New Kowloon (av 170 m2) 144 133 134 125 100 96 91 87 78
New Territories (av 165 m2) 96 90 93 81 70 67 64 59 53
Source: Rating and Valuation Department, Hong Kong Property Review, various issues.
Table 2.4.2a - Average Rents

24
(Unit: $/m2 per month) 1997 1998 1999 2000 2001 2002 2003 Q2
Office Grade A (av. 230 m2)
Sheung Wan 115,356 62,565 77,433 50,582 40,977 19,673 18,869 Central 203,152 105,245 86,621 82,489 73,224 54,665 43,989
Wan Chai/Causeway Bay 140,437 91,749 78,522 51,350 51,965 39,643 32,974 Tsim Sha Tsui 115,575 70,383 51,649 48,787 45,981 39,510 35,609
Yau Ma Tei/Mong Kok 95,927 52,699 55,645 31,719 — — — Grade B (av. 80 m2)
Sheung Wan 76,587 47,238 28,462 32,696 27,830 21,253 17,064 Central 129,403 68,274 40,274 60,539 45,554 40,214 15,928
Wan Chai/Causeway Bay 96,484 62,837 44,247 34,892 34,420 30,305 21,050 Tsim Sha Tsui 81,920 48,984 38,819 35,525 31,084 31,133 28,952
Yau Ma Tei/Mong Kok 66,840 47,705 35,390 31,719 25,076 24,584 22,635 Grade C (av. 42 m2)
Sheung Wan 57,768 41,989 30,943 25,588 21,785 19,129 13,826 Central 76,129 57,795 37,581 28,000 28,178 28,926 23,704
Wan Chai/Causeway Bay 77,005 57,981 37,782 30,753 27,794 23,287 20,968 Tsim Sha Tsui 56,806 48,505 30,255 24,884 23,001 22,636 20,045
Yau Ma Tei/Mong Kok 57,391 48,197 32,512 27,869 23,008 21,923 18,281 Residential
Class A (< 40 m2) Hong Kong 69,304 50,687 41,750 35,975 31,922 29,012 24,991
Kowloon 56,537 42,155 35,909 New Kowloon 57,606 41,422 34,996
30,990 26,560 23,324 20,661
New Territories 59,481 42,063 35,709 31,444 27,883 24,455 20,382 Class B (40.0 - 69.9 m2)
Hong Kong 83,568 57,203 49,204 43,656 39,783 34,177 27,854 Kowloon 54,983 40,580 33,597
New Kowloon 70,427 47,876 39,392 31,711 28,317 24,722 20,411
New Territories 59,606 40,935 35,096 31,358 27,841 24,646 21,015 Class C (70.0 - 99.9 m2)
Hong Kong 104,374 71,676 60,775 54,957 49,358 42,116 38,482 Kowloon 76,248 61,639 42,887
New Kowloon 81,892 51,428 45,156 38,515 33,792 30,654 25,653
New Territories 68,305 49,259 41,055 37,324 32,685 29,522 25,562 Class D (100.0 - 159.9 m2)
Hong Kong 115,910 77,009 65,478 63,194 56,904 51,801 46,486 Kowloon 79,530 71,109 50,345
New Kowloon 84,892 59,678 51,512 46,639 40,968 37,582 34,759
New Territories 80,414 51,977 47,139 41,389 34,812 31,953 28,771 Class E ( > 159.9 m2)
Hong Kong 136,138 88,213 77,665 80,222 70,312 65,725 61,697 Kowloon 136,322 96,633 54,951
New Kowloon 122,227 79,249 74,243 70,992 58,686 49,840 37,160
New Territories 80,039 56,499 47,047 44,589 35,676 35,326 30,910 Industrial
Hong Kong (av 190 m2) 19,239 14,901 11,412 9,817 8,321 8,094 7,121 Kowloon (av 225 m2) 14,893 12,527
New Kowloon (av 170 m2) 18,944 13,901 11,387 9,308 8,521 8,272 8,050
New Territories (av 165 m2) 11,375 8,392 7,054 6,215 5,641 4,958 4,589
Source: Rating and Valuation Department, Hong Kong Property Review, various issues.
Table 2.4.2b - Average Prices
Property market in the third quarter of 2003
There is hope of improving property market considering the fast growing economic activities and tourism with the Mainland China. Moreover, there is a large overhang of newly completed flats not yet occupied. Also relevant was the prospect for reversal of the earlier downtrend in interest rates later in the year. This

25
should be further enhanced by the forthcoming heavy investments in infrastructure that will facilitate cross border travel.
Meanwhile, property developers continued to offer distinct price discounts and attractive financing arrangements to boost sales. With flat buyers being swayed by such intensive promotion in the primary market, activity in the secondary market remained depressed during most of the first quarter. As to the rental market for residential property, performance continued to be generally lacklustre, as demand remained subdued while the supply of flats for lease increased. Flat prices fell slightly further during the first quarter, while flat rentals came down more. 2.4.3 Land market overview
In eight out of the past ten years, the Government has run a capital account deficit. Capital expenditure is mainly on infrastructural projects, and is principally funded by land premiums. As Hong Kong’s property sector undergoes consolidation, land premiums in the recent past have and in near future are likely to be inadequate to meet the capital expenditure. Although the Government can sell some of its assets, this may not provide a stable source of revenue in the long term. The Table 2.4.3a indicates that land sale perked up in 2001 as compared to the previous 2 years. For the years up to 1996-97, the figures represent the area of residential land per annum approved by the Sino-British Land Commission. Of those periods between 1997-98 and 2000-01, the figures represent the total area of residential land disposed in the years. Less land was disposed of in 1998-99 as the Government imposed moratorium on land sales in June 1998.
Year (April to March) Land Disposal (hectares) 1992-1993 29.68 1993-1994 19.72 1994-1995 25.22 1995-1996 92.50 1996-1997 15.67 1997-1998 41.84 1998-1999 26.41 1999-2000 8.84 2000-2001 11.41 2001-2002 6.57 2002-2003 19.21
2003 April to September 5.79
Source: Housing, Planning and Lands Bureau, 2003, http://www.info.gov.hk/landsd/lsr/lsr.htm
Table 2.4.3a - Land sales in successive years
The land sale programme, both through auctions and tenders for the period April 2002 to September 2003 indicates that just 5.79 hectares of land will be put on sale, which is less than half of total land sales in 2001-2002 thereby indicating underbidding at auctions and tenders. The land market has now undergone a prolonged slump over the years. Commercial plots expectedly feature as the only type of land sold this year.
Land Use No. of Plots Total Area (Ha) Commercial 1 1.23
Recreational (Theme Park) 1 12.08 Petrol Filling Station 5 0.93
Total 7 14.24
Source: Lands Department, 2003, http://www.info.gov.hk/landsd/lsr/lsr.htm
Table 2.4.3b - Land sales programme, April 2003 – September 2003 (Auctions and Tenders)

26
Land prices are difficult, if not impossible, to be averaged to give the unit prices any practical meaning. The value of land depends mainly on location, use, plot ratio, lease conditions, height restrictions … etc. There has been no practice of recording land price indices or unit rates either by the Government or property consultants in Hong Kong. Table 2.4.3c, however, has been compiled from data provided by the Lands Department. It gives an idea on how much land has been disposed of and the revenue generated to the public coffers in recent years. The summary table is compiled on a financial year base (April to March of following year) as land disposal programmes have been administered on this basis. No distinction is made in the table concerning the types of land disposals (auction, exchange of letters A/B and tender).
The year 2003-2004 will certainly register as a year that saw very limited quantity of land being sold. Other than 1.2 ha for a theme park and a few other locations for petrol filling stations, neither residential nor commercial land are being sold.
The table further shows that in a period of seven years (until 3rd quarter of 2001) a total of 122 lots have been disposed of, involving a total area of more than 2.01 million m2 of land. The total premium recorded is more than $1008 billion. On an average, one square meter of land has been sold for about $50111. This figure as such has lowered this year compared to the figures of last year due to less than expected land auction figures in the second quarter of 2000.
In 1995/96, more than 0.9 million m2 of land was disposed of. This alone was almost 46% of the total of the seven years combined. In the following year, the area of land disposed of dropped substantially to less than 0.16 million m2, with the average price of land reaching the peak of about $115000 per m2. Indeed, the unit price of land peaked in 1996/97 for residential use, industrial use and other uses. The unit price of commercial land peaked one year later (1997/98). There was however a general downturn in the following year. The unit price of all land dropped by almost 18% in 1997/98. This downward adjustment was followed with an even bigger drop of 45% in 1998/99 and a further drop of 23% in 1999/00, fully reflecting the devastating blow of the economic crisis. The land market only began to recover, in the first half of 2000, when the average premium paid for the 7 lots rose by 44% compared with a year ago. Yet, the average unit price of land suffered again a fall of over 40% in the year 2000/01. However, these figures must not be made too much of. They are only a rough indication as other factors such as location play a crucial role in determining prices.
During the seven-year period, residential land disposed of amounts to about 50% of the total but the premium it brings is over two-thirds of the total. Residential land has been an important source of public revenue in recent years. It also appears however to be the most severely hit when the property prices bottomed in 1998/99, as the unit land premium dropped by almost 54% from the peak, a magnitude roughly comparable with the corresponding decline in residential property prices. In the commercial land sector, the unit land premium in 2001/02 dropped by about 43% from its peak. The reduction is substantial, though less than that of the residential land. For the industrial land and land marked for other uses, the lots disposed of are too few to make any quantitative analysis meaningful. In conclusion, the effect of the economic crisis has been quickly reflected in land sales, as it has been in the property market.

27
1995/96 1996/97 1997/98 1998/99 1999/00 2000/01 2001/02 2002/03 2003/04* 1995—04
Residential Land No. of Lots 10 10 17 5 21 6 3 7 0 79
Area (m2) 180,669 125,230 242,227 133,843 226,141 87,489 20,588 53,234 — 1,069,421 Premium ($m) 8,363 15,642 28,646 7,722 8,909 4,989 266 3,682 — 78,219
Premium/m2 ($) 46,289 124,906 118,261 57,694 39,396 57,024 12,940 69,166 — 525,677
Commercial Land No. of Lots 9 7 2 3 2 1 2 1 1 28
Area (m2) 63,299 15,133 10,886 10,574 21,513 14,900 20,754 675 12,289 170,023 Premium ($m) 13,383 1,624 2,998 1,931 988 850 1,095 83 353 23,305
Premium/m2 ($) 211,425 107,315 275,400 182,618 45,926 57,047 52,761 122,963 28,725 1,084,179 Industrial Land
No. of Lots 4 4 3 2 0 0 0 0 0 13
Area (m2) 13,869 13,899 13,317 14,483 — — — — — 55,568 Premium ($m) 150 421 269 286 — — — — — 1,126
Premium/m2 ($) 10,815 30,290 20,200 19,747 — — — — — 81,052
Other Uses No. of Lots 2 2 3 3 1 0 0 0 5 16
Area (m2) 667,202 2,386 74,782 36,069 2,578 — — — 8,045 791,062 Premium ($m) 1,502 290 337 146 8 — — — 235 2,518
Premium/m2 ($) 2,251 121,542 4,506 4,048 3,103 — — — 29,212 164,663
Yearly Total No. of Lots 25 23 25 13 24 7 5 8 6 136
Area (m2) 925,039 156,648 341,212 194,969 250,232 102,389 41,342 53,909 20,334 2,086,074 Premium ($m) 23,398 17,977 32,250 10,085 9,905 5,839 1,361 3,765 588 105,168
Premium/m2 ($) 270,781 384,054 418,367 264,107 88,425 114,071 65,700 192,129 57,937 1,855,571
Source: Lands Department website at the URL http://www.info.gov.hk/landsd/index.htm Census and Statistics Department, Monthly Digest of Statistics, various issues
* Up to and including land disposed of (by auction) in September, 2004.
Notes: Residential land includes land uses designated as PSPS (Private Sector Participation
Scheme), R1, R2, R3, R4 (Residential R1, R2, R3, R4) and V (village type development).
Commercial land includes land uses designated as C (commercial), C/MCP (commercial/multi-story car park), C/OU (commercial/other uses) and C/R (commercial/residential).
Industrial land includes land uses designated as DGG (dangerous goods godown), G (godown), I (industrial), I/G (industrial/godown), IO (industrial office).
Other uses include land uses designated as HTL (hotel), MCP (multiple-storey car park), OU (other uses) and PFS (petrol filling station).
Table 2.4.3c - Land Sales Summary
2.4.4 On Contractors, Professionals, Technical Personnels, Workers, Material and Machinery Suppliers
Contractors
The Table 2.4.4a gives an overview of the past decade. Steady growth in gross nominal value of main contractors’ works is evident since 1994. The financial turmoil quickly showed its effect on the

28
construction industry. The values of work in the private sector and in the building sector which peaked in the fourth quarter of 1997 and has since fallen right through to the first quarter of 2002. It should be noted, however, that the reduction in the value of work is much larger in the private than the public sector. As discussed above, there has been an unprecedented large volume of construction in the public housing sector until it somewhat slackened in the year 2000. It is the private building sector that has seen a major setback in the volume of work. In 2001, however, values of both private and public sectors have dampened further in building activities particularly due to the inventory of a large number of unsold units.
In the civil engineering sector, construction peaked in the fourth quarter of 1995 and the value of work has declined ever since. The reduction of civil engineering works came at the completion of the major parts of the new airport and its ancillary projects. In the first quarter of 1999, the average quarterly contract value of civil engineering works was less than half that of the fourth quarter of 1996, when the quarterly value reached the peak for the 6-year period between 1994 and 1999. The year 2000 however saw the civil engineering construction increase marginally although steadily. By the 4th quarter of 2000, the value of civil engineering construction was up by about 9% compared to the same period in 1999. This trend continued well into 2001, when the total annual value increased by about 23% as compared to the whole year of 2001.
Between 1994 and 2001, the average annual increase in the value of work is about 10% overall. When the work is classified into public and private sectors, the annual increases are over 15% and 7% respectively. When the work is classified into building and civil engineering sectors, the annual increases are over 14% and –1% respectively. Considering that the majority of civil engineering works are in the public sector, it could be deduced that public building most likely has an average annual increase larger than 15%. The public building sector has perhaps contributed most significantly to the growth of construction activities in Hong Kong, especially after the financial turmoil. The growth of construction work, except for the civil engineering sector, has in general outpaced that of the GDP by a wide margin.

29
(Unit: $ million)
Gross Value of Main Contractors’ Work
Year Qtr Analysed by Sector Analysed by Project Type
Total Public Private Building Civil Eng 1994 1 15,546 6,728 8,819 10,190 5,356
2 15,560 6,484 9,075 11,127 4,433 3 15,556 6,516 9,040 10,161 5,395 4 16,737 7,469 9,268 11,031 5,706
1995 1 16,655 7,891 8,765 11,118 5,537 2 18,408 9,612 8,796 11,869 6,539 3 17,923 9,314 8,610 10,811 7,112 4 20,599 11,100 9,498 12,604 7,995
1996 1 20,256 11,122 9,134 12,953 7,303 2 21,035 11,142 9,893 13,333 7,703 3 21,353 11,771 9,582 13,865 7,489 4 24,548 12,688 11,859 16,682 7,866
1997 1 23,904 12,021 11,883 16,797 7,107 2 24,369 10,898 13,470 17,702 6,667 3 23,899 9,641 14,257 18,331 5,568 4 26,813 9,586 17,226 21,273 5,540
1998 1 26,034 10,122 15,912 20,797 5,237 2 27,155 10,520 16,635 21,941 5,214 3 24,247 9,498 14,749 20,763 3,484 4 24,443 10,274 13,812 20,561 3,883
1999 1 23,890 11,707 12,183 19,907 3,982 2 23,058 11,881 11,177 19,098 3,959 3 23,161 12,526 10,635 19,262 3,899 4 23,353 13,060 10,385 18,253 5,100
2000 1 22,976 13,272 9,704 18,309 4,667 2 21,413 12,494 8,919 16,686 4,727 3 22,472 12,603 9,869 17,624 4,847 4 22,785 12,106 10,679 17,251 5,535
2001 1 20,517 11,619 8,898 14,732 5,711 2 19,919 10,347 9,572 14,289 5,598 3 19,230 9,394 9,836 13,400 5,792 4 22,624 10,433 12,191 15,379 7,216
2002 1 18,907 9,016 9,831 12,881 6,027 2 19,607 8,464 11,143 14,190 5,417 3 17,960 7,180 10,627 13,127 4,832 4 17,888 8,052 10,480 12,807 5,081
2003 1 12,028 7,644 9,197 12,028 4,812 Quarterly Increase (%)
Average 0.7 0.8 0.6 0.8 0.5 Standard Deviation 7.3 9.1 10.5 8.5 12.6
Annual Increase (%) Average 2.6 4.3 3.5 4.0 2.2
Standard Deviation 11.8 21.7 19.6 17.3 21.1
Source: Hong Kong Environment, Transport and Works Bureau web-site http://www.wb.gov.hk and the Hong Kong Government information website http://www.info.gov.hk/gia)
Table 2.4.4a - Gross Value of Main Contractors’ Work

30
Professional and Technical Personnel, and Workers
Table 2.4.4b below shows statistics on employment and salaries in the construction industry, compared with GDP growth. The construction industry as a whole employed almost 10% of the total labour force in the year 1997, the largest portion in the 9 year-period between 1993 and 2001. But since then, the proportion has dropped to single figures (from 9.1% to 8.7%) in each of the next four years. Relative to the total labour force, there have been more increases in overall construction employment than in site workers. Between 1993 and 2000, the total construction employment, as a proportion of the total labour force, started from 8% to peak at 10% before dropping to 9%. This represents a 16% increase over a period of 8 years. Meanwhile, there has been an 11% increase of site workers. The numbers of site workers relative to the total labour force increased from 2% and peaked at 3% before dropping back to 2% and again rising to 3% during the same period.
The year 2001 saw a downward trend for the labour force on site as the figure decreased by 5% in September 2001 compared to the same period in 2000. This was attributable entirely to the decline of 24% in employment at public sector sites upon the completion of several public housing projects. Though not shown in the Table 2.4.4b, it should be noted that employment at building sites declined by 12% in the same period while a rise of 16% was recorded in civil engineering sites. This was due mainly to the intensification of construction work at Terminal 9 priority railway projects as well as the acceleration of the Disneyland project.
Number of Employed Persons Real Salary Index (A) for
Managerial and Professional Employees (June 1995=100)
Gross Domestic Product
Construction Industry
(% of Total Labour
Force)
Site Workers (% of
Total Labour Force)
Total Labour Force
Building and Construction and Related Trades (% change over
last year)
All Sectors (% change over
last year)
% Change over Last Year at
Constant (2000) Market Prices
% Change over Last Year at Current Market Prices
1993 217,400 (7.6) 55,852 (1.9) 2,874,700 95.2 (1.5) 98.8 (0.2) 6.3 15.4 1994 235,000 (7.9) 63,068 (2.1) 2,968,500 97.1 (2.0) 99.0 (0.2) 5.5 12.8 1995 244,700 (8.1) 68,525 (2.3) 3,012,700 100.0 (3.0) 100.0 (1.0) 3.9 6.5 1996 286,900 (9.4) 81,676 (2.7) 3,063,200 101.6 (1.6) 101.2 (1.2) 4.3 10.5 1997 320,300 (10.0) 83,251 (2.6) 3,216,000 104.9 (3.2) 103.0 (1.8) 5.1 11.0 1998 306,400 (9.1) 72,253 (2.2) 3,358,000 105.6 (0.7) 104.0 (1.0) -5.0 -4.8 1999 305,300 (8.8) 71,789 (2.1) 3,476,600 108.7 (2.9) 107.1 (2.9) 3.4 -2.6 2000 303,200 (9.0) 79,600 (2.3) 3,353,400 112.4 (3.4) 114.1 (6.5) 10.2 3.4 2001 298,800 (8.7) 76,500 (2.6) 3,429,300 112.8 (0.3) 116.5 (2.0) 0.6 -0.7 2002 277,200 (8.7) 79,193 (2.5) 3,203,100 106.5 (-5.6) 116.1 (-0.4) 2.3 -0.6 2003 262,200 (8.1) 63,174 (2.0) 3,219,400 104.9 (-1.5) 113.1 (-2.5) *< -5.8 *< -0.7
* Forecast
Sources: Quarterly Report on General Household Survey, various issues (for “Number of Employed
Persons- Construction Industry and Total Labour Force”). Quarterly Report of Employment, Vacancies Statistics and Report of Salaries and Employee
Benefits Statistics Managerial and Professional Employees (for “Number of Employed Persons-Site Workers” and “Real Salary Index (A) for Managerial and Professional Employees”).
Gross Domestic Product 2003 (for “Gross Domestic Product”). Annual Digest of Statistics, various issues
Table 2.4.4b - Employment and Salaries in the Construction Industry and GDP Growth
31
In terms of real salary growth, managerial and professional employees in the construction sector commanded better growth than the overall average in 1997, when there was a more than 3% increase in the real wage, larger than the overall figure of 2%. In 1998 and 1999, however, the annual salary increases were more or less at par with the overall average which rose to over 3% in the year 2000 but in 2001 this rise was limited to 0.5%. Annual salary increases for the managers and professionals in the construction sector had always lagged behind the real annual growth in GDP before 1998. However, in 1998 when the GDP contracted by 5% in real terms, building and construction managerial and professional staff still saw their salaries increase by 1% in real terms. In 1999, their salary increment, that of all the sectors overall and the GDP growth all registered the same figure of 3%. In 2001, managerial and construction professional staff saw their salary increase only by 0.3% as compared to the rise of over 3% in the year before. This was relatively small compared to the average of 2% for all the sectors in 2001.
Labour and Material Indices
Both Labour and Material Indices in the 1st Quarter 2003 showed a positive change of 0.4% over the 4th Quarter 2002. Although the Labour Index showed an increase in the first two quarters of 2002, there was a decrease of 0.6% in the 4th Quarter. In 2002, the Material Index showed a slight upwards trend after the steady decline through 2001.
Labour cost in the building and construction sector as measured by the Labour Cost Index, was virtually unchanged in 2001 when compared to a year earlier. This represented a further moderation from the increases of 3% and 1% respectively in the first two quarters. For the first 3 quarters of 2001, the increase averaged at 1%, slightly smaller than the 2% in 2000. The Building Material cost Index remained flat throughout the first 2001 having risen by 1% in 2000. The Labour and Material Cost Index, when seen together had a marginal increase of 1% in 2001 following a 2% rise in 2000.
Table 2.4.4c shows that the building materials index has experienced a general drop since its peak in the last quarter of 1997. The average quarterly growth is practically zero in the materials index during the period between 1994 and 2001. More substantial drops began in the second quarter of 1998 when the index declined by more than 2% compared with the figure of the previous quarter. The index has continued to drop since to bottom out in the second quarter of 1999. Since then, the material index has remained stable. The adverse effect of the financial turmoil seems to have dissipated at last.
The average quarterly growth of the labour index has been 1.9% over the past 8 years. There has been a continuous rise in labour wages through all these years. Not even the 1997 financial crisis could stop the rise, though the upward trend has slowed down a little since 1999. A comparison between material and labour indices in Table 2.4.4c suggests that the financial turmoil had more of an adverse effect on materials prices than on labour wages. Labour wages continued to rise whilst material prices dropped. It might be attributable to the fact that there has never been much reduction in the total contract value of building work. The demand for labour continued for quite a while after the financial turmoil. On the other hand, most construction materials are imported to Hong Kong, with a few exceptions such as cement and aggregates of which half are locally made. The devaluation of most of Asian currencies helped to lower the prices of many imported materials.

32
Year Qtr Materials Index (% Change over
One Quarter Ago)
Labour Index (% Change over
One Quarter Ago) 1994 1 765.75 (0.1) 2,173.91 (2.5)
2 766.64 (0.1) 2,205.81 (1.5) 3 760.79 (-0.8) 2,259.09 (2.4) 4 772.21 (1.5) 2,307.02 (2.1)
1995 1 762.03 (-1.3) 2,382.69 (3.3) 2 750.70 (-1.5) 2,412.30 (1.2) 3 743.82 (-0.9) 2,477.50 (2.7) 4 757.67 (1.9) 2,531.22 (2.2)
1996 1 766.07 (1.1) 2,574.79 (1.7) 2 765.01 (-0.1) 2,610.70 (1.4) 3 773.25 (1.1) 2,687.23 (2.9) 4 782.25 (1.2) 2,835.11 (5.5)
1997 1 785.74 (0.4) 2,916.06 (2.9) 2 784.80 (-0.1) 2,976.58 (2.1) 3 786.31 (0.2) 3,034.85 (2.0) 4 792.13 (0.7) 3,184.14 (4.9)
1998 1 786.69 (-0.7) 3,304.02 (3.8) 2 769.42 (-2.2) 3,389.80 (2.6) 3 750.99 (-2.4) 3,442.12 (1.5) 4 746.24 (-0.6) 3,483.45 (1.2)
1999 1 746.02 (0.0) 3,487.72 (0.1) 2 747.67 (0.2) 3,471.82 (-0.5) 3 754.03 (0.9) 3,495.45 (0.7) 4 758.40 (0.6) 3,516.14 (0.6)
2000 1 762.00 (0.5) 3,504.25 (-0.3) 2 760.58 (-0.2) 3,537.87 (1.0) 3 758.97 (-0.2) 3,576.16 (1.1) 4 764.03 (0.7) 3,628.91 (1.5)
2001 1 761.71 (-0.3) 3,600.03 (-0.8) 2 759.38 (-0.3) 3,580.73 (-0.5) 3 756.86 (-0.3) 3,578.70 (-0.1) 4 754.07 (-0.4) 3,563.65 (-0.4)
2002 1 752.37 (-0.2) 3,569.98 (0.2) 2 753.24 (0.1) 3,587.82 (0.5) 3 754.68 (0.2) 3,583.01 (-0.1) 4 755.59 (0.1) 3,560.67 (-0.6)
2003 1 758.77 (0.4) 3,574.02 (0.4) Average 762.89 (0.0) 3124.47 (1.4)
Source: Davis Langdon & Seah International, Current Building Cost Information Data in Hong Kong, various issues
Table 2.4.4c - ASD Cost Index (1970 Q1=100)

33
3 ADMINISTRATION AND REGULATION OF CONSTRUCTION INDUSTRY 3.1 Structure and Role of Construction Administration
The Environment, Transport and Works Bureau is responsible for formulating, co-ordinating and monitoring the implementation of public works projects. The Bureau is also responsible for policy matters on water supply, slope safety and flood prevention. These are all essential for improving our quality of life, and meeting the immediate needs and the long-term development of Hong Kong. Besides, the Bureau is the lead agency within the Government for co-ordinating construction-related issues and implementation of the recommendations made by the Construction Industry Review Committee (CIRC). The Bureau oversees the implementation of such works policies by the Works Departments and is responsible for the overall coordination of Works Departments’ functions for the Public Works Programme (PWP). The PWP comprises public works on port development, government building projects, drainage projects, civil engineering projects (e.g. reclamation and landslip preventive measures). The organization chart is in the Appendix.
The key activities of the Bureau are outlined below:
§ Construction Standards and Quality: development of local construction standards in line with leading international standards, which can help ensure that the construction of public works complies with internationally recognised standards of works.
§ Construction Safety for Public Works: develop construction site safety initiatives for government contracts; encourage public works contractors to set up effective and efficient safety management systems and monitor their safety performance and take regulating actions; administer the Considerate Contractors Site Award Scheme; coordinate safety training and co-organise safety promotional activities; and review and update the site safety manual and handbook for use in public works construction sites, etc.
§ Management of Consultants and Contractors: strengthen the quality management of the consultants and contractors and to ensure quality delivery of PWP; formulate guidelines and procedures for selecting and administering consultants and contractors and monitor their performance. For example, - issue the Handbook on Selection, Appointment and Administration of Engineering and Associated Consultants and the Contractor Management Handbook for administering and monitoring the performance of contractors on the approved lists; strengthen the criteria for the selection of and evaluation of tenders; formulate policies to require contractors to employ specified percentages of qualified tradesmen and semi-skilled tradesmen as part of the contractual requirements.
In addition, the Secretary of the Environment, Transport and Works Bureau also chairs the following Boards and Committees:
Construction Advisory Board - Comprising key representatives from the construction industry, it is tasked to advise the Government on a wide range of construction related issues including contracts, construction standards, quality management, resources and construction safety.
Building Contractors Committee – It provides a forum for discussing matters affecting building and civil engineering construction.
Consulting Engineers’ Committee – It provides a forum for discussing matters relating to the employment of engineering and associated consultants. 3.1.1 Provisional Construction Industry Co-ordination Board (PCICB)
The Provisional Construction Industry Co-ordination Board (PCICB) was formed in September 28 2001 to spearhead implementation of the recommendations made by the Construction Industry Review Committee

34
(CIRC) in its report submitted to the Chief Executive in January 2001. As a precursor of a statutory industry co-ordinating body, the PCICB seeks to spur efforts in taking forward the vast change programme recommended in the CIRC report. Furthermore, it provides a forum for key stakeholders to deliberate and generate consensus on strategic matters affecting the construction industry, as well as to communicate the industry’s needs and aspirations to the Government. The PCICB has a total of 22 Members drawn from major industry stakeholders including construction clients, professionals, academics, consultants, contractors, workers, independent persons and government representatives. One major task being pursued by the PCICB is to develop a framework for the establishment of a statutory industry co-ordinating body as envisaged by the Construction Industry Review Committee (CIRC) in its report.
In pursuance of those CIRC recommendations that require a substantial element of industry input or co-ordination, the PCICB has established five working groups focusing on specific topics. They are:
§ Construction cost and performance indicators § Employees’ compensation insurance § Management of subcontracting § Skills development of construction workers § Statutory industry co-ordination board
The Government so far has been able to make important headway and has agreed in principle to implement all of the 109 recommendations of the CIRC having regard to their level of complexity and availability of resources. The Government also aims to work proactively with industry stakeholders to decide on the best way forward on those recommendations, which carry with them far-reaching implications.
Apart from setting up of the Provisional Construction Industry Co-ordination Board (PCICB) and designation of the Environment, Transport and Works Bureau as the lead agency in the Government on all construction-related matters, 62 of the 109 CIRC recommendations have had some notable progress or far-reaching implications. Some of the more prominent items are highlighted in the following paragraphs based on the Environment, Transport and Works Bureau report.
1. Construction procurement:
In respect of public housing projects, efforts are being intensified to develop the Preferential Tender Award System (PTAS) that provides for evaluation on account of both price and quality by extending it progressively from building contracts to other types of contracts managed by the Housing Authority. Regarding public works projects, planned improvements to the procurement system has been regularly discussed. The Government maintains a close dialogue with the Board to work out further enhancements to the existing system.
2. Management of subcontracting:
Enforcement against total subletting of public housing and public works contracts is being stepped up. Contractors for public housing projects are already required to submit details of the subcontractors that they engage to enhance supervision and provide an accountability trail. Similar provisions are being extended to public works contracts in mid-2002 and private clients are encouraged to follow this practice. As an on-going effort to strengthen site supervision, there will be deployment of resident professional staff to piling contracts and complex building contracts for public housing developments.
3. Quality matters:
Quality control measures such as the employment of direct contractors to conduct tests on structural materials to public works projects are being discussed. Other measures being considered include parallel testing by the Public Works Laboratory, tightened control on test samples and enhanced training. These measures will be implemented by phases in 2002. On private building projects, quality control of foundation works is enhanced by requiring the provision of sufficient

35
qualified site supervisors. The auditing role of Buildings Department (BD) in ensuring compliance with statutory requirements on safety and quality is strengthened.
4. Manpower development:
A framework for the Construction Personnel Registration Scheme is in the pipeline and the government aims to introduce a relevant bill into the Legislative Council before the end of 2002. Once successfully launched, the scheme will serve as a platform for the introduction of other initiatives to upgrade the level and variety of professional skills possessed by the construction workforce. It will also provide a more reliable basis for manpower forecast and planning.
5. Efficiency, innovation and productivity:
The Government aims to build on the success achieved by the Housing Authority on public housing projects and promote the wider use of standardized components as well as mechanization in public works projects by developing a new standard components library for shared use by the Works departments.
On information technology, a consultancy study on the deployment of electronic services delivery (ESD) in public works projects is being done. This study will formulate a roadmap for improving the productivity and quality of the project delivery process through ESD and identify the legal, technical, and administrative infrastructures required. The industry will be consulted on a preliminary ESD strategy in late-January 2002, and the final product will be available in mid-2002.
The industry will continue to leverage on electronic procurement systems to reduce the costs incurred by those bidding for works contracts and works-related consultancies. Tender documents and invitations for consultancy are already disseminated electronically both on CD-ROM and through the Internet. Tender returns and consultancy submissions may now be submitted on CD-ROMs, while feasibility study is in hand for Internet submission to commence by the end of 2003/04. Aiming for a widespread use of information technology in June 2001, the pilot Electronic Building Record Management System was launched to provide the public with convenient online access to the records of private buildings in the Yau Tsim District. The system will be extended to other districts subject to the availability of funds.
6. Safety and environment:
An amendment regulation is being presented for consideration by the Legislative Council to render both principal contractors and subcontractors jointly liable for non-compliance of safety requirements. For private building projects, enforcement is particularly strong now with disciplinary actions against Registered General Building Contractors and Registered Specialist Contractors for poor site safety performance or blatant negligence leading to serious site accidents. To strengthen the deterrent effect, this practice will be extended to public sector projects with effect from late-2002.
To promote safety awareness among contractors, workers and their families, the ‘Construction Industry Safety Award Scheme’ has been operative in the past four years. The scheme has been jointly organised with key stakeholders of the industry, including, of course, the HK Construction Association. Through an open competition, contractors, sub-contractors, safety teams and workers with good safety and health performance are identified and rewarded.
3.2 Regulation on construction market access 3.2.1 Licensing or Registration Requirements

36
Contract administration and tendering procedures of the Works Bureau and the Housing Authority are generally the same in principle. There is no distinction made between local and overseas contractors. Both are subject to the same set of criteria concerning admission and to and retention on the various lists of approved contractors.
According to Works Branch Technical Circular No. 9/97- Rules for the Administration of the List of Approved Contractors for Public Works, all contractors are required to:
1. Establish in Hong Kong a place of business as defined in section 2 of the Business Registration Ordinance (Cap. 310) and produce a business registration certificate as proof;
2. Employ in Hong Kong the minimum number of full time management and technical personnel specified;
3. Satisfy the financial criteria for retention on the list.
3.2.2 Company Capability Evaluation System
Management item inspection system
Those subject to inspection: Only contractors listed in the appropriate lists of approved contractors are eligible to tender for public works. Under the most exceptional circumstances such as contracts demanding considerable financial resources, highly specialized equipment, technology or professional/ technical expertise; tenders may be invited from pre-qualified contractors.
Inspection items: A contractor applicant shall be assessed on the basis of both of their global and local business activities, financial status, and technical and management capability. The minimum financial, technical and management criteria are all specified in Works Branch Technical Circular No. 9/97- Rules for the Administration of the List of Approved Contractors for Public Works.
Inspection result: The Environment, Transport and Works Bureau shall notify the applicants. Only under exceptional circumstances shall a contractor be admitted in the appropriate group and category without being required to go through a 24 months probation period first. An unsuccessful applicant will be advised of the reasons for not being admitted.
Contractors shall be approved to carry out public works in one or more of the following categories: buildings, port works, roads and drainage, site formation, and waterworks. Within each category, contractors shall be further divided into Group A, B or C according to the value of contractors for which they are eligible to tender. The current Group tender limits are:
Group A - contracts of value up to $20 million. Group B - contracts of value up to $50 million. Group C - contracts of any values exceeding $50 million.
Circumstances leading to a contractor being removed, suspended or downgraded from the approved lists include poor performance, violation of laws and regulations, insufficient human, technical and/or financial resources, and failure to submit a valid competitive tender within three years.
37
3.2.3 Forms of Tendering for Public and Private Sector
Open and Competitive Tendering
The large majority of public works contracts are procured on the basis of competitive tendering and open to all approved contractors in the appropriate category and grade. Open and competitive tendering procedures are normally employed for government procurement exceeding HK$500,000 for goods and general services; and HK$1 million for construction and engineering services. The Agreement on Government Procurement (signed by 28 World Trade Organisation members including HKSAR) applies to local construction services valued at 5,000,000 Special Drawing Rights, or $HK55.109 million, for the period 1998-1999. This value is indeed more than the minimum contract amount (HK$50 million) that Group C contractors are eligible to tender, and there is no more demarcation between local and overseas contractors since June 19 1997.
Restricted and Single Tendering
Under such exceptional circumstances as contracts demanding immediate or very early commencement of works, or proprietary technology/ materials, the Managing Department may initiate restricted or single tendering procedures. Only a few contractors, and one in the case of single tendering, will be invited to tender for the contracts. Besides, when contracts require considerable financial resources, highly specialised equipment, technology, or professional/ technical expertise, tenders may be invited from prequalified contractors who are not on the approved lists.
Prequalified Tendering
Application for prequalified tendering is invited openly. Applicants are prequalified and short listed based on their technical capabilities required for the particular contract. The invitation procedure follows an open tendering system. 3.2.4 Types of Contracts Used
Lump Sum Contracts
For building and housing works, lump sum contracts have been the norm. In principle, contractors are committed to their tender prices for the works they undertake to complete, though there are provisions for price change due to, for example, variations, substantiated claims and fluctuations in material prices and labour wages.
Re-measurement Contracts
For civil engineering contracts, re-measurement contracts have been the norm. In principle, contractors are committed to their unit rates for individual pieces of works they undertake to complete. The final contract sum would be subject to the actual quantities of work they are required to carry out. However, since 1992 the Works Branch has promoted the use of lump sum contracts whenever it is appropriate and feasible. (Works Branch Technical Circular No. 17/95 – The Use of Lump Sum Bills of Quantities Contracts for Civil Engineering Works, dated 22 August 1995)
Design and Build Form of Contract
The Design and Build Form of Contract is closely based on the Hong Kong Government General Conditions Contract 1990 Edition (GCC 1990). The important changes made to the well-tried GCC 1990 include such new concepts and new/revised definitions as Employer’s Requirements, Contractor’s Proposals, Breakdown of the Contractor’s rates and prices, Variation, Design Checker and Design Checking Procedures, Supervising Officer, Plant, Commissioning Tests, Works, Copyrights, Alternatives … etc. The Design and Build Form of Contract is particularly useful when it is intended to make use of contractor’s special skills or techniques, explore innovative design, enable fast-tracking, and facilitate

38
design economy (Works Branch Technical Circular No. 17/92- Design and Build Contracts, dated 5 June 1992). 3.3 Management System of Public or Government Construction Projects
The following list gives a brief overview of management systems commonly practiced in Hong Kong for public or private construction projects:
Management Systems Description
ISO 9001/9002/9003:1994 and ISO 9001:2000 Quality
A quality management system that focuses on the reduction of avoidable error through pre-planning, communication, auditing and reviews. The System helps to promote the concepts of ‘right first time’ and ‘continuous improvement’, and to achieve ‘Customer Satisfaction’ as a minimum, by prevention of error rather than detection.
ISO 14001 Environmental
An environmental management system that puts into place procedures/systems to predict and monitor the impact an organisation has on the environment. In doing so, this can help to significantly reduce operating costs, as well as contribute to environmental conservation, awareness and improved practices.
BS 8800/OHSAS 18001
A safety management system that creates an occupational health and safety culture for staff both on site, and in the office environment. Hazards are foreseen and minimised, health is enhanced and ‘safety consciousness and awareness’ is improved to the benefit of all
IMS and ISO Integrated Management System
An integrated management system that combines the fundamental elements of the above standards into a holistic management system that links the business function of the organisation with its objectives and targets on quality, environmental and safety issues.
TQM
Total quality management that continuously improve all aspects of the organisation’s business, including marketing, recruitment, administration, personnel, finance, etc., thus instilling an organisation-wide quality culture and providing more structured control over every process.
SA 8000- Social Accountability
SA 8000 seeks to bring agreement, consistency and a ‘social conscience’ to business practice all over the world. It seeks to ensure that human rights and the rights of children are protected through the organisation’s management system.
International Safety Management (ISM) Code
Based on the ISO Standards, the ISM Code sets an international standard for the safe operation of ships at sea and for the prevention of pollution. It applies to both shore-based and shipboard activities. Serious ‘Incidents’ should be reduced or prevented from happening as a result of improved management techniques and communications.
Source: http://www.havrad.com.hk/management.html#a
3.4 Risk Management for Construction Projects
Risk management starts before the project is bid. Many methods of risk management are well known and widely practiced. Subcontracting specialty work or payment and performance bonds are different forms of risk management practiced in Hong Kong. Performance and payment bonds offer legal remedies for dealing with difficult subcontractors but are not a deterrent to poor performance. Moreover, it is not always possible to obtain bonds for small subcontractors or the cost is prohibitive in light of the expected savings
39
of using their bids. Confirming the project duration specified in the bid documents is another form of risk management, but is usually ignored by contractors except in extreme cases. 4 ENHANCEMENT AND DEVELOPMENT OF THE CONSTRUCTION INDUSTRY 4.1 Productivity 4.1.1 Value-Added per Employee
Almost every other industry depends on man-made structures such that the construction industry has become the foundation to any economic development. Productivity, efficiency and competitiveness of building and construction are of critical importance to the growth and success of the Hong Kong economy. In 2000, the construction sector accounted for 5.3% of the GDP and 34.8% of gross domestic fixed capital formation (2001 Economic Prospect,). About 9.4% of our workforce was employed by the construction industry in that year (Yueng and Chan, 2002). Improvements in efficiency and effectiveness flow through to the economy and enhance international competitiveness (Sidwell, 1994 as quoted in Yeung and Chan, 2002). Stoeckel and Quirke (1992) estimate that a 10% lift in efficiency in construction would boost the GDP by 2.5%.
Results of the 2000 Annual Survey of Building, Construction and Real Estate Sectors indicate that the value added for the Construction sector was HK$ 63,170 million. Its year-on-year percentage change was -4%. A benchmark study (CIRC, 2001) on the construction cost of building projects in Hong Kong by the Construction Industry Review Committee concludes that the average labour component costs in normal building projects are 25% of the total construction costs Hong Kong while they are, 20% and 40% in Singapore and the USA respectively. This shows that the labour cost input of a building project is relatively higher in Hong Kong as compared to Singapore but lower than the US. The difference in productivity could be attributed to various factors such as the degree of mechanisation and the use of dry construction and modular units, which are less labour-intensive and are more common in the USA thereby cutting down on overall cost of the completed projects.
Factors contributing to the high construction cost in Hong Kong include: labour costs and productivity, material costs, site establishment costs, construction programme, design practices and specification, regulations related to building construction, construction-related regulations, site conditions, climatic conditions, construction methods, contractual arrangements. Of these, the following factors are believed to have significant impacts on local construction cost: labour cost and productivity, limited supply of local skilled labour, site management and supervision cost, fast track construction programme, and in-situ labour intensive construction methods. Last but not least, due to the high prices of land in Hong Kong, developers and their design and construction teams have typically a tight working schedule to complete their projects as soon as possible. This usually results in the sub-optimal use of labour and other resources, thus raising the construction portion of the total development cost. However, if the projects could be completed in time or on time, the developers would have the revenues back sooner than later, and the burden of finance charges relieved. Such benefits could easily make up for the increased costs of construction. The following tables show the value-added per employee for the construction industry.

40
2000 (Year-on-year percentage change)
2001 (Year-on-year percentage change)
Number of establishments 20,181 (– 0.3 %) 19,521 (– 3.3 %) Number of persons directly engaged 154,676 (– 1.9 %) 141,079 (– 8.8 %)
Compensation of employees (HK$ million) 53,008 (– 2.5 %) 48,480 (– 8.5 %)
Consumption of materials and supplies (HK$ million) 42,958 (– 5.7 %) 38,845 (– 9.6 %)
Gross output for the Construction sector (HK$ million) 208,026 (– 8.2 %) 196,564 (– 5.5 %)
Value of sub contracting work by fee sub contractors (HK$ million) 92,965 (– 11.2 %) 90,247 (– 2.9 %)
Miscellaneous operating expenses (HK$ million) 17,914 (– 14.0 %) 16,737 (– 6.6 %)
Other business receipts (HK$ million) 8,853 (– 13.7 %) 7,114 (– 19.6 %) Gross surplus (HK$ million) 10,034 (– 12.9 %) 9,370 (– 6.6 %)
Value added for the Construction sector (HK$ million) 63,170 (– 4.5 %) 58,139 (– 8.0 %)
Gross addition to fixed assets (HK$ million) 1,478 (– 7.5 %) 1,341 (– 9.2 %)
Source: Annual Survey of Building, Construction and Real Estate Sectors, 2000
Table 4.1.1a – Value-Added per Employee for the construction industry
A quick overview of the past decade indicates that the local economy has undergone a fundamental structural change from predominantly manufacturing to services. Until the first half of the ‘80’s, the industrial sector accounted for about half of total employment (59% in 1975 and 49.5% in 1980) by virtue of foreign investors establishing industry in Hong Kong due to cheap labour. Since the mid 80’s Hong Kong’s industries changed to being service oriented with its output growing at the rate of 16% (in nominal terms) between 1984 and 1996 and its share of GDP increasing to 84.7% in 1998. During the early 90’s the value added of this sector to GDP rose at an average rate of 14.4% which is 2.3% higher than the average annual growth rate. The table 4.1.1b shows the sector incorporated 84.6% of the working population in 1998.
Sector GDP Employment
1980 1998 1980 1998*
Primary 0.9 - 1.9 -
Industry 32.2 15.3 49.9 15.4
Services 66.9 84.7 47.2 84.6
Source: Census and Statistics Department, Annual Digest of Statistics, various issues
Note: Services employment excludes civil services * at 4th Quarter of the year
Table: 4.1.1b - Composition of GDP in Selected years

41
Table 4.1.1c and 4.1.1d indicate that the phenomenal rise of service industries in Hong Kong, however, has not benefited all the service sub sectors and not all the sub sector had an equal rise. The working population employed in the FIRE (finance, insurance and real estate) and business sector alone accounted for 22% of total service employment in Hong Kong. The value added of this sector to the GDP grew at an average rate of 17.9% between 1998 to 1997, which is 2.2% higher than the average growth rate of all services during the period. This sector has also recorded the highest labour productivity. Foreign investors have been instrumental in stimulating this growth of service sector industries in Hong Kong with the focus skewed to industries like FIRE services expected to yield higher returns.
Sector 1981-87* 1987-97*
FIRE and Business Services 13.5 17.9
All Services Sector 17.3 15.7
Economy 15.7 14.1
*Average over the period
Source: Census and Statistics Department, Monthly Digest of Statistics
Table 4.1.1c- Average Growth rate of value Added
Product per Worker**
(HK$) Productivity Growth
(%) Sector 1985 1990 1997 1985-90 1990-97
FIRE and Business Services 218953 408960 833345 22.1 14.9 Wholesale, retail and export import 87992 169628 344808 18.5 14.2
Transport, Storage and Communication 206361 393826 336852 18.1 -2.1 Community Social and personnel Services 204373 324998 327470 11.8 0.2
*Average over the period at market price
Source: Census and Statistics Department, Annual Digest of Statistics, various issues
Table 4.1.1d - Sectoral Performance
4.1.2 Physical Measurement of Construction Productivity (Production)
Table 4.1.2 shows the total floor areas completed in various building sub-sectors. There was significant increase in the completion of private residential properties after the financial crisis in 1997, whilst completion of commercial and industrial properties contracted equally if not more significantly.

42
(Unit: sq. m*)
1996 1997 1998 1999 2000 2001 2002 2003 Q2
Public residential 556,984 658,026 634,545 n.a. n.a. n.a. n.a. n.a.
Private residential 769,000 711,600 1,033,600 1,346,700 1,101,100 963,400 1,411,400 377,300
Commercial 609,500 585,900 1,252,500 1,087,800 309,800 319,300 528,600 257,400
Industrial 426,200 391,800 399,200 195,200 104,000 71,400 19,600 43,600
* Area (sq. m) refers to total built-up area.
Industrial buildings = Flatted factories + specialized factories + I/O buildings. Commercial buildings = Private office + Private commercial (including retail space). Completed area used as man-hours employed in each sector not available. Source: http://www.info.gov.hk/censtatd/eng/hkstat/hkinf/land/land4.htm
Table 4.1.2 - Physical Measurement of Construction Productivity (Production)
4.2 Construction Cost 4.2.1 Unit Construction Cost
(Unit: $/sq. m of gross floor area*)
Year Residential (High-Rise) Commercial office Industrial Hotel
Standard Luxurious Standard Prestige Light Heavy 5-Star
1995 8,000-8,500 8,500-10,000 8,500-9,500 12,000 up 4,800-5,000 5,300-6,300 14,000 up
1996 9,000-9,500 9,500-12,500 9,500-10,700 13,000 up 5,400-5,700 6,100-7,200 16,000 up
1997 11,000-12,000 11,500-15,000 11,550-13,500 15,500 up 6,500-7,000 7,100-8,500 19,500 up
1998 10,000-11,000 11,000-13,500 10,500-12,500 14,300 up 5,600-6,200 6,300-7,500 18,000 up
1999 9,800-10,700 10,800-13,200 10,300-12,100 13,800 up 5,500-6,100 6,200-7,100 17,500 up
2000 9,300-10,000 10,500-12,800 9,700-11,500 13,500 up 5,500-6,000 6,000-6,900 17,500 up
2001 9,100-9,800 10,300-12,600 9,700-11,500 13,500 up 5,500-6,000 6,000-6,800 17,500 up
2002 8,500-9,000 9,800-11,700 9,500-11,200 13,500 up 5,400-5,800 5,900-6,600 17,200 up
2003 (Q2) 7,800-8,400 8,900-10,700 9,000-10,500 12,200 up 4,900-5,500 5,300-6,100 16,200 up
* Unit costs exclude sub-structural works.
Source: Davis Langdon & Seah International, Current Building Cost Information Data in Hong Kong (various issues).
Table 4.2.1 – Unit Construction Cost

43
4.2.2 Average Construction Material Price
Year
Cement in Bulk
($ per tonne)
Steel Bars
($ per tonne)
Aggregates (all grades)
($ per tonne)
Concreting Sand
($ per m3)
Common Bricks
($/10,000 pcs.)
RMC* Grade 30
($ per m3)**
1995 711 2,961 60 60 8,894 600
1996 738 2,921 64 61 8,550 610
1997 734 2,891 59 63 8,722 630
1998 719 2,348 54 60 8,342 620
1999+ 689 2,239 53 61 8,252 580
2000 658 2,273 70 49 7,824 —
2001 649 2,291 85 49 7,360 —
2002 595 2,,367 85 43 7,270 —
Feb 2003 587 2,793 81 43 7,276 —
* RMC : Ready Mix Concrete ** Prices measured in April of the year. + Information supplied by Department of Architectural Services, HKSAR Government.
Since the average wholesale prices of building materials are compiled by the Commissioner for Census and Statistics for internal use, the figures for the period 1995-98 were estimated by using index numbers of the costs of labour and materials used in public sector construction projects.
Source: Consumer Price Index Section, Census and Statistics Department.
Table 4.2.2 – Average Construction Material Price

44
4.2.3 Construction Industry Salaries and Wages
(Unit: $)
1995 1996 1997 1998 1999 2000 2001 2002 2003
Professionals (Monthly Salary) 41,726 45,190 49,404 51,824 51,365 51,333 50,782 44,438 —
Technicians (Monthly Salary) 9,563 10,367 11,134 11,481 11,333 10,961 11,146 10,185 —
Skilled worker (Daily Wage) 710.9 766.5 882.3 933.7 947.9 985.4 982.4 979.1 958.9
Unskilled Worker (Daily Wage) 460 503.4 549.9 604.2 595.8 607.6 620.1 617.5 603.1
All figures are nominal.
The wages of unskilled workers are based on wages of unskilled labourer, excavator, concretor’s labourer, bricklayer’s labourer and plasterer’s labourer.
The wages of skilled workers are based on wages of concretor, bricklayer and drainlayer.
The salary of technicians is in the category: Financing, insurance, real estate and business services.
Only the index (not absolute figure) for salary of professional in the construction industry is available. Based on the Manpower Survey Report on the Building and Civil Engineering Industry, we estimate the weighted average monthly salary of professional in the construction industry. Then, we use the index the estimate the salary figures in each year.
Source: Census and Statistics Department, HKSAR Government, Hong Kong Annual Digest of Statistics, various issues
Table 4.2.3 – Construction Industry Salaries and Wages
4.2.4 Average Sectoral Wages per Month
(Unit: $)
1995 1996 1997 1998 1999 2000 2001 2002 2003 June
Construction* 9,560 10,369 11,134 11,480 11,324 11,535 11,207 10,567 10,985
Manufacturing 10,173 10,935 11,596 9,716 9,434 9,958 10,906 9,565 9,338
Services 10,335 10,853 11,696 11,833 11,816 11,911 11,885 11,758 11,475
* There is no sectoral wage for the construction sector, because most of the workers receive daily wages. Thus, the average sectoral wage in the construction sector refers to the wage under the category of real estate and business services.
Note: Based on supervisory, technical, clerical and miscellaneous non-production workers.
Source: Hong Kong Annual Digest of Statistics and Hong Kong Monthly Digest of Statistics, various issues
Table 4.2.4 – Average Sectoral Wages per Month

45
4.3 Policy and Initiatives on Construction Quality 4.3.1 Enhancement of Quality Assurance
Amid the growing quality consciousness of overseas buyers, many companies have strengthened their quality assurance systems by adopting the ISO 9000 series in Hong Kong. Meanwhile, in view of keen competition, Hong Kong companies have diversified their businesses to higher value-added products which meet international standards. According to the Hong Kong Quality Assurance Agency (HKQAA), over 800 QA certificates have been issued with ISO 9000 by this Agency alone. Note that this pioneering Agency claims to have 70-80% of the market share, hence the total certificates issued may be as high as 1000. Also note that one construction firm may get more than one QA certificate. However, the number of firms involved is not available.
The construction industry was the first commercial sector to look for ISO 9000 certification, because the Hong Kong Government, as the biggest housing developer in the colony, decided to tackle the problem of sick buildings by enhancing a quality management system in the construction industry. Owing to the booming of population in the 1960s and 1970s, quantity and speed of construction rather than quality was the major concern of public housing development. Maintenance problems associated with thousands of post-war public buildings have arisen such as water leakage, spalling of concrete, rusting of steel reinforcement, honeycombing, etc. In 1990, the construction industry was very concerned with the quality of building work. The Housing Authority of Hong Kong, being the largest developer in Hong Kong, has committed itself to producing buildings with good quality. It is mandatory that all concrete suppliers and contractors have to be audited and certified against the ISO 9001 and ISO 9002 quality management standard.
Quality Assurance Bodies At Work
1. HKQAA (Hong Kong Quality Assurance Agency): The HKQAA was incorporated in 1989 as a non-profit distributing company owned by the Hong Kong Government. It is a third party independent ISO 9000 certification body whose members are drawn from industry, academia, trade organizations, quality organisations and relevant consultant firms. It uses an international recognition program as the BSI QA in the UK. The Agency operates in accordance with the international accreditation requirements of ISO/IEC Guide 62 and has been committed to assisting industry and commerce for over 12 years now. HKQAA’s major focus lies in the development and establishment of viable ISO 9000 Quality Management System and ISO 14001 Environmental Management System, as well as other popular management system initiatives such as SA8000 Social Accountability Management System, OHSAS 18001 Occupational Health and Safety Management System and Hazard Analysis Critical Control Points (HACCP) Food Safety Management System.
2. BSI Quality Assurance (UK): BSI has been founded over 60 years. It gives advice to contractors to improve their quality assurance standards in order to help them get ISO 9000 certificates.
3. LRQA (Lloyds Register Quality Assurance) (UK): LRQA was founded in UK for issuing the registered companies. LRQA also provides special scheme for small firms.
4. Trada Certification Ltd. (UK): It is an independent third party certification company accredited by the Department of Trade and Industry through its National Accreditation Council for Certification Bodies (NACCB).
5. SGS Hong Kong Limited - ICS Division: It is an independent third party certification company established in 1959 accredited by HKCAS.
6. Det Norske Veritas Certification B.V. - Hong Kong Office (Det Norske Veritas AS)

46
7. Bureau Veritas Quality International Limited - BVQI China, Hong Kong Office
Assessment Criteria
This guide to the ISO9000 is produced by the Hong Kong Quality Assurance Agency, as an aid to companies in understanding the international standards for quality systems. HKQAA is a government subsidized organisation, which is to promote QA in the manufacturing and construction industry in Hong Kong, and carry out certification auditing, etc.
The ISO9002 (for building contractors) sets out how companies can establish, document and maintain an effective management system, and compliance with it will help to provide the necessary consistency. It includes the following aspects:
1. Tender and contract; 2. Planning and documentation; 3. Control of measurement and test equipment; 4. Quality procurement; 5. Sampling, inspection and testing; 6. Incoming inspection; 7. In-process inspection; 8. Final inspection; 9. Inspection and test status; 10. Material identification and traceability; 11. Handling, storage, packaging and delivery; 12. Control of production/construction; 13. Quality records; 14. Control of non-conformity; 15. Corrective actions; 16. Use of statistical techniques; 17. Auditing the quality system.
In Hong Kong, 7 certification bodies are fully recognized and are in their different ways connected with the construction industry. They provide certification for: product conformity; supplier and services quality management systems; and personnel involved in quality verification, within various sectors of the construction industry and within specific fields of activity.

47
4.3.2 Enhancement of Skills Workforce
Comparison of Manpower by Skill Level
Number of Employees Job Level March 1995 March 1997 March 1999 March 2001
Professional/Technologist 12,834 (14)
13,279 (12.2)
13,579 (13.2)
15,169 (11.6)
Technician 19,094 (20.6)
19,727 (18.0)
20,848 (20.2)
32,072 (24.5)
Tradesmen 42,831 (46.3)
53,090 (48.7)
48,965 (47.5)
61,043 (46.7)
Semi-skilled Worker/General Worker
18,721 (20.3)
22,748 (20.9)
19,719 (19.1)
22,471 (17.2)
Total 92,480 108,844 103,111 130,755
Source: Building and Civil Engineering Industry Training Board, Vocational Training Council, Manpower Survey Reports on the Building and Civil Engineering Industry, Bi-annual issues of 1995 and 1997.
Note: This is a report published once every two years. Figures are not available for 1996 and 1998 & 2000. The figures within brackets denote respective percentages of the total.
Table 4.3.2 – Comparison of Manpower by Skill Level
4.3.3 Enhancement of Supervisory Level
Site Safety Supervision Plan
In the early 1990s, a few serious construction accidents aroused concern on site safety supervision. Site Safety Supervision Plan was first introduced under the Buildings (Amendment) Ordinance 1996 in order to enhance safety on site. The requirements are set out in the Draft Code of Practice for Site Safety Supervision (Buildings Department, 2000) and the Technical Memorandum for Supervision Plans (Buildings Department, 1998).
A construction site refers to a demarcated locality where one or more stages of construction work are being carried on. It is divided into a private or public sector site depending on whether the contracting party is a private company or a Government department. A site can be further classified into either a building site (such as residential buildings, commercial buildings and general superstructure erection) or a civil engineering site (such as railways, roads, highways, water works, drainage, reclamation and excavation works) depending on the nature of the work or the end-use of the construction project.
The concept of site supervision is based on the following parameters:
1. Scale, S; 2. Difficulty, D, and 3. Risk, R.
The difficulty and risk are combined to form the complexity, C, factor. The degree of supervision is based on the parameters S, D and R for every type of work.
A supervision plan aims at achieving the following:
1. That site safety be maintained at all times by controlling site work hazards. 2. That works are to be carried out in accordance with approved plans.
The present Site Safety Supervision requirements are divided into three streams:

48
1. Authorized Person (AP) stream; 2. Registered Structural Engineer (RSE) stream; and 3. Registered Contractor stream.
All three safety supervision streams are composed of engineering supervision and routine supervision. The engineering supervision focuses on the engineering principles while the routine supervision is basic checking of specified requirement. The AP stream is management oriented, the RSE stream is engineering oriented while the Contractor stream is operation oriented.
PWP Construction Site Safety Manual
The intention is stated in the policy document of the Hong Kong Government to accomplish public works safely, efficiently and with due regards for the environment. Accordingly, the Environment, Transport and Works Bureau in a bid to eliminate/reduce risks encountered by those involved in construction, maintenance and supervision has issued PWP Construction Site Safety Manual, that must be complied with by all PWP Contracts. The PWP Contract aims at an accident frequency rate of less than 1.5 reportable accidents (each of which resulting in incapacity for more than 3 days) per 100,000 man hours. This figure is equivalent to about 55 reportable accidents per thousand workers each year.
Safety Charter
On a broader basis, the Government has also issued a ‘Safety Charter’, a written document highlighting the commitment of both the employers and employees in creating and maintaining a safe and healthy work environment. This has led to the drawing up of a framework for introducing a Safety Management System. Organizations which have subscribed to the Occupational Safety Charter have totalled 557 so far (this list also includes the Government Departments). The construction Industry seems to have taken the Charter seriously as evident by the growing number of construction companies included in the list. The key areas of a Safety Management System are:
§ Policy—It defines employers’ commitment to communicating, implementing and maintaining a safe workplace.
§ Planning—It ensures that projects are reviewed at the design stage so as to minimize future risks. It also ensures that plans are in place to deal with emergencies safely and effectively.
§ Procedures—They make sure that employees understand clearly the in-house safety rules and regulations, and their obligations.
§ Investigations—They ensure that all accidents and incidents at work are analysed, conclusions are properly drawn and appropriate action taken.
§ Subcontracting—It governs the responsibilities of the contractors, so that their subcontractors are fully aware of, and are capable of meeting the contractors’ safety management obligations.
4.3.4 Enhancement of Construction Safety
The Hong Kong construction industry accident rate is extremely high when compared to other local industries, and the construction industry of other countries. There were 9,747 employee compensation cases for personal injury received in site accidents, with sick leave exceeding three days reported in 2001. As at the end of 2002, 9,108 non-fatal cases and 10 fatal cases were settled, with a sum of $341 million payable as compensation to the injured employees or family members of deceased employees. These accidents also resulted in the loss of 454,000 workdays, or about 50 days per worker. In Hong Kong, the Employees’ Compensation Ordinance establishes a no-fault, non-contributory employees’ compensation system for work injuries. Under the system, employers are legally required to take out insurance policies to cover their liabilities under both the Ordinance as well as common law for work injuries of their employees. There are some major reasons for the high accident rate in Hong Kong:

49
§ High-rise buildings remain predominant in Hong Kong. Many hazards are associated with working at heights and with the vertical transportation of materials, such as falling objects or the fall of a person.
§ Most construction sites are very crowded, do not have sufficient storage space or space for auxiliary works. In the construction site, different tradesmen have to work close together within limited space. The most frequent accidents include: stepping on, striking against or being struck by objects.
§ Hong Kong construction sites are still employing labour intensive methods.
In the last ten years, construction accidents claimed the lives of 470 workers, accounting for over 80% of all fatal industrial accidents. The trend of both accidents as well as fatalities however seem to be lowering in the construction industry. In 2000, 11,925 accidents including 29 fatalities were recorded for the local construction industry. The accident rate of the construction industry per thousand workers in 2000 was 149.81, lower than 198.45 in 1999 by 24.5%. Over the past two years construction industry recorded a significant decrease by about half in the accident rate. The improvements have continued this year, where the accident statistics for the first half of 2003 show a reduction of 34% in the number of construction accidents - from 3,223 to 2,141 - and 20% in the accident rate - from 82.6 to 66 - over the same period last year. Table 4.3.4 indicates the accident rates from 1994 to 2003 together with the number of accidents reported under the Employees’ Compensation Ordinance.
While the number of fatal construction accidents has been on the decline in the past few years, there is very much concerned over an upward trend this year. Provisional figures indicate that the number of fatal industrial accidents in the first three quarters of 2003 increased by 38% from 21 to 29, compared with the same period last year. Of these, 25 occurred in the construction industry, representing an increase of 25% compared with 20 in the same period last year. To counter this worrying trend, the Labour Department has stepped up law enforcement action in construction sites. A special operation was conducted in July and August this year to inspect 4,230 construction sites and, as a result, 17 suspension notices and 183 improvement notices were issued, prosecutions on 235 offences and also were initiated.
Improvement in safety performance continued into 2001. A total of 28,518 industrial accidents (IA) were recorded in 2001, a drop of 15.3% compared with the figure of the previous year. The construction industry recorded the most remarkable improvement, with a drop of 22.8% in accident figure and 23.5% in accident rate. Fatal accidents dropped from 43 cases in 2000 to 34 in 2001, and for the construction industry alone, from 29 to a historical low of 28 cases.
Despite the significant fall in the accident rate, the safety record of the local construction industry still has a long way to improve. As illustrated in Table 4.3.4, the occupational health and safety has still not been properly addressed so far in the construction industry in Hong Kong. About one in every three accidents has occurred in the construction industry between 1994 and 2003.
Since 1997, most government contracts have explicitly indicated that contractors are required to arrange for their workers to enrol in the Enhance Green Card Course, a safety induction course for the construction industry. Moreover, the Factories & Industrial Undertakings (Training) Regulation also stipulates that construction workers should receive approved safety training courses and to obtain a pass before they are being allowed to enter construction sites.

50
1989 1990 1991 1992 1993 1994 1995 1996 1997 1998 1999 2000 2001 2002 2003 Q2
No. of Construction
Accidents 26,399 25,138 23,115 18,815 16,573 16,422 15,268 16,469 18,559 19,588 14,078 11,925 9,205 6,239 2,141
No. of Fatalities 59 58 54 48 80 51 63 51 41 56 47 29 28 24 25
*Employment 70,505 71,113 63,450 62,232 56,226 59,710 65,611 74,907 81,629 79,007 71,780 83,924 76,601 66,393 63,174
No. of Accidents per
1,000 Workers
374.4 353.5 364.3 302.3 294.8 275.0 232.7 219.9 227.4 247.9 196.1 143.0 114.6 85.2 66.0
No. of Fatalities per
1,000 Workers
0.837 0.816 0.851 0.771 1.423 0.854 0.960 0.681 0.502 0.709 0.655 0.350 0.349 0.328 0.240
* The employment size only covers manual workers on construction sites Source: Labour Department, HKSAR
Table 4.3.4 - Serious Construction Accident in Construction Industry from 1989-98
Number of Construction Accidents and Fatalities Since 1989
0
10
20
30
40
50
60
70
80
90
1989 1990 1991 1992 1993 1994 1995 1996 1997 1998 1999 2000 2001 2002 2003Q2
Year
Num
ber
No. of Accidents ('000)
No. of Fatalities
Chart 4.3.4 - Construction Accidents between 1989-2003 Q2
Over the past 10 years (1992-2001), there has been a very significant reduction in the number of accidents, especially in the construction industry, as shown in the above Chart 4.3.4.
Safety and health training for employees is perhaps the most fundamental element for a safety management program. Not only is it essential for employees to be informed about safety and health matters, but the regulation also requires all employees to be trained in those aspects related to their employment, as it is essential for them to perform their tasks safely. When people have been properly trained, they have acquired the necessary skills to do their jobs safely. When employees and their workplaces are properly matched, it is suggested that they are less likely to sustain injury or to suffer from illness.

51
4.4 Development of New Technology in the Construction Sector
No new technology seems to be in the offing in the industry. There is however a continued emphasis on innovation in building and construction to suit the changing context of labour, prices, materials and environmental standards. The Provisional Construction Industry Co-ordination Board (PCICB) is set up to create a positive ambiance for an efficient, innovative and productive industry. The commitment of the Government behind this particular ‘impetus’ for making the construction methods and techniques more modern by using sophisticated technology along with IT stems from the experience of nearly a half a century of public housing construction in Hong Kong. This is also in line with the construction industry’s continued striving for greater efficiency and raising standards. Housing still remains one of the most coveted and also expensive of commodities in Hong Kong while construction in itself is a complex task of converging diverse skills and techniques to produce a tempting ‘product’. In Hong Kong growing demand for housing coupled with increasing wages of labour as well as rising prices of materials naturally forced both the Government and the private sector to work towards bringing ample efficiency, innovation and creativity in techniques and materials.
The construction industry in Hong Kong has remained prudently conservative when it comes to application and research of new technology. Some degree of mechanization could be seen with public housing construction where large panel formwork, tower cranes, concrete pumps and other mechanical equipment and plants are used. However the local contractor’s technological ability is poor compared to international standards. This inferiority restrains them from undertaking large and technologically savvy projects. In the Airport Core Programme, Hong Kong’s biggest project in the past decade, out of a total of 145 contracts awarded by the government, Airport Authority, MTR and Western Harbour Tunnel Co., Japan gained the largest share (by value) of 25%, followed by Hong Kong (23%), UK (16%), China (6%), Netherlands (6%) and the remaining distributed among France, Belgium, New Zealand, Australia, Spain, Italy, Germany and the USA.
As to materials for construction, it has been increasingly recognized in Hong Kong that prefabrication along with the use of standardized and modular components will help to improve buildability. Public sector clients such as the Housing Authority have taken a noticeable lead in promoting these techniques. Rationalisation of processes and practices of project development and implementation would help shorten the learning curve and provide better predictability of outcomes. In a bid to streamline construction practices in Hong Kong the government further proposes a dedicated standardisation office to facilitate better coordination in the development and application of construction standards in Hong Kong. The construction industry can clearly exploit the fast growing IT sector for these purposes. 4.4.1 Prefabrication technology
In the United States, a construction worker’s wage can be 4 times higher than that of Hong Kong, but the production cost of high rise residential flat is more or less the same as that in Hong Kong Reasons include extensive use of prefabrication; e.g. wall, staircases, external facades, door sets, etc. that comes as a reliable labour saving technology.
On the whole the local construction continues to involve extensive wet trades on site and thus very labour intensive. Quality depends very much on the skills of the craftsmen as well as the intensive supervision of them for quality assurance. This puts a stress on the logistic management on site, and increases construction costs when there may be shortage of craftsmen and supervisors. Besides, excessive wastage and environmental damages are other factors that make in-situ construction costly, in both material as well as the non-material sense. It is now well understood that wider use of prefabrication can effectively overcome many of these problems. The Hong Kong construction industry is now more aggressively using prefabrication as a step forward towards efficiency and reduction in cost. As mentioned, led by public sector clients the benefits of prefabrication are being widely exploited by the private sector clients as well.
The Housing Authority in Hong Kong adopted prefabrication in the mid ‘80’s along with the introduction of a new Trident block series design that attempted to standardize the size and shape of walls. Application

52
of a precast façade system was first experimented with on a 33-storey block by a French Company, which unfortunately had to be stopped due to excessive water leakage at the joints. Metal-formed formwork subsequently became mandatory. Prefabrication technology eventually made its way as architects began to concentrate on the simplification of structural design to facilitate mechanized construction as well as standardized components. With the advent of the Harmony series design characterized by large panel formwork, prefabricated façades, prefabricated stairs, semi prefabricated slabs and fabric reinforcement, prefabrication technology became the hallmark of cost effectiveness, improved durability and enhanced buildability. Precast facades are now mandatory in standard domestic blocks in public housing. A variety of other precast materials such as precast concrete structural elements and panel wall partitions are also widely used.
Contractors in the public housing sector have adopted a manufacturing approach with prefabrication to stay eligible for tendering and to remain competitive. In the private sector, probably stemming from the recent downturn in the property market, it is observed that a number of developers have shown a heightened interest in the adoption of more efficient construction methods including prefabrication. Such interest will inevitably lead to innovation and greener building designs and construction methods. However, the most effective motivation appears to have come from the Government. Non-structural prefabricated external walls are now exempted from Gross Floor Area (GFA) and/or Site Coverage (SC) calculations under the Buildings Ordinance (Joint Practice Note No.2 issued jointly by Buildings Department, Lands Department and Planning Department in February 2002). This provision is among a basket of features intended to promote green and innovative buildings. According to the Head of the Buildings Department (2002) in a press release, “the use of prefabrication, particularly precast concrete, eliminates the use of formwork and falsework and improves site conditions”. By virtue of Hong Kong’s status as a market led economy, the effectiveness of the Government’s efforts should essentially be driven by market forces. However, it is likely that the extra cost, if any, of constructing external walls through prefabrication will be offset by the gains in selling the “bonus” floor areas. This is an example clearly demonstrating the important regulatory role of the Government that has the incidental effect of promoting the use of alternative technology by the industry. 4.5 Policy and Initiative on the use of IT in construction
The construction industry is greatly sensitive to information and communication owing to the fact that multiple parties are involved during the project delivery process. Information technology is now increasingly recognised to have great potential to enhance access and exchange of project information and transact with one another electronically in a seamless manner. The CIRC (2001) has recognised IT as an important means for better information dissemination among all the parties concerned, improved design capabilities and enhanced project logistics management. Hong Kong’s construction industry has recently begun to reap the fruits of IT particularly through the use of software applications for selected tasks such as CAD drafting, structural analysis, budget estimation and contract administration. Yet full potential of IT in the sector of construction management and logistics planning is still far from realisation. It is observed that despite its huge potential for bringing all participants together to work efficiently and more productively from the improved information flow along the construction value chain, wider use of IT in the local construction industry has been (for quite some time now) stifled by a number factors including:
§ Fragmented nature of the industry which impedes wider adoption of common IT tools across disciplines.
§ Absence of conducive ambiance due to lack of common standards and data infrastructure.
§ Lack of practical application solutions in the market to suit the local context.
§ High initial development costs and uncertainty over returns.
§ Low awareness of IT benefits at management levels and low IT literacy.

53
It should be noted that, the major inhibition for IT use in the construction sector in Hong Kong has been the lack of common standards and data infrastructures. The Government of Hong Kong, realizing the urgency of the situation has now taken a number of initiatives that have significantly contributed to the development of a common platform for electronic communication in the industry, and raised the general awareness in the potential use of IT in the construction industry. The government initiatives include: ongoing consultation study on the alignment of planning, lands and works data; study of CAD standard for drawings for works projects; pilot scheme to digitize building plans in the archives of Buildings Department; and feasibility study of the development of an electronic system for building plan submission and document management (that includes the Buildings Department’s close monitoring of the development of artificial intelligence technology with a view to testing the feasibility of introducing electronic checking of building plans).
Recently, the Environment, Transport and Works Bureau has taken active steps in finding ways to enhance the efficiency of electronic service delivery. The implementation of Electronic Mark Plant Circulation System and the Electronic Tendering Initiatives are a few examples of such efforts. Web Based Project Management, Electronic Supply Chain and Logistics management, Mobile Computing for Project Delivery and Electronic Document Management and Electronic Maintenance Management System are other initiatives that are under consideration by the Government in a bid to enhance IT usage.
Government initiatives apart, it is important in order to harness the full potential of IT that the private sector understands that IT by itself is an enabler and not a solution. The return on any IT investments is a long term one. Accordingly, to drive more extensive use of IT throughout the construction delivery process, there is a need to build a critical mass of IT users within the industry. Leading clients and construction companies should effectively take the lead in setting up IT establishments and in training and educating the work force at all levels of the industry.
In order to enhance the implementation of IT usage in the local construction industry a three-fold approach is recommended:
§ Consultation – Wider consultation with industry participants in the development process is essential with particular attention paid to the compatibility with and interoperability of the global standards.
§ Legalisation – Currently there are many exemptions made under the Electronic Transaction Ordinance for construction related legislation which should begin to be withdrawn.
§ Collaboration – A closer collaboration with the software companies and construction industry is essential to map out the demand and supply of software applications in the market. More recently Hong Kong has seen a launch of many IT solutions and integrated industry portals catering for the construction industry. Closer ties between the construction and IT industry will thus be a key to developing applications suited to the vernacular context.
4.6 Research and Development
The Hong Kong construction industry undertakes a negligible amount of research and development (R&D) activities. Although high-tech industries have been a priority of the HKSAR Government in recent years, according to data from the OECD, Hong Kong’s expenditure on scientific and technological research and development amounted to only 0.25% of its GDP in 1998, and ranked fortieth among forty seven major countries and regions. Serious competitors of Hong Kong, such as Taiwan and Singapore, ranked eleventh and fourteenth respectively, while China ranked thirtieth and India, thirty-second. Only 1.5 persons per one thousand Hong Kong people were engaged in research and development work. Even if one takes into consideration the US$178 million spent by the private sector on research and development, Hong Kong still spent only 0.36% of its GDP in 1998 in this area.
There are no major efforts coordinated by the Hong Kong Government or the industry to raise the general technology level in construction. Expenditures on research and development by local contractors,

54
particularly the indigenous local contractors, are practically nil. Belatedly the CIRC (2001) has begun to recognise research as the key to improving overall performance and competitiveness by enhancing productivity and improving quality through innovation. It is believed that the construction industry will inevitably benefit by development of better designs and materials as well as construction techniques and management practices. A strong R&D culture will not only produce design solutions that are suited to local conditions but will also maintain Hong Kong’s competitiveness and keep the local construction industry abreast with the latest technological enhancement in other countries. Some initiatives in the public and private sector are discussed below. 4.6.1 Public Sector
§ A research fund to promote research activities about enhancing construction quality and sustainability of public housing development was announced in June 2001 to be set up later. The Housing Authority has earmarked $20 million (US$2.56 million) to set up the Housing Authority Research Fund. Applications were received from academic institutes, professional institutes and associations, and contractors’ associations of major construction trades in the third quarter of 2001. This would be followed by the selection and commissioning procedures. The research fund has aimed at the following initiatives:
(a) Introduce the concept of “Technology Leading to Total Quality” into tender assessments. Tenderers who can innovate by providing proposals to enhance buildability and quality will be given higher technical scores during tender evaluation in recognition of their positive contribution.
(b) Establish an annual Excellence Award Scheme to recognize the contributions of new building innovations and to share productivity gains with innovations on more efficient building methods and better building materials.
(c) Draw up a systematic research plan by the HD annually to identify major study areas. (d) Facilitate the wider use of information technology in the construction industry.
§ The INTEGER Hong Kong Pavilion, once situated at the Tamar site, Central, demonstrated some of the ways in which green products and services, combined with intelligent technologies and innovative business practices that can be used to improve local housing developments. The research programme is designed to engage people involved in all aspects of Hong Kong housing, from the designers and developers to the property owners and residents. The programme was developed with the participation of the housing industry and local universities. They looked at specific issues that arose in this project and the implications on larger and real housing projects. A series of workshops and seminars were held throughout the lifespan of the project to bring together private and public sector design and construction experts. Application of the construction methods shown in the INTEGER Hong Kong Pavilion would help:
(a) Performance evaluation of “intelligent and Green” products and services. (b) Evaluation of waste reduction opportunities and refuse handling systems. (c) Development of INTEGER style housing projects through multi-disciplinary working
environment. (d) Life Cycle Assessment and Life Cycle Costing studies of multi storey residential building
projects that adopt the “intelligent and Green” principles (e) Identification of barriers to INTEGER design and construction concepts
§ Development is proceeding on a Science Park near The Chinese University of Hong Kong, Tai Po. Its mission is to create a “community of innovation” fostering Hong Kong based world class enterprise clusters to flourish in the knowledge-based economy of this century. Initial focus is four sectors: electronics, information technology, biotechnology and precision engineering. Phase One of the Science Park occupies 8 hectares (out of 22 hectares) with about 1.3 million square feet floor space. The opening ceremony was held on 27 June 2002. In order to meet the market

55
demand, development of Phase Two of the Science Park, 7 hectares in area, has been advanced. It is targeted to open in 2004.
4.6.2 Construction Research
Broadly, government investment in construction research is administered through the University Grants Council (UGC) and the Innovation and Technology Fund. A very limited amount of research is funded by private industry on an opportunistic basis, but recently established in 2003 is the Hong Kong CII (Construction Industry Institute) on the existing US model, and a number of firms have joined this organisation to pool funds in order to commission research projects from the Universities and potentially elsewhere.
UGC Funds
Most research projects undertaken by local universities are funded by the University Grants Council (UGC), either indirectly through the block grants to the Universities, some of which may be spent on research, or directly via its research grants council (RGC). The RGC allocates funds across the research fields on a competitive basis once a year, to individual university employed applicants. Construction researchers win funds each year of the order of HK$ 20 million (US$ 2.5 million).
Innovation and Technology Fund
The Chief Executive’s Commission on Innovation and Technology, set up in March 1998, recommended several measures for the promotion of knowledge-based and higher value-added activities. These include the establishment of a $5 billion Innovation & Technology Fund, an Applied Science & Technology Research Institute, Applied Research Fund, Science Park, Cyberport as well as measures to stimulate university-business partnership in research and development and to strengthen technological collaboration between Hong Kong and Mainland China.
The construction industry falls within the coverage of Innovation and technology Fund. However the industry is yet to make the full use of this fund due to low awareness, itself perhaps a result of the inherently fragmented nature of the industry, on the scope as well as the application methods of the Fund. While the RGC fund is focused also on basic research, the latter supports applied research that contributes to innovations or upgrading of technology.
As stated above, on the one hand investment made in R&D in construction research is significantly low while on the other those efforts that are made are marred by lack of coordination between industry and academia. While the academic sector is recognised as the principal research body, there has been little interaction between these two sectors to effectively articulate the local research needs.
Hence to avoid duplication of efforts to bring in cost efficiency, research funding bodies, research providers and potential research users need to work in partnership, under the aegis of an all embracing body. Better coordination will also encourage private sector clients to begin to commit resources for the construction research and development in Hong Kong. The new CII is a helpful step in this regard, and the new Provisional Construction Industry Co-ordination Board (PCICB) has established a task force, one of whose tasks is the co-ordination of more research.
University Research
There are nine construction industry departments in five of Hong Kong’s Universities and a long established centre for Urban Planning and Environmental Management at Hong Kong University. Four of the Departments are in the Hong Kong Polytechnic University, the only University with a Construction Industry Faculty (or School) – the Faculty of Construction and Land Use. Across the nine construction industry departments, there are roughly 200 – 250 research active academics in total and at the end of 2001, there existed established Research Centres in the following discipline areas across the various campuses.

56
Building Environmental Performance – 7 centres Construction Process and Economics – 6 centres Environmental Engineering and Management, including Transportation – 12 centres Geotechnical Engineering – 4 centres Structural Engineering and Materials – 7 centres
4.7 Environmental Conservation
Perhaps construction activities are inherent adversaries to the environment, for their very aim is to physically change the existing landscape. But for their contribution to the economy and our basic need for shelter, accommodation and infrastructure we cannot stop constructing. Yet at the same time construction activities generate significant environmental nuisances in the form of noise, dust, muddy runoffs and improper disposal of waste which should be minimised as much as possible. Hong Kong’s vibrant construction industry saw a 9% rise in the number of complaints for non compliance with the environmental protection measures in 1999 compared to the figure of 1998. The number of convictions also increased by 40% over the same period. Disposal of construction and demolition materials also presents a major problem in Hong Kong. In 1999, construction industry produces 7.52 million cu. M. of construction and demolition materials, a 14.3% increase over 1998. In 1999 about 21% of construction and demolition materials were disposed off at landfill sites which accounted for over 40% of the total waste disposed of there. In 2001, about 38% of the construction and demolition waste was disposed of amounting to some 6410 tonnes per day of waste.
The impact of construction activities on the environment in Hong Kong goes beyond simply producing excessive waste, and air, noise and water pollution. Aspects of energy consumption and land contamination also affect the environment in more indirect ways in the long term. Research and development as part of the construction process is intricately linked to the introduction and development of environmentally friendly materials and techniques to reduce the adverse impact on the environment. However efforts to simply minimize the effects of such pollution will only be a myopic approach to the problem. The ultimate solution still depends upon our ability to make the industry more responsible with the application of materials and technology that are sustainable, recyclable and non-hazardous to the environment. The concept of environmental conservation dwells even further in the realm of policy and planning much in line with the principles of sustainability. Of late the Government has been aggressively coming forward with multi-tiered regulatory measures to curb these problems.
Construction noise is controlled under the Noise Control Ordinance using a permit system. Hand-held percussive breakers and air compressors are controlled by a label system. Industrial and commercial noise is controlled by the mechanism of Noise Abatement Notice (NAN). Complaints received are investigated and NANs are issued to those failing to comply with the required limits. Prosecution action would follow and normally result in fines being imposed on the offenders. Enforcement Activities and Statistics under the Noise Control Ordinance carried out by both the Police and the Environmental Protection Department (EPD) shows in 2001 that there were 273 prosecutions for construction noise. Offenders are liable to a maximum fine of $100,000 on first conviction and $200,000 on further convictions. 4.7.1 Corrective measures
The Noise Control Ordinance (NCO): Construction sites in Hong Kong have always been a significant source of noise pollution. Regulations for specific control such as the Noise Control (Air Compressors) and Noise Control (Hand Held Percussive Breakers) are promulgated to exercise specific noise control on particular machinery used in construction sites. These regulations require machinery to comply with the statutory noise standard and be issued with a noise emission label. The two most common mechanical equipment that fall within the control of the said regulations are Concrete/Rock Breaking Equipment and Portable Air Compressors.
Water Pollution Control Ordinance (WPC): This ordinance along with its subsidiary regulations (CAP 358A- CAP 358W) allow designated areas to be ‘water control zones’. Within the zones, licence is

57
required to discharge effluent. The criteria for license and limits are set out in the Technical Memorandum of Effluent Standards. This caters for development in places where connections to public sewerage are not feasible.
Air Pollution Control Ordinance (APC): As for noise control, the major impacts of the Air Pollution Control Ordinance on property development are experienced during the environmental impact assessment and site layout design stages. It also aims to control excessive noise from the percussive.
The Factories and Industrial Undertakings Regulations: This regulation, concerning the safety of people, lays down control measures and requirements for protective equipment, storage and distribution of asbestos materials and conditions for working with asbestos. The (Asbestos) (Administration) Regulation provides for registration of asbestos consultants, supervisors, laboratories and contractors. Since May 1993, the EDP has been operating a “cradle-to-grave” licensing system to control the manufacture/import of asbestos and keep track with their sale and use, removal and disposal.
Waste Disposal: As with other pollution control ordinances in Hong Kong, waste disposal control is based on the ‘Polluter Pays Principle’ and backed up with a body of sanctions and penalty for non-compliance. Promulgated in 1995, it aims to regulate commercial and hotel buildings such that they are designed to achieved energy efficiency. The criteria are measured against the Overall Thermal Transfer Value (OTTV). The external walls and roofs are designed to achieve at least the minimum standard required to avoid waste of energy. The Regulation has however been criticised in that the requirements are too rigid in terms of choice of materials, colour scheme and for stifling innovative options in building design.
Building (Demolition Woks) Regulations: Before the enactment of the Air Pollution Control (Construction Dust) Regulation, this Regulation made under the Buildings Ordinance provides for, inter alia, prevention of dust nuisance and removal of construction waste caused in the process of demolition. Contractors are required to erect dust screens to protect the works and notify EPD of the demolition works for monitoring through the Buildings Authority. Under the (Construction Dust) Regulation, it is a mandatory requirement of a contractor to notify the EPD prior to commencement of works or else be liable to a penalty.
Environmental Impact Assessment (EIA)
Environmental Impact Assessment has been an integral part of development and construction of projects in Hong Kong following the enactment of its ordinance on the 4th of February 1997. This Ordinance covers both public and private projects (but does not cover residential projects except for development projects in the vicinity of sensitive zones), enables the Director of the Environmental Protection Department to regulate the process and designate projects that must apply for Environmental Permit prior to its commencement. In Addition, larger urban environmental projects covering 20ha or more and involving over 100,000 existing or new population are required to submit EIA report. Along with EIA, Strategic Impact Assessment for major planning projects has also been enforced. Impacts of EIA on environmental conservation are large. In general, developers would encounter rejections, amendments and resubmissions before final approval is obtained.
HK-BEAM
Modelled on the UK Building Research Establishment’s Environmental Assessment Method, The Hong Kong Building Environmental Assessment Method (HK-BEAM) was set up in early 90s and operated by the Centre for Environmental Technology Ltd (CET), the executive arm of Private Sector Committee on the Environment. It is developed and funded by the Real Estate Developers Association with the bulk of the technical input provided by the Department of Building Services Engineering at the Hong Kong Polytechnic University, the Welsh School of Architecture, and the ECD Energy and Environmental Ltd. The scheme, a voluntary initiative by property owners, gives recognition for enhanced environmental performance in the design, operation and maintenance of new and existing commercial buildings. Certification to HK-BEAM is completely voluntary and undertaken by independent specialists.

58
The Government Property Agency (GPA), as the portfolio manager of government properties, is committed to establishing and implementing a sound environmental policy. As part of its pro-environment drive the GPA aims at:
§ Ensuring that energy-saving designs and installations will be incorporated in the construction of new joint-user office buildings.
§ Continuing the energy conservation practices adopted in managing government joint-user office buildings. § Seeking improvement in waste minimization and recovery in managing government buildings. § Ensuring green procurement for standard office furniture. § Ensuring green office management.
Comprehensive Environmental Performance Assessment Scheme (CEPAS)
Buildings Department (BD) has, in August 2002, commenced a consultancy study to develop CEPAS along the lines envisaged in CIRC recommendations, as a means to upgrade environmental performance of buildings in Hong Kong. The concept of CEPAS will provide an objective method and eventually benchmarks to facilitate the community, the professionals as well as the Government to assess the environmental performance of buildings. The new system would be designed for application to all types of buildings, old or new, and be capable of dealing with entire developments as well as individual features or components. The consultants have been looking at 11 existing assessment schemes, including HK-BEAM, on formulation of performance benchmarks for buildings, and incentive systems applied abroad for the purpose of drawing up a basic framework for CEPAS and recommending an implementation strategy. Concern is prevalent about duplication with similar initiatives taken by other industry stakeholders, particularly HK-BEAM, under which over 83 buildings had already been certified. Since the eventual choice of solutions must be supported by the industry at large, it seemed logical to leverage on the demonstrated success and widespread acceptance of HK-BEAM instead of starting afresh, thus avoiding the risk of confusion caused by having different schemes functioning in parallel.
The environmental performance of the buildings in Hong Kong should be part of the framework to measure the sustainability of Hong Kong. The current CEPAS initiative focuses on the buildings as the basic units for assessment. However, in the high-density development prevalent in this city, the way buildings are designed as a cluster or a neighbourhood will often dictate the environmental quality of the individual buildings. There are many examples where a single building achieves high environmental performance standards internally but performs poorly in the neighbourhood context, thus one should not loose sight of the need to ensure the public realm between buildings to achieve high standard of environmental quality. Hence, strong considerations are made to extend the concept of CEPAS to cover neighbourhood planning or comprehensive development projects. 4.7.2 Environmental Planning
The Government in general has prescribed the following environmental principles to be adopted by all construction related agencies in Hong Kong:
§ Integrate environmental considerations into the planning, design, construction, operation and maintenance of all facilities and services.
§ Maintain environmental policies and standards that meet legal requirements. § Promote the use of environmentally acceptable materials and technology in the design, construction,
operation and maintenance of buildings. § Develop or adapt procedures and technologies to the benefit of both the environment and wider
community. § Identify environmental impacts associated with the project. § Take suppliers’ environmental performance into account in all purchasing strategies.
The environmental control framework in Hong Kong is moving towards a more integrated approach to ensure that environmental factors are taken into account at all stages of planning and project development. For territorial and sub-regional planning, the Environmental Protection Department is involved for

59
environmental input in formulating the Territorial Development Strategy carried out by the Planning Department. The strategy will identify further strategic growth areas to meet long term development needs and comprehensively assess the environmental impact and development potential of these areas. At the local planning level, environmental factors recommended in the Environmental Chapter of Hong Kong Planning Standards and Guidelines have to be considered when planning applications are submitted by planners, architects and engineers. With the effect of EIA Ordinance, Environmental Permit is a pre-requisite for planning approval for designated projects.
Levels of Planning Objectives of Environmental Inputs Means of Inputs
Strategic Planning through Territorial
Development Strategy
Address key strategic environmental issues, environmental carrying capacities, environmentally suitable areas for developments.
The Environment Chapter of Hong Kong Planning Standards and Guidelines (HKPSG), strategic environmental assessment.
Sub-regional planning and feasibility studies for
new towns
Address the environmental acceptability of major development strategies and plans.
The Environment Chapter of HKPSG, environmental planning studies at the regional level, environmental assessment of plans, site search and EIA studies.
Outline Development Plans, Outline Zoning
Plans, and Layout Plan
Address environmental compatibility of land uses, environmental acceptability of plans, and environmental facility requirements.
The Environment Chapter of HKPSG, environmental assessment of plans, environmental advice at planning committees.
Project planning and implementation
Address the environmental impacts of project design and implementation, and monitor the actual environmental impacts
Project EIA, environmental monitoring and audit, the Environment Chapter of HKPSG.
Table 4.7.2 - Environmental Inputs to Different Stages of Forward Planning
It is observed that efforts for environmental conservation in Hong Kong should ideally be based on life cycle considerations rather than short term benefits, for which quality of materials and construction techniques are important. Ongoing rebuilding and renewal of the city’s structures in itself are hazardous to the environment in the long term, hence more sustainable and durable production should be the aim of construction activities based on the concept of life cycle costing, which refers to systematic evaluation of all relevant costs associated with the acquisitions and ownership of the built form. The Building Safety and Preventive Maintenance Task Force issued a proposal to implement a ‘Defect Liability Warranty’ which will help promote more durable buildings.
As a long term strategy to preserve the environment, the construction industry in Hong Kong needs to adopt greener and more energy efficient designs. To encourage this a supportive regulatory framework, market demand as well as access to information on the environmental performance of buildings are needed. Construction of green building should be given adequate incentives. The industry also needs sufficient motivation to comply with regulatory requirements by making environmental performance a factor of consideration in tender evaluation and ongoing performance assessment.
Sustainable construction is a global trend and an integral part of wider dynamics of sustainable development. Hong Kong’s construction industry however is still several steps away from making headway towards this direction. The private sector in particular still perceives environmental regulation as an obstruction to economic development and a major setback in the pursuit of profit. In this context, a holistic effort from all the stakeholders becomes essential to promote sustainable construction.

60
5 GLOBALISATION OF THE CONSTRUCTION SERVICES 5.1 Government Policy on Liberalization
The Heritage Foundation and Fraser Institute of Canada have consistently rated Hong Kong as the world’s freest economy. Hong Kong embraces globalisation of trade and services and is an active participant in international organisations that promote such activities. The HKSAR Government vows to promote a free market economy with little government intervention. Liberalization is always part of its policies, even for the construction industry. The cornerstone of the economy rests on free trade and free markets that are open to all, no restrictions on investments inward or outward, no foreign exchange control, and no nationality restrictions on corporate or sectoral ownership with the exception of the territorial broadcasting industry.
With liberalization and de-regulation around the globe, Hong Kong looks for an expansion in the scope of business for banks and insurance companies. To enhance the global logistics and distribution businesses, Hong Kong’s trading partners are urged to adopt trade facilitation measures through simplification of customs clearance procedures and elimination of unnecessary regulatory practices that impede the movement of goods, among other things. The continued liberalization of China’s economy remains a source of business opportunity for Hong Kong. Contracted foreign direct investment (FDI) into China grew by 47% in the first two months of 2001 while actually utilized FDI grew by 24%. The inflow of overseas companies into Hong Kong to set up regional operations or headquarters continues to be strong in recent months, following a 20% increase in the number of such companies last year. Multilateral rules on the domestic regulation of the accountancy sector were adopted. These rules would enter into force together with those being developed for other professional services. The Government is constantly reviewing and improving our documentation processes.
Hong Kong is also one of the most open insurance centers in the world. Its openness is acknowledged in the Commission of European Communities Report, Treatment Accorded in Third Countries to Community Credit Institutions and Insurance Companies (1992), which states that ‘‘Hong Kong grants national treatment to foreign insurance companies and does not impose any significant restrictions on foreign establishment’’. At the end of 2000, there were 100 authorized insurers incorporated in Hong Kong. 5.2 Commitments in GATT & WTO
In 1986, Hong Kong became a separate contracting party to the General Agreement on Tariffs and Trade (GATT). Upon the establishment of the World Trade Organization (WTO) on 1 January 1995, Hong Kong became one of its founding members. Hong Kong also became a member of the Customs Cooperation Council (subsequently renamed the World Customs Organization) in 1987 and the Asia Pacific Economic Cooperation (APEC) in 1991. The status of the HKSAR in these and other international organizations remains unchanged except that our participation is now under the name “Hong Kong, China”. Hong Kong is a staunch supporter of the multilateral trading system and adheres to GATT principles of non-discrimination and most-favoured-nation treatment. Hong Kong takes seriously its rights and obligations as a Member of the WTO. Hong Kong’s free trade policy applies to both merchandise trade as well as trade in services.
As a founding member, Hong Kong has its full commitments in GATT, with no exception for (i) construction and related engineering services and (ii) architectural and engineering services. In fact, Hong Kong is more liberalized than any other economy in the construction field in the region. Economic liberalization came into effect a long time ago. There has been no capping on foreign equity except for the territorial broadcasting industry. Open bidding for public works has been adopted over the last century, whilst Hong Kong has pioneered Build-Operate-Transfer (BOT) projects with the Central Cross-Harbour Tunnel being the first BOT project in the region. In stark contrast to what has been happening in other parts of Asia (Rafter and Peccadillo, 1997), all these measures vividly exemplify the openness of the local economy not only to the construction sector in particular but to all sectors in general.

61
5.3 Rules and Regulations for Participation of Foreign Contractors and Professionals
Hong Kong acceded to the WTO Agreement on Government Procurement (GPA) on 20 May 1997, which entered into force for Hong Kong on 19 June 1997. According to the authorities, Hong Kong maintains an open and non-discriminatory public procurement system for goods and services, and extends voluntarily non-discriminatory treatment on a Most Favored Nation basis to all countries irrespective of whether they are signatories to the GPA. The government procurement process is governed by the Stores and Procurement Regulations issued by the Financial Secretary under the Public Finance Ordinance. Most government procurement of goods and services in Hong Kong is handled by the Government Supplies Department (GSD), which is the Government’s central procurement agent. Construction services are procured by the individual Works departments, under the general supervision of the Environment, Transport and Works Bureau. Individual departments may make direct purchases only of low value items or with special approval from the relevant authorities. Services are generally procured by individual departments.
Hong Kong has not placed any legal or institutional restriction on foreign contractors entering either the public or private construction markets, nor on professionals. Foreign contractors are subject to the same sets of criteria, rules and regulations as their indigenous local counterparts. As such, foreign contractors are subject to the same set of laws, rules and regulations as local contractors. The long established Hong Kong Construction Association has its membership open to both local and foreign contractors. The following contractors are eligible to apply for their membership:
§ All approved contractors for Hong Kong Government Public Works. § All approved contractors for Hong Kong Housing Authority Work. § All contractors registered with the Buildings Ordinance Office.
Foreign contractors seeking inclusion in the Government’s lists of approved contractors are generally required to meet the same financial, technical and managerial criteria applicable to domestic contractors, and to provide their latest unconsolidated, audited accounts. Further, they have to produce evidence of technical capacities, substantiated by the consul or trade commissioner of their country in Hong Kong. They are also required either to set up a registered office in Hong Kong or to appoint a local agent who must be a person of good standing such as members of a firm of accountants or solicitors in Hong Kong. Successful foreign contractors will be appointed initially on probation. A probationary contractor may be awarded at any time to a maximum of two contracts each exceeding $50 million which together do not exceed $120 million in each of the works categories to which the contractor has been appointed on probation. 5.4 Foreign Participation in the Domestic Market
A total of about $235 billion (US$30 billion) has been committed on new major rail, road, land, port and environment projects as well as numerous, smaller projects in a bid to help Hong Kong maintain its position as a regional transport hub and improve the quality of life. The new rail projects will add more than 60 kilometres to the existing 143 kilometres of railway lines in Hong Kong and open up the northwest and northeast New Territories for further development. The road projects will include the construction of and improvements to more than 100 kilometres of strategic roads. A substantial chunk of these projects will also go to foreign contractors and consultants.
Foreign contractors have been dominating civil engineering works in Hong Kong (Chiang, Tang and Leung, 2001). In the building sector, major developers in Hong Kong are local Chinese, and major investors to Hong Kong property are ethnic Chinese. The dominance of local developers in the property sector has been attributed to the information barrier of entry. On the other hand, many foreign contractors, especially those multi-international players, excel in the areas of finance, proprietary technology, and economies of scale. Thus, foreign contractors play a leading role in the construction industry, especially the complex infrastructure sector. Consequently, foreign and localised foreign contractors tend to dominate the civil engineering sector that is more capital and technology intensive than the building sector.
62
5.5 Impact of Liberalization under the World Trade Organization
The Hong Kong Government follows liberalised policies, facilitating a free market system. In the construction sector, the Government encourages private sector investment in order to maximise land use, and continues to see its role to be a facilitator rather than provider. Given this, there is no observable impact of liberalization in Hong Kong, under the World Trade Organization.
Unification of Hong Kong with China in 1997 has removed the political uncertainty factor, which was perceived to be a severe problem in the past. Recent obstacles against infrastructure development are largely economic. The Asian financial crisis is identified as the culprit. Unlike other Asian currencies, the Hong Kong dollars remain pegged to the US dollars and do not devaluate. Notwithstanding repeated promises from the HKSAR Government to protect the currency peg, speculators keep betting on a delink. As a result, local interest rates once rose and stock market plummeted. All these have hampered the ability and interest of the private sector to fund infrastructure projects in Hong Kong. Economic base of the territory is seriously eroded. Asset prices in the territory dropped drastically. Availability of private finance capital is now a major constraint. Internal consumption contracts substantially causing great concern to future demand and financial viability of the proposed major infrastructure projects.
The WTO agreement in Doha in November 2001 on a programme of work on trade liberalisation and related issues has pushed for bilateral and regional multilateral free trade pacts in the region, for e.g. ASIANFTA, AUS-NZ trade pacts, Singapore bilaterals etc. Ideas in these forums may be reverberated in the construction industry as well and certain preferential treatment could be observed. For example, the main issue for Hong Kong would be the national access to the Mainland service sector, while for China the problem would be how to limit preferential access to Chinese nationals without undermining Hong Kong’s own status. Nonetheless, WTO remains a wider institutional umbrella for the flow of goods and services in the region.
At the same time, as Hong Kong becomes more interlinked to China, efforts to attract and retain international business, investors and human capital to provide the added-value to boost Hong Kong’s competitiveness. The Government aims to retain Hong Kong’s position as the first and logical place that comes to mind in terms of business and investment not only in China, but the rest of Asia. About more than 3,200 international companies have now established their regional operations in Hong Kong - nearly 650 from the United States alone - 30% more than in 1997; and many others have simply ‘set up shop’. They have been attracted by the region’s free and open domestic market as well as China’s vast market. To illustrate this, by the end of 2001, preliminary US government statistics showed that American direct investment in Hong Kong totalled US$25 billion. These links are likely to expand in the future, now that China is a member of the World Trade Organisation.
Against this background, privatisation of future infrastructure development, or co-operation with the private sector, becomes essentially an acid test of the private sector confidence towards Hong Kong’s future in general, and its currency in particular. In so far as the domestic scene is concerned, more construction projects are needed primarily to provide additional employment to the current economy. In the light of the credit crunch and uncertainty associated with local currency, the HKSAR Government will play a greater role in financing these projects than previously. However, because of a likely reduction in government revenues due to economic recession and plummeting land prices, government intervention in infrastructure development has to be achieved in the context of much weaker public financial basis. 5.6 Strategies Towards Co-operation in the Asian Construction Market
Globalization across the world and cooperation on a regional basis are seemingly complementary processes that the Hong Kong Government has endorsed. For instance, the technical standards or agreements formed as a result of the regional cooperation in a certain part of the world may develop into global application. Hong Kong has been open to regional co-operation, and, for long now, there has been no institutional barriers of entry to foreign firms providing either consultancy or construction services. The Government in its bid to boost cooperation, however has realized that technical cooperation requires

63
participation of all the sectors of the society i.e. government, academe and industry, and its objectives should be widely diversified such as in (a) promoting commercial business, (b) assisting other countries, (c) pursuing common interests such as development of technology, and (d) setting standards and bench marking. The Government aims to further enhance cooperation in these channels.
It is these open and positive strategies that have been the hallmark of the construction market in the territory. The Government welcomes all kinds of co-operation in the construction industry and refrains from setting limits on foreign equity participation in construction and related engineering services, nor in architectural and engineering services. As mentioned before, absence of institutional, legal or information barriers of entry to foreign contractors has led to a number of overseas contractors and consultants bidding for local projects. Once registered with the Buildings Ordinance Office as a main contractor, local as well as foreign entities can engage in construction activities in the territory. In fact, many of the domestic contractors were originally major international players coming from abroad for the Mass Transit Railway and other civil engineering infrastructure projects, such as Leighton from Australia, Kumagai Gumi from Japan, Gammon from the UK, and Dragages et Travaux Publique from France.
In addition, there are no preferential contract practices in Hong Kong. Hong Kong Government is particularly reputed for its laissez faire governance with a long-held philosophy of non-interference in commercial activities that offers no protection measures to domestic contractors, nor does it offer assistance to them seeking work overseas. Overseas construction of domestic contractors is done mainly in the Mainland China and the Southeast Asia region. However, most of the construction activities result from local developers’ overseas Build-Operate-Transfer (BOT) or joint venture contracts. There are also no constraints on repatriation of profits, or foreign exchange. Although Hong Kong does not have a construction board that promotes co-operation at strategic ministry level, as many countries in the region have, the business environment here could on the whole be regarded as very friendly to any form of co-operation that may arise with the regional economies.
Joint venture (JVs) has been a major form of foreign direct investment (FDI) in China. Foreign investors want to use JVs as a means to penetrate the domestic market. The features of JVs are the sharing of control over operations and the ownership of capital by all the entities involved. Thus, the foreign firm’s interests are closely intertwined with those of the local firms. Foreign investors usually face an unfamiliar business environment which is different to that in their home countries. They need to deal with many related issues: for example, the political and economic structure in a centrally-planned socialist country, cultural and language differences, current business practices, management systems and knowledge of government procedures with local governments. Foreign investors preferred to form JVs with Chinese local firms as a method of establishing themselves in a country that they were not familiar with. For instance, foreign business believes that their ability to form true strategic alliances was crucial for long-term access to the Chinese market. Obtaining information in China has been costly and time consuming for foreigners, particularly since much of it has not been officially published, especially in foreign languages. A JV performs this function effectively. Successful partnership reduces the need for information gathering by the foreign partner.
Foreign-exchange constraint has been the major problem in the operation of JVs in many other countries. In Hong Kong, aggressive but non-interference policy pursued and entrusted to all industries with high degree of freedom has led to near zero exchange control. Foreign firms can invest in Hong Kong in order to gain access to China. JVs are still popular even though China has allowed wholly-owned foreign subsidiaries to operate in China and the law on wholly-owned foreign firms was promulgated as far back as 1987. In order to further reinforce Hong Kong’s position as a global financial centre, greater flexibility in foreign exchange is likely attract more market participants and bring to the city, a greater share of global liquidity as investors increasingly trade around the clock and the globe.
Mainland/Hong Kong Closer Economic Partnership Arrangement (CEPA)
The Mainland/Hong Kong Closer Economic Partnership Arrangement (CEPA) has been launched to promote the joint economic prosperity and development of the Mainland and the Hong Kong Special

64
Administrative Region and to facilitate the further development of economic links between the two sides and other countries and regions. To achieve these objectives, following measures will be implemented under CEPA:
4. progressively reduce or eliminate tariffs and non-tariff barrier on substantially all the trade in goods between the two sides;
5. progressively achieve liberalization of trade in services through reduction or elimination of substantially all discriminatory measures;
6. promote trade and investment facilitation.
In doing so, CEPA will:
1. abide by the “one country, two systems” principle;
2. be consistent with the rules of the World Trade Organisation (hereinafter called the “WTO”);
3. accord with the needs of both sides to adjust and upgrade their economic regime;
4. achieve mutual benefits, complementarity and joint prosperity;
5. take progressive action, dealing with the easier issues first.
From 1 January 2004, the Mainland and Hong Kong will implement the specific commitments in liberalization of trade in goods and services under “CEPA”. The two sides will broaden and enrich the content of “CEPA” through continuous and further liberalization between them.
The two sides recognise that through over 20 years of reform and liberalisation, the market economy system of the Mainland has been continuously improving, and the mode of production and operation of Mainland enterprises is in line with the requirements of a market economy. The two sides agree that Articles 15 and 16 of the “Protocol on the Accession of the People’s Republic of China to the WTO” and paragraph 242 of the “Report of the Working Party on the Accession of China” will not be applicable to trade between the Mainland and Hong Kong.
1. Hong Kong will continue to apply zero tariff to all imported goods of Mainland origin.
2. From 1 January 2004, the Mainland will apply zero tariff to the import of those goods of Hong Kong origin as set out in Schedule 1 of Annex 1.
3. Not later than 1 January 2006, the Mainland will apply zero tariff to the import of goods of Hong Kong origin other than some 273 items specified at the moment. Detailed implementation procedures are set out in Annex 1.
4. Any new goods benefiting from elimination of import tariffs will be also be added to the above list in 3.
Neither side will apply any non-tariff measure that is inconsistent with WTO rules to goods imported and originated from the other side. The Mainland will not apply tariff rate quota against goods of Hong Kong origin. The two sides undertake not to apply anti-dumping measures to goods imported and originated from the other side and reiterate that they will abide by the WTO “Agreement on Subsidies and Countervailing Measures” and Article XVI of “the General Agreement on Trade and Tariffs 1994”, and undertake not to apply countervailing measures to goods imported and originated from each other.
65
REFERENCES
2001 Economic Prospect, Hong Kong Government.
2002 Economic Background, Hong Kong Government.
2003 Budget, Hong Kong Government.
Annual Report on the Consumer Price Index various issues.
Bon, R. and Crosthwaite, D. (2000) The Future of International Construction (London: Thomas Telford Publishing).
Buildings Department (1998), Technical Memorandum for Supervision Plans, Hong Kong: Buildings Department
Buildings Department (2000), Code of Practice for Site Safety Supervision, Hong Kong: Buildings Department
Buildings Department (2002) Web-site: http://www.info.gov.hk/bd/english/inform/news/20020205ae.htm.
Chiang, Y.H., Tang, B.S. and Leung, W.Y. (2001), “Market Structure of the Construction Industry in Hong Kong”, Construction Management and Economics, Vol.19, No. 7, pp.675-87.
CIRC (2001) Construct for Excellence, Report of the Construction Industry Review Committee, Government of Hong Kong Special Administrative Region.
Davis Langdon & Seah International, Current Building Cost Information Data in Hong Kong, various issues.
Estimates of Gross Domestic Product 1961 to 2002.
First Quarter Economic Report 2002
Government of the HKSAR webpage: http://www.info.gov.hk/censtatd/hkstat/fas/tpop.htm.
Gross Domestic Product, various issues
Hong Kong Lands Department webpage: http://www.info.gov.hk/landsd/lsr/lsr.htm.
Hong Kong Monetary Authority, Monthly Statistical Bulletin, various issues.
Hong Kong Rating and Valuation Department, Hong Kong Property Review, various issues.
Hong Kong Trade Development Council webpage: http://www.tdctrade.com/main/si/spcons.htm.
PCICB, Provisional Construction Industry Co-ordination Board (2001). Procurement of public works. http://www.pcicb.gov.hk/index.htm.
PCICB, Provisional Construction Industry Co-ordination Board (2002). 3rd progress report of working group on construction cost and performance indicators. Quarterly Report of Employment, Vacancies Statistics, various issues.
PCICB, Provisional Construction Industry Co-ordination Board (2002b). Follow-up paper on procurement of public works. http://www.pcicb.gov.hk/index.htm.
PCICB, Provisional Construction Industry Co-ordination Board (2003a). 8th progress report of working group on construction cost and performance indicators.
PCICB, Provisional Construction Industry Co-ordination Board (2003b). 7th progress report of working group on construction cost and performance indicators.
PCICB, Provisional Construction Industry Co-ordination Board (2003c). Progress report on implementation of recommendations of the Construction Industry Review Committee. http://www.pcicb.gov.hk/index.htm.
Quarterly Report on General Household Survey, various issues

66
Raftery, J. and Pasadilla, B. (1997) “Opportunities for Intra-Asian Corporation: An Overview”, The 3rd AsiaConstruct Conference, November 1997, Hong Kong, China.
Report of Salaries and Employee Benefits Statistics Managerial and Professional Employees, various issues.
Report on [“Year”] Annual Survey of Building, Construction and Real Estate Sectors, various issues.
Stoeckel A and Quirke D. 1992, “Services setting the agenda for reform” Canberra: Australian Government Publishing Service.
Yeung, Nicolas SY and Chan, Albert PC, “Collaborative research – Better Value for Construction”, Conference proceeding Project Management – Impresario of the Construction Industry Symposium, 22-23 March 2002, Hong Kong.
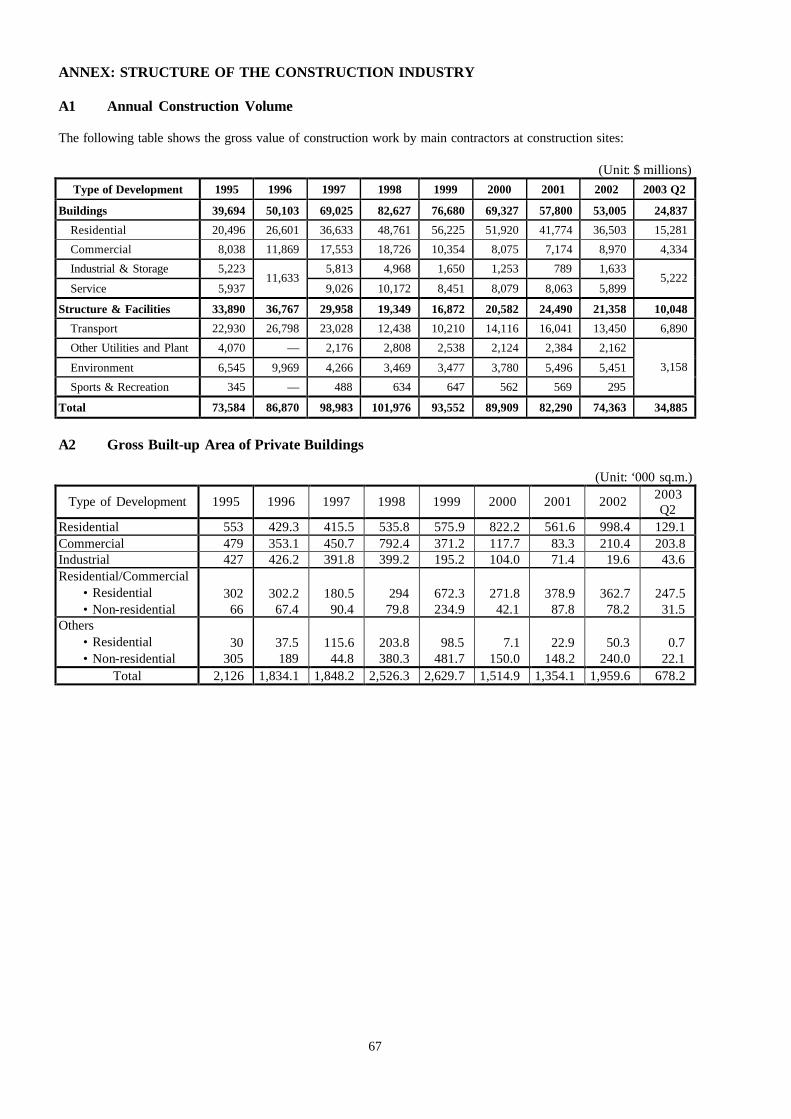
67
ANNEX: STRUCTURE OF THE CONSTRUCTION INDUSTRY A1 Annual Construction Volume
The following table shows the gross value of construction work by main contractors at construction sites:
(Unit: $ millions) Type of Development 1995 1996 1997 1998 1999 2000 2001 2002 2003 Q2
Buildings 39,694 50,103 69,025 82,627 76,680 69,327 57,800 53,005 24,837
Residential 20,496 26,601 36,633 48,761 56,225 51,920 41,774 36,503 15,281
Commercial 8,038 11,869 17,553 18,726 10,354 8,075 7,174 8,970 4,334
Industrial & Storage 5,223 5,813 4,968 1,650 1,253 789 1,633
Service 5,937 11,633
9,026 10,172 8,451 8,079 8,063 5,899 5,222
Structure & Facilities 33,890 36,767 29,958 19,349 16,872 20,582 24,490 21,358 10,048
Transport 22,930 26,798 23,028 12,438 10,210 14,116 16,041 13,450 6,890
Other Utilities and Plant 4,070 — 2,176 2,808 2,538 2,124 2,384 2,162
Environment 6,545 9,969 4,266 3,469 3,477 3,780 5,496 5,451
Sports & Recreation 345 — 488 634 647 562 569 295
3,158
Total 73,584 86,870 98,983 101,976 93,552 89,909 82,290 74,363 34,885
A2 Gross Built-up Area of Private Buildings
(Unit: ‘000 sq.m.)
Type of Development 1995 1996 1997 1998 1999 2000 2001 2002 2003 Q2
Residential 553 429.3 415.5 535.8 575.9 822.2 561.6 998.4 129.1 Commercial 479 353.1 450.7 792.4 371.2 117.7 83.3 210.4 203.8 Industrial 427 426.2 391.8 399.2 195.2 104.0 71.4 19.6 43.6 Residential/Commercial
• Residential • Non-residential
302 66
302.2 67.4
180.5 90.4
294 79.8
672.3 234.9
271.8 42.1
378.9 87.8
362.7 78.2
247.5 31.5
Others • Residential • Non-residential
30 305
37.5 189
115.6 44.8
203.8 380.3
98.5 481.7
7.1 150.0
22.9 148.2
50.3 240.0
0.7 22.1
Total 2,126 1,834.1 1,848.2 2,526.3 2,629.7 1,514.9 1,354.1 1,959.6 678.2

68
A3 Distribution of Contractors by Size in terms of Volume of Work
Number of Enterprises Number of Persons Engaged Gross Value of Construction Work Performed for 1999 ($’000) Number % Number %
< 500 6,302 31.1 11,059 7.0 500 – 1999 7,132 35.2 22,992 14.6
2,000 – 4,999 3,043 15.0 20,277 12.9 5,000 – 9,999 1,514 7.5 13,204 8.4
10,000 – 19,999 925 4.6 11,648 7.4 20,000 – 49,999 762 3.8 17,395 11.0 50,000 – 99,999 231 1.1 8,091 5.1
> 100,000 324 1.6 53,019 33.6 Total 20,233 100.0 157,685 100.0
Number of Enterprises Number of Persons Engaged Gross Value of Construction Work
Performed for 2000 ($’000) Number % Number % < 500 5,944 29.5 8,194 5.3
500 – 1999 7,625 37.8 21,716 14.0 2,000 – 4,999 3,212 15.9 19,449 12.6 5,000 – 9,999 1,295 6.4 11,696 7.6
10,000 – 19,999 928 4.6 14,188 9.2 20,000 – 49,999 621 3.1 13,594 8.8 50,000 – 99,999 251 1.2 10,653 6.9
> 100,000 305 1.5 55,186 35.7 Total 20,181 100.0 154,676 100.0
A4 Distribution of Contractors by Size in terms of Number of Employees
June 2002 Number of Enterprises Number of Persons Engaged Size of the Organisation by the Number of
Persons Employed Number % Number % 1 – 9 263 26.5 1,243 5.3
10 – 19 183 18.4 2,463 14.0 20 – 49 218 22.0 6,767 12.6 50 – 99 133 13.4 9,202 7.6
100 – 199 92 9.3 12,732 9.2 200 – 499 73 7.4 21,768 8.8 500 – 999 23 2.3 15,679 6.9
≥1000 7 0.7 9,339 35.7 Total 992 100.0 79,193 100.0
June 2003 Number of Enterprises Number of Persons Engaged Size of the Organisation by the Number of
Persons Employed Number % Number % 1 – 9 302 30.7 1,351 2.1
10 – 19 175 17.8 2,271 3.6 20 – 49 237 24.1 7,404 11.7 50 – 99 108 11.0 7,650 12.1
100 – 199 82 8.3 11,108 17.6 200 – 499 57 5.8 17,808 28.2 500 – 999 21 2.1 13,325 21.1
≥1000 2 0.2 2,257 3.6 Total 984 100.0 63,174 100.0

69
A5 Number of Construction Workers by Job Type (Unit: thousand persons)
Job Levels 1991 1995 1997 1999 2001 Technologist 8,957 12,834 13,279 13,779 15,169
Technician 16,534 19,094 19,727 20,848 32,072 Craftsman 31,457 28,371 43,425 Operative 11,859 13,460 9,665 48,965 61,043
General Worker 16,462 18,721 22,748 19,719 22,471 Total 85,269 92,480 108,844 103,111 130,755
Source: Manpower Survey Report on the Building and Civil Engineering Industry A6 Average Exchange Rate of Local Currency to US$: Historical Overview
Year HK$/US$ 1 1995 7.736 1996 7.734 1997 7.742 1998 7.746 1999 7.759 2000 7.792 2001 7.800 2002 7.799
2003 (January – September) 7.798
Source: The Hong Kong Monetary Authority (HKMA); http://www.info.gov.hk/hkma/eng/statistics/msb/index.htm A7 Organisation Structure of the Environment, Transport and Works Bureau Secretary Environment Transport and Works
Transport Works
Industry Review
Administrative
Programmes and Resources
Works Policy
Technical Services
Works Policy
Education and Training Safety
Professional Services Training
IT Promotion
Finance
Press
Policy & Development
Public Works Adm.
Infrastructure Coordination
Programme Management
Project Action
Resource management