Embed Size (px)
Citation preview

Send Orders of Reprints at [email protected]
Journal of Lightning Research, 2013, 5, 1-10 1
1652-8034/13 2013 Bentham Open
Open Access
An ANN-Based Approach for Lightning-Caused VFT Detection in GIS
Ebrahim A. Badran*,1
, Mohammad H. Abdelrahem2 and Mansour H. Abdel-Rahman
1
1Electrical Engineering Department, Mansoura University, Mansoura, Egypt
2Middle Delta Electricity Generation Company, Talkha, Egypt
Abstract: This paper introduces an artificial neural network (ANN) approach for the detection and identification of
lightning-caused very fast transient (VFT) in gas insulated substation (GIS). VFT in GIS can be due to faults, lightning
and switching operations. VFT in GIS has to be located and classified as soon as possible to start the processes of
reconfiguration and restoration of the normal power supply. A practical case study is investigated in Talkha 220-kV GIS
which represents a critical generation point in the Egyptian Electric Power Network. The layout of the Talkha 220-kV GIS
is discussed and modeled using ATP/EMTP. The ANN-based approach is built and trained. Finally, the proposed
approach is tested using bolt ground faults, high impedance faults, and lightning on the connected transmission lines. The
results ensure the success of the proposed approach to classify and discriminate the faults and the lightning-caused VFT.
Keywords: GIS, Lightning, VFT, Fault, ANN, ATP/EMTP.
1. INTRODUCTION
In power system substations, faults that produced load disconnections or emergency situations have to be located as soon as possible. Faults location is necessary to start the substation reconfiguration for restoring normal energy supply. Failures in GIS are known to have occurred both during early years of operation and during site testing or assembling. From the statistical point of view, problems have occurred at the highest voltage levels rather than the lower level [1]. However, the identification of the faulted points is not always an easy task, delaying the restoration procedures. This usually occurs when the protection system does not behave as expected. Substation in commissioning phase or even the ones already in operation, but with complex constructive and operational natures, can have high indices of protection system failure. In these substations, fault location can take a long time due to the great amount of information to be analyzed. The difficulty in identifying the fault points significantly increases in non-conventional substation, as gas-insulated ones [2].
In GIS a large number of restrikes occur across the switching contacts when disconnector, breaker operations, the closing of grounding switch, and by line-to-ground faults. Each strike leads to generation of VFT [2]. The generation and propagation of VFT from their original location throughout a GIS can produce internal and external overvoltages. In case of a line-to-ground fault, the voltage collapse at the fault location occurs in a similar way as in the disconnector gap during striking. Step-shaped traveling surges are generated and injected to GIS lines connected to the collapse location [3].
*Address correspondence to this author at the Electrical Engineering
Department, Mansoura University, Mansoura, Egypt;
Tel: +2-011-11109383; Fax: +2-057-2402865;
E-mail: [email protected].
VFT in GIS can be divided into internal and external. Internal transients can produce overvoltages between inner conductors and the encapsulation. External transients can cause stress on secondary and adjacent equipment. Breakdown phenomena across the contacts of a disconnector during a switch operation or line-to-ground faults generate very short rise time traveling waves which propagate in either direction from the breakdown or fault location. Surges traveling throughout GIS and to other connected equipment are reflected and refracted at every transition point. As a consequence of multiple reflections and refractions, traveling voltages can increase above the original values and very high frequency oscillations occur. An internally generated VFT propagates throughout the GIS and reaches the bushing where it causes a transient enclosure voltage and a traveling wave that propagates along the overhead transmission line [2].
In the areas of power systems, problems may have one or more of the following characteristics: dynamic, non-linear, large scale and random like. These factors make power system problems more difficult to solve. Therefore, computers are extensively applied to power system operation, planning, monitoring and control. Current approaches to power system computation are mainly based either on developing a mathematical model of a relevant part of the system or on expert systems. Artificial Neural Networks (ANNs) provide a promising and attractive alternative [4].
ANNs have the inherent capacity of modeling functional relationships between input and output data without the explicit knowledge of an analytical model. ANNs have a great pattern recognition capabilities and their ability to handle noisy data. There are widespread applications of ANNs in a number of different areas of power systems such as: load forecasting, security assessment, control, system identification, protection, fault location, adaptive auto reclosing, operational planning, etc. Matlab/Simulink has a
2 Journal of Lightning Research, 2013, Volume 5 Badran et al.
suite of programs designed to build ANNs (Neural Networks Toolbox) [5]. There are three steps to using ANNs; design, training, and testing [6, 7].
This paper concerns the lightning-caused VFT and the fault identification and detection in GIS. A practical case study is analyzed using Talkha 220-kV GIS. This GIS represents a critical generation point in the Egyptian Electric Power Network. The layout of the Talkha 220-kV GIS is discussed and modeled using ATP/EMTP. The ANN-based approach is built and trained. The proposed approach is tested using solidly ground faults, high impedance faults, and lightning on the connected transmission lines.
2. MODELING OF TALKHA 220-KV GIS
2.1. GIS Layout
Talkha 220 kV GIS is an important generation busbar in the north of Egypt. The fault in GIS at this point in the Egyptian power network may lead to severe stability events that may result in a complete or partial blackout. So, attention must be given to prevent or limit fault consequences. A typical 220 kV GIS installation of a one-
and-half circuit breaker arrangement is used in this paper as a case study. It consists of circuit breakers, disconnectors, busbars, surge arresters, transmission lines, transformers, generators, coupling feeders, earthing switches.
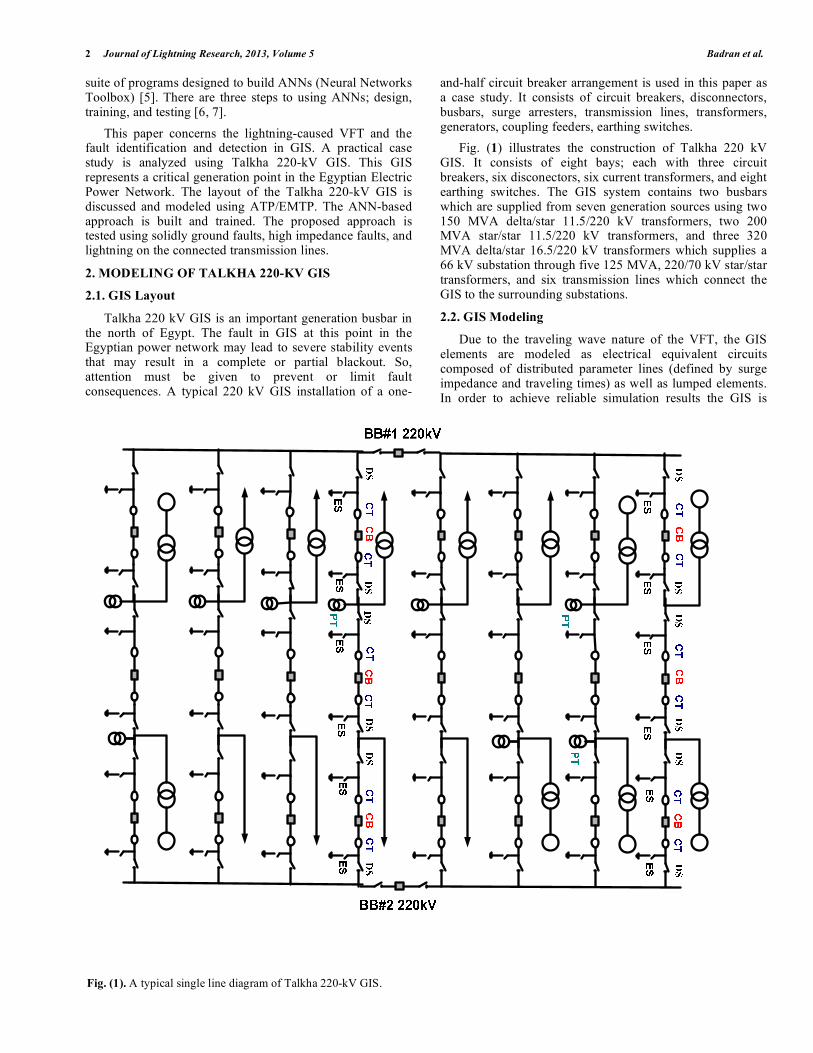
Fig. (1) illustrates the construction of Talkha 220 kV GIS. It consists of eight bays; each with three circuit breakers, six disconectors, six current transformers, and eight earthing switches. The GIS system contains two busbars which are supplied from seven generation sources using two 150 MVA delta/star 11.5/220 kV transformers, two 200 MVA star/star 11.5/220 kV transformers, and three 320 MVA delta/star 16.5/220 kV transformers which supplies a 66 kV substation through five 125 MVA, 220/70 kV star/star transformers, and six transmission lines which connect the GIS to the surrounding substations.
2.2. GIS Modeling
Due to the traveling wave nature of the VFT, the GIS elements are modeled as electrical equivalent circuits composed of distributed parameter lines (defined by surge impedance and traveling times) as well as lumped elements. In order to achieve reliable simulation results the GIS is
Fig. (1). A typical single line diagram of Talkha 220-kV GIS.

An ANN-Based Approach for Lightning-Caused VFT Detection in GIS Journal of Lightning Research, 2013, Volume 5 3
subdivided into several shorter sections. Table 1 gives the GIS components and how to be modeled [2, 8].
The GIS installation is regarded as series of distributed parameters transmission lines and lumped capacitor elements. The parameters of each GIS section are calculated from the standard formula of capacitance. The capacitance is calculated with the assumption that the conductors are cylindrical [9]. Capacitance is calculated by the following [3, 10];
C=2 o rl 2.3ln b a( ) (1)
where b is the outer cylinder radius, a is the inner cylinder radius, and l is the length of the section.
Spacers are used for supporting the inner conductor with reference to the outer enclosure. They are made with Alumina filled epoxy material whose relative permittivity, r, is 4. The thickness of the spacer is assumed to be the length of the capacitor which is taken as 15~1000 pF.
The busbar is represented by the surge impedance, the velocity of surge propagation, and the length. The surge impedance of the busbar is calculated from the relation [9];
Z=60 ln B A( ) (2)
where A is the diameter of the bus and B is the inner diameter of the enclosure. The surge impedance of the 220-kV busbar is taken as 90 and the surge velocity is assumed be the velocity of light.
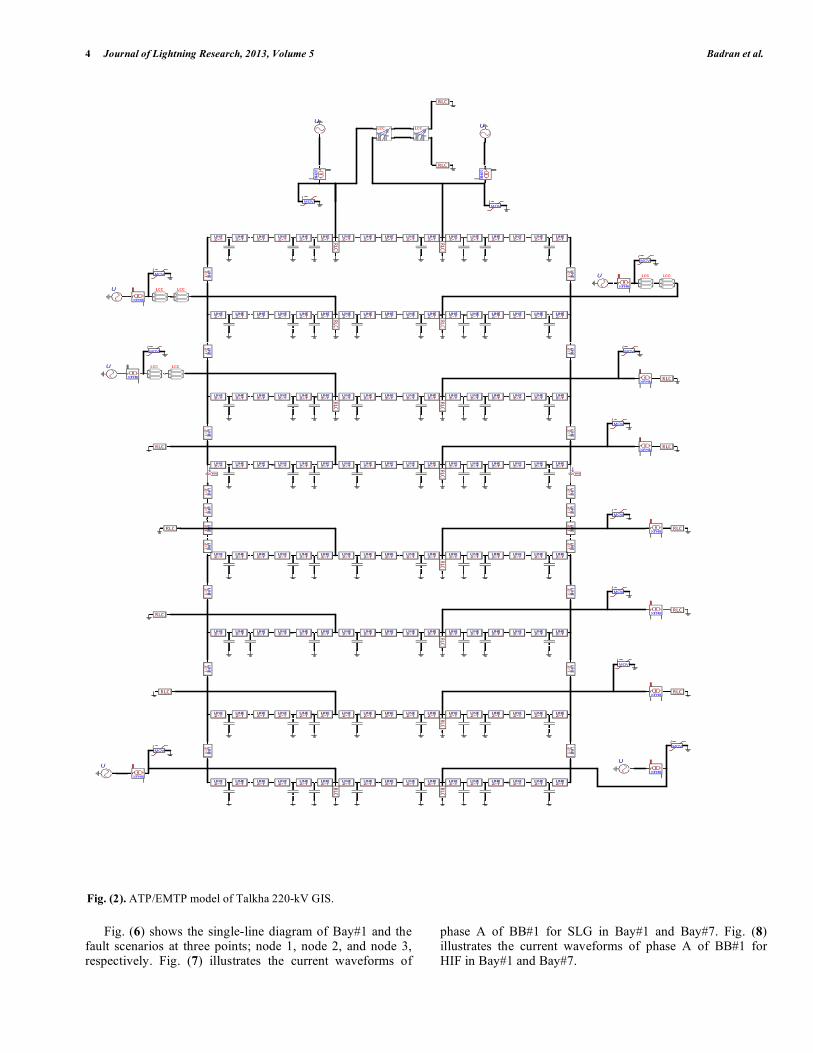
Fig. (2) illustrates the ATP/EMTP model of Talkha 220-kV GIS. In this model each Bay consists of three partitions and each partition has six sections. So the fault can be applied at eighteen points for each Bay in the GIS.
The surge arrester is modeled by the frequency dependent model introduced in [11-13] shown in Fig. (3). The inductances Lo and L1 characterize the frequency dependence of the surge arrester, with respect to the lightning current surges, which are determined by the following relations [11, 14]:
L0 = 0.01 * Vn & L1 = 0.03 * Vn
where Vn is the rated voltage of surge arrester. The input resistance R0 is implemented for numerical stability and its value is equal 1 M [12]. A0 and A1 are non-linear resistors that represent the non-linear V-I characteristic of the model [12]. Fig. (4) shows the V-I characteristic [15]. The non-linearities, A0 and A1, are modeled in ATP/EMTP using non-linear resistor (type-92) [12, 13, 16].
2.3. Simulation of Faults and Lightning
Faults in GIS are modeled using single-line-to-ground fault with two types; solidly to ground (SLG) and high impedance fault (HIF). The arc of the HIF is based on the energy balance of the arc and describes an arc in air by a differential equation of the arc conductance (g) [17]. Fig. (5) illustrates the main components of the HIF arc model using ATP/EMTP [18].
Table 1. Models of GIS Components
GIS Component Equivalent Circuit Data in Simulation
Open Distributed parameters transmission line in series with grading capacitor
20 pF20 pF
2800 pF
17 ohms
Z=90 ohms Z=90 ohms
Circuit Breaker
Close Distributed parameters transmission line
Z=110 ohms
L= 0.9 m & =300m/ s
Busbar Distributed parameters transmission line
Z=90 ohms
L= 0.9 m & =300m/ s
Earthing Switch Lumped capacitor to earth C= 20~45 pF
Open Distributed parameters transmission line in series with capacitor Z=90 ohms Z=90 ohms
C=20 pF
Disconnector
Close Distributed parameters transmission line
Z=0.8 ohms
L= 0.60 m & =300m/ s
4 Journal of Lightning Research, 2013, Volume 5 Badran et al.
Fig. (6) shows the single-line diagram of Bay#1 and the fault scenarios at three points; node 1, node 2, and node 3, respectively. Fig. (7) illustrates the current waveforms of
phase A of BB#1 for SLG in Bay#1 and Bay#7. Fig. (8) illustrates the current waveforms of phase A of BB#1 for HIF in Bay#1 and Bay#7.
Fig. (2). ATP/EMTP model of Talkha 220-kV GIS.
MOVI
U
U
U
U
MOVI
U
MOVI
MOVI
MOVI
U
MOVI
U
MOVI
MOVI
MOVI
MOVI
MOVI
MOVI

An ANN-Based Approach for Lightning-Caused VFT Detection in GIS Journal of Lightning Research, 2013, Volume 5 5
A1A0R0
L1L0
Fig. (3). Simplified IEEE model (Pinceti-Giannettoni Model).
Fig. (4). The current/voltage characteristics of the surge arrestor.
Fig. (5). ATP/EMTP HIF Arc Model.
The current is measured at the middle of BB#1 near the bus-tie. The most of generation units are located in the upper part of GIS; as shown in Fig. (2). It is noted that for the fault on Bay#7, all the generation units feed this fault, so the
monitored fault current at the measuring point at the middle of BB#1 for both HIF and SLG is greater than that measured for Bay#1.
Table 2 summarized the maximum monitored fault currents at different fault scenarios. It is clearly seen that the closer the fault points to the monitoring point, the higher the absolute peak of the monitoring fault currents.
Table 2. Absolute Peak of the Monitoring Fault Current for
Fault Scenarios
Absolute Peak of the Fault Current (A) Fault
SLG HIF
node1 4492 8
node2 4669 17
Ba
y#
1
node3 6416 92
node1 12648 29
node2 13049 35
Ba
y#
7
node3 15767 115
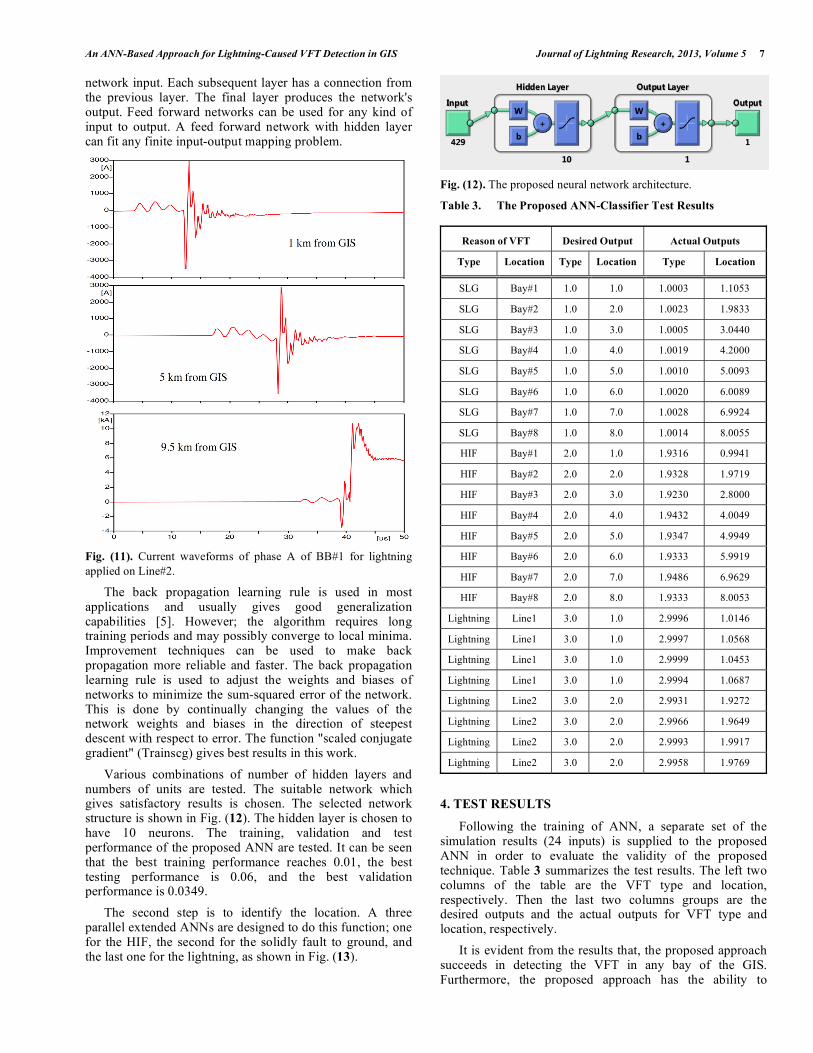
Lightning is simulated as an impulse current source of 51 kA in parallel with a resistance of 400 [19]. Fig. (9) shows a double circuit transmission lines which are connected to the GIS; Line#1 and Line#2. Each of them is 10 km length. The lightning is applied at different points along the two lines. Figs. (10, 11) illustrate the current waveforms of phase A of BB#1 for lightning applied on Line#1 and Line#2, respectively, at different points.
3. THE PROPOSED ANN-BASED CLASSIFIER
ANN have demonstrated the special capability of mapping the very complicated relationships between the inputs and the outputs and of revealing subtle differences in features between ill-defined patterns, particularly of the aforementioned types associated with wideband fault generated noise.
A large number of simulations are performed to generate a good representative data set for training and testing ANN. Once sets of training/testing patterns have been generated, the appropriate ANN architecture and associated parameters are chosen. The task of ANN is to learn to capture the VFT in GIS and detect the reason and its location.
Fig. (6). Fault scenarios at Bay#1.
0.1
230.0
367.5
505.0
642.5
780.0 U [kV]
7.6 15.0 22.5 30.0
I [kA]
BB#1

6 Journal of Lightning Research, 2013, Volume 5 Badran et al.
Fig. (7). Current waveforms of phase A of BB#1 at SLG fault.
Fig. (8). Current waveforms of phase A of BB#1 at HIF.
It is important to give meaningful training patterns, which will contain all the necessary information to generalize the problem. Special care must be taken to include boundary patterns. It is possible that a particular ANN structure with the given training data may not train properly, i.e., the training process takes too long. The structure and/or parameters must be changed and the network retrained. Also, a trained network might not perform satisfactory because of inadequate training data, or due to the structure of the network. In that case, the structure of the network should be re-designed and the process should be repeated.
After the data have been collected, there are two steps that need to be performed before the data are used to train
the network: the data need to be preprocessed, and they need to be divided into subsets. It is a standard practice to normalize the inputs before applying them to the network. Generally, the normalization step is applied to both the input vectors and the target vectors in the data set. In this way, the network output always falls into a normalized range [20].
Fig. (9). ATP/EMTP Simulation of lightning in double circuit
transmission lines connected to the GIS.
Fig. (10). Current waveforms of phase A of BB#1 for lightning
applied on Line#1.
Multilayer feed forward network is the most widely used [21, 22]. The back propagation algorithm is the most commonly used procedure yielding usually good generalizat-ion capabilities. Multilayer Feed forward networks consist of a series of layers. The first layer has a connection from the
0 0.1 0.2 0.3 0.4 0.5 0.6 0.7 0.8 0.9 1
x 10-5
-8000
-6000
-4000
-2000
0
2000
4000
6000
time(sec)
curren
t (A
)
solidbay1node1
solidbay1node2
solidbay1node3
0 0.1 0.2 0.3 0.4 0.5 0.6 0.7 0.8 0.9 1
x 10-5
0
2000
4000
6000
8000
10000
12000
14000
16000
time(sec)
curren
t(A)
solidbay7node1
solidbay7node2solidbay7node3
Bay#1
Bay#7
0 0.1 0.2 0.3 0.4 0.5 0.6 0.7 0.8 0.9 1
x 10-5
-10
-5
0
5
10
15
20
time(sec)
curren
t(A
)
HIFbay1node1
HIFbay1node2
0 0.1 0.2 0.3 0.4 0.5 0.6 0.7 0.8 0.9 1
x 10-5
-5
0
5
10
15
20
25
30
time(sec)
curren
t(A
)
HIFbay7node1
HIFbay7node2
Bay#1
Bay#7
An ANN-Based Approach for Lightning-Caused VFT Detection in GIS Journal of Lightning Research, 2013, Volume 5 7
network input. Each subsequent layer has a connection from the previous layer. The final layer produces the network's output. Feed forward networks can be used for any kind of input to output. A feed forward network with hidden layer can fit any finite input-output mapping problem.
Fig. (11). Current waveforms of phase A of BB#1 for lightning
applied on Line#2.
The back propagation learning rule is used in most applications and usually gives good generalization capabilities [5]. However; the algorithm requires long training periods and may possibly converge to local minima. Improvement techniques can be used to make back propagation more reliable and faster. The back propagation learning rule is used to adjust the weights and biases of networks to minimize the sum-squared error of the network. This is done by continually changing the values of the network weights and biases in the direction of steepest descent with respect to error. The function "scaled conjugate gradient" (Trainscg) gives best results in this work.
Various combinations of number of hidden layers and numbers of units are tested. The suitable network which gives satisfactory results is chosen. The selected network structure is shown in Fig. (12). The hidden layer is chosen to have 10 neurons. The training, validation and test performance of the proposed ANN are tested. It can be seen that the best training performance reaches 0.01, the best testing performance is 0.06, and the best validation performance is 0.0349.
The second step is to identify the location. A three parallel extended ANNs are designed to do this function; one for the HIF, the second for the solidly fault to ground, and the last one for the lightning, as shown in Fig. (13).
Fig. (12). The proposed neural network architecture.
Table 3. The Proposed ANN-Classifier Test Results
Reason of VFT Desired Output Actual Outputs
Type Location Type Location Type Location
SLG Bay#1 1.0 1.0 1.0003 1.1053
SLG Bay#2 1.0 2.0 1.0023 1.9833
SLG Bay#3 1.0 3.0 1.0005 3.0440
SLG Bay#4 1.0 4.0 1.0019 4.2000
SLG Bay#5 1.0 5.0 1.0010 5.0093
SLG Bay#6 1.0 6.0 1.0020 6.0089
SLG Bay#7 1.0 7.0 1.0028 6.9924
SLG Bay#8 1.0 8.0 1.0014 8.0055
HIF Bay#1 2.0 1.0 1.9316 0.9941
HIF Bay#2 2.0 2.0 1.9328 1.9719
HIF Bay#3 2.0 3.0 1.9230 2.8000
HIF Bay#4 2.0 4.0 1.9432 4.0049
HIF Bay#5 2.0 5.0 1.9347 4.9949
HIF Bay#6 2.0 6.0 1.9333 5.9919
HIF Bay#7 2.0 7.0 1.9486 6.9629
HIF Bay#8 2.0 8.0 1.9333 8.0053
Lightning Line1 3.0 1.0 2.9996 1.0146
Lightning Line1 3.0 1.0 2.9997 1.0568
Lightning Line1 3.0 1.0 2.9999 1.0453
Lightning Line1 3.0 1.0 2.9994 1.0687
Lightning Line2 3.0 2.0 2.9931 1.9272
Lightning Line2 3.0 2.0 2.9966 1.9649
Lightning Line2 3.0 2.0 2.9993 1.9917
Lightning Line2 3.0 2.0 2.9958 1.9769
4. TEST RESULTS
Following the training of ANN, a separate set of the simulation results (24 inputs) is supplied to the proposed ANN in order to evaluate the validity of the proposed technique. Table 3 summarizes the test results. The left two columns of the table are the VFT type and location, respectively. Then the last two columns groups are the desired outputs and the actual outputs for VFT type and location, respectively.
It is evident from the results that, the proposed approach succeeds in detecting the VFT in any bay of the GIS. Furthermore, the proposed approach has the ability to

8 Journal of Lightning Research, 2013, Volume 5 Badran et al.
classify the lightning-caused VFT. The proposed approach depends on the measurement of only the current at one point in the GIS. The measurement point is selected in this study at the middle of BB#1; between Bay#4 and Bay#5.
5. CONCLUSIONS
In this paper, an ANN-based approach is proposed and designed to detect and classify VFT in Talkha 220-kV GIS. The presented approach has the ability to detect, classify, and identify the lightning-caused VFT. The layout of the Talkha GIS is modeled using ATP/EMTP. A multi-stages ANN of multilayer feed-forward network is designed, trained, and
tested. The proposed approach accurately discriminates between the bolt ground faults and the high impedance faults, and the lightning. Also, it has the ability to identify the location.
The proposed approach has distinct advantages; first of all, the high speed detection of the VFT in GIS, also, the accurate identification of the fault point or the lightning-struck line. The high speed of this approach is very important in GIS which is considered critical in the electric power network and the accurate VFT type classification leads to take the right protective actions.
Fig. (13). Structure of the proposed multi-stage feed-forward ANN.
Input layer
SLG Fault
Inputs
Current waveforms of phase A of BB#1
Input layer
Hidden layer
Output layer
Inputs
Current waveforms of phase A of BB#1
Output
InputsCurrent waveforms of phase A of BB#1
Inplaye
Hidden layer10 neuron
Output layer(One neuron )
HIF Lig
Outpu
ut er
Hidden layer
Output layer
Output
( Type of fault )
1: SLG Fault2: HIF3: lightning
ghtning
ut
InputsCurrent waveforms of phase A of BB#1
Input layer
Hiddlay
Output
den yer
Output layer

An ANN-Based Approach for Lightning-Caused VFT Detection in GIS Journal of Lightning Research, 2013, Volume 5 9
CONFLICT OF INTEREST
The authors confirm that this article content has no conflicts of interest.
ACKNOWLEDGEMENTS
Declared none.
REFERENCES
[1] Alves da silva AP, Insfran AHF, da silverira PM, Lambert-Torres
G. Neural networks for fault location in substations. IEEE TransPower Deliv 1996; 11(1): 234-8.
[2] Martinez JA, Chowdhuri P, Iravani R, Keri A, Povh D. Modelingguidelines for very fast transients in gas insulated substations.
IEEE Trans Power Deliv 1996; 11(4): 2028-8. [3] Stosur M, Szewczyk M, Piasecki W, Florkowski M, Fulczyk M.
GIS disconnector switching operation - VFTO Study. MEPS -Wroclaw, Poland: ABB Corporate Research Center 2010.
[4] Warwick K, Ekwue A, Aggarwal R. Artificial IntelligenceTechniques in Power Systems. UK: IET 1997; pp. 302-6.
[5] Math Works ANN Toolbox for MATLAB. USA: Math Works, 2007.
[6] Aggarwal R, Song Y. Artificial neural networks in power Systems: i. General introduction to neural computing. Power Eng J 1997;
11(3): 129-6.
[7] Aggarwal R, Song Y. Artificial neural networks in power Systems: iii. Examples of applications in power systems. Power Eng J 1997;
12(6): 279-9. [8] Kondalu M, Reddy GS, Subramanyam PS. Estimation of transient
over voltages in gas insulated bus duct from 220 kv gas Insulated substation. Int J Comp Appl 2011; 20(8): 975-13.
[9] Kho DTA, Smith KS. Analysis of very fast transient Overvoltages in a proposed 275 kv gas insulated substation. IPST2011; 2011
June 14-17; Delft, Netherlands, 2011. [10] Rama Rao JVG, Amarnath J, Kamakshaiah S. Simulation and
Measurement of very fast transient over voltages in a 245 kv Gis and research on suppressing method using ferrite rings. ARPN J
Eng Appl Sci 2010; 5(5): 88-8. [11] Kessel J, Atlason V, Bak CL, Lund J. Lightning simulation of a
combined overhead line/cable connected gis. ICLP; 23rd
to 26th
June; Uppsala, Sweden, 2008.
[12] Pinceti P, Giannetteni M. A simplified model for ZnO surgearresters. IEEE Trans Power Deliv 1999; 14(2): 393-6.
[13] Peppas GD, Naxakis IA, Vitsas CT, Pyrioti EC. Surge arrestermodels for fast transients. ICLP; 2008 Sep 2-7; Vienna, Austria,
2008. [14] Magro MC, Giannettoni M, Pinceti P. Validation of ZnO surge
arresters model for overvoltage studies. IEEE Trans Power Deliv2004; 19(4): 1692-4.
[15] Badran EA, Rizk ME, Abdel-Rahman MH. Analysis andSuppression of back-flow lightning surges in onshore wind farms.
J Lightning Res 2011; 3: 1-11.
ABOUT THE AUTHORS
Ebrahim A. Badran was born in Egypt in 1969. He received his B.Sc., M.Sc. and Ph.D. in Electrical Engineering from Mansoura University, Egypt, in 1991, 1995 and 2004, respectively. From 1993 to 1999 he was an operation engineer with the Egyptian Electricity Authority. In 1999 he joined the Academy of Special Studies, Egypt, where he was the Head of Technology Department from 2004 to 2008.
In 2008, he joined the Electrical Engineering department, Mansoura University, where he is currently assistant professor. The research interests of Dr. Badran include Transients in Power System, Modeling of Power System, Protection, Power Quality, FACTS, and Wind Power.
Mohamed H. Abdelrahem was born 1985.in Mansoura, Egypt. He received his B.Sc. in Electrical Engineering from Mansoura University, Egypt, in 2007. Recently; he is an operation engineer in Talkha Generation Power Plant, Middle Delta Electricity Generation Company, Egypt. Currently, he is pursuing his M.Sc. degree at Mansoura University. His research interest includes investigation of the electromagnetic Transients in Power system and Very Fast Transient in GIS.
Mansour Hassan Abdel-Rahman was born in Egypt in 1947. He received the B.Sc. and M.Sc. degrees in electrical engineering from Cairo University in 1970 and 1975, respectively, and the Ph.D. degree in electrical engineering from the University of Manchester Institute of Science and Technology (UMIST), U.K., in 1979. He has been a Full Professor at the University of El-Mansoura, Egypt, since 1987.
He spent visiting assignments, teaching and researching, at the University of Toronto, and, University of Windsor, Canada, the University of Cambridge, U.K., where he was a Fellow of Churchill College, University of Western Australia, Australia, University of Canterbury, New Zealand, Doshisha University, Japan, University of Iceland, Iceland, The School of Renewable Energy Science (RES), Iceland, Helsinki University of Technology, Finland, University of Aalborg, Denmark, Shandong University, China, Jordan University, Jordan, and Kuwait University, Kuwait.
Dr. Abdel-Rahman received the John Madsen Medal for the best paper submitted to the Institute of Engineers, Australia, in 1989, and three awards from the IEEE for the best paper in 1987 and 1988, respectively.

10 Journal of Lightning Research, 2013, Volume 5 Badran et al.
[16] Kizilcay M. Capabilities of the transient program ATP-EMTP.
EMTP Applications Laboratory 2011. [17] Misak S. Mathematical model of electric arc respecting Mayr
theory in EMTP-ATP. Acta Electrotechnica Inform 2008; 8(3): 66-4.
[18] Shebl KM, Badran EA, Abdalla E. A combined MODELS-TACSATPdraw general model of the high impedance faults in
distribution networks. MEPCON’10; 2010, 19-21 Dec; Cairo, Egypt 2010.
[19] Schmitt H, Winter W. Simulation of lightning overvoltages inelectrical power systems. IPST '01 - Rio de Janeiro, 2001 June 24-
28, Brazil 2001.
[20] Mazon AJ, Zamora I, Minambres JF, Zorrozua MA, Barandiaran
JJ, Sagastabeitia K. A new approach to fault location in two-Terminal transmission lines using artificial neural networks.
Electic Power Syst Res 2000; 56(3): 261-6. [21] Aggarwal R, Song Y. Artificial neural networks in power Systems,
ii. Types of artificial neural networks. Power Eng J 1998; 12(1): 41-7.
[22] Ukil A. Intelligent systems and signal processing in powerEngineering. USA: Springer 2007.
Received: September 17, 2012 Revised: December 21, 2012 Accepted: December 23, 2012
© Badran et al.; Licensee Bentham Open.
This is an open access article licensed under the terms of the Creative Commons Attribution Non-Commercial License (http://creativecommons.org/licenses/by-nc/3.0/)
which permits unrestricted, non-commercial use, distribution and reproduction in any medium, provided the work is properly cited.


![Correlated magnetic noise across Virgo and spatially ... · global resonance may occur [14]. Natural Schumann resonance excitation is mostly caused by lightning discharges. Lightning](https://img.pdfslide.us/doc/110x75/5f0b7b177e708231d430baad/correlated-magnetic-noise-across-virgo-and-spatially-global-resonance-may-occur.jpg)


![Vibration Fundamentals Training [VFT]](https://img.pdfslide.us/doc/110x75/587c41771a28ab5a1d8b67e5/vibration-fundamentals-training-vft.jpg)