Embed Size (px)
Citation preview

AN ANALYTICAL STUDY OF QUESTIONING LEADING TO CRITICAL THINKING IN
CLASSROOMS
WILAYAT BIBI
Ph.D. Scholar
INSTITUTE OF EDUCATION AND RESEARCH,
UNIVERSITY OF PESHAWAR 2014

AN ANALYTICAL STUDY OF QUESTIONING LEADING TO CRITICAL THINKING IN
CLASSROOMS
A thesis submitted to the institute of Education & Research, University of Peshawar in partial fulfillment of the requirement for the award of the degree
of
DOCTOR OF PHILOSOPHY IN EDUCATION
SESSION 2014

APPROVAL SHEET
Title of thesis: An Analytical Study of Questioning Leading to Critical
Thinking in Classrooms
Name of Student: Wilayat Bibi
Accepted by the Institute of Education and Research, University of Peshawar, in
partial fulfillment of the requirements for the degree of Doctor of Philosophy in
Education, with Specialization in Educational Administration
VIVA VOCE COMMITTEE
Dean, Faculty of Social Sciences، University of Peshawar Director، Institute of Education and Research, University of Peshawar External Examiner Supervisor
Member

FORWARDING SHEET
The thesis in title ‘An Analytical Study of Questioning Leading to Critical
Thinking in Classrooms’ submitted by Ms. Wilayat Bibi, in partial fulfillment of
the requirements for the degree of Doctor of Philosophy in Education has been
completed under my guidance and supervision. I am satisfied with the quality of
this research work.
Dated:
(Dr. Hafiz Muhammad Inamullah) (Supervisor)

DECLARATION
I, Ms. Wilayat Bibi, Roll No. 09, a student of Ph.D. at the Institute of Education
and Research, University of Peshawar, do hereby solemnly declare that the thesis
titled ‘An Analytical Study of Questioning Leading to Critical Thinking in
Classrooms’ submitted by me in partial fulfillment of the requirements for the
degree of Doctor of Philosophy in Education, is my original work, except where
otherwise acknowledged in the text and has not been submitted or published
earlier and shall not in future, be submitted by me for obtaining any degree from
this or any other university of institution.
Dated:
Wilayat Bibi

In the Name of
Allah
The Most Merciful, and the Most
Compasionate

DEDICATION
To my Father& Mother
For their love, continuous support and 100% encouragement;
To my Siblings
For their love, unfailing ‘push’ and support in their own individual way;
To my beloved Friend
For her undying love, endless understanding and lasting support;
All of you mean so much to me and you are all truly and absolutely beautiful in my eyes and in my heart.
Nothing is wasted,
Nothing is forgotten...

i
ACKNOWLEDGEMENTS
In the name of Allah the most Gracious and Merciful who has given the researcher
the will and strength to surmount all the difficulties in conducting this thesis.
In 2009, the researcher got admission in M.Phil. leading to Ph.D. degree at the
Institute of Education and Research, Peshawar University. Life at IER, University
of Peshawar widened the vision of the researcher. There, the researcher
experienced many new and distinctive aspects of life, especially the knowledge in
the field of teaching, education and the experience of having an independent life.
It took five years to complete the study. However, this work would not have been
successful without the help, advice, encouragement, and support of a number of
people. The researcher would like to express sincere gratitude and appreciation to
all the people who played their sincere role in accomplishing this doctoral study.
Endless gratitude and admiration goes to the researcher’s supervisor, Dr. Hafiz
Muhammad Inamullah, Associate Professor, for his untiring guidance and
supervision that the researcher would not been able to accomplish this task. His
incredible patience and friendly attitude in pushing the researcher will not go
unnoticed and certainly exemplary to many when a dedicated or devoted
supervisor is needed to be taken as an example. The researcher is extremely
grateful to him for his scholarly advice and supportive attitude in completion of
the task.
The researcher wants to express deepest gratitude to Prof. Dr. Muhammad Neman,
Director, Institute of Education and Research, University of Peshawar. His kind
and sympathetic attitude encouraged the researcher to accomplish the task.
Very special thanks for the members of Graduate Studies Committee Prof. Dr.
Hafiz Muhammad Inamullah, Dr. Shafqat Perveen, Dr. Asha Shafiq, and Dr. Israr
Khattak for giving approval to the synopsis after which the researcher carried out
the task to completion. It will not be fair if I do not mention Prof. Dr Muhammad
Iqbal, of Statistics Department, Peshawar University, for his sincere help in the

ii
analysis of data for the study. He rendered his precious time whenever the
researcher needed his guidance. The researcher pays deepest gratitude to Dr.
Rahim, Manager Educational Services, AFAQ, Peshawar, for his encouraging,
supportive, and inspiring attitude helped in accomplishing the task whenever the
researcher lost the courage.
The researcher’s deepest appreciations are for all those teachers who volunteered
to be the subjects for this study and also to those teachers who were asked to be
the participants of the study and they cooperated with an open heart.
The support provided by the Librarians of Institute of Education and Research &
Central Library, University of Peshawar are duly acknowledged. Words of thanks
are for all my colleagues, friends, and my students for their moral support and
prayers.
Last but not the least, the researcher’s undying love and thanks to her parents for
being an inspiration in carrying out this study. Deepest appreciation goes also to
the researcher’s beloved siblings for being there for support and encouragement.
Special thanks are for researcher’s younger sister Dr. Hashmat Begum, for
providing generous help and encouragement in the completion of this task. Very
special words of thanks are for the researcher’s brother Mr. Amriz Khan for his
supportive attitude and encouragement in carrying out the study. Special utmost
heartfelt thanks to researcher’s friend, Najma Khan, for her constant love and
support, emotionally, spiritually and physically.
Thank You All!
Ms. Wilayat Bibi

iv
TABLE OF CONTENTS
Acknowledgements.......................................................................................... i
Table of contents ........................................................................................... iv
List of tables ................................................................................................. vii
List Of Figures............................................................................................. viii
Abstract ......................................................................................................... xi
Chapter-One ................................................................................................. 1
Introduction .................................................................................................. 1
1.1 Background of the Study ..................................................................... 1
1.2 Nature of Questions............................................................................. 2
1.3 Blooms’ Levels of Questions............................................................... 3
1.4 Convergent and Divergent Questions .................................................. 5
1.5 Wait Time ........................................................................................... 6
1.6 Significance ........................................................................................ 7
1.7 Statement of the problem..................................................................... 8
1.8 Objectives of the study ........................................................................ 8
1.9 Research Hypotheses........................................................................... 8
1.10 Limitations of the Study ...................................................................... 9
1.11 Delimitations of the Study................................................................... 9
1.12 Definition of the Terms ....................................................................... 9
Chapter-Two............................................................................................... 11
Literature Review ....................................................................................... 11
2.1 Questioning Skills ............................................................................. 11
2.2 What is question? .............................................................................. 11
2.3 Classification of Questions according to Bloom’s Taxonomy............ 13
2.3.1 Knowledge Level Questions ..................................................... 14
2.3.2 Comprehension Level Questions............................................... 15
2.3.3 Application Level Questions..................................................... 16
2.3.4 Analysis Level Questions ......................................................... 17
2.3.5 Synthesis Level Questions ........................................................ 17
2.3.6 Evaluation Level Questions ...................................................... 18
2.4 Convergent and Divergent Questions ................................................ 19
2.5 Wait time .......................................................................................... 21
2.6 Effective Questioning Skills .............................................................. 22
2.7 Common Problems in Using Questions ............................................. 23
2.7.1 Use of Complex, Ambiguous or “Double” questions................. 23
2.7.2 We accept only the Answers we expect..................................... 24
2.7.3 Why to ask this Question? ........................................................ 24

v
2.7.4 Answering own question........................................................... 24
2.7.5 Using Questions as Punishment ................................................ 24
2.8 Research Already Conducted............................................................. 24
Chapter-Three ............................................................................................ 28
Research Methodology ............................................................................... 28
3.1 Introduction....................................................................................... 28
3.2 Population......................................................................................... 28
3.2.1 Categorization of the population ............................................... 28
3.2.2 Sampling .................................................................................. 28
3.3 Research Instrument .......................................................................... 29
3.4 Procedure .......................................................................................... 29
3.5 Pilot Testing...................................................................................... 30
3.6 Data Collection ................................................................................. 30
3.7 Ethical Consideration ........................................................................ 31
3.8 Budget............................................................................................... 31
3.9 Time Schedule .................................................................................. 31
Chapter-Four .............................................................................................. 33
Data And Data Analysis.............................................................................. 33
4.1 Organization of the Data ................................................................... 33
4.2 Data Tabulation and Analysis............................................................ 33
4.3 Secondary Level Data of individual tables......................................... 36
4.4 Tertiary Level Data individual tables................................................. 97
4.5 Comprehensive Tables of Secondary Level Data ............................. 106
4.6 Comprehensive Tables of Tertiary Level Data................................. 113
4.7 Comparison of the type of Questions at Secondary and Tertiary Level118
Chapter-Five ............................................................................................. 119
Findings, Conclusion, Discussion And Recommendations...................... 119
5.1 Findings .......................................................................................... 119
5.3 Discussion....................................................................................... 122
5.3 Conclusion ...................................................................................... 128
5.4 Recommendations ........................................................................... 129
Literature Cited ........................................................................................ 132
Appendices ................................................................................................ 140
Appendix-1: Letter to the Director .............................................................. 140
Appendix–2: Detail description of the Instrument ....................................... 141
Appendix–3: List of Universities and Schools............................................. 143

vii
LIST OF TABLES
Table-1~176: Category of questions observed in 176 total sessions at Secondary
Level .......................................................................................... 37
Table-177~200: Categories of questions observed in 24 total sessions at tertiary
level............................................................................................ 97
Table-201: Percentage of total questions asked in each category................. 106
Table-202: Time versus type of questions (Secondary level Data)............... 111
Table-203: Time versus type of questions (Secondary level Data)............... 111
Table-204: Time versus knowledge, comprehension and application as (lower
order questions) for Secondary Data ......................................... 112
Table-205: Time versus analysis, synthesis and evaluation as (higher order
questions) for Secondary Data .................................................. 112
Table-206: Shows percentage of total questions asked in each category...... 113
Table-207: Time versus type of questions (Tertiary level Data) .................. 115
Table-208: Time versus type of questions (Tertiary level Data) .................. 116
Table-209: Time versus knowledge, comprehension and application as (lower
order questions) for Tertiary Data ............................................. 116
Table-210: Time versus analysis, synthesis and evaluation as (higher order
questions) for Tertiary Data ...................................................... 117
Table-211: Comparison of the type of Questions at Secondary and Tertiary
Level ........................................................................................ 118

viii
LIST OF FIGURES
Figure 3.1: Map showing districts of Khyber Pakhtunkhwa .....................32
Figure-4.1: Graphic representation of secondary level data ....................110
Figure-4.2: Graphic representation of tertiary level data.........................115

xi
ABSTRACT
Questioning is one of the most commonly used techniques at the disposal of
teachers during teaching to check students’ level of understanding about the
concepts. Questioning technique assists teachers to communicate them about the
level of understanding of their students. Questions are promoting students’
creativity in classroom interaction. Without higher order, thought provoking
questions, learning become little more than memorization. Questions, if asked
intelligently not only elicit information and develop cognitive thinking processes
but also develop analytical and critical thinking. Perhaps a few studies have been
carried out on this vital issue in the Pakistani classroom situation.
The overall purpose of the proposed study was to investigate questioning leading
to critical thinking in the classrooms setting. It was focused to determine the levels
of questions keeping in view the Bloom’s Taxonomy. The study was also focused
to analyze lower and higher order questions and to explore convergent and
divergent questions at secondary and tertiary levels. The study was an
observational type of the descriptive method. The target population composed of
21965 teachers at Secondary Level and 3000 teachers at Tertiary Level in Khyber
Pakhtunkhwa. Using proportional allocation of population (Walpole, 1968), 176
Secondary School teachers and 24 Tertiary level teachers were observed in their
classrooms during their teaching. Using simple random sample technique, the
study was conducted in districts Peshawar, Kohat, D.I.Khan, Mansehra, Mardan,
Malakand, and Swat. To achieve the objectives of the study, the instrument
“observation guide using Bloom’s Taxonomy” was used. A total of two hundred
observations were made at both the levels. During the observation the researcher

xii
noted down the questions asked by the teacher and was also audio recorded. The
questions were then categorized on the observation sheet as knowledge,
comprehension, application, analysis, synthesis and evaluation.
The study results revealed that teachers practice of asking questions was very
weak, majority of the teachers asked dominantly lower order and convergent
questions at secondary level which could not help to develop the habit of critical
thinking among students at secondary level. There were variations in terms of
classroom time duration and number of asked questions by teachers. The results of
the study showed that no question was asked by teachers in some of the classes at
secondary level. The asked questions were predominantly lower order and
convergent questions with a very low asking ratio and, not encouraging critical
thinking at tertiary level among students. The teachers both at secondary and
tertiary level provided very short wait time to students to respond. There found no
awareness of teachers regarding the positive impact of increasing wait time and
getting divergent answers. The results also concluded that there is no significance
difference between type of teachers’ questions at secondary and tertiary level. The
observations in the study revealed that teachers at secondary and tertiary level
employed almost similar type of questioning technique while teaching in order to
check student’s level of understanding. Of all the questions asked in the study,
lower order and convergent questions elicited the greatest number of responses
from the students. Teachers rarely posed questions at the application, synthesis
and evaluation levels.
Teachers generally preferred to pose simple questions that would accelerate the
teaching learning process and would need little efforts on the part of students to
answer the questions.

xiii
It was recommended that the use of multiple types of questions in the classroom is
crucial for promoting students’ critical thinking. In teaching, it is necessary for the
teachers to plan questions for students learning, as well as for promoting students’
higher level of thinking process.

1
CHAPTER-ONE
INTRODUCTION
1.1 Background of the Study
The researcher has almost ten years school and college teaching
experience. Once at school the researcher was making classroom observations
with the school principal. It was observed that questioning techniques were
heavily used teaching strategy employed by almost all teachers who were
observed. Half of their instructional time was spent in asking questions for the
active participation of the students in the lesson, to arouse their interest and to
develop their critical thinking. The researcher interest in the area developed as
being teacher, has experienced great satisfaction when asked questions from
students and got correct responses. It was thought that whether the practice of
asking questions was appropriate and teachers were asking the right type of
questions or not? Were these questions effective to improve students’ achievement
and develop their critical thinking?
The researcher and advisor conducted a small scale study earlier that was a
case study of one school. In order to expand this study to see if the findings were
generalizable, this Ph.D. level study was a large scale study and was further
expanded to offer a comparison of one level with another (secondary and tertiary).
Basically asking questions is a compulsory part of instruction in classroom. This
activity begins in the early grades and it is expected that in higher grades the
teachers would ask good quality, thought-provoking questions. This is why a

2
comparison of the two levels was made in order to see if questioning increased in
higher levels of schooling.
1.2 Nature of Questions
One of the aims of teaching is to equip the students with necessary skills to
make appropriate decisions in life. For this purpose students must be taught in
such a way as to enable them to solve the problems actively, to critically think,
and to feel relax about them. They get these skills of thinking by learning to
response to critical questions. Asking appropriate question which lead to critical
thinking is a complicated process and unfortunately most of the teachers are
untrained to ask high-quality questions (Cecil, 1995).
The questioning process is a central feature of most classrooms. Teachers
ask questions not only to monitor students understanding, but also to stimulate
students to engage with the content, relate it to the prior knowledge, and to think
about its applications. Researches show that teachers are supposed to ask as many
questions which require students to process and analyze information while many
of their questions are factual which encourage only rote memorization. Teachers
also tend to rush students responses not giving them adequate time to provide
varied and thoughtful answers (Ryan & Cooper, 2010).
Teachers play a critical role in asking questions. It is much important for
the teachers to plan questions carefully so that knowledge and comprehension of
students may enhanced. High quality of teacher’s questioning can help students
think critically and independently. All questions involve content. Mastery of
teachers in content can help teachers ask questions which involve students in
deeper meaning and critical thinking (Pagliaro, 2011).

3
Questions are tool for checking the understanding level of students.
Questions are not only asked to make the students learn factual knowledge or
recall information but the important thing is to ensure that the questions engage
students in deeper and creative thinking. One way to make sure that the questions
involve students in creative and analytical thinking is to plan in advance using an
organizational structure such as Bloom’s Taxonomy (Fisher & Frey, 2007)
1.3 Blooms’ Levels of Questions
When one considers the development of thinking skills, turns for guidance
to Bloom’s Taxonomy. Education professor Benjamin Bloom and a group of
colleagues worked to develop a system to identify and organize the process of
thinking and learning. In 1956 Bloom’s group published the Taxonomy of
Educational Objectives: Handbook 1, which is now commonly known as Bloom’s
Taxonomy (McDonald & Hershman, 2010). From 1995 through 2000, a group of
educators worked to revise the original taxonomy based on more recent
understanding about learning. The group published the result of their work in
2001(Sousa, 2009). To summarize this taxonomy advocate that giving judgment
for something is not possible without knowing the facts, understanding of the
facts, application of the facts, taking the facts apart, and putting the facts
organized in such a way that new perspectives are disclosed (Morgan & Saxton,
2006).
Bloom’s six types of questions can further be divided into three detailed
groups. Level one question consists of “knowledge” and “comprehension”. These
are categorized as lower level questions, which require students to recall and
collect data, but these encourage students for little deep thinking. Level two

4
questions consist of “application” and “analysis”. Such types of questions require
the students to begin to process data and to assimilate new content with their own
observations. The third level of questions is “synthesis” and “evaluation”. These
questions provoke higher level deep thinking because these involve a high level
of mental activity (Cecil, 1995). These different questioning techniques of
Bloom’s Taxonomy are recommended to promote critical and analytical thinking
in students. Teachers can inculcate these questions in such a manner that students
actively participate in many activities of deep level thinking and behind these
techniques the teachers have many objectives and conclusions. These objectives
can be achieved effectively by creating an encouraging classroom environment
boost up active involvement of students with new experiences and inquisitive
attitude which help them in achieving their goals (Shaunessy, 2005).
The concept of learning is that it occurs when the students are able to
answer the questions asked by the teacher, the reality is that learning does not
occur until learner need to know and can formulate the questions for themselves.
Classroom activities involve the students into the process of inquiry-
thinking, feeling, discussing, arguing, philosophizing and more- and it is the
teacher who is mostly the initiator of these actions (Morgan & Saxton, 2006).
Gall (1984) indicated that teachers seldom ask questions that require
higher levels of thinking (application, analysis, synthesis or evaluation). Teachers
ask questions requiring students to recall facts. This is unfortunate because higher
order questions stimulate critical thinking. However, achievement is not
accomplished if teachers only ask higher order questions. The best strategy is to

5
use the combination of questions that can move students from lower levels to
higher levels of learning.
One of the problems is that without higher order, thought-provoking
questions learning becomes little more than memorization (Cooper, 2013).
Different types of questions serve different types of learning and teaching
purposes. It is not the case that certain types of questions should be preferred over
others such as low cognitive over high cognitive or vice versa. Teachers should
select questions keeping in view the objectives of the lesson. If the objective is to
give some basic information of the concepts, low cognitive questions should be
asked. If the purpose is to make the students analyze, evaluate or create new
information, high cognitive questions should be used (Hunt, Wiseman & Touzel,
2009).
1.4 Convergent and Divergent Questions
Asking convergent questions means to restrict student’s responses to one
right answer while asking divergent questions is to divert student’s thinking in
many directions. Divergent questions encourage critical thinking about problems.
Mostly, teachers ask convergent questions without realizing the fact that they are
confining students to recall of information (Althouse et al; 2003). Convergent
questions can only be effective when teachers want to assess students’ knowledge
of facts (Colburn, 2003).

6
1.5 Wait Time
Another dynamic aspect that is related to teachers’ questions, involves
wait time. Teachers seldom wait more than one minute to answer their own
questions (Powell & Caseau, 2004). Critical and creative thinking and reflection
take time. A teacher questioning methodology should operate in such a way that
give students enough time to think over and give a response (Ryan & Cooper
2010). How long teachers pause or wait? Suggestions range from 3 to 5 seconds.
Research shows a range of 0.5 to 1.2 seconds (Blosser, 2000).
Teachers’
question
Pause (wait time
1)
Student
response
Pause (wait time 2) Teacher
reaction
Pausing after asking a question (wait time 1) provides students with the
opportunity to think about teacher’s question and to formulate a response. Pausing
after a student’s responds (wait time 2) provides the students with the opportunity
to add, to modify, or elaborate on the response (Rowe, 1973).
Ever since the beginning of classroom research (Stevens, 1912), teachers
have been observed – when not lecturing or demonstrating –ask a good many
questions at a fast pace over a class hour, several questions per minute. Less than
one second of time has repeatedly been observed to lapse between the end of the
student’s answer and the start of the teacher’s next question. The majority of
questions entail the recall and recitation of factual information previously taught
or studied; some questions bear on speculative, evaluative, and other cognitive
manipulations of information; and the remainder are conversational and
managerial.

7
1.6 Significance
Questioning is essential for good communication and it lies at the heart of
good, interactive teaching. Learning to think in an effective manner and develop
critical thinking, students must be engaged to learn actively, and one way to active
learning in classroom is to ask variety of questions. Good questioning technique is
a challenging skill which is very important to be developed by the teachers.
Questions are supposed to be asked intelligently that is at the suitable level, of the
suitable type, and specially, should be worded correctly. Very often it has been
observed that the teacher occupy central position in the classroom who is busy in
talking while the students become passive listeners. Use of questioning technique
is an appropriate way to changeover from teacher-centered instruction to student-
centered instruction. A skill in questioning is becoming a vital element of
productive teaching.
Questioning technique plays a key role in helping teachers to impart
knowledge as it serves so many functions but it is still an under researched area in
the Pakistani classroom context. This study adopted a realistic approach to focus
on daily classroom activities related to questioning.
The study will be significant for the teachers to develop and improve their
questioning skill as to promote higher order thinking in students. The study will be
beneficial for university and secondary school teachers to get familiar with
convergent and divergent questions. The study will provide footings for further
research to correlate the type of question asked and the development of higher
order or lower order thinking.

8
1.7 Statement of the problem
Being a teacher herself, the researcher noticed that teachers asked a lot of
questions but whether the questions were better enough to promote critical
thinking. Perhaps this vital issue has not gained attention of the researchers and
still an under – researched area in Pakistan. The overall purpose of the study was
an analysis of Questioning leading to critical thinking in the classrooms.
1.8 Objectives of the study
Objectives of the study were
To explore the convergent questions at Secondary and Tertiary Levels
To find out the divergent questions at Secondary and Tertiary levels
To determine the levels of questioning taking into consideration the
Taxonomy of Bloom
To differentiate the levels of questioning at Secondary and Tertiary levels
To analyze higher and lower order questions
1.9 Research Hypotheses
H0: There is no significance difference between the type of questions at Secondary
and Tertiary Levels
H1: There is significance difference between the type of questions at Secondary
and Tertiary Levels
The teachers at Secondary Level ask lower order questions.
The teachers at Tertiary Level ask lower order questions.

9
The teachers at Secondary and Tertiary Levels ask more convergent
questions than divergent questions.
There is no significance difference between teachers’ lower order
questions at Secondary and Tertiary level.
There is no significance difference between teachers’ higher order
questions at Secondary and Tertiary level.
1.10 Limitations of the Study
The study was limited to the Secondary and Tertiary level teachers of
Khyber Pakhtunkhwa to know the prevailing practice of questioning technique.
1.11 Delimitations of the Study
Keeping in view the real world constraints, the study was delimited to two
levels of education i.e. Secondary and Tertiary Levels. The study was further
delimited to the Secondary School teachers and teachers of public sector
universities of Khyber Pakhtunkhwa.
1.12 Definition of the Terms
Analytical: Relating to or using analysis or logical reasoning.
Question: A sentence worded or expressed so as to elicit information.
Critical: Expressing adverse or disapproving comments or judgments.
Thinking: Using thought or rational judgment.
Secondary level teachers: teachers teaching to class, 6th, 8th,9th, 10th,
Tertiary level teachers: teachers teaching at B.A, B.Sc, M.A, M.Sc level

10
Convergent question: A convergent question is a specific query which
requires 'yes' or ‘no’ answer.
Divergent question: A divergent question has more than one answer or a
finite limit.

11
CHAPTER-TWO
LITERATURE REVIEW
This chapter describes the review of related literature under the following
headings.
2.1 Questioning Skills
Educational process based on the practice of enquiry, and enquiry takes
place through the framing of questions (Kerry, 2002). Since Socrates time,
teaching and questioning strategy have been regarded as necessarily relevant
activities. An effective teacher must also be an effective questioner. While
teaching in the classroom, teachers ask a lot of questions. Researchers have
identified that during teaching career, a typical teacher ask almost one and half
million questions. Asking lots of questions do not mean that teachers are skilled in
asking good questions (Cooper, 2013). Wood (1998) stated that teachers’
questions have commanding influence over classroom talk. Most of the research
findings about classroom questions show that questions play a crucial role in the
classroom and that teachers need to develop an improved questioning skill
(Dillon, 1984).
2.2 What is question?
Questioning is a strategy which is employed to accomplish a specific
purpose (Nor, & Mohd. Ramli, 1998). A working definition of a question in the
classroom is “any statement intended to evoke a verbal response’’ (Wragg, 1984).
Any declaration aimed to elicit a student’s response is called question. If the

12
questions evoke responses that actively engage a student in the learning process,
are considered effective questions. Questions are helping instruments for teachers
to present the content of the lesson, develop students’ bridging understanding
ability to learn the content. Questions are used to arise interest and curiosity, to
focus attention on an issue, to diagnose specific learning difficulties, to help recall
specific information, to promote thought and understanding of ideas.
Teacher’s questions has a vital role in the development of students’ spirit
of inquiry, evoke and initiate new ideas, clear their concepts and they become
more demanding and ambitious in life. Students generate their learning and
thinking skills when exposed to the right set of questions. It is therefore vital for
teachers to assess their current questioning techniques (Stewart, 2011).
Questioning technique is an indispensable element in the teaching learning
process. Teachers’ classroom time is spent in asking different questions. They ask
questions as much as two questions each minute, up to 400 in a day, almost
70,000 a year or two to three million questions over the course of a career. So, it is
imperative to ask right questions in the right way. Among the four hundred
questions between 30 to 60 percent are procedural rather than learning-based. But
questioning technique is still an important element and play pivotal role in
transmitting knowledge (Hastings, 2006).
Questions are vehicles for thought. Teacher questioning behaviors affect
which students learn how much (Walsh & Sattes, 2005). Questioning is an
essential and complex learning tool for teachers –even for the most experience as
well -- to master. To add to the complexity, varieties of questions are suitable for
various kinds of instructional strategies (Pagliaro, 2011).

13
The use of skilful questioning techniques is seen as sign of a successful
teacher. Skilful teachers match their questions to the ability level of their students.
Less competent students may need a series of questions to arrive at a correct
answer (Lapp, Flood & Farnan, 1989).
Nor, & Mohd. Ramli (1998) listed a number of reasons for asking
questions by the teachers. The reasons they had given were, a) to promote
creativity in the thinking process, b) to collect and examine the facts, c) to
stimulate and extend students’ cognitive abilities, d) to update their already
learned knowledge, e) to activate students’ participation in the teaching and
learning process, f) to instigate the creativity in ideas, g) to develop a supportive
environment where teachers and students can freely share their ideas, h) to check
and judge students’ level of understanding and time to time progress in the
studies , i) to find out whether the targets set for the teaching and learning are
achieved or not, j) to draw students’ attention and to promote their interest for
learning and, k) to generate a cordial and pleasant environment between teachers
and students.
2.3 Classification of Questions according to Bloom’s Taxonomy
Effective questioning has well-defined and definite characteristics, serves
various functions and creates different levels of thinking. Teachers’ questions
involve different thought processes from simple factual recall of information to
more complex thinking level. Teachers ‘great reliance on asking factual questions
cannot create effective learning environment. Using questions effectively and
intelligently, thorough knowledge about the different types of questions is very
important for teachers (Cooper, 2013).

14
There are many terms and classifications for explaining the different types
of questions. All these classifications provide a conceptual framework for
categorizing questions. To simplify the process and to avoid repetition, Bloom’s
Taxonomy (1956) which is a famous system of classification for educational
objectives and also for classroom questions has to be selected. Bloom’s
Taxonomy consists of six levels and question at each level demand distinct type of
thought process. Effective teachers formulate questions on each of these six levels
in order to involve students in different types of thinking processes.
There are different types of learners in the classroom for which teachers
must plan to devise such questions which cover all the distinct levels of cognitive
domain that contain knowledge, comprehension, application, analysis, synthesis,
and evaluation levels of Bloom’s Taxonomy.
2.3.1 Knowledge Level Questions
Knowledge level questions refer to types of questions that lay stresses on
memory. Such type of questions assist students in understanding or remembering
of the concepts that had been taught. These levels of questions demand students to
demonstrate their knowledge in the form of classification, sequencing and listing
of facts (Bloom, 1956). Knowledge based questions encourage the learner to
recall, describe, define, or recognize facts that already have been devoted to
memory (Borich, 2000).
Questions formulated at the knowledge level may ask students to
remember common terms, specified and definite facts, methods and procedures,
basic ideas, and principles. This could include stating or describing the who, what,
when, where, and how of a situation. Knowledge questions can prompt students to

15
arrange ,define, describe, enumerate, identify, know, label, list, match, outline,
recall, recognize, select, state, or tell (Henning, 2008).
Knowledge level questions are important for several reasons. Knowledge
level questions provide a base for higher level thinking as memorization of
information is required to perform a variety of tasks. Use of knowledge questions
also develops class participation (Cooper, 2013). Asking knowledge level
questions provide an opportunity to low ability students to exhibit a leading
performance by responding correctly to such questions 70 to 80 percent of the
time (Brophy & Evertson, 1976).
On the other hand knowledge category questions have some drawbacks.
Most of the teachers overuse knowledge level questions, memorization of facts are
stressed which is easily forgotten. Such questions judge students’ superficial and
shallow understanding of the phenomena (Cooper, 2013).
2.3.2 Comprehension Level Questions
Comprehension based questions are the type of questions that give more
consideration to the comprehension of concepts or principles. At this level,
learners are expected to use ideas, concepts, principles and theories learned to
obtain solutions of the problems. The principles used must be transparent as well.
Learners should have the ability to manipulate information from diagrams, graphs,
formula or explain scientific terminology (Bloom, 1956).
Questions asked at the comprehension level stimulate the learner behavior
to explain, describe, summarize, or elaborate the facts learned formerly (Borich,
2000).

16
At the comprehension level, students may be asked to explain facts and
principles, interpret verbal material, clarify charts and graphs, translate etc.
(Henning, 2008).
Examples
1. Can anyone explain photosynthesis in your own words?
2. What is the purpose of Bloom’s taxonomy?
Questions asked at the comprehension level encourage the learner to go
outside of the rote memorization of certain facts and their translation and to use
previously acquired facts and understandings in an advanced and distinct
environment (Borich, 2000).
2.3.3 Application Level Questions
Application level questions give more stress to focus learners’ competency
to use ideas, concepts, principles and theories to find solutions to problems that
they have not confronted before (Bloom, 1956).
The application level of Bloom’s taxonomy requires both understanding
and application; it is considered a high level of cognition than the comprehension
level. Questions at the application level require students to act, administer, apply,
articulate, develop, discover, dramatize, establish, show, use, write etc. (Henning,
2008).
Example
1. Why is Bloom’s taxonomy helpful in analyzing the effectiveness of
teacher questions?

17
2.3.4 Analysis Level Questions
Questions at the analysis level demand learners’ ability to distinguish the
constituting elements of an idea at large, analyzing the relationship between
various constituents and splitting up a topic into various inter-connected fractions.
Making distinctions, comparing, connecting, doing an experiment and solving a
problem are the behavior which can be judged at this level (Bloom, 1956).
Analysis level questions come under the category of higher order
questions. Here the students are asked to split the information or problem into its
constituent parts and to draw relationships among the parts (Borich, 2000).
At the analysis level of Bloom’s taxonomy students are asked to divide
and organize concepts, ideas, examples, theories, or other information or material
into their component parts to better understand its organizational structure.
Questions may include verbs such as analyze, appraise, break down, calculate,
categorize, compare, contrast, correlate, diagram, differentiate, outline etc.
(Henning, 2008).
Example
1. What features distinguish bird from a mammal?
2. What is the difference between knowledge and analysis level of Bloom’s
taxonomy?
2.3.5 Synthesis Level Questions
A synthesis level question stimulates learners to be more creative and
imaginative. Acquiring this ability will help them to explore and solve a problem
that has been presented. For instance, this level question demands the learners to
plan, combine, create or produce something new (Bloom, 1956).

18
Synthesis level questions are designed to ask the learners to plan or create
a unique or incomparable response to an unknown problem (Borich, 2000).
Synthesis level of Bloom’s taxonomy encourages students to initiate,
assimilate, and combine ideas into a product, plan, or proposal that is unique to
him or her. They may be engaged in writing an essay, composing a speech,
designing an experiment, creating a classification scheme, or generating any kind
of project that requires the formulation of new patterns or structures (Henning,
2008).
2.3.6 Evaluation Level Questions
Evaluation level questions require learners to ponder on specific situation.
Learners require appraising an idea, finding answers and making a judgment. An
example of question for this level is requiring students to evaluate, give opinions,
to elaborate the essence of a specific matter or issue, draw conclusion and give an
explanation (Bloom, 1956).
Evaluation level questions are designed to develop in students the power
of making judgments and taking in time decisions. Such type of questions helps
students to employ stated criteria for determining the adequacy of the response
(Borich, 2000).
Teachers need practice and guidance on asking a variety of questions as
only effective questions can engage students actively in learning (Powell, 2004, p.
221).

19
2.4 Convergent and Divergent Questions
Questions may be narrow or broad. Questions are narrow when
encouraging a specific or limited response. Questions are broad when a general or
expansive response encouraged. An efficient and competent teacher has full
insight about questioning technique and always in a position to frame both type of
questions, close (convergent) and open ended (divergent). Convergent types of
questions are those which confined students responses to single or very limited
answer. Convergent questions encourage students thinking on already learned
answers and memorizing some limited facts (Borich, 2000).
Hiang (1997) also described the meaning of a convergent question and a
divergent question. A convergent question requires a clear-cut and well-defined
answer. The answer is wrong if it is contrastive to the supposed answer. On the
contrary, a divergent question is not directed towards one specific answer rather it
demands one to state one’s views, feelings, observations, prediction and thoughts
on specific situation.
The vast majority of questions teachers ask students are convergent
(Blosser, 2000). Convergent questions are also called short-answer questions,
since students can often respond to them with a word or two. Convergent
questions are effective for assessing students’ knowledge of facts (Colburn, 2003).
Convergent questions may require students to make comparisons, explain
facts or concepts, state or describe relationships, or solve problems using leaned
procedures. The following example illustrate convergent question:

20
What is the relationship between crude oil and plastic? (Hunt et al., 2009)
Convergent questions are also asked to lead the way for a discussion. For
example:
1. What percentage of all teachers are females?
2. Why would more females become teachers than males?
3. What are the main reasons that all teachers give for becoming teachers?
(Clement, 2005).
Questions which stimulate extensive and wide range responses are termed
as divergent or indirect questions. Such sort of questions has more chances of
correct and right answers (Borich, 2000).
Clement (2005) asserted that divergent questions are designed to guide the
students to think broadly as such questions have many possible answers.
Divergent questions give students the freedom to respond and not restrict
them to one correct answer. Responding to divergent questions require
information base on the part of students. Divergent questions require students to
think in new and novel ways (Powell, 2010).
Questions classified as divergent may require students to predict,
hypothesize, or infer. An expression such as ‘what if’ is common to questions
classified as divergent. The following example illustrate divergent question:
What do you think our society will be like in one hundred years? (Hunt et
al, 2009).
The ratio of convergent questions asked in the classroom is much higher
than divergent questions. The proportion is about 4:1 (Borich, 2000). The
formulations of divergent questions that encourage higher level thinking are
difficult to construct. Its formulation needs planning in advance. Due to lack of

21
proper planning in advance, many teachers rely on asking primarily convergent
questions (Cruickshank, 2009, p.373).
2.5 Wait time
Questioning technique with the provision of wait time for students’
responses helps teachers to accelerate the learning process. It is essential for
teachers to give time before starting another question or turning to another student
to actively engage the learner in the learning process (Borich, 2000).
Teachers usually do not wait after asking questions from students. It has
been observed that teachers do not wait more than a second to get answers of their
asked question. Teachers allowed an average time of a second to put questions and
receive a response from students. Sometimes teachers answer the question
themselves. Below average students are provided with more less time as the
teachers do not want them to feel shy when they are not able to give the right
responses (Hastings, 2006).
Rowe (1974) conducted a study on questioning and concluded that
teachers wait only 0.9 seconds for students’ responses after posing a question.
This time is too little for average students to answer any question. Every learner
goes through four intellectual steps that are needed to response to a question. First
step demand them to hear and comprehend the question. Second step encourage
the students to recollect and think about the information from their memories.
Third step requires the students to take into consideration that their answers will
be approved and fourth step tells them that their answers will either be appreciated
or criticized (Jones and Jones, 2004).

22
Increasing wait time by the teachers to students’ responses has very
positive impacts on developing higher level thinking in students, their answer skill
improves and the failures to respond decrease (Rowe, 1986).
The more we provide longer time the more we get reasonable responses
with great willingness and much confidence (Borich, 2000).
Permitting students a reasonable amount of thinking time increases the
quality of students’ responses (Partin, 2005).
2.6 Effective Questioning Skills
Effective questioning gives participants to think through the content and
gain a better understanding of the concepts being presented (Sullivan &
Wircenski, 2001).
The use of successful questioning strategy helps teachers to promote
thinking ability of the students, strengthen their fundamental skills, encourage shy
and quiet students to participate and gain the concentration of inattentive, non -
serious students (Dana & Hoppey, 2003).
Effective questioning is a complex process which needs careful planning.
The teachers, while planning for effective questioning skills, should consider the
goals and objectives of the lesson, should think about students’ characteristics and
should prepare guiding questions and include variety in capturing students’
interest (Fusco, 2012). Effective teachers keep in view the instructional objectives
of the lesson before framing the type of question (Moore & Hansen, 2011).
Frequency, equal distribution of low and higher level questions, prompting
and wait- time are considered the characteristics of effective questioning strategies
(Eggen & Kauchak, 2007; O’Flahavan, Hartman, & Pearson, 1988). Good

23
questioning skill has positive consequences on classroom environment as it
stimulates students’ creativity and critical thinking, involve students to actively
participate in class and ensure their understanding (Ralph, 2004). Questioning, if
asked intelligently, would upgrade students' level of thinking (Muth & Alverman,
1992; Orlich, Harder, Callahan, Kauchak, & Gibson, 1994; Ornstein, 1995).
2.7 Common Problems in Using Questions
Eighty percent of the school time is devoted to questions and answers
(Gall, 1984). According to (Brown & Edmondson, 1984) almost hundreds of
questions per hour are asked by the teachers during classroom instruction. Borich
(2000) study showed that questioning strategy is the most frequent technique
employ by the teachers in their classroom teaching as this is the most appropriate
method in promoting critical thinking.
But not all questions are effective. Only those questions encourage active
participation of students in classroom if develop carefully. Questioning technique
occupies much class time and students are actively involved during the learning
process if teachers follow good questioning techniques (Bond, 2007).
Some of the most frequently observed problems with asking questions are
the following.
2.7.1 Use of Complex, Ambiguous or “Double” questions
One of the commonest question asking problems of beginning teachers is
the use of the complex, ambiguous or “double” question. This is a question that is
so long and complicated that students easily lose track of the main idea by the
time it is completed (Borich, 2000).

24
2.7.2 We accept only the Answers we expect
Another common mistake of teachers is to rely almost exclusively on the
answer they expect. Answers that are just what the teachers are looking for are
always desirable, but partly accurate replies and even uncommon and
unanticipated. One can become effective supplements to the discussion through
the use of probes (Borich, 2000).
2.7.3 Why to ask this Question?
The most serious error of all in question asking is not being certain why
we are asking a question. Questions are tools that support teaching and learning
processes. Our first decision in using questions is to decide either to use
convergent or divergent questions which fulfill lesson needs (Borich, 2000).
2.7.4 Answering own question
Another common problem with teachers is posing a question, and then
answering it themselves. The teachers often supply the correct answer to their own
questions (Borich, 2000).
2.7.5 Using Questions as Punishment
Teachers usually employ questioning strategy to punish or make the
students confuse. This wrong use of questions can hardly improve misbehavior
and never supports the learning process (Borich, 2000).
2.8 Research Already Conducted
According to a study done by khan & Inamullah, (2011) “A study of lower
order and higher order questions at secondary level” concluded that teachers asked

25
frequent questions in classrooms where most of the questions were lower order
while higher order questions were seldom asked.
Tritapoe, (2010) declared that in most of the classrooms there is absence of
motivation and interest on the part of students when the teacher is busy in
explaining the content. The main reason behind this was lacking suitable
questioning skills by the teachers. Declamatory and procedural questions were
mostly asked by the teachers. It was also observed that insufficient time was
provided to students’ responses when asked questions.
The research of Tekene, (2006) highlighted that most of the questions
asked in the centers were lower order questions. Majority of the participants were
provided with less than three seconds to answer any question.
Ma, (2004) conducted a study which discussed some basic knowledge of
questions, and then explores the skill of questioning in English class about the
preparing, designing, controlling and evaluating of questioning.
Honea, (1982) conducted an experiment which studied the effects of which
increasing wait-time. The number of participants of the study was twenty four
social studies class students. It was observed that when wait-time was increased
from three to five seconds, the active involvement and participation of students
were highly improved.
Dumteeb (2009) explored the questions and questioning techniques used by
Thailand English teachers to promote students’ responses and their critical thinking
skills in the English language classrooms. To obtain the data, various collection
strategies including classroom observations, questionnaires, individual interviews,

26
focus group interviews, and document analysis were employed. The teachers used six
types of questions in the classrooms: knowledge, comprehension, application,
analysis, synthesis, and evaluation questions. Knowledge questions were found to be
predominant. The dominance of knowledge questions was caused by the focus, the
objectives of the lesson and the classroom context. Of all the questions asked in the
study, knowledge questions elicited the greatest number of responses from the
students. The fact that the students responded to knowledge questions most often
might be because responding to knowledge questions does not require much of the
students’ time, effort, vocabulary and grammatical knowledge in formulating their
responses.
Sulaiman & Noordin (2005) examined to what extent teachers use question
levels in teaching investigation skills and explored that while teaching
investigation skills, teachers mostly use knowledge level questions followed by
analysis and comprehension question levels. Questions from the other levels were
not often used while teaching.
According to Moore (1995) teachers have the inclination to ask a series of
particular, factual, lower-order questions that do not pose any difficulty to the
learner in finding answers because answers can easily be picked from the texts.
This dependence on lower-order questions and ignoring other kinds of questions
leads to rote learning and poses hurdles in promoting higher-level thinking skill
among students (Perrott, 1990).
Ghazali (1998) conducted study on questioning in Malaysia and found that
majority of the teachers feel discomfort in effective use of all types of questions
that is from low to high, convergent, divergent, literal and inferential questions.

27
Questions asked at the lower-level appeal to lower level thinking which result in
rote learning of facts and solid information. Such questions are beneficial for
learners who have no prior learning and who must be dealt with easy questions
before moving on to difficult and more intellectual reasoning (Ornstein, 1995).

28
CHAPTER-THREE
RESEARCH METHODOLOGY
3.1 Introduction
The main purpose of the study was analysis of questioning leading to
critical thinking in the classroom. The study was observational type of the
descriptive method. The following procedure was adopted for studying the
questioning techniques in the classroom using Bloom’s Taxonomy.
3.2 Population
3.2.1 Categorization of the population
All the 21965 teachers (http://www.kpese.gov.pk/)of the public secondary
schools in Khyber Pukhtunkhwa
All the 3000 teachers (http://www.hec.gov.pk/ourinstitutes/) of the public
sector universities in Khyber Pukhtunkhwa
3.2.2 Sampling
After studying different articles, research papers and research
methodologies, the researcher decided to use proportion allocation of population
(Walpole, 1968), 200 classroom observations were done, 176 at secondary level
and 24 at tertiary level keeping in view cultural constraints, time constraints and
current depressed situation and war against terrorism in the Khyber Pakhtunkhwa.
At secondary level classes of 6th, 7th, 8th, 9th, and 10th were observed while at
tertiary level classes of B.A, B.Sc. and M.A, M.Sc. were taken. Being the student

29
of social sciences and having no background of pure sciences, with the permission
of the heads of the institutes and willingness of the teachers, the researcher
conducted observations of teachers teaching English, Urdu, Islamiyat, social
studies etc. science classrooms were not observed.
In classes of 6th, 7th, 8th, 9th, and 10th subjects of English, Urdu, social
studies/ Pakistan studies, Islamiyat, civics were seen. In classes of B.A, B.Sc. and
M.A, M.Sc. subjects like Education, Political science, English, Urdu, Islamic
studies, Economics, Pakistan studies, Psychology, History etc. were observed.
Using simple random sample technique, the study was conducted in the
districts of Peshawar, Kohat, D.I. Khan, Mansehra, Mardan, Malakand, and Swat.
3.3 Research Instrument
To achieve the objectives of the study, the instrument was taken from “the
instructional leader’s guide to informal classroom observations” (Zepeda, 2009)
and modified by the supervisor and the researcher. The modifications were made
in each category of the cognitive domain of Bloom’s Taxonomy. Each level was
further divided into sub categories so that the categorization of the questions
become easy and done appropriately. (Appendix -2)
3.4 Procedure
The design of the study was observational. In order to collect data, the
observational sheet was used while observing teacher’s lesson. One hundred and
seventy six lessons were observed at Secondary Level while twenty four lessons
were observed at Tertiary Level. A total of two hundred observations were made
at both the levels. During the observation the researcher noted down the questions

30
asked by the teacher and was also audio recorded. The questions were then
categorized on the observation sheet as knowledge, comprehension, application,
analysis, synthesis and evaluation based.
Before conducting the actual study, the researcher got letter of permission
(Appendix-1) from IER, University of Peshawar for collecting the data. After
getting permission from school and universities authority and consent of the
teachers, the observations were conducted at Secondary and Tertiary Levels of
Khyber Pakhtunkhwa.
3.5 Pilot Testing
The researcher selected Institute of Education & Research, University of
Peshawar for pilot testing as the researcher is student over there. The researcher
observed two classes using the instrument in the presence of senior professors.
They were requested to give their valuable suggestions freely for improvement.
They suggested
That each category of the instrument be further expanded.
For the validity of the data audio recording should also be made.
For unobtrusive observation so that the teachers might be observed in their
real spirit of teaching.
Accordingly technique of observation improved upon in the light of pilot testing.
3.6 Data Collection
Data collection stage was an interesting stage for the researcher. The
researcher visited different institutions (Appendix-3) and interacted with different

31
teachers at Secondary and Tertiary levels. Two hundred classes (as mentioned in
the sample) with different strength of the students were observed in a period of six
months. The class sizes ranged from 40-100 students at secondary level while
class sizes was not more than 20- 30 students at tertiary level. The cooperation of
the principals and teachers was admirable. Throughout the classroom
observations, the teachers’ questioning strategy was observed and was audio
recorded. The observation sheet developed for the study was used for encoding
the data. Each teacher was observed in the allocated class time in different
institutions.
3.7 Ethical Consideration
The teachers were carefully approached keeping in view the ethical issues
discussed by Denscombe (2002). The purpose of research was explained and thus
an informed consent was signed from the teachers of both secondary and tertiary
level. Confidentiality of data and anonymity of the participants was ensured.
3.8 Budget
The study was managed on self-support basis.
3.9 Time Schedule
The study was completed in 20 months by following the given phases:
1. Review of related Literature was completed in 6 months.
2. The instrument was developed in a month.
3. The data was collected in 6 months
4. The collected data was organized, analyzed and interpreted in 4 months.

32
5. The research was reported in 3 months.
There are total 25 districts in Khyber Pakhtunkhwa:
1 Abbottabad 2 Bannu 3 Chitral 4 Charsadda 5 D.I. Khan 6 Dir Lower
7 Karak 8 Kohat 9 Kohistan 10 Mansehra 11 Mardan 12 Malakand
13 Nowshera 14 Peshawar 15 Swat 16 Swabi 17 Bunner 18 Haripur
19 Lakki 20 Tank 21 Battagram 22 Dir Upper 23 Hangu 24 Shangla
25 Tor Ghar
(Annual Statistical Report 2010)
Figure 3.1: Map showing districts of Khyber Pakhtunkhwa

33
CHAPTER-FOUR
DATA AND DATA ANALYSIS
4.1 Organization of the Data
The major purpose of the study was an analysis of questioning leading to
critical thinking in the classrooms. To achieve the objectives of the study the
researcher collected the data through the instrument “observation guide using
Bloom’s Taxonomy” developed by Zepeda in (2009) amended by Khan &
Inamullah (2011), using the observational technique. Data was collected by the
above mentioned instrument, tabulated, analyzed and interpreted by using
percentage and Chi Square statistical tool.
This chapter deals with the analysis and interpretation of data according to
the study objectives. Tables 1 to 176 show the number of questions teacher asked
at different levels of Bloom’s Taxonomy over specified classroom time at
secondary level. Tables 177 to 200 show the number of questions teacher asked at
different levels of Bloom’s Taxonomy over specified classroom time at tertiary
level. Tables 201 to 211 deal with testing research hypotheses.
4.2 Data Tabulation and Analysis
A naturalistic approach was adopted by the researcher to observe teachers’
questioning technique in the classroom (Agrosino & Mays de Pérez, 2000). This
helped the researcher to observe the real picture regarding questioning technique
employed by teachers in the classrooms (Allwright & Bailey, 1991) and yet to be

34
inconspicuous (Ackroyd & Hughes, 1992; Bryman, 2001). During the classroom
observations, the teachers’ questioning patterns were observed and audio
recording was made. The observation sheet developed for the study was used for
encoding the data.
Each teacher was observed in the class over specific period of time. At the
secondary level, the time duration per class was not more than forty minutes. In
some schools a period of thirty minutes was also observed. There were differences
in the time because the researcher was only concerned with the time when the
teacher was engaged in giving lecture. That time of the class was not taking into
considerations when the teacher started written work or checking of the notebooks
of the students.
Two hundred teachers (as mentioned in the sample) were observed with
audio recording.
The two hundred audio – taped observation sessions were transcribed. The
transcribed data was analyzed on the bases of intuitive interpretation of the
researcher (Kvale, 1996). Following observations, questions were categorized on
the observation sheet consisting six levels of Bloom’s Taxonomy. The Procedural
questions (e.g., take out your books and start reading? and rhetorical questions
(e.g., you have test today, isn‘t it?) were not analyzed.
The researcher identified the level of thinking for each question noted and
placed it in the knowledge, comprehension, application, analysis, synthesis and
evaluation category.
The teacher‘s questions were coded lower – order that asks for knowledge,
comprehension and application, the first three categories of Bloom’s taxonomy.

35
The questions that asked for analysis, synthesis, and evaluation were coded as
higher – order questions, the last three categories of Bloom’s taxonomy (Morgan
& Saxton, 1994, p.63, 64).
Some of the examples of low order questions include: which is the biggest
mountain range? What is the meaning of cognitive? What is unconditioned
stimulus? What is stratified random sampling? Who is the writer of the book
“politics among nations”? Where is Mount Olympia?
Some of the higher order questions were:
What effect does overpopulation have on our country? What is the
relationship between culture and religion? How will we change this sentence into
indirect speech? How might we create a sentence for negative?
When the level of teacher questions was confirmed, questioning data were
recorded onto a questioning chart regarding: question types; categories of data
from the chart were summed. After each category was calculated, the total number
of question types was divided by the number of questions the teacher asked. This
information provided a percentage of each category of Bloom’s taxonomy.
The formula of percentage was:
Number of asked questions ––––––––––––––––––––––– × 100 Total number of questions
In order to compare the types of questions at secondary and tertiary level
classrooms, chi square test was applied using manual calculations.
Chi-Square Test
Test statistics was used

36
Oi = Observed frequencies
Ei= Expected frequencies.
Df= Degree of freedom
Level of Significance used in the study was 0.05 (Gay, 2000)
Observed frequencies were collected and the expected frequency comes
from the formula.
Row total multiply by column total whole divided by grand total
{(R*C)/GT}.
In the table Df is degree of freedom and, 0.05 is level of significance
(Garrett, 1997)
4.3 Secondary Level Data of individual tables
Connotation used:
K= Knowledge, C= Comprehension, APP= Application, ANA= Analysis,
SYNT= Synthesis, EVA= Evaluation, No of Obs. Ques. = Number of observed
questions

37
Table-1~176: Category of questions observed in 176 total sessions at
Secondary Level
Table 01
Table 1 indicated that in 15 minutes class duration, the researcher observed 19
questions. 58 % of the questions were knowledge based, 21% were
comprehension based, 31% were application based and 5% were analysis based.
Thus majority of the questions asked in the class were lower order questions. The
total percentage of questions during 15 minutes was 127%.
Table 02
Table 2 indicated that in 25 minutes class duration, the researcher observed 9
questions. 82 % of the questions were knowledge based and 18% were
comprehension based. Thus majority of the questions asked in the class were
lower order questions. The total percentage of questions during 25 minutes was
44%.
Time No. of obs. Ques. K C App. Ana. Synt. Eva.
15 min 19 11 4 3 1 0 0
%age 58% 21% 16% 5% 0% 0%
Time No. of obs. Ques. K C App. Ana. Synt Eva.
25min 11 9 2 0 0 0 0
%age 82% 18% 0% 0% 0% 0%

38
Table 03
Table 3 indicated that in 15 minutes class duration, the researcher observed 10
questions. 50% of the questions were knowledge based and 50% were
comprehension based. Thus majority of the questions asked in the class were
lower order questions. The total percentage of questions during 15 minutes was
67%.
Table 04
Table 4 indicated that in 15 minutes class duration, the researcher observed 10
questions. 90% of the questions were knowledge based and 10% were
comprehension based. Thus all of the questions asked in the class were lower
order questions. The total percentage of questions during 15 minutes was 67%.
Time No. of obs. Ques. K C App Ana Synt Eva
15min 10 5 5 0 0 0 0
%age 50% 50% 0% 0% 0% 0%
Time No. of obs. Ques. K C App Ana Syn Eva
15min 10 9 1 0 0 0 0
%age 90% 10% 0% 0% 0% 0%

39
Table 05
Table 5 indicated that in 25 minutes class duration, the researcher observed 26
questions. 77 % of the questions were knowledge, 7.6% were comprehension, and
11% .5 were application and 4% were analysis based. Thus majority of the
questions asked in the class were lower order questions. 4% of the questions were
asked in the higher order. The total percentage of questions during 25 minutes was
104%.
Table 06
Time No. of obs. Ques. K C App Ana Synt Eva
20min 7 4 3 0 0 0 0
%age 57% 43% 0% 0% 0% 0%
Table 6 indicated that in 20 minutes class duration, the researcher observed 7
questions. 57% of the questions were knowledge based and 43% were
comprehension based. Thus all of the questions asked in the class were lower
order questions. The total percentage of questions during 20 minutes was 35%
Time No. of obs. Ques. K C App. Ana. Syn. Eva
25min 26 20 2 3 1 0 0
%age 77% 7.6% 11.5% 4% 0% 0%

40
Table 07
Time No. of obs. Ques. K C App Ana Synt Eva
30min 19 12 7 0 0 0 0
%age 63% 37% 0% 0% 0% 0%
Table 7 indicated that in 30 minutes class duration, the researcher observed 19
questions. 63% of the questions were knowledge based and 37% were
comprehension based. Thus all of the questions asked in the class were lower
order questions. The total percentage of questions during 30 minutes was 63%.
Table 08
Table 20 indicated that in 20 minutes class duration, the researcher observed 9
questions. 33 % of the questions were knowledge based, 56% were
comprehension based, and 11% were synthesis based. Thus majority of the
questions asked in the class were lower order questions. Only 11% of the
questions were higher order. The total percentage of questions during 20 minutes
was 60%.
Time No. of obs. Ques. K C App Ana Synt Eva
20min 9 3 5 0 0 1 0
%age 33% 56% 0% 0% 11% 0%

41
Table 09
Table 9 indicated that in 30 minutes class duration, the researcher observed 17
questions. 65% of the questions were knowledge based and 35% were
comprehension based. Thus all of the questions asked in the class were lower
order questions. The total percentage of questions during 30 minutes was 57%.
Table 10
Table 10 indicated that in 25 minutes class duration, the researcher observed 17
questions. 77 % of the questions were knowledge based, 9% were comprehension
based, 9% were application based and 5% were analysis based. Thus majority of
the questions asked in the class were lower order questions. The total percentage
of questions during 25 minutes was 88%.
Table 11
Table11 indicated that in 15 minutes class duration, the researcher observed 10
questions. 80% of the questions were knowledge based and 20% were
comprehension based. Thus all of the questions asked in the class were lower
order questions. The total percentage of questions during 15 minutes was 67%.
Time No. of obs. Ques. K C App Ana Synt Eva
30min 17 11 6 0 0 0 0
%age 65% 35% 0% 0% 0% 0%
Time No. of obs. Ques. K C App Ana Synt Eva
25min 22 17 2 2 1 0 0
%age 77% 9% 9% 5% 0% 0%
Time No. of obs. Ques. K C App Ana Synt Eva
15min 10 8 2 0 0 0 0
%age 80% 20% 0% 0% 0% 0%

42
Table 12
Table 12 indicated that in 40 minutes class duration, the researcher observed 7
questions. 86 % of the questions were knowledge based and 14% were analysis
based. Thus majority of the questions asked in the class were lower order
questions. 14% of the questions were asked in the higher order. The total
percentage of questions during 40 minutes was 17.5%.
Table 13
Table 13 indicated that in 45 minutes class duration, the researcher observed 8
questions. 100 % of the questions were knowledge based. All the questions asked
in the class were lower order questions. The total percentage of questions during
45 minutes was just 18%.
Table 14
Table 14 indicated that in 35 minutes class duration, the researcher observed 6
questions. 83% of the questions were knowledge based and 17% were
comprehension based. Thus all of the questions asked in the class were lower
order questions. The total percentage of questions during 35 minutes was 17%.
Time No. of obs. Ques. K C App Ana Synt Eva
40min 7 6 0 0 1 0 0
%age 86% 0% 0% 14% 0% 0%
Time No. of obs. Ques. K C App Ana Synt Eva
45min 8 8 0 0 0 0 0
%age 100% 0% 0% 0% 0% 0%
Time No. of obs. Ques. K C App Ana Synt Eva
35min 6 5 1 0 0 0 0
%age 83% 17% 0% 0% 0% 0%

43
Table 15
Table 15 indicated that in 40 minutes class duration, the researcher observed 6
questions. 83% of the questions were knowledge based and 17% were
comprehension based. Thus all of the questions asked in the class were lower
order questions. The total percentage of questions during 35 minutes was just
15%.
Table 16
Table 16 indicated that in 45 minutes class duration, the researcher observed 5
questions. 80% of the questions were knowledge based and 20% were
comprehension based. Thus all of the questions asked in the class were lower
order questions. The total percentage of questions during 45 minutes was just
11%.
Table 17
Table 17 indicated that in 40 minutes class duration, the researcher observed 5
questions. 60 % of the questions were knowledge based, 20% were
comprehension based, and 20% were application based. Thus majority of the
questions asked in the class were lower order questions. The total percentage of
questions during 40 minutes was 12.5%.
Time No. of obs. Ques. K C App Ana Synt Eva
40min 6 5 1 0 0 0 0
%age 83% 17% 0% 0% 0% 0%
Time No. of obs. Ques. K C App Ana Synt Eva
45min 5 4 1 0 0 0 0
%age 80% 20% 0% 0% 0% 0%
Time No. of obs. Ques. K C App Ana Synt Eva
40min 5 3 1 1 0 0 0
%age 60% 20% 20% 0% 0% 0%

44
Table 18
Table 18 indicated that in 35 minutes class duration, the researcher observed 7
questions. 43 % of the questions were knowledge based, 14% were
comprehension based, 29% were synthesis and 14% were evaluation based. Thus
most of the questions asked in the class were lower order questions. 43% of the
questions were higher order. The total percentage of questions during 35 minutes
was 20%.
Table 19
Table 19 indicated that in 40 minutes class duration, the researcher observed 7
questions. 71% of the questions were knowledge based and 29% were
comprehension based. Thus all of the questions asked in the class were lower
order questions. The total percentage of questions during 40 minutes was just
17.5%.
Table 20
Table 20 indicated that in 35 minutes class duration, the researcher observed only
1 question 100 % of the questions were knowledge based. All the rest were lower
order questions. The total percentage of questions during 35 minutes was just only
3%.
Time No. of obs. Ques. K C App Ana Synt Eva
35min 7 3 1 0 0 2 1
%age 43% 14% 0% 0% 29% 14%
Time No. of obs. Ques. K C App Ana Synt Eva
40min 7 5 2 0 0 0 0
%age 71% 29% 0% 0% 0% 0%
Time No. of obs. Ques. K C App Ana Synt Eva
35min 1 1 0 0 0 0 0
%age 100% 0% 0% 0% 0% 0%

45
Table 21
Table 21 indicated that in 30 minutes class duration, the researcher observed 2
questions. 50 % of the questions were knowledge based and 50% were analysis
based. Here 50% of the questions were lower order 50% of the questions were
higher order. The total percentage of questions during 30 minutes was just 7%.
Table 22
Table 22 indicated that in 35 minutes class duration, the researcher observed 6
questions. 83 % of the questions were knowledge based and 17% were application
based. Thus majority of the questions asked in the class were lower order
questions. The total percentage of questions during 35 minutes was 17%.
Table 23
Table 23 indicated that in 30 minutes class duration, the researcher observed 2
questions. 50 % of the questions were knowledge based and 50% were analysis
based. Here 50% of the questions were lower order 50% of the questions were
higher order. The total percentage of questions during 30 minutes was just 7%.
Time No. of obs. Ques. K C App Ana Synt Eva
30min 2 1 0 0 1 0 0
%age 50% 0% 0% 50% 0% 0%
Time No. of obs. Ques. K C App Ana Synt Eva
35min 6 5 0 1 0 0 0
%age 83% 0% 17% 0% 0% 0%
Time No. of obs. Ques. K C App Ana Synt Eva
30min 2 0 1 0 1 0 0
%age 0% 50% 0% 50% 0% 0%

46
Table 24
Table24 indicated that in 30 minutes class duration, the researcher observed 11
questions. 82% of the questions were knowledge based and 18% were
comprehension based. Thus all of the questions asked in the class were lower
order questions. The total percentage of questions during 30 minutes was 37%.
Table 25
Table 25 indicated that in 20 minutes class duration, the researcher observed 11
questions. 27% of the questions were knowledge based and 73% were
comprehension based. Thus all of the questions asked in the class were lower
order questions. The total percentage of questions during 20 minutes was 55%.
Table 26
Table 26 indicated that in 20 minutes class duration, the researcher observed 5
questions. 80% of the questions were knowledge based and 20% were
comprehension based. Thus all of the questions asked in the class were lower
order questions. The total percentage of questions during 20 minutes was just
25%.
Time No. of obs. Ques. K C App Ana Synt Eva
30min 11 9 2 0 0 0 0
%age 82% 18% 0% 0% 0% 0%
Time No. of obs. Ques. K C App Ana Synt Eva
20min 11 3 8 0 0 0 0
%age 27% 73% 0% 0% 0% 0%
Time No. of obs. Ques. K C App Ana Synt Eva
20min 5 4 1 0 0 0 0
%age 80% 20% 0% 0% 0% 0%

47
Table 27
Table 27 indicated that in 15 minutes class duration, the researcher observed
9questions. 44.4 % of the questions were knowledge based, 44.4% were
comprehension based and 11% were analysis based. Thus majority of the
questions asked in the class were lower order questions. Only 11% of the
questions were asked in the higher order. The total percentage of questions during
15 minutes was 60%.
Table 28
Table 28 indicated that in 20 minutes class duration, the researcher observed 13
questions. 54 % of the questions were knowledge based, 15% were
comprehension based, and 31% were application based. Thus all of the questions
asked in the class were lower order questions. The total % of questions during 20
minutes was 65%.
Table 29
Table 29 indicated that in 30 minutes class duration, the researcher observed 9
questions. 100 % of the questions were knowledge based. All the questions asked
in the class were lower order questions. The total percentage of questions during
30 minutes was 30%.
Time No. of obs. Ques. K C App Ana Synt Eva
15min 9 4 4 0 1 0 0
%age 44.4% 44.4% 0% 11% 0% 0%
Time No. of obs. Ques. K C App Ana Synt Eva
20min 13 7 2 4 0 0 0
%age 54% 15% 31% 0% 0% 0%
Time No. of obs. Ques. K C App Ana Synt Eva
30min 9 9 0 0 0 0 0
%age 100% 0% 0% 0% 0% 0%

48
Table 30
Table 30 indicated that in 30 minutes class duration, the researcher observed 19
questions. 53 % of the questions were knowledge based, 37% were
comprehension based, and 10% were application based. Thus all of the questions
asked in the class were lower order questions. The total % of questions during 30
minutes was 63%.
Table 31
Table 31 indicated that in 30 minutes class duration, the researcher observed 18
questions. 67 % of the questions were knowledge based, 22% were application
based, 5.5% were analysis and 5.5% were synthesis based. Thus most of the
questions asked in the class were lower order questions. 33% of the questions
were higher order. The total percentage of questions during 30 minutes was 60%.
Table 32
Table 32 indicated that in 20 minutes class duration, the researcher observed 5
questions. 80% of the questions were knowledge based and 20% were
comprehension based. Thus all of the questions asked in the class were lower
order questions. The total percentage of questions during 20 minutes was just
25%.
Time No. of obs. Ques. K C App Ana Synt Eva
30min 19 10 7 2 0 0 0
%age 53% 37% 10% 0% 0% 0%
Time No. of obs. Ques. K C App Ana Synt Eva
30min 18 12 0 4 1 1 0
%age 67% 0% 22% 5.5% 5.5% 0%
Time No. of obs. Ques. K C App Ana Synt Eva
40min 2 1 1 0 0 0 0
%age 50% 50% 0% 0% 0% 0%

49
Table 33
Table 33 indicated that in 30 minutes class duration, the researcher observed 4
questions. 75% of the questions were knowledge based and 25% were
comprehension based. Thus all of the questions asked in the class were lower
order questions. The total percentage of questions during 20 minutes was just
13%.
Table 34
Table 34 indicated that in 35 minutes class duration, the researcher observed 2
questions. 100 % of the questions were comprehension based. All the questions
asked in the class were lower order questions. The total percentage of questions
during 30 minutes was 6%.
Table 35
Table 35 indicated that in 25 minutes class duration, the researcher observed 4
questions. 75 % of the questions were knowledge based and 25% of the questions
were analysis based. The total percentage of questions during 25 minutes was
16%.
Time No. of obs. Ques. K C App Ana Synt Eva
30min 4 3 0 1 0 0 0
%age 75% 0% 25% 0% 0% 0%
Time No. of obs. Ques. K C App Ana Synt Eva
35min 2 0 2 0 0 0 0
%age 0% 100% 0% 0% 0% 0%
Time No. of obs. Ques. K C App Ana Synt Eva
25min 4 3 0 0 1 0 0
%age 75% 0% 0% 25% 0% 0%

50
Table 36
Table 36 indicated that in 30 minutes class duration, the researcher observed 2
questions. 100 % of the questions were comprehension based. All the questions
asked in the class were lower order questions. The total percentage of questions
during 30 minutes was 7%.
Table 37
Table 37 indicated that in 30 minutes class duration, the researcher observed 2
questions. 50% of the questions were knowledge based and 50% were
comprehension based. Thus all of the questions asked in the class were lower
order questions. The total percentage of questions during 30 minutes was just only
7%.
Table 38
Table 38 indicated that in 30 minutes class duration, the researcher observed 4
questions. 100 % of the questions were knowledge based. All the questions asked
in the class were lower order questions. The total percentage of questions during
30 minutes was 13%.
Time No. of obs. Ques. K C App Ana Synt Eva
30min 2 0 2 0 0 0 0
%age 0% 100% 0% 0% 0% 0%
Time No. of obs. Ques. K C App Ana Synt Eva
30min 2 1 1 0 0 0 0
%age 50% 50% 0% 0% 0% 0%
Time No. of obs. Ques. K C App Ana Synt Eva
30min 4 4 0 0 0 0 0
%age 100% 0% 0% 0% 0% 0%

51
Table 39
Table 39 indicated that in 35 minutes class duration, the researcher observed 2
questions. 50 % of the questions were comprehension based, and 50% were
application based. Thus all of the questions asked in the class were lower order
questions. The total percentage of questions during 35 minutes was 6%.
Table 40
Table 40 indicated that in 35 minutes class duration, the researcher observed 10
questions. 100 % of the questions were knowledge based. All the questions asked
in the class were lower order questions. The total percentage of questions during
35 minutes was 29%.
Table 41
Table 41 indicated that in 30 minutes class duration, the researcher observed 2
questions. 100 % of the questions were knowledge based. All the questions asked
in the class were lower order questions. The total percentage of questions during
30 minutes was 7%.
Time No. of obs. Ques. K C App Ana Synt Eva
35min 2 0 1 1 0 0 0
%age 0% 50% 50% 0% 0% 0%
Time No. of obs. Ques. K C App Ana Synt Eva
35min 10 10 0 0 0 0 0
%age 100% 0% 0% 0% 0% 0%
Time No. of obs. Ques. K C App Ana Synt Eva
30min 2 2 0 0 0 0 0
%age 100% 0% 0% 0% 0% 0%

52
Table 42
Table 42 indicated that in 35 minutes class duration, the researcher observed4
questions. 50 % of the questions were knowledge based, 25% were
comprehension based, and 25% were application based. Thus all of the questions
asked in the class were lower order questions. The total percentage of questions
during 35 minutes was just 11%.
Table 43
Table 43 indicated that in 35 minutes class duration, the researcher observed 5
questions. 60 % of the questions were knowledge based, 20% were application
based, and 20% were analysis based. Thus majority of the questions asked in the
class were lower order questions. The total percentage of questions during 35
minutes was 14%.
Table 44
Table 44 indicated that in 35 minutes class duration, the researcher observed 5
questions. 60 % of the questions were knowledge based, 20% were application
based, and 20% were analysis based. Thus majority of the questions asked in the
class were lower order questions. The total percentage of questions during 35
minutes was 14%.
Time No. of obs. Ques. K C App Ana Synt Eva
35min 4 2 1 1 0 0 0
%age 50% 25% 25% 0% 0% 0%
Time No. of obs. Ques. K C App Ana Synt Eva
35min 5 3 0 1 1 0 0
%age 60% 0% 20% 20% 0% 0%
Time No. of obs. Ques. K C App Ana Synt Eva
35min 5 3 0 1 1 0 0
%age 60% 0% 20% 20% 0% 0%

53
Table 45
Table 45 indicated that in 40 minutes class duration the researcher observed no
question. The total percentage of questions during 40 minutes was 0%.
Table 46
Table 46 indicated that in 35 minutes class duration, the researcher observed 3
questions. 67 % of the questions were knowledge based, and 50% were
application based. Thus all of the questions asked in the class were lower order
questions. The total percentage of questions during 35 minutes was 9%.
Table 47
Table 47 indicated that in 35 minutes class duration, the researcher observed 3
questions. 67% of the questions were knowledge based and 33% were
comprehension based. Thus all of the questions asked in the class were lower
order questions. The total percentage of questions during 35 minutes was just only
9%.
Time No. of obs. Ques. K C App Ana Synt Eva
40min nil 0 0 0 0 0 0
%age 0% 0% 0% 0% 0% 0%
Time No. of obs. Ques. K C App Ana Synt Eva
35min 3 2 0 1 0 0 0
%age 67% 0% 33% 0% 0% 0%
Time No. of obs. Ques. K C App Ana Synt Eva
35min 3 2 1 0 0 0 0
%age 67% 33% 0% 0% 0% 0%

54
Table 48
Table 48 indicated that in 40 minutes class duration, the researcher observed 4
questions. 75% of the questions were knowledge based and 25% were
comprehension based. Thus all of the questions asked in the class were lower
order questions. The total percentage of questions during 40 minutes was just only
10%.
Table 49
Table 49 indicated that in 35 minutes class duration, the researcher observed 3
questions. 67% of the questions were knowledge based and 33% were
comprehension based. Thus all of the questions asked in the class were lower
order questions. The total percentage of questions during 35 minutes was just only
9%.
Table 50
Table 50 indicated that in 35 minutes class duration, the researcher observed 3
questions. 67% of the questions were knowledge based and 33% were
comprehension based. Thus all of the questions asked in the class were lower
order questions. The total percentage of questions during 35 minutes was just only
9%.
Time No. of obs. Ques. K C App Ana Synt Eva
40min 4 3 1 0 0 0 0
%age 75% 25% 0% 0% 0% 0%
Time No. of obs. Ques. K C App Ana Synt Eva
35min 3 2 1 0 0 0 0
%age 67% 33% 0% 0% 0% 0%
Time No. of obs. Ques. K C App Ana Synt Eva
35min 3 2 1 0 0 0 0
%age 67% 33% 0% 0% 0% 0%

55
Table 51
Table 51 indicated that in 40 minutes class duration, the researcher observed 4
questions. 75% of the questions were knowledge based and 25% were
comprehension based. Thus all of the questions asked in the class were lower
order questions. The total percentage of questions during 40 minutes was just only
10%.
Table 52
Table 52 indicated that in 40 minutes class duration, the researcher observed 7
questions. 71% of the questions were knowledge based and 29% were
comprehension based. Thus all of the questions asked in the class were lower
order questions. The total percentage of questions during 40 minutes was just only
17.5%.
Table 53
Table 53 indicated that in 40 minutes class duration, the researcher observed 4
questions. 100 % of the questions were knowledge based. All the questions asked
in the class were lower order questions. The total percentage of questions during
40 minutes was 10%.
Time No. of obs. Ques. K C App Ana Synt Eva
40min 4 3 1 0 0 0 0
%age 75% 25% 0% 0% 0% 0%
Time No. of obs. Ques. K C App Ana Synt Eva
40min 7 5 2 0 0 0 0
%age 71% 29% 0% 0% 0% 0%
Time No. of obs. Ques. K C App Ana Synt Eva
40min 4 4 0 0 0 0 0
%age 100% 0% 0% 0% 0% 0%

56
Table 54
Table 54 indicated that in 40 minutes class duration, the researcher observed 6
questions. 83% of the questions were knowledge based and 17% were
comprehension based. Thus all of the questions asked in the class were lower
order questions. The total percentage of questions during 40 minutes was just only
15%.
Table 55
Table 55 indicated that in 40 minutes class duration, the researcher observed 9
questions. 67 % of the questions were knowledge based, 11% were
comprehension based, and 22% were application based. Thus all of the questions
asked in the class were lower order questions. The total %of questions during 40
minutes was 22.5%.
Table 56
Table 56 indicated that in 40 minutes class duration, the researcher observed 5
questions. 60 % of the questions were knowledge based, and 40% were analysis
based. Thus majority of the questions asked in the class were lower order
questions. The total percentage of questions during 40 minutes was 12.5%.
Time No. of obs. Ques. K C App Ana Synt Eva
40min 6 5 1 0 0 0 0
%age 83% 17% 0% 0% 0% 0%
Time No. of obs. Ques. K C App Ana Synt Eva
40min 9 6 1 2 0 0 0
%age 67% 11% 22% 0% 0% 0%
Time No. of obs. Ques. K C App Ana Synt Eva
40min 5 3 0 0 2 0 0
%age 60% 0% 0% 40% 0% 0%

57
Table 57
Table 57 indicated that in 40 minutes class duration, the researcher observed 5
questions. 100 % of the questions were knowledge based. All the questions asked
in the class were lower order questions. The total percentage of questions during
40 minutes was 12.5%.
Table 58
Table 58 indicated that in 40 minutes class duration, the researcher observed 6
questions. 100 % of the questions were knowledge based. All the questions asked
in the class were lower order questions. The total percentage of questions during
40 minutes was 15%.
Table 59
Table 59 indicated that in 35 minutes class duration, the researcher observed 2
questions. 50 % of the questions were knowledge based, and 50% were
application based. Thus all of the questions asked in the class were lower order
questions. The total percentage of questions during 35 minutes was 6%.
Time No. of obs. Ques. K C App Ana Synt Eva
40min 5 5 0 0 0 0 0
%age 100% 0% 0% 0% 0% 0%
Time No. of obs. Ques. K C App Ana Synt Eva
40min 6 6 0 0 0 0 0
%age 100% 0% 0% 0% 0% 0%
Time No. of obs. Ques. K C App Ana Synt Eva
35min 2 1 0 1 0 0 0
%age 50% 0% 50% 0% 0% 0%

58
Table 60
Table 60 indicated that in 35 minutes class duration, 25% of the questions were
knowledge based, 25% were comprehension based, 25% were application and
25% were analysis based. Thus most of the questions asked in the class were
lower order questions. 25% of the questions were higher order. The total
percentage of questions during 35 minutes was 11%.
Table 61
Table 61 indicated that in 35 minutes class duration, the researcher observed 6
questions. 67 % of the questions were knowledge based, 16.6% were
comprehension based, and 16.6% were application based. Thus all of the
questions asked in the class were lower order questions. The total % of questions
during 35 minutes was 17%.
Table 62
Table 62 indicated that in 35 minutes class duration, the researcher observed 7
questions. 14 % of the questions were knowledge based, 29% were application
based, 43% were analysis and 14% were synthesis based. Thus most of the
questions asked in the class were lower order questions. 14% of the questions
were higher order. The total percentage of questions during 35 minutes was 20%.
Time No. of obs. Ques. K C App Ana Synt Eva
35min 4 1 1 1 1 0 0
%age 25% 25% 25% 25% 0% 0%
Time No. of obs. Ques. K C App Ana Synt Eva
35min 6 4 1 1 0 0 0
%age 67% 16.6% 16.6% 0% 0% 0%
Time No. of obs. Ques. K C App Ana Synt Eva
35min 7 1 0 2 3 1 0
%age 14% 0% 29% 43% 14% 0%

59
Table 63
Table 63 indicated that in 35 minutes class duration, the researcher observed 3
questions. 67 % of the questions were knowledge based, and 33% were
application based. Thus all of the questions asked in the class were lower order
questions. The total percentage of questions during 35 minutes was 9%.
Table 64
Table 64 indicated that in 25 minutes class duration, the researcher observed 16
questions. 44 % of the questions were knowledge based, 25% were
comprehension based, 25% were application and 6% were analysis based. Thus
most of the questions asked in the class were lower order questions. 6% of the
questions were higher order. The total percentage of questions during 25 minutes
was 64%.
Table 65
Table 65 indicated that in 35 minutes class duration, the researcher observed 12
questions. 33 % of the questions were knowledge based, 50% were
comprehension based, and 17% were application based. Thus all of the questions
asked in the class were lower order questions. The total % of questions during 35
minutes was 34%.
Time No. of obs. Ques. K C App Ana Synt Eva
35min 3 2 0 1 0 0 0
%age 67% 0% 33% 0% 0% 0%
Time No. of obs. Ques. K C App Ana Synt Eva
25min 16 7 4 4 1 0 0
%age 44% 25% 25% 6% 0% 0%
Time No. of obs. Ques. K C App Ana Synt Eva
35min 12 4 6 2 0 0 0
%age 33% 50% 17% 0% 0% 0%

60
Table 66
Table 66 indicated that in 40 minutes class duration, 33 % of the questions were
knowledge based, 17% were comprehension based, 33% were application and
17% were analysis based. Thus most of the questions asked in the class were
lower order questions. 17% of the questions were higher order. The total
percentage of questions during 40 minutes was 15%.
Table 67
Table 67 indicated that in 35 minutes class duration, 12.5 % of the questions were
knowledge based, 25% were comprehension based, 12.5% were application and
50% were analysis based. Thus 50% of the questions asked in the class were
lower order questions and 50% of the questions were higher order. The total
percentage of questions during 35 minutes was 23%.
Table 68
Table 68 indicated that in 40 minutes class duration, 25 % of the questions were
knowledge based, 50% were comprehension based, and 25% were analysis based.
Thus most of the questions asked in the class were lower order questions. 25% of
the questions were higher order. The total percentage of questions during 40
minutes was 10%.
Time No. of obs. Ques. K C App Ana Synt Eva
40min 6 2 1 2 1 0 0
%age 33% 17% 33% 17% 0% 0%
Time No. of obs. Ques. K C App Ana Synt Eva
35min 8 1 2 1 4 0 0
%age 12.5% 25% 12.5% 50% 0% 0%
Time No. of obs. Ques. K C App Ana Synt Eva
40min 4 1 2 0 1 0 0
%age 25% 50% 0% 25% 0% 0%

61
Table 69
Table 69 indicated that in 35 minutes class duration, the researcher observed 5
questions. 40 % of the questions were comprehension based, and 60% were
application based. Thus all of the questions asked in the class were lower order
questions. The total percentage of questions during 35 minutes was 14%.
Table 70
Table 70 indicated that in 30 minutes class duration, the researcher observed 4
questions. 75 % of the questions were knowledge based, and 25% were analysis
based. Thus majority of the questions asked in the class were lower order
questions while 25% were lower order questions. The total percentage of
questions during 30 minutes was just 13%.
Table 71
Table 71 indicated that in 45 minutes class duration, the researcher observed 9
questions. 45 % of the questions were knowledge based, 11% were
comprehension based, 22% were application and 22% were analysis based. Thus
most of the questions asked in the class were lower order questions. Only 22% of
the questions were higher order. The total percentage of questions during 45
minutes was 20%.
Time No. of obs. Ques. K C App Ana Synt Eva
35min 5 0 2 3 0 0 0
%age 0% 40% 60% 0% 0% 0%
Time No. of obs. Ques. K C App Ana Synt Eva
30min 4 3 0 0 1 0 0
%age 75% 0% 0% 25% 0% 0%
Time No. of obs. Ques. K C App Ana Synt Eva
45min 9 4 1 2 2 0 0
%age 45% 11% 22% 22% 0% 0%

62
Table 72
Table 72 indicated that in 15 minutes class duration, 50 % of the questions were
knowledge based, 25% were comprehension based, and 25% were analysis based.
Thus most of the questions asked in the class were lower order questions. 25% of
the questions were higher order. The total percentage of questions during 15
minutes was 26%.
Table 73
Table 73 indicated that in 30 minutes class duration, 25 % of the questions were
knowledge based, 25% were comprehension based, 25% were application and
25% were analysis based. Thus most of the questions asked in the class were
lower order questions. Only 25% of the questions were higher order. The total
percentage of questions during 30 minutes was 13%.
Table 74
Table 74 indicated that in 40 minutes class duration, the researcher observed 3
questions. 33.3 % of the questions were knowledge based, 33.3% were
comprehension based, and 33.3% were application based. Thus all of the
questions asked in the class were lower order questions. The total percentage of
questions during 40 minutes was 6%.
Time No. of obs. Ques. K C App Ana Synt Eva
15min 4 2 0 1 1 0 0
%age 50% 0% 25% 25% 0% 0%
Time No. of obs. Ques. K C App Ana Synt Eva
30min 4 1 1 1 1 0 0
%age 25% 25% 25% 25% 0% 0%
Time No. of obs. Ques. K C App Ana Synt Eva
40min 3 1 1 1 0 0 0
%age 33.3% 33.3% 33.3% 0% 0% 0%

63
Table 75
Table 75 indicated that in 40 minutes class duration, the researcher observed 6
questions. 67 % of the questions were knowledge based, 16.6% were
comprehension based, and 16.6% were analysis based. Thus most of the questions
asked in the class were lower order questions. The total % of questions during 40
minutes was 15%.
Table 76
Table 76 indicated that in 30 minutes class duration, the researcher observed 3
questions. 33.3 % of the questions were knowledge based, 33.3% were
comprehension based, and 33.3% were analysis based. Thus most of the questions
asked in the class were lower order questions. 33.3% of the questions were higher
order. The total percentage of questions during 30 minutes was 10%.
Table 77
Table 77 indicated that in 35 minutes class duration, 50 % of the questions were
knowledge based, 33% were comprehension based, and 17% were analysis based.
Thus most of the questions asked in the class were lower order questions. 17% of
the questions were higher order. The total percentage of questions during 35
minutes was 17%.
Time No. of obs. Ques. K C App Ana Synt Eva
40min 6 4 0 1 1 0 0
%age 67% 0% 16.6% 16.6% 0% 0%
Time No. of obs. Ques. K C App Ana Synt Eva
30min 3 1 0 1 1 0 0
%age 33.3% 0% 33.3% 33.3% 0% 0%
Time No. of obs. Ques. K C App Ana Synt Eva
35min 6 3 2 0 1 0 0
%age 50% 33% 0% 17% 0% 0%

64
Table 78
Table 78 indicated that in 35 minutes class duration, the researcher observed 2
questions. 100 % of the questions were knowledge based. All the questions asked
in the class were lower order questions. The total percentage of questions during
35 minutes was 6%.
Table 79
Table 79 indicated that in 35 minutes class duration, the researcher observed 8
questions. 75 % of the questions were knowledge based, 12.5% were
comprehension based, and 12.5% were application based. Thus all of the
questions asked in the class were lower order questions. The total % of questions
during 35 minutes was 23%.
Table 80
Table 80 indicated that in 35 minutes class duration, the researcher observed 4
questions. 50 % of the questions were knowledge based, 25% were application
based, and 25% were analysis based. Thus most of the questions asked in the class
were lower order questions. 25% of the questions were higher order. The total
percentage of questions during 35 minutes was 11%.
Time No. of obs. Ques. K C App Ana Synt Eva
35min 2 2 0 0 0 0 0
%age 100% 0% 0% 0% 0% 05
Time No. of obs. Ques. K C App Ana Synt Eva
35min 8 6 1 1 0 0 0
%age 75% 12.5% 12.5% 0% 0% 0%
Time No. of obs. Ques. K C App Ana Synt Eva
35min 4 2 0 1 1 0 0
%age 50% 0% 25% 25% 0% 0%

65
Table 81
Table 81 indicated that in 35 minutes class duration, the researcher observed 6
questions. 50% of the questions were knowledge based and 50% were
comprehension based. Thus all of the questions asked in the class were lower
order questions. The total percentage of questions during 35 minutes was just only
17%.
Table 82
Table 82 indicated that in 35 minutes class duration, the researcher observed 4
questions. 50% of the questions were knowledge based and 50% were analysis
based. 50% of the questions asked in the class were lower order and 50% were
higher order questions. The total percentage of questions during 35 minutes was
just only 11%.
Table 83
Table 83 indicated that in 35 minutes class duration, the researcher observed 10
questions. 70 % of the questions were knowledge based, 10% were
comprehension based, 10% were application and 10% were analysis based. Thus
most of the questions asked in the class were lower order questions. Only 10% of
the questions were higher order. The total percentage of questions during 35
minutes was 29%.
Time No. of obs. Ques. K C App Ana Synt Eva
35min 6 3 3 0 0 0 0
%age 50% 50% 0% 0% 0% 0%
Time No. of obs. Ques. K C App Ana Synt Eva
35min 4 2 0 0 2 0 0
%age 50% 0% 0% 50% 0% 0%
Time No. of obs. Ques. K C App Ana Synt Eva
35min 10 7 1 1 1 0 0
%age 70% 10% 10% 10% 0% 0%

66
Table 84
Table 84 indicated that in 40 minutes class duration, 40 % of the questions were
knowledge based, 30% were comprehension based, 20% were application and
10% were synthesis based. Thus most of the questions asked in the class were
lower order questions. Only 10% of the questions were higher order. The total
percentage of questions during 40 minutes was 25%.
Table 85
Table 85 indicated that in 30 minutes class duration, 40 % of the questions were
knowledge based, 40% were comprehension based, and 20% were analysis based.
Thus most of the questions asked in the class were lower order questions. Only
20% of the questions were higher order. The total percentage of questions during
30 minutes was 17%.
Table 86
Table 86 indicated that in 25 minutes class duration, 55% of the questions were
knowledge based and 45% were comprehension based. Thus all of the questions
asked in the class were lower order questions. The total percentage of questions
during 25 minutes was 44%.
Time No. of obs. Ques. K C App Ana Synt Eva
40min 10 4 3 2 0 1 0
%age 40% 30% 20% 0% 10% 0%
Time No. of obs. Ques. K C App Ana Synt Eva
30min 5 2 2 0 1 0 0
%age 40% 40% 0% 20% 0% 0%
Time No. of obs. Ques. K C App Ana Synt Eva
25min 11 6 5 0 0 0 0
%age 55% 45% 0% 0% 0% 0%

67
Table 87
Table 87 indicated that in 35 minutes class duration, 25 % of the questions were
knowledge based, 50% were comprehension based, and 25% were application
based. Thus all of the questions asked in the class were lower order questions. The
total % of questions during 35 minutes was 23%.
Table 88
Table 88 indicated that in 40 minutes class duration, 23.5 % of the questions were
knowledge based, 29% were comprehension based, 17.6% were application, 12%
were analysis based, 6% were synthesis based and 12% were evaluation based.
Thus most of the questions asked in the class were lower order questions and 30%
of the questions were higher order. The total percentage of questions during 40
minutes was 43%.
Table 89
Table 89 indicated that in 30 minutes class duration, the researcher observed 9
questions. 89% of the questions were knowledge based and 11% were
comprehension based. Thus all of the questions asked in the class were lower
order questions. The total percentage of questions during 30 minutes was 30%.
Time No. of obs. Ques. K C App Ana Synt Eva
35min 8 2 4 2 0 0 0
%age 25% 50% 25% 0% 0% 0%
Time No. of obs. Ques. K C App Ana Synt Eva
40min 17 4 5 3 2 1 2
%age 23.5% 29% 17.6% 12% 6% 12%
Time No. of obs. Ques. K C App Ana Synt Eva
30min 9 8 1 0 0 0 0
%age 89% 11% 0% 0% 0% 0%

68
Table 90
Table 90 indicated that in 40 minutes class duration, the researcher observed 3
questions. 100 % of the questions were knowledge based. All the questions asked
in the class were lower order questions. The total percentage of questions during
40 minutes was 8%.
Table 91
Table 91 indicated that in 30 minutes class duration, the researcher observed 4
questions. 50 % of the questions were knowledge based, and 50% were
application based. Thus all of the questions asked in the class were lower order
questions. The total percentage of questions during 30 minutes was 47%.
Table 92
Table 92 indicated that in 25 minutes class duration, the researcher observed 12
questions. 50 % of the questions were knowledge based, 25% were
comprehension based, 17% were analysis and 8% were synthesis based. Thus
most of the questions asked in the class were lower order questions. Only 25% of
the questions were higher order. The total percentage of questions during 25
minutes was 48%.
Time No. of obs. Ques. K C App Ana Synt Eva
40min 3 3 0 0 0 0 0
%age 100% 0% 0% 0% 0% 0%
Time No. of obs. Ques. K C App Ana Synt Eva
30min 4 2 0 2 0 0 0
%age 50% 0% 50% 0% 0% 0%
Time No. of obs. Ques. K C App Ana Synt Eva
25min 12 6 3 0 2 1 0
%age 50% 25% 0% 17% 8% 0%

69
Table 93
Table 93 indicated that in 20 minutes class duration, not a single question was
asked.
Table 94
Table 94 indicated that in 35 minutes class duration, the researcher observed 7
questions. 57% of the questions were knowledge based and 43% were
comprehension based. Thus all of the questions asked in the class were lower
order questions. The total percentage of questions during 35 minutes was just only
20%.
Table 95
Table 95 indicated that in 35 minutes class duration, the researcher observed 15
questions. 40 % of the questions were knowledge based, 20% were
comprehension based, 20% were application, 13% were synthesis based and 7%
were evaluation based. Thus most of the questions asked in the class were lower
order questions and 20% of the questions were higher order. The total percentage
of questions during 35 minutes was 43%.
Time No. of obs. Ques. K C App Ana Synt Eva
20min Nil 0 0 0 0 0 0
%age 0% 0% 0% 0% 0% 0%
Time No. of obs. Ques. K C App Ana Synt Eva
35min 7 4 3 0 0 0 0
%age 57% 43% 0% 0% 0% 0%
Time No. of obs. Ques. K C App Ana Synt Eva
35min 15 6 3 3 0 2 1
%age 40% 20% 20% 0% 13% 7%

70
Table 96
Table 96 indicated that in 40 minutes class duration, the researcher observed 20
questions. 55 % of the questions were knowledge based, 15% were
comprehension based, 5% were application, 15% were analysis based, and 10%
were evaluation based. Thus most of the questions asked in the class were lower
order questions and 25% of the questions were higher order. The total percentage
of questions during 40 minutes was 50%.
Table 97
Table 97 indicated that in 30 minutes class duration, the researcher observed 6
questions. 33 % of the questions were knowledge based, 50% were
comprehension based, and 17% were application based. Thus all of the questions
asked in the class were lower order questions. The total % of questions during 30
minutes was 20%.
Table 98
Table 98 indicated that in 20 minutes class duration, the researcher observed 3
questions. 100 % of the questions were knowledge based. All the questions asked
in the class were lower order questions. The total percentage of questions during
20 minutes was 15%.
Time No. of obs. Ques. K C App Ana Synt Eva
40min 20 11 3 1 3 0 2
%age 55% 15% 5% 15% 0% 10%
Time No. of obs. Ques. K C App Ana Synt Eva
30min 6 2 3 1 0 0 0
%age 33% 50% 17% 0% 0% 0%
Time No. of obs. Ques. K C App Ana Synt Eva
20min 3 3 0 0 0 0 0
%age 100% 0% 0% 0% 0% 0%

71
Table 99
Table 99 indicated that in 35 minutes class duration, the researcher observed 13
questions. 46 % of the questions were knowledge based, 46% were
comprehension based, and 8% were synthesis based. Thus most of the questions
asked in the class were lower order questions. Only 8% of the questions were
higher order. The total percentage of questions during 35 minutes was 37%.
Table 100
Table 100 indicated that in 35 minutes class duration, the researcher observed 18
questions. 39 % of the questions were knowledge based, 22% were
comprehension based, 22% were application, 11% were analysis based, and 6%
were evaluation based. Thus most of the questions asked in the class were lower
order questions and 17% of the questions were higher order. The total percentage
of questions during 35 minutes was 51%.
Table 101
Table 101 indicated that in 40 minutes class duration, the researcher observed 8
questions. 25 % of the questions were knowledge based, 13% were
comprehension based, and 65% were application based. Thus all of the questions
asked in the class were lower order questions. The total %of questions during 40
minutes was 20%.
Time No. of obs. Ques. K C App Ana Synt Eva
35min 13 6 6 0 0 1 0
%age 46% 46% 0% 0% 8% 0%
Time No. of obs. Ques. K C App Ana Synt Eva
35min 18 7 4 4 2 0 1
%age 39% 22% 22% 11% 0% 6%
Time No. of obs. Ques. K C App Ana Synt Eva
40min 8 2 1 5 0 0 0
%age 25% 13% 62% 0% 0% 0%

72
Table 102
Table 102 indicated that in 40 minutes class duration, the researcher observed 12
questions. 67 % of the questions were knowledge based, 17% were
comprehension based, 8% were application and 8% were analysis based. Thus
most of the questions asked in the class were lower order questions. Only 8% of
the questions were higher order. The total percentage of questions during 40
minutes was 30%.
Table 103
Table 103 indicated that in 35 minutes class duration, 40 % of the questions were
knowledge based, 50% were comprehension based, and 10% were application
based. Thus most of the questions asked in the class were lower order questions.
Only 10% of the questions were higher order. The total percentage of questions
during 35 minutes was 29%.
Table 104
Table 104 indicated that in 30 minutes class duration, the researcher observed 4
questions. 75% of the questions were knowledge based and 25% were
comprehension based. Thus all of the questions asked in the class were lower
order questions. The total percentage of questions during 30 minutes was just only
13%.
Time No. of obs. Ques. K C App Ana Synt Eva
40min 12 8 2 1 1 0 0
%age 67% 17% 8% 8% 0% 0%
Time No. of obs. Ques. K C App Ana Synt Eva
35min 10 4 5 0 1 0 0
%age 40% 50% 0% 10% 0% 0%
Time No. of obs. Ques. K C App Ana Synt Eva
30min 4 3 1 0 0 0 0
%age 75% 25% 0% 0% 0% 0%

73
Table 105
Table 105 indicated that in 40 minutes class duration, the researcher observed 10
questions. 60% of the questions were knowledge based and 40% were
comprehension based. Thus all of the questions asked in the class were lower
order questions. The total percentage of questions during 40 minutes was just only
25%.
Table 106
Table 106 indicated that in 25 minutes class duration, 50 % of the questions were
knowledge based, 25% were application based, and 25% were analysis based.
Thus most of the questions asked in the class were lower order questions. Only
25% of the questions were higher order. The total percentage of questions during
25 minutes was just 16%.
Table 10 7
Table 107 indicated that in 35 minutes class duration, the researcher observed 6
questions. 50% of the questions were knowledge based, 16.6% were
comprehension based, 16.6% were application, and 16.6% were synthesis based.
Thus most of the questions asked in the class were lower order questions and
16.6% of the questions were higher order. The total percentage of questions
during 35 minutes was 17%.
Time No. of obs. Ques. K C App Ana Synt Eva
40min 10 6 4 0 0 0 0
%age 60% 40% 0% 0% 0% 0%
Time No. of obs. Ques. K C App Ana Synt Eva
25min 4 2 0 1 1 0 0
%age 50% 0% 25% 25% 0% 0%
Time No. of obs. Ques. K C App Ana Synt Eva
35min 6 3 1 1 0 1 0
%age 50% 16.6% 16.6% 0% 16.6% 0%

74
Table 108
Table 108 indicated that in 35 minutes class duration, 50 % of the questions were
knowledge based, 25% were comprehension based, and 25% were application
based. Thus all of the questions asked in the class were lower order questions. The
total % of questions during 25 minutes was 11%.
Table 109
Table 109 indicated that in 40 minutes class duration, 40 % of the questions were
knowledge based, 40% were comprehension based, and 20% were application
based. Thus all of the questions asked in the class were lower order questions. The
total %of questions during 40 minutes was 13%.
Table 110
Table 110 indicated that in 45 minutes class duration, the researcher observed 10
questions. 40 % of the questions were knowledge based, 20% were
comprehension based, 20% were application, 10% were analysis based, and 10%
were evaluation based. Thus most of the questions asked in the class were lower
order questions and 17% of the questions were higher order. The total percentage
of questions during 45 minutes was 22%.
Time No. of obs. Ques. K C App Ana Synt Eva
35min 4 2 1 1 0 0 0
%age 50% 25% 25% 0% 0% 0%
Time No. of obs. Ques. K C App Ana Synt Eva
40min 5 2 2 1 0 0 0
%age 40% 40% 20% 0% 0% 0%
Time No. of obs. Ques. K C App Ana Synt Eva
45min 10 4 2 2 1 0 1
%age 40% 20% 20% 10% 0% 10%

75
Table 111
Table 111 indicated that in 30 minutes class duration, the researcher observed 2
questions. 100 % of the questions were comprehension based. All the questions
asked in the class were lower order questions. The total percentage of questions
during 30 minutes was 7%.
Table 112
Table 112 indicated that in 30 minutes class duration, the researcher observed 2
questions. 100 % of the questions were comprehension based. All the questions
asked in the class were lower order questions. The total percentage of questions
during 30 minutes was 7%.
Table 113
Table 113 indicated that in 45 minutes class duration, the researcher observed 4
questions. 75% of the questions were knowledge based and 25% were
comprehension based. Thus all of the questions asked in the class were lower
order questions. The total percentage of questions during 40 minutes was just only
9%.
Time No. of obs. Ques. K C App Ana Synt Eva
30min 2 0 2 0 0 0 0
%age 0% 100% 0% 0% 0% 0%
Time No. of obs. Ques. K C App Ana Synt Eva
30min 2 0 2 0 0 0 0
%age 0% 100% 0% 0% 0% 0%
Time No. of obs. Ques. K C App Ana Synt Eva
45min 4 3 1 0 0 0 0
%age 75% 25%

76
Table 114
Table 114 indicated that in 40 minutes class duration, the researcher observed 4
questions. 50% of the questions were knowledge based and 50% were
comprehension based. Thus all of the questions asked in the class were lower
order questions. The total percentage of questions during 40 minutes was just only
10%.
Table 115
Table 115 indicated that in 45 minutes class duration, the researcher observed 10
questions. 60% of the questions were knowledge based and 40% were
comprehension based. Thus all of the questions asked in the class were lower
order questions. The total percentage of questions during 40 minutes was just only
22%.
Table 116
Table 116 indicated that in 30 minutes class duration, the researcher observed 15
questions. 40% of the questions were knowledge based, 47% were comprehension
based, and 13% were analysis based. Thus most of the questions asked in the class
were lower order questions and 13% of the questions were higher order. The total
percentage of questions during 30 minutes was 50%.
Time No. of obs. Ques. K C App Ana Synt Eva
40min 4 2 2 0 0 0 0
%age 50% 50% 0% 0% 0% 0%
Time No. of obs. Ques. K C App Ana Synt Eva
45min 10 6 4 0 0 0 0
%age 60% 40% 0% 0% 0% 0%
Time No. of obs. Ques. K C App Ana Synt Eva
30min 15 6 7 0 2 0 0
%age 40% 47% 0% 13% 0% 0%

77
Table 117
Table 117 indicated that in 40 minutes class duration, the researcher observed 5
questions. 40% of the questions were knowledge based and 60% were
comprehension based. Thus all of the questions asked in the class were lower
order questions. The total percentage of questions during 40 minutes was just only
13%.
Table 118
Table 118 indicated that in 35 minutes class duration, the researcher observed 12
questions. 67% of the questions were knowledge based and 33% were
comprehension based. Thus all of the questions asked in the class were lower
order questions. The total percentage of questions during 40 minutes was just only
34%.
Table 119
Table 119 indicated that in 45 minutes class duration, the researcher observed 8
questions. 425% of the questions were knowledge based, 50% were
comprehension based, and 25% were application based. Thus all of the questions
asked in the class were lower order questions. The total % of questions during 40
minutes was 18%.
Time No. of obs. Ques. K C App Ana Synt Eva
40min 5 2 3 0 0 0 0
%age 40% 60% 0% 0% 0% 0%
Time No. of obs. Ques. K C App Ana Synt Eva
35min 12 8 4 0 0 0 0
%age 67% 33% 0% 0% 0% 0%
Time No. of obs. Ques. K C App Ana Synt Eva
45min 8 2 4 2 0 0 0
%age 25% 50% 25% 0% 0% 0%

78
Table 120
Table 120 indicated that in 45 minutes class duration, the researcher observed 5
questions. 20 % of the questions were knowledge based, 60% were
comprehension based, and 20% were application based. Thus all of the questions
asked in the class were lower order questions. The total % of questions during 45
minutes was 11%.
Table 121
Table 121 indicated that in 45 minutes class duration, 50 % of the questions were
knowledge based, 16.6% were application based, 16.6% were analysis, and 16.6%
were synthesis based. Thus most of the questions asked in the class were lower
order questions and 33% of the questions were higher order. The total percentage
of questions during 45 minutes was 13%.
Table 122
Table 122 indicated that in 45 minutes class duration, the researcher observed 6
questions. 50% of the questions were knowledge based, 47% were application
based, and 13% were analysis based. Thus most of the questions asked in the class
were lower order questions and 17% of the questions were higher order. The total
percentage of questions during 45 minutes was 13%.
Time No. of obs. Ques. K C App Ana Synt Eva
45min 5 1 3 1 0 0 0
%age 20% 60% 20% 0% 0% 0%
Time No. of obs. Ques. K C App Ana Synt Eva
45min 6 3 0 1 1 1 0
%age 50% 0% 16.6% 16.6% 16.6% 0%
Time No. of obs. Ques. K C App Ana Synt Eva
45min 6 3 0 2 1 0 0
%age 50% 0% 33% 17% 0% 0%

79
Table 123
Table 123 indicated that in 25 minutes class duration, the researcher observed 4
questions. 50% of the questions were knowledge based, 25% were comprehension
based, and 25% were analysis based. Thus most of the questions asked in the class
were lower order questions and 25% of the questions were higher order. The total
percentage of questions during 25 minutes was 16%.
Table 124
Table 124 indicated that in 20 minutes class duration, the researcher observed 8
questions. 62.5 % of the questions were knowledge based, 25% were
comprehension based, and 12.5% were application based. Thus all of the
questions asked in the class were lower order questions. The total % of questions
during 20 minutes was 40%.
Table 125
Table 125 indicated that in 30 minutes class duration, the researcher observed 3
questions. 100 % of the questions were knowledge based. All the questions asked
in the class were lower order questions. The total percentage of questions during
20 minutes was 10%.
Time No. of obs. Ques. K C App Ana Synt Eva
25min 4 2 0 1 1 0 0
%age 50% 0% 25% 25% 0% 0%
Time No. of obs. Ques. K C App Ana Synt Eva
20min 8 5 2 1 0 0 0
%age 62.5% 25% 12.5% 0% 0% 0%
Time No. of obs. Ques. K C App Ana Synt Eva
30min 3 3 0 0 0 0 0
%age 100% 0% 0% 0% 0% 0%

80
Table 126
Table 126 indicated that in 25 minutes class duration, the researcher observed 3
questions. 33% of the questions were knowledge based and 67% were
comprehension based. Thus all of the questions asked in the class were lower
order questions. The total percentage of questions during 25 minutes was just only
12%.
Table 127
Table 127 indicated that in 35 minutes class duration, the researcher observed 2
questions. 50% of the questions were comprehension based, and 50% were
analysis based. Thus 50% of the questions asked in the class were lower order
questions and 50% of the questions were higher order. The total percentage of
questions during 25 minutes was 6%.
Table 128
Table 128 indicated that in 30 minutes class duration, the researcher observed 2
questions. 100 % of the questions were knowledge based. All the questions asked
in the class were lower order questions. The total percentage of questions during
30 minutes was 7%.
Time No. of obs. Ques. K C App Ana Synt Eva
25min 3 1 2 0 0 0 0
%age 33% 67% 0% 0% 0% 0%
Time No. of obs. Ques. K C App Ana Synt Eva
35min 2 0 1 0 1 0 0
%age 0% 50% 0% 50% 0% 0%
Time No. of obs. Ques. K C App Ana Synt Eva
30min 2 2 0 0 0 0 0
%age 100% 0% 0% 0% 0% 0%

81
Table 129
Table 128 indicated that in 35 minutes class duration, the researcher observed 11
questions. 46% of the questions were knowledge based, 18% were comprehension
based, 18% were application, and 18% were analysis based. Thus most of the
questions asked in the class were lower order questions and 18% of the questions
were higher order. The total percentage of questions during 35 minutes was 31%.
Table 130
Table 130 indicated that in 30 minutes class duration, 10% of the questions were
knowledge based, 40% were comprehension based, 20% were application, and
30% were analysis based. Thus most of the questions asked in the class were
lower order questions and 30% of the questions were higher order. The total
percentage of questions during 30 minutes was 33%.
Table 131
Table 131 indicated that in 40 minutes class duration, the researcher observed 4
questions. 50% of the questions were knowledge based and 50% were
comprehension based. Thus all of the questions asked in the class were lower
order questions. The total percentage of questions during 40 minutes was just only
10%.
Time No. of obs. Ques. K C App Ana Synt Eva
35min 11 5 2 2 2 0 0
%age 46% 18% 18% 18% 0% 0%
Time No. of obs. Ques. K C App Ana Synt Eva
30min 10 1 4 2 3 0 0
%age 10% 40% 20% 30% 0% 0%
Time No. of obs. Ques. K C App Ana Synt Eva
40min 4 2 2 0 0 0 0
%age 50% 50% 0% 0% 0% 0%

82
Table 132
Table 132 indicated that in 45 minutes class duration, the researcher observed 4
questions. 75% of the questions were knowledge based, and 25% were analysis
based. Thus 75% of the questions asked in the class were lower order questions
and 25% of the questions were higher order. The total % of questions during 45
minutes was 9%.
Table 133
Table 133 indicated that in 35 minutes class duration, 17% of the questions were
knowledge based, 33% were comprehension based, 17% were application, and
33% were analysis based. Thus most of the questions asked in the class were
lower order questions and 33% of the questions were higher order. The total
percentage of questions during 35 minutes was 17%.
TABLE 134
Table 134 indicated that in 40 minutes class duration, the researcher observed 4
questions. 50% of the questions were knowledge based, 25% were comprehension
based, and 25% were analysis based. Thus most of the questions asked in the class
were lower order questions and 25% of the questions were higher order. The total
percentage of questions during 40 minutes was 10%.
Time No. of obs. Ques. K C App Ana Synt Eva
45min 4 3 0 0 1 0 0
%age 75% 0% 0% 25% 0% 0%
Time No. of obs. Ques. K C App Ana Synt Eva
35min 6 1 2 1 2 0 0
%age 17% 33% 17% 33% 0% 0%
Time No. of obs. Ques. K C App Ana Synt Eva
40min 4 2 1 0 1 0 0
%age 50% 25% 0% 25% 0% 0%

83
Table 135
Table 135 indicated that in 40 minutes class duration, the researcher observed 14
questions. 57 % of the questions were knowledge based, 36% were
comprehension based, and 7% were application based. Thus all of the questions
asked in the class were lower order questions. The total % of questions during 40
minutes was 35%.
Table 136
Table 136 indicated that in 45 minutes class duration, the researcher observed 13
questions. 31% of the questions were knowledge based and 69% were
comprehension based. Thus all of the questions asked in the class were lower
order questions. The total percentage of questions during 45 minutes was just only
29%.
Table 137
Table 137 indicated that in 40 minutes class duration, the researcher observed 5
questions. 80% of the questions were knowledge based and 20% were
comprehension based. Thus all of the questions asked in the class were lower
order questions. The total percentage of questions during 40 minutes was just only
13%.
Time No. of obs. Ques. K C App Ana Synt Eva
40min 14 8 5 1 0 0 0
%age 57% 36% 7% 0% 0% 0%
Time No. of obs. Ques. K C App Ana Synt Eva
45min 13 4 9 0 0 0 0
%age 31% 69% 0% 0% 0% 0%
Time No. of obs. Ques. K C App Ana Synt Eva
40min 5 4 1 0 0 0 0
%age 80% 20% 0% 0% 0% 0%

84
Table 138
Table 138 indicated that in 25 minutes class duration, the researcher observed 5
questions. 20 % of the questions were knowledge based, 20% were
comprehension based, and 60% were application based. Thus all of the questions
asked in the class were lower order questions. The total % of questions during 25
minutes was 20%.
Table 139
Table 139 indicated that in 45 minutes class duration, the researcher observed 19
questions. 37% of the questions were knowledge based, 32% were comprehension
based, 26% were application, and 5% were analysis based. Thus most of the
questions asked in the class were lower order questions and 5% of the questions
were higher order. The total percentage of questions during 45 minutes was 42%.
Table 140
Table 140 indicated that in 25 minutes class duration, the researcher observed 3
questions. 67% of the questions were knowledge based and 33% were
comprehension based. Thus all of the questions asked in the class were lower
order questions. The total percentage of questions during 25 minutes was just only
12%.
Time No. of obs. Ques. K C App Ana Synt Eva
25min 5 1 1 3 0 0 0
%age 20% 20% 60% 0% 0% 0%
Time No. of obs. Ques. K C App Ana Synt Eva
45min 19 7 6 5 1 0 0
%age 37% 32% 26% 5% 0% 0%
Time No. of obs. Ques. K C App Ana Synt Eva
25min 3 2 1 0 0 0 0
%age 67% 33% 0% 0% 0% 0%

85
Table 141
Table 141 indicated that in 40 minutes class duration, the researcher observed 9
questions. 56 % of the questions were knowledge based, 22% were
comprehension based, and 22% were application based. Thus all of the questions
asked in the class were lower order questions. The total% of questions during 40
minutes was 23%.
Table 142
Table 142 indicated that in 35 minutes class duration, the researcher observed 3
questions. 33.3% of the questions were knowledge based, 33.3% were
comprehension based, and 33.3% were analysis based. Thus most of the questions
asked in the class were lower order questions and 33.3% of the questions were
higher order. The total percentage of questions during 35 minutes was 9%.
Table 143
Table 143 indicated that in 25 minutes class duration, the researcher observed 4
questions. 25% of the questions were knowledge based, 25% were application
based, and 50% were analysis based. Thus m50% of the questions asked in the
class were lower order questions and 50% of the questions were higher order. The
total percentage of questions during 25 minutes was 16%.
Time No. of obs. Ques. K C App Ana Synt Eva
40min 9 5 2 2 0 0 0
%age 56% 22% 22% 0% 05 0%
Time No. of obs. Ques. K C App Ana Synt Eva
35min 3 1 1 0 1 0 0
%age 33.3% 33.3% 0% 33.3% O% 0%
Time No. of obs. Ques. K C App Ana Synt Eva
25min 4 1 0 1 2 0 0
%age 25% 0% 25% 50% 0% 0%

86
Table 144
Table 144 indicated that in 45 minutes class duration, the researcher observed 3
questions. 67 % of the questions were knowledge based, and 33% were
application based. Thus all of the questions asked in the class were lower order
questions. The total percentage of questions during 45 minutes was 7%.
Table 145
\Table 145 indicated that in 45 minutes class duration, the researcher observed 4
questions. 75% of the questions were knowledge based and 25% were
comprehension based. Thus all of the questions asked in the class were lower
order questions. The total percentage of questions during 25 minutes was just only
12%.
Table 146
Table 146 indicated that in 45 minutes class duration, the researcher observed 4
questions. 75 % of the questions were knowledge based, and 25% were
application based. Thus all of the questions asked in the class were lower order
questions. The total percentage of questions during 45 minutes was 9%.
Time No. of obs. Ques. K C App Ana Synt Eva
45min 3 2 0 1 0 0 0
%age 67% 0% 33% 0% 0% 0%
Time No. of obs. Ques. K C App Ana Synt Eva
45min 4 3 1 0 0 0 0
%age 75% 25% 0% 0% 0% 0%
Time No. of obs. Ques. K C App Ana Synt Eva
45min 4 3 0 1 0 0 0
%age 75% 0% 25% 0% 0% 0%

87
Table 147
Table 147 indicated that in 40 minutes class duration, the researcher observed 8
questions. 50 % of the questions were knowledge based, 38% were
comprehension based, and 12% were application based. Thus all of the questions
asked in the class were lower order questions. The total percentage of questions
during 40 minutes was 20%.
Table 148
Table 148 indicated that in 35 minutes class duration, the researcher observed 7
questions. 100 % of the questions were knowledge based. All the questions asked
in the class were lower order questions. The total percentage of questions during
35 minutes was 20%.
Table 149
Table 149 indicated that in 35 minutes class duration, the researcher observed 19
questions. 89% of the questions were knowledge based and 11% were
comprehension based. Thus all of the questions asked in the class were lower
order questions. The total percentage of questions during 35 minutes was 54%.
Time No. of obs. Ques. K C App Ana Synt Eva
40min 8 4 3 1 0 0 0
%age 50% 38% 12% 0% 0% 0%
Time No. of obs. Ques. K C App Ana Synt Eva
35min 7 7 0 0 0 0 0
%age 100% 0% 0% 0% 0% 0%
Time No. of obs. Ques. K C App Ana Synt Eva
35min 19 17 2 0 0 0 0
%age 89% 11% 0% 0% 0% 0%

88
Table 150
Table 150 indicated that in 25 minutes class duration, the researcher observed 2
questions. 50 % of the questions were knowledge based, and 50% were analysis
based. Thus 50% of the questions asked in the class were lower order questions,
and 50% were higher order. The total percentage of questions during 25 minutes
was 8%.
Table 151
Table 151 indicated that in 25 minutes class duration, the researcher observed 3
questions. 67 % of the questions were knowledge based, and 33% were
application based. Thus all of the questions asked in the class were lower order
questions. The total percentage of questions during 25 minutes was 12%.
Table 152
Table 152 indicated that in 25 minutes class duration, the researcher observed 3
questions. 100 % of the questions were knowledge based. All the questions asked
in the class were lower order questions. The total percentage of questions during
25 minutes was 12%.
Time No. of obs. Ques. K C App Ana Synt Eva
25min 2 1 0 0 1 0 0
%age 50% 0% 0% 50% 0% 0%
Time No. of obs. Ques. K C App Ana Synt Eva
25min 3 2 0 1 0 0 0
%age 67% 0% 33% 0% 0% 0%
Time No. of obs. Ques. K C App Ana Synt Eva
25min 3 3 0 0 0 0 0
%age 100% 0% 0% 0% 0% 0%

89
Table 153
Table 153 indicated that in 35 minutes class duration, the researcher observed 3
questions. 33 % of the questions were knowledge based, and 67% were analysis
based. Thus 33% of the questions asked in the class were lower order questions,
and 67% were higher order. The total percentage of questions during 25 minutes
was 9%.
Table 154
Table 154 indicated that in 20 minutes class duration, the researcher observed 4
questions. 75 % of the questions were comprehension based, and 25% were
application based. Thus all of the questions asked in the class were lower order
questions. The total percentage of questions during 20 minutes was 20%.
Table 155
Table 155 indicated that in 30 minutes class duration, the researcher observed 4
questions. 50% of the questions were comprehension based, 25% were application
based, and 25% were analysis based. Thus majority of the questions asked in the
class were lower order questions while 25% of the questions were higher order.
The total percentage of questions during 30 minutes was 13%.
Time No. of obs. Ques. K C App Ana Synt Eva
35min 3 1 0 0 2 0 0
%age 33% 0% 0% 67% 0% 0%
Time No. of obs. Ques. K C App Ana Synt Eva
20min 4 0 3 1 0 0 0
%age 0% 75% 25% 0% 0% 0%
Time No. of obs. Ques. K C App Ana Synt Eva
30min 4 0 2 1 1 0 0
%age 0% 50% 25% 25% 0% 0%

90
Table 156
Table 156 indicated that in 30 minutes class duration, the researcher observed 6
questions. 50% of the questions were knowledge based, 33% were comprehension
based, and 17% were analysis based. Thus most of the questions asked in the class
were lower order questions only 17% of the questions were higher order. The total
percentage of questions during 30 minutes was 20%.
Table 157
Table 157 indicated that in 20 minutes class duration, the researcher observed 3
questions. 100 % of the questions were knowledge based. All the questions asked
in the class were lower order questions. The total percentage of questions during
25 minutes was 15%.
Table 158
Table 158 indicated that in 40 minutes class duration, the researcher observed 3
questions. 67 % of the questions were knowledge based, and 33% were synthesis
based. Thus majority of the questions asked in the class were lower order
questions, and 33% were higher order. The total % of questions during 25 minutes
was 8%.
Time No. of obs. Ques. K C App Ana Synt Eva
30min 6 3 2 0 1 0 0
%age 50% 33% 0% 17% 0% 0%
Time No. of obs. Ques. K C App Ana Synt Eva
20min 3 3 0 0 0 0 0
%age 100% 0% 0% 0% 0% 0%
Time No. of obs. Ques. K C App Ana Synt Eva
40min 3 2 0 0 0 1 0
%age 67% 0% 0% 0% 33% 0%

91
Table 159
Table 159 indicated that in 35 minutes class duration, the researcher observed 3
questions. 67 % of the questions were knowledge based, and 33% were
application based. Thus all of the questions asked in the class were lower order
questions. The total percentage of questions during 35 minutes was just only 9%.
Table 160
Table 160 indicated that in 45 minutes class duration, the researcher observed 3
questions. 100 % of the questions were knowledge based. All the questions asked
in the class were lower order questions. The total percentage of questions during
45 minutes was just only7%.
Table 161
Table 161 indicated that in 30 minutes class duration, the researcher observed 4
questions. 50% of the questions were comprehension based, 25% were application
based, and 25% were analysis based. Thus most of the questions asked in the class
were lower order questions. Only 25% of the questions were higher order. The
total percentage of questions during 30 minutes was 13%.
Time No. of obs. Ques. K C App Ana Synt Eva
35min 3 2 0 1 0 0 0
%age 67% 0% 33% 0% 0% 0%
Time No. of obs. Ques. K C App Ana Synt Eva
45min 3 3 0 0 0 0 0
%age 100% 0% 0% 0% 0% 0%
Time No. of obs. Ques. K C App Ana Synt Eva
30min 4 0 2 1 1 0 0
%age 0% 50% 25% 25% 0% 0%

92
Table 162
Table 162 indicated that in 25 minutes class duration, the researcher observed 4
questions. 25% of the questions were knowledge based and 75% were
comprehension based. Thus all of the questions asked in the class were lower
order questions. The total percentage of questions during 25 minutes was 16%.
Table 163
Table 163 indicated that in 30 minutes class duration, the researcher observed 3
questions. 33% of the questions were knowledge based and 67% were
comprehension based. Thus all of the questions asked in the class were lower
order questions. The total percentage of questions during 30 minutes was 10%.
Table 164
Table 164 indicated that in 35 minutes class duration, the researcher observed 3
questions. 67% of the questions were knowledge based and 33% were
comprehension based. Thus all of the questions asked in the class were lower
order questions. The total percentage of questions during 35 minutes was 9%.
Time No. of obs. Ques. K C App Ana Synt Eva
25min 4 1 3 0 0 0 0
%age 25% 75% 0% 0% 0% 0%
Time No. of obs. Ques. K C App Ana Synt Eva
30min 3 1 2 0 0 0 0
%age 33% 67% 0% 0% 0% 0%
Time No. of obs. Ques. K C App Ana Synt Eva
35min 3 2 1 0 0 0 0
%age 67% 33% 0% 0% 0% 0%

93
Table 165
Table 165 indicated that in 35 minutes class duration, the researcher observed 3
questions. 67 % of the questions were comprehension based, and 33% were
application based. Thus all of the questions asked in the class were lower order
questions. The total percentage of questions during 35 minutes was 9%.
Table 166
Table 166 indicated that in 35 minutes class duration, the researcher observed 3
questions. 33.3% of the questions were knowledge based, 33.3% were
comprehension based, and 33.3% were analysis based. Thus most of the questions
asked in the class were lower order questions only while 33.3% of the questions
were higher order. The total percentage of questions during 35 minutes was 9%.
Table 167
Table 167 indicated that in 35 minutes class duration, the researcher observed 3
questions. 67 % of the questions were knowledge based, and 33% were analysis
based. Thus majority of the questions asked in the class were lower order
questions, and 33% were higher order. The total % of questions during 35 minutes
was 9%.
Time No. of obs. Ques. K C App Ana Synt Eva
35min 3 0 2 1 0 0 0
%age 0% 67% 33% 0% 0% 0%
Time No. of obs. Ques. K C App Ana Synt Eva
35min 3 1 1 0 1 0 0
%age 33.3% 33.3% 0% 33.3% 0% 0%
Time No. of obs. Ques. K C App Ana Synt Eva
35min 3 2 0 0 1 0 0
%age 67% 0% 0% 33% 0% 0%

94
Table 168
Table 168 indicated that in 40 minutes class duration, the researcher observed 4
questions. 100 % of the questions were knowledge based. All the questions asked
in the class were lower order questions. The total percentage of questions during
40 minutes was just only10%.
Table 169
Table 169 indicated that in 35 minutes class duration, the researcher observed 5
questions. 40% of the questions were knowledge based, 20% were comprehension
based, 20% were application, and 20% were analysis based. Thus most of the
questions asked in the class were lower order questions and 20% of the questions
were higher order. The total percentage of questions during 35 minutes was 14%.
Table 170
Table 170 indicated that in 25 minutes class duration, the researcher observed 2
questions. 50 % of the questions were knowledge based, and 50% were
application based. Thus all of the questions asked in the class were lower order
questions. The total percentage of questions during 25 minutes was 8%.
Time No. of obs. Ques. K C App Ana Synt Eva
40min 4 4 0 0 0 0 0
%age 100% 0% 0% 0% 0% 0%
Time No. of obs. Ques. K C App Ana Synt Eva
35min 5 2 1 1 1 0 0
%age 40% 20% 20% 20% 0% 0%
Time No. of obs. Ques. K C App Ana Synt Eva
25min 2 1 0 1 0 0 0
%age 50% 0% 50% 0% 0% 0%

95
Table 171
Time No. of obs. Ques. K C App Ana Synt Eva
20min 4 4 0 0 0 0 0
%age 100% 0% 0% 0% 0% 0%
Table 171 indicated that in 20 minutes class duration, the researcher observed 4
questions. 100 % of the questions were knowledge based. All the questions asked
in the class were lower order questions. The total percentage of questions during
20 minutes was just only20%.
Table 172
Table 172 indicated that in 25 minutes class duration, the researcher observed 3
questions. 33.3 % of the questions were knowledge based, 33.3% were
comprehension based, and 33.3% were application based. Thus all of the
questions asked in the class were lower order questions. The total percentage of
questions during 25 minutes was 12%.
Table 173
Table 173 indicated that in 35 minutes class duration, the researcher observed 3
questions. 67% of the questions were knowledge based and 33% were
comprehension based. Thus all of the questions asked in the class were lower
order questions. The total percentage of questions during 35 minutes was 9%.
Time No. of obs. Ques. K C App Ana Synt Eva
25min 3 1 1 1 0 0 0
%age 33.3% 33.3% 33.3% 0% 0% 0%
Time No. of obs. Ques. K C App Ana Synt Eva
35min 3 2 1 0 0 0 0
%age 67% 33% 0% 0% 0% 0%

96
Table 174
Table 174 indicated that in 25 minutes class duration, the researcher observed 3
questions. 33.3 % of the questions were knowledge based, 33.3% were
comprehension based, and 33.3% were application based. Thus all of the
questions asked in the class were lower order questions. The total percentage of
questions during 25 minutes was 12%.
Table 175
Table 175 indicated that in 30 minutes class duration, the researcher observed 3
questions. 67% of the questions were knowledge based and 33% were
comprehension based. Thus all of the questions asked in the class were lower
order questions. The total percentage of questions during 30 minutes was 10%.
Table 176
Table 176 indicated that in 30 minutes class duration, the researcher observed 11
questions. 36.3 % of the questions were knowledge based, 36.3% were
comprehension based, and 27% were application based. Thus all of the questions
asked in the class were lower order questions. The total percentage of questions
during 30 minutes was 37%.
Time No. of obs. Ques. K C App Ana Synt Eva
25min 3 1 1 1 0 0 0
%age 33.3% 33.3% 33.3% 0% 0% 0%
Time No. of obs. Ques. K C App Ana Synt Eva
30min 3 2 1 0 0 0 0
%age 67% 33% 0% 0% 0% 0%
Time No. of obs. Ques. K C App Ana Synt Eva
30min 11 4 4 3 0 0 0
%age 36.3% 36.3% 27% 0% 0% 0%

97
4.4 Tertiary Level Data individual tables
Table-177~200: Categories of questions observed in 24 total sessions at
tertiary level
Table 177
Table 177 indicated that in 1 hour 30 minutes class duration, the researcher
observed 8 questions. 25 % of the questions were knowledge based, 13% were
comprehension based, and 62% were application based. Thus all of the questions
asked in the class were lower order questions. The total percentage of questions
during 1 hour 30 minutes was 9%.
Table 178
Table 178 indicated that in 1 hour class duration, the researcher observed 12
questions. 67% of the questions were knowledge based, 17% were comprehension
based, 8% were application, and 8% were analysis based. Thus most of the
questions asked in the class were lower order questions and just 8% of the
questions were higher order. The total percentage of questions during 1 hour was
23%.
Time No. of obs. Ques. K C App Ana Synt Eva
1 hour 30min 8 2 1 5 0 0 0
%age 25% 13% 62% 0% 0% 0%
Time No. of obs. Ques. K C App Ana Synt Eva
1 hour 12 8 2 1 1 0 0
%age 67% 17% 8% 8% 0% 0%

98
Table 179
Table 179 indicated that in 1 hour class duration, the researcher observed 10
questions. 40% of the questions were knowledge based, 50% were comprehension
based, and 10% were analysis based. Thus most of the questions asked in the class
were lower order questions and just 10% of the questions were higher order. The
total percentage of questions during 1 hour was 17%.
Table 180
Table 180 indicated that in 1 hour 30 minutes class duration, 75 % of the
questions were knowledge based, and 25% were comprehension based. Thus all of
the questions asked in the class were lower order questions. The total % of
questions during 1 hour 30 minutes was just only 4%.
Table 181
Table 181 indicated that in 3 hours class duration, the researcher observed 3
questions. 67% of the questions were comprehension based, and 33% were
analysis based. Thus most of the questions asked in the class were lower order
questions and just 33% of the questions were higher order. The total percentage of
questions during 3 hours was just only 2%.
Time No. of obs. Ques. K C App Ana Synt Eva
1 hour 10 4 5 0 1 0 0
%age 40% 50% 0% 10% 0% 0%
Time No. of obs. Ques. K C App Ana Synt Eva
1hour30min 4 3 1 0 0 0 0
%age 75% 25% 0% 0% 0% 0%
Time No. of obs. Ques. K C App Ana Synt Eva
3 hour 3 0 2 0 1 0 0
%age 0% 67% 0% 33% 0% 0%

99
Table 182
Table 182 indicated that in 1 hour 30 minutes class duration, the researcher
observed 4 questions. 50 % of the questions were knowledge based, 25% were
comprehension based, and 25% were application based. Thus all of the questions
asked in the class were lower order questions. The total percentage of questions
during 1 hour 30 minutes was just only 4%.
Table 183
Table 183 indicated that in 1 hour class duration, the researcher observed 6
questions. 50% of the questions were knowledge based, 16.6% were
comprehension based, 16.6% were application, and 16.6% were synthesis based.
Thus most of the questions asked in the class were lower order questions and
16.6% of the questions were higher order. The total percentage of questions
during 1 hour was 10%.
Table 184
Table 184 indicated that in 1 hour class duration, the researcher observed 4
questions. 50 % of the questions were knowledge based, 25% were
comprehension based, and 25% were application based. Thus all of the questions
asked in the class were lower order questions. The total percentage of questions
during 1 hour was just only 7%.
Time No. of obs. Ques. K C App Ana Synt Eva
1 hour 30min 4 2 1 1 0 0 0
%age 50% 25% 25% 0% 0% 0%
Time No. of obs. Ques. K C App Ana Synt Eva
1 hour 6 3 1 1 0 1 0
%age 50% 16.6% 16.6% 0% 16.6% 0%
Time No. of obs. Ques. K C App Ana Synt Eva
1 hour 4 2 1 1 0 0 0
%age 50% 25% 25% 0% 0% 0%

100
Table 185
Table 185 indicated that in 1 hour 30 minutes class duration, the researcher
observed 3 questions. 67 % of the questions were knowledge based, and 33%
were comprehension based. Thus all of the questions asked in the class were lower
order questions. The total % of questions during 1 hour 30 minutes was just only
3%.
Table 186
Table 186 indicated that in 2 hours class duration, the researcher observed 10
questions. 40% of the questions were knowledge based, 20% were comprehension
based, 20% were application, 10% were analysis and 10% were evaluation based.
Thus most of the questions asked in the class were lower order questions and 20%
of the questions were higher order. The total % of questions during 2 hours was
8%.
Table 187
Table 187 indicated that in 1 hour 30 minutes class duration, the researcher
observed 2 questions. 100 % of the questions were knowledge based. Thus all of
the questions asked in the class were lower order questions. The total percentage
of questions during 1 hour 30 minutes was just only 2%.
Time No. of obs. Ques. K C App Ana Synt Eva
1 hour 30min 3 2 1 0 0 0 0
%age 67% 33% 0% 0% 0% 0%
Time No. of obs. Ques. K C App Ana Synt Eva
2 hour 10 4 2 2 1 0 1
%age 40% 20% 20% 10% 0% 10%
Time No. of obs. Ques. K C App Ana Synt Eva
1hour 30min 2 0 2 0 0 0 0
%age 0% 100% 0% 0% 0% 0%

101
Table 188
Table 188 indicated that in 1 hour 30 minutes class duration, the researcher
observed 5 questions. 20% of the questions were knowledge based, 40% were
comprehension based, 20% were application, and 20% were analysis based. Thus
most of the questions asked in the class were lower order questions only 20% of
the questions were higher order. The total % of questions during 1 hour 30
minutes was 6%.
Table 189
Table 189 indicated that in 1 hour 30 minutes class duration, 33.3% of the
questions were knowledge based, 33.3% were application, and 33.3% were
analysis based. Thus most of the questions asked in the class were lower order
questions only 33.3% of the questions were higher order. The total percentage of
questions during 1 hour 30 minutes was just only 3%.
Table 190
Table 190 indicated that in 1 hour 3 hours class duration, the researcher observed
2 questions. 50 % of the questions were knowledge based, and 50% were
comprehension based. Thus all of the questions asked in the class were lower
order questions. The total percentage of questions during 3 hours was just only
1%.
Time No. of obs. Ques. K C App Ana Synt Eva
1 hour 30min 5 1 2 1 1 0 0
%age 20% 40% 20% 20% 0% 0%
Time No. of obs. Ques. K C App Ana Synt Eva
1 hour 30min 3 1 0 1 1 0 0
%age 33.3% 0% 33.3% 33.3% 0% 0%
Time No. of obs. Ques. K C App Ana Synt Eva
3 hour 2 1 1 0 0 0 0
%age 50% 50% 0% 0% 0% 0%

102
Table 191
Table 191 indicated that in 1 hour 30 minutes class duration, the researcher
observed 10 questions. 60 % of the questions were knowledge based, and 40%
were comprehension based. Thus all of the questions asked in the class were lower
order questions. The total % of questions during 1 hour 30 minutes was just only
11%.
Table 192
Table 192 indicated that in 1 hour 30 minutes class duration, 40% of the questions
were knowledge based, 47% were comprehension based, and 13% were analysis
based. Thus most of the questions asked in the class were lower order questions
and just 13% of the questions were higher order. The total percentage of questions
during 1 hour 30 minutes was 17%.
Table 193
Time No. of obs. Ques. K C App Ana Synt Eva
2 hour 5 2 3 0 0 0 0
%age 40% 60% 0% 0% 0% 0%
Table 193 indicated that in 2 hours class duration, the researcher observed 5
questions. 40 % of the questions were knowledge based, and 60% were
comprehension based. Thus all of the questions asked in the class were lower
order questions. The total percentage of questions during 2 hours was just only
4%.
Time No. of obs. Ques. K C App Ana Synt Eva
1 hour 30min 10 6 4 0 0 0 0
%age 60% 40% 0% 0% 0% 0%
Time No. of obs. Ques. K C App Ana Synt Eva
1 hour 30min 15 6 7 0 2 0 0
%age 40% 47% 0% 13% 0% 0%

103
Table 194
Table 194 indicated that in 1 hour 30 minutes class duration, the researcher
observed 2 questions. 50 % of the questions were knowledge based, and 50%
were application based. Thus all of the questions asked in the class were lower
order questions. The total percentage of questions during 1 hour 30 minutes was
just only 2%.
Table 195
Table 195 indicated that in 1 hour 45 minutes class duration, the researcher
observed 8 questions. 25 % of the questions were knowledge based, 50% were
comprehension based, and 25% were application based. Thus all of the questions
asked in the class were lower order questions. The total percentage of questions
during 1 hour 45 minutes was just only 8%.
Table 196
Table 196 indicated that in 1 hour 45 minutes class duration, the researcher
observed 5 questions. 20 % of the questions were knowledge based, 60% were
comprehension based, and 20% were application based. Thus all of the questions
asked in the class were lower order questions. The total percentage of questions
during 1 hour 45 minutes was just only 5%.
Time No. of obs. Ques. K C App Ana Synt Eva
1 hour 30min 2 1 0 1 0 0 0
%age 50% 0% 50% 0% 0% 0%
Time No. of obs. Ques. K C App Ana Synt Eva
1hour 45min 8 2 4 2 0 0 0
%age 25% 50% 25% 0% 0% 0%
Time No. of obs. Ques. K C App Ana Synt Eva
1hour 45min 5 1 3 1 0 0 0
%age 20% 60% 20% 0% 0% 0%

104
Table 197
Time No. of obs. Ques. K C App Ana Synt Eva
1hour 45min 6 3 0 1 1 1 0
%age 50% 0% 16.6% 16.6% 16.6% 0%
Table 197 indicated that in 1 hour 45 minutes class duration, the researcher
observed 6 questions. 50% of the questions were knowledge based, 16.6% were
application based, 16.6% were analysis and 16.6% were synthesis based. Thus
most of the questions asked in the class were lower order questions and 33% of
the questions were higher order. The total% of questions during 1 hour 45 minutes
was 6%.
Table 198
Time No. of obs. Ques. K C App Ana Synt Eva
1hour 45min 6 3 0 2 1 0 0
%age 50% 0% 33% 17% 0% 0%
Table 198 indicated that in 1 hour 45 minutes class duration, 50% of the questions
were knowledge based, 33% were application, and 17% were analysis based. Thus
most of the questions asked in the class were lower order questions only 17% of
the questions were higher order. The total percentage of questions during 1 hour
45 minutes was just only 6%.
Table 199
Table 199 indicated that in 1 hour 30 minutes class duration, the researcher
observed 4 questions. 50% of the questions were knowledge based, 25% were
application, and 25% were analysis based. Thus most of the questions asked in the
class were lower order questions only 25% of the questions were higher order.
The total percentage of questions during 1 hour 30 minutes was just only 4%.
Time No. of obs. Ques. K C App Ana Synt Eva
1 hour 30min 4 2 0 1 1 0 0
%age 50% 0% 25% 25% 0% 0%

105
Table 200
Table 200 indicated that in 3 hours class duration, the researcher observed 4
questions. 75% of the questions were comprehension based, and 25% were
application based. Thus all of the questions asked in the class were lower order
questions. The total percentage of questions during 13 hours was just only 2%.
Time No. of obs. Ques. K C App Ana Synt Eva
3hour 4 0 3 1 0 0 0
%age 0% 75% 25% 0% 0% 0%

106
4.5 Comprehensive Tables of Secondary Level Data
Table-201: Percentage of total questions asked in each category
Observation
Time No.ofObs. Qs
K C App Analy Synt Eva
1 0:15:00 19 11 4 3 1 0 0 2 0:25:00 11 9 2 0 0 0 0 3 0:15:00 10 5 5 0 0 0 0 4 0:15:00 10 9 1 0 0 0 0 5 0:25:00 26 20 2 3 1 0 0 6 0:20:00 7 4 3 0 0 0 0 7 0:30:00 19 12 7 0 0 0 0 8 0:20:00 9 3 5 0 0 1 0 9 0:30:00 17 11 6 0 0 0 0 10 0:25:00 10 8 2 0 0 0 0 11 0:15:00 10 8 2 0 0 0 0 12 0:40:00 7 6 0 0 1 0 0 13 0:45:00 8 8 0 0 0 0 0 14 0:35:00 6 5 1 0 0 0 0 15 0:40:00 6 5 1 0 0 0 0 16 0:45:00 5 4 1 0 0 0 0 17 0:40:00 5 3 1 1 0 0 0 18 0:35:00 7 3 1 0 0 2 1 19 0:40:00 7 5 2 0 0 0 0 20 0:35:00 1 1 0 0 0 0 0 21 0:30:00 2 1 0 0 1 0 0 22 0:35:00 6 5 0 1 0 0 0 23 0:30:00 2 0 1 0 1 0 0 24 0:30:00 11 9 2 0 0 0 0 25 0:20:00 11 3 8 0 0 0 0 26 0:20:00 5 4 1 0 0 0 0 27 0:15:00 9 4 4 0 1 0 0 28 0:20:00 13 7 2 4 0 0 0 29 0:30:00 9 9 0 0 0 0 0 30 0:30:00 19 10 7 2 0 0 0 31 0:30:00 18 12 0 4 1 1 0 32 0:40:00 2 1 1 0 0 0 0 33 0:30:00 4 3 0 1 0 0 0 34 0:35:00 2 0 2 0 0 0 0 35 0:25:00 4 3 0 0 1 0 0 36 0:30:00 2 0 2 0 0 0 0 37 0:30:00 2 1 1 0 0 0 0 38 0:30:00 4 4 0 0 0 0 0 39 0:35:00 2 0 1 1 0 0 0 40 0:35:00 10 10 0 0 0 0 0 41 0:30:00 2 2 0 0 0 0 0 42 0:35:00 4 2 1 1 0 0 0 43 0:35:00 5 3 0 1 1 0 0 44 0:35:00 5 3 0 1 1 0 0 45 0:40:00 0 0 0 0 0 0 0 46 0:35:00 3 2 0 1 0 0 0 47 0:35:00 3 2 1 0 0 0 0 48 0:40:00 4 3 1 0 0 0 0

107
49 0:35:00 3 2 1 0 0 0 0 50 0:35:00 3 2 1 0 0 0 0 51 0:40:00 4 3 1 0 0 0 0
52 0:40:00 7 5 2 0 0 0 0
53 0:40:00 4 4 0 0 0 0 0
54 0:40:00 6 5 1 0 0 0 0
55 0:40:00 9 6 1 2 0 0 0
56 0:40:00 5 3 0 0 2 0 0
57 0:40:00 5 5 0 0 0 0 0
58 0:40:00 6 6 0 0 0 0 0
59 0:35:00 2 1 0 1 0 0 0
60 0:35:00 4 1 1 1 1 0 0
61 0:35:00 6 4 1 1 0 0 0
62 0:35:00 7 1 0 2 3 1 0
63 0:35:00 3 2 0 1 0 0 0
64 0:25:00 16 7 4 4 1 0 0
65 0:35:00 12 4 6 2 0 0 0
66 0:40:00 6 2 1 2 1 0 0
67 0:35:00 8 1 2 1 4 0 0
68 0:40:00 4 1 2 0 1 0 0
69 0:35:00 5 0 2 3 0 0 0
70 0:30:00 4 3 0 0 1 0 0
71 0:45:00 9 4 1 2 2 0 0
72 0:15:00 4 2 0 1 1 0 0
73 0:30:00 4 1 1 1 1 0 0
74 0:40:00 3 1 1 1 0 0 0
75 0:40:00 6 4 0 1 1 0 0
76 0:30:00 3 1 0 1 1 0 0
77 0:35:00 6 3 2 0 1 0 0
78 0:35:00 2 2 0 0 0 0 0
79 0:35:00 8 6 1 1 0 0 0
80 0:35:00 4 2 0 1 1 0 0
81 0:35:00 6 3 3 0 0 0 0
82 0:35:00 4 2 0 0 2 0 0
83 0:35:00 10 7 1 1 1 0 0
84 0:40:00 10 4 3 2 0 1 0
85 0:30:00 5 2 2 0 1 0 0
86 0:25:00 11 6 5 0 0 0 0
87 0:35:00 8 2 4 2 0 0 0
88 0:40:00 17 4 5 3 2 1 2
89 0:30:00 9 8 1 0 0 0 0
90 0:40:00 3 3 0 0 0 0 0
91 0:30:00 4 2 0 2 0 0 0
92 0:25:00 12 6 3 0 2 1 0

108
93 0:20:00 0 0 0 0 0 0 0
94 0:35:00 7 4 3 0 0 0 0
95 0:35:00 15 6 3 3 0 2 1
96 0:40:00 20 11 3 1 3 0 2
97 0:30:00 6 2 3 1 0 0 0
98 0:20:00 3 3 0 0 0 0 0
99 0:35:00 13 6 6 0 0 1 0
100 0:35:00 18 7 4 4 2 0 1
101 0:40:00 8 2 1 5 0 0 0 102 0:40:00 12 8 2 1 1 0 0 103 0:35:00 10 4 5 0 1 0 0 104 0:30:00 4 3 1 0 0 0 0 105 0:40:00 10 6 4 0 0 0 0 106 0:25:00 4 2 0 1 1 0 0 107 0:35:00 6 3 1 1 0 1 0 108 0:35:00 4 2 1 1 0 0 0 109 0:40:00 5 2 2 1 0 0 0 110 0:45:00 10 4 2 2 1 0 1
111 0:30:00 2 0 2 0 0 0 0 112 0:30:00 2 0 2 0 0 0 0 113 0:45:00 4 3 1 0 0 0 0 114 0:40:00 4 2 2 0 0 0 0 115 0:45:00 10 6 4 0 0 0 0 116 0:30:00 15 6 7 0 2 0 0 117 0:40:00 5 2 3 0 0 0 0 118 0:35:00 12 8 4 0 0 0 0 119 0:45:00 8 2 4 2 0 0 0 120 0:45:00 5 1 3 1 0 0 0 121 0:45:00 6 3 0 1 1 1 0 122 0:45:00 6 3 0 2 1 0 0 123 0:25:00 4 2 0 1 1 0 0 124 0:20:00 8 5 2 1 0 0 0 125 0:30:00 3 3 0 0 0 0 0 126 0:25:00 3 1 2 0 0 0 0 127 0:35:00 2 0 1 0 1 0 0 128 0:30:00 2 2 0 0 0 0 0 129 0:35:00 11 5 2 2 2 0 0 130 0:30:00 10 1 4 2 3 0 0 131 0:40:00 4 2 2 0 0 0 0 132 0:45:00 4 3 0 0 1 0 0 133 0:35:00 6 1 2 1 2 0 0 134 0:40:00 4 2 1 0 1 0 0 135 0:40:00 14 8 5 1 0 0 0

109
136 0:45:00 13 4 9 0 0 0 0 137 0:40:00 5 4 1 0 0 0 0 138 0:25:00 5 1 1 3 0 0 0 139 0:45:00 19 7 6 5 1 0 0 140 0:25:00 3 2 1 0 0 0 0 141 0:40:00 9 5 2 2 0 0 0 142 0:35:00 3 1 1 0 1 0 0 143 0:25:00 4 1 0 1 2 0 0 144 0:45:00 3 2 0 1 0 0 0 145 0:45:00 4 3 1 0 0 0 0 146 0:45:00 4 3 0 1 0 0 0 147 0:40:00 8 4 3 1 0 0 0 148 0:35:00 7 7 0 0 0 0 0 149 0:35:00 19 17 2 0 0 0 0 150 0:25:00 2 1 0 0 1 0 0 151 0:25:00 3 2 0 1 0 0 0 152 0:25:00 3 3 0 0 0 0 0 153 0:35:00 3 1 0 0 2 0 0 154 0:20:00 4 0 3 1 0 0 0 155 0:30:00 4 0 2 1 1 0 0 156 0:30:00 6 3 2 0 1 0 0 157 0:20:00 3 2 0 0 0 1 0 158 0:40:00 3 2 0 1 0 0 0 159 0:35:00 3 3 0 0 0 0 0 160 0:45:00 4 0 2 1 1 0 0 161 0:30:00 4 1 3 0 0 0 0 162 0:25:00 3 1 2 0 0 0 0 163 0:30:00 3 2 1 0 0 0 0 164 0:35:00 3 0 2 1 0 0 0 165 0:35:00 3 1 1 0 1 0 0 167 0:35:00 3 2 0 0 1 0 0 168 0:40:00 4 4 0 0 0 0 0 169 0:35:00 5 2 1 1 1 0 0 170 0:25:00 2 1 0 1 0 0 0 171 0:20:00 4 4 0 0 0 0 0 172 0:25:00 3 1 1 1 0 0 0 173 0:35:00 3 2 1 0 0 0 0 174 0:25:00 3 1 1 1 0 0 0 175 0:30:00 3 2 1 0 0 0 0 176 0:30:00 11 4 4 3 0 0 0
Total 97:05:00 1150 638 288 125 77 14 8 % 55.47% 25.04% 10.87% 6.70% 1.22% 0.70%

110
The above table indicated that during 176 observations session at Secondary
Level, the total time of observation was 97 hours and 5 minutes, the total number
of questions observed were 1150. The result of the study revealed that the teachers
asked questions during instruction. Total percentage of questions during 5825
minutes was 20 percent. The whole number of questions was not good and in most
of the classes the number of questions was also too much low. Among 1150
questions 55.47% were knowledge based, 25.04% were comprehension based,
10.87% were application based, 6.70% were analysis based, 1.22% was synthesis
based, and 0.70% was evaluation based. In the knowledge category most of the
questions were related to knowledge of specifics and terminology, theories and
structures, and trend and sequences. In the comprehension category most of the
questions asked were related to interpretation and extrapolation. In the application
category the questions were either related to manipulation or demonstration. The
questions asked in the analysis category were mostly related to analysis of
elements and relationship. The questions at synthesis and evaluation level were
too much low.
55%25%
11%7%
1%
1%
Knowledge
Comprehension
Application
Analysis
Synthesis
Evaluation
Figure-4.1: Graphic representation of secondary level data
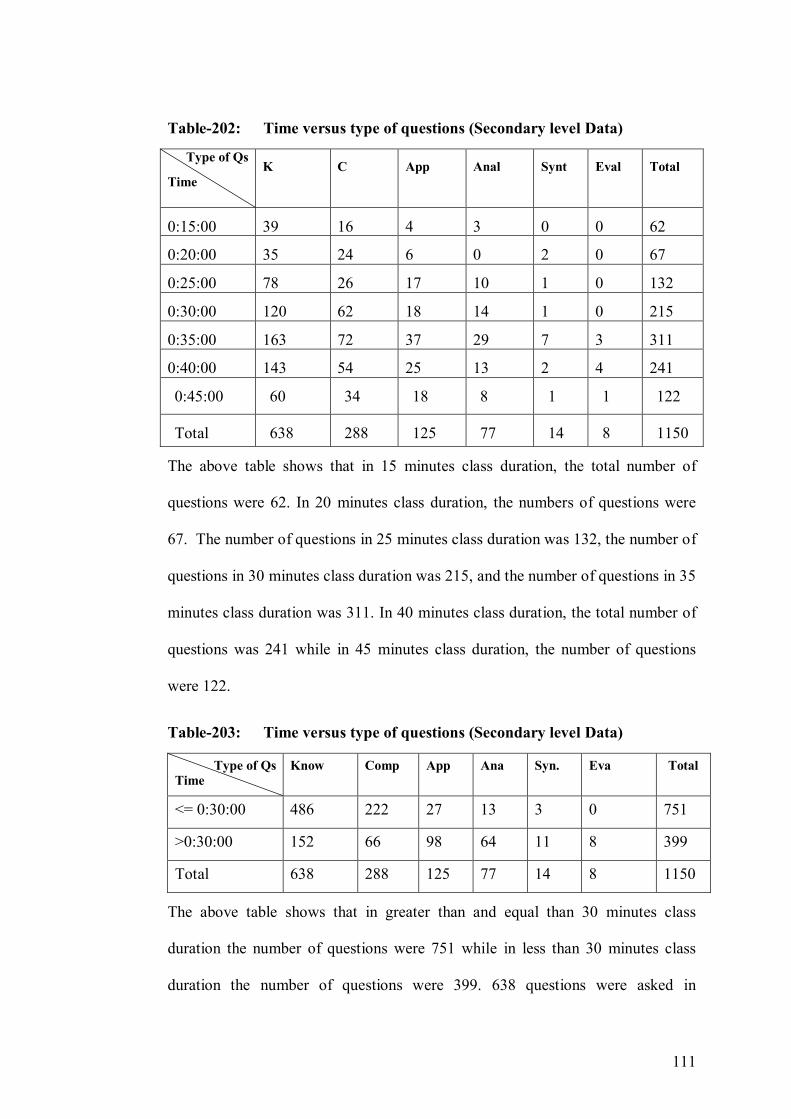
111
Table-202: Time versus type of questions (Secondary level Data)
Type of Qs
Time
K C App Anal Synt Eval Total
0:15:00 39 16 4 3 0 0 62
0:20:00 35 24 6 0 2 0 67
0:25:00 78 26 17 10 1 0 132
0:30:00 120 62 18 14 1 0 215
0:35:00 163 72 37 29 7 3 311
0:40:00 143 54 25 13 2 4 241
0:45:00 60 34 18 8 1 1 122
Total 638 288 125 77 14 8 1150
The above table shows that in 15 minutes class duration, the total number of
questions were 62. In 20 minutes class duration, the numbers of questions were
67. The number of questions in 25 minutes class duration was 132, the number of
questions in 30 minutes class duration was 215, and the number of questions in 35
minutes class duration was 311. In 40 minutes class duration, the total number of
questions was 241 while in 45 minutes class duration, the number of questions
were 122.
Table-203: Time versus type of questions (Secondary level Data)
Type of Qs Time
Know Comp App Ana Syn. Eva Total
<= 0:30:00 486 222 27 13 3 0 751
>0:30:00 152 66 98 64 11 8 399
Total 638 288 125 77 14 8 1150
The above table shows that in greater than and equal than 30 minutes class
duration the number of questions were 751 while in less than 30 minutes class
duration the number of questions were 399. 638 questions were asked in

112
knowledge category, 288 questions were asked in comprehension category, 125
questions were asked in application category, 77 questions were asked in the
analysis category, 14 questions were asked in synthesis category while 8 questions
were asked in the evaluation category of Bloom’s Taxonomy.
Table-204: Time versus knowledge, comprehension and application as
(lower order questions) for Secondary Data
Type of Qs
Time
Know Comp App Total
<= 0:30:00 486 222 27 735
> 0:30:00 152 66 98 316
Total 638 288 125 1051
Percentage 55.47% 25.04% 10.87% 91.38%
The above table indicated that at knowledge, comprehension, and application
level of Bloom’s Taxonomy, most of the questions asked by the teachers at
Secondary Level were lower order and factual. A total of 55.47% questions were
asked in knowledge category, 25.04% questions were asked in the comprehension
category while 10.87% questions were asked in the application category. The total
percentage of lower order questions at Secondary Level was 91.38%.
Table-205: Time versus analysis, synthesis and evaluation as (higher order
questions) for Secondary Data
Type of Qs
Time
Ana. Syn. Eva. Total
<= 0:30:00 13 3 0 16
>0:30:00 64 11 8 83
Total 77 14 8 99
Percentage 6.70% 1.22% 0.70% 8.62%

113
The above table indicated that at analysis, synthesis, and evaluation levels of
Bloom’s Taxonomy, very little number of questions were asked. The numbers of
higher order questions asked by the teachers at Secondary Level were very low. A
total of 6.70% questions were asked in analysis category, 1.22% questions were
asked in the synthesis category while 0.70% questions were asked in the
evaluation category. The total percentage of higher order questions at Secondary
Level was 8.62%.
4.6 Comprehensive Tables of Tertiary Level Data
Table 206 shows percentage of total questions asked in each category
Observation Time
No.of ObsQ K C App Ana Synth Eval
1 1:30:00 8 2 1 5 0 0 0 2 1:00:00 12 8 2 1 1 0 0 3 1:00:00 10 4 5 0 1 0 0
4 1:30:00 4 3 1 0 0 0 0
5 3:00:00 3 0 2 0 1 0 0
6 1:30:00 4 2 1 1 0 0 0
7 1:00:00 6 3 1 1 0 1 0
8 1:00:00 4 2 1 1 0 0 0
9 1:30:00 3 2 1 0 0 0 0
10 2:00:00 10 4 2 2 1 0 1 11 1:30:00 2 0 2 0 0 0 0
12 1:30:00 5 1 2 1 1 0 0
13 1:30:00 3 1 0 1 1 0 0
14 3:00:00 2 1 1 0 0 0 0
15 1:30:00 10 6 4 0 0 0 0
16 1:30:00 15 6 7 0 2 0 0
17 2:00:00 5 2 3 0 0 0 0
18 1:30:00 2 1 0 1 0 0 0
19 1:45:00 8 2 4 2 0 0 0
21 1:45:00 6 3 0 1 1 1 0
22 1:45:00 6 3 0 2 1 0 0
23 1:30:00 4 2 0 1 1 0 0
24 3:00:00 4 0 3 1 0 0 0
Total 38:45:00 136 58 43 21 11 2 1
% 42.65% 31.62% 15.44% 8.09% 1.47% 0.74%

114
The above table indicated that during 24 observations session at Tertiary Level,
the total time of observation was 38 hours and 45 minutes, the total number of
questions observed were 136. The result of the study revealed that the teachers
asked questions during instruction. Total percentage of questions during 2325
minutes was only 6 percent. The entire number of questions was not admirable
and nearly all of the classes observed, the number of questions was very low. It
was observed that teachers raised questions very rarely at this level and dominated
giving lectures only. Out of 136 questions, 42.65% were knowledge based,
31.62% were comprehension based, 15.44% were application based, 8.09% were
analysis based, 1.47% was synthesis based, and 0.74% was evaluation based. In
the knowledge category most of the questions were related to knowledge of
specifics and terminology, theories and structures, and trend and sequences. In the
comprehension category most of the questions asked were related to interpretation
and extrapolation. In the application category the questions were either related to
manipulation or demonstration. The questions asked in the analysis category were
mostly related to analysis of elements and relationship. The questions at synthesis
and evaluation level were too much low.

115
43%
32%
15%
8%
1%
1%
Knowledge
Comprehension
Application
Analysis
Synthesis
Evaluation
Figure-4.2: Graphic representation of tertiary level data
Table-207: Time versus type of questions (Tertiary level Data)
Type of Qs
Time K C App Ana Synt. Eva Total
1:00:00 17 9 3 2 1 0 32
1:30:00 26 19 10 5 0 0 60
1:45:00 8 4 5 2 1 0 20
2:00:00 6 5 2 1 0 1 15
3:00:00 1 6 1 1 0 0 9
Total 58 43 21 11 2 1 136
The above table shows that in 1 hour class duration, the total number of questions
were 32. In 1 hour 30 minutes class duration, the numbers of questions were 60.
The number of questions in 1 hour and 45 minutes class duration was 20, the
number of questions in 2 hours class duration was 15, and the number of questions
in 3 hours class duration was 9. A total of 136 questions were asked in different
specified period of time at Tertiary Level.

116
Table-208: Time versus type of questions (Tertiary level Data)
Type of Qs
Time K C App Ana Synt Eva. Total
<= 2:00:00 7 32 3 2 0 1 45
>2:00:00 51 11 18 9 2 0 91
Total 58 43 21 11 2 1 136
The above table shows that in greater than and equal than 2 hours class duration
the number of questions were 45 while in less than 2 hours class duration the
number of questions were 91. 58 questions were asked in knowledge category, 43
questions were asked in comprehension category, 21 questions were asked in
application category, 11 questions were asked in the analysis category, 2 questions
were asked in synthesis category while only 1 question was asked in the
evaluation category of Bloom’s Taxonomy.
Table-209: Time versus knowledge, comprehension and application as
(lower order questions) for Tertiary Data
Type of Qs
Time
K Com App Total
<= 2:00:00 7 32 3 42
>2:00:00 51 11 18 80
Total 58 43 21 122
Percentage 42.65% 31.62% 15.44% 89.71%
The above table indicated that at knowledge, comprehension, and application level
of Bloom’s Taxonomy, most of the questions asked by the teachers at Tertiary
Level were lower order and factual. A total of 42.65% questions were asked in
knowledge category, 31.62% questions were asked in the comprehension category
while 15.44% questions were asked in the application category. The total
percentage of lower order questions at Tertiary Level was 89.71%.

117
Table-210: Time versus analysis, synthesis and evaluation as (higher order
questions) for Tertiary Data
Type of Qs Time
Ana Syn Eva Total
<= 2:00:00 2 0 1 3
>2:00:00 9 2 0 11
Total 11 2 1 14
Percentage 8.09% 1.47% 0.74% 10.3%
The above table indicated that at analysis, synthesis, and evaluation levels of
Bloom’s Taxonomy, very little number of questions were asked. The numbers of
higher order questions asked by the teachers at Tertiary Level were very low. A
total of 8.09% questions were asked in analysis category, 1.47% questions were
asked in the synthesis category while 0.74% questions were asked in the
evaluation category. The total percentage of higher order questions at Secondary
Level was 10.3%.
The null and alternative hypothesis
H0: There is no significance difference between type of questions at Secondary
and Tertiary Levels
H1: There is significance difference between type of questions at Secondary
and Tertiary Levels
The significance level at α = 0.05

118
4.7 Comparison of the type of Questions at Secondary and
Tertiary Level
Table-211: Comparison of the type of Questions at Secondary and
Tertiary Level
Levels Time
Type/Nature of questions Total 2
K Comp App Ana Syn Eva Secondary Level Data
97:05:00 638 288 125 77 14 8
1150
2.873 Tertiary
Level Data
38:45:00
58
43
21
11
2
1
136
7.504
Total 696 331 146 88 16 9 1286 10.377 df= 5 Table value= 11.07
The calculated value of 2 is 10.377, while the tabulated value of 2 with 5 degree
of freedom is 11.07 at 5 percent level of significance. So we accept the null
hypothesis and conclude that there is no significance difference between teachers’
types of questions at secondary and tertiary levels.
The table shows that the total number of questions at Secondary Level were 1150
over time period of 97 hours and 05 minutes while the total number of questions
at tertiary level were 136 over time period of 38 hours and 45 minutes. Most of
the questions asked were lower order at both Secondary and Tertiary Levels.

119
CHAPTER-FIVE
FINDINGS, CONCLUSION, DISCUSSION AND
RECOMMENDATIONS
This chapter deals with the gist of the whole thesis. The researcher has
derived findings after analyzing the data, has presented the conclusion, discussion
on the results and has given suggestions and recommendations.
5.1 Findings
Two hundred teachers were observed in their classes for the types of
questions they asked. One hundred and seventy six teachers were observed at
Secondary level and twenty four teachers were observed at Tertiary level. Time
duration for each class was different at both the levels.
Following were the findings of the study.
During 176 observations session at Secondary Level, the total time of
observation was 97 hours and 5 minutes, the total number of questions
observed were 1150.
Among 1150 questions 55.47% were knowledge based, 25.04% were
comprehension based, 10.87% were application based, 6.70% were
analysis based, 1.22% was synthesis based, and 0.70% was evaluation
based.

120
During 24 observations session at Tertiary Level, the total time of
observation was 38 hours and 45 minutes, the total number of questions
were 136.
Among 136 questions 42.65% were knowledge based, 31.62% were
comprehension based, 15.44% were application based, 8.09% were
analysis based, 1.47% was synthesis based, and 0.74% was evaluation
based.
At both Secondary and Tertiary Level the knowledge category questions
were dominantly asked and were mostly related to knowledge of specifics
and terminology, theories and structures, and trend and sequences.
In the comprehension category most of the questions asked were related to
interpretation and extrapolation.
In the application category the questions were either related to
manipulation or demonstration.
The questions asked in the analysis category were mostly related to
analysis of elements and relationship.
The questions at synthesis and evaluation level were too much low.
Of all the question levels found in this study, knowledge, comprehension,
and application, low level of cognition questions were found to be
predominant. The total percentage of such questions was 91.38% at
secondary level and 89.71% at tertiary level.
This is followed respectively by analysis, synthesis and evaluation, high
level of cognition questions. These levels of questions were not mostly

121
asked. The total percentage of such type of questions was 8.62 % at
secondary level and 10.3% at tertiary level
As for questioning techniques employed by the teachers in the classrooms,
convergent questions were found to be predominant over divergent
questions.
It was also found that there was no significance difference between the
type of questions asked at Secondary and Tertiary levels.
In some classrooms teachers did not even ask a single question.
At secondary level teachers were observed for a different period of time.
Class duration range from fifteen minutes to forty five minutes. The
number of asked questions was different at different time period. The total
numbers of asked questions were low.
At tertiary level, the duration of the class was different from that of
secondary level. Teachers were observed in the class for a minimum of
one hour and maximum of three hours. The number of asked questions
varied at different time period. The total numbers of asked questions were
too much low.
During 176 observations session at Secondary Level, the total time of
observation was 97 hours and 5 minutes, the total number of questions
observed were 1150. Total percentage of asked questions during 5825
minutes was 20 percent.
During 24 observations session at Tertiary Level, the total time of
observation was 38 hours and 45 minutes, the total number of questions

122
observed were 136. Total percentage of questions during 2325 minutes
was only 6 percent.
In three hours class duration at tertiary level, the researcher observed even
just two questions was posed, showing lack of questioning culture in the
Pakistani classroom context.
It was found that teachers mostly asked convergent questions which
limited students’ responses to set answers rather than divergent questions
which encourage divergent and open thinking.
The study revealed that very little attention is given to students’ critical
thinking development in the Pakistani schools and universities.
It was also found that very little wait time was provided by teachers at both
secondary and tertiary level after posing questions and getting answers.
5.3 Discussion
At secondary and tertiary level, the teachers in Pakistan do not ask many
questions. Much as other studies have shown (Goodlad, 1982) the teachers
primarily teach as they were taught in their own school experience, but there are
additional reasons as well. Being a former teacher and having conducted two
hundred observations at the secondary and tertiary level, the researcher noted that
most of the teachers were mainly engaged with giving lectures and explaining the
concepts. During their lecture time very few questions were posed, and those that
were asked were predominantly of lower order. The questions were mainly related
to terminologies of specific words or meanings of difficult words. Teachers lacked

123
the knowledge of Bloom’s Taxonomy nor did they have the training to frame
questions covering all the levels of Bloom’s Taxonomy.
Most of the teachers were not mentally ready to pose questions as their
teaching revolves around the textbook only, which did not encourage the teacher
to pose questions. The nature of the required summative examination compelled
teachers to make students memorize the content, which encouraged rote learning.
Asking a good question is a skill in itself which demands more expertise on the
part of teachers in content and pedagogy. Our teachers, however, lack the training
and expertise to frame higher order questions to enhance students’ thinking. The
results are provided strength by the findings of the study of Nisa & Khan (2012)
that teacher’s content knowledge and pedagogical skills, and some school factors
(time constraints, examination system) were some of the possibilities and
challenges which influence classroom questioning.
The result of the study showed that at both secondary and tertiary level
teachers questioning strategy was almost the same. Many teachers were not aware
of the number and type of questions they ask in class or the functions of those
questions. This study was unable to examine the levels of critical thinking—due to
the poor levels of questioning. Most of the teachers asked very less number of
questions. The researcher also observed some classes where teacher even didn’t
ask a single question. In the asked questions, the numbers of lower level and
convergent questions were greater than higher level and divergent questions at
both the levels. The questions which are low level simply reflect no critical
thinking. Questions of high level reflect higher thinking but its scale was low.

124
The result of the study revealed that majority of teachers at secondary level
asked lower order and convergent questions and the ratio of higher order and
divergent questions was very low. The results are in consistency with the results
given by Gall (1984) that teacher seldom asking questions that require higher
order thinking. The reason might be the lack of training in asking appropriate
questions by the teachers as identified by Cecil (1995).
It has also been observed that teachers at the tertiary level with greater
time duration for instruction asked very little number of questions. Most of the
asked questions were lower order convergent questions, while the number of
higher order divergent questions was too much low. The results are in support of
the study conducted by Ciardiello (1998) that at post – secondary level, teachers
were not using high level divergent questions in the class for their students.
At both secondary and tertiary level the knowledge based questions were
more dominant followed by comprehension, application, analysis, synthesis and
evaluation. The results are in support with the study of Dumteeb (2009) who
explored that knowledge questions were found to be predominant. The dominance
of knowledge questions was caused by the focus, the objectives of the lesson and
the classroom context. Of all the questions asked in the study, knowledge
questions elicited the greatest number of responses from the students. The fact that
the students responded to knowledge questions most often might be because
responding to knowledge questions does not require much of the students’ time,
effort, vocabulary and grammatical knowledge in formulating their responses.
It has also been explored that the number of asked questions were too
much low at both levels. A total of 1150 questions were asked at secondary level

125
over time period of 97 hours and 05 minutes. The total percentage of questions
during 5825 minutes was only 20 percent.
At tertiary level, the researcher observed twenty four lessons of
universities lecturers and professors. At tertiary level too the number of asked
questions was low. A total of 136 questions were asked over time period of 38
hours and 45 minutes. The total percentage of questions during 2325 minutes was
only 6 percent. The results are not in consistency with the results of Brown &
Wragg (1993) who discusses the research study of Stevens (1912) that teachers
appeared to ask 400 questions per day. Moreover, Johnston (1990), cited in Ellis
(1994) witnessed a total of 522 questions of various kinds in three hours of
teaching.
It has also been observed that teachers did not provide sufficient wait time
to students after posing questions and getting responses. Wait-time which is one
of the fundamental components of good questioning practices requires ‘patience’
on the part of the teacher. However, it was observed that the children were not
given enough wait time. The results are in support of the studies by Powell &
Caseau (2004), Hastings (2006) that teachers seldom wait more than a minute to
answer their own questions. Rowe (1974) concluded that teachers wait only 0.9
seconds for students’ responses after posing questions.
The results of the study revealed that teachers asked more convergent
questions than divergent questions. The results are provided strength by the study
of Borich (2000) that the ratio of convergent questions asked in the classroom is
much higher than divergent questions. The proportion is about4:1.

126
It was also observed by the researcher that the teachers at both the levels
did not have the skill of asking the right type of questions. The observation got
strength with the observation of Tritapoe (2010) that teachers lack the skill of
asking appropriate questions.
Evidence from previous studies reported that teachers ask a lot of
questions during classroom teaching but the ratio of low level questions is more
than the higher level questions. Hussin (2006) conducted study on the dimensions
of questions in Malaysia and reported that the national curriculum of Malaysia
demand learners to be critical thinkers but the teachers, in reality, teach in terms of
posing low-level, factual questions that discourage critical thinking on the part of
learners.
Critelli & Tritapoe (2010) explored effective questioning techniques to
increase class participation. They found out that the teacher lacked the skill of
posing effective questioning strategies that enhance class involvement rather
mainly relied on declamatory questions and convergent questions which did not
encourage high level class participation or powerful responses.
The results of the study provide support to the study by Sulaiman &
Noordin (2005), who also examine to what extent teachers use six question levels
of Bloom’s Taxonomy in the teaching of investigation skills. They found out that
teachers frequently use knowledge questions followed by analysis and
comprehension question levels while teaching investigation skills, however, other
levels of questions were seldom asked.
The teachers in Pakistan know little about Bloom‘s taxonomy of questions.
No planning is carried out to plan for asking better questions before going to class.

127
Teachers are more concerned with the syllabus completion rather than plan for
promoting critical thinking through questioning technique.
Due to lack of research culture in Pakistan, data collection stage of the
study was time consuming and hard stage for the researcher. Dealing with the
authorities of Secondary Schools and public sector universities of Khyber
Pahtunkhwa for getting permission to collect data was a difficult job for the
researcher. The timing and duration of the field work was constrained by school
schedules and sometime public holidays. However, after permission for collecting
data was granted by the concerned authority, the researcher planned with the
teacher participants about their schedules for collecting the necessary data for the
study. Some teachers denied to be observed with audio- recording but they were
made convinced that identity of the institution and the confidentiality of the
participants would be protected. The researcher did not mention either the name of
the institution or the teacher in the analysis and results of data.
The researcher understanding of the profession provided her with greater
insight to conduct more in-depth data collection and analysis. The researcher is
teaching at school and college level, provided her a good opportunity to
understand the classroom setting. At the tertiary level the researcher did
observations of lecturers and professors in the social sciences departments only
because with no science background, the researcher could not conduct
observations in pure sciences.

128
5.3 Conclusion
In the light of findings and discussion the following conclusions have been
drawn.
The study results revealed that teachers practice of asking questions were
very weak, majority of teachers asked dominantly lower order and convergent
questions at secondary level which could not help to develop the ability of critical
thinking among students at secondary level. There were variations in terms of
classroom time duration and number of asked questions by teachers. The results of
the study showed that no question was asked by teachers in some of the classes at
secondary level.
The asked questions were predominantly lower order and convergent
questions with a very low asking ratio and, not encouraging critical thinking at
tertiary level among students.
The teachers both at secondary and tertiary level provided very short wait
time to students to respond. There found no awareness of teachers regarding the
positive impact of increasing wait time and getting divergent answers.
The results also concluded that there is no significance difference between
type of teachers’ questions at secondary and tertiary level.
The observations in the study revealed that teachers at secondary and
tertiary level employed almost similar type of questioning technique while
teaching in order to check student’s level of understanding. Of all the questions
asked in the study, lower order and convergent questions elicited the greatest
number of responses from the students. Questions at the analysis, synthesis and
evaluation levels were not mostly asked. These three levels were rarely used. The

129
researcher also noticed that teachers usually preferred to rely mostly on asking
simple questions that would accelerate the teaching learning process and the
learners also feel relax to easily answer the teacher’s questions.
5.4 Recommendations
The following recommendations have been given in light of findings and
conclusions.
1. It is indicated from the results that teachers both at secondary and tertiary
level asked low level cognitive questions predominantly while it is
suggested that a combination of lower and higher order questions should
be asked in order to foster student understanding and achievement.
2. The teachers’ asked questions were mostly factual even if the goal of
instruction was to promote higher level thinking. It is therefore
recommended that teachers should ask factual questions when the goal is
primarily mastery of basic understanding or skills. Higher cognitive
questions are effective when more independent thinking is required and
where the goal of instruction is to promote higher- level thinking.
3. The observations revealed that teachers at secondary and tertiary level
classrooms did not ask a good number of questions. No question culture
was found in the classrooms. Teachers should develop a thought
provoking question culture in the classrooms in order to foster critical
thinking among the students.
4. The results also revealed that teachers’ questions were mostly convergent
rather than divergent. Open ended, divergent questions should be asked to
stimulate divergent thinking among the students. Teachers should use

130
primarily convergent questions to teach facts, rules, and action sequences
and should use divergent questions to teach concepts, patterns, and
abstractions.
5. Based on the observations conducted in the study, it was revealed that
teachers did not provide sufficient wait time to students after posing a
question at secondary and tertiary level. Therefore it is recommended that
students should be allowed ample time for discovery and consolidation of
answers.
6. It was observed that the climate in many Pakistani classrooms inhibits
students’ from asking and answering questions. In such classrooms,
silence and order were the most important features and strict adherence to
teacher’s imposed rules was dutifully enforced. In such like situation
students minds did not grow and never totally engaged in learning.
Encouraging atmosphere should be created so that every hand is raised.
7. The observations in the study revealed that no careful planning for asking
the right questions was made. Therefore it is suggested that thorough
preparation and careful planning will assist teachers to ask better questions
so as to promote students’ critical thinking skills.
8. Majority of the teachers were unaware about the proper use of questioning
technique in the classrooms. Therefore, special training to teachers should
be given and six question levels based on Bloom’s Taxonomy (1956) may
be included in teacher education programme at all levels.
9. Teachers training programmes like workshops, symposium, and refresher
courses should be conducted on this vital issue as to familiarize teachers
with the different question levels of Blooms’ Taxonomy.

131
10. One of the problems might be the overcrowded classrooms in schools of
Khyber Pakhtunkhwa. This may also be one of the reasons of not asking
much questions in such classrooms. To minimize class strength for the
promotion of questioning culture in classrooms is also recommended.
11. The researcher by herself conducted the observations in the classrooms.
More than one observer should be employed in the future studies in order
to produce more authentic and reliable results.

132
LITERATURE CITED
Ackroyd, S., & Hughes, J. (1992). Data collection in context (2nd ed.). London:
Longman.
Agrosino, M.V. & Mays de Pérez, K.A. (2000.) Rethinking observation: From
method to context. In K.D. Denzin & Y.S. Lincoln (Eds.), Handbook of
qualitative research (2nd ed.)(pp. 673-702). Thousand Oaks, CA: Sage
Publications.
Allwright, D., & Bailey, K. (1991). Focus on the language classroom: An
introduction to classroom research for language teachers. Cambridge:
Cambridge University Press.
Althouse, R., Johnson, M.H. & Mitchell, S.T. (2003). The colors of learning:
integrating the visual arts into the early childhood curriculum
Bloom, B. S. (1956). Taxonomy of educational objectives; the classification of
educational goals,. New York: Longmans, Green.
Blosser, P. E. (2000). How to ask the right questions. Washington, DC: National
Science Teachers Association.
Bond, N. (2007). 12 questioning strategies that minimize classroom management
problems. Kappa Delta Pi Record, 18-21.
Borich, G. D. (2000). Effective teaching methods (4th Ed.). Upper Saddle River,
N.J.: Merrill.
Brophy, J., & Evertson, C. (1976). Learning from Teaching: A Developmental
Perspective. Boston: Allyn and Bacon.
Brown, G., & Wragg, E. (1993). Questioning. London: Routledge.
Bryman, A. (2001). Social research methods. Oxford: Oxford University Press.

133
Cecil, N. L., & Pfeifer, J. (2011). The art of inquiry questioning strategies for K-6
classrooms (2nd ed.). Winnipeg: Portage & Main Press.
Cecil, N.L. (1995) The Art of Inquiry: Questioning Strategies for K-6 Classrooms
Hignell Printing Limited Canada
Ciardiello, A. V. (1998). Did you ask a good question today? Alternative
cognitive and metacognitive strategies.Journal of Adolescent & Adult
Literacy, 42(3), 210-219.
Clement, M. C. (2005). First time in the high school classroom: essential guide for
the new teacher. Lanham, Md.: Scarecrow Education.
Colburn, A. (2003). The lingo of learning: 88 education terms every science
teacher should know. Victor Graphics, Inc. USA PAGE 33
Cooper, J. M. (2013). Classroom Teaching Skills: International ed of 10th
revised: ed. Belmont, CA: WADSWORTH PUBLISHING CO INC.
Critelli, A., & Tritapoe, B.(2010). Effective Questioning Techniques to Increase
Class Participation. E-Journal of Student Research, 2(1), 1-7.
Cruickshank, D., Jenkins, D., Metcalf K. (2009). The Act of Teaching. (5th ed.).
New York: McGraw-Hill.
Dana, N. F., & Hoppey, D. (2003). The reflective educator's guide to classroom
research: learning to teach and teaching to learn through practitioner
inquiry. Corwin Press: Thousand Oaks, Calif.
Denscombe, M. (2002). Ground rules for good research. Buckingham: Open
University Press.
Dillion, J. T. (1984). Research on Questioning and Discussion. Educational
Leadership, 42(3), 50-56.
Dumteeb, N. (2009). Teacher's questioning techniques and students' critical
thinking skills English language classroom in the Thai context.

134
Effective questioning (2). (n.d.). Upload & Share PowerPoint presentations and
documents Retrieved July 19, 2011, from:
http://www.slideshare.net/rowenativoli/effective-questioning-
23427422?src=related_normal&rel=4715703
Eggen, P., & Kauchak, D. (2007). Educational Psychology: windows on
classrooms (7th ed.). Upper Saddle River, NJ: Pearson Education.
Elementary & Secondary Education Department Khyebr Pakhtunkhwa- Official
Web Portal. (n.d.). Elementary & Secondary Education Department
Khyebr Pakhtunkhwa- Official Web Portal. Retrieved March 8, 2012, from
http://www.kpese.gov.pk/
Ellis, R. (1994). The study of second language acquisition. Oxford: Oxford
University Press.
Fisher, D., & Frey, N. (2007).Checking for understanding: formative assessment
techniques for your classroom. Alexandria, VA: Association for
Supervision and Curriculum Development.
Fusco, E. (2012). Effective questioning strategies in the classroom: a step-by-step
approach to engaged thinking and learning, K-8. New York: Teachers
College Press.
Gall, M. (1984). Synthesis of research on teachers questioning. Educational
Leadership, 2, 40- 47.
Garret, H. E. (1997). Statistics in Psychology and Research in Education,
6thEd.Combine Printers PVT.LTD, Lahore, Pakistan. 263
Gay, L.R, 2000, Competencies for Analysis and Application (5th ed) Educational
Research Florida International University Pp. 448-457
Goodlad, J. (1982). Let’s get on with reconstruction. Phi Delta Kappan, 64, 19-20.
Hastings, S. (2006). The complete classroom: issues and solutions for teachers.
London: Routledge/TES.

135
HEC Recognized Universities and Degree Awarding Institutions. (n.d.).Higher
Education Commission. Retrieved May 5, 2012, from:
http://www.hec.gov.pk/ourinstitutes/page
Henning, J. E. (2008). The art of discussion-based teaching opening up
conversation in the classroom. New York: Routledge.
Honea, J.M., Jr. (1982). “Wait-Time as an Instructional Variable: An Influence on
Teacher and Student.” The Clearing House, 56, 167–170.
Hunt, G. H., Wiseman, D. G., & Touzel, T. J. (2009). Effective Teaching
Preparation and Implementation. (4th ed.). Springfield: Charles C Thomas
Publisher, LTD.
Hussin, H. (2006). Dimensions of Questioning: A Qualitative Study of Current
Classroom Practice in Malaysia.TESL-EJ, 10(2), 1-18.
Jones, V., and L. Jones. 2004. Comprehensive classroom management: Creating
communities of support and solving problems, 7th ed. Boston: Pearson
Karen, S. Meador (1997). Creative thinking and problem solving for young
learners Englewood, CO United States of America
Kerry, T. (2002). Explaining and questioning ([New ed.). Cheltenham: Nelson
Thornes.
Khan, W. B., & Inamullah, H. M. (2011). A Study of Lower-order and Higher-
order Questions at Secondary Level. Asian Social Science, 7(9), 149-157.
Kvale, S. (1996). InterViews: An introduction to qualitative research interviewing.
Thousand Oaks: Sage Publications.
Lapp, D., Flood, J., & Farnan, N. (1989). Content area reading and learning:
instructional strategies. Englewood Cliffs, N.J.: Prentice Hall.
Ma, X. (2008). The Skills of Teacher’s Questioning in English Classes.
International Education Studies, 1(4), 92-100.

136
McDonald, E. S., & Hershman, D. M. (2010). Classrooms that spark!: recharge
and revive your teaching(2nd ed.). San Francisco, CA: Jossey-Bass.
Meador, K.S. (1997). Creative thinking and problem solving for young learners.
Englewood, CO, United States of America.
Moore, K. D. (1995). Classroom teaching skills (3rd ed.). New York: McGraw-
Hill Inc.
Moore, K. D., & Hansen, J. (2011).Effective Strategies for Teaching in K-8
classrooms. Thousand Oaks: SAGE Publications.
Morgan, N. & Saxton, J. (2006). (2nd Ed). Asking Better Questions 2nd edition
Pembroke Publishers 538 hood road markham Ontario Canada page 74
Morgan, N. & Saxton, J. (2006). Asking better questions, (2nd Ed) Pembroke
Publishers, Canada page 18
Morgan, N., & Saxton, J. (1994). Asking better questions. Markham, Ont.:
Pembroke Publishers.
Mustapha, G. (1997). An investigation into teachers' questions and tasks to
develop reading comprehension: the application of the Cogaff Taxonomy
in developing critical thinking in Malaysia. Leicester: University of
Leicester.
Muth, K. D., & Alverman, D. E. (1992). Teaching and learning in the middle
grades. Boston: Allyn and Bacon.
Nisa, S., & khan, A. A. (2012). Questioning Practices in A Social Studies
Classroom: A Case Study from Pakistan. International J. Soc. Sci. &
Education, 2(3), 474-482.
O’Flahavan, J., Hartman, D,. & Pearson, D. ( 1988). Teacher questioning and
feedback practices: A twenty-year retrospective.In J. Readence, R.
Baldwin, J. Konopak, & P.O’Keefe(Eds.), Dialogue in literacy research
(pp.183-208). Chicago: National Reading Conference.

137
Orlich, D. C., Harder, R. J., Callahan, R. C., Kauchak, D. P., & Gibson, H. W.
(1994). Teaching strategies: A guide to better instruction (4th ed.).
Lexington, MA: D. C. Heath and Company.
Orlich, D.C., Harder, R.J., Callahan, R.C., Trevisan, M.S. & Brown, A.H. (2007,
2010) (9th Ed). Teaching Strategies: A Guide to Effective Instruction.
Wadsworth, Cengage learning.
Ornstein, A. C. (1995). Strategies for effective teaching (2nd ed.). Madison, WI:
Brown & Benchmark.
Pagliaro, M. M. (2011). Exemplary classroom questioning: practices to promote
thinking and learning. Lanham, Md.: Rowman & Littlefield Education.
Partin, R. L. (2005). Classroom teacher's survival guide: practical strategies,
management techniques, and reproducibles for new and experienced
teachers (2nd ed.). San Francisco, CA: Jossey-Bass.
Perrott, E. (1990). Using questions in classroom discussion. In J. Brophy (Ed.),
Methods of teaching (pp. 50-62). London: The College of Perceptors.
Powell, D. L. (2010). Classroom Communication and Diversity Enhancing
Instructional Practice... New York: Taylor & Francis
Powell, R. G., & Caseau, D. (2004).Classroom communication and diversity
enhancing instructional practice. Mahwah, NJ: L. Erlbaum Associates.
Ralph, E. G. (2004). Pursuing instructional effectiveness in higher education: it's
about time!. New York: Nova Science Publishers.
Rowe, M. B. (1973). Teaching science as continuous inquiry. New York:
McGraw-Hill.
Rowe, M. B. (1974). Reflections on wait time: Some methodological questions.
Journal of Research in Science Teaching 11(3): 263–79.

138
Rowe, M. B. 1986. Wait times: Slowing down may be a way of speeding up!
Journal of Teacher Education 37(1): 43–50.
Ryan, K. & Cooper J.M. (2010. Those Who Can, Teach Wadsworth/Cengage
Learning Thomson Place Boston, USA PAGE 192
Shaunessy, E. (2005). Questioning Strategies for Teaching the Gifted. Prufrock
Press, Inc. Texas, USA
Sousa, D. A. (2009). How the gifted brain learns (2nd ed.). Thousand Oaks, Calif.:
Corwin.
Stevens, R. (1912). The question of measure of efficiency in instruction: A critical
study of classroom practice. Teachers College Contributions to Education,
No.48.
Stewart, D. (n.d.). How to Improve Your Questioning Techniques in the
Classroom | eHow.com. eHow | How to Videos, Articles & More - Trusted
Advice for the Curious Life| eHow.com. Retrieved July 19, 2011, from
http://www.ehow.com/how_7744692_improve-questioning-techniques-
classroom.html
Sulaiman, T., & Noordin, N. (2005). The application of question levels in the
teaching of year one primary school students. Journal of Science and
Mathematics Education in S.E. Asia, 28(2), 117-140.
Sullivan, R. L., & Wircenski, J. L. (2001). Effective classroom training
techniques: presentation skills & games. Alexandria, Va.: American
Society for Training & Development.
Tekene, L. M. (2006). Enhancing Teachers’ Questioning Skills to Improve
Children’s Learning and Thinking in Pacific Island Early Childhood
Centres. New Zealand Journal of Teachers’ Work,, 3(1), 12-23.
Tritapoe, A. C. (2010). Effective Questioning Techniques to Increase Class
Participation . E Journal of Student Research, 2(1), 7.

139
Walpole, R. E. (1968). Introduction to statistics,. New York: Macmillan.
Walsh, J. A., & Sattes, B. D. (2005).Quality questioning: research-based practice
to engage every learner. Thousand Oaks, CA: Corwin Press
Wood, D. (1998). How children think and learn. (2nd ed.). Oxford: Blackwell.
Wragg, E. C. (1984). Classroom teaching skills: the research findings of the
Teacher Education Project. London: Croom Helm
Zepeda, S. J. (2009). The instructional leader's guide to informal classroom
observations. Larchmont, N.Y.: Eye on Education.

140
APPENDICES
Appendix-1: Letter to the Director
From The director, Institute Of Education and Research, University of Peshawar
To The Principal/Chairman Government High School----------------/ University of…………………………
Subject: PERMISSION FOR OBSERVATION
Dear Sir,
Miss Wilayat Bibi, Ph.D, research scholar in the Institute of Education and
Research, is conducting research on “analysis of questioning leading to critical
thinking in the classrooms of Secondary Schools and Universities of Khyber
Pukhtunkhwa under the supervision of Dr. Hafiz Muhammad Inamullah. She
has to collect data related to the given topic for which your kind cooperation will
be highly appreciated. The observations will be done only for the purpose of
research. All the information will be kept confidential.
Thanks
Director, Institute Of Education and Research,

141
Appendix–2: Detail description of the Instrument
Observation Tool
Teacher: ------------- Date of observation: ---------------- Observer: --------------------------------
Class: -------------------- Period of the Day: -------------------
Time of observation: Start: --------------- End: ---------------------------------------
Total time spent in observation: ----------------------- No. of Students present: --------------
Grade Level: -----------------
Topic of the lesson: ---------------------------------------
Level of Thinking Knowledge Comprehension Application Analysis Synthesis Evaluation
Time Questions and Activities
Of
Spe
cifi
cs
Ter
min
olo
gy
Cla
ssif
icat
ion
& C
ateg
orie
s
The
ori
es &
str
uct
ure
s
Cri
teri
a m
eth
odo
log
y
Tre
nds
& s
equ
ence
s
Tra
nsl
atio
n
Inte
rpre
tati
on
Ext
rap
ola
tion
Man
ipu
lati
on
Dem
on
stra
tion
Of
Ele
men
ts
Rel
atio
nsh
ip
Org
. Pri
ncip
le
Pro
duc
tion
an
d u
niq
ue
Com
mu
nic
atio
n
Of
a P
lan
Der
ivat
ion
of
set
of
abst
ract
re
lati
ons
Judg
men
ts o
f te
rms
of
inte
rnal
ev
iden
ce
Dec
isio
n m
akin
g

142

143
Appendix–3: List of Universities and Schools
1. Public Sector Universities in Khyber Pakhtunkhwa
University of Peshawar, Peshawar
Abdul Wali Khan University, Mardan
Frontier Women University, Peshawar
Gomal University, D.I. Khan
Hazara University, Dodhial, Mansehra
Institute of Management Science, Peshawar (IMS)
Islamia College University, Peshawar
Khyber Medical University, Peshawar
Kohat University of Science and Technology, Kohat
Khyber Pakhtunkhwa Agricultural University, Peshawar
NWFP University of Engineering. & Technology, Peshawar
Shaheed Benazir Bhutto University, Sheringal, Dir
University of Malakand, Chakdara, Dir, Malakand
University of Science & Technology, Bannu
University of Swat, Swat

144
2. Secondary schools from different districts of Khyber Pakhtunkhwa
District Peshawar
GHS Gharib Abad Peshawar
GHS Hayat Abad Phase- I Peshawar
GHS Cantt- 1 Peshawar
GGHS Dabgari Garden Peshawar
GHS Sufaid Dheri Peshawar
District Mardan
GHS Lund Khawar Mardan
GGHS Lund Khawar Mardan
GHS Takht Bhai Mardan
GHSTakkar Mardan
GHS Mardan
District Malakand
GHS 1, Dargai Malakand
GGHS Sakha Kot Malakand
GHS Sakha Kot 1 Malakand
GHS 2, Dargai Malakand
District Swat
Govt. Girls High School Mingora No. 1
GHS Pishmal, Swat
GHS Gulibagh, Swat
Govt. Girls High School Barikot, Swat