Embed Size (px)
Citation preview
JOURNAL OF
Journal of Wind Engineering ~ [ ~ i ( _ ~ and Industrial Aerodynamics 56 (1995) 291-310 ELSEVIER
An analytical model for simulation of the wind field in a typhoon boundary layer
Y a n M e n g * , M a s a h i r o M a t s u i , K a z u k i H i b i
Environmental Engineering Department, Institute of Technology, Shimizu Corporation, No. 4-17, Etchujima, 3-chome, Koto-ku, Tokyo 135, Japan
Received 12 March 1994; accepted 13 May 1994
Abstract
An analytical model has been developed for calculating the wind field in a moving typhoon boundary layer. The present model has an upper inviscid layer of cyclostrophic balance and a lower friction layer controlled by a surface drag coefficient and eddy viscosity. Velocity in the inviscid region is described first, using the assumption that the wind field moves with the translation velocity of the typhoon. Perturbation analysis is then performed to obtain the tangential and radial boundary layer velocity in the friction region. Wind speeds and directions predicted by the present model agree favorably with observations obtained at a 100 m height tower during three typhoons in 1991. Rapid variations in wind speed due to surface roughness and topography around the tower are also amply demonstrated. In the final section of this paper, a case study is presented to examine the wind field associated with a typhoon, as well as the characteristics of the ratio of surface to gradient wind speeds G(r) and the inflow angle 7. The results indicate that previous observation data obtained at coastal areas during typhoons can be explained satisfactorily by this model.
Nomenclature
P P~ Pw Ap B
pressure, function of r central (minimum) pressure per iphery pressure Pw -- Pc, central pressure difference pressure profile cons tan t
* Corresponding author.
0167-6105/95/$09.50 © 1995 Elsevier Science B.V. All rights reserved SSDI 0 1 6 7 - 6 1 0 5 ( 9 4 ) 0 0 0 1 4 - 5
292 Y. Meng et al.,,J. Wind Eng. Ind. Aeroclvn. 56 (1995) 291- 310
r rm P ¢
f 20 d h Z, ,7,'
ZI0 A Ca / - - i = x / - I D = D1 + iD2 G(r) G(oo), xv, k, G(xp)
0 7'
P km
= 0.40 3 ,2 Z
Subscripts 0 r
g S
radial distance from typhoon center radius of maximum winds wind velocity translation velocity of typhoon Coriolis parameter equivalent roughness length zero-plane displacement mean height of roughness elements vertical coordinate height 10 m above the mean height of roughness elements constant drag coefficient
complex unit complex constant ratio of surface to gradient wind speeds
fitting parameters approach angle, counterclockwise positive from East angle, counterclockwise positive from East inflow angle air density eddy viscosity Karman constant see Eq. (19) see Eq. (26)
component in the tangential direction component in the radial direction value at the gradient height value on the ground surface
1. Introduction
For wind-resistant structural design, the design wind speed is often determined from statistical probability analysis based on field data. For many coastal regions in Japan, as in most areas on the western rim of the Pacific Ocean, the highest recorded wind speeds are caused by typhoons. Design wind loads for engineering structures in these areas are therefore governed by this factor. In order to reasonably determine design wind loads for such structures by means of standard statistical techniques, at least several decades of annual extreme wind observations would be needed at the proposed construction site. However, such data bases, which would allow
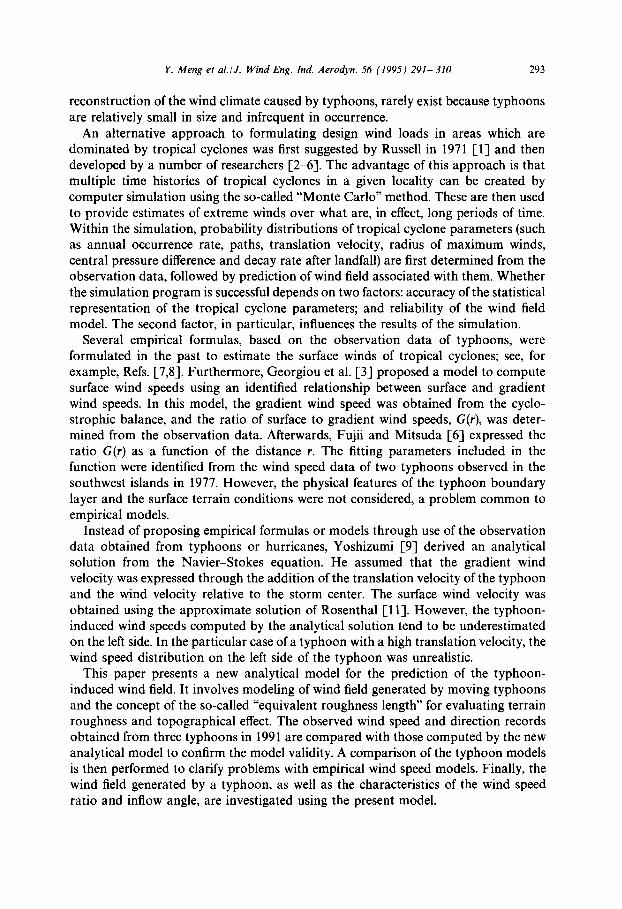
Y. Meng et al./J. Wind Eng. Ind. Aerodyn. 56 (1995) 291- 310 293
reconstruction of the wind climate caused by typhoons, rarely exist because typhoons are relatively small in size and infrequent in occurrence.
An alternative approach to formulating design wind loads in areas which are dominated by tropical cyclones was first suggested by Russell in 1971 [1] and then developed by a number of researchers [2-6]. The advantage of this approach is that multiple time histories of tropical cyclones in a given locality can be created by computer simulation using the so-called "Monte Carlo" method. These are then used to provide estimates of extreme winds over what are, in effect, long periods of time. Within the simulation, probability distributions of tropical cyclone parameters (such as annual occurrence rate, paths, translation velocity, radius of maximum winds, central pressure difference and decay rate after landfall) are first determined from the observation data, followed by prediction of wind field associated with them. Whether the simulation program is successful depends on two factors: accuracy of the statistical representation of the tropical cyclone parameters; and reliability of the wind field model. The second factor, in particular, influences the results of the simulation.
Several empirical formulas, based on the observation data of typhoons, were formulated in the past to estimate the surface winds of tropical cyclones; see, for example, Refs. I-7,8]. Furthermore, Georgiou et al. [3] proposed a model to compute surface wind speeds using an identified relationship between surface and gradient wind speeds. In this model, the gradient wind speed was obtained from the cyclo- strophic balance, and the ratio of surface to gradient wind speeds, G(r), was deter- mined from the observation data. Afterwards, Fujii and Mitsuda [6] expressed the ratio G(r) as a function of the distance r. The fitting parameters included in the function were identified from the wind speed data of two typhoons observed in the southwest islands in 1977. However, the physical features of the typhoon boundary layer and the surface terrain conditions were not considered, a problem common to empirical models.
Instead of proposing empirical formulas or models through use of the observation data obtained from typhoons or hurricanes, Yoshizumi [9] derived an analytical solution from the Navier-Stokes equation. He assumed that the gradient wind velocity was expressed through the addition of the translation velocity of the typhoon and the wind velocity relative to the storm center. The surface wind velocity was obtained using the approximate solution of Rosenthal [11]. However, the typhoon- induced wind speeds computed by the analytical solution tend to be underestimated on the left side. In the particular case of a typhoon with a high translation velocity, the wind speed distribution on the left side of the typhoon was unrealistic.
This paper presents a new analytical model for the prediction of the typhoon- induced wind field. It involves modeling of wind field generated by moving typhoons and the concept of the so-called "equivalent roughness length" for evaluating terrain roughness and topographical effect. The observed wind speed and direction records obtained from three typhoons in 1991 are compared with those computed by the new analytical model to confirm the model validity. A comparison of the typhoon models is then performed to clarify problems with empirical wind speed models. Finally, the wind field generated by a typhoon, as well as the characteristics of the wind speed ratio and inflow angle, are investigated using the present model.
2 9 4 Y. Meng et al./.l. Wind Eng. Ind. Aerodyn. 56 (1995) 291 310
2. An analytical solution for typhoon-induced wind field
2.1. Model
It is well known that the pressure isobars in the domain of a typhoon are distributed in approximately concentric circles with respect to the center of the typhoon. This pressure is usually computed from the relationship proposed by Holland [-11],
p = p~ + Ap exp[ - (rm/r)8]. (1)
In the case of B = 1.0, this relationship becomes the Schloemer empirical formula [12]. Considering that the strong wind field in a lower typhoon boundary layer is in a neutral condition [13], the equation of motion can be written as
(?v 1 - - + v . V v = - V p - f k x v + F . (2) ~?t p
Because the vertical scale of the typhoon (10 km) is much less than its horizontal scale (1000 km), the hydrostatic approximation is valid. In this study, the typhoon-induced wind velocity v is expressed by the addition of the gradient wind Vg in the free atmosphere (called GW hereafter), and the component v', caused by the friction on the ground surface, as
v = Vg+ v'. (3)
Since the radial pressure gradient does not vary with height in the lower typhoon boundary layer, and the frictional force F is negligible above the boundary layer, the equation of motion (2) can be divided into the following two formulas,
?vg 1 Vp - f k x Vg, (4) i)~- + Vg. Vvg = - P
?t + v ' .Vv' + v'.Vvg + vg. Vv' = - f k x v' + F. (5)
In order to analytically solve Eqs. (4) and (5), modeling of the unsteady terms in these equations is carried out as follows: (a) In the free atmosphere, the gradient wind pattern vg moves at the translation velocity of the typhoon c. Therefore, the unsteady term in Eq. (4) becomes
(~Ug __ gt c- Vvg. (6)
(b) In the typhoon boundary layer, the unsteady term in Eq. (5) is considered smaller than the viscosity term and the inertia term, and is disregarded as
~t 0. (7)
Y. Meng et al.IJ. Wind Eng. Ind. Aerodyn. 56 (1995) 291- 310 295
(a) (b) N
Z Z' / ~ w,o<~.ofMo,o.
/ . . . / \z~ \
t Z l ~ / ' '" / ' - \ ' I ~ / "~i / I I ' ~ i \ I • E
~. "./ o . ~ . f / ~ / (0=0) h d x\\ I I/" - . \ , . I ~ / /
Z=0 , \,. / / " ' ~ / / - ~ I / / /
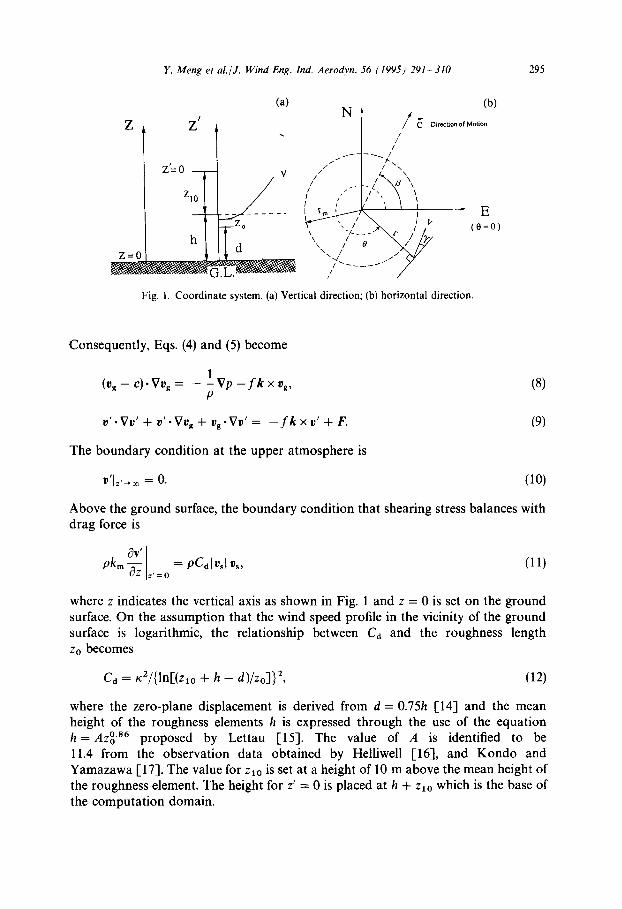
Fig. 1. Coordinate system. (a) Vertical direction; (b) horizontal direction.
Consequently, Eqs. (4) and (5) become
1 ( v ~ - c)" Vvg = - - Vp - f k x vg, (8)
P
v ' . V v ' + v ' . V v g + rg. Vv' = - f k x v ' + F. (9)
The boundary condition at the upper atmosphere is
v ' l z ,~ = 0. (10)
Above the ground surface, the boundary condition that shearing stress balances with drag force is
63V' z' = o p k m ~ = P f d l v s l v s , (11)
where z indicates the vertical axis as shown in Fig. 1 and z = 0 is set on the ground surface. On the assumption that the wind speed profile in the vicinity of the ground surface is logarithmic, the relationship between Cd and the roughness length Zo becomes
C d = x2/{ln[(zlo + h - d)/zo]} 2, (12)
where the zero-plane displacement is derived from d = 0.75h [14] and the mean height of the roughness elements h is expressed through the use of the equation h = A z °'86 proposed by Lettau [15]. The value of A is identified to be 11.4 from the observation data obtained by Helliwell [16], and Kondo and Yamazawa 1-17]. The value for Zlo is set at a height of 10 m above the mean height of the roughness element. The height for z' = 0 is placed at h + Zlo which is the base of the computation domain.
296 Y. Meng et al.,J. Wind l~)tg. Ind. Aero~lvn. 56 (1995) 291 310
2.2. Wind velocity.field in the /ree atmosphere
Since the pressure isobars in the domain of a moving typhoon are axisymmetrical with respect to the center of the typhoon, the cylindrical coordinate system is used, and Eq. (g) is written as
(v~g - or) -~--- + ('r r ?0 r r p Or + lbog, (13)
(Urg Cr) CUOg l!Og - - C 0 (2l!Og l!Ogl?rg I!rgCO - - - - + + - . f i : ~ g , (141
c~'r r ~0 r r
where cr = c cos(0 - [:t) and c~, - c sin(0 - [4). Considering that the radial velocity v~g is smaller than the tangential velocity v0= in the free a tmosphere , the first and second convect ion terms on the left-hand side of Eq. (13) are disregarded. The wind velocity v~, is expressed approximate ly as
t :0 ,=½(~, - , / t ' )+k\ , 2 / + p ; r t (15)
This expression of the gradient wind field has the same form as that obta ined from the equat ion of cyclostrophic balance in which the centrifugal acceleration, in the pres- ence of general t yphoon translation, is calculated using Blaton's formula. The radial velocity v~g can be obtained from the equat ion of continuity as follows,
r
G g - ! ?V°g dr (16) r ! ?0
Considering approx imate accuracy Vrg is set at 0 in this study.
2.3. Velocity component v' caused by ground surlace fi'iction
Per turbat ion analysis is performed to obtain the distribution of v' in the vertical direction. The velocity componen t s of vl, v'r are assumed to be small compared with the gradient wind, and the first derivative of the velocity componen t s with respect to 0 are presumably small compared with the velocity components . The equat ion of mot ion (9) can be linearized with these considerat ions as
- 2 V0gr + / v'0 = km ~-~-,z_ (17)
I UOI - ; + --- + v', = km • (18)
t"
Y. Meng et al./J. Wind Eng. Ind. Aerodyn. 56 (1995) 291- 310 291
Introducing the following two abbreviations,
and rearranging Eqs. (17) and (18) gives
2A2u” _ a26 e
az2 ’
_ 2~2v” _ a26 I
a22 ’
(19)
(20)
(21)
where vi = vb and v:’ = - vi/t. Multiplication of Eq. (20) by i and addition of the result to Eq. (21) produces
a2d~ ~ - [(l + i) A12C = 0, az2 (22)
and the solution satisfying the boundary condition (10) is
v” = Dexp[ - (1 + i) AZ’], (23)
where D( = D1 + iD2) is a complex constant found from the boundary condition above the ground surface. The velocity components are obtained as
vk = e-““‘CD, cos(lz’) + D, sin(lz’)], (24)
u’, = - <e-““‘CD, cos(Az’) - D, sin(Az’)] , (25)
where
D, = _ x(x + 11% - xv,/5 1+(x+1)2 ’
D 2
= Peg + x(x + 1)4,/5 1 + (x + 1)2 ’
1( = ~IvsI = $J_ m m
(26)
Since v, is included in the formula of x, the value of v B, v, must be found from iterated computation. The gradient wind velocities of veg, urg are used for the initial value of uos, u,,. The eddy viscosity is fixed at 100 m”/s in reference to the value [18,9] obtained from hurricane observation. The air density p is set at 1.2 N s2/m4.
298 Y. Meng et al./J. Wind Eng. Ind. Aerodyn. 56 (1995) 291 310
3. An application for simulating three typhoons
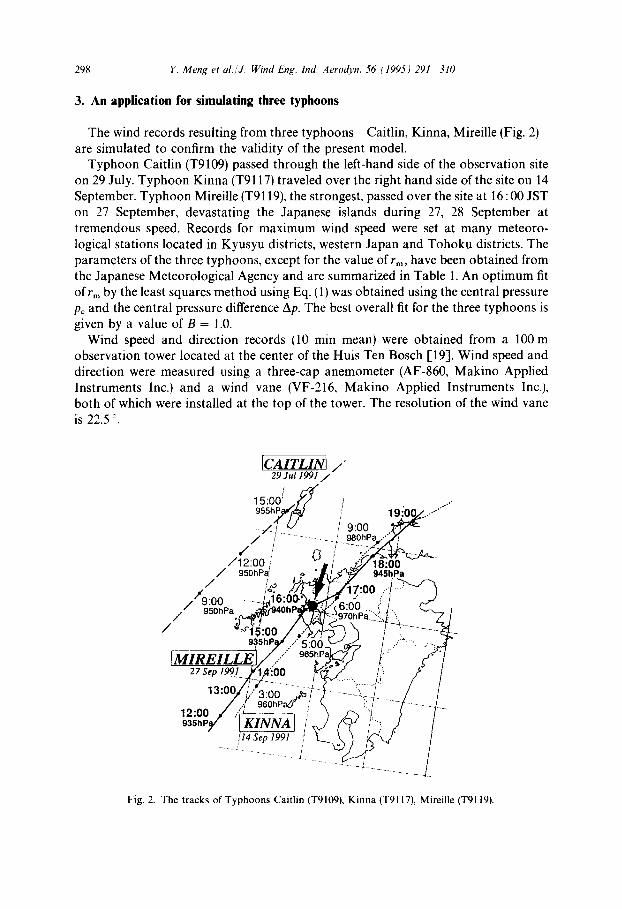
The wind records resulting from three typhoons - Caitlin, Kinna, Mireille (Fig. 2) are simulated to confirm the validity of the present model.
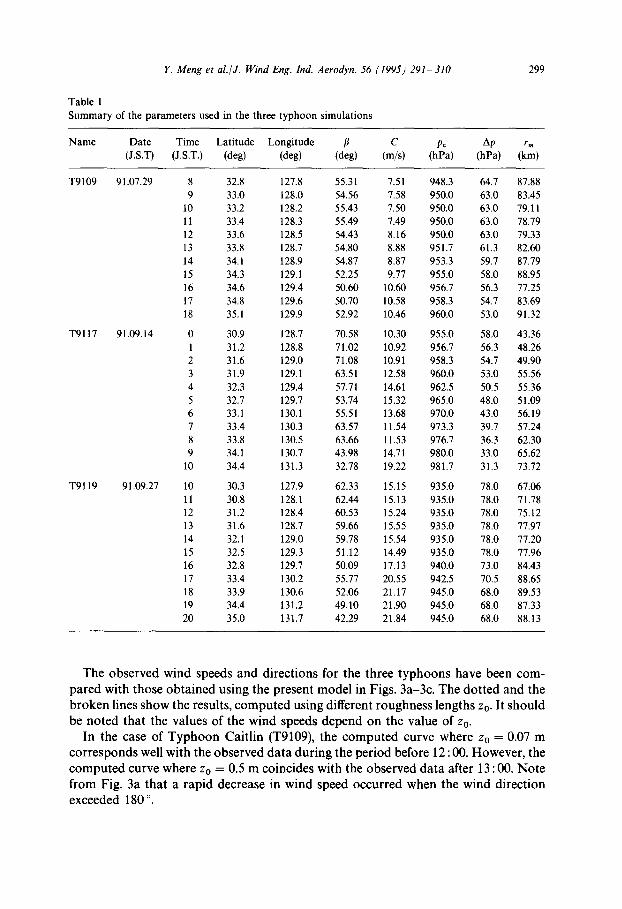
Typhoon Caitlin (T9109) passed through the left-hand side of the observation site on 29 July. Typhoon Kinna (T9117) traveled over the right hand side of the site on 14 September. Typhoon Mireille (T9119), the strongest, passed over the site at 16:00 JST on 27 September, devastating the Japanese islands during 27, 28 September at tremendous speed. Records for maximum wind speed were set at many meteoro- logical stations located in Kyusyu districts, western Japan and Tohoku districts. The parameters of the three typhoons, except for the value of rm, have been obtained from the Japanese Meteorological Agency and are summarized in Table 1. An optimum fit ofrm by the least squares method using Eq. (1) was obtained using the central pressure Pc and the central pressure difference Ap. The best overall fit for the three typhoons is given by a value of B = 1.0.
Wind speed and direction records (10 min mean) were obtained from a 100m observation tower located at the center of the Huis Ten Bosch [19]. Wind speed and direction were measured using a three-cap anemometer (AF-860, Makino Applied Instruments Inc.) and a wind vane (VF-216, Makino Applied Instruments Inc.), both of which were installed at the top of the tower. The resolution of the wind vane is 22.5 °
ICAITLINJ / 29 Jul 1991 /
15:00 / ~ / ..... 955hP~/~ ] 1 ~ ........
/ l /-J / 900 / / .................. / _~'OhPa.''21
/12:00 / =, / / 950hPa' ,a, " ~ / ~ 945hPa / ~ L ~ , ~ ~g~.....,/, ; ,-~
/'9"00 ..... -.-1-~16:~~ n"~- ,.i ! c- -g -/ 9 o,P. ,." .... / ,c~v?- .'~ I~z!97hPO a ".,.i. ~ /
, . f . . . . . :q - . -A ...... . . . . . . . . . .
9 shf, / i --' $7
~ i i i . _ / / " I * . . . . . . . . . . . . . . . . . z ~, --/"
/ ......... L._ 1 2 ~ -, i ~ ~"i: J I .... 935.P~ I KINNAI i ,,J {S~J /'., ) /
.... /14Sep1991 / ~ ~ ' ' ' ~ ~ k IN ]
Fig. 2. The tracks of Typhoons Caitlin (T9109), Kinna (T9117), Mireille (T9119).
Y. Meng et al./J. Wind Eng. Ind. Aerodyn. 56 (1995) 291- 310
Table 1 Summary of the parameters used in the three typhoon simulations
299
Name Date Time Latitude Longitude fl C Pc Ap rm (J.S.T) (J.S.T.) (deg) (deg) (deg) (m/s) (hPa) (hPa) (kin)
T9109 91.07.29 8 32.8 127.8 55.31 7.51 948.3 64.7 87.88 9 33.0 128.0 54.56 7.58 950.0 63.0 83.45
10 33.2 128.2 55.43 7.50 950.0 63.0 79.1 l 11 33.4 128.3 55.49 7.49 950.0 63.0 78.79 12 33.6 128.5 54.43 8.16 950.0 63.0 79.33 13 33.8 128.7 54.80 8.88 951.7 61.3 82.60 14 34.1 128.9 54.87 8.87 953.3 59.7 87.79 15 34.3 129.1 52.25 9.77 955.0 58.0 88.95 16 34.6 129.4 50.60 10.60 956.7 56.3 77.25 17 34.8 129.6 50.70 10.58 958.3 54.7 83.69 18 35.1 129.9 52.92 10.46 960.0 53.0 91.32
T9117 91.09.14 0 30.9 128.7 70.58 10.30 955.0 58.0 43.36 1 31.2 128.8 71.02 10.92 956.7 56.3 48.26 2 31.6 129.0 71.08 10.91 958.3 54.7 49.90 3 31.9 129.1 63.51 12.58 960.0 53.0 55.56 4 32.3 129.4 57.71 14.61 962.5 50.5 55.36 5 32.7 129.7 53.74 15.32 965.0 48.0 51.09 6 33.1 130.1 55.51 13.68 970.0 43.0 56.19 7 33.4 130.3 63.57 I 1.54 973.3 39.7 57.24 8 33.8 130.5 63.66 11.53 976.7 36.3 62.30 9 34.1 130.7 43.98 14.71 980.0 33.0 65.62
10 34.4 131.3 32.78 19.22 981.7 31.3 73.72
T9119 91.09.27 10 30.3 127.9 62.33 15.15 935.0 78.0 67.06 11 30.8 128.1 62.44 15.13 935.0 78.0 71.78 12 31,2 128.4 60.53 15.24 935.0 78.0 75.12 13 31.6 128.7 59.66 15.55 935.0 78.0 77.97 14 32.1 129.0 59.78 15.54 935.0 78.0 77.20 15 32.5 129.3 51.12 14.49 935.0 78.0 77.96 16 32.8 129.7 50.09 17.13 940.0 73.0 84.43 17 33.4 130.2 55.77 20.55 942.5 70.5 88.65 18 33.9 130.6 52.06 21.17 945.0 68.0 89.53 19 34.4 131.2 49.10 21.90 945.0 68.0 87.33 20 35.0 131.7 42.29 21.84 945.0 68.0 88,13
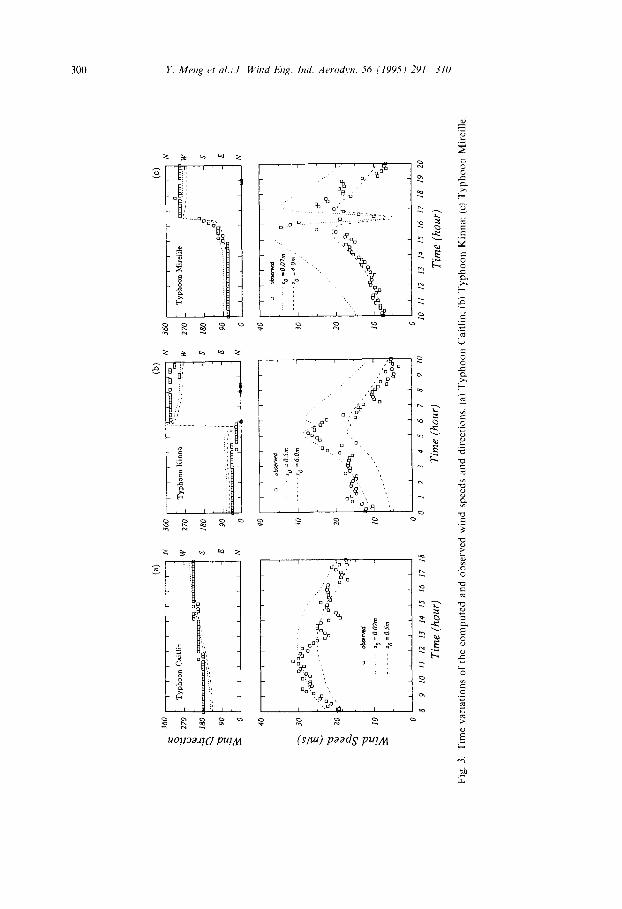
The observed wind speeds and directions for the three typhoons have been com- pared with those obtained using the present model in Figs. 3a-3c. The dotted and the broken lines show the results, computed using different roughness lengths Zo. It should be noted that the values of the wind speeds depend on the value of Zo.
In the case of Typhoon Caitlin (T9109), the computed curve where Zo = 0.07 m corresponds well with the observed data during the period before 12:00. However, the computed curve where Zo = 0.5 m coincides with the observed data after 13 : 00. Note from Fig. 3a that a rapid decrease in wind speed occurred when the wind direction exceeded 180 ° .
(a)
360
N
~b
270
Typ
hoon
Cai
tlin
W
L ~-
° -4
~ ; '
- ' =
~'~%
......
.. =""
::i
"~
/80
....
.. '.~2
Y:':
s
90
E
~:
0 I
I ~
I I
N
(b)
(c)
......
. ....
.......
f .
..
..
..
..
I ! ....
° 27
0 T
ypho
on K
inna
"-
: z-
:.:.:
:~.:.
m_.
W
27
0 T
ypho
on M
lred
le
ma:
m:~
.~..
W
J
;.
....
....
.
90
E 90
...
......
...
~°o "~
t:t
40
tl
~l
l
3O
20
10
o g
%%
g-'
,9o
"
.. 'o
oo
.
..g"
...
. --
-~;;o
-o..
o • $
o .-
o
o ~
#
~
o-.
c
G
o&~r
~d
. z
0 =
O.0
7m
....
. zo
=O
.Sm
0 [
I ¢
I ¢
I I
{ I
8 9
10
11
12
13
14
15
16
17
18
Tim
e (h
our)
40
30
i i
i i
i i
i
D
obse
rved
z 0 =
05m
- -
z 0
=6.
0m
"~..
. .'o
m.
20
o o
°D
n
o .
o o
oo6~
. '
a ..
-
10
:6
"-.
•
---"
d o
0 I
I I
I I
I I
i I
0 1
2 3
4 5
6
7 8
91
0
Tim
e (h
our)
40
~ ob
serv
ed
• •
z 0
=O
.07m
~
' •
30
- -
z o =
40
m
~D
• ~
20
~ '
10
ii
12
13
14
15
16
17
i8
19
20
Tim
e (h
our)
Fig
. 3.
T
ime
var
iati
on
s o
f th
e co
mp
ute
d
and
o
bse
rved
w
ind
sp
eed
s an
d
dir
ecti
on
s.
(a)
Ty
ph
oo
n
Cai
tlin
: (b
) T
yp
ho
on
K
inn
a:
(c)
Ty
ph
oo
n
Mir
eill
e.
&
,.....
Y. Meng et al./J. Wind Eng. Ind. Aerodyn. 56 (1995) 291 310 301
Fig. 4. Topography around the observation site. The shadowed areas are higher than 50 m.
With regard to Typhoon Kinna (T9117), the calculated curve where Zo = 0.5 m corresponds to the observation data before 6:00. However, the calculated curve where Zo = 6.0 m coincides with the observation data during the period after 6:00. During particularly strong winds, the wind direction ranged between 0 ° and 30 °
Regarding Typhoon Mireille (T9119), although the value obtained using Zo = 4.0 m corresponds to observation values before 15:30, the data observed during the period from 15:40 to 16 : 20 corresponds well with the results computed using Zo -- 0.07 m. It should be noted from Fig. 3c that the wind speed changed rapidly when the wind direction exceeded 90 °
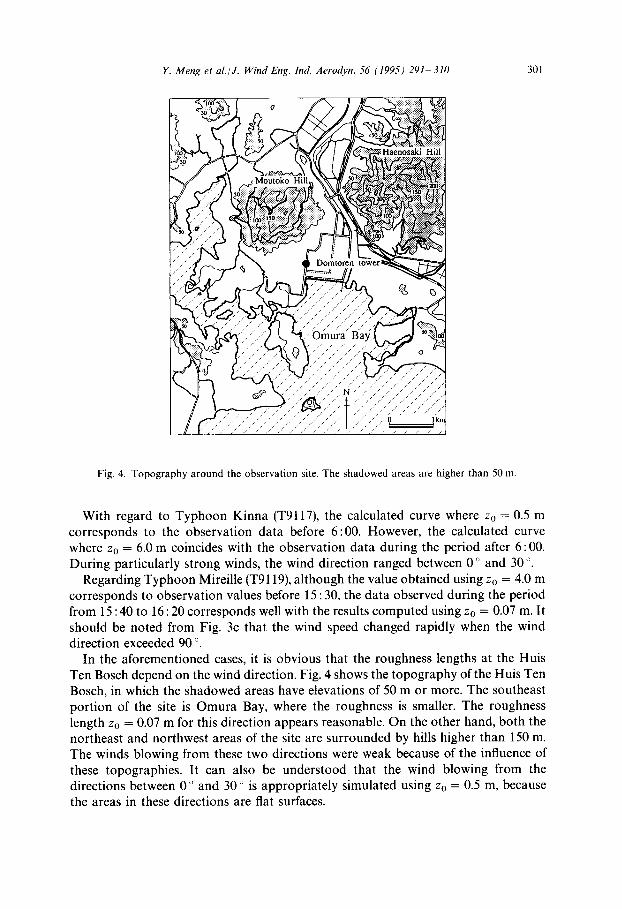
In the aforementioned cases, it is obvious that the roughness lengths at the Huis Ten Bosch depend on the wind direction. Fig. 4 shows the topography of the Huis Ten Bosch, in which the shadowed areas have elevations of 50 m or more. The southeast portion of the site is Omura Bay, where the roughness is smaller. The roughness length Zo = 0.07 m for this direction appears reasonable. On the other hand, both the northeast and northwest areas of the site are surrounded by hills higher than 150 m. The winds blowing from these two directions were weak because of the influence of these topographies. It can also be understood that the wind blowing from the directions between 0 ° and 30 ° is appropriately simulated using Zo = 0.5 m, because the areas in these directions are flat surfaces.
302 Y. Meng et al.,,Y. Wind Eng. Ind. Aerodvn. 56 (1995) 291 310
(Moutoko Hill H=150m ) (Haenosaki Hill H=200m )
W E
S • equivalent roughness :z 0
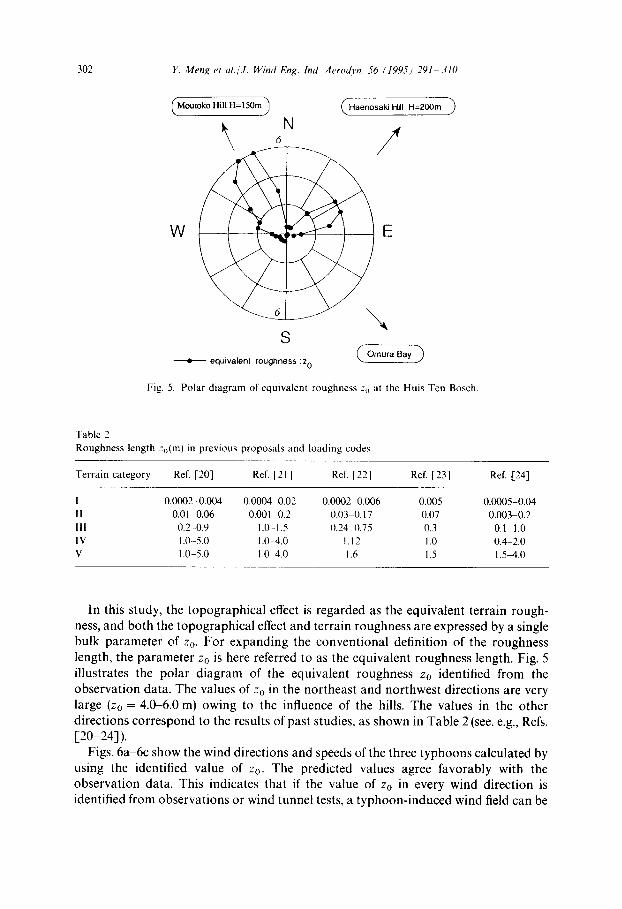
Fig. 5. Polar diagram of equivalent roughness Zo at the Huis Ten Bosch.
Table 2 Roughness length zo(m) in previous proposals and loading codes
Terrain category Ref. [20] Ref. [21] Ref. [22] Ref. [23] Ref. [24]
I 0.0002 0.004 0.0004 0.02 0.0002 0.006 0.005 0.0005 0.04 I1 0.01 0.06 0.001 0.2 0.03 0.17 0.07 0.003-0.2 III 0.2 0.9 1.0 1.5 0.24 0,75 0.3 0.1 1.0 1V 1.0 5.0 1.0 4,0 1.12 1.0 0.4 2.0 V 1.0 5.0 1.0 4.0 1.6 1.5 1.5~4.0
In this study, the topographical effect is regarded as the equivalent terrain rough- ness, and both the topographical effect and terrain roughness are expressed by a single bulk parameter of Zo. For expanding the conventional definition of the roughness length, the parameter Zo is here referred to as the equivalent roughness length. Fig. 5 illustrates the polar diagram of the equivalent roughness Zo identified from the observation data. The values of z0 in the northeast and northwest directions are very large (Zo = 4.(~6.0 m) owing to the influence of the hills. The values in the other directions correspond to the results of past studies, as shown in Table 2 (see. e.g., Refs. [20-24]).
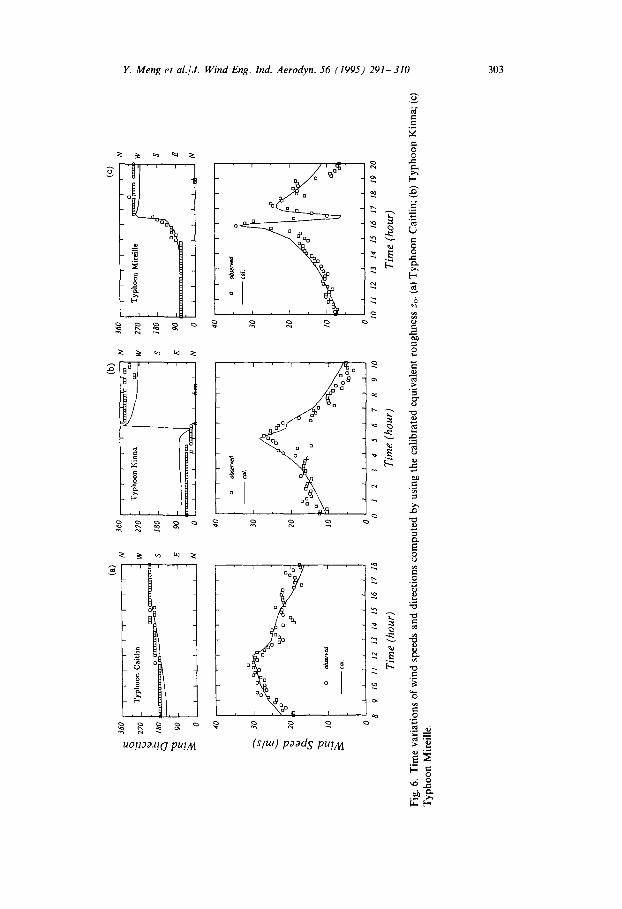
Figs. 6a 6c show the wind directions and speeds of the three typhoons calculated by using the identified value of Zo. The predicted values agree favorably with the observation data. This indicates that if the value of Zo in every wind direction is identified from observations or wind tunnel tests, a typhoon-induced wind field can be
(a)
(b)
.~
Typh
oon
Kin
na
270
Typh
oon
Cai
tlin
~
W
270
W
~ 18
0 L
..
..
..
..
..
..
..
..
..
.o
~,~
,~
......
......
. '~'
s :8
0 s
90
E 9
0
E
0 I
I I
I I
t N
0
1='"
'1"'
"'1
....
....
....
. ~
x~
i N
40
il
ll
ll
II
I
-".
30
x_.
"~
20
,
10
ta
ta
ob~r
,#*~
d
cal
9 to
11
t2
~3
14
15
t6
t7
~8
Tim
e (h
ou
r)
40
u
i i
i u
r i
u u
o ob
.u:r
ved
cal,
3O
10
a
0 I
I I
I )
I 1
~ I
1 2
3 4
5 6
7 8
9 10
Tim
e (h
our)
36
0
270
180
90 0
Cc)
i n
1 t
u I
n QI
u~
N
Typh
oon
Mir
eill
e ~
40
t
qt
ql
ll
tl
30
20
IO
a ob
serv
ed
cal. J
0 I
I I
I I
I I
I I
10
11
12
13
14
15
16
17
18
19
20
Tim
e (h
our)
Fig.
6.
Tim
e va
riat
ions
of w
ind
spee
ds a
nd d
irec
tions
com
pute
d by
usi
ng th
e ca
libra
ted
equi
vale
nt r
ough
ness
Zo.
(a) T
ypho
on C
aitli
n; (
b) T
ypho
on K
inna
; (c
) T
ypho
on M
irei
lle.
r~
t.,n
o~
x~
t~ I
304 Y. Meng el al.,J. Wind £)lg. Ind. Aerodvn. 56 (1995) 291 310
30
& "~ 20
(a) 40
a 7"9109 A l l
• T9117 ~'i 7 / /~
a T9119 . ~ - - t~
"o. i
0 ' , I _ _ ~ , _ _ 0 0 10 20 30 40
Observed Wind Speed (m/s)
360
~ 270 c~
...~
JSO
g
c~
90
(b)
7'i,: / . " = ~ ~ , ,
0 90 180 270 360
Observed Wind Direction (deg.)
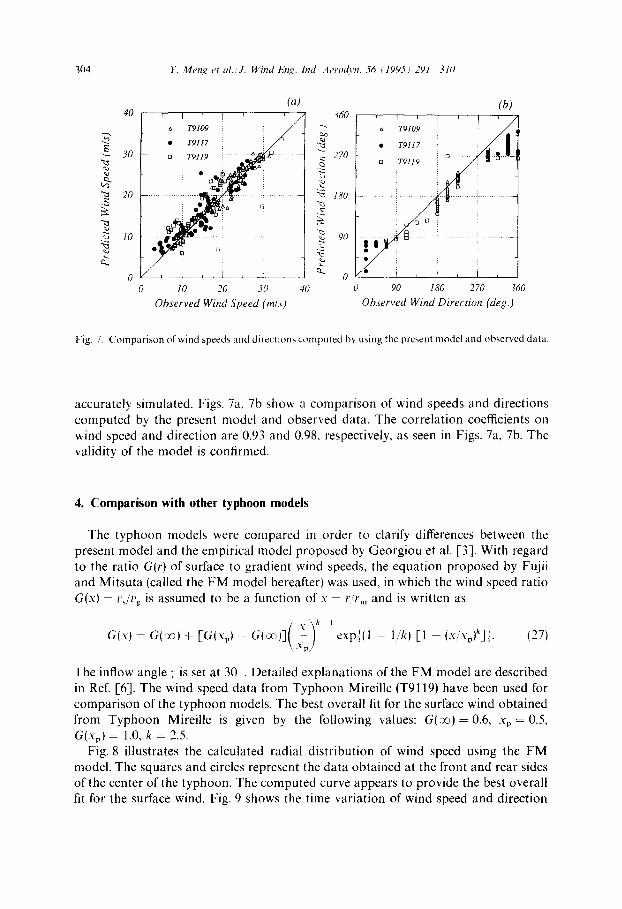
Fig. 7. C o m p a r i s o n of wind speeds a n d d i rec t ions c o m p u t e d bw using the present mode l a n d obse rved da t a .
accurately simulated. Figs. 7a, 7b show a comparison of wind speeds and directions computed by the present model and observed data. The correlation coefficients on wind speed and direction are 0.93 and 0.98, respectively, as seen in Figs. 7a, 7b. The validity of the model is confirmed.
4. Comparison with other typhoon models
The typhoon models were compared in order to clarify differences between the present model and the empirical model proposed by Georgiou et al. [3]. With regard to the ratio G(r) of surface to gradient wind speeds, the equation proposed by Fujii and Mitsuta (called the FM model hereafter) was used, in which the wind speed ratio G(x) = vSv~ is assumed to be a function of x = r/r m and is written as
(-7' G(x) = G(oo) + [G(Xp) - Gt~;o)] x expl(l - l/k) [1 - (x/'.'%)k]~. (27)
The inflow angle ), is set at 30 . Detailed explanations of the FM model are described in Ref. [6]. The wind speed data from Typhoon Mireille (T9119) have been used for comparison of the typhoon models. The best overall fit for the surface wind obtained from Typhoon Mireille is given by the following values: G ( ~ ) = 0.6, Xp = 0.5, G(xp) = 1.0, k = 2.5.
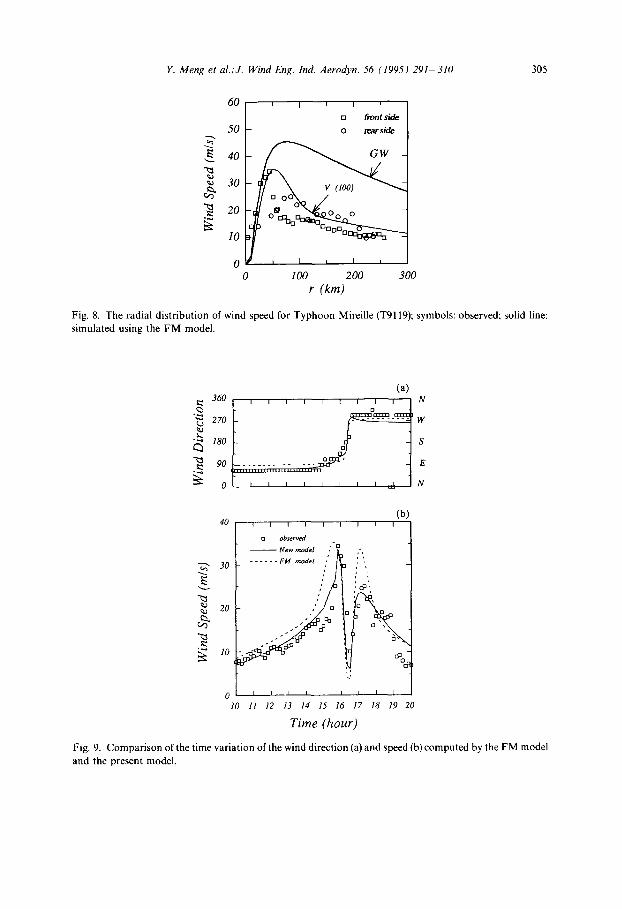
Fig. 8 illustrates the calculated radial distribution of wind speed using the FM model. The squares and circles represent the data obtained at the front and rear sides of the center of the typhoon. The computed curve appears to provide the best overall fit for the surface wind. Fig. 9 shows the time variation of wind speed and direction
Y. Meng et al./J. Wind Eng. Ind. Aerodyn. 56 (1995) 291-310 305
~o
.g
60
50
40
30
20
10
0 0
i I i I '
[] f i l o n t s i d e
0 r e a r s i d e
i I ~ I i
100 200 300 r (km)
Fig. 8. The radial distribution of wind speed for Typhoon Mireille (T9119); symbols: observed; solid line: simulated using the FM model.
(a) ~ 3 6 o | , , , , i t , , , 1 N
180 S S
(b) 4 0 I I i I
30
~ 20
0 10
I ~ i I I
o obs~rv~
. . . . . .
""/// q3QJ~ I I I I I I
l! 12 13 14 ]5 16 17
Time (hour)
% i
I I
18 19 20
Fig. 9. Comparison of the time variation of the wind direction (a) and speed {b) computed by the FM model and the present model.
306 Y. Meng et al./Y. Wind Eng. Ind. Aerodyn. 56 (1995) 291 310
computed by the FM model and the present model, as well as the observation data. Although there is little difference between the models with regard to wind direction, the wind speed calculated after 16 : 00 by the FM model is overestimated. It is obvious in this case that the wind speed ratio depends not only on the radial distance from the typhoon center but also on the wind direction, because of the heterogeneity of surface roughness and topography around the observation site.
400
"~ Direction of Motion (a)
200
-200
-400 -400 -200 0 200 400 (km)
400
200
-200
"~ Direction of Motion (b)
/ /
/ /
J4 10 15
\ \
\
\ \
\ \
,i
/ /
/ : /
/ /
/ /
U(m/s)
25 20 15 10
-400 - - -400 -200 0 200 400 (km)
Fig. 10. Contours of wind speed calculated using the present model. (a) Gradient wind speed; (b) surface wind speed.
Y. Meng et al.IJ. Wind Eng. Ind. Aerodyn. 56 (1995) 291-310 307
5. Wind speed ratio G(r) and inflow angle 7
It is well known that the wind speed ratio G(r) tends to be almost constant when the center of a typhoon moves away from an observation point at coastal areas. It has been reported that the value of G(oo) is within 0.45~0.67 [3,6], and that the inflow angle 7 shows a value close to 30 °. Theoretical explanations of these observation results have seldom been given.
To examine the characteristics of both the wind speed ratio G(r) and the inflow angle 7, a case study was analyzed using the present model. In relation to the data of the three typhoons analyzed in Section 3, Ap = 60hpa, rm = 80 km, c = 15 m/s, Zo = 0.1 m were selected as typhoon parameters.
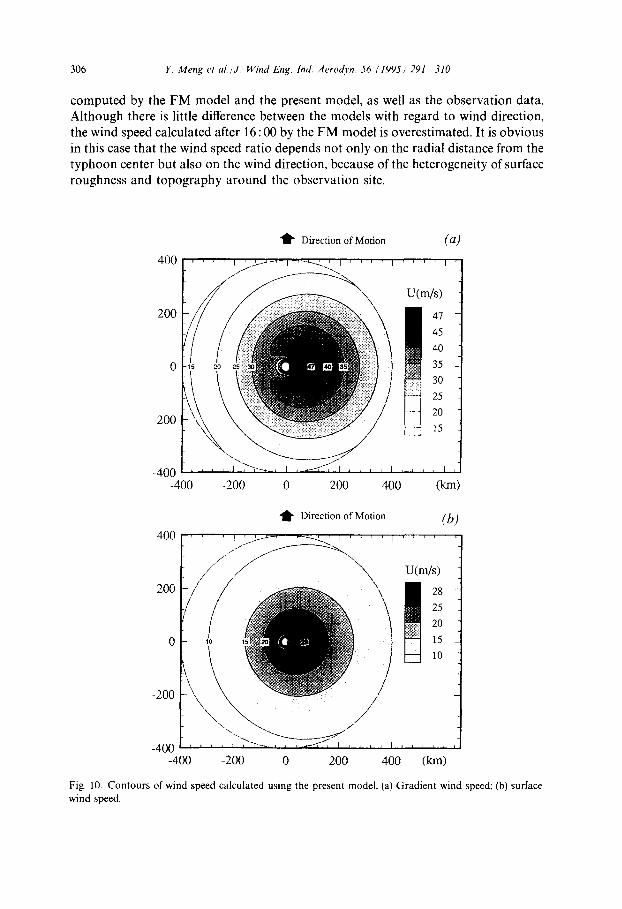
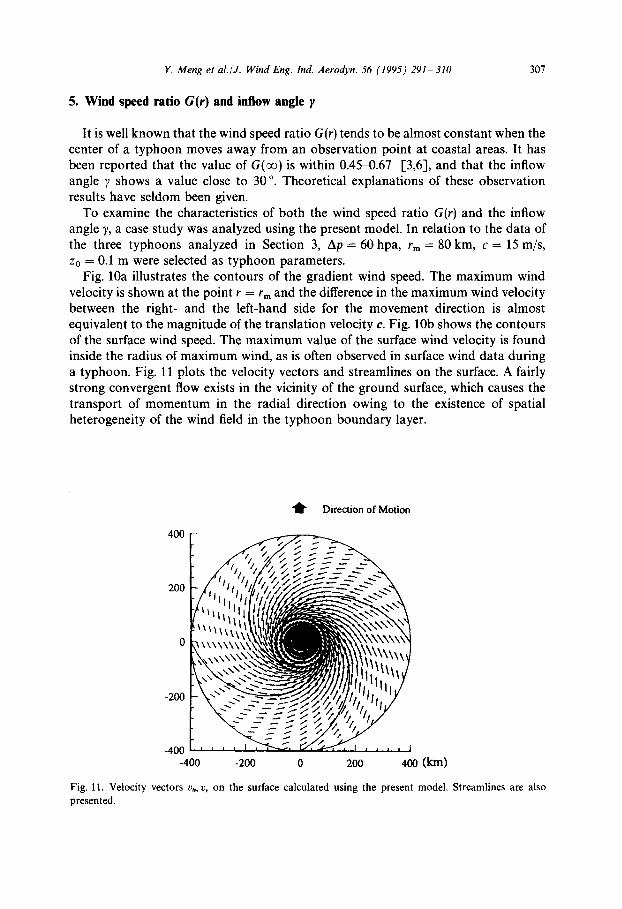
Fig. 10a illustrates the contours of the gradient wind speed. The maximum wind velocity is shown at the point r = r m and the difference in the maximum wind velocity between the right- and the left-hand side for the movement direction is almost equivalent to the magnitude of the translation velocity c. Fig. 10b shows the contours of the surface wind speed. The maximum value of the surface wind velocity is found inside the radius of maximum wind, as is often observed in surface wind data during a typhoon. Fig. 11 plots the velocity vectors and streamlines on the surface. A fairly strong convergent flow exists in the vicinity of the ground surface, which causes the transport of momentum in the radial direction owing to the existence of spatial heterogeneity of the wind field in the typhoon boundary layer.
" ~ Direction of Motion
200
0
-200
-400
400 -
s-Z -. "
-400 -200 0 200 400 (km)
Fig. 11. Velocity vectors v0, v, on the surface calculated using the present model. Streamlines are also presented.
308 Y. Meng et al.,,'J. Wind Eng. Ind. Aerodvn, 56 (1995) 291 310
II
L3
1
0.8
0.6
0.4
0.2
0 0
(a)
0 o o
' , ~ ------- 9 O °
" " _ 1 3 5 °
- 1 8 0 "
60
50
40
30
20
10
0 0
(b) i
o . . . . 0 "
- - . - 4 5 "
_ _ 9 o °
1 3 5 ~
: ' f
i i i i i i
1 2 3 4 1 2 3
x = r/r x = r/r m m
Fig. 12. [a) Wind speed rat io G(r) and (b) inflow angle 7 in var ious or ien ta t ions calcula ted using the present
model.
e~o
II
1
0.8
0.6
0.4
0.2
0 0
(a)
Z o
. ~ O O l
- - - 0 0 5
- - - - 0. I0
- - 0 1 5
I I I
l 2 3 4
x = r / r m
~3
60 Z o
50 " 0 ol . . . . . 0 0 5
- - O L O 40
- - - 0 1 5
3O
2O
i0
0
(b) J
i i t
1 2 3
x =r / r m
Fig. 13. (a) Averaged wind speed rat io G(rl and {b) averaged inflow angle 7 calcula ted using var ious zo.
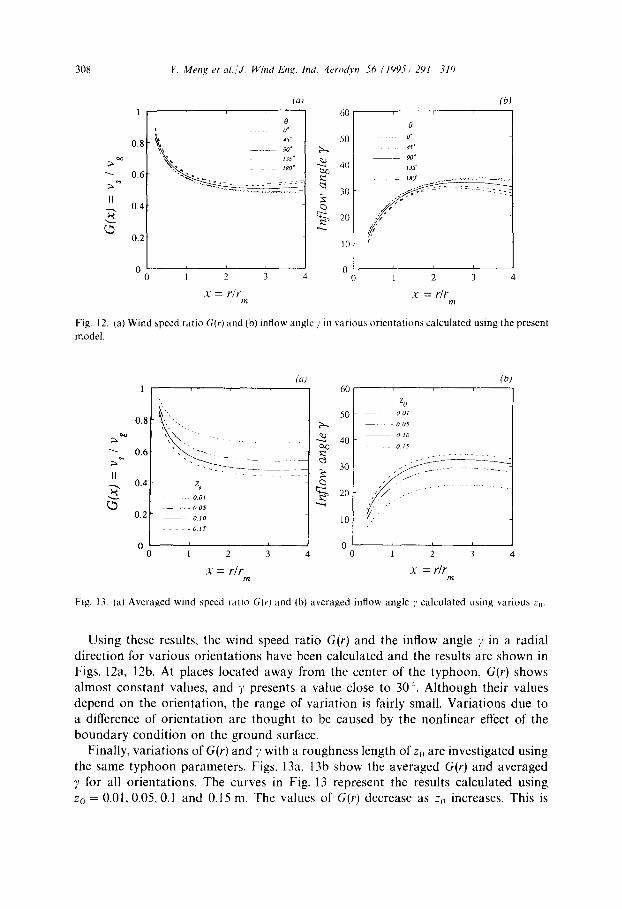
Using these results, the wind speed ratio G[r) and the inflow angle 7 in a radial direction for various orientations have been calculated and the results are shown in Figs. 12a, 12b. At places located away from the center of the typhoon, G(r) shows almost constant values, and ~, presents a value close to 30 °. Although their values depend on the orientation, the range of variation is fairly small. Variations due to a difference of orientation are thought to be caused by the nonlinear effect of the boundary condition on the ground surface.
Finally, variations of G(r) and 7 with a roughness length of Zo are investigated using the same typhoon parameters. Figs. 13a, 13b show the averaged G(r) and averaged 7 for all orientations. The curves in Fig. 13 represent the results calculated using zo = 0.01,0.05,0.1 and 0.15 m. The values of G(r )decrease as Zo increases. This is

Y. Meng et al./J. Wind Eng. Ind. Aerodyn. 56 (1995) 291-310 309
because the surface wind speed decreases with surface roughness increase. The variation of the observation data on G ( ~ ) is explained by a change in surface roughness. The value of the inflow angle y also depends on the surface roughness and increases as Zo increases. The inflow angle does not vary rapidly and shows a value of approximately 30 ° at most places except in the vicinity of the center of the typhoon. The results satisfactorily explain past observations at coastal areas.
6. Conclusions
An analytical model has been presented for the prediction of typhoon-induced wind field. The model has been applied to three typhoons observed in 1991 at a 100 m tower at Nagasaki, Japan. The wind speeds and directions computed by the present model agree favorably with those observed. In this study, the concept of the so-called "equivalent roughness length" was introduced to evaluate the terrain roughness and topographical effect. Using this single-bulk parameter, it is possible to simulate surface wind speed as well as wind direction at a site with complex terrain conditions.
The model has been shown to be superior to the widely used empirical model. It provides more accurate predicted wind speeds at a site with complex terrain condi- tions than the empirical model which overestimates wind speeds in some wind direction. This indicates that the wind speed ratio depends not only on the radius distance from the typhoon center but also on the wind direction, because of the heterogeneity of surface roughness and topography around the observation site.
A typhoon-induced wind field simulated by the model was presented in the final section of this paper. The maximum wind speed in the free atmosphere is shown at the point r = r m on the right-hand side of the typhoon, but the maximum value of the surface wind speed is found inside the radius of maximum wind. Characteristics of the wind speed ratio G(r) and the inflow angle 7 were also investigated, The results indicate that the model satisfactorily explains past observation data obtained at coastal areas.
Acknowledgement
The authors express their gratitude to Dr. Yukio Tamura, Professor at Tokyo Polytechnic University, and Mr. Kenji Shimada, researcher at the Institute of Techno- logy of Shimizu Corporation, for providing valuable typhoon observation data.
References
[1] L.R. Russell, Probability distributions for hurricane effects, J. of the Waterways, Harbor and Coastal Engineering Division, ASCE, Vol. 97, No. WWl, Proc. Paper 7886, February, 1971, pp. 139 154.
[2] BN. Tryggvason, D. Surry and A.G. Davenport, Predicting wind induced response in hurricane zones, J. of the Structural Division, ASCE, Vol. 102, No. STI2, Proc. Paper 12630, December, 1976, pp. 2333 2350.
310 Y. Meng et al./J. Wind Eng. Ind. Aerodyn. 56 (1995) 291--310
[3] P.N. Georgiou, A.G. Davenport and B.J. Vickery, Design wind speeds in regions dominated by tropical cyclones, J. Wind Eng. Ind. Aerodyn. 13 (1983) 139-152.
[4] M.E. Batts, M.R. Cordes, L.R. Russell, J.R. Shaver and E. Simiu, Hurricane wind speeds in the U.S.A., NBS Building Science series 124 (National Bureau of Standards, Washington, 1980).
[5] G.S. Martin, Probability distributions for hurricane wind gust speeds on the Australian Coast, in: Proc. I.E. Aust. Conf. on Applied probability theory to structural design, Melbourne, 1974.
[6] T. Fujii and Y. Mitsuta, Simulation of winds in typhoons by a stochastic model, J. Wind Eng. No. 28 (1986) 1 12 [in Japanese].
[7] K. Terada and J. Kondo, Trajectory of air parcel and energy supply from the ocean in typhoon area, Sea and Air 48, No. 1 (1972) 1-14.
[8] Y. Mitsuta, T. Fujii and O. Tsukamoto, Simulation of the surface wind in typhoon, Annuals of Disaster Prevention Research Institute, Kyoto University Vol. 25B1 (1982) 273-282 [in Japanese].
[9] S. Yoshizumi, On the asymmetry of wind distribution in the lower layer of a typhoon, J. Meteor. Soc. Japan 46, No. 3, (1968) 153-159.
[10] S.L. Rosenthal, A theoretical analysis of the field of motion in the hurricane boundary layer, National Hurricane Research Project Report, No. 56 (1962) 12 pp.
[11] G.J. Holland, An analytic model of the wind and pressure profiles in Hurricanes, Mort. Weather Rev. 108 No. 8(1980) 1212 1218.
[12] R.W. Schloemer, Analysis and synthesis of hurricane wind patterns over Okeechobee, Florida, Hydrometeorological Report, No. 31 (1954)49 pp.
[13] Y. Meng, M. Matsui and K. Hibi, A theoretical analysis of the wind field in the typhoon boundary layer, J. Wind Eng. No. 55 (1993) 7,8 [in Japanese].
[14] E. Simiu, Equivalent static wind load for tall building design, in: Proc. 4th ICWE (Cambridge Univ. Press, Cambridge, 1977) pp. 721 733.
[15] H.H. Lettau, Physical and meterorological basis for mathematical models of urban diffusion pro- cesses, in: Proc. Symp. on Multiple-source urban diffusion models, U.S. EPA, Publ. AP-86 Research Triangle Park, N.C., 1970, pp. 2.1 2.26.
[16] N.C. Helliwell, Wind over London, in: Proc. Wind effects on buildings and structures, Tokyo, 1971, pp. 23-32.
[17] J. Kondo and H. Yamazawa, Aerodynamic roughness over an inhomogeneous ground surface, Bound.-Layer Meteorol. 35 (1986) 331 348.
[18] R.K. Smith, The surface boundary layer of a hurricane, Tellus, Vol. 20 (Almquist and Wiksell, Stockholm, 1968) pp. 473-484.
[19] Y. Tamura, K. Shimada and K. Hibi, Wind Response of a tower (Typhoon observation at the Nagasaki Huis Ten Bosch Domtoren), J. Wind Eng. Ind. Aerodyn. 50 (1993) 309 318.
[20] A.G. Davenport, The relationship of wind structure to wind loading, in: Proc. Symp. No. 16, on Wind effects on building and structures, Nat. Phys. Lab., 1963, H.M.S.O., 1965, pp. 54 102.
[21] J. Counihan, Adiabatic atmospheric boundary layers. A review and analysis of data from the period 1880-1972, Atmos. Environ. 9 (1975) 871 905.
[22] J. Wieringa, Roughness-dependence geographical interpolation of surface wind averages, Q. J. R. Meteorol. Soc. 112 (1986) 867 889.
[23] ECCS: Recommendations for calculating the effects of wind on constructions, 2nd Ed., Technical Committee 12, No. 52, ECCS (1987).
[24] H. Choi and J. Kanda, Characteristics of the vertical wind profile for wind load estimation, J. Wind Eng. No. 45 (1990) 23~13 [in Japanese].