Embed Size (px)
Citation preview
N84"25606
NASA
Technical Memorandum 83716
AIAA-84-1500
USAAVSCOM
Technical Report 84-C-8
An Analytical Method To Predict Efficiencyof Aircraft Gearboxes
Neil E. Anderson
Propulsion LaboratoryAVSCOM Research and Technology LaboratoriesLewis Research Center
Cleveland, Ohio
and
Stuart H. Loewenthal
Lewis Research Center
Cleveland, Ohio
and
Joseph D. BlackAllison Gas Turbine Operations
Indianapolis, Indiana
Prepared for the
Twentieth Joint Propulsion Conference
cosponsored by the AIAA, SAE, and ASMECincinnati, Ohio, June 11-13, 1984
https://ntrs.nasa.gov/search.jsp?R=19840017538 2018-06-18T13:43:39+00:00Z
AN ANALYTICAL METHOD TO PREDICT EFFICIENCY OF AIRCRAFT GEARBOXES
Neil E. Anderson*
Propulsion LaboratoryAVSCOM Research and Technology Laboratories
Lewis Research CenterCleveland, Ohio
Stuart H. Loewenthal
National Aeronautics and Space AdministrationLewis Research Center
Cleveland, Ohio
and
Joseph D. BlackAllison Gas Turbine Operations
Indianapolis, Indiana
Abstract
A spur gear efficiency prediction methodpreviously developed by the authors was extended
to include power loss of planetary gearsets. Afriction coefficient model was developed forMIL-L-7808 oil based on disc machine data. This
combined with the recent capability of predictinglosses in spur gears of nonstandard proportionsallows the calculation of power loss for completeaircraft gearboxes that utilize spur gears. The
method was applied to the T56/501 turboprop gear-box and compared with measured test data. Bearinglosses were calculated with large scale computer
programs. Breakdowns of the gearbox losses pointout areas for possible improvement.
Nomenclature
a addendum, m (in.)
AR addendum ratio
C center distance, m (in.)
CI to C6 constants of proportionality
e tool shift, m (in.)
ER tool shift ratio
FR rolling traction force, N (lbf)
FS sliding force, N (Ibf)
face width of tooth, m (in.)
coefficient of friction
G dimensionless material parameter,E_
HH dimensionless film thickness(eq. (4))
h isothermal central film thickness,m (in.)
w(m, + 1)4
K gear capacity factor K = _Rpmgu
*Currently with Allison Gas Turbine Operat}ons.
k
mg
N
n
Pb
PR
PS
PW
R
Pmax
S
T
U
V
VS
VT
W
W
X
Greek
X
ellipticity parameter
gear ratio, Ng/Np
number of gear teeth
rotational speed, rpm
base pitch, m (in.)
power loss due to rolling traction,kW (hp)
power loss due to tooth sliding kW(hp)
power loss due to windage, kW (hp)
diametral pitch
pitch circle radius or radius ingeneral, m (in.)
maximum Hertz stress, GPa
sliding velocity to rolling
velocity ratio
lubricant inlet temperature
dimensionless speed parameter
surface velocity, m/sec (in/sec)
sliding velocity, Vg - Vp,m/sec (inlsec) _-
rolling velocity, Vg + Vp,mlsec (inlsec)
dimensionless load parameter,
FHIE'R _
gear contact normal load, N (Ibf)
path of contact distances, m(in.)
dimensionless ratio of film
thickness to composite surfaceroughness
_t
o
B
lubri_ant absolute viscosity,10-0 N seclm _ (cP)(Ibf seclin Z)
thermal reduction factor
roll angle
pressure angle
friction coefficient thermalreduction factor
Subscripts:
b base
c curvature
g gear
i inner
o outer
P pinion
pl_ pitch line velocity
R rolling
r ring
S sliding
t tangential
Superscripts:
(-) average value
* evaluate at s = 0.35
Introduction
Increasing fuel prices in the last decade
have stimulated interest in finding ways to reducefuel consumption for aircraft transportation. Thesignificant fuel efficiency advantages that turbo-prop propulsion systems offer over turbofan
systems at equivalent Mach numbers has long beenrecognized. Turbofan systems, however, have hadthe advantage in higher Mach number operation andlower noise levels in the past. Recently emphasishas been placed on a propulsion system that wouldovercome some of the disadvantages of the turbo-
prop system. This system, know as the propfan,allows aircraft to cruise at Mach numbers of 0.8with significantly higher efficiencies than modernturbofans. These advanced propfans will verylikely require a gearbox to reduce the speedbetween the power section and the propfan.Improving the efficiency of this gearbox wouldprovide further fuel consumption savings. Forthe current T561501 engine, each0.1 percent im-provement in the effective gearbox efficiencyresults in approximately a 700 000 annual fuelsavings for the user.
Lubrication system designs also benefit fromreduced gearbox heat generation. Reducing gearboxheat generation permits the oil flow to be reducedwithout affecting the temperature rise across thegearbox. Lower oii flow rates reduce oii pump
energy losses and reduce windage/churning lossesassociated with the improved airloil environment.Reduced oil flow rate requirements also allow theweight and size of the lubrication system to bereduced. Smaller tanks, lines, passages, filters,pumps, and on-board oil quantities can be
employed. Further, reduced gearbox heat genera-tion allows air/oil cooler size and weight to bereduced. Smaller coolers result in lower aircraft
drag which leads to better specific fuel consump-tion. For high Mach number aircraft, such as thepropfan, these drag reduction benefits aresignificant.
Gearbox efficiency improvements can providesignificant benefits. Gearbox efficiency optimiz-ation has not normally been included in the air-craft gearbox design methodology in the past,however, due to the lack of a technique that could
assess the many design variables[I,2]. In [3,4]
a technique was described that included the majordesign variables required for standard involutespur gears. In [5] this technique was extendedto include nonstandard spur gears. Nonstandardgeometries included modified addendums, tooththickness variations and operation on nonstandardgear centers either by design or as a function ofoperating conditions.
In order to analyze the T561501 gearbox forefficiency in this investigation the method of [3to 5] required modifications to include internal
spur gear geometry and the effects of planetarymotion. Additionally, a friction coefficientmodel was required for the MIL-L-7808 oil used inthe gearbox testing. With these new tools an
examination of the various losses in the gearboxcould be made.
Transmission Power Loss Analysis
Gear Power Loss Equations
The method utilized here for calculation of
power loss was described in detail in [3,4] asapplied to spur gears of standard proportions andin [5] for gears of nonstandard proportions. Itis applicable to spur gears which are jet orsplash lubricated. Churning losses of gears run-ning submerged in oil are not considered. Theanalysis considers sliding losses, which are theresult of friction forces developed as the teethslide across each other, rolling losses resulting
from the formation of an elastohydrodynamic (EHD)film and windage losses of both gears spinning inan oily atmosphere.
Sliding and rolling losses were evaluated bynumerically integrating the instantaneous valuesof these losses across the path of contact. Thefriction coefficient used to calculate slidingloss [3-5] was based on disk machine data gener-
ated by Benedict and Kelley[ 6] for mineral oils.
This friction coefficient expression is considered
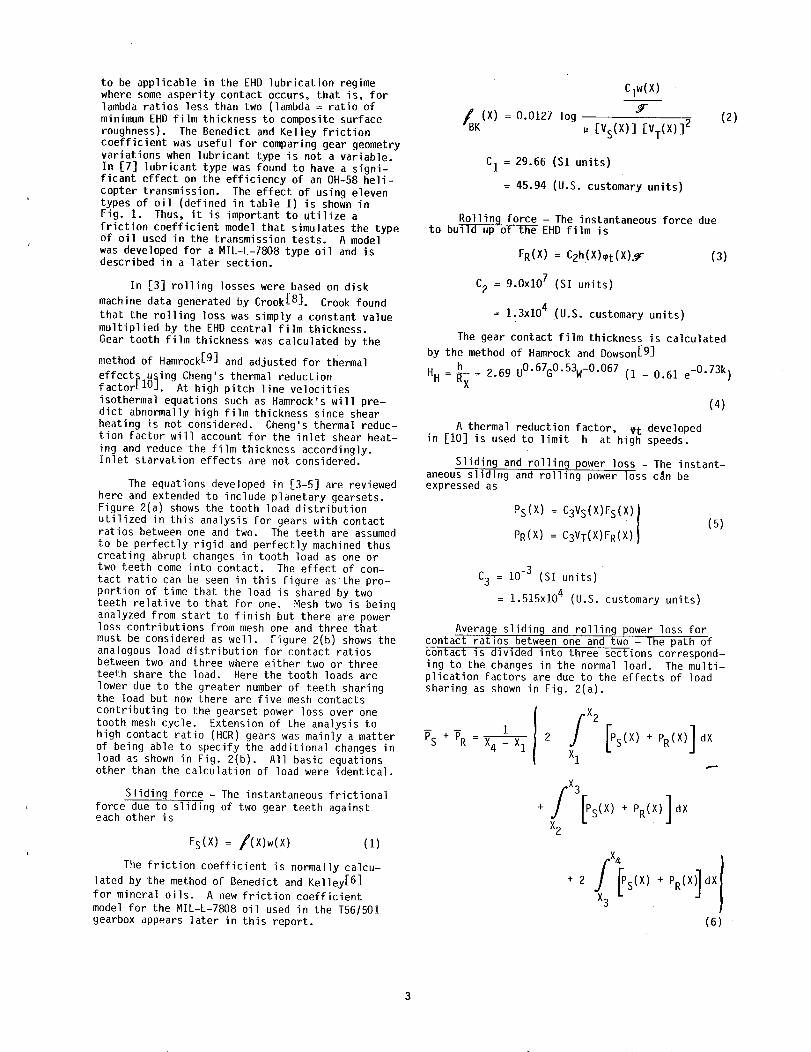
to beapplicablein theEHDlubrication regimewhere some asperity contact occurs, that is, forlambda ratios less than two (lambda = ratio ofminimum EHD film thickness to composite surface
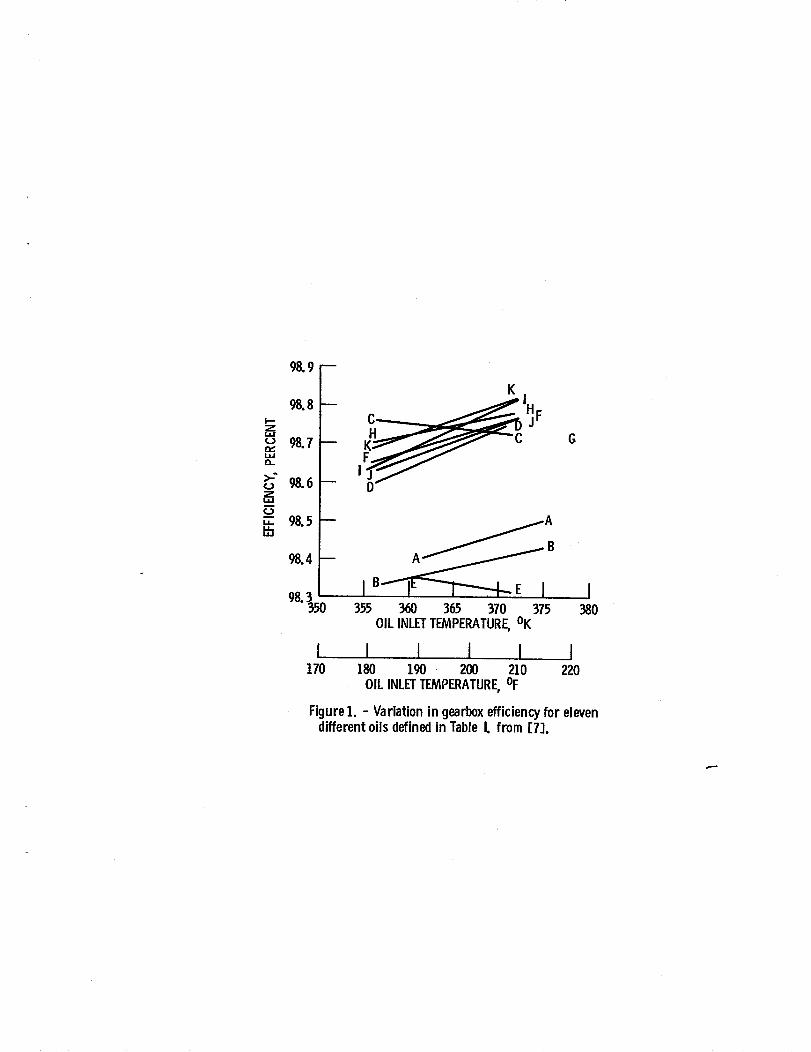
roughness). The Benedict and Kelley frictioncoefficient was useful for comparing gear geometryvariations when lubricant type is not a variable.In [7] lubricant type was found to have a signi-ficant effect on the efficiency of an 0H-58 he]i-
copter transmission. The effect of using eleventypes of oil (defined in table I) is shown inFig. 1. Thus, it is important to utilize a
friction coefficient model that simulates the typeof oii used in the transmission tests. A modelwas developed for a MIL-L-7808 type oil and isdescribed in a later section.
In [3] rolling losses were based on disk
machine data generated by Crook[8]. Crook found
that the rolling loss was simply a constant valuemultiplied by the EHD central film thickness.
Gear tooth film thickness was calculated by the
method of Hamrock[ 9] and adjusted for thermal
effects using Cheng's thermal reductionfactorLlO]. At high pitch line velocities
isothermal equations such as Hamrock's will pre-dict abnormally high film thickness since shearheating is not considered. Cheng's thermal reduc-tion factor will account for the inlet shear heat-
ing and reduce the film thickness accordingly.Inlet starvation effects are not considered.
The equations developed in [3-5] are reviewed
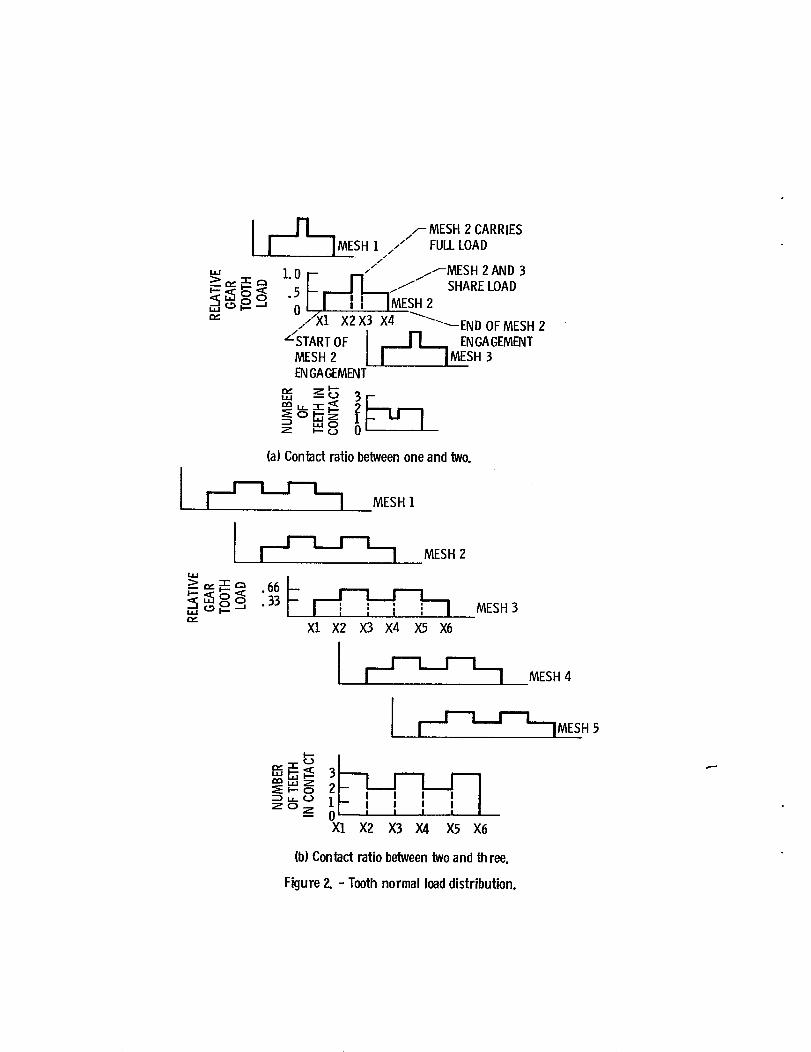
here and extended to include planetary gearsets.Figure 2(a) shows the tooth load distribution
utilized in this analysis for gears with contactratios between one and two. The teeth are assumed
to be perfectly rigid and perfectly machined thuscreating abrupt changes in tooth load as one ortwo teeth come into contact. The effect of con-
tact ratio can be seen in this figure as the pro-portion of time that the load is shared by twoteeth relative to that for one. Mesh two is being
analyzed from start to finish but there are powerloss contributions from mesh one and three that
must be considered as well. Figure 2(b) shows theanalogous load distribution for contact ratiosbetween two and three where either two or threeteeth share the load. Here the tooth loads are
lower due to the greater number of teeth sharingthe load but now there are five mesh contacts
contributing to the gearset power loss over onetooth mesh cycle. Extension of the analysis tohigh contact ratio (HCR) gears was mainly a matterof being able to specify the additional changes inload as shown in Fig. 2(b). All basic equationsother than the calculation of load were identical.
Sliding force - The instantaneous frictional
force due to sliding of two gear teeth againsteach other is
Fs(X) = /(X)w(X) (i)
The friction coefficient is normally calcu-
lated by the method of Benedict and Kelley[ 6]
for mineral oils. A new friction coefficient
model for the MIL-L-7808 oil used in the T56/501gearbox appears later in this report.
clW(X)
5
K(X) = 0.0127 log [VT(X)]2 (2)[Vs(X)]
C1 = 29.66 (SI units)
= 45.94 (U.S. customary units)
Rollin 9 force - The instantaneous force dueto build up of the EHD film is
FR(X) = C2h(X)_t(X)Y (3)
C2 = 9.0x10⁷ (SI units)
= 1.3xi04 (U.S. customary units)
The gear contact film thickness is calculated
by the method of Hamrock and Dowson[ 9]
h uO.67GO.53w-O.067 e_O.73k)HH =_X = 2.69 (1 - 0.61
(4)
A thermal reduction factor, mt developedin [10] is used to limit h at high speeds.
Sliding and rolling power loss - The instant-aneous sliding and rolling power loss can beexpressed as
Ps(X) = C3Vs(X)Fs(X)I(5)I
PR(X) C3VT(X)FR(X) )
C3 = 10-3 (SI units)
= 1.515x10⁴ (U.S. customary units)
Average sliding and rolling power loss forcontact ratios between one and two - The path ofcontact is divided into three sections correspond-ing to the changes in the normal load. The multi-plication factors are due to the effects of load
sharing as shown in Fig. 2(a).
1
_S +-F R _ X4_ X1 /X2 [Ps(X) + PR(X)]dX
X1
X3
X2
dX
X4
(6)
Average slidin_ and rollinq power loss forcontact ratios between two and three - Here thepath of contact is divided into five sections due
to the more frequent changes in load.
Ps+..= 3 [Ps(X)+ dXX1
Pw,g
PW,p = C4
where
+ 2fX3 [Ps(X)
X2
+3
+ 2fX5[ps(X)
X4
+3
+ PR(X_
fX_s(X)
X3
+ PR(X)]
X6
X5
Windage Loss Expressions -
= C4 + 2.3 _ np
x R_'6(0.028 , + C5)0"2
_ + 2.3_pp')n 2 8R4 6 ....p" p" (u.uz_
dX +
+ PR(X)] dX
dX +
+ PR(X_dX
(7)
p + C5)0"2
(8)
C4 = 2.82x10 -7 (SI units)
= 4.05x10 -13 (U.S. customary units)
C5 = 0.019 (SI units)
= 2.86x10 -9 (U.S. customary units)
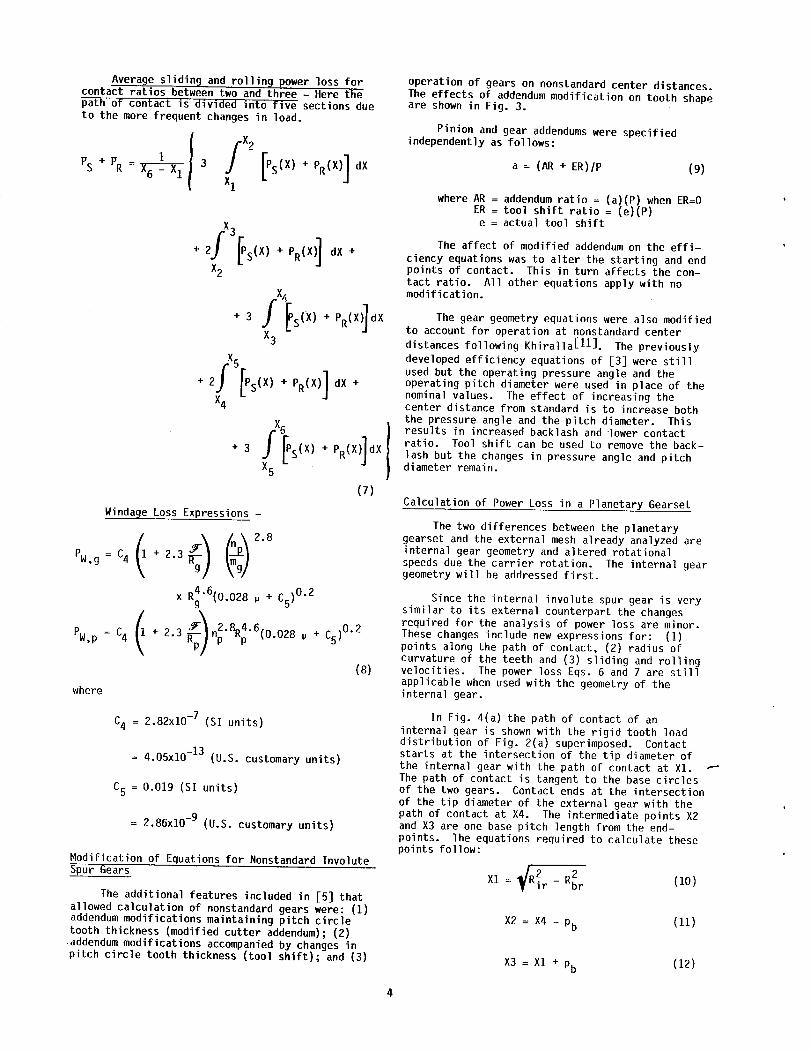
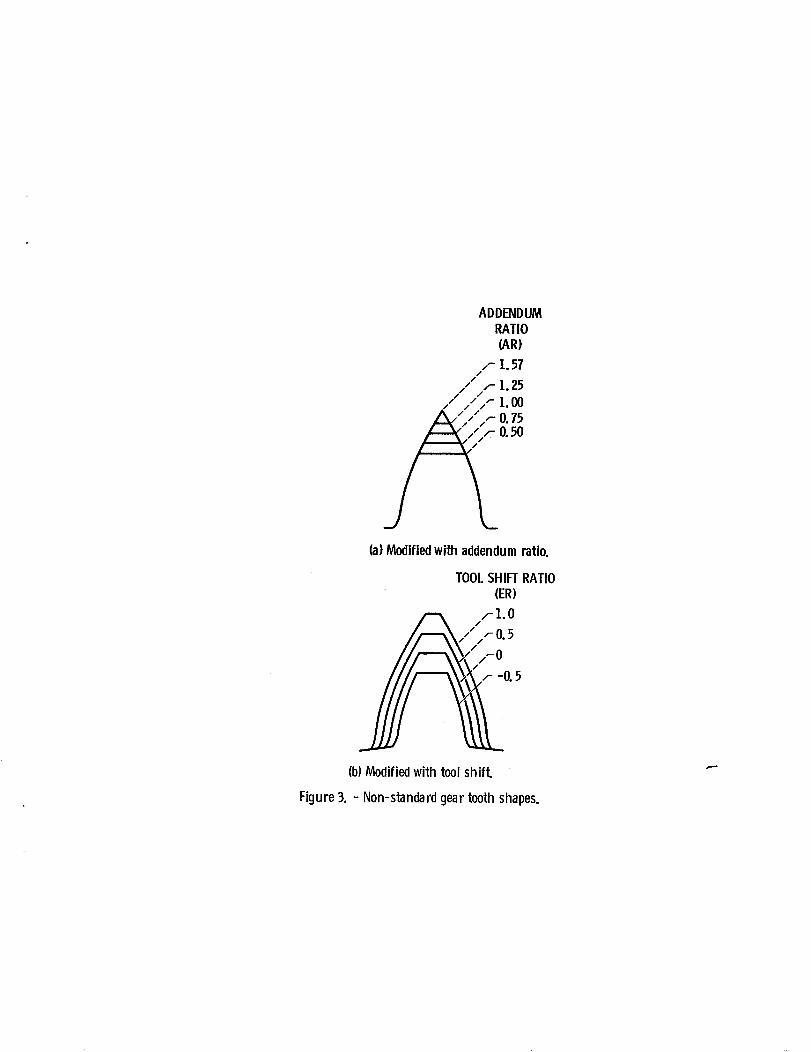
Modification of Equations for Nonstandard InvoluteSpur Gears
The additional features included in [5] thatallowed calculation of nonstandard gears were: (1)addendum modifications maintaining pitch circle
tooth thickness (modified cutter addendum); (2)addendum modifications accompanied by changes inpitch circle tooth thickness (tool shift); and (3)
operation of gears on nonstandard center distances.
The effects of addendum modification on tooth shapeare shown in Fig. 3.
Pinion and gear addendums were specifiedindependently as follows:
a = (AR + ER)IP (9)
where AR = addendum ratio = (a)(P) when ER=OER = tool shift ratio = (e)(P)e = actual tool shift
The affect of modified addendum on the effi-
ciency equations was to alter the starting and endpoints of contact. This in turn affects the con-
tact ratio. A11 other equations apply with nomodification.
The gear geometry equations were also modified
to account for operation at nonstandard center
distances following Khiralla[11]. The previously
developed efficiency equations of [3] were stillused but the operating pressure anqle and theoperating pitch diameter were used'in place of thenominal values. The effect of increasing thecenter distance from standard is to increase boththe pressure angle and the pitch diameter. Thisresults in increased backlash and lower contactratio. Tool shift can be used to remove the back-
lash but the changes in pressure angle and pitchdiameter remain.
Calculation of Power Loss in a Planetary Gearset
The two differences between the planetarygearset and the external mesh already analyzed areinternal gear geometry and altered rotational
speeds due the carrier rotation. The internal geargeometry will be addressed first.
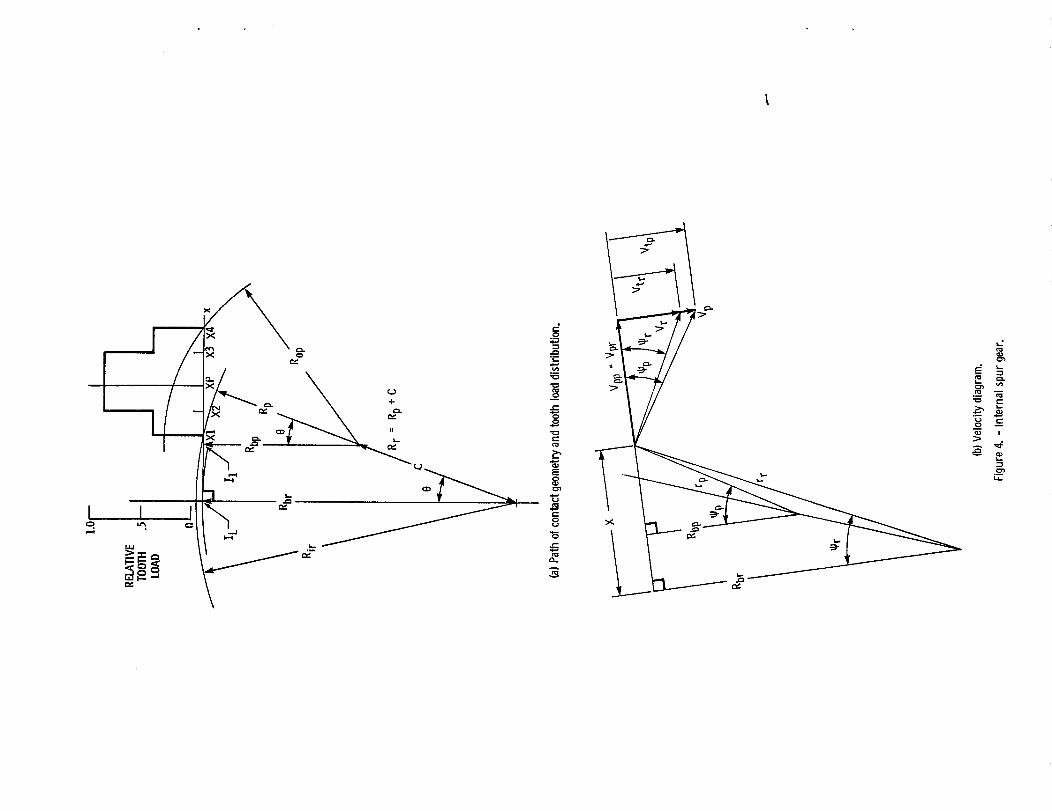
Since the internal involute spur gear is verysimilar to its external counterpart the changesrequired for the analysis of power loss are minor.These changes include new expressions for: (I)points along the path of contact, (2) radius of
curvature of the teeth and (3) sliding and rollingvelocities. The power loss Eqs. 6 and 7 are stillapplicable when used with the geometry of theinternal gear.
In Fig. 4(a) the path of contact of an
internal gear is shown with the rigid tooth loaddistribution of Fig. 2(a) superimposed. Contactstarts at the intersection of the tip diameter ofthe internal gear with the path of contact at XI.
The path of contact is tangent to the base circlesof the two gears. Contact ends at the intersection
of the tip diameter of the external gear with thepath of contact at X4. The intermediate points X2and X3 are one base pitch length from the end-points. The equations required to calculate thesepoints follow:
XI= _/R_r-R_r (10)
X2 = X4 - Pb (11)
X3 = X1 + Pb (12)
(13)
XP =_r2- R_r (14)
The radii of curvature of the teeth change asthe point of contact moves along the path ofcontact. The radius of curvature of the internal
gear is 12X and the external gear is IIX.
R = X (15)cp
Rcg = X - (Rr - Rp) sin ¢ (16)
A velocity diagram for the internal mesh is
shown in Fig. 4(b). Vr and Vp are theabsolute velocities of the gears at point X forthe internal and external gears respectively.The absolute velocities can be broken intovelocities along the tooth surface, Vt, andvelocities perdpendicular to the tooth surface,Vp. Sliding velocity is defined as the differ-ence in the tangential velocities while rollingvelocity is the sum. The velocity components arecalculated as a function of the roll angles ofthe gears as follows:
VS = Vtp - Vtr (17)
= Vpl v (sin Cp - sin Cr )
VT = Vtp + Vtr
= Vplv (sin Cp - sin Cr)
(18)
where
and
Cp = tan-I [(X - C sin ¢)/Rbp ] (19)
¢r = tan-1 [XIRbr] (20)
By using these values in Eqs. (6) and (7),power loss of the internal mesh can be found.
To account for the rotation of the carrier in
a planetary gearset the rotational speeds of the
sun gear and planet gear in each of their meshes
were modified following Glover[12]. The angular
speed of tooth engagement is the gear speed thatwould be obtained if the carrier was stationary.In this configuration the sun/planet speed was thesun gear absolute speed less the carrier speed.The planet/ring mesh speed was found by setting thering speed equal to the negative of the carrierspeed. The torque balance is not modified and thus
loads are identical for a fixed or rotating carrier1Rotational speeds for other planetary configurationscan be found in [12].
Calculation of Bearing Power Loss
Bearing power losses at various flight loadingconditions were calculated with large scale computerprograp_al The programs used were NASA versions ofCYBEANLIaJ._Qr cylinder roller bearings,
SPHERBEA_I_] for the planet bearing andSHABERTHLIbJ for the prop thrust bearing. Theseprograms calculate heat generation at the manycontacting surfaces within the bearing. Knownoperating temperatures were input variables alongwith detailed bearing geometry. An internal
lubricant model was used for the MIL-L-7808 typelubricant. These large programs are designed toperform calculations for bearings that are carryingsignificant load. At light loads when the number
of loaded rolling elements becomes equal to one,numerical difficulties arise and the results are
not accurate. Thus these programs cannot be usedfor th_.:pin (no-load) calculation. Instead theHarrisLZb] equations were used to calculate thespin losses.
Calculation of Power Loss in Oil Pumps
Oil pump loses were calculated by conventionalmethods using oil flow rate, pressure head and pumpefficiency. The main oil supply pump efficiency wasset equal to 25 percent based on past experience.The two scavenge pumps were rated at 20 percentefficiency due to the aerated oil that it must pump.Losses were proportioned with speed of rotation tothe third power.
Friction Coefficient for Mil-L-7808 Type Oil
A breakdown of the gear mesh powe loss com-
ponents in [3] indicates that the sliding frictionloss is a major loss component at moderate to highloads, particularly at the lower meshing speeds.Thus an accurate description of the friction char-
acteristics of the oil in question is vital foraccurate loss predictions. In the past the authorsrelied on the Benedict and Kelley friction coeffi-
cient model[ 6] for mineral oils to provide an
engineering estimate of power loss. However inreviewing published friction coefficient data for
several different MIL-L-7808 type oils[17,18] it
was apparent the MIL-L-7808 oil's friction coeffi-
cient was several times smaller than that predicJcmdby the Benedict and Kelley model at comparableoperating conditions. In view of this it wasdescided that a friction model based on a regressionanalysis of the MIL-L-7808 friction data appearingin [17] would provide a better estimate of gearsliding losses.
The friction data appearing in [17] was gener-ated on a twin disc machine over a wide range ofconditions for one type of MIL-L-7808 oil. Maximum
contact pressures ranged from 0.69 to 1.03 GPa,rolling speeds from 11.4 to 46.3 m/s, oil tempera-tures from 23 to 71 deg. C, and slide to roll ratios(2VsIVT) from 0 to 0.35. A total of 41 separatefriction/slip curves were analyzed. The followingregression equation was obtained:
for 0 < S< 0.35
/=/78 = 0.00209 + 0.01696 Pmax - 3-553x10-5 V
+ 8.739x10 -5 T + 6.998x10 -4 In (S)
+ 0.01734 (S) - 0.0173 (S)2
(2o)
where"
_max = maximum Hertz stress, GPasum velocity, mlsec
T = lubricant inlet temperature, degCelsius
S = slidelro11 ratio = 2 VsIVT
note for steel gears in line contact:
Pmax = C6 _/w(X)/°_(l/Rcp + l/Rcg)
where C6 = 1.902xi0 -4 (SI units); 2290.6 (U.S.customary units)
The correlation regression coefficient, R,for the above equation is 0.956. R is a measureof both the fit of the regression equation andthe consistency of the test data. (An R valueof 0 indicates no correlation while and R valueof I indicates perfect correlation).
High slip region - Unfortunately, the frictiondata appearing in [17] was limited to intermediateslip values which cover only the region of gearcontact near the pitch point. Since slide to rollratios of 1.0 or greater are not uncommon at gearmesh entry and exit points, it was necessary toextend the friction model to the high slip region.
One approach which could be taken is basical-
ly theoretical in nature in which the traction
characteristics are thermally modeled[19,20].
The problem in applying such a model is thatseveral basic thermal properties of the oil andtheir variations with temperature and pressuremust be known to properly perform the analysis.The other approach, adopted here, is to assumethat the degradation of the friction coefficient
of the MIL-L-7808 oil with increasing slip approx-imately follows that found from the Benedict andKelley experiments with several mineral oils as
described by Eq. (21).. While it is recognizedthat such an approach is clearly less desirablethan a full theoretical description of the oil'straction, it does, however, provide an interim
engineering approximation until a more completemodel can be formulated.
For slide to roll ratios, S, greater than0.35, a friction coefficient thermal reduction
factor, B, was introduced to modify the frictioncoefficient found from eq. 20 at S = 0.35.
Thus for S > 0.35
I: 4* (211
where f^ = friction coefficient found fromeq. 20 at S = 0.35
and
where
BK coefficient from thethe friction
Benedict and Kelley model
S=0.35= the Benedict and Kelley
friction coefficient model
evaluated at S = 0.35
The predicted variation in f with slide to
roll ratio at representative operating conditionsappears in Fig. 5. Also, plotted for comparisonare some of the test data from [17]. The dis-continuity at S = 0.35 is an artifact of the com-posite model used here. It's effect on the
predicted sliding loss is judged to be extremelysmall. It is clear from this plot that the effec-tive friction coefficient for the MIL-L-7808 oil
analyzed is quite low. Thus the losses due to gearsliding, as will be shown, are expected to berelatively minor.
Other considerations - Two potentiallyimportant factors that can influence the frictioncoefficient model but not included are the effectsof lubricant formulation and surface roughness.Although the lubricant tested in [17] and modeledhere fits a MIL-L-7808 oil specification, the fric-tion characteristics of the oil can vary signi-ficantly with different formulations or brandsthat meet this specification. This is illustratedin Fig. i from [7], where oils C, D, I, and J allmeet the MIL-L-23699 oil specification and yet "-provide different transmission efficiencies.Since the viscosities of these oils are ostensiblythe same, it is likely that these efficiencydifferences are largely due to differences infriction. It is interesting to note that oil Ceven has a different temperature trend than theother three oils.
Another factor to consider is the effect of
surface finish on friction. The data appearingin [17] were generated with hardened steel discspolished to a 2 _in. rms finish. Aircraft gearsare generally much rougher than this, althoughthose used in the T56/501 gearbox are relatively
smooth being honed to about 10 pin. AA. It is
difficult to assess the contribution of asperityFriction to the proposed friction model. However,to account for some asperity traction, the pro-posed model arbitrarily limits the friction coef-
ficient to a minimum of 0.001. It is interestingto note that relatively large variations in sur-
face roughness (6 to 800 pin. peak-to-valleyroughness) on discs tested in sliding in [21] hadremarkab]y little effect on the measured tractionwhich typically varied from 0.05 to 0.055 at afilm thickness of 25 pin. From this, [21] con-cludes that the friction mechanism is predomi-nantly a shearing of the oil film rather thanmetallic or boundary lubrication.
180 psig, and scavenge pressure was 30-35 psig.Propeller monents and side loads were not appliedduring efficiency measurements. A constant thrustload of 44 480 N (10 000 ]bf) was applied to thepropeller shaft however. The gearboxes weretested in a horizontal attitude at sea levelpressure.
Accuracy of the efficiency tests was in-creased by averaging ten oil in and ten oil outthermocouple measurements at the two locations.
Oil flow rate was determined by measuring thechange in weight of the oil supply tank duringthe efficiency calculation period.
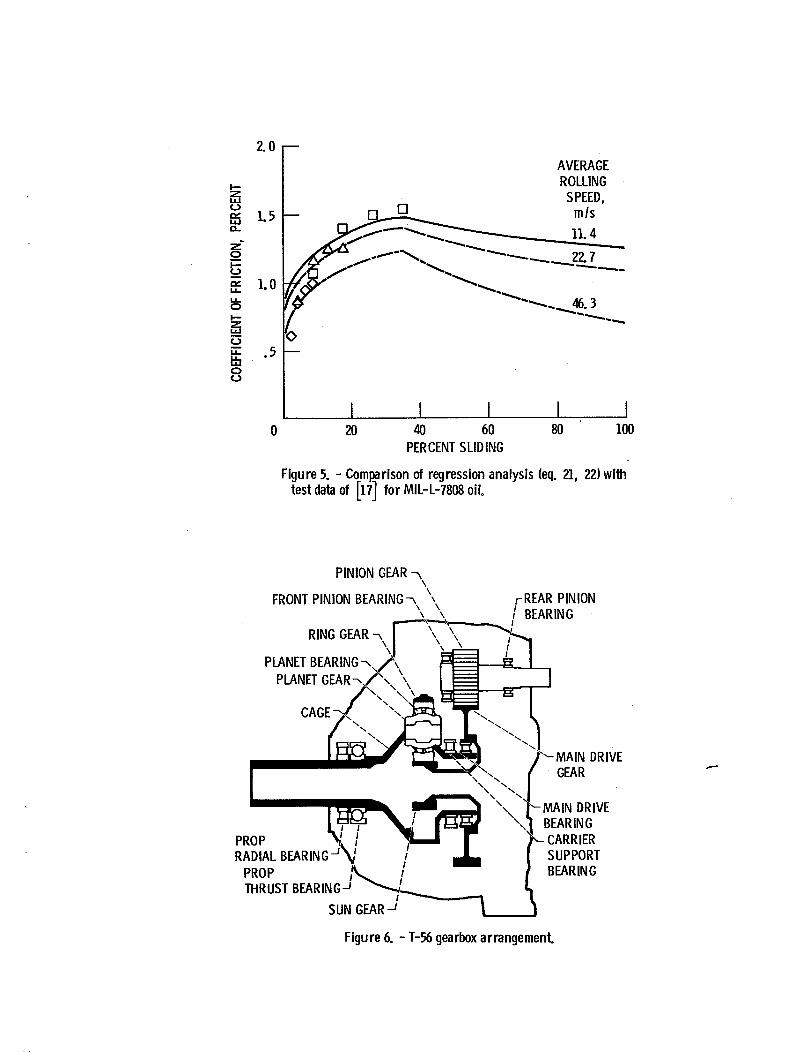
Description of T56/501 Gearbox
The T56/501 gearbox is used in both militaryand commercial versions of Lockheed, Grumman andConvair aircraft. As shown in Fig. 6 the firststage of gearing is an offset spur gear mesh. Thesecond stage is a planetary gearset with input tothe sun gear and output from the carrier. Five
planet gears located on spherical bearing drivethe carrier which in turn drives the propeller.Apart from the planet bearing and propeller thrust
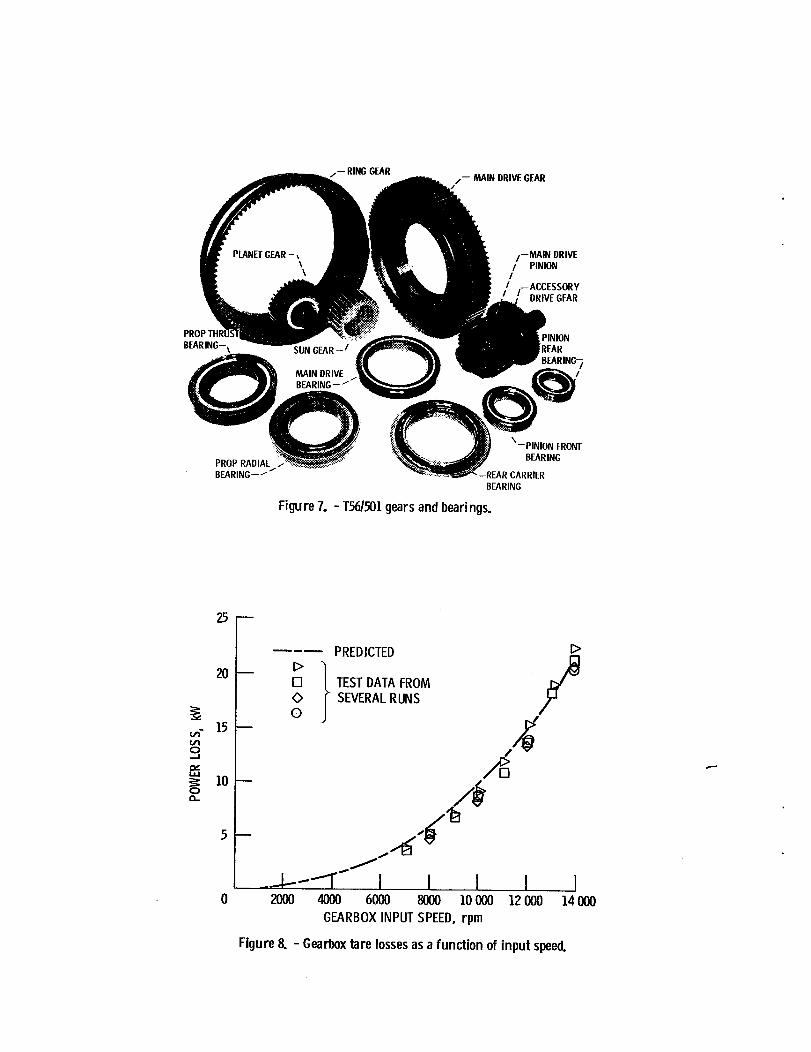
bearing all other bearings are cylindrical. Theseven bearings and five gear types are shown inFig. 7. Gear and bearing proportions are listedin Table II and Ill.
An accessory train is driven from the high
speed input pinion gear. This drive train sup-plies power to oil supply pump, scavenge pumps, analternator, an EDC or hydraulic pump and tacho-meters. The starter uses this drive train to
drive engine during start-up. The accessory drivewas analyzed with loads due only to the oil pumpssince the efficiency tests did not require acces-sories. The pinion rear bearing is supported bythe rear housing.
Test Stand
The gearbox power loss data used in this
analysis for comparison to the theory were
obtained from a cradled dynamometer, no-loadtesting and back-to-back loaded gearbox testing.The data shown are the results of six tests usingfour transmissions. The no-load power loss datawas obtained by driving the pump shaft with thedynamometers until temperature stabilized at eachspeed point. A load cell was used to determinethe torque required to rotate the transmissions.Oil heat rejection measurements were also made
during these tests. The heat rejection measure-
ment accounts for all losses except scavenge pumplosses and heat rejected through the transmissionhousings.
Power loss at loaded conditions was obtained
on a back-to-back gearbox rig using heat rejectedto the oil to determine power loss. To accountfor the scavenge pump loss and heat transfer
through the housings the power loss found fromthe heat loss to the oil was increased in thesame proportion as that found in the no-loadtests.
All tests were conducted with a MIL-L-7808lubricant at an inlet temperature of 82.2 • 2.7 ° C(180 • 5 °F). Nominal oil supply pressure was
Comparison of Theory with Data
Two sets of test data were analyzed usingthe technique described above. The first set ofdata included spin losses where no external loadwas applied to the transmission other than theoil pumps connected to the accessory drive train.
The second set of data simulated flight loadingconditions.
SpinLosses
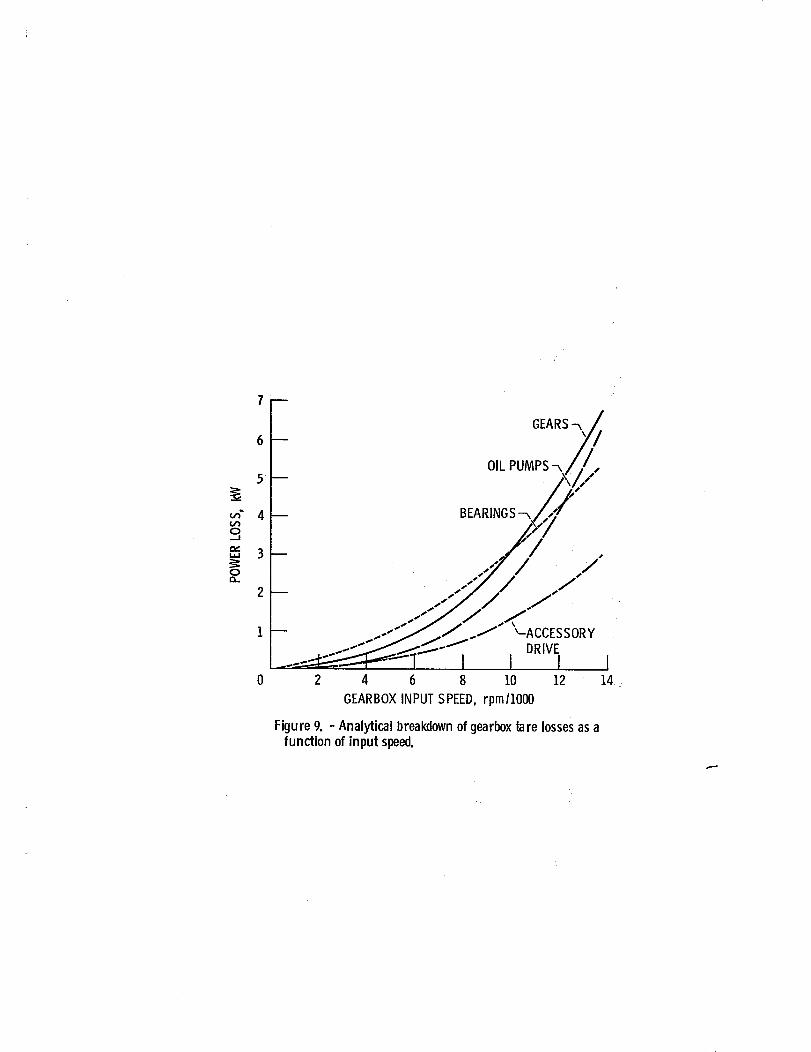
Figure 8 shows the gearbox spin losses as a
function of input speed. In the analysis, geartorques were arbitrarily set to 22 N-m (5 in-lbf)and bearing loads at 222 N (50 Ibf) so that nu-merical expressions that have no value at zero
load could be evaluated. It is apparent in Fig.8 that the analysis gives an extremely goodestimate of the spin losses. The range ofmeasured values shown represents results obtainedwith different transmissions of the same design.
In Fig. 9 the losses are broken down analyt-ically into four categories and shown as a func-tion of gearbox input speed. Spin losses at fullspeed are listed by percentage in Table IV. Thegear, bearing and oil pump losses are equallyimportant at or near full speed. In the breakdownby component in Table IV the oil pump losses (onesupply and two scavenge) were higher than anyother single component. The high speed main drivegearset followed due mainly to the high windagelosses. The accessory gear train which included
the first two meshes and bearings had the thirdhighest losses due to high windage losses (sincethe first mesh was actually a speed increase aboveinput speed). The sum of these three sources
amounted to 68.6 percent of all the spin lossesof the transmission. This would be the area to
investigate to reduce transmission spin losses _-since the remaining components contributed lessthan 6 percent each.
Losses at Flight Loading Conditions
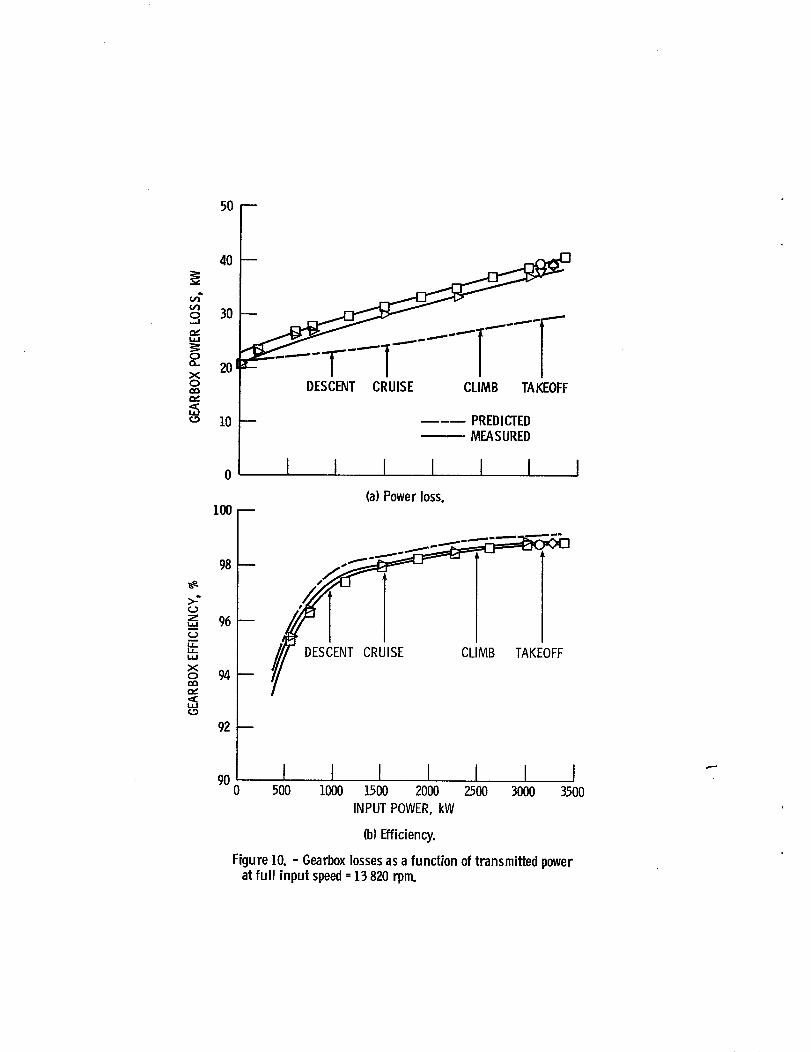
Figure lO(a) shows the transmission losses asa function of input torque or power at a constanttransmission input speed of 13 820 rpm. This
transmission is operated in a constant speed modeduring flight conditions (see Table V). At zerospeed the prediction agrees well as describedabove. The load sensitivity predicted by the pre-sent analysis is not as strong as that shown by
the measured data. The prediction is low by 8.2 kW(11 hp) at takeoff power levels. This is equiv-alent to 0.26 percentage points of efficiency.
Thedatais replottedasefficiencyin Fig.lO(b). Theanalysisoverestimatesthemeasuredefficiencybya nearlyconstantvalueovertheoperatingrange. Thereareseveralpossibleexplanationsfor this; (1) experimentalerror, (2)incorrectfriction coefficientmodelfor thislubricantor (3) lackof bearingloaddependence.
Measurementof powerlossin a veryefficienttransmissionis achallengingtask. Themeasuredlossesat full powerareapproximately35kWascomparedto the inputpowerlevelof 3132kW. In[7] a verythoroughmethodof measuringheatrejectionfroma helicoptertransmissionwasutilized to determineefficiency. Themethodincludedcapturingthecoolingwater,weighingitandaccuratelyrecordingtemperaturerise withanRTDthermocoupleaccurateto within0.1 degreesF.Theestimatedaccuracyof this techniqueat fullratedpoweris plusor minus0.1 percentagepoints. Asimilar techniquewasusedto obtainthis databut severalmodificationsto thetech-niquewereutilized that decreasethe accuracyofthemeasurement.Fromthis viewpointthepre-dictedlossesarewithintheexperimentalerrorof this typeof test.
Thegearfriction coefficientmodelusedinthis analysiswasbasedona limitedamountofdiscmachinedatarunat typical gearcontactconditionsbutat lowslip rates[17]. It wasintendedto giveanapproximationof thefrictioncoefficientfor a givenMIL-L-7808oil in lieu ofa morecompletemodel.Someof thedifficulties,asdiscussedearlier, in applyingthis limiteddiscmachinefriction datato gearpowerlosscalculationswill contributeto predictiveinaccuracies.Also,operatingtemperaturesintheT56/501gearboxaregenerallymuchhigherthanthoseinvestigatedin [17] andoperatinggearcontactstressesaregenerallylower. It isanticipatedthat amorecompletefriction modelwouldaccountfor muchof the loadsensitivitydisagreementencounteredhere.
Thethird possibilityfor the lackof pre-dictedpowerlossloaddependencecouldlie inthebearingpowerlosscalculations. Thelargebearingprogramsusedhere,however,havebeenusedin thepastwithgoodresults. Asa check,losseswerealsocalculatedwith theHarrisEq.[16] andfoundto showevenless loaddependenceoverall. Bearinglossesarenot likely to bethesourceof the lowerpredictedlossesat themoreheavilyloadedcondition.
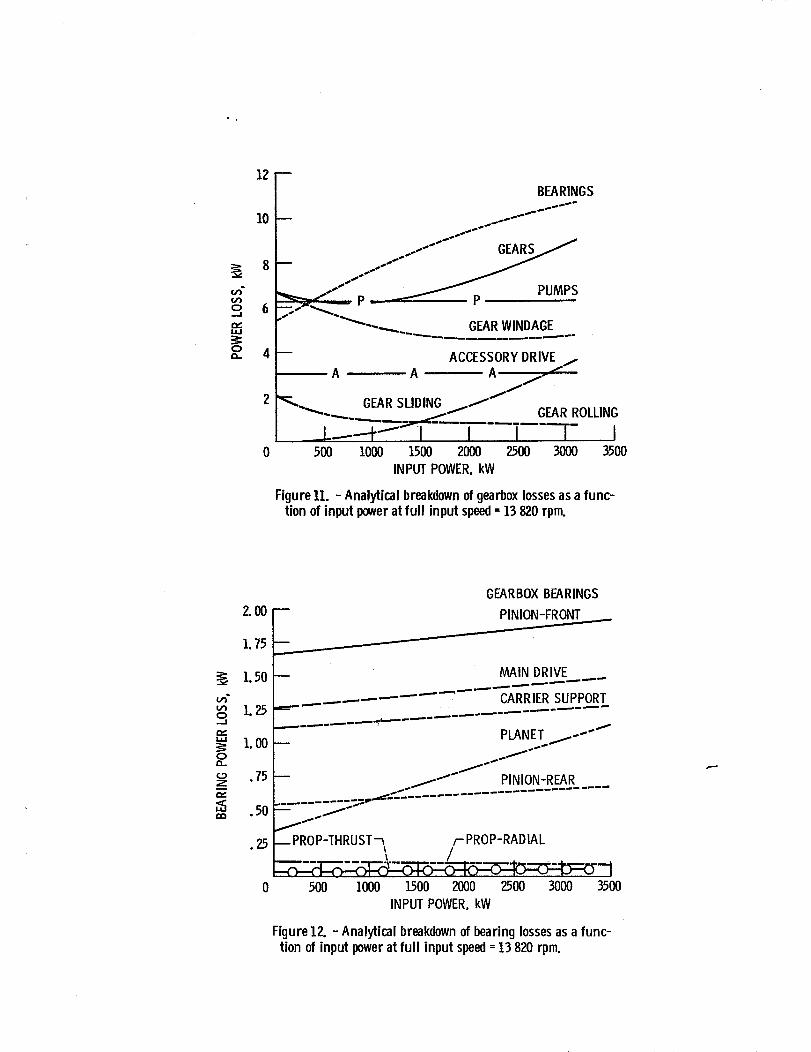
Despitethesesourcesof inaccuracy,thepredictedefficiencytrendswith inputpowercloselymatchthemeasureddatain Fig. 10(b).Basedonthis powerlosspredictionmodel,thelosseswereanalyzedbycategoryandcomponentinFig. 11to 17andin TableIV. In Fig. 11thelossesareshownbygeneralcategory.Thetotalsystembearinglossis somewhatgreaterthanthetotal gearlossoverthe rangeof operatingconditions.Asmentionedbefore,oil pumplossesarea verysignificantpart of the systemloss.Theaccessorydrive (gearsandbearings)lossesarea smallerbutsignificantportionof thetransmissionlosses.
In Fig. 12the individual transmission bear-
ing losses are shown as a function of power level.
The very modest increase in bearing loss with loadcan be seen. Only the spherical planet bearingshows a stronger load dependence. Its affect onthe transmission loss is greater than shown heresince this loss must be multiplied by five sincethere are five planet bearings in the trans-
mission. The propeller radial and thrust bearinglosses are very low due to the relatively lowrotational speed.
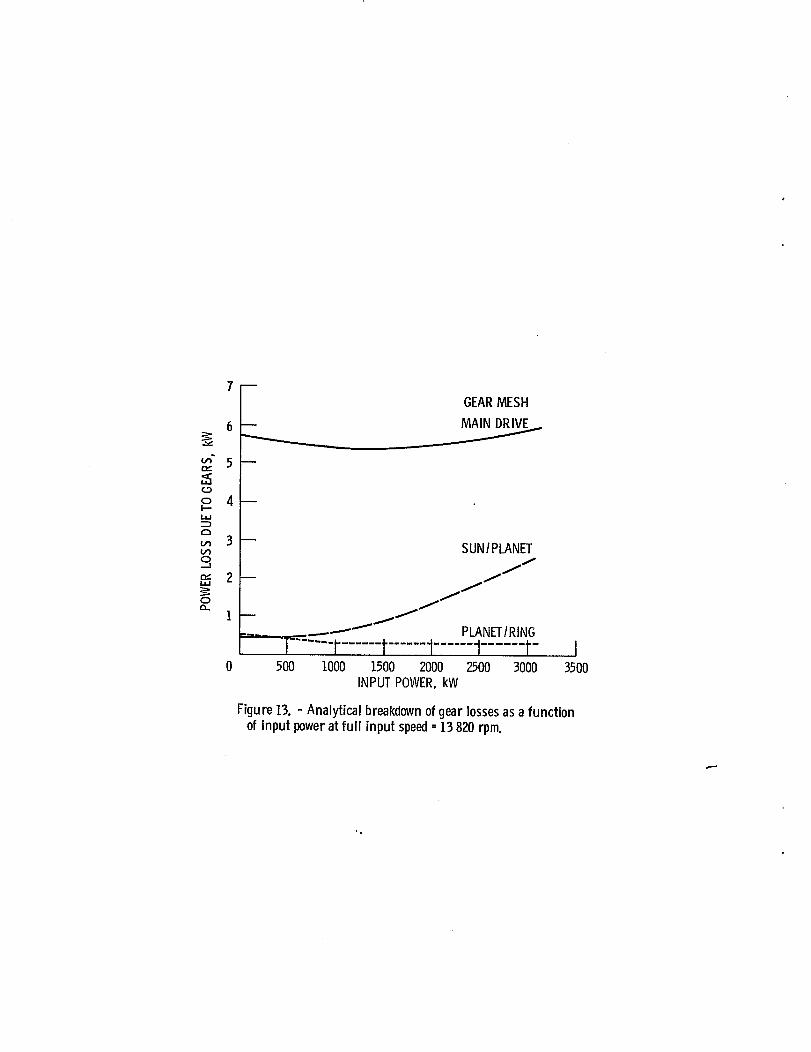
A comparison of the losses in the main drive
gears and the planetary gearset is shown in Fig.13. The planetary gearset has only half the loses
at full power due to its lower operating veloc-ities and lack of windage losses even though bothare carrying approximately the same power. Theplanetary action of the carrier is beneficial in
reducing contact velocities in the gear mesh.Calculated as efficiency the main drive has anefficiency of 99.86 percent at full power and theplanetary has an efficiency of 99.93 percent.
These values are quite high and are due mainly tothe low coefficient of friction of the MIL-L-7808oil.
The transmission losses at full power areshown by component in Table IV. At full powerthe oil pumps are again the single largest con-tributor to the gearbox loss. The main drivegears are next followed by the planet bearing.These three components alone make up 45 percentof the losses for the whole transmission at fullload.
If an improvement in efficiency is requiredthese components should be investigated first dueto this significant impact on overall efficiency.All other components contribute less than 7percent each.
Summary
A previously developed method for calculatingefficiency of spur gears was extended to includeplanetary gearsets. A friction coefficient modelwas developed for a MIL-L-7808 type oil based ondisc machine friction data. Power loss of a com-
plete T561501 gearbox was determined using thesemethods in conjunction with both the Harris bear-
ing power loss expressions and large scale bearingcomputer programs. The following results wereobtained:
(1) Gearbox spin loss predictions to 13 820"rpm agreed well with measured data.
(2) Gearbox losses at flight conditions were
underestimated resulting in a gearbox efficiencyprediction that was approximately 0.3 percentagepoints above the measured data over the operatingrange. This difference is within the experimentalaccuracy of the measurement and the anticipatedaccuracy of the friction model employed.
(3) The planetary gearset had approximately
half the losses of the high speed external maindrive mesh even though both were carrying approx-imately 3132 kW (4200 hp).
(4) Losses in the oi1 pumps were a majorportion of both the spin and full power losses.
I°
2°
3.
References
Shipley, E. E., "Loaded Gears in Action,"
Gear Handbook, D. W. Dudley, ed., McGrawHi]1, Inc., 1962, pp. 14-1 to 14-60.
Buckingham, E., "Efficiencies of Gears,"Analytical Mechanics of Gears," Dover Publi-cations, 1963, pp. 395-425.
Anderson, N. E., and Loewenthal, S. H."Spur-Gear-System Efficiency at Part andFull Load," NASA TP-1622, AVRADCOM TR 79-46,1980.
4. Anderson, N. E., and Loewenthal, S. H.,"Design of Spur Gears for Improved Effi-ciency," ASME Journal of Mechanical Design,Vol. 104, Oct. 1982, pp. 767-774.
5. Anderson, N. E., and Loewenthal, S. H.,
"Efficiency of Nonstandard and High ContactRatio Involute Spur Gears," to be presentedat the Fourth International Power Transmis-sion and Gearing Conference, Oct. 1984.
6. Benedict, G. H., and Kelley, B. W.,"Instantaneous Coefficient of Gear Tooth
Friction," ASLE Transactions, Vo1. 4, No. 1,Apr1. 1961, pp. 59-70.
7.
9o
10.
11.
Mitchell, A. M., "Lubricant Effects onEfficiency of a Helicopter Transmission,"NASA TM-82857, American Helicopter Societypaper No. AHS-RWP-15. (See also AVRADCOMTR-82-C-9).
Crook, A.W., "The Lubrication of Rollers.IV - Measurements of Friction and EffectiveViscosity," Philisophical Transactions ofthe Royal Society (London), sen. A, Vol.255, No. 1056, Jan. 1963, pp. 281-312.
Hamrock, B. J., and Dowson, D., "IsothermalElastohydrodynamic Lubrication of Point Con-tacts. III- Fully Flooded Results," ASMEJournal of Lubrication Technology, Vol. 99,No. 2, Apr. 1977, pp. 264-276.
Cheng, H. S., "Prediction of Film Thickness
and Sliding Frictional Coefficients inElastohydrodynamic Contacts," ASME DesignEngineering Technology Conference, ASME, NewYork, 1974, pp. 286-293.
Khiralla, T. W., On the Geometry of ExternalInvolute Spur Gears, CII Leaming, NorthHollywood, Calif., 1976.
12.
13.
14.
15.
16.
17.
18.
19.
20.
21.
G1over, J. H., "Efficiency and Speed RatioFormulas for P]anetary Gear Systems," ProductEngineering, Sept. 27, 1965.
K]eckner, R. J., and Pirvics, J., "HighSpeed Cylindrical Roller Bearing Analysis(CYBEAN) Users's Manual," SKF Report No.AL78P023, SKF Industries, Inc. (NASA ContractNo. NAS3-22807), July, 1978.
K1eckner, R. J., Dyba, G. J., and Ragen, M.
A., "Spherical Roller Bearing Analysis(SPHERBEAN) User's Manual," SKF Report No.
AT81DO07, SKF Industries, Inc. (NASA ContractNAS3-22807), Feb. 1982.
Hadden, G. B., K1eckner, R. J., Ragen, M. A.,
and Sheynin, L., "System Including Ba11,Cylindrical, and Tapered Roller Bearings(SHABERTH) User's Manual," SKF Report No.AT81D040_ SKF Industries, Inc. (NASA ContractNo. NAS3-22690), May, 1981.
Harris, T. A., "Rolling Bearing Analysis.
John Wiley and Sons, Inc., 1966, pp. 446-450.
Walowitt, J. A., "Traction Characteristicsof a MIL-L-7808 Oil," ASME Paper 76-LubS-191976.
Gupta, P. K., Flammand, L., Berthe, D., and
Godet, M.: "On the Traction Behavior ofSeveral Lubricants," ASME paper 80-C21Lub-15,1980.
Johnson, K. L., and Greenwood, J. A. "Ther-
mal Analysis of an Eyring Fluid in E1astohy-drodynamic Traction," Wear, Vol. 61, 1980,pp. 353-374.
Tevaarwerk, J. L., "Traction in LubricationContacts," Proceedings of International Sym-posium on Contact Mechanics and Wear of Rail/Wheel Systems. Vancouver, Canada, July 6-9,1982.
Jeffries, J. A., and Johnson, K. L., "Slid-ing Friction Between Lubricated Rollers,"Traction in Elastohydrodynamic Contacts,Proceedings of Institution of MechanicalEngineers, Vol. 182, pt. I, No. 4, 1967-68.

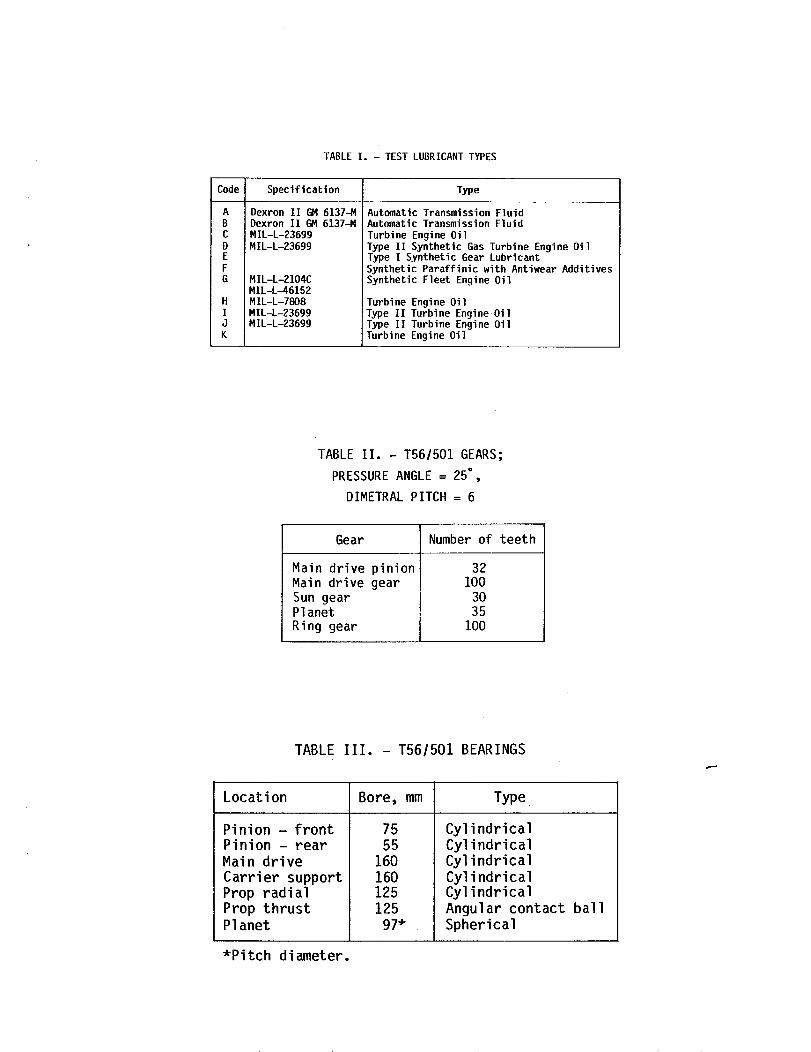
Code
TABLE I. - TEST LUBRICANT TYPES
Specification Type
Dexron II GM 6137-M
Dexron II GM 6137-M
MIL-L-23699
MIL-L-2369g
MIL-L-2104C
MIL-L-46152
MIL-L-7808
MIL-L-23699
MIL-L-2369g
Automatic Transmission Fluid
Automatic Transmission F]uid
Turbine Engine 0i1
Type II Synthetic Gas Turbine Engine 0i1
Type I Synthetic Gear Lubricant
Synthetic Paraffinic with Antiwear Additives
Synthetic Fleet Engine Oil
Turbine Engine 0i1
Type II Turbine Engine 0i1
Type II Turbine Engine Oil
Turbine Engine 0i1
TABLE II. - T561501 GEARS;
PRESSURE ANGLE = 25°,
DIMETRAL PITCH = 6
Gear Number of teeth
Main drive pinion 32Main drive gear 100Sun gear 30Planet 35
Ring gear 100
TABLE III. - T561501 BEARINGS
Locati on Bore, mm Type
Pinion - front
Pinion - rear
Main drive
Carrier support
Prop radial
Prop thrustPlanet
75
55
160
160125
125
97*
Cylindrical
Cylindrical
Cylindrical
CylindricalCylindrical
Angular contact ball
Spherical
*Pitch diameter.
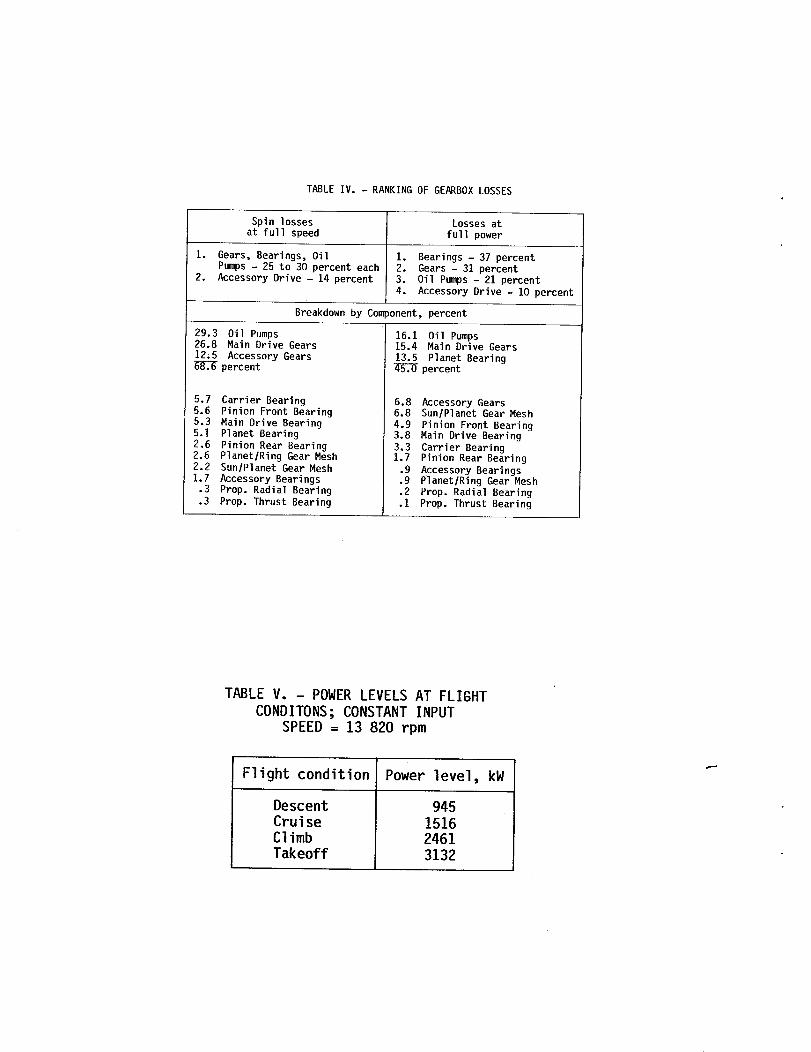
TABLE IV. - RANKING OF GEARBOX LOSSES
Spin losses Losses at
at full speed full power
1. Gears, Bearings, Oil 1. Bearings - 37 percent
Pumps - 25 to 30 percent each 2. Gears - 31 percent
2. Accessory Drive - 14 percent 3. Oil Pumps - 21 percent
4. Accessory Drive - 10 percent
Breakdown by Component, percent
29.3 Oil Pumps26.8 Main Drive Gears
12.5 Accessory Gears
68.6 percent
5.7 Carrier Bearing
5.6 Pinion Front Bearing
5.3 Main Drive Bearing
5.1 Planet Bearing
2.6 Pinion Rear Bearing
2.6 Planet/Ring Gear Mesh
2.2 Sun/Planet Gear Mesh
1.7 Accessory Bearings
.3 Prop. Radial Bearing
.3 Prop. Thrust Bearing
16.1 Oil Pumps
15.4 Main Drive Gears
13.5 Planet Bearing
_percent
6.8 Accessory Gears
6.8 Sun/Planet Gear Mesh
4.9 Pinion Front Bearing3.8 Main Drive Bearing
3.3 Carrier Bearing1.7 Pinion Rear Bearing
.9 Accessory Bearings.9 Planet/Ring Gear Mesh
.2 Prop. Radial Bearing
.1 Prop. Thrust Bearing
TABLE V. - POWER LEVELS AT FLIGHT
CONDITONS; CONSTANT INPUT
SPEED = 13 820 rpm
Flight condition Power level, kW
Descent
Cruise
Climb
Takeoff
945
15162461
3132
I--Z
¢.D
O-
>.-(DZ
i.i.1,3..iaJ
98.9--
98.8
98.7
98.6--
98.5--
98.4
98.3 i35O
I170
K
G
IB E I I355 360 365 370 3?5 380
OIL INLETTEMPERATURE,OK
I I I I I180 190 200 210 220
OILINLETTEMPERATURE,OF
Figure 1. - Variation in gearbox efficiency for elevendifferentoils definedin Table I. from I?1.
I /- MESH2 CARRIESF'--'FL1MESH 1//" FULLLOAD
MESH2ENGAGEMENT
I.0 -- /" jr-MESH 2AND 3
5 __ r___/// SHARE LOAD"_°_ "0', .' '' ,MESH2
_" /"Xl X2 X3 X4 -"_'-END OFMESH2
_"STARTOF l
0O
(a) Contactratio betweenoneand two.
MESH1
F-r'-L-r_l_ I MESH2/..I.I
._ N_ .66,., _o .33e_
Xl X2 X3 X4 X.5 )(6
MESH3
l MESH4
F-J-"_'_ MESH5
E<_ 3
Xl X2 X3 )(4 )(5 X6
(b) Contactratio betweentwoand th ree.
Figure 2. - Toothnormal loaddistribution.
ADDENDUMRATIO(AR)
P 1.57/
/! p 1.25/ //'- 1 O0
/ / / •/ /A,, ,, ,- o 75// 0_50
(a)Modifiedwith addendumratio.
TOOLSHIFTRATIO(ER)
,/-1.0
//--_\,,',,-o.5II/-t_; r o
jZ(b) Modified with tool shift.
Figure 3. - Non-standardgear toothshapes.
I I I
o
E
r-
8
2.0
1.5
1.0
c.)'-:" .5UaQC.)
AVERAGEROLLINGSPEED,
-- _ mlsr-i
11.4
I I I I I20 40 60 80 100
PERCENTSLIDING
Figure 5. - Com_rison of regressionanalysis (eq. 21, 22)with
testdataof [1i] for MIL-L-7808 oilo
PINION GEAR--_\
\FRONTPINIONBEARING-'x
\
\
RINGGEAR\\
PLANETBEARING-,\
PLANETGEAF
\ r-REARPINIONx\ [ BEARING
I
\\\ \ I
\ \
\\
\
I I
PROP IRADIALBEARING- I I
IPROP iTHRUSTBEARINGJ I
I
SUNGEARJ
\
MAIN DRIVE
GEAR
MAIN DRIVEBEARING
ERSUPPORTBEARING
Figure 6. - T-56 gearboxarrangement.
/-- RING GEARDRIVE GEAR
/--MAIN DRIVE/ PINION
/--ACCESSORY
DRIVEGEAR
PINIONBEARING--_ REAR
MAIN DRIVE BEARING_
BEARING--/" ___!
BEARING
Figure 7. - TNISO1gears and bearings.
25
I;> PREDICTED ;/_I-1 _ TESTDATAFROM
2O
00 _ SEVERALRUNS
S /
0 2000 4000 6000 8000 10000 12000 14000
GEARBOXINPUTSPEED,rpm
Figure 8. - Gearboxtare lossesas a function of input speed.
0
l,i
0Q.
5
4
0
GEARS_//
- o,,PU,_-,.,//.- />/,,-- BEARINGS_ s/Ss;/
i>7 .- ...../! .i....y/ .i
.,,,'Y./- ..I .....--'D/"./ ..,..I"
-- .....*-'"_Ii.._-..i " '_-ACCESSORY
2 4 6 8 I0 12 14
GEARBOX INPUTSPEED,rpml1000
Figure9.-AnalyEcalbreakdownofgearboxtarelossesasafunction of input speed.
50--
40
_oo_ 20X0
10
100 n
m
DESCENT CRUISE CLIMB TAKEOFF
_-_ PREDICTEDMEASURED
I I I I I I I(a) Powerloss.
98
96
x 94
<I:
92
90
DESCENT CRUISE CLIMB TAKEOFF
I I I I I I I0 500 1000 1500 2000 2500 3000 3500
INPUTPOWER,kW
(b) Efficiency.
Figure 10. - Gearboxlossesas a function of transmittedpowerat full input speed= 13820 rpm.
O,,...I
e-,,,hl
O
12
10
6
m
BEARINGS
_,..._.,..,...""p _ p PUMPS
""";"_"'_----_ IEAR WINDAGE
D ACCESSORY DRIVE /
n A A _A lj-""
_.._.. GEARSLIDINGI_ I..... .._ GEARROLLING
i r- J500 1000 1500 2000 2500 3000 3500
INPUTPOWER,kW
Figure 11. - Analytical breakdownof gearboxlossesas a func-tion of inputpowerat full input speed= 13 820 rpm.
0.-J
ev-la.I
0
ev-
,,<;
2.00
1. 75
1.50
1.25
1.00
•75
.50
.25
GEARBOXBEARINGS
PINION-FRONT _..
_ MAIN DRIVE
CARRIERSUPPORT
____.. -- ,. PLANET./......_
._-" PINION-REAR
--PROP-THRUST_ r-PROP-RADIAL/
/
500 1000 1500 2000 2500 3000 3500
INPUTPOWER,kW
Figure 12. - Analytical breakdownof bearing lossesas a func-tion of input powerat full input speed= 13 820 rpm.
Ol--
If)
,..I
i,i
C)Q..
7
6
5
4
3
2
1
GEAR MESH
- M_
SUN/PLANET
jjjl
i_ jj
--r_..-..___c__t......_....______:__,___500 I000 1500 2000 2500 3000
INPUTPOWER,kW
I3500
Figure 13. - Analytical breakdownof gear lossesas a functionof input power at full input speed= 13 820 rpm.

1. Report No. NASA TM-83716USAAVSCOM-TR- 84- C- 8AIAA- 84-1500
4. Title and Subtitle
2. Govemment Accession No. 3. Recipient's Catalog No.
5. Report Date
An Analytical Method To Predict Efficiency of AircraftGearboxes
7. Author(s)
Neil E. Anderson, Stuart H. Loewenthal, andJoseph D. Black
9. Performing Organization Name and Address
NASA Lewis Research Center and Propulsion LaboratoryU.S. Army Research and Technology Laboratories (AVSCOM)Cleveland, Ohio 44]35
12. Sponsoring Agency Name and Address
National Aeronautics and Space Administration
Washington, D.C. 20546 and U.S. Army Aviation
Systems Command, St. Louis, Mo. 63120
"15. Supplementary Notes
6. Performing Organization Code
505-40-42
8. Performing Organization Report No.
E-2169
10. Work Unit No.
111. Contract or Grant No.
13. Type of Report and Period Covered
Technical Memorandum
14. Sponsoring Agency Code
Nell Eo Anderson, Propulsion Laboratory, AVSCOM Research and Technology Labora-
tories, Lewis Research Center, Cleveland, Ohio; currently with Allison Gas Turbine
Operations. Stuart H. Loewenthal, Lewis Research Center; Joseph D. Black, Allison
Gas Turbine Operations, Indianapolis, Indiana. Prepared for the Twentieth Joint
Propulsion Conference cosponsored by the AIAA, SAE, and ASME, Cincinnati, Ohio,June If-13, 1984.
16. Abstract
A spur gear efficiency prediction method previously developed by the authors was
extended to include power loss of planetary gearsets. A friction coefficientmodel was developed for MIL-L-7808 oil based on disc machine data. This combined
with the recent capability of predicting losses in spur gears of nonstandard pro-
portions allows the calculation of power loss for complete aircraft gearboxesthat utilize spur gears. The method was applied to the T561501 turboprop gear-
box and compared with measured test data. Bearing losses were calculated with
large scale computer programs. Breakdowns of the gearbox losses point out areas
for possible improvement.
17. Key Words (Suggested by Author(s)) 18. Distribution Statement
Gears
EfficiencyPower loss
Unclassified- unlimited
STAR Category Ol
;19. Security Classif. (of this report)
Uncl assi fied20. Security Classif. (of this page) 21. No. of pages 22. Price"
Uncl assi fled
*For sale by the National Technical Information Service, Springfield, Virginia 22161