Embed Size (px)
Citation preview
InvestmentResearchMethods2(BEFM014)Coursework
NHATMINH,Tran650051066
FEIFEI,Wang650030826
EUGENE,Ang620023714
DIEULINH,Vu650041533
LINXIAO,Xie650047842

1. What are the principal differences in the business activities and operating models of these three companies?
Differences Sources of revenue The most widely implemented strategy of major international cement companies is focusing on cost reduction plans and internal growth. Lafarge, currently in the form of the merged entity LafargeHolcim, is the second largest cement manufacturer in the world. Cement production represents the core business activity of the company, representing 71.37% of its gross revenue. Since the industry itself requires a sizeable network in manufacturing and transportation, Lafarge engages in acquisition activities globally, specifically in emerging markets. The firm has expanded through acquisition in these markets, especially in the Asia-Pacific areas, to hedge against saturation of demand in developed regions such as Europe. According to Lafarge, emerging markets account for 90% of world demand for cement, and they account for more than half of Lafarge’s revenues. As such, its fortunes will be more heavily dependent on the economic performance of emerging countries, than either Vodafone, which derives 64% of its revenues from its European market, and Diageo, where 62% of its revenue still comes from Europe and North America.
Figure 1: Lafarge geographical share
21%
38%
20%
14%
7%
Lafargein2007
AsiaPacific
Europe
NorthAmerica
LatinAmerica
AfricaMiddleEast

Figure 2: Lafarge geographical share
In an industry as cutthroat, and with as little margins as that of the telecommunications sector, size does matter. Operators need to be large enough and provide cash flow effectively to satisfy the costs of expanding networks and services that become obsolete seemingly overnight (“The Industry Handbook: The Telecommunications Industry”, n.d.). To some extent, this issue could be solved simply through mergers and acquisitions.
Figure 3: Vodafone geographical share
Vodafone mainly acquires, and does not merge or consolidate. Could operating expenses possibly be hidden within restructuring charges for integrating new
35%
28%
17%
15%
5%
Lafargein2014
AsiaPacific
Europe
NorthAmerica
LatinAmerica
AfricaMiddleEast
35%
64%
1%
Vodafone
Africa,MiddleEast,Asia-Pacific
Europe
Others

acquisitions? This was taken into account, but their restructuring charges were found to be largely in line with its competitors, such as BT Group. In addition, while Vodafone’s rates of acquisition and amount spent on such activities have been notably greater than those of Lafarge and Diageo, its impairment of goodwill has also been much greater than either company. We shall touch upon this issue in the next few questions. Marketing spend Diageo has a high fixed asset turnover due to their low proportion of fixed assets to total assets. They are more reliant on their strong brand power to generate revenue, as more of a luxury goods company, rather than one producing mere beverages. Once you have an established brand, you do not really need to continually innovate or maintain, especially in the luxury retail market. Diageo is therefore more dependent on its licenses and trademarks, and it has a market share of 26% of the world premium drinks market. It does however need to rely on marketing to retain its dominant market share, with a marketing spend of around 15.8% of its revenue in 2014, or £1.62 billion. This is in contrast to both Lafarge, which spends a negligible amount on marketing due to the fact that its products are not consumer goods, and Vodafone, which spent around £600 million, a mere 1.42% of its group revenue. This might also contribute to the relative stability of its asset ratios, in comparison to Lafarge and Vodafone. Profit margins
Figure 4: Net margin of 3 companies
It should be noted that Vodafone’s large net margin increase in 2014 was a one-off occurrence, immensely boosted by its sale of Verizon Wireless for £79 billion. It market value was slashed by half as a result.
-0.5000
0.0000
0.5000
1.0000
1.5000
2.0000
2015 2014 2013 2012 2011 2010 2009 2008 2007
Netmargin
Lafarge Diageo Vodafone

Market share In contrast to Lafarge, which held a 35% share of the European cement market before its merger with Holcim, Vodafone faces stiff competition, holding a mere 11.3% of the European telecommunications market. Although this might not be a number to scoff at, as it is a whole 5.3% higher than its closest competitor, O2, the telecommunications market is a highly competitive one, given the fast pace of technological progress, and the heavy investment needed to sustain market share. Hence, its capital expenditure remains high. Capital expenditure The main differentiating characteristic of the cement industry is its highly capital-intense nature, and its focus on selling to other business, mainly in construction. This is markedly different from both Diageo and Vodafone, both of which target consumers. However, Vodafone’s capex ratios have outstripped Lafarge recently. We shall touch upon this in the next question.
Figure 5: Capex margin of 3 companies
Debt level The debt-to-equity ratio is much higher for Diageo than its competitors. This is mainly achieved through debt-funded acquisitions and joint ventures in emerging economies, and might leave it uniquely exposed to economic shocks. Almost this might accelerate earnings, it would also incur high interest expenses. RBS was another firm that expanded rapidly in this manner, almost entirely due to acquisitions as well, and also fell just as quickly when the financial crisis hit almost a decade ago.
0.0000
0.0500
0.1000
0.1500
0.2000
2014 2013 2012 2011 2010 2009 2008 2007
Capexmargin
Lafarge Diageo Vodafone

Diageo’s high D/E ratio is also unusual, given that it is not a capital-intensive firm judging by its fixed asset ratios and capital expenditure. Lafarge’s capital structure is also surprising, given its capital-intense nature. This might be a good sign for the company, perhaps signifying that their expansion is funded internally. Vodafone’s massive equity levels, about £66 billion, compared to about £7.7 billion for Diageo and £12 billion for Lafarge, contribute to its low debt-to-equity ratio.
Figure 6: Debt-to-equity ratios of 3 companies
Similarities Geographical spread of Lafarge and Diageo In spite of their differences, Lafarge, Diageo, and Vodafone all have their main revenue bases in developed countries. Lafarge and Diageo have both started to solidify their positions in emerging markets, however, in order to hedge against swings in demand caused by deteriorating economic conditions in developed countries.
0.000050.0000
100.0000150.0000200.0000250.0000300.0000
2014 2013 2012 2011 2010 2009 2008 2007
Debt-to-Equity
Lafarge Diageo Vodafone

Figure 7: Diageo geographical share
This looks quite similar to Lafarge’s geographical spread. Although the bulk of revenue is still derived from advanced economies, they still have significant presence in developing regions.
13%
28%
34%
11%
14%
Diageo
AsiaPacific
Europe
NorthAmerica
LatinAmerica
Africa

Sales growth The performance of these companies is also somewhat correlated with the performance of the economies in which they operate. When the economy performs well, there is an upswing of demand for their products, and when it does not, demand will tend to fall.
Figure 8: Sales growth of 3 companies
Note the remarkable correlation between sales for all three firms, and the world GDP growth rate.
-0.2000
-0.1000
0.0000
0.1000
0.2000
0.3000
0.4000
2014 2013 2012 2011 2010 2009 2008 2007
Salesgrowth
Lafarge Diageo Vodafone WorldGDP

2. How does this affect their patterns of acquiring and utilising fixed assets?
Figure 9: Fixed asset ratios of 3 companies
While both Diageo and Vodafone have been steadily increasing their proportion of fixed assets over the past decade, Lafarge has seen this number fall, down from an average of 42% over the years 2007-10, to just under 36% in 2014. The differences in business models between the firms means that Lafarge has far greater holdings of fixed assets than Vodafone or Diageo. Cement is a product that is costly to transport overland. Consequently, the location of a cement plant and the cement transportation cost significantly affects the plant’s competiveness. The further the plants are, the easier the firm access its clients and reduce delivering cost. Therefore, manufacturing and transportation play an important role in keeping the businesses’ competitive edge, leading Lafarge to aggressively engage in acquisition activities globally, and specifically in emerging markets, throughout the past decade. As a result, the firm’s fixed assets dominates its balance sheet. Lafarge’s fixed assets accounted on average for more than 40% of total assets from 2007 to 2014, and more than 65% of Lafarge’s fixed assets is in the form of machinery and equipment. In contrast, Diageo provides a product that can be produced in a few central locations, and then shipped worldwide. Hence, it stands to reason that its fixed assets would be lower in proportion. Finally, Vodafone is more of a service provider
0.00%
10.00%
20.00%
30.00%
40.00%
50.00%
2014 2013 2012 2011 2010 2009 2008 2007
Fixedassetratio
Lafarge Diageo Vodafone

than a producer of physical goods. As such, its holdings of fixed assets would also be significantly lower than Lafarge.
Figure 10: Lafarge asset structure ratios
Diageo has a high fixed asset turnover due to their low proportion of fixed assets to total assets. They are more reliant on their strong brand power to generate revenue, as more of a luxury goods company, rather than one producing mere beverages.
Figure 12: Fixed asset turnover ratios of 3 companies
It follows that because Lafarge has such high levels of fixed assets, it has a lower fixed asset turnover. Vodafone, which enjoys higher margins than Lafarge due to the
32.64% 31.30% 30.87% 31.19% 33.72% 33.54% 32.93% 26.39%
35.96% 35.33% 39.13% 38.94%42.64% 42.61% 41.87%
42.37%
0.00%
20.00%
40.00%
60.00%
80.00%
100.00%
120.00%
2014 2013 2012 2011 2010 2009 2008 2007
Goodwill/Totalassets Intangibleassets/Totalassets Fixedassets/Totalassets
Inventory/Totalassets Otherassets/Totalasset
0.00
1.00
2.00
3.00
4.00
5.00
2014 2013 2012 2011 2010 2009 2008 2007
Fixedassetturnover
Lafarge Diageo Vodafone

nature of the industry it operates in, has a fixed asset turnover about twice as high. So far, so good. In 2014, Vodafone’s fixed asset ratio increased, due to a large fall in its long-term investment in unconsolidated subsidiaries, to the tune of roughly £46.3 billion. This is most likely attributed to its sale of Verizon Wireless. Concurrently, its holdings of machinery and equipment, which comprises about 96.7% of their total fixed assets, increased by 29.95% over the past year, which represents a major increase over its average level of £17.52 billion. In fact, this pattern persisted to the next year, where its total fixed assets jumped by another 16.4% to £26.6 billion, a massive 51.29% increase over 2013.
Figure 13: Inventory turnover ratios of 3 companies
Changes in their holdings of fixed assets do not seem to have significant impact on the inventory turnover of any of the three firms. Diageo, being a company that produces goods with a finite shelf life, sold in a retail context, tends to have a much lower inventory turnover than the other two firms. Lafarge, which also makes a physical good, also enjoys a relatively low inventory turnover. Both Lafarge and Diageo have maintained stable levels of inventory turnover over the years. Vodafone, which does not produce much physical goods at all, naturally has a much higher inventory turnover than either of the other two firms, due to its comparatively low levels of inventory.
0.00
10.00
20.00
30.00
40.00
50.00
60.00
2014 2013 2012 2011 2010 2009 2008 2007
Inventoryturnover
Lafarge Diageo Vodafone

Figure 14: Inventory growth of 3 companies
Inventory growth seems to be relatively stable across the years for all three firms, with no indication that it is out of line with revenue growth. We can not detect any sign of earnings manipulation as of yet.
Figure 15: Depreciation-to-fixed-assets ratios of 3 companies
-40.00%
-20.00%
0.00%
20.00%
40.00%
60.00%
80.00%
2014 2013 2012 2011 2010 2009 2008 2007
InventoryGrowth
Lafarge Diageo Vodafone
0.00%
2.00%
4.00%
6.00%
8.00%
10.00%
12.00%
2014 2013 2012 2011 2010 2009 2008 2007
DepreciationtoFixedAssets
Lafarge Diageo Vodafone

Figure 16: Depreciation-to-revenue ratios of 3 companies
Being in industries where the activities are not expected to cause wear and tear, and it stands to reason that both Diageo and Vodafone would have lower levels of depreciation than Lafarge. However, Vodafone’s depreciation to fixed ratio is far higher than either Lafarge, or Diageo. Although Diageo has a higher ratio of depreciation compared to its fixed assets compared to Lafarge, it is the lowest overall in terms of percentage of revenue. Let us focus on Vodafone. As depreciation is based on discretion and company policy, this could be due to a number of reasons. Firstly, this is evidence of earnings smoothing, or cookie-jar accounting on the part of Vodafone, whereby they report higher levels of depreciation in earlier years when their profits are healthier, so that they can lower depreciation charges in later years, if needed to, to boost their earnings for that period. However, Vodafone’s depreciation to fixed asset ratio was around 8% in 2014, whereas BT Group’s was 19.95% for the same period, more than twice as high. This seems to discredit any attempt to accuse Vodafone of creative accounting in this arena. Secondly, this could be due to the nature of the equipment employed by Vodafone. Being a firm with a more technological nature than either Diageo or Lafarge, it could stand to reason that with relentless advancements in technology, Vodafone is constantly required to overhaul its infrastructure, in order to keep up to step with its competitors.
0.00%
2.00%
4.00%
6.00%
8.00%
10.00%
12.00%
2014 2013 2012 2011 2010 2009 2008 2007
DepreciationtoRevenue
Lafarge Diageo Vodafone

Figure 17: Capex margin of 3 companies
Vodafone faces stiffer competition, hence its increased capital expenditure. Its market share in Europe is a mere 11.3%, compared to Lafarge, which is the second-largest company in its sector, and Diageo, which holds 26% of the world premium drinks market. Vodafone is thus forced to spend more on state-of-the-art infrastructure than its competitors, and this is exacerbated by the rapid pace of technological progress. The costs to implement any emergent technology, and be the first, or one of the first, to get it onto the market, is always high.
Figure 18: Return on fixed assets ratios of 3 companies
0.00000.02000.04000.06000.08000.10000.12000.14000.16000.1800
2014 2013 2012 2011 2010 2009 2008 2007
Capexmargin
Lafarge Diageo Vodafone
-60.00%
-40.00%
-20.00%
0.00%
20.00%
40.00%
60.00%
80.00%
100.00%
2014 2013 2012 2011 2010 2009 2008 2007
Returnonfixedassets
Lafarge Diageo Vodafone

An interesting thing to note here is that Lafarge has remarkably low returns on their PPE, which has been dropping consistently since 2007, from around 15%, to 1.19% in 2014. This could be explained by their high levels of fixed assets. Similarly, Diageo enjoys a relatively high ROFA due to its lower proportion of fixed assets compared to its income. These differences can be attributed to the different nature of the industries that these firms operate in. Based on the capex margin, we can see that although Vodafone already has an impressive balance sheet, boosted by its high levels of goodwill, it is nevertheless doing its best to maintain its competitiveness. This is demonstrated by its consistent rate of capital expenditures, which are far higher than either Lafarge or Diageo. This is also supported by its return-to-fixed-asset ratio, which shows that while Vodafone has been spending more on capital, it has also seen higher profits as a resulted of its invested capital.
Figure 19: Operating-lease-to-fixed-assets ratios of 3 companies
Diageo, which relies heavily on marketing, has much lower levels of fixed assets than Lafarge. This is demonstrated both by its much lower fixed asset and capex margin ratios. However, it does have the highest levels of fixed asset turnover and return on fixed assets. Diageo has almost the same proportion of fixed assets as Vodafone, but Vodafone has a far higher proportion of operating leases to either Diageo or Lafarge. This indicates that Vodafone is using PPE which does not appear on its balance sheets. This has the effect of strengthening its balance sheet, but the impact of fixed assets on Vodafone’s financial performance is made murkier.
0.00000.02000.04000.06000.08000.10000.12000.14000.16000.18000.2000
2014 2013 2012 2011 2010 2009 2008 2007
Operatingleasetofixedassets
Lafarge Diageo Vodafone

Given the nature of its business, it is unusual that Lafarge has such a low proportion of operating leases. Assets with residual value, such as aircraft, vehicles, and construction machinery are commonly leased rather than bought, in order to offset residual value risk. Diageo might require specialised equipment to manufacture its premium drinks, and hence it would have to purchase, and subsequently modify, proprietary plant and machinery, which would thus be unable to be returned back to any lessor. Vodafone, on the other hand, operates in a technological field, where rapid changes are common. It would thus make sense for them to lease their assets, rather than buy them outright, as any piece of equipment can quickly become obsolete, losing money for the firm. This would also explain their low fixed asset ratios, and would also partially account for Vodafone’s relatively high ratios of depreciation relative to its level of fixed assets, as depreciation on leased assets would still appear on its income statement, although it would not show up on the balance sheet as part of its assets.

3. How does this affect their varying levels of reliance upon intangible assets? The presence of goodwill indicates that the firm in question has been active in acquiring other companies, normally as part of its expansionary strategies. Logically, the higher the level of goodwill present on a firm’s balance sheet, the more active it has been in acquiring other companies in the past. Unlike other intangible assets, goodwill is not amortized. Instead, it is subject to annual impairment tests, which will reduce the value of the goodwill, should the fair market value ever become less than the carrying value, which is the book value less any depreciation, amortization, or impairment charges.
Figure 20: Goodwill-to-total-assets ratios of 3 companies
Firms can seek to improve the superficial health of their balance sheet, in order to present a better view to shareholders and investors. Some may attempt to do this by retaining high levels of goodwill on their balance sheet. Deriving the fair value is always tricky, and there is much room for discretion in this regard. Firms may attempt to prevent the impairment of goodwill by giving overly high estimates of the fair value of their goodwill, ensuring that it stays on their books, in order to present a healthier set of accounts to the public.
0.00%5.00%
10.00%15.00%20.00%25.00%30.00%35.00%40.00%45.00%
2014 2013 2012 2011 2010 2009 2008 2007
GoodwilltoTotalAssets
Lafarge Diageo Vodafone

Vodafone
Figure 21: Vodafone asset structure
Similar to Diageo, Vodafone’s non-current assets section is dominated by intangible assets and goodwill. Again, similarly to Diageo, most of these assets were acquired through mergers and acquisitions. Other intangible assets include licenses and computer software. Tangible assets, on the other hand, only comprise a small proportion in total assets of the company.
Vodafone’s goodwill dropped, fixed assets increased. It is worth noticing that intangible segment magnitude including goodwill and other intangible assets narrowed gradually in the observed time period (from 51.53% in 2007 to 46.12% in 2014). While Vodafone has played host to spectacular levels of goodwill in the past, with up to 40% of their total assets being comprised of goodwill roughly 7 to 8 years ago, this number has declined dramatically in recent years. In 2014, goodwill only made up 23% of their total assets. Here, we can see that Vodafone has been steadily impairing its goodwill over the years. The share of goodwill almost halved from 2008 to 2014. This makes it hard to indict them for manipulating their balance sheet, as this is a sign of conservative accounting. The question is, are they impairing enough of their goodwill?
0.00%
10.00%
20.00%
30.00%
40.00%
50.00%
2014 2013 2012 2011 2010 2009 2008 2007
ProportionofAssets:Vodafone
Goodwill/Totalassets Otherintangibleassets/Totalassets
Fixedassets/Totalassets

Figure 22: Sales growth
Over the 2011-2014 period, Vodafone acquired more than £16.67 billion worth of companies. For the same period, BT Group made no acquisitions. The only acquisition made by BT Group, Vodafone’s most prominent competitor in the UK, was for EE, the largest mobile operator in the UK, to the tune of £12.5 billion. This was finalised in late January 2016, out of the time frame that we are looking at. Across our time frame, Vodafone’s revenues were shrinking at a much higher pace than BT. This can be explained by the fact that the firms acquired, in India, the UK, Germany, and Spain, were located in economies that were not doing as well over that period. However, it is still not a good look for Vodafone, after splurging all that money on acquisitions, and especially in comparison to its competition.
Figure 23: Goodwill-to-total-assets ratios
-0.1000
-0.0500
0.0000
0.0500
0.1000
0.1500
0.2000
2014 2013 2012 2011 2010 2009 2008 2007
SalesGrowth:VodafonevsBT
Vodafone BTGroup
0.00%5.00%
10.00%15.00%20.00%25.00%30.00%35.00%40.00%45.00%
2014 2013 2012 2011 2010 2009 2008 2007
GoodwilltoTotalAssets:VodafonevsBT
Vodafone BTGroup

Vodafone, as mentioned earlier, has been impairing its goodwill at a steady pace. However, given its lacklustre, steadily declining performance compared to the scale of its acquisitions, perhaps Vodafone should be impairing its goodwill at an even higher rate than before, perhaps its line with its failing revenue growth, to present a fairer view of its books to shareholders. However, let us look at the other two firms in our analysis, Lafarge and Diageo, before we call judgement.

Lafarge
Figure 24: Lafarge asset structure
Goodwill contributes a large proportion of total assets of the firm (approximately 30% on average). This achievement was acquired by firm’s acquisition agreements throughout the past 25 years. Inventory and intangible assets, on the other hand, only take a very small proportion of Lafarge’s total asset. While Lafarge has a large proportion of fixed assets (35.96%), this has been in decline in recent years. In contrast, its proportion of goodwill has been on an upward trend over the past four years. Its other intangible assets are negligible, forming only around 1% of their total assets. In its financial statements, Lafarge is not as clear as either Diageo or Vodafone in breaking down its intangible assets. However, because we have accepted that the nature of its business operations make it more reliant on fixed assets, we can appreciate that there is not such a strong need to be clear on its intangibles.
0.00%
10.00%
20.00%
30.00%
40.00%
50.00%
2014 2013 2012 2011 2010 2009 2008 2007
ProportionofAssets:Lafarge
Goodwill/Totalassets Otherintangibleassets/Totalassets
Fixedassets/Totalassets

Diageo
Figure 25: Diageo asset structure
The majority of Diageo’s assets is comprised of a special category of intangible asset in this accounts, not found in those of Lafarge and Vodafone, called ‘Brands’. Due to its long history of brand acquisition prior to 1997, it has built up a formidable array of different luxury drinks under its umbrella, to capture a larger geographical share of the diverse global alcohol market. In the alcoholic drinks industry, brand acquisition is a common method of expansion and capturing market share. Another company famous for this strategy is SABMiller, which grew from its South African origins into a global leader in the beer market, by a strategy of aggressively acquiring other breweries. Among the three firms of Lafarge, Vodafone, and Diageo, the latter is unique in the sense that a large share of their assets is classified under this term of ‘Brands’. The value of the brands is determined by an extrapolation of the fair price paid by Diageo to acquire them, and as such, is subject to a high level of discretion. As such, we must be wary of this aspect of Diageo’s balance sheet, as the real value of these assets may be very subjective. Needless to say, in a pure sense whereby goodwill is excluded, Diageo is highly reliant on intangible assets in conducting business.
0
1,000
2,000
3,000
4,000
5,000
6,000
7,000
2014 2013 2012 2011 2010 2009 2008 2007 2006
ProportionofAssets:Diageo
Brands Goodwill OtherIntangibles ComputerSoftware FixedAssets

Summary Surprisingly, despite its seeming reliance on fixed assets, it is Lafarge, among the three, which has the highest ratio of goodwill. Its impairment of goodwill was a measly €69 million in 2014, compared with its goodwill of €11,360 million. and in 2010, its impairment was €151 million, with goodwill of €14,327 million. As such, it is highly reliant on goodwill to maintain its asset levels.
Figure 26: Lafarge impairment
After analysing all three firms, it is our opinion that there are significant and glaring problems with all of their books. For Vodafone, its impairment of goodwill does not match up to its slow revenue growth. However, this is not as damning as the sins of the other two firms. Diageo clearly has excessive levels of discretion when it comes to estimating the value of its assets, and this is both unhealthy, and misleading to shareholders. Lafarge is overly reliant on its goodwill, levels of which are now almost as high as those of its fixed assets, which are supposed to be its bread and butter. Given the plunging sales of all three firms, such levels of creative accounting are not at all beneficial to shareholders.
0
2000
4000
6000
8000
10000
12000
14000
16000
2014 2013 2012 2011 2010 2009 2008 2007
Impairment:Lafarge
Impairment Goodwill

4. Do these differences in asset treatment and utilization reflect the contrast in their business activities – drinks v cement v mobile phones? Basically, companies in the cement industry (i.e. Lafarge and CRH) have similar asset structures: The largest proportion belongs to fixed assets following by quite a significant amount of intangible assets, which are mainly goodwill. Furthermore, the fluctuating patterns in profitability and efficiency ratios observed for these companies does not seem be very different. This trend could also be observed from Diageo and Pernod Ricard in the beverage industry.
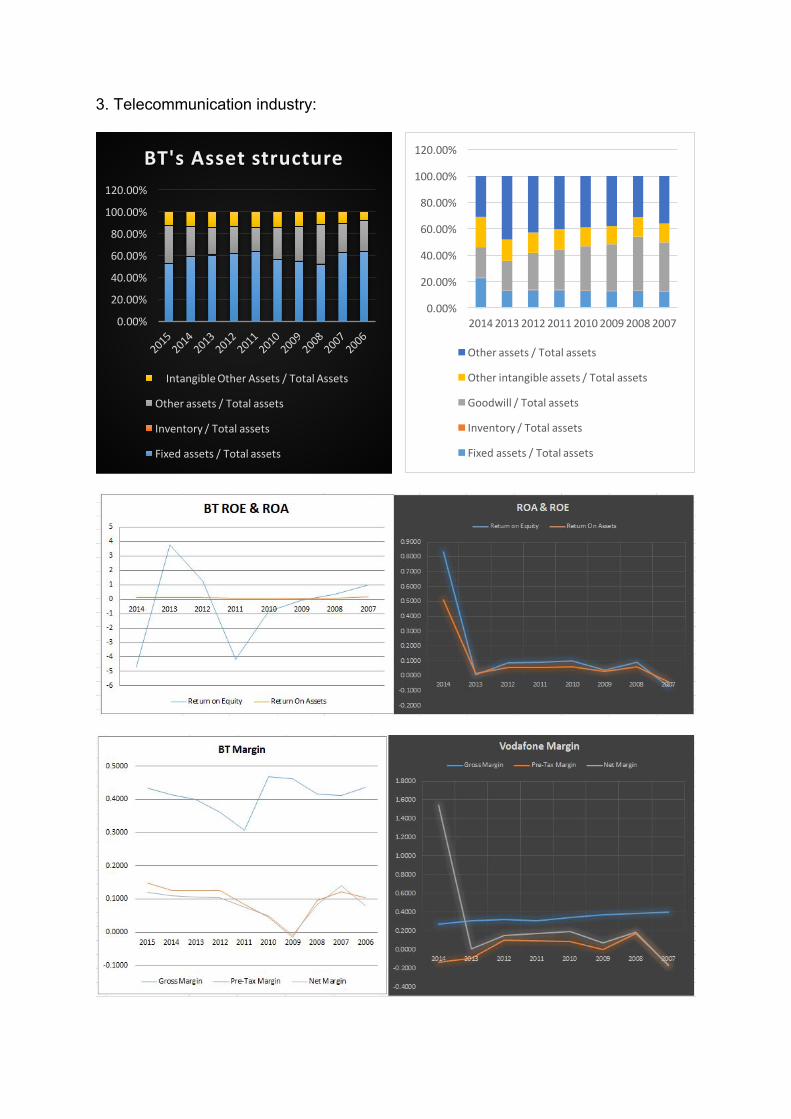
It is a different situation in the telecommunication sectors, where asset treatments and utilisation are not likely to follow any pattern. A comparison between Vodafone and BT can illustrate this.
Figure 27: Vodafone asset structure
0.00%
50.00%
100.00%
150.00%
2014 2013 2012 2011 2010 2009 2008 2007
Otherassets/Totalassets
Otherintangibleassets/Totalassets
Goodwill/Totalassets
Inventory/Totalassets
Fixedassets/Totalassets
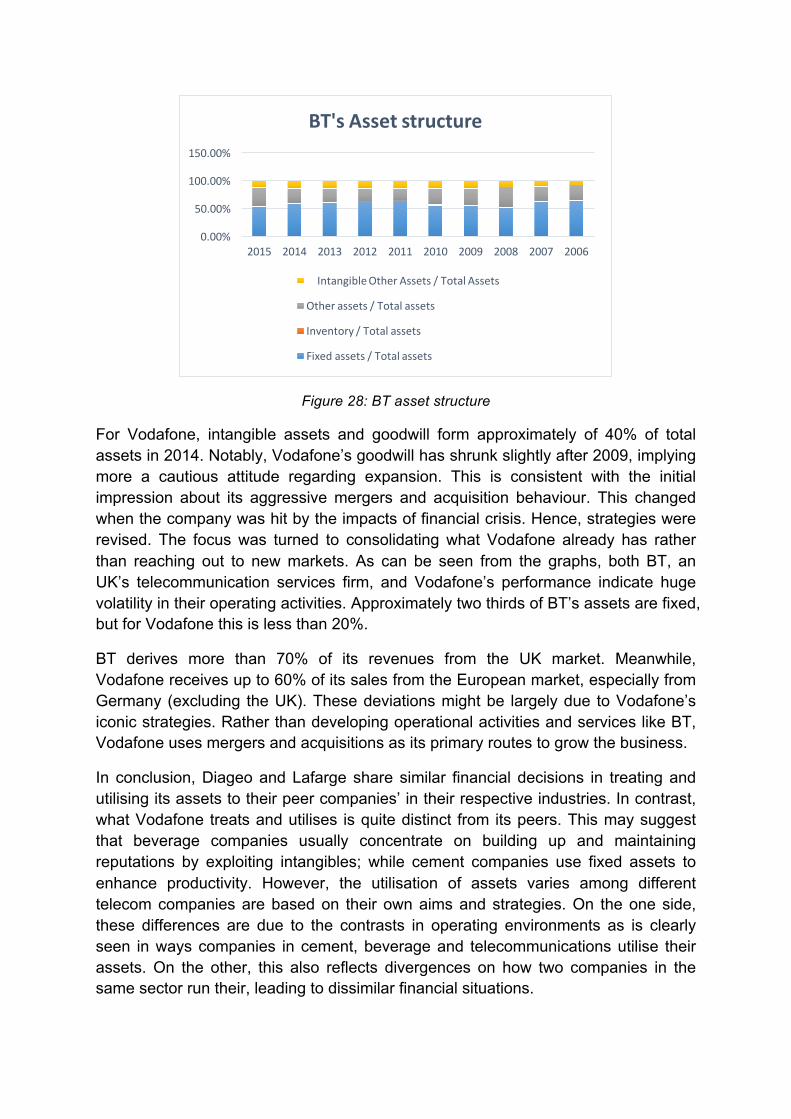
Figure 28: BT asset structure
For Vodafone, intangible assets and goodwill form approximately of 40% of total assets in 2014. Notably, Vodafone’s goodwill has shrunk slightly after 2009, implying more a cautious attitude regarding expansion. This is consistent with the initial impression about its aggressive mergers and acquisition behaviour. This changed when the company was hit by the impacts of financial crisis. Hence, strategies were revised. The focus was turned to consolidating what Vodafone already has rather than reaching out to new markets. As can be seen from the graphs, both BT, an UK’s telecommunication services firm, and Vodafone’s performance indicate huge volatility in their operating activities. Approximately two thirds of BT’s assets are fixed, but for Vodafone this is less than 20%.
BT derives more than 70% of its revenues from the UK market. Meanwhile, Vodafone receives up to 60% of its sales from the European market, especially from Germany (excluding the UK). These deviations might be largely due to Vodafone’s iconic strategies. Rather than developing operational activities and services like BT, Vodafone uses mergers and acquisitions as its primary routes to grow the business.
In conclusion, Diageo and Lafarge share similar financial decisions in treating and utilising its assets to their peer companies’ in their respective industries. In contrast, what Vodafone treats and utilises is quite distinct from its peers. This may suggest that beverage companies usually concentrate on building up and maintaining reputations by exploiting intangibles; while cement companies use fixed assets to enhance productivity. However, the utilisation of assets varies among different telecom companies are based on their own aims and strategies. On the one side, these differences are due to the contrasts in operating environments as is clearly seen in ways companies in cement, beverage and telecommunications utilise their assets. On the other, this also reflects divergences on how two companies in the same sector run their, leading to dissimilar financial situations.
0.00%
50.00%
100.00%
150.00%
2015 2014 2013 2012 2011 2010 2009 2008 2007 2006
BT'sAssetstructure
IntangibleOtherAssets/TotalAssets
Otherassets/Totalassets
Inventory/Totalassets
Fixedassets/Totalassets

5. Or do they reflect different approaches towards delivering shareholders value? Or differences in their corporate cultures and background?
So far, we have understood the key differences in approaches for all three companies. Lafarge seeks to enhance shareholder value by bolstering its balance sheet, through retention of a significant proportion of goodwill. Diageo is basically doing the same thing, however, the assets in question this time fall under its ‘Brands’ category. It is essentially banking on its marketing and brand power to maintain its dominance on the world luxury beverage market. Lastly, Vodafone has sought to increase its value through aggressive acquisition of firms across the globe, seeking to have a wider impact on consumers everywhere, and perhaps seeking to diversify its holdings. All three of them have very different approaches towards delivering shareholder value.
Historically, Diageo only started growing organically since 1997, when it was officially established. Before that, it was just a hodgepodge of a number of large firms which grew by means of a long series of mergers and acquisitions. Even after its official formation, compared to its rivals, Diageo’s growth is relatively less organic. With the recent slowdown in emerging markets affecting the consumption of luxury products, Diageo seems to have resorted to subtle manipulation of its books, in order to retain shareholder confidence.
Similarly, Lafarge’s goodwill, which comprises almost a third of its total assets, was amassed following a long series of acquisitions throughout its history. Its sales performance has been lacklustre of late, and so perhaps they sought to retain shareholder loyalty by bolstering its balance sheet through the rather insidious means of failing to properly impair their goodwill. Hence, the strength of their balance sheet does not accurately reflect a retention or increase in value of their firm. They may be relying on the sentiment that their performance, or at least the strength of their accounts, warrants continued holding of their shares, rather than the fact that their performance has not warranted anything at all.
Vodafone, among the three, seems to be the most earnest in delivering solid value to its shareholders. Instead of relying on highly discretionary holdings of intangible assets to bolster its accounts, it has taken steps to provide a most honest interpretation of its fair value. They have done this by significantly impairing their goodwill over the past decade. Given this, its continued acquisition of companies around the world is not a sign that they are seeking to bolster their books through increasing their share of goodwill. Rather, it seems to be part of a long-term strategy to increase their global presence. The business cycle has ups and downs, and this strategy of acquiring while the market is down, might prove to pay dividends when the market finally reverses.
6. How successful has each of these companies been in delivering shareholder value over the past decade? Is it possible to compare their relative rates of success?
Usually, the shareholder value can be estimated based on various criteria, for examples, firms’ earning growth rates, dividend yields and share prices. In order to deliver value to its shareholders, a firm has to operate efficiently and increase the amount of free cash flow. Different companies have different approach to deliver value based on the operating activities of each.
Diageo: Dividend giant
As a dividend giant, Diageo has delivered shareholder returns by paying large dividends. When Diageo has exhibited exceptional performance, they have decided to reward their stakeholders using these extra earnings.
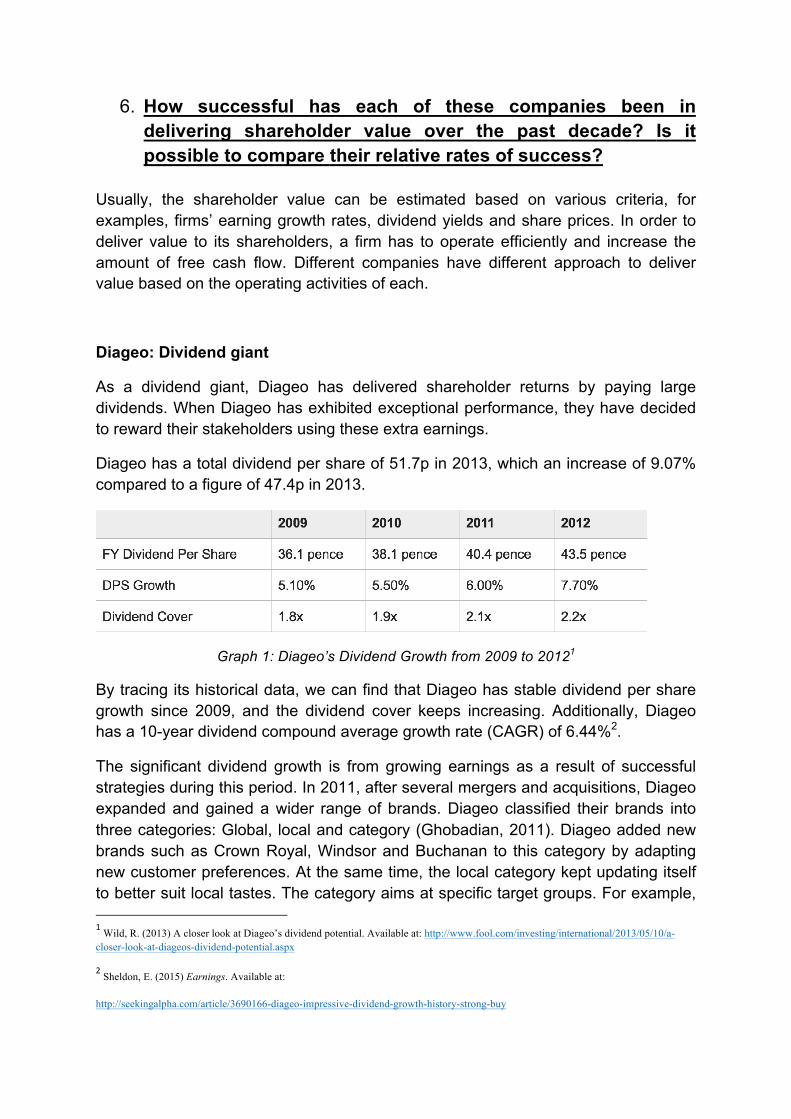
Diageo has a total dividend per share of 51.7p in 2013, which an increase of 9.07% compared to a figure of 47.4p in 2013.
Graph 1: Diageo’s Dividend Growth from 2009 to 20121
By tracing its historical data, we can find that Diageo has stable dividend per share growth since 2009, and the dividend cover keeps increasing. Additionally, Diageo has a 10-year dividend compound average growth rate (CAGR) of 6.44%2.
The significant dividend growth is from growing earnings as a result of successful strategies during this period. In 2011, after several mergers and acquisitions, Diageo expanded and gained a wider range of brands. Diageo classified their brands into three categories: Global, local and category (Ghobadian, 2011). Diageo added new brands such as Crown Royal, Windsor and Buchanan to this category by adapting new customer preferences. At the same time, the local category kept updating itself to better suit local tastes. The category aims at specific target groups. For example, 1 Wild, R. (2013) A closer look at Diageo’s dividend potential. Available at: http://www.fool.com/investing/international/2013/05/10/a-closer-look-at-diageos-dividend-potential.aspx 2 Sheldon, E. (2015) Earnings. Available at:
http://seekingalpha.com/article/3690166-diageo-impressive-dividend-growth-history-strong-buy

a grape-based vodka called Cîroc came out aimed at high-income customers, while they paid much effort to investigate the customers in emerging markets as well.
All efforts turned out to have paid off as Diageo became the top luxury beverage seller worldwide and delivered huge value to their shareholder, usually by paying dividends.
However, Diageo was created in 1997, so it is relatively young and may need further expansion in the future. Thus, the trend of paying out dividends is unlikely to continue. Diageo’s overall performance in value delivery to shareholders in recent years has deteriorated.
Graph 2: Diageo’s FCF, ROIC and Total Shareholder Return Performance3
In 2014, Diageo had £1,235 million of free cash flow, 13.7% return on average invested capital and 2% total shareholder return. From the chart we can see that these numbers have been shrinking over the past five years.
The deteriorated performance is related to their declining sales and lower operating margin in 2014. The sale in some markets underperformed; for example the decline in America is attributed to their whiskies failing to appeal to younger consumers (Daneshkhu, 2016).
Vodafone: Customer priority
Vodafone builds its value by providing more diversified and better services to their customers, thus promoting loyalty and continued revenue growth.
Unlike Diageo, who chose organic growth, plus slowly acquiring others, Vodafone relies mainly on acquisition. Vodafone’s strategy is to acquire its peer companies and absorb their core businesses to increase its own competitiveness. For instance, Vodafone acquired Japan Telecom and Mannesmann, which allowed Vodafone to gain ownership of fixed line operations (Hitt, Ireland and Hoskisson, 2012).
Whether an acquisition is successful or not depends on the degree that Vodafone
3 Diageo Annual Report 2014. Page 21, How we measure performance: Key performance indicators.

utilities the acquired company to increase their earnings and profit. Thus, winning over customers of the acquired company and maintaining existing customers is an important strategy for Vodafone.
Services provided by Vodafone in 2009 contains voice, messaging, data and fixed broadband services, and they gave priority to the development of 3G networks. In 2010, they decided to add Machine-to-machine (M2M) services (Cowan, 2012). In 2012, Vodafone already become the biggest provider of M2M services, and their operating profit almost doubled from £5,596 million in 2011 to £11,187 million in 2012.
The pace of change in the mobile industry is accelerating, Vodafone keeps their loyal customers and explore potential in emerging markets by technological innovation as well as providing customers with the newest services to satisfy their updating needs.
However, similar to Diageo, Vodafone’s performance in delivering services to customers deteriorated as Vodafone ranked the last among the four mobile service providers in UK in network performance reviews. At the same time, Vodafone reported an operating loss of £3,913 million in 2014.
Lafarge: Opportunity seeker
Lafarge focuses more on the long-term, when compared to short to medium term shareholder returns, and make long term investments by utilising leverage. In order to buy Egypt's Orascom Construction Industries, Lafarge paid $11 billion, but ended up near the top of the list of European toxic debt owners (Matlack, 2009). What made things worse is that their debt could be downgraded, such as when it was downgraded to junk by S&P in 2011 (Alphe, 2011), negatively impacting Lafarge’s credibility.
As the market leader in cement manufacturer, Lafarge delivers the value to shareholders mainly by improving their earnings. Since major manufacturers in the cement industry use homogenous raw materials and production processes, the key factor in become differentiated is efficient cost control and providing high quality products (Chatha, 2013). As mentioned previously, Lafarge has made much effort in to reduce transportation cost, and cost reduction helped Lafarge increase their operating profits by 20% (Stothard, 2015).
In addition, as an opportunistic company, Lafarge does well in promoting their corporate social responsibility (CSR) in environmental protection.

The possibility of comparing relative rates of success
We already discussed the different approaches of the three companies so far and we hold the opinion that it is impossible to compare their relative rate of success. First of all, it is difficult to compare their rates of success because the three companies are in different industries and their value delivery approaches are not the same. Diageo combines organic growth with slow rates of acquisition, so they can pay dividends using their extra earnings. However, companies which adopts intensive acquisition strategies, such as Vodafone, have to focus on their customers because they expect to grow profit by acquiring new customers. Lafarge places more emphasis on long term objectives, so they just focus on fixed asset investments and earnings growth. Secondly, unlike other accounting measure such as return on equity (ROE), there is no unified benchmark to compare their relative rates of success, because each company evaluates this on their own basis. There are several measures which can be used in assess their approaches like earnings growth, dividend yield and share price, but which one to choose remains questionable. If the dividend yield is used to compare success rates, companies which deliver value by approaches other than paying dividends, like Vodafone, will be deemed to have underperformed.

References
Alphe, S. (2011) Struggling under a heavy debt load and with a large exposure to Mena, french building materials. Available at: http://seekingalpha.com/news/71246 (Accessed: 27 April 2016).
Chatha, A. (2013) Effective maintenance management helps Lafarge cement grow. Available at: http://predictiveassetmanagement.com/2013/10/effective-maintenance-management-helps-lafarge-cement-grow/ (Accessed: 27 April 2016).
Cowan, J. (2012) Vodafone reports M2M connections up 47% as group profits fall 2.4% to £11.5bn - IoT now - how to run an IoT enabled business. Available at: http://www.iot-now.com/2012/05/22/5477-vodafone-reports-m2m-connections-up-47-as-group-profits-fall-2-4-to-11-5bn/ (Accessed: 27 April 2016).
Daneshkhu, S. (2016) Diageo delivers mixed results as shake-up continues. Available at: http://www.ft.com/cms/s/0/d677e066-c5a9-11e5-808f-8231cd71622e.html#axzz46t6QtGPm (Accessed: 26 April 2016).
Ghobadian, A. (2011) Case study: Diageo. Available at: http://www.ft.com/intl/cms/s/0/6c92feaa-fc0f-11e0-b1d8-00144feab49a.html#axzz46t6QtGPm (Accessed: 26 April 2016).
Matlack, C. (2009) More trouble ahead: Europe’s new wave of toxic debt - SPIEGEL ONLINE. Available at: http://www.spiegel.de/international/business/more-trouble-ahead-europe-s-new-wave-of-toxic-debt-a-605887.html (Accessed: 27 April 2016).
Sheldon, E. (2015) Earnings. Available at: http://seekingalpha.com/article/3690166-diageo-impressive-dividend-growth-history-strong-buy (Accessed: 26 April 2016).
Stothard, M. (2015) Cost reductions lift Lafarge’s operating profit nearly a fifth. Available at: http://www.ft.com/cms/s/0/4cedf07c-ef19-11e4-a6d2-00144feab7de.html#axzz4716eqbWg (Accessed: 27 April 2016).
Thomas, D. (2014) Vodafone says door is open to new deals. Available at: http://www.ft.com/cms/s/0/29cef142-39cd-11e4-8aa2-00144feabdc0.html#axzz46t6QtGPm (Accessed: 26 April 2016).
Wild, R. (2013) A closer look at Diageo’s dividend potential. Available at: http://www.fool.com/investing/international/2013/05/10/a-closer-look-at-diageos-dividend-potential.aspx (Accessed: 26 April 2016).

0.00%
50.00%
100.00%
150.00%
CRHassetstructure
IntangibleOtherAssets/TotalAssets
Otherassets/Totalassets
Inventory/Totalassets
Fixedassets/Totalassets
0.00%
50.00%
100.00%
150.00%
2014 2013 2012 2011 2010 2009 2008 2007
Lafargeassetstructure
Otherassets/Totalasset
Inventory/Totalassets
Fixedassets/Totalassets
Intangibleassets/Totalassets
Goodwill/Totalassets
Appendix
1. Cement industry:

2. Beverage industry:
0.00%20.00%40.00%60.00%80.00%
100.00%120.00%
PRassetstructure
IntangibleOtherAssets/TotalAssets
Otherassets/Totalassets
Inventory/Totalassets
Fixedassets/Totalassets
3. Telecommunication industry:
0.00%
20.00%
40.00%
60.00%
80.00%
100.00%
120.00%
BT'sAssetstructure
IntangibleOtherAssets/TotalAssets
Otherassets/Totalassets
Inventory/Totalassets
Fixedassets/Totalassets
0.00%
20.00%
40.00%
60.00%
80.00%
100.00%
120.00%
2014 2013 2012 2011 2010 2009 2008 2007
Otherassets/Totalassets
Otherintangibleassets/Totalassets
Goodwill/Totalassets
Inventory/Totalassets
Fixedassets/Totalassets