Embed Size (px)
Citation preview
Logistics Management Institute
Consolidation of DoD Inventory Control Points Under the
Defense Logistics Agency An Analysis of the Risk
and Benefits
LG601R1
September 1997
Dennis L. Zimmerman Kelvin K. Kiebler Larry S. Klapper
[UTIC QUALITY INSPECTED 8
= . 19970925 046
REPORT DOCUMENTATION PAGE Form Approved OPM No.0704-0188
Public reporting burden for this collection of information is estimated to average 1 hour per response, including the time for reviewing instructions, searching existing data sources gathering, and maintaining the data needed, and reviewing the collection of information. Send comments regarding this burden estimate or any other aspect of this collection of information, including suggestions for reducing this burden, to Washington Headquarters Services, Directorate for Information Operations and Reports, 1215 Jefferson Davis Highway, Suite 1204, Arlington, VA 22202-4302, and to the Office of Information and Regulatory Affairs, Office of Management and Budget, Washington, DC 20503.
1. AGENCY USE ONLY (Leave Blank) 2. REPORT DATE
Sep'97
3. REPORT TYPE AND DATES COVERED
Final
4. TITLE AND SUBTITLE
Consolidation of DoD Inventory Control Points Under the Defense Logistics Agency: An Analysis of the Risks and Benefits
6. AUTHOR(S)
Dennis L. Zimmerman, Kelvin K. Kiebler, Larry S. Klapper
5. FUNDING NUMBERS
C DASW01-95-C-0019
PE0902198D
7. PERFORMING ORGANIZATION NAME(S) AND ADDRESS(ES)
Logistics Management Institute 2000 Corporate Ridge McLean, VA 22102-7805
8. PERFORMING ORGANIZATION REPORT NUMBER
LMI-LG601R1
9. SPONSORING/MONITORING AGENCY NAME(S) AND ADDRESS(ES)
John F. Phillips, DUSD(L) Room3E114 The Pentagon Washington, DC 20301
10. SPONSORING/ MONITORING AGENCY REPORT NUMBER
11. SUPPLEMENTARY NOTES
12a. DISTRIBUTION/AVAILABILITY STATEMENT
A: Approved for public release; distribution unlimited
12b. DISTRIBUTION CODE
13. ABSTRACT (Maximum 200 words)
This report documents the findings of an analysis of the potential risks and benefits of consolidating management of all DoD inventory control points under the Defense Logistics Agency. The analysis was done to support a review directed by the National Defense Authorization Act for fiscal year 1996. The analysis found a potential for substantial savings and potential risks to the current relationship between management of weapon systems and the management of secondary-item materiel and to the ability of inventory control points to tailor customer support. The findings of the analysis were included in a DoD report to Congress.
14. SUBJECT TERMS
inventory control point; materiel management; consolidation
15. NUMBER OF PAGES
110
16. PRICE CODE
17. SECURITY CLASSIFICATION OF REPORT
Unclassified
18. SECURITY CLASSIFICATION OF THIS PAGE
Unclassified
19. SECURITY CLASSIFICATION OF ABSTRACT
Unclassified
20. LIMITATION OF ABSTRACT
UL
NSN 7540-01-280-5500 Standard Form 298, (Rev. 2-89) Prescribed by ANSI Std. 239-18 299-01
Consolidation of DoD Inventory Control Points Under the
Defense Logistics Agency An Analysis of the Risk
and Benefits
LG601R1
September 1997
Dennis L. Zimmerman Kelvin K. Kiebler Larry S. Klapper
DHC QUALITY müFEVZED 8
Consolidation of DoD Inventory Control Points Under the
Defense Logistics Agency An Analysis of the Risks
and Benefits
LG601R1
September 1997
Dennis L. Zimmerman Kelvin K. Kiebler Larry S. Klapper
Prepared pursuant to Department of Defense Contract DASW01-95-C-0019. The views expressed here are those of the Logistics Management Institute at the time of issue but not necessarily those of the Department of Defense. Permission to quote or reproduce any part except for government
purposes must be obtained from the Logistics Management Institute.
LOGISTICS MANAGEMENT INSTITUTE
2000 CORPORATE RIDGE
MCLEAN, VIRGEUA 22102-7805
LOGISTICS MANAGEMENT INSTITUTE
Consolidation of DoD Inventory Control Points Under the Defense Logistics Agency: An Analysis
of the Risks and Benefits
LG601R1/SEPTEMBER 1997
Executive Summary
The National Defense Authorization Act for FY96 directed DoD to review the consolidation of management of all DoD inventory control points (ICPs) under the Defense Logistics Agency (DLA). In response, the Deputy Under Secretary of Defense (Logistics) tasked the Logistics Management Institute with analyzing the potential risks and benefits of such a mission transfer.
We found a potential for substantial savings. Over the period addressed by DoD's program objective memorandum (POM), we estimated that savings could range between $553 million and $951 million. Our savings estimate for a post-POM period that extended to FY10 ranges between $1,609 million and $2,859 million.
However, we also found a potential risk to ICP mission performance. We polled subject-matter experts within the military services on the potential negative impacts of transferring ICP functions to DLA. Their responses revealed their concerns that the transfer would disrupt the current relationship between management of weapon-systems and management of secondary-item materiel and also would increase standardization and thus reduce the ability of the ICPs to provide tailored support to their customers. Although circumstances exist that somewhat mitigate these concerns, our own assessment of the transfer concluded that the transfer could have some negative impacts.
In this report we document the analyses behind these two major findings. It shows the criteria that the military services used to judge impact, their scoring of impact for individual ICP functions, and how we consolidated their input and produced our own assessment. We also show how savings were developed for the initial in-place-transfer of military-service ICPs to DLA, for business process improvements made possible by a single ICP manager, and for physical-site consolidation that a single ICP manager would pursue at some time.
; jmc QHALTrf ms&ii anm
111
The findings of our analyses were subsequently included in a report to Congress. In that report, DoD announced its intent to systematically examine this alternative to the present ICP infrastructure, along with other alternatives, in its Quadrennial Defense Review.
IV

Contents
Chapter 1 Introduction 1-1
BACKGROUND 1-1
Current ICP Infrastructure 1-2
Congressionally Mandated Review 1-3
SCOPE 1-3
Functions That Compose an ICP 1-3
Transfer Scenario 1-4
APPROACH 1-5
FINDINGS 1-8
Potential Risk to ICP Performance 1-8
Potential for Significant Savings 1-8
Potential Reduction in Risk 1-10
Chapter 2 Assessment of Impact on Performance 2-1
GENERAL APPROACH TO ASSESSING IMPACT 2-1
RESULTS 2-3
Step 1—Criteria 2-3
Step 2—Scoring of Impact 2-5
Step 3—Consolidated Assessment of Military Services 2-6
Step A—Our Independent Assessment 2-9
Reducing the Potential for a Negative Impact 2-11
Summary of Findings 2-13
Chapter 3 Economic Impact During the Program Objective Memorandum Period 3-1
DEVELOPING AN ECONOMIC BASELINE 3-2
Data Collection 3-3
Consolidated FY96 Baseline 3-5
Extending Our Baseline Through the POM and Beyond 3-6
IN-PLACE-TRANSFER SAVINGS 3-8

PROCESS IMPROVEMENT SAVINGS 3-10
Potential Process Improvements 3-11
Savings 3-12
SUMMARY OF POM SAVINGS 3-13
Chapter 4 Economic Impact After the Program Objective Memorandum Period 4-1
IN-PLACE-TRANSFER SAVINGS CARRIED FORWARD FROM POM PERIOD 4-2
POST-POM SAVINGS FROM PROCESS IMPROVEMENTS 4-2
Additional Process Improvements 4-2
Estimating Post-POM Savings 4-4
PHYSICAL CONSOLIDATION OF ICPS 4-6
Reasons for Physical Consolidation of ICPs 4-6
Model Used to Estimate Costs and Savings Associated with Physical Consolidation 4-7
Results of the Consolidation Analysis 4-9
SUMMARY 4-10
Appendix A DoD Inventory Control Points
Appendix B Inventory Control Point Functions
Appendix C Scoring of Impact
Appendix D Process Improvements
Appendix E Glossary
VI
Contents
FIGURES
Figure 1-1. Locations of Major DoDICPs 1-2
Figure 1-2. Overall Approach to Analysis 1-6
Figure 2-1. General Approach to Developing Assessment 2-2
Figure 2-2. Negative Impact—by Criteria 2-5
Figure 2-3. Negative Impact—by Function 2-6
Figure 2-4. Graphing of the Overall Potential for a Negative Impact 2-11
Figure 3-1. The Focus of Chapter 3 3-1
Figure 3-2. FY96 Baseline FTE Breakdown 3-6
Figure 3-3. FY96 Baseline Dollar Breakdown 3-6
Figure 3-4. Logistics Headquarters POM Reductions 3-7
Figure 3-5. ICP POM Reductions 3-8
Figure 4-1. The Focus of Chapter 4 4-1
Figure 4-2. Estimating Process Improvement Savings 4-4
TABLES
Table 1-1. Functions Considered by the Military Services in Assessing Impact 1-4
Table 1-2. Summary of Analysis of Savings 1-7
Table 1-3. Potential Savings (in millions of dollars) 1-9
Table 2-1. Military Service Criteria for Judging the Risks of Transferring Management of Functions to DLA 2-4
Table 2-2. Logistics Management Institute Scoring of Function Transfer 2-10
Table 3-1. FY96 Baseline (in thousands of dollars) 3-5
Table 3-2. Baseline (millions of dollars) 3-8
Table 3-3. In-Place-Transfer Factors 3-9
Table 3-4. POM In-Place-Transfer Savings (in millions of dollars) 3-10
Table 3-5. POM Process Improvements 3-11
Table 3-6. Process Improvement Factors 3-13
Table 3-7. POM Process Improvement Savings (in millions of dollars) 3-13
Table 3-8. Estimated POM Savings (in millions of dollars) 3-14
Table 4-1. Post-POM In-Place-Transfer Savings 4-2
Table 4-2. Additional Post-POM Process Improvements 4-3
Vll
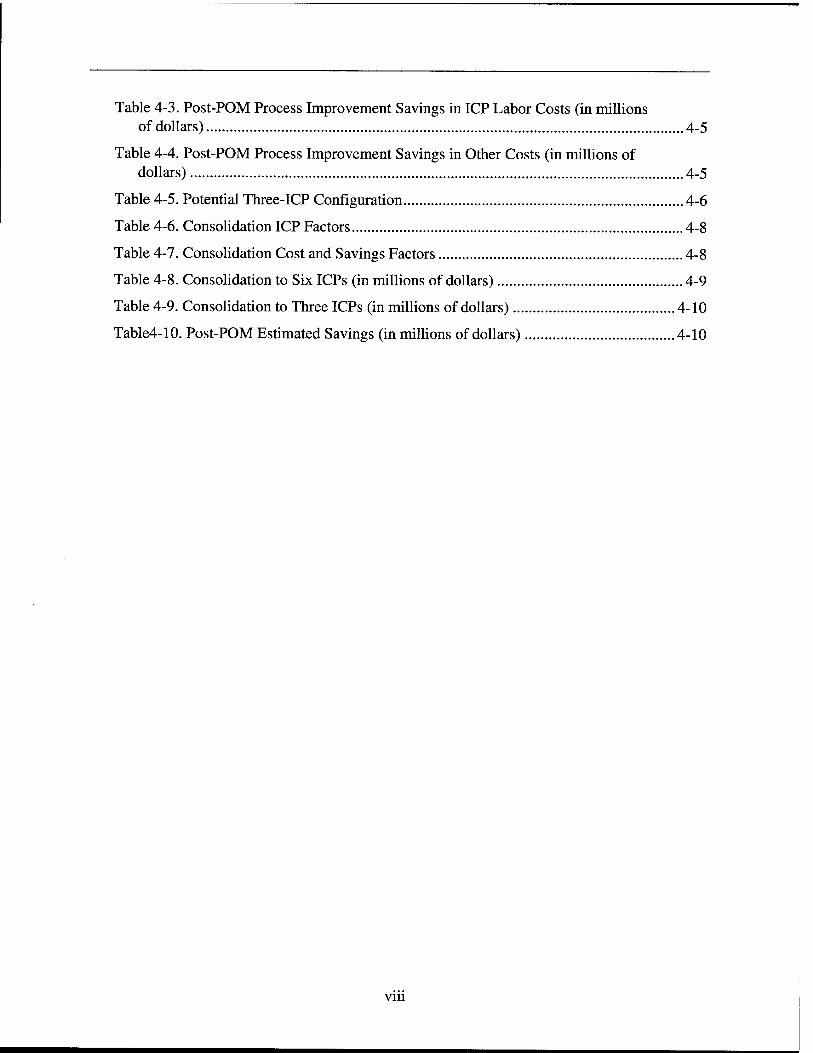
Table 4-3. Post-POM Process Improvement Savings in ICP Labor Costs (in millions of dollars) 4-5
Table 4-4. Post-POM Process Improvement Savings in Other Costs (in millions of dollars) 4-5
Table 4-5. Potential Three-ICP Configuration 4-6
Table 4-6. Consolidation ICP Factors 4-8
Table 4-7. Consolidation Cost and Savings Factors 4-8
Table 4-8. Consolidation to Six ICPs (in millions of dollars) 4-9
Table 4-9. Consolidation to Three ICPs (in millions of dollars) 4-10
Table4-10. Post-POM Estimated Savings (in millions of dollars) 4-10
vin

Chapter 1 Introduction
This report documents the results of a Logistics Management Institute analysis of the potential risks, costs, and benefits of transferring management of all DoD in- ventory control points (ICPs) to the Defense Logistics Agency (DLA). Currently, the military services manage a total of 11 ICPs at 13 locations, while DLA man- ages 5 ICPs at 5 locations. This transfer would turn over management of all of the service-managed ICPs to DLA and effectively make DLA DoD's single ICP man- ager as well as its wholesale manager for all secondary items.
The transfer of management of all DoD ICPs to DLA would represent a major un- dertaking. It would change a support structure that has served the department well for more than 30 years. More than 12,000 DoD employees would be directly af- fected; the supply support provided to all of DoD's operating forces may also be affected. Consequently, our analysis is centered on developing best estimates for the potential performance and economic impacts of the transfer.
BACKGROUND
Traditionally, an ICP is associated with wholesale materiel management, although most ICPs are also involved in some aspect of retail materiel management. Estab- lishing a precise definition of an ICP is difficult because the ICPs managed by the Army, Navy, Air Force, Marine Corps, and DLA differ in their operating philoso- phies and in their organizational structures. Past studies2 have defined an ICP as any activity performing certain materiel management functions, including provi- sioning, cataloging, requirements determination, acquisition, distribution, mainte- nance, and disposal.
DoD's ICPs play a major role in supplying our fighting forces with the equipment, assemblies, repair parts, and general supplies that they need to operate weapon-systems and conduct contingency and wartime operations. For the past 30 years, DLA has operated ICPs responsible for consumable items such as repair parts; personnel support items (i.e., clothing, food, and medical supplies); fuel; other bulk items and materiel; and expendable, minor end items. DLA supplies each of the military services, as well as other DoD and non-DoD agencies, with
lrThe military services would continue to manage, through their program managers, principal items (such as tanks, aircraft, and ships) that may or may not be collocated at secondary-item ICPs. The military services would also continue to manage their own retail supply activities.
^he 7990 ICP Consolidation Study (Defense Management Report Decision 926), the Com- mission on Roles and Missions, and ICP Benchmarking Study all defined an ICP in terms of a set of materiel management functions.
1-1
these items. Over the same period, the services have operated ICPs that manage reparable components, subsystems, and assemblies and selected consumable items as well as certain principal and major end items, including ammunition. Although military service ICPs may provide cross-service support for some common items, service ICPs generally provide support to their respective services.
Current ICP Infrastructure
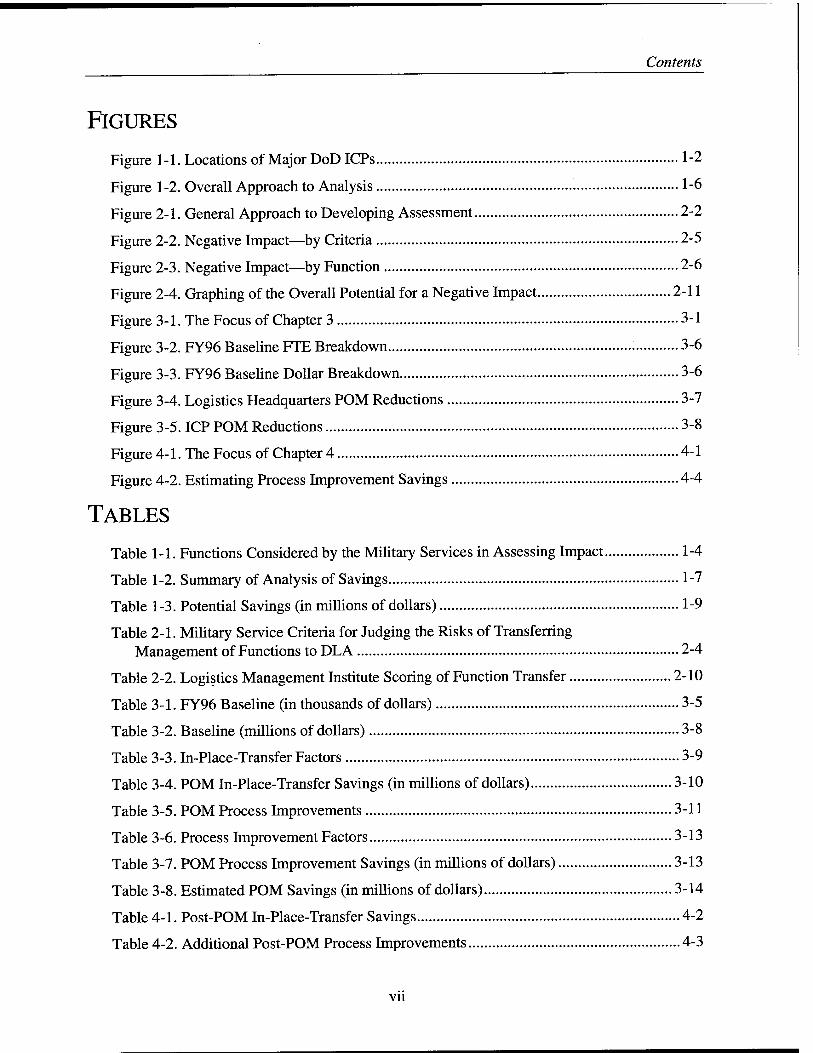
Since the end of the Cold War, the DoD logistics establishment has acted to re- duce its infrastructure in response to the downsizing of its military forces. Because DLA and each of the military services manage ICPs, they have been responsible for their own ICP downsizing initiatives. Figure 1-1 show the 18 locations of the activities traditionally labeled ICPs.
Figure 1-1. Locations of Major DoD ICPs
Note: ALC = Air Logistics Center; IOC = Industrial Operations Command; ACALA = Armament and Chemical Acquisition and Logistics Activity; ATCOM = Aviation and Troop Command; TACOM = Tank-automotive; MICOM = Missile Command; DSCC = Defense Supply Center Colum- bus; NICP = national inventory control point; SPCCA&ASO = Ships Parts Control Center and Avia- tion Supply Office; CECOM = Communications and Electronics Command; DISC = Defense Industrial Supply Center; DPSC = Defense Personnel Support Center; DFSC = Defense Fuel Sup- ply Center; DSCR = Defense Supply Center Richmond; MCLB = Marine Corps Logistics Base.
Circled activities are subject to future downsizing. Specifically, the Army is moving from four ICPs at five locations to three ICPs at four locations; the Air Force is moving from five to three Air Logistics Centers, thereby reducing its ICPs from five to three; and DLA is moving to four ICPs by consolidating its two ICPs in Philadelphia, Pennsylvania, into one ICP. (Appendix A gives a complete listing of the ICPs and their abbreviations.)
1-2

Introduction
Congressionally Mandated Review
The FY96 Defense Authorization Act directed the Secretary of Defense to "conduct a review of the management by the Defense Logistics Agency of all in- ventory control points in the Department of Defense." In April 1996, the Deputy Under Secretary of Defense (Logistics) asked for the support of the military serv- ices in carrying out the mandated review and at the same time, he also tasked the Logistics Management Institute to act as an unbiased and independent evaluator working with the services and DLA to conduct this analysis.
In directing the department to review management of ICPs under DLA, Congress also directed that, as part of the review, the Secretary of Defense "examine the management and acquisition practices of the Defense Logistics Agency for in- ventory of repairable spare parts." This requirement highlights the need to exam- ine not only the impacts of transferring the ICP mission from the services but also the ability of DLA to accept this new mission. It also confirms the Congressional intent to focus on the transfer of ICP functions associated with secondary repara- ble and consumable item support and not on the transfer of other functions that are performed at the same activities but are associated with weapon-system manage- ment.
SCOPE
This analysis looks at the Congressional proposal to consolidate management of all DoD ICPs under DLA. It does not evaluate other alternatives for configuring DoD's ICP infrastructure.
Functions That Compose an ICP
In 1990, Defense Management Review Decision (DMRD) 926, ICP Consolida- tion Study3, identified the functions that define an ICP. DMRD 926 categorized the functions as either integrated materiel manager (MM) functions or user func- tions. EVIM functions can also be categorized as Primary Inventory Control Activ- ity (PICA) functions, while user functions can be categorized as Secondary Inventory Control Activity (SICA) functions.
3 Joint Service White Paper, "Defense Management Review Decision 926: Consolidation of Inventory Control Points," 31 January 1990 (For Official Use Only)
1-3
For purposes of our analysis, we condensed the DMRD 926 functions into the 19 functions4 listed in Table 1-1 by
♦ dividing functions that were both IMM and user functions into two func- tions with separate tasks under each;
♦ combining several IMM functions into the IMM item-management func- tion and several user functions into the user inventory management func- tion; and
♦ deleting the weapon-system management function, which had tasks spe- cifically dealing with principal items, and replacing it with weapon-system secondary-item supply support, which retains those tasks that are associ- ated only with secondary items.
Table 1-1. Functions Considered by the Military Services in Assessing Impact
PICA/IMM functions SICA/User functions
Budget funding Allowance/Initial supply support list (ISSL) Cataloging development
Contracting Budgeting/Funding
Customer services Cataloging
Engineering support Configuration management
Item management Customer services
Requisition processing Engineering services
Stock control Inventory management
Technical support Provisioning
Weapon-system secondary-item sup- Technical support
ply support
Appendix B defines the functions and the tasks under each function.
Transfer Scenario
The Office of the Secretary of Defense directed the Institute to evaluate an ICP management transfer that would take place as follows:
♦ The transfer would start in FY98 to allow for a one-year period of deci- sion-making and preimplementation planning.
We initially split the DMRD 926 Weapon-System Management function into the PICA function of weapon-system secondary-item supply support and a user function of weapon-system management. Later, since the tasks under the user function are not associated with secondary-item materiel management but are tasks performed by military-service program managers for principal end items, we eliminated weapon-system management as an ICP function.
1-4
Introduction
♦ Between FY98 and FY03 (i.e., the period covered by DoD's most recent program-objective memorandum, or POM), ICP functions being per- formed at military service ICPs would continue at those locations under DLA management, using the same people, policies, systems, and proce- dures (i.e., "in-place-transfer"). DLA may elect to consolidate support functions regionally or at a single site and thereby reduce personnel re- quirements.
♦ Starting in FY04, DLA may start to reduce the number of ICPs and stan- dardize systems and procedures.
♦ Throughout the planning horizon (i.e., FY98 to FY10), DLA may intro- duce process improvements that reduce inventory costs (i.e., requirements levels and unit prices), automated system costs, and storage costs as well as ICP labor and nonlabor costs.
This scenario presents a controlled process for changes that would give DLA time to assimilate current military service management and acquisition practices and develop universal process improvements.5 However, if consolidation were to oc- cur, actual implementation may well differ from this scenario, and any site con- solidation would have to go through the base closure and realignment process.
APPROACH
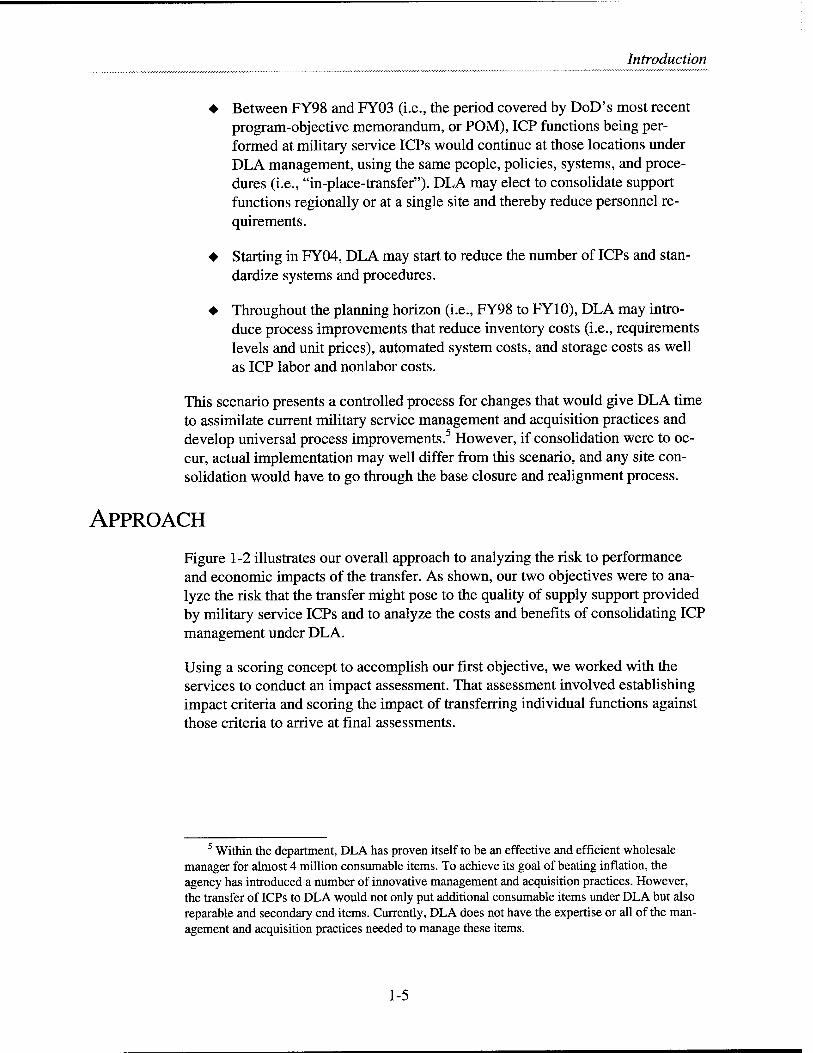
Figure 1-2 illustrates our overall approach to analyzing the risk to performance and economic impacts of the transfer. As shown, our two objectives were to ana- lyze the risk that the transfer might pose to the quality of supply support provided by military service ICPs and to analyze the costs and benefits of consolidating ICP management under DLA.
Using a scoring concept to accomplish our first objective, we worked with the services to conduct an impact assessment. That assessment involved establishing impact criteria and scoring the impact of transferring individual functions against those criteria to arrive at final assessments.
5 Within the department, DLA has proven itself to be an effective and efficient wholesale manager for almost 4 million consumable items. To achieve its goal of beating inflation, the agency has introduced a number of innovative management and acquisition practices. However, the transfer of ICPs to DLA would not only put additional consumable items under DLA but also reparable and secondary end items. Currently, DLA does not have the expertise or all of the man- agement and acquisition practices needed to manage these items.
1-5
Figure 1-2. Overall Approach to Analysis
Analyzing risk to quality of
support
Service issues and concerns
Analysis of functions—scoring concept IMM and user functions
Criteria (A-K) Scoring (+, 0, -) Supporting narratives
iv Lv Final assessment
Analyzing costs and benefits (in 3 areas)
Post POM
People savings/ «JUG \ Relocation costs consolidation .■% --•- .
BOS savings ^ -" Facility costs
'fi Inventory savings - lower unit prices - levels
ir Savings in other areas of materiel management - data systems - distribution - maintenance
To accomplish our second objective, we looked at how a single ICP manager might reduce or increase costs in three areas:
♦ Labor costs during the in-place-transfer period
♦ Labor and relocation costs during site consolidation
♦ Labor and nonlabor costs due to business process improvements.
Three sources of data were available for use in our cost analysis. The first source was ICP cost data through the POM period, which was provided by the military services and DLA. The second was logistics headquarters data pertinent to ICPs, which was provided by the military services. The third was background data that military service and DLA project leaders provided us on their initiatives involved in ICP downsizing and business process improvements.
To estimate cost savings, we could use either a bottom-up or topdown approach. The bottom-up approach identifies and costs out individual initiatives that would result from the transfer and then sums the associated savings to arrive at percent- ages for reducing labor and nonlabor costs. The topdown approach adopts reason- able low- and high-end percentages for savings from similar cases or expected future trends and then supports those percentages by citing individual initiatives that would result from the transfer.
1-6
Introduction
We favored the topdown approach because we could develop reasonable and timely estimates in spite of
♦ the uncertainty involved in predicting what changes would happen if the transfer were to occur and
♦ the limitations on the amount of available data and on the time required to develop detailed analyses of potential changes and their associated sav- ings.
Since we had a complete set of data for ICP and supporting headquarters costs, we were able to apply percentages to estimate savings in these costs. However, some of process improvement savings involved costs for which we did not have a com- prehensive database (e.g., distribution costs). We had to apply a bottom-up ap- proach to estimate those savings.
Since some of the potential improvements we identified in our analysis are exten- sions of ongoing initiatives of the military services, we wanted to avoid any po- tential double counting of savings in our analyses. Since savings data on ongoing initiatives was part of our database of ICP and supporting headquarters costs, we did not have to be concerned with double counting in our topdown analyses. However, similar data were not available to us in other cost areas and we had to compensate for potential double counting in our bottom-up analyses. As a way of not overinflating expected savings from those analyses, we selected only a few potential improvements to price out. We then used the estimates for those few as our estimates for all improvements less savings from existing initiatives.
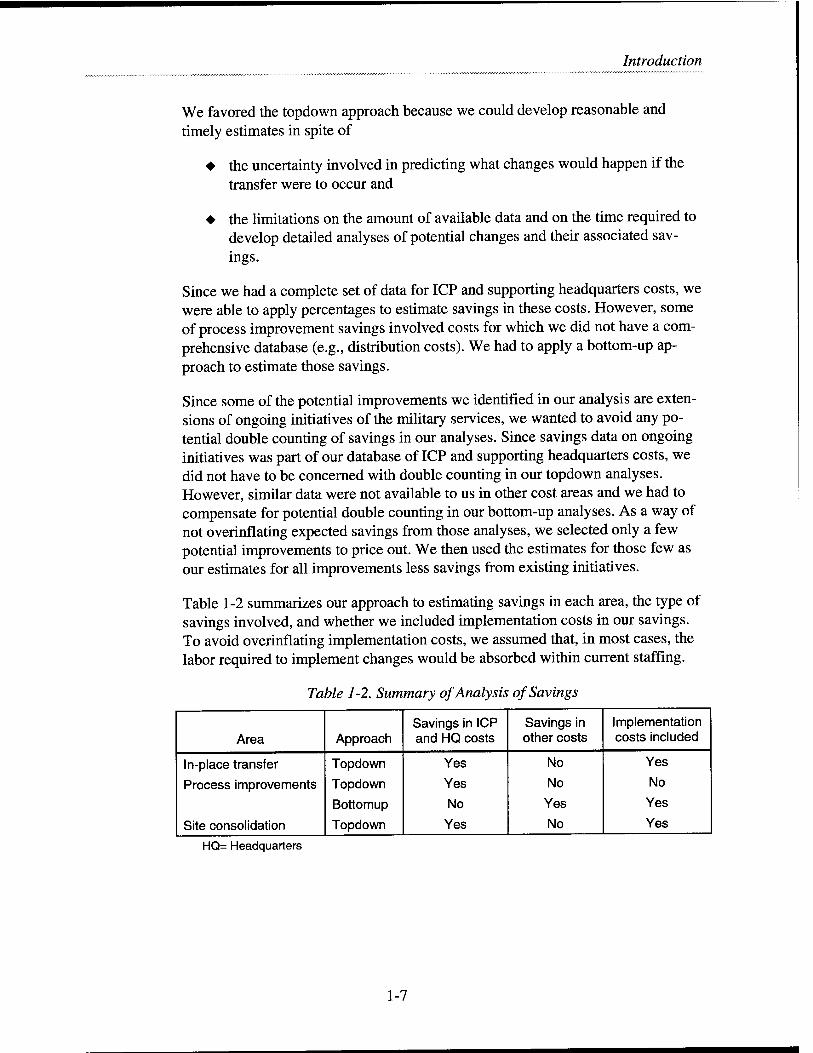
Table 1-2 summarizes our approach to estimating savings in each area, the type of savings involved, and whether we included implementation costs in our savings. To avoid overinflating implementation costs, we assumed that, in most cases, the labor required to implement changes would be absorbed within current staffing.
Table 1-2. Summary of Analysis of Savings
Area Approach Savings in ICP and HQ costs
Savings in other costs
Implementation costs included
ln-place transfer Topdown Yes No Yes
Process improvements Topdown Yes No No
Bottomup No Yes Yes
Site consolidation Topdown Yes No Yes
HQ= Headquarters
1-7
FINDINGS
We concluded that
♦ transfer of all ICP functions is feasible, although some potential risk exists that the current relationship between weapon-system management and materiel management might be disrupted and support decreased;
♦ going to a single DoD ICP manager offers the potential for significant POM and post-POM savings; and
♦ retention by the military services of some functions being performed at ICPs might reduce the risk.
Potential Risk to ICP Performance
To assess the potential risk to ICP performance, we polled subject-matter experts in the military services on what they would foresee as the negative impacts of transferring management of ICP functions to DLA. We consolidated their scoring of potential impacts and their supporting rationale and reduced them to two major concerns:
♦ The transfer would disrupt the current relationship between weapon-system management and secondary-item materiel management and thereby decrease materiel support to readiness.
♦ The transfer would increase standardization and reduce the ability of the ICPs to provide tailored support to their customers.
We reviewed the concerns of the military service experts and developed our own independent assessment of potential impacts. Although our scoring of potential impacts is generally more positive than that of the military services, we also fore- saw some potential negative impacts. Our scoring was closer to the scoring of some of the military services than those services were to the scoring of the other services. Chapter 2 describes our risk analysis in detail.
Potential for Significant Savings
In each area of potential savings, we developed two sets of estimates for savings that might accrue by having a single manager for ICPs. One set of estimates deals with savings during the POM period that extends to FY03, while the other set deals with savings during a post-POM planning period that extends to FY10.
1-8
Introduction
In Chapter 3 we discuss our POM analysis. In that analysis, our topdown approach for estimating the potential range of savings from in-place-transfer considered the following conservative low-end and optimistic high-end reductions:
♦ Pertinent headquarters labor costs—10 percent and 20 percent
♦ ICP direct labor costs—0 percent and 2 percent
♦ ICP indirect labor costs—2 percent and 4 percent
♦ ICP general and administrative labor costs—2 percent and 4 percent
♦ ICP nonlabor costs—1 percent and 2 percent.
To estimate ICP cost savings due to process improvements, we reduced ICP di- rect, indirect, and general and administrative labor costs an additional 2 to 6 percent. In our bottom-up approach for estimating other cost savings due to process improvements, we focused on two process improvements in contracting and inactive-item reduction.
In Chapter 4 we describe our post-POM analysis. To estimate post-POM ICP cost savings due to in-place-transfer initiatives, we used the same percentages that we used to make our POM estimates. We also used the same process improvement percentages. However, to estimate process improvement savings in other costs, we added two process improvements dealing with the integration of initial and re- plenishment requirements and a reduction of ICP materiel management policies and procedures. To provide a range for site-consolidation savings, in our topdown approach we considered two generic scenarios—one consolidating the 13 planned sites to 6 and one consolidating the 13 sites to 3.
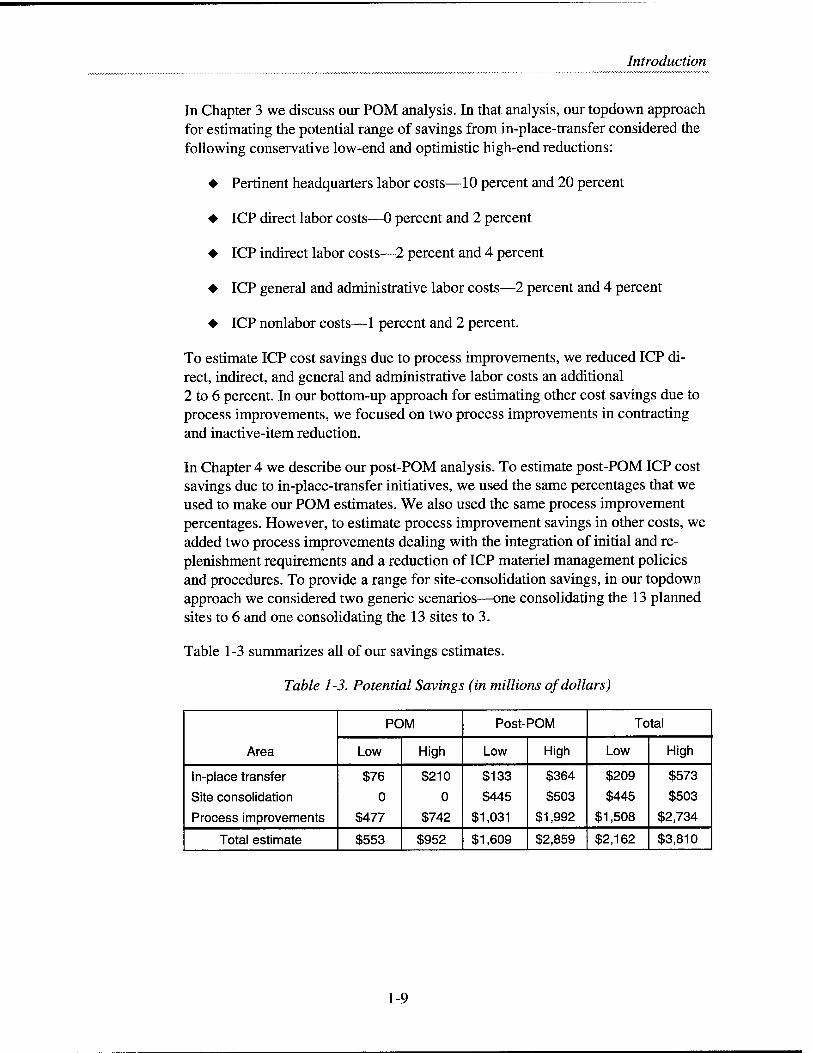
Table 1-3 summarizes all of our savings estimates.
Table 1-3. Potential Savings (in millions of dollars)
Area
POM Post-POM Total
Low High Low High Low High
ln-place transfer
Site consolidation
Process improvements
$76
0
$477
$210
0
$742
$133
$445
$1,031
$364
$503
$1,992
$209
$445
$1,508
$573
$503
$2,734
Total estimate $553 $952 $1,609 $2,859 $2,162 $3,810
1-9
Potential Reduction in Risk
In Chapter 2, we suggest one way to reduce the potential negative impact of the transfer while not significantly reducing savings. This solution involves the reten- tion of certain user functions by the military services. Those functions are con- figuration management, engineering services, technical support, provisioning, and allowance/ISSL development.
In Chapter 2, we also discuss our rationale for the military services retaining se- lective tasks within these functions. In Chapter 3, we show how retention of these functions would only reduce estimated POM savings by 5.3 to 8.7 percent.
1-10
Chapter 2 Assessment of Impact on Performance
The transfer of management of all DoD ICPs to DLA and the subsequent stan- dardization of business practices would represent a significant change in the way the military services execute their materiel support mission and therefore requires careful analysis.
Within its current organization, DLA does not have the people, expertise, infor- mation systems, or acquisition and management practices to assume the mission of the military service ICPs. However, the transfer scenario defined by Office of the Secretary of Defense (OSD) provides for the same people, policies, systems, and procedures that are currently performing the mission to be transferred in place to DLA. Under these circumstances, consolidation of all ICPs under DLA is feasi- ble.
However, the decision to consolidate should not be based on whether or not DLA could do the mission. It should be based on whether or not DLA should do the mission. If DLA management of all ICPs would impair ICP mission performance by adversely affecting the people, policies, systems, and procedures performing that mission, then the transfer should not occur. However, if the perceived risk to mission performance is manageable and the potential savings are significant, then the case for transfer is strong.
Therefore, the first part of our study assesses where the transfer might have po- tential impacts that would have a negative effect on ICP performance and pose a risk to military supply support. We also sought to identify where the transfer would have little or no impact or where it would have a positive effect on supply support. In this chapter, we discuss our general approach for accomplishing the overall assessment. We then present the results of the assessments prepared by the military services and the results of our own independent assessment.
GENERAL APPROACH TO ASSESSING IMPACT
Conducting an assessment of potential impacts is difficult in this case because
♦ ICPs perform a broad spectrum of functions that entail a large number of interactions with other logistics and nonlogistics activities;
♦ metrics, such as supply availability and requisition response time, can be used to track overall ICP supply support, but few metrics exist that directly relate performance in ICP functional areas to ICP supply support; and
2-1
♦ no analytical model, comparison of similar cases,1 or other methodology exists that would permit a complete and objective evaluation of the per- formance impact of consolidating management of all of these functions under DLA.
Under these circumstances, the only impact assessment that can be made is a subjective evaluation based on input from subject-matter experts involved in ICP operations.
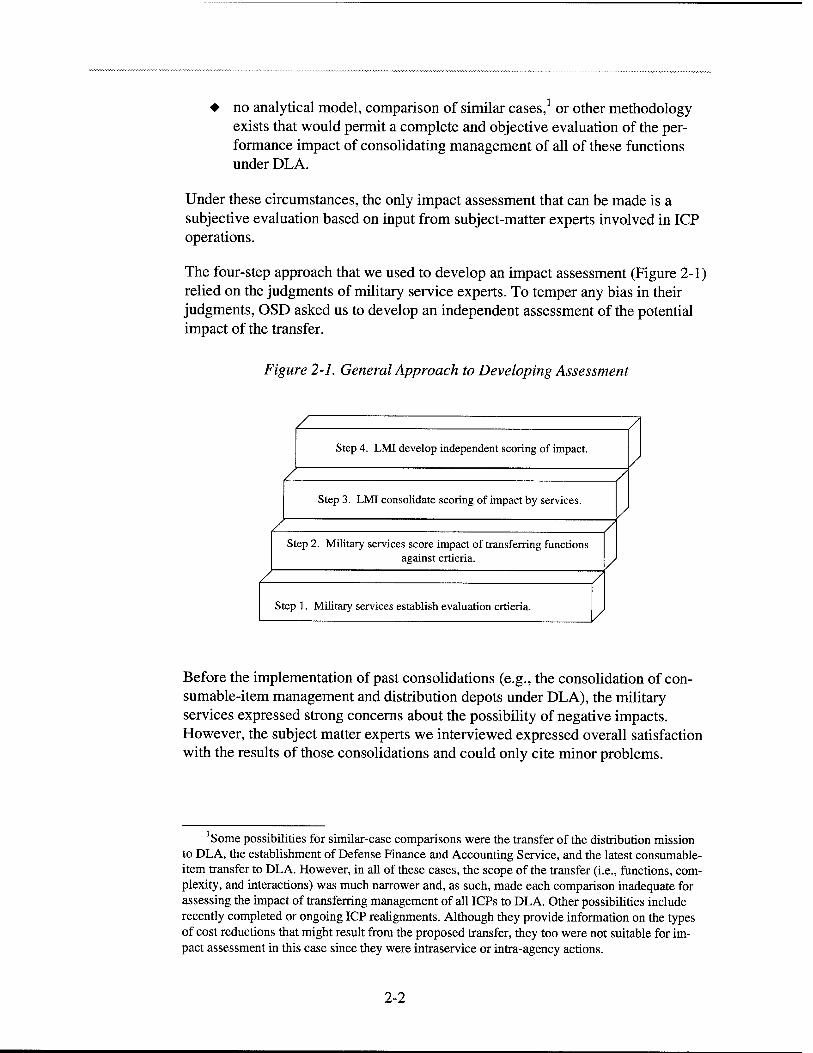
The four-step approach that we used to develop an impact assessment (Figure 2-1) relied on the judgments of military service experts. To temper any bias in then- judgments, OSD asked us to develop an independent assessment of the potential impact of the transfer.
Figure 2-1. General Approach to Developing Assessment
Step 4. LMI develop independent scoring of impact.
Step 3. LMI consolidate scoring of impact by services.
Step 2. Military services score impact of transferring functions against crtieria.
Step 1. Military services establish evaluation crtieria.
Before the implementation of past consolidations (e.g., the consolidation of con- sumable-item management and distribution depots under DLA), the military services expressed strong concerns about the possibility of negative impacts. However, the subject matter experts we interviewed expressed overall satisfaction with the results of those consolidations and could only cite minor problems.
Some possibilities for similar-case comparisons were the transfer of the distribution mission to DLA, the establishment of Defense Finance and Accounting Service, and the latest consumable- item transfer to DLA. However, in all of these cases, the scope of the transfer (i.e., functions, com- plexity, and interactions) was much narrower and, as such, made each comparison inadequate for assessing the impact of transferring management of all ICPs to DLA. Other possibilities include recently completed or ongoing ICP realignments. Although they provide information on the types of cost reductions that might result from the proposed transfer, they too were not suitable for im- pact assessment in this case since they were intraservice or intra-agency actions.
2-2
Assessment of Impact on Performance
To avoid overemphasizing or unduly minimizing any potential risk that the ICP transfer might pose, we adopted the following guidelines:
♦ Any and all evaluation criteria posed by military service experts would be included in the analysis, but the contribution of each criterion to the over- all assessment would differ based on the criterion's relative importance.
♦ Any and all negative (or positive) impacts asserted by military service ex- perts would require supporting rationale.
♦ Our independent assessment would consider the inputs of the military services but also reflect any mitigating factors that might exist.
RESULTS
Step 1—Criteria
We started the assessment process by working with the military services to iden- tify the criteria that they would use to judge the risks of transferring management of functions to DLA.2 Our objective was to establish criteria that could be used to determine if a function should or should not be transferred to DLA.
Although most of the criteria are the same across the military services, some crite- ria were only applied by one service or were applied by all services except one. Table 2-1 lists the criteria and which military services used each criteria. The weights in Table 2-1 give the relative importance of a negative impact in one cri- terion compared with a negative impact in another (e.g., a negative impact to weapon-system readiness, with a weight of 9, is three times more important than a negative impact to data processing systems, with a weight of 3).
Although we considered all of the military service criteria and scoring of the crite- ria to be important, we did want to differentiate between the many concerns ex- pressed by the experts. Our goal in using weights was to surface and focus on "show stoppers"—those impacts that would negate any potential savings from the transfer and rule out the transfer as a viable alternative for further consideration.
2The Institute worked with the Navy to establish an initial list of six criteria. All of the mili- tary services adopted those original six criteria and, except for the Marine Corps, added other cri- teria.
3We developed the weights in Table 2-1. Originally, we planned to have the military services rank the criteria. Except for the Marine Corps, who did rank the criteria, the services used the time allocated for this part of the analysis to focus on the scoring itself.
2-3

Table 2-1. Military Service Criteria for Judging the Risks of Transferring Management of Functions to DLA
Criterion Definition Service applying
the criterion Weight
Customer support
Weapon- system readiness
Resource allocation
Sustain- ability
Weapon- system life cycle
Interfaces
Synergism
Transparent to warfighter
Ability to implement
Data- processing systems
Qualified personnel
ICP ability to economically provide prod- ucts and services that are responsive and tailored to each customer's unique and changing needs.
Weapon-system operational availability attributable to secondary-item supply support.
The ability to reallocate resources (personnel and funds) to competing and changing requirements in order to achieve optimum performance.
The ability to build up and provide the secondary-item supply support needed to maintain weapon-system readiness lev- els on station over an extended period of time.
Total costs associated with the acquisi- tion, fielding, support, and retirement of weapon-systems.
The internal (within ICP materiel man- agement) and external (with program managers, systems commands, and customers) functional interfaces.
The productivity multipliers that come from teaming (e.g., weapon-system teaming at the Army's integrated materiel management centers).
Major command policies, procedures, and data systems for sustainment logis- tics.
Complexity of the planning process to carry out a transfer in place to DLA.
Degree of integration of the data- processing system supporting a function, i.e., whether it is a stand-alone system or part of an integrated system networked to other functions and a central data- base.
Personnel of the appropriate grade level, training, and experience.
All
All
All
All
All
All
Army only
Air Force only
Air Force only
All except Marine Corps
Air Force only
3
3
2-4
Assessment of Impact on Performance
Step 2—Scoring of Impact
Our next step was to poll subject matter experts in the military services on the potential impact of the transfer. Using either a minus sign, plus sign, or zero, they scored the impact of transferring management of each ICP function against each criterion. A minus sign indicated that the transfer of management for that function would result in a negative impact for that criteria, a plus sign indicated a positive impact, and a zero meant little or no impact. The services provided supporting ra- tionale for every minus sign. Appendix C presents the scoring of each military service.
We consolidated the scores of the military services and looked at the distribution of negative impacts across the evaluation criteria. Figure 2-2 shows how the evaluation criteria are ranked according to their percent of negative impacts scored by the military services, from highest to lowest, with a break between crite- ria used by all military services and those used by only one or two services.
Figure 2-2. Negative Impact—by Criteria
Evaluation criterion
Interfaces
Resource allocation
Customer support
Weapon-system readiness
Sustainability
Weapon-system life cycle
Synergism
Ability to implement
Transparent to warfighter
ADP systems
Qualified personnel
40 60 Percent negative
100
Figure 2-3 ranks the ICP functions by their percent of negative impacts scored by the military services, from highest to lowest.
2-5
Figure 2-3. Negative Impact—by Function
Functions
I MM budget/funding I MM engr support User engr support
I MM item mangement User budget/funding
I MM tech support User allowance/ISSL
IMM contracting I MM customer svcs IMM WS Supply Sup
IMM stock control User inventory mgt
User customer svcs IMM rqn processing
IMM cataloging User configuratn Mgt
User provisioning User tech support
User cataloging
0 20 40 60 Percent negative
80 100
Step 3—Consolidated Assessment of Military Services
We were able to take the scoring and supporting rationale of the military service experts and reduce them into the following two major concerns:
♦ Potential impact on weapon-system readiness. Transfer would disrupt the current relationship between weapon-system management and secondary- item materiel management and thereby decrease materiel support to readi- ness.
♦ Potential impact on customer support. Transfer would increase standardi- zation and reduce the ability of the ICPs to provide tailored support to their customers.
The other concerns that the military service experts expressed involved integrated automated systems, qualified personnel, and the ability to implement. After we discussed the transfer scenario with the experts, they generally agreed that the transfer scenario somewhat mitigated these concerns.
2-6
Assessment of Impact on Performance
POTENTIAL DISRUPTION OF THE RELATIONSHIP BETWEEN WEAPON-SYSTEM AND
MATERIEL MANAGEMENT
Many of the negative impacts cited by the military service experts revolve around their concern that the transfer would disrupt the current close relationship between materiel management of secondary and principal end items. Today, military serv- ice weapon-system program managers have authority over management functions related to principal end items (i.e., weapon-system acquisition, engineering, con- figuration management, funding, distribution, and maintenance planning), while military service ICPs perform similar functions for the secondary reparable items that are key components of those end items. In many instances the program man- agers are collocated with the ICPs.
The military services have moved to strengthen the key interfaces between princi- pal- and secondary-item functions to avoid waste when fielding new weapon-systems and modifications to existing weapons systems. Through modifi- cations of reparable components, the military services insert new technologies into weapons systems and thereby reduce their operating and support costs and extend their service lives. This process relies on the integration of component mainte- nance data collection, failure analysis, and sustaining engineering into equipment and system redesign and modification. The general concern of the military serv- ices was that organizationally separating these functions and their funding could disrupt this integration and thereby cause costs to go up and weapon-system per- formance to go down and hinder future modernization programs.
Specific concerns voiced by the military service experts were as follows:
♦ The transfer would adversely affect interfaces between secondary-item management and weapon-system management by increasing the organiza- tional separation
>- between weapon-system program managers and materiel managers, causing delays in the evaluation and resolution of support issues;
> between principal end-item procurements and secondary-item pro- curements, resulting in less joint procurements; and
> between weapon-system program managers and ICP personnel in- volved in weapon-system configuration (i.e., engineers, technicians, and equipment specialists), resulting in less configuration control.
♦ DLA may allocate funds for new procurements differently than the current intraservice allocation.
2-7

♦ Although no quantifiable evidence exists that weapon-system readiness would decline as a result of the transfer, the combined effects on interfaces and resource allocation could potentially affect readiness.
♦ If military service operational commanders and ICP managers are under different command and control, ICPs might be less responsive to critical support requirements during contingency operations.
♦ The synergism within weapon-system teams could be affected if team members are under different management.
POTENTIAL REDUCTION IN THE ABILITY TO TAILOR CUSTOMER SUPPORT
Another major concern expressed by the military service experts was that the transfer would lead to increased standardization and reduce their ability to tailor their support to specific customers. The military service ICPs feel closely aligned to their customers. They cited numerous interfaces and some special procedures they perform to provide levels of support required by particular customers.
Specific concerns voiced by the military service experts were as follows:
♦ DLA will uncouple stock-fund budgeting and allocation from specific military service projects, including modernization, and thereby hamper the success of such projects.
♦ If the ICPs were transferred to DLA, the military services may withdraw from those ICPs the administration of funds other than stock funds (e.g., appropriated funds).
♦ Determination of war-reserves materiel requirements should not be trans- ferred to DLA because it is tailored to military service wartime mission accomplishment and not peacetime support.
♦ DLA's management priorities would be based more on sales and less on readiness and sustainability.
♦ The military services would have to establish new activities to monitor ICP performance in support of their respective missions and weapon-system program managers.
♦ After FY03, when the in-place transfer period ends, DLA will want to standardize its systems and procedures; this standardization will disrupt the roles that military service ICPs play as part of a supply chain that each service has established to provide materiel support to its units within its operating environments.
2-8
Assessment of Impact on Performance
Step A—Our Independent Assessment
We reviewed the input from the military services and developed our own assess- ment of the impact of the transfer. We based our assessment not only on an evaluation of the military service input but also on discussions and interviews we conducted as part of this analysis and on our past research experience in DoD supply support.
ITEMS MITIGATING SERVICE CONCERNS
In reviewing the assessments of the military services, we felt that the following items mitigated some of their concerns:
♦ The transfer of personnel at military service logistics headquarters and ICPs to DLA would provide the agency with the expertise it needs in each ICP functional area to perform the mission and to maintain many of the current interfaces regardless of the new management organizational struc- ture.
♦ The Navy has demonstrated that weapon-system teaming can be success- fully accomplished through matrix support; under the transfer, teaming could be retained, with DLA personnel providing matrix support.
♦ Work done by personnel directly involved in principal-item support could be performed on a reimbursable basis if it is for secondary-item support and vice versa.
♦ While DLA could be made responsible for determining levels and apply- ing computational algorithms, the military services can continue to control the management objectives of these processes for determining require- ments by retaining responsibility for setting materiel support goals, either by weapon system or by groups of items.
♦ Although each military service emphasizes weapon-system support in its ICP operations, factors such as commonality, commodity specialization (e.g., engines), and functional specialization (e.g., provisioning) have pre- cluded any military service ICP from achieving total management of sec- ondary items by weapon-system.
OUR SCORING OF IMPACT
To score the impact of transferring management of a function to DLA, we used a scale from -1 (negative impact) to 1 (positive impact). Table 2-2 shows the results of our scoring.
2-9
Table 2-2. Logistics Management Institute Scoring of Function Transfer
Function Score
IMM cataloging 1.000 IMM contracting 1.000 IMM budgeting/funding 0.667 IMM engineering support 0.667 IMM item management 0.667 IMM requisition processing 0.667 IMM stock control 0.667 IMM technical support 0.667
IMM weapon-system secondary-item supply support 0.667 User cataloging 0.667 User inventory management 0.667 User budgeting/funding 0.333 User customer services 0.333 IMM customer services 0.333 User provisioning 0.000 User technical support 0.000 User configuration management -0.333 User engineering services -0.333 User allowance/ISSL development -0.667
Although our scoring is more positive than that of the military services, we also foresaw some potential negative impacts. Figure 2-4 graphs our negative scoring as well as the negative scoring of each of the military services. It shows that, in total, some of the military services are closer to us in their scoring than they are to other services.
We foresee many positive impacts from the transfer, but we also foresee some problem areas. One of these problem areas is the oversight responsibilities of the program managers for the design, development, acquisition, deployment, and sustainment of their assigned weapon-systems. To fulfill these responsibilities, the program managers must have final approval authority over design and engineering changes and funds for the acquisition of those changes. The transfer of ICP func- tions related to these changes (e.g., engineering services) could dilute that author- ity and cause cost increases and delays in making changes. As a result, the transfer could diminish the ability of the military services to modernize their weapon- systems through the introduction of new technologies.
2-10
Assessment of Impact on Performance
Figure 2-4. Graphing of the Overall Potential for a Negative Impact
Army
Navy
Air Force Materiel Command (AFMC)
Air Force Oklahoma City Air Logistics Center (OC-ALC)3
Marine Corps
Independent
0% 20% 40% 60% 80% 100%
□ Little or no negative impact or positive impact
H Negative impact
Only the Air Force provided both ICP and headquarters responses.
We are also concerned that the establishment of a single wholesale manager who is organizationally separated from the management of retail supply activities could impede DoD's ability to coordinate the management of all echelons of supply supporting our military units. Materiel managers within the private sector and within the department are relying more and more on supply-chain management to minimize inventories while maintaining support to customers. Consolidation of all ICPs under DLA could hinder efforts to link the performance of all echelons of supply to goals for weapon-system readiness.
Reducing the Potential for a Negative Impact
One way of reducing the potential of a negative impact would be for the military services to retain selective ICP functions. We focused on the five user functions where we did not see a positive impact from the transfer—configuration manage- ment, engineering services, technical support, provisioning, and allowance/ISSL development.
The rationale for retaining the first three functions is based on our understanding that the objectives associated with the tasks under these functions are oriented to- ward weapon-system performance, with cost given limited consideration. Since management of weapon-systems is not being transferred to DLA, these user tasks
2-11
should remain with the military services. As for the corresponding IMM tasks, cost is a major consideration and the tasks themselves are closely related to the functions of item management, contracting, and cataloging. If those functions are transferred to DLA, then the IMM engineering, technical, and configuration tasks should also be transferred.
The rationale for retaining provisioning under military service management is based on provisioning's relationship with principal-item supply management. Weapon-system program managers are responsible for the provisioning of new and modified systems. They contract for both principal- and secondary-item data that are needed to do provisioning. They assign other key data elements (e.g., source, maintenance, and recoverability factors) used for secondary-item provi- sioning on the basis of the maintenance philosophy of the military service and the system itself.
However, one disadvantage of not transferring provisioning to DLA is that it would organizationally separate the computations of initial and replenishment re- quirements. If these two computations could be synchronized, the time between the acquisition of materiel and its actual application could be reduced, thereby saving inventory holding costs. Some potential also exists to reduce the amount of materiel that is bought up front but never used because of changes in configura- tions. Given these advantages, if the transfer were to occur, tasks under provi- sioning should be closely examined to determine
♦ which tasks should be transferred and which should not; or
♦ if all of the tasks and people performing those tasks were transferred to DLA, how program managers could work with DLA to carry out their pro- visioning responsibilities.
The rationale for retaining allowance/ISSL development under military service management is based on its relationship with retail supply management. If the transfer were to occur, the military services would still be responsible for retail supply management, and the computation of levels is key to carrying out that re- sponsibility. However, here again, there is a disadvantage to not transferring the function, namely, coordinated computation of wholesale and retail supply levels. Research and experience have demonstrated that multiechelon or multilink com- putations generate smaller inventory levels than single-echelon wholesale and re- tail computations for the same performance targets. If the transfer were to occur, the tasks under this function would also have to be examined in greater detail to determine who and how they could best be accomplished.
2-12
Assessment of Impact on Performance
Summary of Findings
In summary, our analysis of the potential impact of the transfer found that
♦ military service experts believe that the risk of a negative impact on per- formance does exist, particularly in the relationship between weapon-system and materiel management and in an ICP's ability to tailor its support to customers;
♦ the size of that risk is perceived differently by each of the military serv- ices;
♦ although items exist that do mitigate the concerns of the military services, the transfer is not without risk; and
♦ the military services that scored a minority of the potential impacts as be- ing negative are correct, and retention of some ICP functions by the mili- tary services could reduce the risk.
2-13
Chapter 3 Economic Impact During the Program Objective Memorandum Period
While the first part of our study was designed to assess the potential performance impact of the transfer, the second part was designed to determine the potential savings that the transfer might produce. This chapter deals with potential savings during the POM period. In Chapter 4 we discuss potential savings during the post- POM period.
As shown in Figure 3-1, the two types of savings that could occur during the POM period are the following:
♦ Savings from single agency decisions that affect which functions or tasks are performed at specific sites. Examples of this type of savings are re- gional consolidation of some direct and indirect tasks (e.g., contracting, budgeting) and regional consolidation of certain general and administra- tive (G&A) functions (e.g., personnel, comptroller, legal, data processing). We refer to this type of savings as "in-place transfer savings."
♦ Savings from process improvements introduced by the single agency. Ex- amples of this type of savings are development and use of DoD-wide cor- porate contracts, increased item reduction and inactive-item deletion, and improved stock positioning. We refer to this type of savings as "process improvements savings."
Figure 3-1. The Focus of Chapter 3
POM savings People savings - headquarters - ICP direct FY97—FY03 - ICP indirect
Inventory savings - lower unit prices - levels
Savings in other areas of materiel management - data systems - distribution - maintenance
3-1
Given the many uncertainties involved in the transfer, we could only estimate the magnitude of these savings. To better portray those uncertainties, we chose to es- timate a potential range of savings rather than a single value. The low end of our range is based on what we believe is a conservative estimate of what the transfer might save, while the high end is an optimist estimate.
Our estimates are based on the following timetable:
♦ The earliest that a transfer could occur would be the beginning of FY99.1
♦ Once the transfer occurred, DLA would require one year to implement savings initiatives.
♦ The first year of savings would therefore be FYOO.
Although Congress called for a review of the transfer of all functions, the impact assessment presented in Chapter 2 suggests the possibility of a less risky alterna- tive—the transfer of all functions except for 5 user functions (i.e., technical sup- port, provisioning, allowance/ISSL development, configuration management, and engineering support). This chapter gives the savings if all 19 ICP functions were transferred or if only 14 functions were transferred.
DEVELOPING AN ECONOMIC BASELINE
Before we address savings from in-place transfer and process improvements, we need to describe the economic baseline against which we computed the POM savings in this chapter and the post-POM savings in Chapter 4. To establish an economic baseline, we decided to update the 1994 cost database developed by the Commission on Roles and Missions (CORM).2 Since the military services are fa- miliar with the CORM database, using it had the advantages of speed and credit- ability.
The database contains both staffing- and dollar-cost data for ICPs and logistics headquarters managing those ICPs. Staffing cost is given in full-time equivalents (Fibs). While a single set of FTE and dollar statistics is collected for each logis- tics headquarters, ICP data are collected by the following four categories:
♦ Direct labor by function: The FTE and dollar cost of civilian and military personnel actually performing individual ICP functions.3
'l October 1998.
^The CORM data call format was nearly identical to the format used in 1989 during the DMRD 926 ICP Consolidation Study.
3We started with our original list of functions and added Foreign Military Sales (FMS) as an additional ICP function. However, only the Navy was able to break out ICP costs for FMS.
3-2
Economic Impact During the Program Objective Memorandum Period
♦ Indirect labor: The FTE and dollar cost of other civilian and military per- sonnel within the ICP who are not directly performing ICP functions but are supporting the personnel who are performing these functions. Exam- ples include supervisors, clerical, administrative support, management support, and system support.
♦ G&A: FTE and dollar administrative and base-support labor and nonlabor costs charged to the ICP activity. Examples are command, personnel, comptroller, data-processing operations, utilities, and maintenance of fa- cilities.
♦ Nonlabor costs: The dollar costs of supplies, equipment, training, travel, and contract support actually charged to the ICP.
Data Collection
We asked the military services to update the CORM database to reflect changes that have occurred between FY94 and FY96. Since DLA was excluded from the original CORM database, we also asked DLA to provide data for their ICPs. Fi- nally, to address future years in our analysis, we asked the military services and DLA to provide FTE and dollar projections through FY03 based on their POM submissions.
Once we collected the data submissions of the military services, we reviewed them for content and consistency. On the basis of our review, we adjusted the data as follows:
♦ We reduce headquarters data to only reflect secondary items.
♦ We increase ICP data to correspond to the management of secondary end items.
♦ We reconstruct ICP nonlabor costs on the basis of budget submissions.
We discuss these three adjustments in greater detail in the following subsections.
ADJUSTMENT TO HEADQUARTERS DATA
The logistics headquarters data that we collected covered all personnel involved with secondary- and principal-item management functions performed at ICP loca- tions. Since we were concerned only with secondary-item management functions, we needed to adjust the data downwards.
In the 1994 CORM database, slightly less than 75 percent of the ICP work force was dedicated to secondary-item management. We assumed that the ratio of sec- ondary item to total would remain constant and reduce the headquarters data pro- vided to us by 25 percent.
3-3
ADJUSTMENT TO ICP DATA
We increased the number of ICP personnel that the military services reported as secondary-item personnel. The original CORM database separated personnel by whether they worked with consumable, reparable, or end items, whereas our study makes a distinction between secondary and principal items. The difference is that secondary items include all consumable and reparable items and some portion of end items, while principal items are end items.
The problem with this difference is how to divide end-item data between secon- dary and principal items. The Army considers all personnel associated with op- erations and maintenance or procurement account (PA) funds as principal end- item personnel and not as secondary-item personnel. Similarly, the Air Force ex- cludes a portion of its ICP personnel from the secondary-item roles. We believe that a portion of those personnel should be included as secondary end-item per- sonnel.
To inflate the Army and Air Force data provided to us to include secondary end items, we did the following:
♦ We developed staffing and dollar ratios of end-item data to consumable- and reparable-item data from the Army and Air Force portions of the 1994 database.
♦ We used those factors to estimate FY96 Army and Air Force end-item data on the basis of the FY96 secondary-item personnel data provided to us.
♦ We then estimated that 25 percent of those end-item personnel were really secondary end-item personnel.
♦ We added that 25 percent to the ICP direct, indirect, and G&A numbers that we collected from the Army and Air Force.
ADJUSTMENT TO NONLABOR DATA
The nonlabor costs as reported by the military services were inconsistent— ranging from a few thousand dollars to a few billion dollars. To make sure that we had comparable data, we reviewed the FY96 Defense Business Operating Fund (DBOF) budget submissions on ICP costs. From those detailed submissions, we developed a new consistent set of ICP nonlabor costs for the military services and DLA.
We include only those costs that were directly related to secondary-item ICP functions—such as travel, materiel equipment and supplies, and wholesale data processing costs—and other DBOF purchases. We excluded labor costs (already collected) and other costs, such as distribution depots and depot maintenance, that
3-4
Economic Impact During the Program Objective Memorandum Period
would not change as a result of the transfer. In total, we included a little more than 14 percent of the total costs that were reported.
Consolidated FY96 Baseline
Table 3-1 shows the DoD consolidated baseline.4 The ICP figures include data from the military services and DLA. The logistics headquarters data only includes military service data.
Table 3-1. FY96 Baseline (in thousands of dollars)
Breakout
IMM User Total
FTEs Dollars FTEs Dollars FTEs Dollars
Allowance/ISSL devel- opment
Budgeting/funding
Cataloging
Configuration manage- ment
Contracting
Engineering support
Item and inventory man- agement
Provisioning
Requisition processing
Technical support
War reserve require- ments
Weapon-system supply support
FMS
Total direct
Indirect
G&A
Nonlabor
0
480
488
0
4,459
131
3,901
0
781
2,326
103
1,057
0
13,725
1,887
3,370
0
$0
$24.5
$25.2
$0
$211.8
$6.6
$190.5
$0
$40.9
$112.1
$5.4
$55.7
$0
$672.7
$95.6
$166.8
$1,145.0
241
160
81
374
0
341
288
477
156
792
8
0
148
3,067
930
623
0
$12.0
$7.8
$4.0
$18.6
$0
$16.6
$14.1
$24.1
$7.8
$40.8
$0.4
$0
$7.1
$153.4
$40.5
$27.9
$237.4
241
639
569
374
4459
472
4,189
477
937
3,118
111
1.057
148
16,792
2,817
3,993
0
$12.0
$32.3
$29.2
$18.6
$211.8
$23.2
$204.6
$24.1
$48.7
$152.9
$5.8
$55.7
$7.1
$826.1
$136.1
$194.7
$1,382.4
ICP total
Headquarters
18,187
241
$2,038.1
$16.6
4,619
118
$459.1
$8.1
23,602
359
$2,539.2
$24.7
Total 18,428 $2,055.0 4,737 $467.0 23,962 $2,563.9
4The functions in Table 3-1 match the functions in Chapter 2, with the exceptions of war re- serve requirements and FMS. Tasks under these exceptions were included under either item man- agement or inventory management in Chapter 2. This distinction did not affect either the risk or cost analyses but is shown here for the sake of accuracy.
3-5
Figure 3-2 shows how the FY96 personnel numbers are divided between ICP di- rect, ICP indirect, ICP G&A, and headquarters. By far, ICP personnel directly in- volved in performing ICP functions represent the largest share of the personnel.
Figure 3-2. FY96 Baseline FTE Breakdown
Headquarters 2%
ICP direct 69%
ICP G&A 17%
ICP indirect 12%
Figure 3-3 shows how FY96 costs are divided between ICP direct, ICP indirect, ICP G&A, ICP nonlabor, and headquarters.
Figure 3-3. FY96 Baseline Dollar Breakdown
ICP direct 31%
ICP indirect 5%
ICP G&A 8%
Headquarters 1 %
ICP nonlabor 55%
Extending Our Baseline Through the POM and Beyond
After we established the FY96 personnel and cost baseline, we extended the base- line through the POM period by factoring in reductions that were already pro- grammed. These reductions are due to force-structure changes, service initiated
3-6
Economic Impact During the Program Objective Memorandum Period
consolidations and process improvements, and base realignment and closure (BRAC) decisions. These reductions will take place whether or not the ICP func- tions transfer to DLA in the future.
Figure 3-4 shows that the logistics staffs at headquarters that support the ICPs are projected to be reduced by approximately 13 percent through FY99. As shown, no further reductions are anticipated through the POM period.
Figure 3-4. Logistics Headquarters POM Reductions
Percentage decrease
8%
6%
4% -
2%
0% 1997 1998 1999 2000 2001 2002 2003
Fiscal year
Figure 3-5 shows the reductions currently scheduled for the ICP portion of the baseline. By the end of FY03, ICP staffs will be reduced by approximately 17 per- cent. We did not project any further reductions past FY03 because the size of the reductions tailed off by the end of the POM and no basis exists to support addi- tional post-POM reductions.5
-
7%
3.4%
2.4%
0f/o 0% 0% 0%
5 This does not mean that future reductions will not be programmed, budgeted, and executed for the period FY04 to FY10. It means that, at this time, a definitive basis for quantifying what will happen during that period of time is not available.
3-7
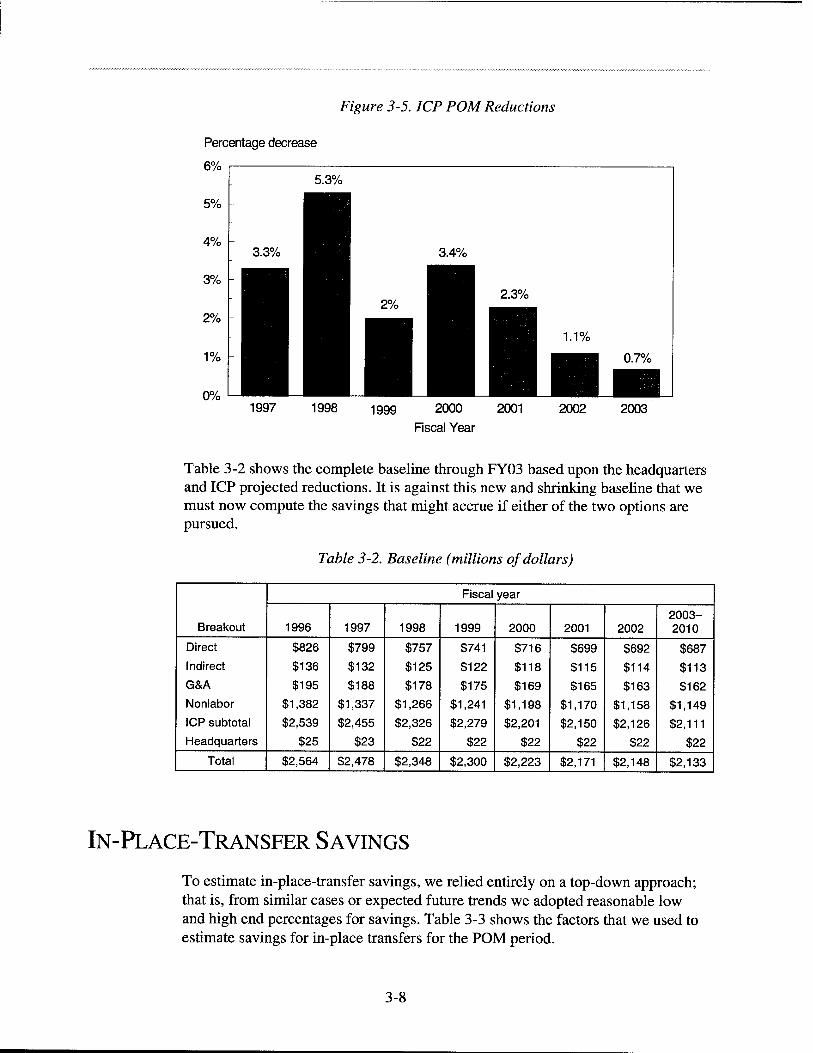
Figure 3-5. ICP POM Reductions
Percentage decrease
1997 1998 1999 2000 2001 2002 2003
Fiscal Year
Table 3-2 shows the complete baseline through FY03 based upon the headquarters and ICP projected reductions. It is against this new and shrinking baseline that we must now compute the savings that might accrue if either of the two options are pursued.
Table 3-2. Baseline (millions of dollars)
Breakout
Fiscal year
1996 1997 1998 1999 2000 2001 2002 2003- 2010
Direct $826 $799 $757 $741 $716 $699 $692 $687
Indirect $136 $132 $125 $122 $118 $115 $114 $113 G&A $195 $188 $178 $175 $169 $165 $163 $162
Nonlabor $1,382 $1,337 $1,266 $1,241 $1,198 $1,170 $1,158 $1,149
ICP subtotal $2,539 $2,455 $2,326 $2,279 $2,201 $2,150 $2,126 $2,111
Headquarters $25 $23 $22 $22 $22 $22 $22 $22
Total $2,564 $2,478 $2,348 $2,300 $2,223 $2,171 $2,148 $2,133
IN-PLACE-TRANSFER SAVINGS
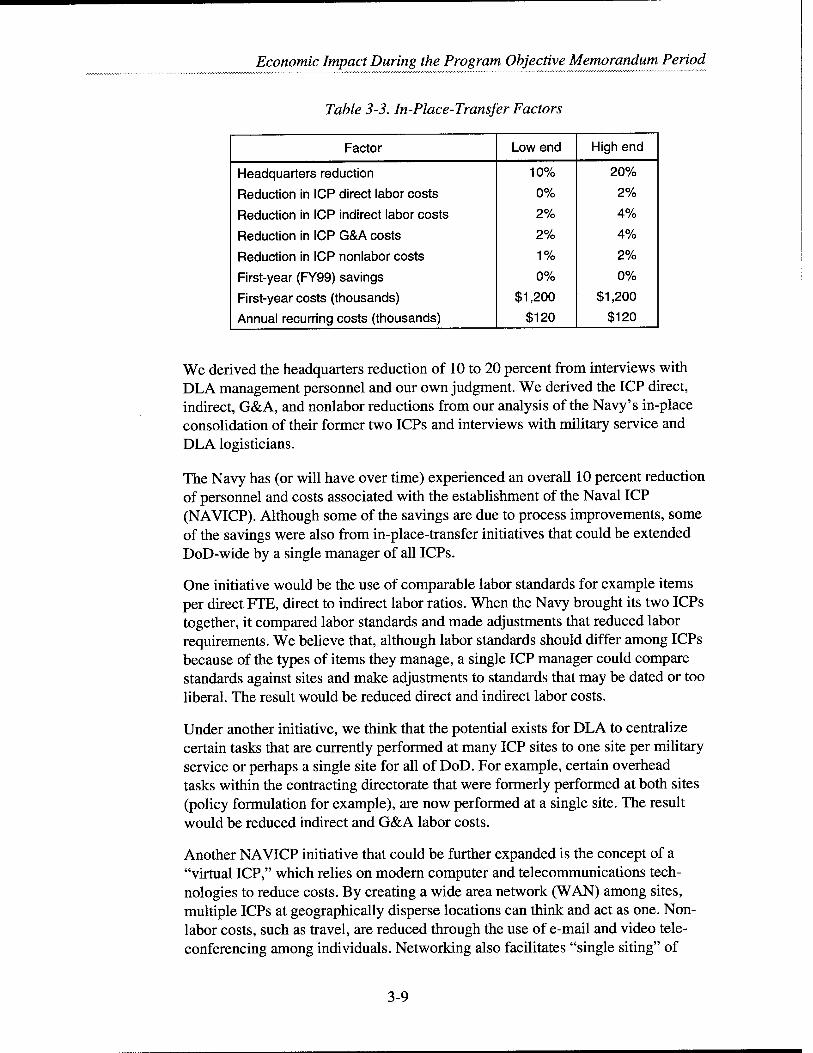
To estimate in-place-transfer savings, we relied entirely on a top-down approach; that is, from similar cases or expected future trends we adopted reasonable low and high end percentages for savings. Table 3-3 shows the factors that we used to estimate savings for in-place transfers for the POM period.
3-8
Economic Impact During the Program Objective Memorandum Period
Table 3-3. In-Place-Transfer Factors
Factor Low end High end
Headquarters reduction 10% 20%
Reduction in ICP direct labor costs 0% 2%
Reduction in ICP indirect labor costs 2% 4%
Reduction in ICP G&A costs 2% 4%
Reduction in ICP nonlabor costs 1% 2%
First-year (FY99) savings 0% 0%
First-year costs (thousands) $1,200 $1,200
Annual recurring costs (thousands) $120 $120
We derived the headquarters reduction of 10 to 20 percent from interviews with DLA management personnel and our own judgment. We derived the ICP direct, indirect, G&A, and nonlabor reductions from our analysis of the Navy's in-place consolidation of their former two ICPs and interviews with military service and DLA logisticians.
The Navy has (or will have over time) experienced an overall 10 percent reduction of personnel and costs associated with the establishment of the Naval ICP (NAVICP). Although some of the savings are due to process improvements, some of the savings were also from in-place-transfer initiatives that could be extended DoD-wide by a single manager of all ICPs.
One initiative would be the use of comparable labor standards for example items per direct FTE, direct to indirect labor ratios. When the Navy brought its two ICPs together, it compared labor standards and made adjustments that reduced labor requirements. We believe that, although labor standards should differ among ICPs because of the types of items they manage, a single ICP manager could compare standards against sites and make adjustments to standards that may be dated or too liberal. The result would be reduced direct and indirect labor costs.
Under another initiative, we think that the potential exists for DLA to centralize certain tasks that are currently performed at many ICP sites to one site per military service or perhaps a single site for all of DoD. For example, certain overhead tasks within the contracting directorate that were formerly performed at both sites (policy formulation for example), are now performed at a single site. The result would be reduced indirect and G&A labor costs.
Another NAVICP initiative that could be further expanded is the concept of a "virtual ICP," which relies on modern computer and telecommunications tech- nologies to reduce costs. By creating a wide area network (WAN) among sites, multiple ICPs at geographically disperse locations can think and act as one. Non- labor costs, such as travel, are reduced through the use of e-mail and video tele- conferencing among individuals. Networking also facilitates "single siting" of
3-9
certain overhead functions by making the services of those functions available to all sites.
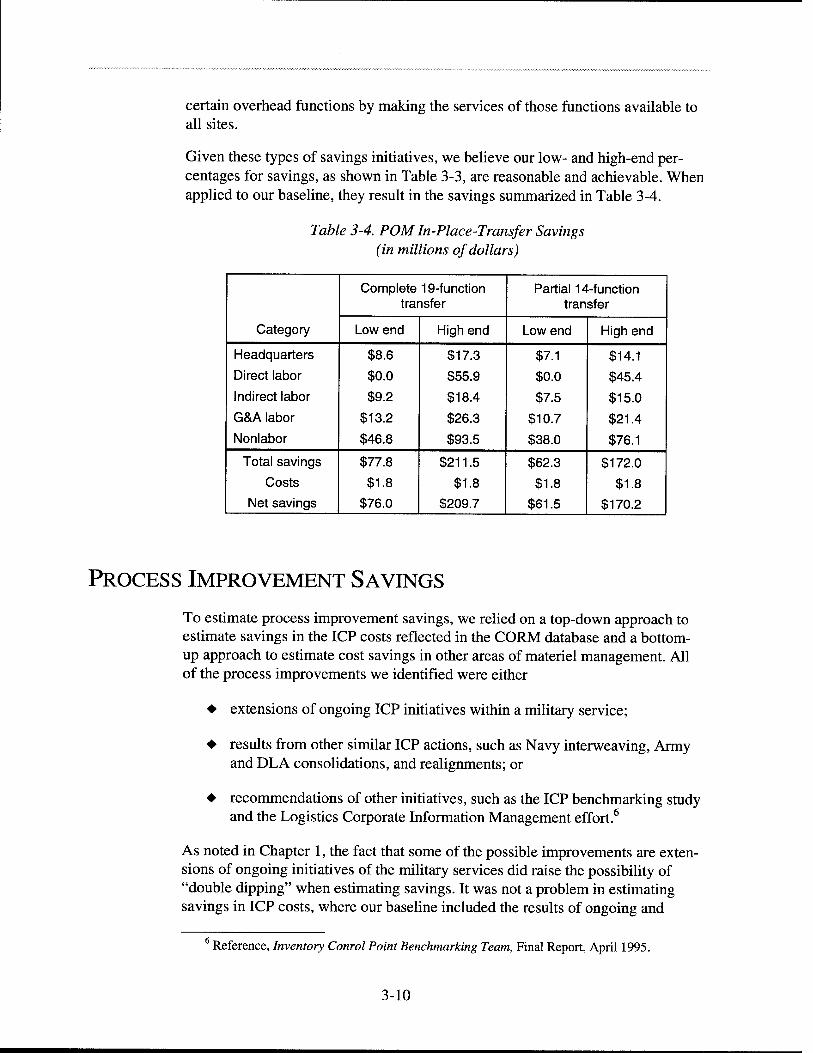
Given these types of savings initiatives, we believe our low- and high-end per- centages for savings, as shown in Table 3-3, are reasonable and achievable. When applied to our baseline, they result in the savings summarized in Table 3-4.
Table 3-4. POM In-Place-Transfer Savings (in millions of dollars)
Category
Complete 19-function transfer
Partial 14-function transfer
Low end High end Low end High end
Headquarters $8.6 $17.3 $7.1 $14.1
Direct labor $0.0 $55.9 $0.0 $45.4
Indirect labor $9.2 $18.4 $7.5 $15.0
G&A labor $13.2 $26.3 $10.7 $21.4
Nonlabor $46.8 $93.5 $38.0 $76.1
Total savings $77.8 $211.5 $62.3 $172.0
Costs $1.8 $1.8 $1.8 $1.8 Net savings $76.0 $209.7 $61.5 $170.2
PROCESS IMPROVEMENT SAVINGS
To estimate process improvement savings, we relied on a top-down approach to estimate savings in the ICP costs reflected in the CORM database and a bottom- up approach to estimate cost savings in other areas of materiel management. All of the process improvements we identified were either
♦ extensions of ongoing ICP initiatives within a military service;
♦ results from other similar ICP actions, such as Navy interweaving, Army and DLA consolidations, and realignments; or
♦ recommendations of other initiatives, such as the ICP benchmarking study and the Logistics Corporate Information Management effort.6
As noted in Chapter 1, the fact that some of the possible improvements are exten- sions of ongoing initiatives of the military services did raise the possibility of "double dipping" when estimating savings. It was not a problem in estimating savings in ICP costs, where our baseline included the results of ongoing and
' Reference, Inventory Conrol Point Benchmarking Team, Final Report, April 1995.
3-10

Economic Impact During the Program Objective Memorandum Period
planned initiatives. However, it was a problem in estimating savings in other costs where specific estimates of savings from these ongoing initiatives were not made available. To overcome this problem, we decided that a reasonable approach would be to develop cost out of the other savings for a few improvements and use them as estimates for all improvements, less savings from existing initiatives.
Potential Process Improvements
Table 3-5 shows the process improvements that could be initiated during the POM period and, when taken together, could generate ICP and other savings. In what follows, we will briefly discuss the two improvements we priced out for POM savings. (Appendix D describes all of the process improvements we identified for the POM period, as well as post-POM process improvements.)
Table 3-5. POM Process Improvements
Improvement
Area of savings
Part of estimate ICP labor
Materiel acquisition
Inventory storage Other
Contracting methodology and process
X X X Yes
Inactive-item deletion X X X Yes
Catalog total quality management
X X No
Improved demilitarization
X X No
Improved stock positioning
X No
Item reduction and entry control
X X X No
More efficient work loading of depot maintenance
X X No
Secondary item provisioning on the end-item contract
X No
Source breakout X No
CONTRACTING METHODOLOGY AND PROCESS
The first initiative, contracting methodology and process, is probably the most significant. It increases use of corporate contracting and reduces overall acquisi- tion lead-times.
3-11
Under corporate contracting, it would create DoD-wide multiple-year, multiple- line, indefinite-delivery contracts for items that lend themselves to this contracting technique. Then, instead of relying on separate drawn-out procurement actions to replenish stock, item managers at any ICP could place quicker and simpler deliv- ery orders against a set of corporate contracts. The result would be significant la- bor savings within both the contracting and item management work force. In addition, DoD could realize a lower acquisition price as economies of scale and lower contractor administrative costs take effect.
Under lead-time reduction, we would expect delivery lead-times for items under corporate contracts to be significantly less than current procurement lead-times. In addition, for other items we would expect DLA to institutionalize its processes for reducing administrative and production lead-times. The result of shorter lead-times would be a one-time savings from reductions in item safety levels and a recurring savings in associated inventory holding costs.
INACTIVE-ITEM DELETION
Savings
The second initiative, inactive-item deletion, is a one-time major action to delete inactive items. A significant portion of the items in the catalog have had no de- mands for one or more years. Although the Defense Inactive Item Program is sup- posed to annually review and delete inactive items, the program appears inadequate.
A single ICP manager would be in a position to strengthen the program and cause all registered users to identify current applications and the expected life of the ap- plications. The program could further check those items with assets against pro- curement histories for date of last procurement, transaction registers for date of last activity, catalog records for date of entry into the catalog system, and provi- sioning records. An enhanced program would lead to the disposal of the unneeded inventory and thereby reduce holding costs.
Table 3-6 shows the savings factors that we used to estimate ICP savings from process improvements. Table 3-7 sums up our estimates for POM savings associ- ated with process improvements. Since the retention of the five functions in the partial transfer alternative did not affect the process improvements that were the basis of our savings estimate for non-ICP costs, our estimate for both alternatives was the same.
3-12
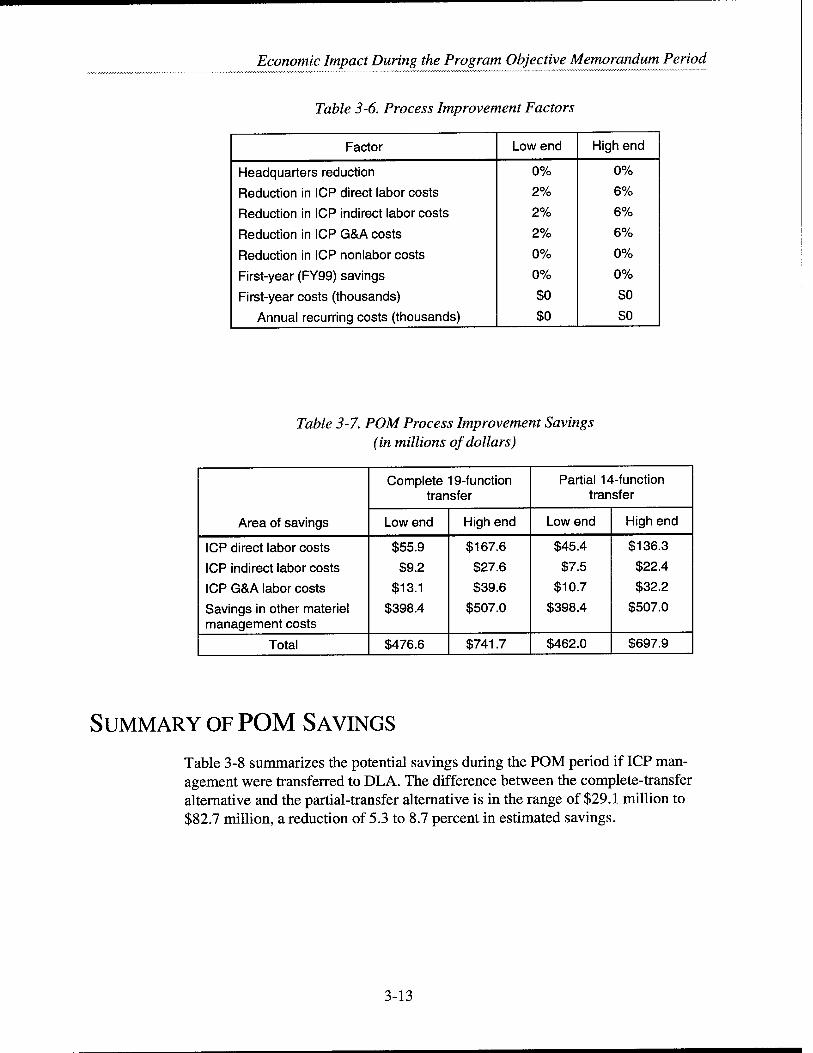
Economic Impact During the Program Objective Memorandum Period
Table 3-6. Process Improvement Factors
Factor Low end High end
Headquarters reduction 0% 0%
Reduction in ICP direct labor costs 2% 6%
Reduction in ICP indirect labor costs 2% 6%
Reduction in ICP G&A costs 2% 6%
Reduction in ICP nonlabor costs 0% 0%
First-year (FY99) savings 0% 0%
First-year costs (thousands) $0 $0
Annual recurring costs (thousands) $0 $0
Table 3-7. POM Process Improvement Savings (in millions of dollars)
Area of savings
Complete 19-function transfer
Partial 14-function transfer
Low end High end Low end High end
ICP direct labor costs $55.9 $167.6 $45.4 $136.3
ICP indirect labor costs $9.2 $27.6 $7.5 $22.4
ICP G&A labor costs $13.1 $39.6 $10.7 $32.2
Savings in other materiel management costs
$398.4 $507.0 $398.4 $507.0
Total $476.6 $741.7 $462.0 $697.9
SUMMARY OF POM SAVINGS
Table 3-8 summarizes the potential savings during the POM period if ICP man- agement were transferred to DLA. The difference between the complete-transfer alternative and the partial-transfer alternative is in the range of $29.1 million to $82.7 million, a reduction of 5.3 to 8.7 percent in estimated savings.
3-13
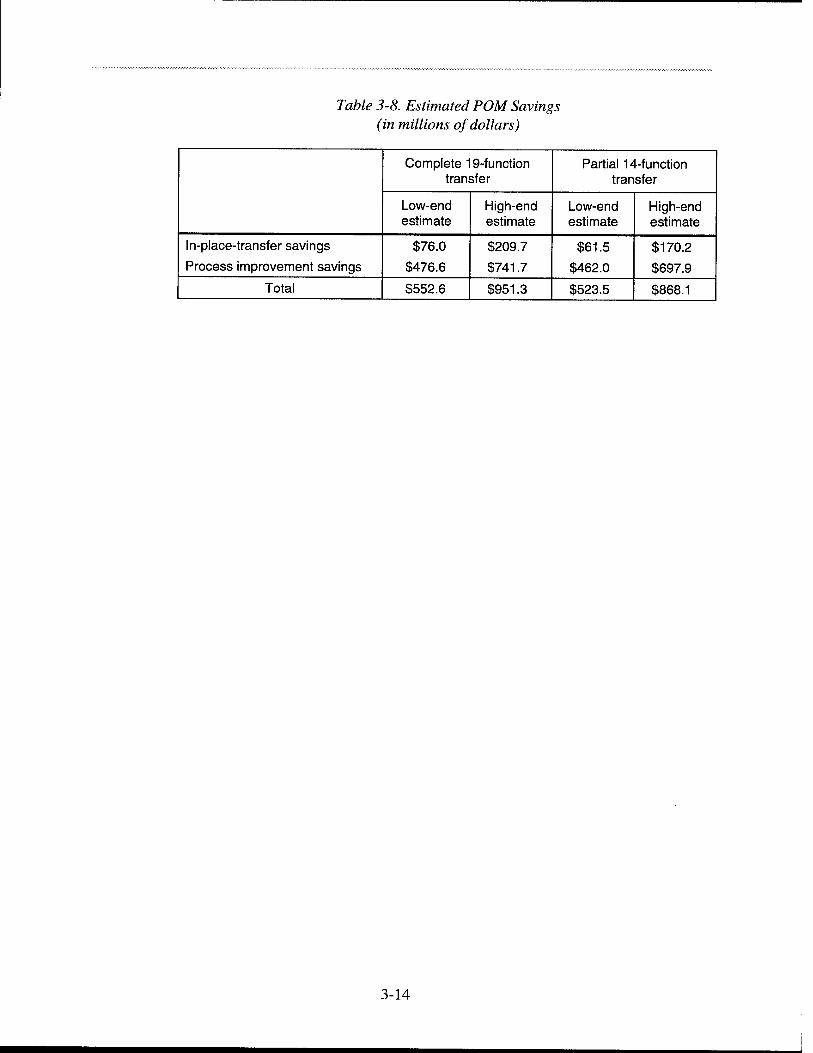
Table 3-8. Estimated POM Savings (in millions of dollars)
Complete 19-function transfer
Partial 14-function transfer
Low-end estimate
High-end estimate
Low-end estimate
High-end estimate
In-place-transfer savings
Process improvement savings
$76.0
$476.6
$209.7
$741.7
$61.5
$462.0
$170.2
$697.9
Total $552.6 $951.3 $523.5 $868.1
3-14
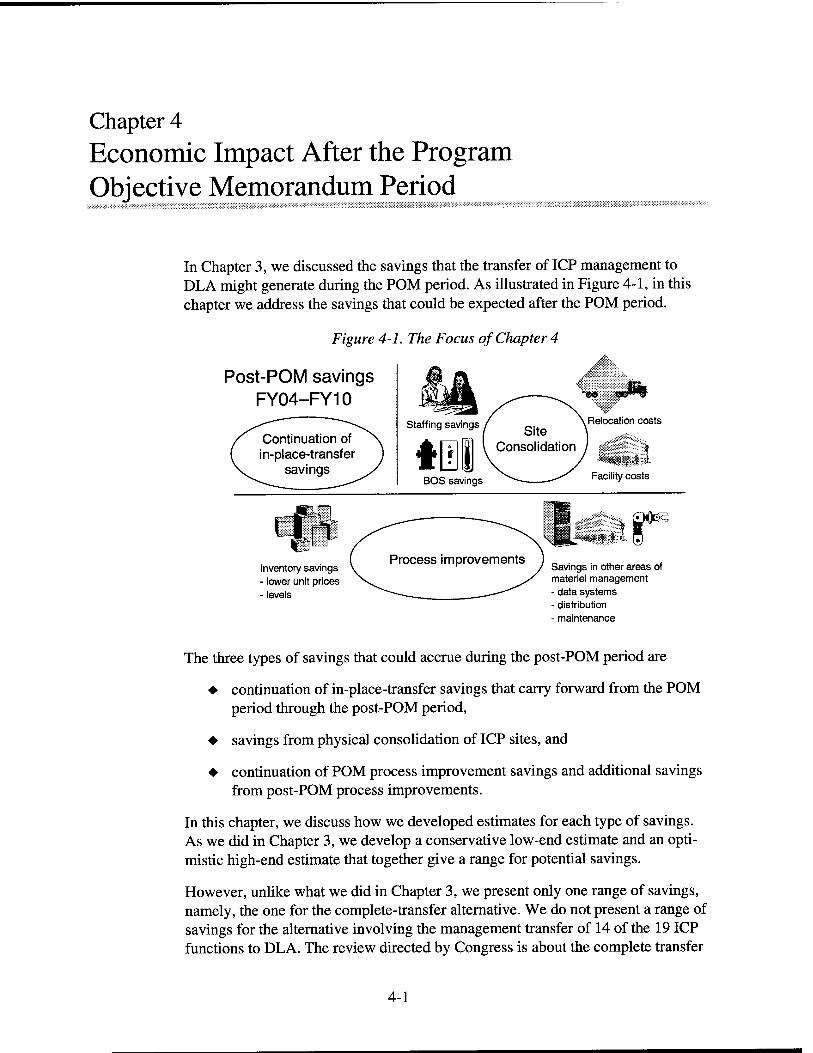
Chapter 4 Economic Impact After the Program Objective Memorandum Period
In Chapter 3, we discussed the savings that the transfer of ICP management to DLA might generate during the POM period. As illustrated in Figure 4-1, in this chapter we address the savings that could be expected after the POM period.
Figure 4-1. The Focus of Chapter 4
Post-POM savings FY04-FY10
Continuation of in-place-transfer
savings
Relocation costs
Inventory savings - lower unit prices - levels
Savings in other areas of materiel management - data systems - distribution - maintenance
The three types of savings that could accrue during the post-POM period are
♦ continuation of in-place-transfer savings that carry forward from the POM period through the post-POM period,
♦ savings from physical consolidation of ICP sites, and
♦ continuation of POM process improvement savings and additional savings from post-POM process improvements.
In this chapter, we discuss how we developed estimates for each type of savings. As we did in Chapter 3, we develop a conservative low-end estimate and an opti- mistic high-end estimate that together give a range for potential savings.
However, unlike what we did in Chapter 3, we present only one range of savings, namely, the one for the complete-transfer alternative. We do not present a range of savings for the alternative involving the management transfer of 14 of the 19 ICP functions to DLA. The review directed by Congress is about the complete transfer
4-1
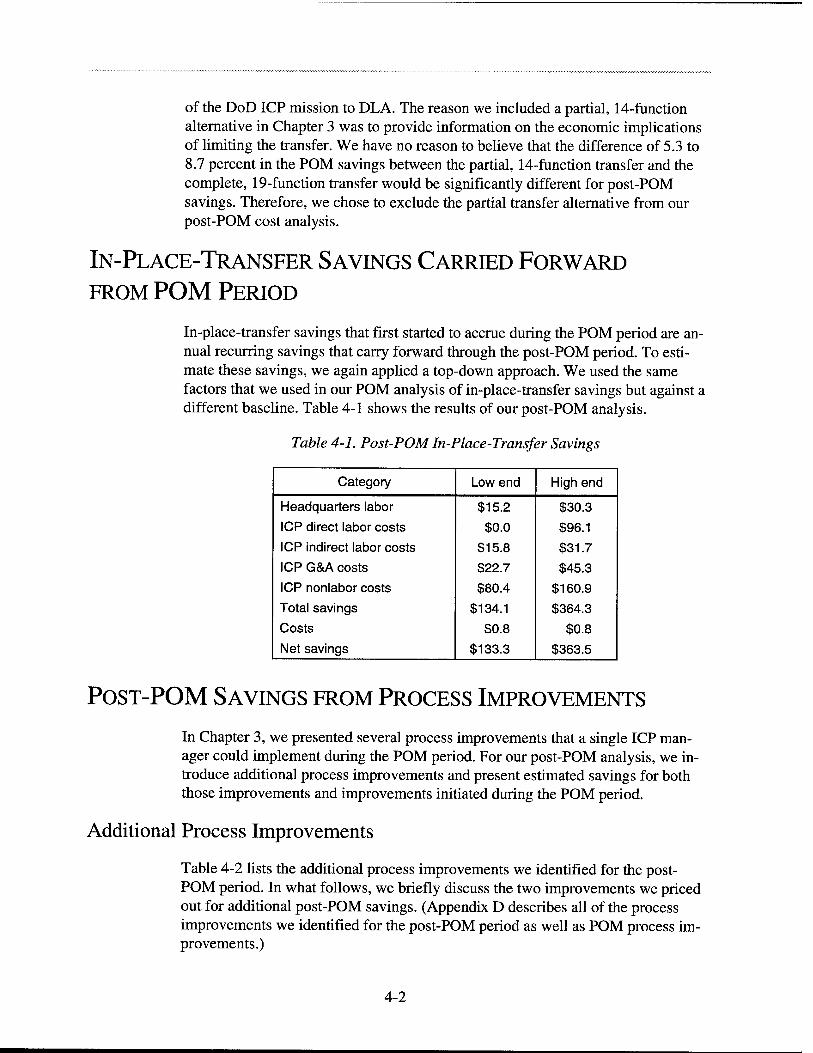
of the DoD ICP mission to DLA. The reason we included a partial, 14-function alternative in Chapter 3 was to provide information on the economic implications of limiting the transfer. We have no reason to believe that the difference of 5.3 to 8.7 percent in the POM savings between the partial, 14-function transfer and the complete, 19-function transfer would be significantly different for post-POM savings. Therefore, we chose to exclude the partial transfer alternative from our post-POM cost analysis.
IN-PLACE-TRANSFER SAVINGS CARRIED FORWARD
FROM POM PERIOD
In-place-transfer savings that first started to accrue during the POM period are an- nual recurring savings that carry forward through the post-POM period. To esti- mate these savings, we again applied a top-down approach. We used the same factors that we used in our POM analysis of in-place-transfer savings but against a different baseline. Table 4-1 shows the results of our post-POM analysis.
Table 4-1. Post-POM In-Place-Transfer Savings
Category Low end High end
Headquarters labor $15.2 $30.3
ICP direct labor costs $0.0 $96.1
ICP indirect labor costs $15.8 $31.7
ICP G&A costs $22.7 $45.3
ICP nonlabor costs $80.4 $160.9
Total savings $134.1 $364.3
Costs $0.8 $0.8
Net savings $133.3 $363.5
POST-POM SAVINGS FROM PROCESS IMPROVEMENTS
In Chapter 3, we presented several process improvements that a single ICP man- ager could implement during the POM period. For our post-POM analysis, we in- troduce additional process improvements and present estimated savings for both those improvements and improvements initiated during the POM period.
Additional Process Improvements
Table 4-2 lists the additional process improvements we identified for the post- POM period. In what follows, we briefly discuss the two improvements we priced out for additional post-POM savings. (Appendix D describes all of the process improvements we identified for the post-POM period as well as POM process im- provements.)
4-2
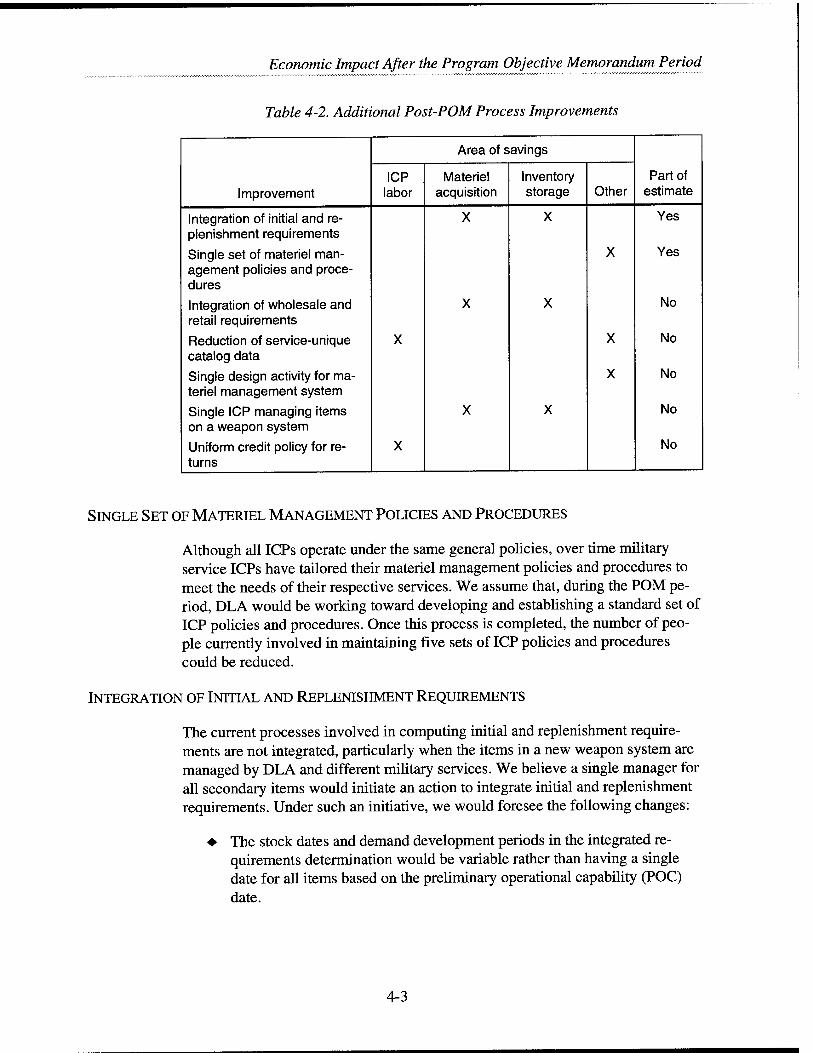
Economic Impact After the Program Objective Memorandum Period
Table 4-2. Additional Post-POM Process Improvements
Improvement
Area of savings
Part of estimate
ICP labor
Materiel acquisition
Inventory storage Other
Integration of initial and re- plenishment requirements
X X Yes
Single set of materiel man- agement policies and proce- dures
X Yes
Integration of wholesale and retail requirements
X X No
Reduction of service-unique catalog data
X X No
Single design activity for ma- teriel management system
X No
Single ICP managing items on a weapon system
X X No
Uniform credit policy for re- turns
X No
SINGLE SET OF MATERIEL MANAGEMENT POLICIES AND PROCEDURES
Although all ICPs operate under the same general policies, over time military service ICPs have tailored their materiel management policies and procedures to meet the needs of their respective services. We assume that, during the POM pe- riod, DLA would be working toward developing and establishing a standard set of ICP policies and procedures. Once this process is completed, the number of peo- ple currently involved in maintaining five sets of ICP policies and procedures could be reduced.
INTEGRATION OF INITIAL AND REPLENISHMENT REQUIREMENTS
The current processes involved in computing initial and replenishment require- ments are not integrated, particularly when the items in a new weapon system are managed by DLA and different military services. We believe a single manager for all secondary items would initiate an action to integrate initial and replenishment requirements. Under such an initiative, we would foresee the following changes:
♦ The stock dates and demand development periods in the integrated re- quirements determination would be variable rather than having a single date for all items based on the preliminary operational capability (POC) date.
4-3
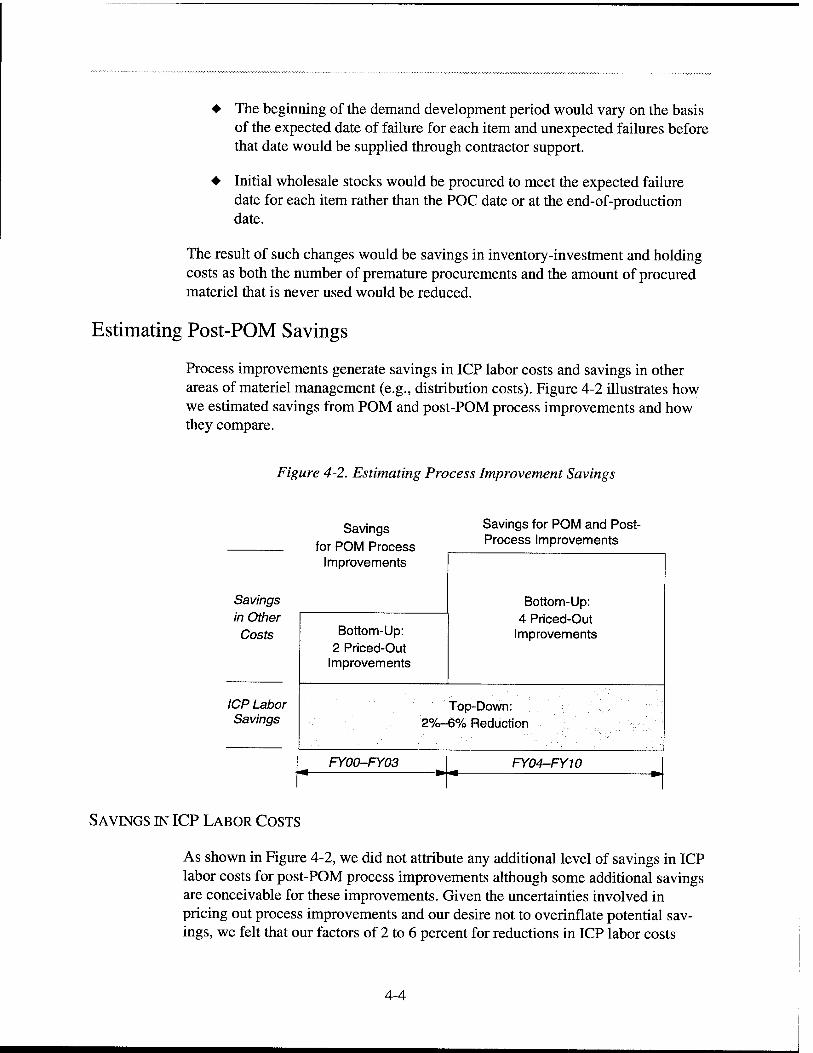
♦ The beginning of the demand development period would vary on the basis of the expected date of failure for each item and unexpected failures before that date would be supplied through contractor support.
♦ Initial wholesale stocks would be procured to meet the expected failure date for each item rather than the POC date or at the end-of-production date.
The result of such changes would be savings in inventory-investment and holding costs as both the number of premature procurements and the amount of procured materiel that is never used would be reduced.
Estimating Post-POM Savings
Process improvements generate savings in ICP labor costs and savings in other areas of materiel management (e.g., distribution costs). Figure 4-2 illustrates how we estimated savings from POM and post-POM process improvements and how they compare.
Figure 4-2. Estimating Process Improvement Savings
Savings in Other
Costs
ICP Labor Savings
Savings for POM Process
Savings for POM and Post- Process Improvements
Improvements
Bottom-Up: 4 Priced-Out
Improvements Bottom-Up: 2 Priced-Out
Improvements
Top-Down: 2%-6% Reduction
FY00-FY03 FY04-FY10
SAVINGS IN ICP LABOR COSTS
As shown in Figure 4-2, we did not attribute any additional level of savings in ICP labor costs for post-POM process improvements although some additional savings are conceivable for these improvements. Given the uncertainties involved in pricing out process improvements and our desire not to overinflate potential sav- ings, we felt that our factors of 2 to 6 percent for reductions in ICP labor costs
4-4
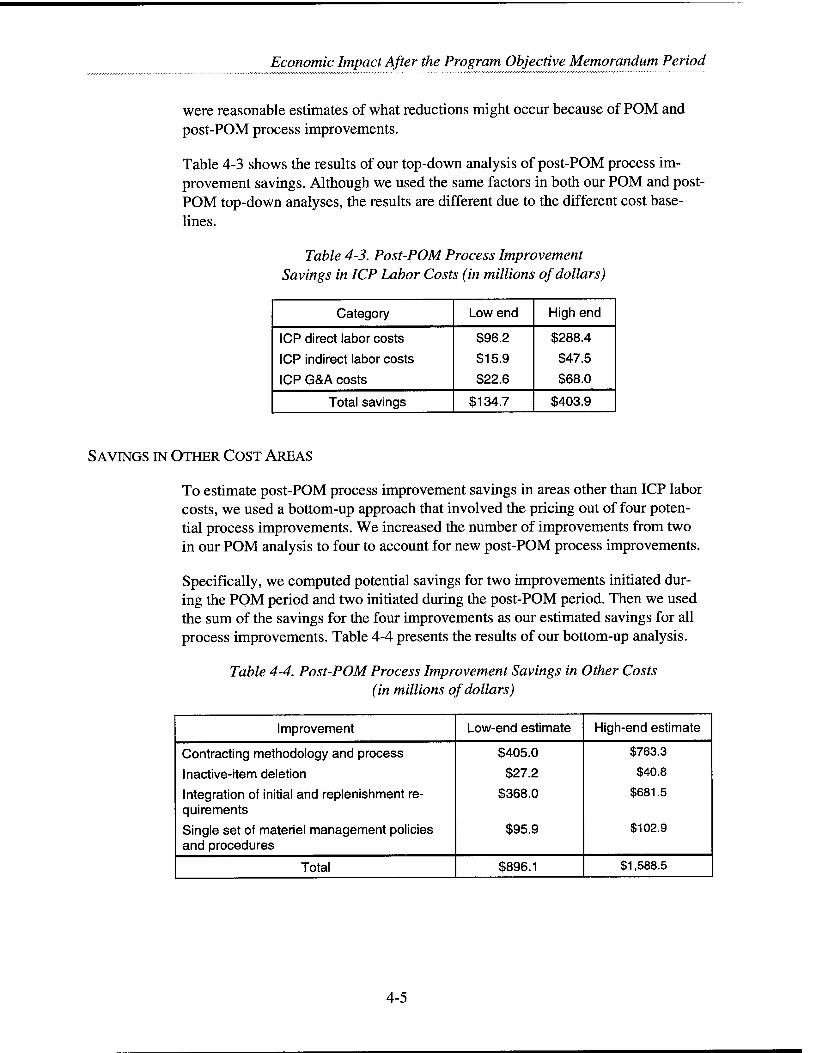
Economic Impact After the Program Objective Memorandum Period
were reasonable estimates of what reductions might occur because of POM and post-POM process improvements.
Table 4-3 shows the results of our top-down analysis of post-POM process im- provement savings. Although we used the same factors in both our POM and post- POM top-down analyses, the results are different due to the different cost base- lines.
Table 4-3. Post-POM Process Improvement Savings in ICP Labor Costs (in millions of dollars)
Category Low end High end
ICP direct labor costs
ICP indirect labor costs
ICP G&A costs
$96.2
$15.9
$22.6
$288.4
$47.5
$68.0
Total savings $134.7 $403.9
SAVINGS IN OTHER COST AREAS
To estimate post-POM process improvement savings in areas other than ICP labor costs, we used a bottom-up approach that involved the pricing out of four poten- tial process improvements. We increased the number of improvements from two in our POM analysis to four to account for new post-POM process improvements.
Specifically, we computed potential savings for two improvements initiated dur- ing the POM period and two initiated during the post-POM period. Then we used the sum of the savings for the four improvements as our estimated savings for all process improvements. Table 4-4 presents the results of our bottom-up analysis.
Table 4-4. Post-POM Process Improvement Savings in Other Costs (in millions of dollars)
Improvement Low-end estimate High-end estimate
Contracting methodology and process
Inactive-item deletion
Integration of initial and replenishment re- quirements
Single set of materiel management policies and procedures
$405.0
$27.2
$368.0
$95.9
$763.3
$40.8
$681.5
$102.9
Total $896.1 $1,588.5
4-5

PHYSICAL CONSOLIDATION OF ICPS
Having a single manager for all secondary-item ICPs offers the potential for dra- matic reductions in the number of ICPs. We would anticipate that, in concert with another BRAC commission, DLA would reduce the total number of ICPs, possi- bly to six or three physical sites. Such a reduction would result in significant long- term infrastructure savings.
Reasons for Physical Consolidation of ICPs
DoD should reduce the number of ICPs through physical site consolidation. Upon completion of the current BRAC, DoD will still have 13 major ICP physical loca- tions. Given the number of people formerly at individual ICP sites and the size of recent and planned reductions in ICP staffs, we believe that this number of loca- tions is too many. We feel that the number of sites could be significantly reduced without creating an unacceptable span of control.
Planned and implemented process improvements as well as further automation will increase the ratio of overhead costs to direct costs if the number of ICPs stays the same. Under these circumstances, the continuance of so many sites adds un- necessarily to the overhead costs paid for in the form of surcharges by the combat forces without adding commensurate value.
The military services and DLA could consolidate ICPs within their respective or- ganizations. However, if consolidation were to take place under a single manager for ICPs, then military service or agency ownership would be less of a factor in the final number of ICPs and the item populations managed by individual ICPs. Instead, we would anticipate a more logical grouping of ICPs based on the types of weapon systems being supported and on presenting one face to commercial suppliers. For example, instead of each military service having at least one ICP managing aviation items, all aviation items could be managed at one ICP.
Table 4-5 lists one possible three-ICP configuration.
Table 4-5. Potential Three-ICP Configuration
ICP Mission
Air
Ground, sea, and commu- nications
Personnel and general supplies
Materiel support for aircraft and air-launched missiles
Materiel support for vehicles, ships, ground-launched mis- siles, armament, and communications equipment
Subsistence, medical, fuels, clothing, general supplies, and construction-equipment support
4-6
Economic Impact After the Program Objective Memorandum Period
This configuration would
♦ provide for greater emphasis on management of secondary items for weapon systems by minimizing the amount of interactivity coordination,
♦ provide for greater specialization on selective weapon-system components (such as on engines and landing gear) without geographically separating the management of those components from the remainder of the weapon system,
♦ facilitate process improvements by concentrating expertise and bringing together items for consideration of item reduction and standardization and for corporate contracting from the same sources, and
♦ provide for greater flexibility in the use of the work force in transitioning from old to new weapon systems and in dealing with workload fluctua- tions.
Although outside the scope of this study, consolidation of ICPs does create the possibility of program-manager consolidation. If ICPs were consolidated at a few sites, it would be desirable to collocate on the same installations many, if not all, of the corresponding program managers under their respective commands.
Model Used to Estimate Costs and Savings Associated with Physical Consolidation
To compute savings for physically consolidating ICPs, we used a model devel- oped for DMRD 926, ICP Consolidation Study, in 1990. The same model was also used by the CORM in 1994 for a similar study effort. In the subsection that follows, we will discuss how we used the model to estimate consolidation savings and costs.
SETTING Low- AND HIGH-END ESTIMATES
The savings from a consolidation action are inversely proportional to the number of sites being consolidated and directly proportional to the number of people that would be transferred or severed. To have a range of savings, we chose a reduction to six ICPs as our low-end estimate and a reduction to three ICPs as our high-end estimate. Since we wanted to be conservative in both of these estimates, we wanted to start with the consolidation baseline that had the least number of peo- ple. Therefore, we used the high-end scenario for in-place transfer and process improvement because it generated the larger number of personnel reductions dur- ing the POM period and, therefore, had less people in its end-of-POM database than other scenarios.
4-7
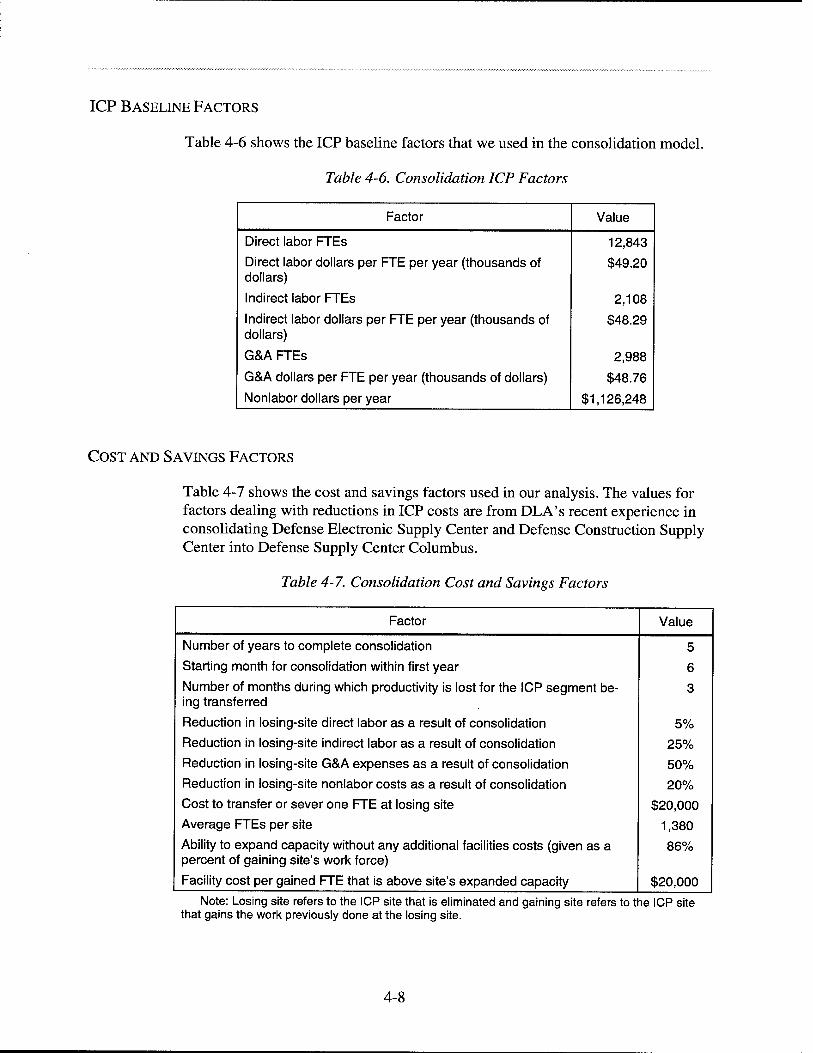
ICP BASELINE FACTORS
Table 4-6 shows the ICP baseline factors that we used in the consolidation model.
Table 4-6. Consolidation ICP Factors
Factor Value
Direct labor FTEs 12,843
Direct labor dollars per FTE per year (thousands of dollars)
$49.20
Indirect labor FTEs 2,108
Indirect labor dollars per FTE per year (thousands of dollars)
$48.29
G&A FTEs 2,988
G&A dollars per FTE per year (thousands of dollars) $48.76
Nonlabor dollars per year $1,126,248
COST AND SAVINGS FACTORS
Table 4-7 shows the cost and savings factors used in our analysis. The values for factors dealing with reductions in ICP costs are from DLA's recent experience in consolidating Defense Electronic Supply Center and Defense Construction Supply Center into Defense Supply Center Columbus.
Table 4-7. Consolidation Cost and Savings Factors
Factor
Number of years to complete consolidation
Starting month for consolidation within first year
Number of months during which productivity is lost for the ICP segment be- ing transferred
Reduction in losing-site direct labor as a result of consolidation
Reduction in losing-site indirect labor as a result of consolidation
Reduction in losing-site G&A expenses as a result of consolidation
Reduction in losing-site nonlabor costs as a result of consolidation
Cost to transfer or sever one FTE at losing site
Average FTEs per site
Ability to expand capacity without any additional facilities costs (given as a percent of gaining site's work force)
Facility cost per gained FTE that is above site's expanded capacity
Value
5
6
3
5%
25%
50%
20%
$20,000
1,380
86%
$20,000
Note: Losing site refers to the ICP site that is eliminated and gaining site refers to the ICP site that gains the work previously done at the losing site.
4-8
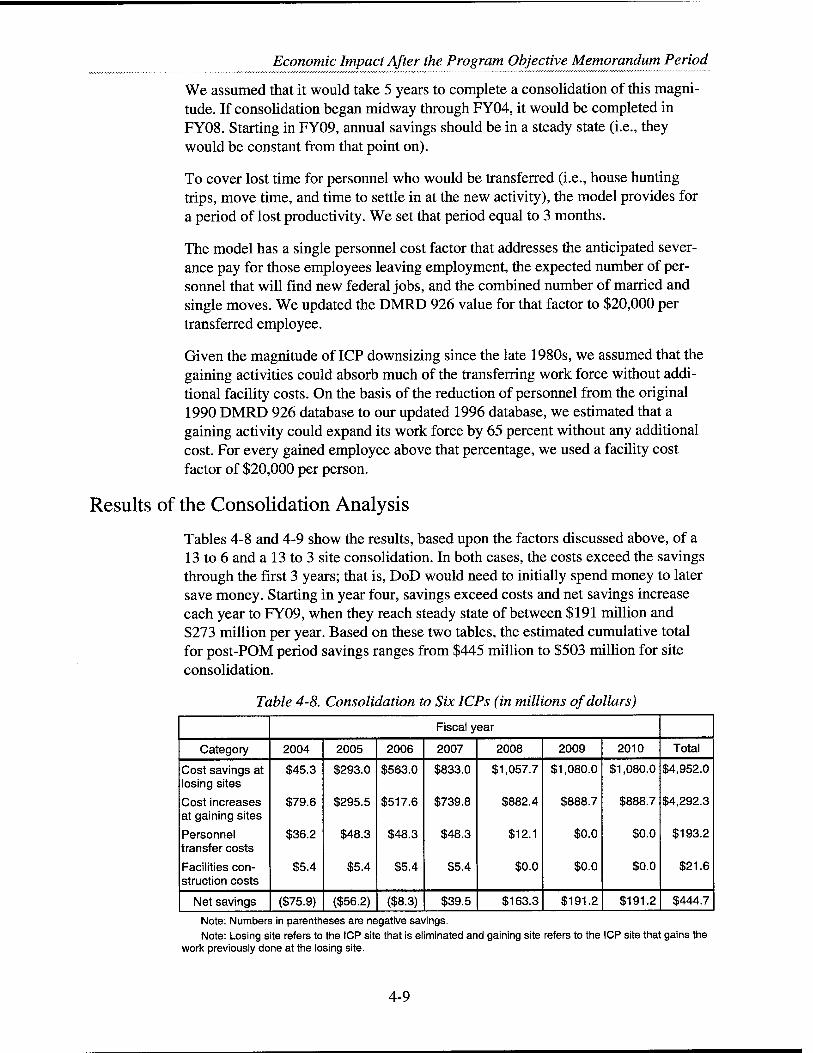
Economic Impact After the Program Objective Memorandum Period
We assumed that it would take 5 years to complete a consolidation of this magni- tude. If consolidation began midway through FY04, it would be completed in FY08. Starting in FY09, annual savings should be in a steady state (i.e., they would be constant from that point on).
To cover lost time for personnel who would be transferred (i.e., house hunting trips, move time, and time to settle in at the new activity), the model provides for a period of lost productivity. We set that period equal to 3 months.
The model has a single personnel cost factor that addresses the anticipated sever- ance pay for those employees leaving employment, the expected number of per- sonnel that will find new federal jobs, and the combined number of married and single moves. We updated the DMRD 926 value for that factor to $20,000 per transferred employee.
Given the magnitude of ICP downsizing since the late 1980s, we assumed that the gaining activities could absorb much of the transferring work force without addi- tional facility costs. On the basis of the reduction of personnel from the original 1990 DMRD 926 database to our updated 1996 database, we estimated that a gaining activity could expand its work force by 65 percent without any additional cost. For every gained employee above that percentage, we used a facility cost factor of $20,000 per person.
Results of the Consolidation Analysis
Tables 4-8 and 4-9 show the results, based upon the factors discussed above, of a 13 to 6 and a 13 to 3 site consolidation. In both cases, the costs exceed the savings through the first 3 years; that is, DoD would need to initially spend money to later save money. Starting in year four, savings exceed costs and net savings increase each year to FY09, when they reach steady state of between $191 million and $273 million per year. Based on these two tables, the estimated cumulative total for post-POM period savings ranges from $445 million to $503 million for site consolidation.
Table 4-8. Consolidation to Six ICPs (in millions of dollars)
Fiscal year
Category 2004 2005 2006 2007 2008 2009 2010 Total
Cost savings at losing sites
Cost increases at gaining sites
Personnel transfer costs
Facilities con- struction costs
$45.3
$79.6
$36.2
$5.4
$293.0
$295.5
$48.3
$5.4
$563.0
$517.6
$48.3
$5.4
$833.0
$739.8
$48.3
$5.4
$1,057.7
$882.4
$12.1
$0.0
$1,080.0
$888.7
$0.0
$0.0
$1,080.0
$888.7
$0.0
$0.0
$4,952.0
$4,292.3
$193.2
$21.6
Net savings ($75.9) ($56.2) ($8.3) $39.5 $163.3 $191.2 $191.2 $444.7
Note: Numbers in parentheses are negative savings. Note: Losing site refers to the ICP site that is eliminated and gaining site refers to the ICP site that gains the
work previously done at the losing site.
4-9
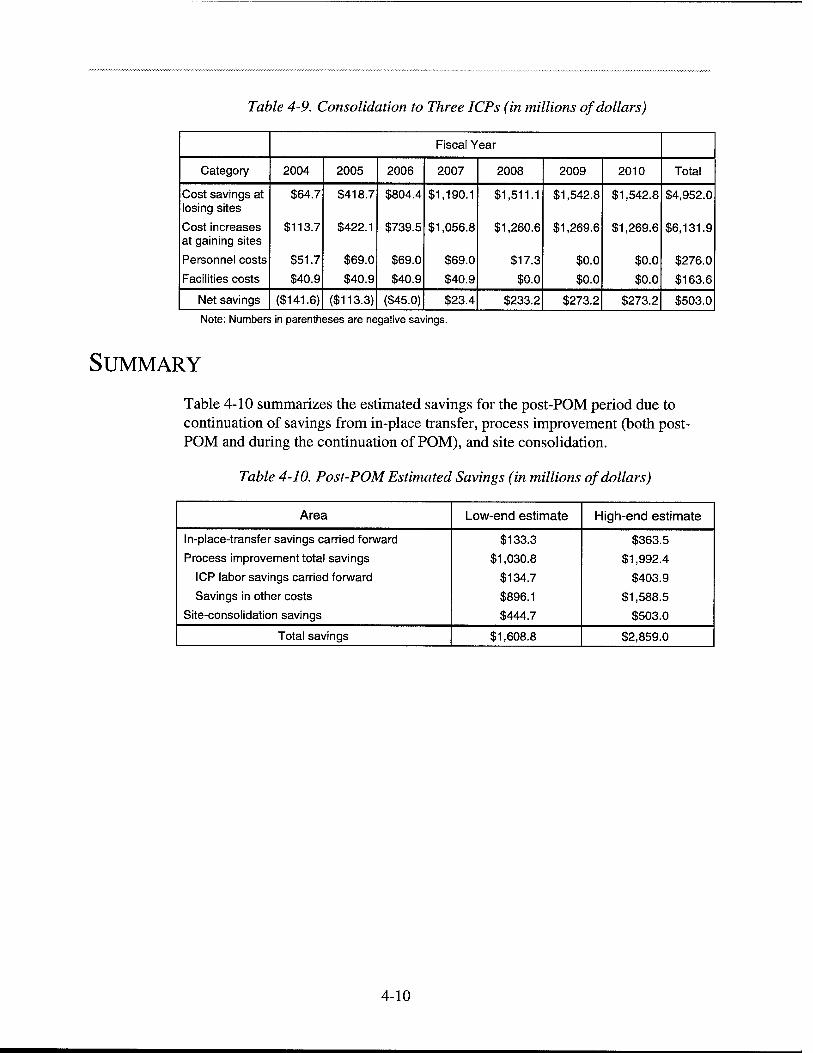
Table 4-9. Consolidation to Three ICPs (in millions of dollars)
Fiscal Year
Category 2004 2005 2006 2007 2008 2009 2010 Total
Cost savings at losing sites
$64.7 $418.7 $804.4 $1,190.1 $1,511.1 $1,542.8 $1,542.8 $4,952.0
Cost increases at gaining sites
$113.7 $422.1 $739.5 $1,056.8 $1,260.6 $1,269.6 $1,269.6 $6,131.9
Personnel costs $51.7 $69.0 $69.0 $69.0 $17.3 $0.0 $0.0 $276.0
Facilities costs $40.9 $40.9 $40.9 $40.9 $0.0 $0.0 $0.0 $163.6
Net savings ($141.6) ($113.3) ($45.0) $23.4 $233.2 $273.2 $273.2 $503.0
Note: Numbers in parentheses are negative savings
SUMMARY
Table 4-10 summarizes the estimated savings for the post-POM period due to continuation of savings from in-place transfer, process improvement (both post- POM and during the continuation of POM), and site consolidation.
Table 4-10. Post-POM Estimated Savings (in millions of dollars)
Area Low-end estimate High-end estimate
ln-place-transfer savings carried forward
Process improvement total savings
ICP labor savings carried forward
Savings in other costs
Site-consolidation savings
$133.3
$1,030.8
$134.7
$896.1
$444.7
$363.5
$1,992.4
$403.9
$1,588.5
$503.0
Total savings $1,608.8 $2,859.0
4-10

Appendix A DoD Inventory Control Points
CURRENT ALIGNMENT OF ICP MATERIEL
MANAGEMENT RESPONSIBILITIES
The DoD ICP infrastructure has been divided between the military services and DLA for the past 30 years. DLA has become DoD's wholesale manager for most consumable items, such as repair parts, personnel support items (i.e., clothing, food, and medical supplies), fuel, other bulk items and materiel, and expendable minor end items. Military service ICPs manage major end items and reparable as- semblies and subassemblies as well as selected consumable items. Historically, DLA ICPs have been associated with commodity management, although DLA has a Weapon System Support Program (WSSP) and is realigning its ICPs more along the lines of weapon-system support.
ICP STATISTICS
Currently, DoD ICPs manage nearly 5 million secondary items with a wholesale inventory valued at more than $54 billion. Navy and Air Force ICPs are also in- volved in the management of their retail reparable inventories, valued at $10 billion.2 In FY95, they sold $16 billion in materiel to forts, bases, ships, camps, posts, and other installations located in this country and overseas. Figure A-l shows how this workload is divided between military service and DLA ICPs. The military services manage fewer items than DLA, but these are the more ex- pensive reparable items that have a major impact on weapon-system readiness.
1 Reparable items managed by the military services are often associated with weapon-system readiness. However, the data show that consumable items managed by DLA, particularly items that go directly on weapon systems rather than within a reparable assembly, can also keep weapon sys- tems from being mission capable.
2 Dollar values for wholesale and retail inventory were taken from the DoD Supply System In- ventory Report, 30 September 1995.
3 Workload measurements do not include fuel managed by DLA's Defense Fuel Supply Center (DFSC). DFSC, which is collocated with DLA headquarters, is not included in any data presented in this report.
A-l

Figure A-1. Division oflCP Workload
DDLAICPs
■ Military service ICPs
Number of items
Dollar value of inventory
Dollar value of
sales
INITIATIVES AFFECTING ICP PLANNING AND
PROGRAMMING
DoD is engaged in several initiatives that affect its future ICP planning and pro- gramming. In addition to the establishment of global Primary Inventory Control Activities (PICAs), several other consolidation studies and efforts are now under- way that will affect DoD ICPs. The primary example is in item cataloging, where the department is moving to consolidate this function at one site under a joint pro- gram office. Another example is the establishment of regional personnel offices supporting all defense sites, including ICPs, within a geographic area.
The department is also modernizing its logistics systems and improving the com- munication of logistics information. It is evolving its current logistics systems into an integrated functional and interoperable technical environment. This environ- ment will maximize the use of standardized data, data repositories, and commer- cial and government off-the-shelf software to support ICP functions, particularly configuration management and cataloging. DoD is also developing the capability for total asset visibility (TAV). The TAV effort will improve the exchange of in- formation among ICPs; and between ICPs and other organizations, such as retail supply activities, commercial sources of supply, and operating and planning units. These efforts by DoD to modernize its information systems and improve data communications will present new opportunities to reengineer ICP business proc- esses.
Besides these DoD-wide initiatives, each military service and DLA has its own ICP initiatives. For example, each military service has reduced or is reducing functional teaming at its ICPs to implement some form of weapon-system team-
A-2
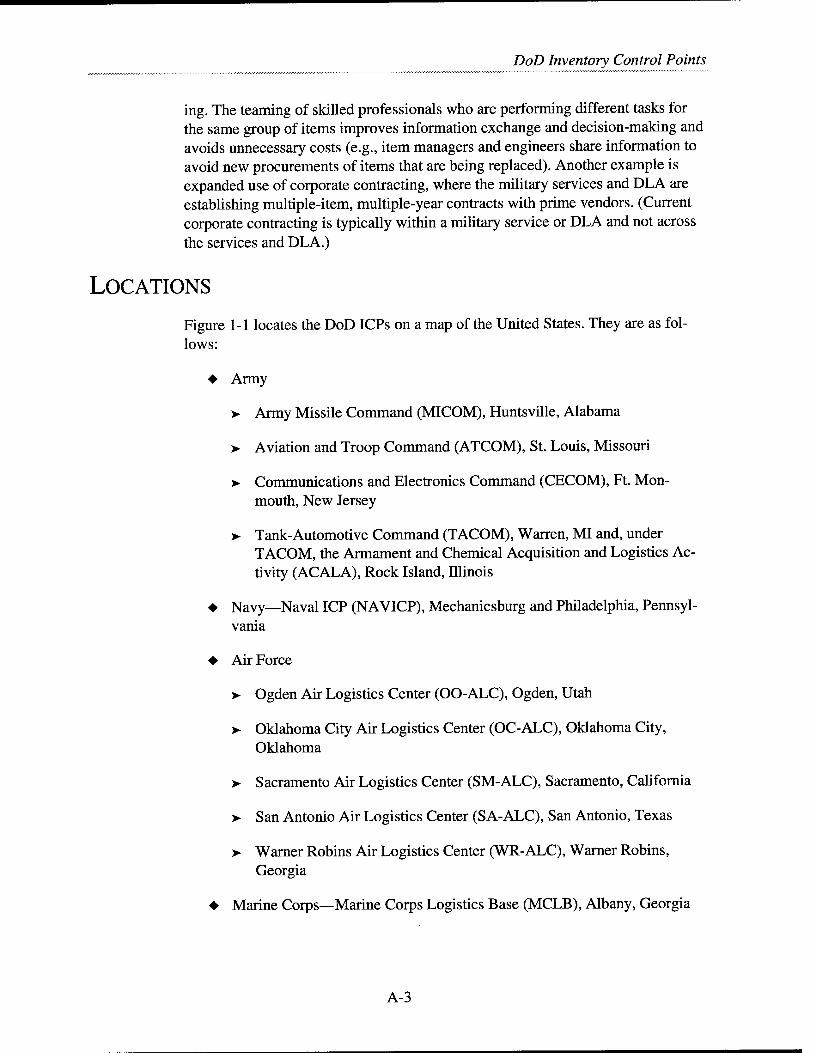
DoD Inventory Control Points
ing. The teaming of skilled professionals who are performing different tasks for the same group of items improves information exchange and decision-making and avoids unnecessary costs (e.g., item managers and engineers share information to avoid new procurements of items that are being replaced). Another example is expanded use of corporate contracting, where the military services and DLA are establishing multiple-item, multiple-year contracts with prime vendors. (Current corporate contracting is typically within a military service or DLA and not across the services and DLA.)
LOCATIONS
Figure 1-1 locates the DoD ICPs on a map of the United States. They are as fol- lows:
♦ Army
> Army Missile Command (MICOM), Huntsville, Alabama
>- Aviation and Troop Command (ATCOM), St. Louis, Missouri
> Communications and Electronics Command (CECOM), Ft. Mon- mouth, New Jersey
> Tank-Automotive Command (TACOM), Warren, MI and, under TACOM, the Armament and Chemical Acquisition and Logistics Ac- tivity (ACALA), Rock Island, Illinois
+ Navy—Naval ICP (NAVICP), Mechanicsburg and Philadelphia, Pennsyl- vania
♦ Air Force
> Ogden Air Logistics Center (OO-ALC), Ogden, Utah
> Oklahoma City Air Logistics Center (OC-ALC), Oklahoma City, Oklahoma
> Sacramento Air Logistics Center (SM-ALC), Sacramento, California
>- San Antonio Air Logistics Center (SA-ALC), San Antonio, Texas
>- Warner Robins Air Logistics Center (WR-ALC), Warner Robins, Georgia
♦ Marine Corps—Marine Corps Logistics Base (MCLB), Albany, Georgia
A-3
♦ DLA
> Defense Industrial Supply Center (DISC), Philadelphia, Pennsylvania
> Defense Personnel Support Center (DPSC), Philadelphia, Pennsylvania
>- Defense Supply Center Columbus (DSCC), Columbus, Ohio
> Defense Supply Center Richmond (DSCR), Richmond, Virginia
>• Defense Fuels Supply Center (DFSC) (not part of the review), collo- cated with DLA headquarters, Ft. Belvoir, Virginia.
A-4
Appendix B
Inventory Control Point Functions
The following list of functions and supporting tasks was originally developed in 1990 by the Operations Subgroup of the DMRD 926, ICP Consolidation Study Team and later was used by the DoD Commission on Roles and Missions of the Armed Services in 1994. The team's objective in preparing the list was to define the functions and supporting tasks that constitute an ICP or, as it is sometimes re- ferred to, an "integrated materiel management activity."
We have divided the list into two parts. The first part addresses functions that are IMM functions and are normally associated with a PICA. The second part ad- dresses functions that are performed by the using military service, or simply user functions, and are normally associated with a Secondary Inventory Control Activ- ity (SICA). A function may appear under both categories, but its supporting tasks will differ.
We used the list in both our risk and cost analyses. We condensed the original de- scription of supporting tasks to facilitate our discussions with DoD subject-matter experts. Specifically, we
♦ combined several IMM functions into the IMM item management function and several user functions into the user inventory management function and
♦ deleted the weapon system management function, which had tasks specifi- cally dealing with principal items, and replaced it with the weapon system secondary item supply support function, which retains those tasks that are only associated with secondary items.
The remainder of this appendix defines each of the functions. Where we com- bined DMRD 926 functions, we listed the functions that we combined under our new function. Although it was excluded from our analysis, we describe, under the SICA/user functions, a weapon system management function that includes princi- pal end-item management tasks that we did not include under our new weapon system secondary item supply support function.
B-l
PICA/IMM FUNCTIONS
B udgeting/Funding
This function involves the financial planning and resource management associated with the acquisition and maintenance of inventories of IMM managed materiel and with the preparation of planning, programming, and budgeting documents in- cluding the POM. Specific tasks under this function are
♦ controlling procurement and depot maintenance funds (appropriated and stock funds),
♦ developing and maintaining standard prices,
♦ billing for reimbursable issues, and
♦ performing financial management and participating in the program or budget process.
Cataloging
This function involves generating the comprehensive logistics data record re- quired to identify, requisition, ship, store, dispose of, or make other logistics deci- sions related to an item of supply during its operational life cycle. Tasks in this process include the following:
♦ Item name assignment—the designation of a commonly recognized noun or noun phrase to an item of supply that answers the question, "What is it?". (An item name may be refined later on the basis of subsequently available technical data and ongoing tool development.)
♦ Federal Supply Class (FSC) determination—the categorization of an item of supply that establishes its relationship with other items on the basis of the assigned item name and/or characteristics. (FSC determination, like item name assignment, may be refined later on the basis of available tech- nical data and ongoing tool development.)
♦ Item identification preparation and maintenance—the recording of char- acteristic data (i.e., words, numbers, and/or codes) to describe the physical and functional attributes of a supply item. Proper item identification is contingent upon accurate item name assignment and FSC.
♦ Item entry control—a filtering process that scrutinizes potential candidates for inclusion in the federal catalog by manually and mechanically com- paring candidates to existing items and recognized standards.
B-2
Inventory Control Point Functions
♦ Technical data validation—the process by which the quality of technical data is confirmed for purposes of item name assignment, FSC determina- tion, item-entry control, and item identification.
♦ Provisioning support—those actions taken to facilitate the best selection, procurement, and cataloging of items of supply required to sustain weapon systems and other government requirements (e.g., data calls, provisioning, guidance and logistics support analysis conferences, technical data valida- tion).
♦ Data recording and maintenance—those actions necessary to ensure com- plete, accurate, and current logistics data records (excluding data on item characteristics) for a supply item. Such actions are normally accomplished as a result of item-manager requests, system incompatibility notices, tech- nical data revisions, interchangeability and substitutability (I&S) deci- sions, and periodic record review. Representative of this function are actions involving the Defense Inactive Item Program, DoD I&S, item- reduction study decisions, major-item maintenance, catalog management data, and logistics reassignments.
♦ Cataloging tools—the process of initiating and enhancing documents and procedures required to research, record, and organize item logistics infor- mation. Tools include item names; definitions; and FSC structure; federal guides for item identification; descriptive guides for logistics name; and other publications. Tool development is directed by established principles, yet driven by technological advancements.
Contracting
This function involves developing, executing, and managing contracts supporting item management, including pre-award and post-award decisions. Specific tasks under this function are
♦ performing pre-award tasks,
♦ issuing contractual instruments, and
♦ performing post-award tasks.
Customer Services
This function involves expediting procurement- and requisition-related repair, is- suance, and delivery of urgent item requirements that may impair mission capa- bilities, cause work stoppages, and include customer liaison efforts. Specific tasks under this function are
♦ coordinating with users and logistics support agents,
B-3
♦ expediting the processing of high-priority requisitions, including edit and generation of material release orders,
♦ maintaining suspense files and providing status information and customer liaison,
♦ maintaining status boards for high-priority requisitions that are not imme- diately issued, and
♦ receiving and processing customer complaints related to requisitions, in- cluding shipment discrepancies.
Engineering Support
This user function involves engineering expertise related to equipment and item management. Specific tasks under this function are
♦ conducting value engineering studies and
♦ performing reverse engineering analyses.
Item Management
This function involves determining customer needs, selecting the method of man- agement, developing stock levels, and determining and initiating supply actions (i.e., buy, repair, contract termination, distribution, maintenance, and disposal ac- tions). It includes the DMRD 926 functions of disposal decisions, distribution de- cisions, maintenance management, and requirements determination. Specific tasks under this function are
♦ obtaining, reviewing, and maintaining requirements computation factors (i.e., authorization allowance data; demand data; failure rates; condemna- tion rates; turn-around times; and program data—flying hours, steaming hours, and troop strengths);
♦ computing gross worldwide requirements (i.e., replenishment, special peacetime requirements, foreign military sales requirements, and other war reserve materiel requirements);
♦ initiating procurement, repair, reclamation, assembly and disassembly, manufacture (depot), distribution, expedite action, and disposal;
♦ performing supply control reviews, which include verification of factors (e.g., price, assets onhand or due in, lead-times, carcass return rates) and determining supply action (i.e., buy, repair, redistribute, or dispose);
♦ developing requirements for depot-level maintenance program;
B-4

Inventory Control Point Functions
♦ performing management functions for modifications until the modifica- tions are accomplished (e.g., preparing procurement requests for kit pro- curement or initiating action to assemble kits from stock or local manufacture, maintaining surveillance over kit delivery and distribution, managing field and depot accomplishment until all affected systems are modified);
♦ maintaining status and control of funds required to support accomplish- ment of modification; and
♦ obtaining, reviewing, and assigning data and codes for supply management systems (e.g., data or codes for critical, management-review, or inactive- review items, or for lead-times, procurement cycles, demand weight).
Requisition Processing
This function involves receiving, recording, and filling requisitions; maintaining requisition files; researching technical data incidents; processing incoming request documents; providing status information on requisitions; and maintaining liaisons with using activities. Specific tasks under this function are
♦ processing requisitions (including performing availability edits) and gen- erating materiel release orders;
♦ reconciling and validating back orders;
♦ taking appropriate supply action on materiel release denials;
♦ conducting authorization review and approval for issuing items controlled by the item manager (supply-source review in lieu of military service or agency review); and
♦ reviewing requisitions for nonstocked items, including items with national stock numbers and local purchase items, for determination of supply ac- tion.
Stock Control
This function involves establishing and maintaining accountable and memoran- dum on-hand asset records and due-in asset records and includes reconciling rec- ords, processing documents other than requisition-related documents affecting stock records, and coordinating physical inventories with storage activities. Spe- cific tasks under this function are
♦ maintaining accountable and memorandum stock records and reconciling storage depot and ICP records;
B-5
♦ processing inventory adjustments, e.g., adjustments to item condition, ownership, purpose, or location;
♦ coordinating physical inventories;
♦ processing count cards of physical inventory and making adjustments;
♦ initiating and processing reports of surveys done by the accountable offi- cers;
♦ establishing and maintaining due-in asset information from procurement, repair, customer returns, logistics transfers, assembly/disassembly, and reclamation;
♦ processing receipt transactions and documents;
♦ processing capitalization and decapitalization transactions; and
♦ processing material on loan, including government-furnished equipment.
Technical Support
This function involves the determination of technical supply management criteria related to reparability, interchangeability, and usage factors; the determination of preservation, packaging, and marking requirements; the development of weight and cube information; the development, maintenance, and furnishing of drawings or military specifications and standards, purchase descriptions, shelf life codes, deterioration codes, acquisition method codes, or other technical data efforts re- lated to value engineering, reverse engineering, or breakout screening programs. Specific tasks under this function are
♦ receiving, maintaining, and furnishing technical data (e.g., specifications, standards, engineering drawings, and maintenance specifications, limita- tions, standards);
♦ providing technical support to item management, e.g., by reviewing requi- sitions and procurement requests for potential use of other assets (including substitution, cannibalization, use of actions for possible modifi- cation or interchangeability); and advising if nonstock numbered items should be stock numbered;
♦ providing technical support to the cataloging function (e.g., by performing technical review of part-numbered items to identify existing stock- numbered items and to preclude entering duplicate items);
♦ providing technical support to procurement by
B-6

Inventory Control Point Functions
> providing procurement technical data packages,
> identifying possible sources,
>- answering contractors' technical inquiries,
> determining price reasonableness,
>- approving or obtaining approval of requests for waivers, deviations, or alternate items,
>- technically evaluating bids,
>- evaluating freight origin or destination alternatives, and
> validating and revising procurement-method codes, including review- ing sole-source breakout;
♦ determining and coordinating preservation, packaging, packing, and quan- tities in unit packs for assigned items;
♦ proposing and maintaining I&S relationships;
♦ reviewing, recommending, or initiating actions resulting in materiel im- provements and reduction of costs or complexity, including value engi- neering analyses and studies subject to the approval of the using military service;
♦ developing and effecting quality-assurance policies for procurement and storage, reviewing quality assurance provisions of contracts, and process- ing deficiency reports; and
♦ developing and maintaining technical data for
>• depot maintenance reparability standards;
>► specifications and limitations for repair, rebuild, and modification of items; and
>- work and project orders.
Weapon System Secondary Item Supply Support
This function involves actions (beyond normal item-management tasks) taken by the wholesale manager to maintain required levels of supply support for secondary items that apply to weapon systems and major end items. Specific tasks under this function are
B-7
♦ acting as a liaison with program and system managers, acquisition com- mands, contractors, and activities responsible for technical data;
♦ acquiring and maintaining application and essentiality data;
♦ providing intensive management of items according to their criticality; and
♦ reporting supply performance by weapon system.
SICA/USER FUNCTIONS
Allowance/Initial Supply Support List (ISSL) Development
This function involves determining, documenting, delivering, and adjusting sec- ondary-item requirements that support the operational readiness of installed equipment and systems and are specifically tailored to customer and intermediate echelons. Specific tasks under this function are preparing and maintaining allow- ance lists, initial outfitting lists, equipment lists, and load lists and does not in- clude tables of allowance or tables of organization and equipment.
B udgeting/Funding
This function involves the financial planning and resource management associated with the acquisition and maintenance of initial-issue and prepositioned war-reserve inventories of material owned by a military service and with the preparation of planning, programming, and budgeting documents, including the POM. The principal task under this function is to perform financial management and budget support.
Cataloging
This function involves those tasks resulting in the comprehensive logistics data record required to identify, requisition, ship, store, dispose of or make other logis- tics decisions related to an item of supply during its operational lifecycle. The tasks in this process include the following:
♦ Supply support request (SSR) processing—actions involved in processing a military service request to be made a user of an item managed by another military service or agency. Included in this process are the cataloging ac- tions that record user interest, assign management data, and review and ac- cept substitutes offered.
♦ Data recordation and maintenance—those actions necessary to ensure complete, accurate, and current logistics data records (excluding item characteristics data) for an item of supply. Such actions are normally ac-
B-8
Inventory Control Point Functions
complished as a result of item manager requests, system incompatibility notices, tech data revisions, I&S decisions, and periodic record review.
♦ Item management coding—the process of determining whether items of supply qualify for management by the military services rather than by DLA or the General Services Administration (GSA), in accordance with DoD Directive 4140.26-M1.
♦ Data dissemination—all those events and products that provide logistical information to those customers who need it at every level of the supply system. These include
>- access to primary data systems;
> microfiche, hard-copy, and compact-disc products based on those sys- tems; and
>• telephonic information and written communication transmitted by various means.
Configuration Management
This function involves controlling and ensuring visibility of the physical and functional characteristics of items installed in equipment and weapon systems and ensuring form, fit, and functional compatibility of secondary items. The configu- ration management function includes processes such as serial number tracking and commodity modification planning. Specific tasks under this function are
♦ analyzing failure reports and unsatisfactory equipment reports, proposing material improvement projects, and coordinating action with engineering and the configuration control board; and
♦ participating in the configuration management process, including main- taining the status of modification applications.
Customer Services
This function involves customer liaison efforts for the respective military service. Specific tasks under this function are
♦ performing as the military service focal point for resolution of retail- and user-level supply and technical-support problems and
♦ coordinating with foreign countries on military sales.
1 DoD Directive 4140.26-M, "Defense Integrated Materiel Management for Consumable Items," Volume n, Weapon System Oriented Items, August 1972.
B-9

Engineering Services
This function involves using engineering expertise relative to equipment and item management. Specific tasks under this function are
♦ conducting reliability assessments and quality-assurance reviews;
♦ making I&S considerations;
♦ determining assembly definition and material composition;
♦ performing accident and incident investigations and developing subse- quent redesigns, engineering change proposals, and technical orders; and
♦ developing depot maintenance specifications.
Inventory Management
This function involves determining military service needs, developing stock lev- els, and determining and initiating supply actions. It includes DMRD 926 func- tions of requirement determination, distribution, requisition processing, and stock control. Specific tasks under this function are
♦ conducting approval review of controlled-item requisitions before passing them to PICA for action and providing funding authorization for valid requisitioned requirements;
♦ managing prepositioned war reserves (PPWR) for the respective military service, including processes such as requirements determination, funding acquisition, distribution, and stock control;
♦ preparing and submitting requisitions for PPWR materiel to PICA;
♦ preparing and submitting requisitions to PICA for delivery of initial spares to users or to SICA for consolidation and subsequent transshipment;
♦ maintaining accountable and memorandum stock records for initial-issue items and PPWR, establishing and maintaining due-in asset records, and processing receipt, issue, and adjustment transactions;
♦ providing program data to PICA, e.g., troop strength, flying hours, steam- ing hours, and ration factors; and
♦ computing and providing special program requirements to PICA and pre- paring the SSR or the comparable internal document.
B-10
Inventory Control Point Functions
Provisioning
This function involves determining and acquiring the range and quantity of sup- port items necessary to operate and maintain an end item. Specific tasks under this function are
♦ participating in provisioning, including determining the range and depth of support items (does not include international logistics support);
♦ making initial code determinations for the SSR or the comparable internal document, including codes for acquisition advice, item management, pro- curement methods, source, maintainability, recoverability, I&S, and shelf life;
♦ determining and assigning condemnation codes, maintenance replacement factors, and rates for mean time between failures;
♦ instructing contractor personnel on FSC classification principles and pro- visioning screening; and
♦ preparing and submitting—or arranging for—provisioning screening re- quests.
Technical Support
This function involves determining the criteria for technical supply management in terms of reparability, interchangeability, and usage factors; determining re- quirements for preservation, packaging, and marking; developing weight and cube information; developing, maintaining, and furnishing drawings or military specifi- cations standards, purchase descriptions, shelf life codes, deterioration codes, ac- quisition method codes, or other technical data; and efforts related to value engineering, reverse engineering, or breakout screening programs. Specific tasks under this function are
♦ providing application data to PICA;
♦ reviewing proposals for newly developed items for type classification;
♦ collaborating on I&S determination;
♦ reviewing and forwarding material deficiency reports to PICA;
♦ as the technical authority for the using military service, providing technical support to PICA (e.g., providing new and revised technical data and appli- cation data; determining acceptability of substitutes offered by the manu- facturer or PICA; determining the acceptability of deviations, modified items, or waivers; and obtaining and providing engineering coordination);
B-ll
♦ developing, revising, and maintaining data for technical publications; and
♦ analyzing failure reports and unsatisfactory-equipment reports, proposing materiel improvement projects, and coordinating action with engineering and the configuration control board.
Weapon System Management
This function involves the process of planning, organizing, and coordinating the efforts of responsible organizational elements and individuals, beginning with the production phase and continuing through the life of the system, to ensure opera- tional readiness of a weapon system or support system through effective, timely, and economical logistics support. Specific tasks under this function are
♦ performing support capability studies;
♦ performing as the military service focal point for logistics support of as- signed weapon systems;
♦ participating in preparation of all applicable sections of the integrated lo- gistics support plan;
♦ keeping informed of the logistics support status of assigned systems by tracking and analyzing systems readiness and deficiencies, investigating and analyzing causes of excessive failure rates (parts failure, training, and supply), determining action required to correct outstanding deficiencies, and evaluating logistics support problems and ensuring adequate and timely action by appropriate functional elements to resolve such problems;
♦ maintaining liaison with operating commands and other DoD components;
♦ maintaining liaison with all functional elements involved in weapon- system support, including item management, technical support, requisition processing, depot maintenance, and engineering;
♦ developing an annual depot-level maintenance program for assigned weapon and support systems (including proposed work requirements and intervals), negotiating with using commands, and programming and con- trolling funds for depot-level maintenance; and
♦ allocating and scheduling assigned weapon and support systems into or- ganic or commercial depot-level maintenance facilities, initiating pro- curement where applicable, and exercising surveillance over production.
B-12
Appendix C Scoring of Impact
We polled military service subject-matter experts at service logistics headquarters and one inventory control point on the potential impact of transferring ICP func- tions. These experts scored the impact of transferring management of each ICP function against their respective criteria, using either a minus sign, a plus sign, or a zero. A minus sign indicated that the transfer of management for that function would result in a negative impact for that criteria, a plus sign indicated a positive impact, and a zero meant little or no impact. Using the same system, we also scored the impact of transferring each function.
The remainder of this appendix presents a brief description of each function fol- lowed by the impact scoring of each military service for each criterion in Ta- bles C-l through C-19. In Figures C-l through C-19 we show the percentage distributions of negative scores, little- or no-impact scores, and positive scores. Separate distributions are shown for each military service and for our own scor- ing.
The Air Force has two sets of scores for each function—one for the AFMC and one for OC-ALC. We had wanted to get two sets of scores from each military service, but most services gave us one set representing both their logistics head- quarters and ICP positions.
IMM BUDGETING/FUNDING
This function involves financial planning and resource management associated with the acquisition and maintenance of inventories of materiel managed by the IMM; and with the preparation of planning, programming, and budgeting docu- ments, including the POM.
C-l
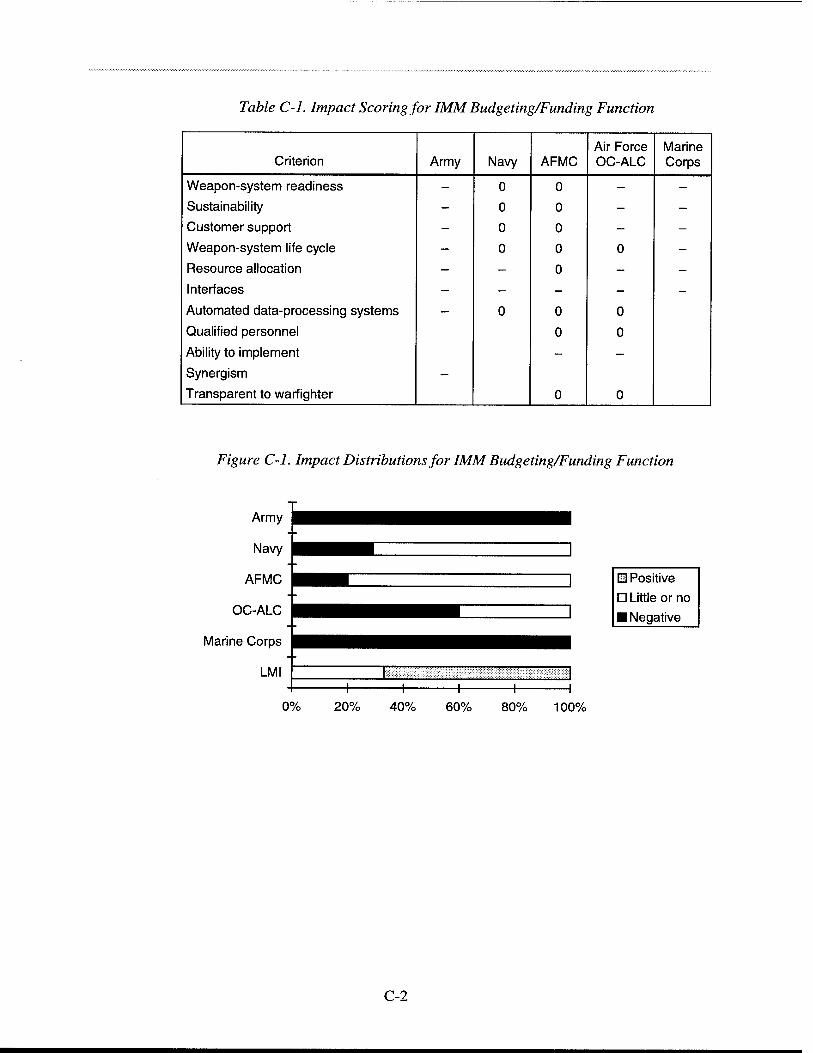
Table C-l. Impact Scoring for IMMBudgeting/Funding Function
Air Force Marine Criterion Army Navy AFMC OC-ALC Corps
Weapon-system readiness - 0 0 - -
Sustainability - 0 0 - -
Customer support - 0 0 - -
Weapon-system life cycle - 0 0 0 -
Resource allocation - - 0 - -
Interfaces - - - - -
Automated data-processing systems - 0 0 0
Qualified personnel 0 0
Ability to implement - -
Synergism -
Transparent to warfighter 0 0
Figure C-l. Impact Distributions for IMM Budgeting/Funding Function
Army
Navy
AFMC
OC-ALC
Marine Corps
- ^^^■i " ■^^ ■ü^^i^
LMI 1 I 1 1 1 1 1
H Positive
D Little or no
■ Negative
0% 20% 40% 60% 80% 100%
C-2
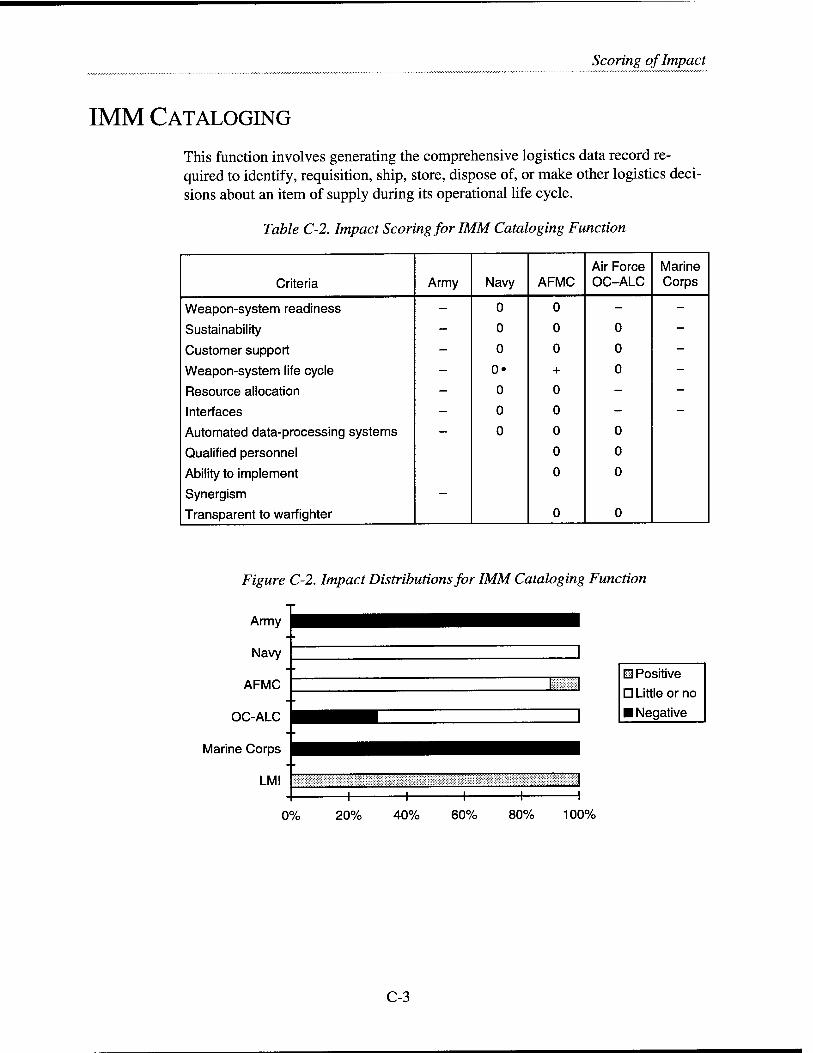
Scoring of Impact
IMM CATALOGING
This function involves generating the comprehensive logistics data record re- quired to identify, requisition, ship, store, dispose of, or make other logistics deci- sions about an item of supply during its operational life cycle.
Table C-2. Impact Scoring for IMM Cataloging Function
Air Force Marine Criteria Army Navy AFMC OC-ALC Corps
Weapon-system readiness - 0 0 - -
Sustainability - 0 0 0 -
Customer support - 0 0 0 -
Weapon-system life cycle - 0« + 0 -
Resource allocation - 0 0 - -
Interfaces - 0 0 - -
Automated data-processing systems - 0 0 0
Qualified personnel 0 0
Ability to implement 0 0
Synergism -
Transparent to warfighter 0 0
Figure C-2. Impact Distributions for IMM Cataloging Function
Army
Navy 1
AFMC 1 1
OC-ALC ^■^^ Marine Corps
LMI 1 1 1 1 1 1
H Positive
D Little or no
■ Negative
0% 20% 40% 60% 80% 100%
C-3

IMM CONTRACTING
This function involves developing, executing, and managing contracts supporting item management, including pre-award and post-award decisions.
Table C-3. Impact Scoring for IMM Contracting Function
Air Force Marine Criteria Army Navy AFMC OC-ALC Corps
Weapon-system readiness - 0 0 - 0 Sustainability - 0 0 0 0 Customer support - - 0 - -
Weapon-system life cycle - 0 0 0 0
Resource allocation - 0 — — 0 Interfaces - - - - —
Automated data-processing systems - 0 0 -
Qualified personnel 0 0
Ability to implement - -
Synergism -
Transparent to warfighter 0 -
Figure C-3. Impact Distributions for IMM Contracting Function
H Positive
D Little or no
■ Negative
0% 20% 40% 60% 80% 100%
C-4

Scoring of Impact
IMM CUSTOMER SERVICES
This function involves the process of expediting procurement and requisition- related repair, issuance, and delivery of urgent item requirements applicable to impaired mission capabilities and work stoppages and includes customer liaison efforts.
Table C-4. Impact Scoring for IMM Customer Services Function
Air Force Marine Criteria Army Navy AFMC OC-ALC Corps
Weapon-system readiness - 0 0 - -
Sustainability 0 0 0 0 -
Customer support - - 0 0 -
Weapon-system life cycle - 0 0 0 -
Resource allocation - 0 0 - -
Interfaces - - - - -
Automated data-processing systems 0 0 0 0
Qualified personnel 0 0
Ability to implement - -
Synergism -
Transparent to warfighter 0 0
Figure C-4. Impact Distributions for IMM Customer Services Function
Army
Navy
AFMC
OC-ALC
■H
Marine Corps
LMI 1 1 1 1 1 1
H Positive
D Little or no
M Negative
0% 20% 40% 60% 80% 100%
C-5
IMM ENGINEERING SUPPORT
This function involves using engineering expertise relative to equipment and item management.
Table C-5. Impact Scoring for IMM Engineering Support Function
Air Force Marine Criteria Army Navy AFMC OC-ALC Corps
Weapon-system readiness - 0 0 - -
Sustainability - 0 0 0 -
Customer support - 0 0 - -
Weapon-system life cycle - 0 0 0 -
Resource allocation - 0 0 - -
Interfaces - - - - -
Automated data-processing systems 0 0 0 0
Qualified personnel 0 -
Ability to implement - -
Synergism -
Transparent to warfighter 0 -
Figure C-5. Impact Distributions for IMM Engineering Support Function
0% 20% 40% 60% 80%
Army
Navy
AFMC
OC-ALC
^■■^^^^^^^M 1
HB1
^
Marine Corps
LMI 1 1 1 1 1
100%
Ü Positive
D Little or no
■ Negative
C-6
Scoring of Impact
IMM ITEM MANAGEMENT
This function involves determining customer needs, selecting the method of man- agement, developing stock levels, and determining and initiating supply actions (i.e., buy, repair, contract termination, distribution, maintenance, and disposal ac- tions). It includes the DMRD 926 functions that involve disposal decisions, distri- bution decisions, maintenance management, and requirements determination.
Table C-6. Impact Scoring for IMM Item Management Function
Air Force Marine Criteria Army Navy AFMC OC-ALC Corps
Weapon-system readiness — 0 0 _
Sustainability — 0 0 0 _
Customer support — 0 0
Weapon-system life cycle — 0 0 0 _
Resource allocation — _ 0 _
Interfaces — —
Automated data-processing systems 0 0 0 0 Qualified personnel 0 0 Ability to implement _
Synergism —
Transparent to warfighter 0 0
Figure C-6. Impact Distributions for IMM Item Management Function
M Positive
D Little or no
■ Negative
80% 100%
C-7
IMM REQUISITION PROCESSING
This function involves receiving, recording, and filling requisitions; maintaining requisition files; researching technical-data; providing status information on req- uisitions; and maintaining liaisons with using activities.
Table C-7. Impact Scoring for IMM Requisition Processing Function
Air Force Marine
Criteria Army Navy AFMC OC-ALC Corps
Weapon-system readiness - 0 0 - -
Sustainability - 0 0 0 " Customer support 0 0 0
Weapon-system life cycle 0 0 0 0 " Resource allocation — 0 0
Interfaces - 0 — —
Automated data-processing systems - 0 0 0
Qualified personnel 0 0
Ability to implement — —
Synergism —
Transparent to warfighter 0 0
Figure C-7. Impact Distributions for IMM Requisition Processing Function
Army ^■^^^^^^"™ Navy 1
11 Positive
D Little or no ■ Negative
AFMC ■^^
OC-ALC P^™^™^™ Marine Corps
LMI I 1 1 1 1 1 ■ 1
0% 20% 40% 60% 80% 100%
C-8
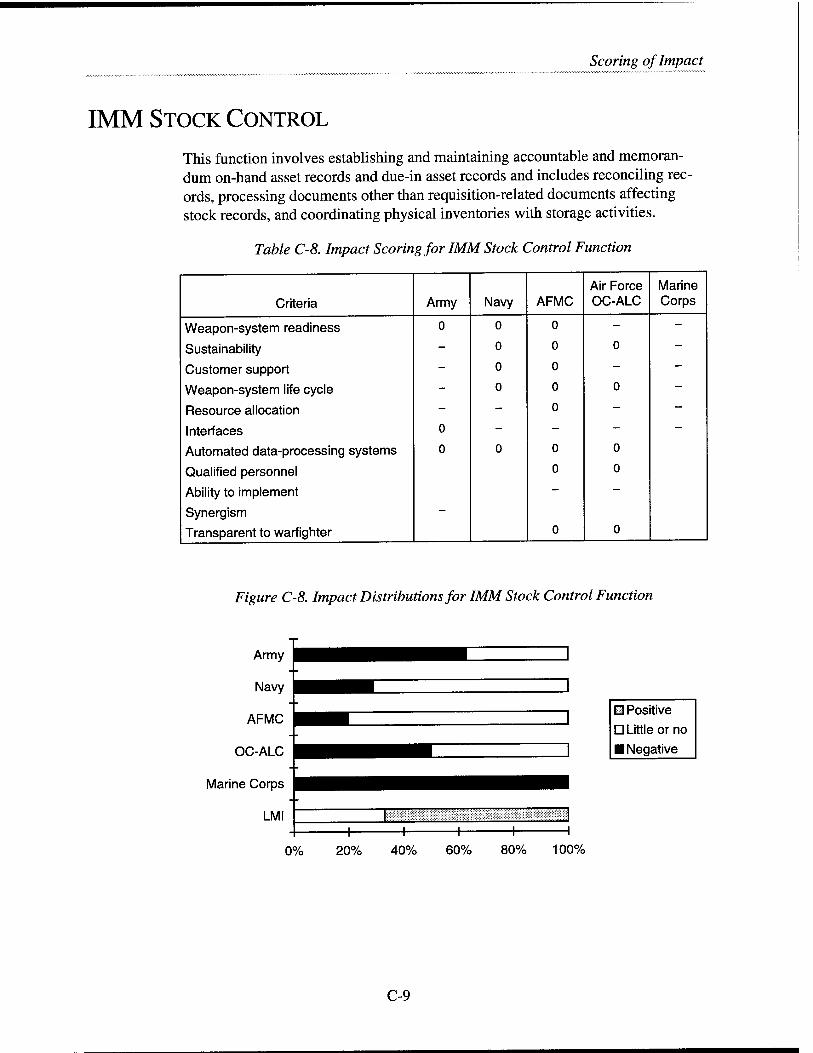
Scoring of Impact
IMM STOCK CONTROL
This function involves establishing and maintaining accountable and memoran- dum on-hand asset records and due-in asset records and includes reconciling rec- ords, processing documents other than requisition-related documents affecting stock records, and coordinating physical inventories with storage activities.
Table C-8. Impact Scoring for IMM Stock Control Function
Air Force Marine Criteria Army Navy AFMC OC-ALC Corps
Weapon-system readiness 0 0 0 - -
Sustainability - 0 0 0 —
Customer support - 0 0 — —
Weapon-system life cycle - 0 0 0 —
Resource allocation - - 0 - —
Interfaces 0 - - - -
Automated data-processing systems 0 0 0 0
Qualified personnel 0 0
Ability to implement - —
Synergism -
Transparent to warfighter 0 0
Figure C-8. Impact Distributions for IMM Stock Control Function
H Positive
D Little or no ■ Negative
0% 20% 40% 60% 80% 100%
C-9
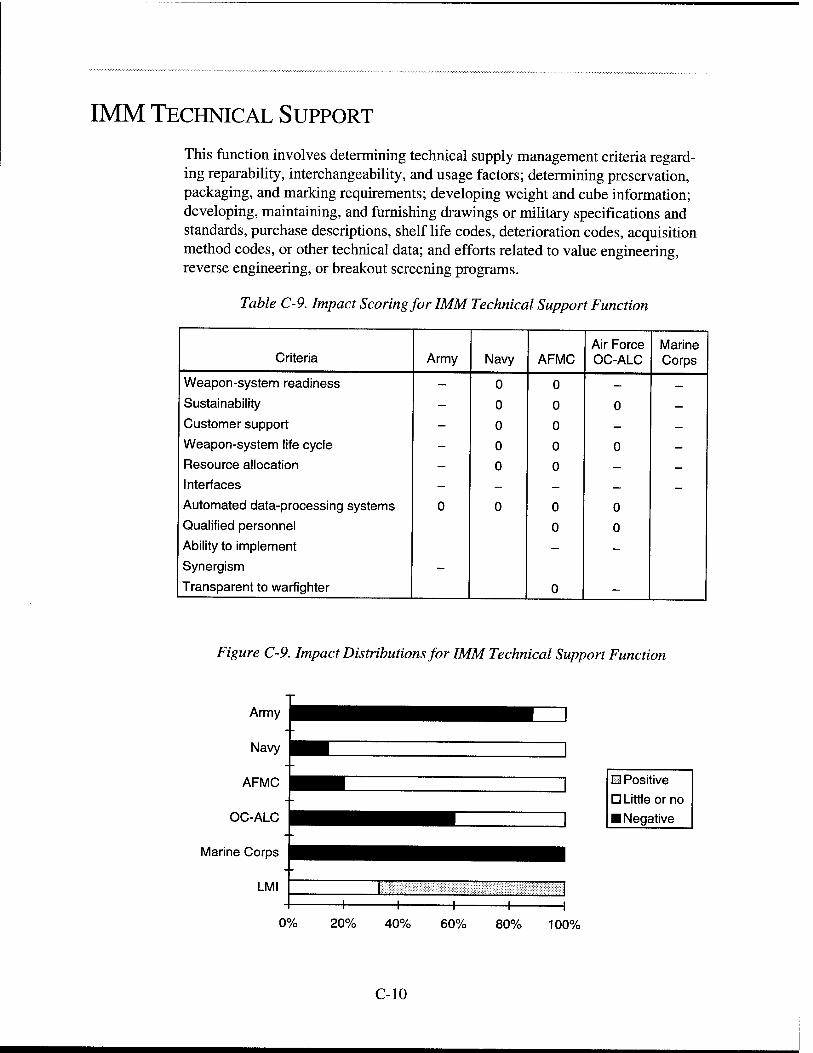
IMM TECHNICAL SUPPORT
This function involves determining technical supply management criteria regard- ing reparability, interchangeability, and usage factors; determining preservation, packaging, and marking requirements; developing weight and cube information; developing, maintaining, and furnishing drawings or military specifications and standards, purchase descriptions, shelf life codes, deterioration codes, acquisition method codes, or other technical data; and efforts related to value engineering, reverse engineering, or breakout screening programs.
Table C-9. Impact Scoring for IMM Technical Support Function
Air Force Marine Criteria Army Navy AFMC OC-ALC Corps
Weapon-system readiness - 0 0 — —
Sustainability - 0 0 0 —
Customer support - 0 0 — —
Weapon-system life cycle - 0 0 0 — Resource allocation - 0 0 — —
Interfaces - — — — —
Automated data-processing systems 0 0 0 0 Qualified personnel 0 0 Ability to implement - - Synergism -
Transparent to warfighter 0 -
Figure C-9. Impact Distributions for IMM Technical Support Function
Army
Navy
AFMC
OC-ALC
■■^^■I^H^^HH ■™ ^""
I^^^^MI^M
Marine Corps
LMI I I I 1 \ 1 1 1
U Positive D Little or no ■ Negative
0% 20% 40% 60% 80% 100%
C-10
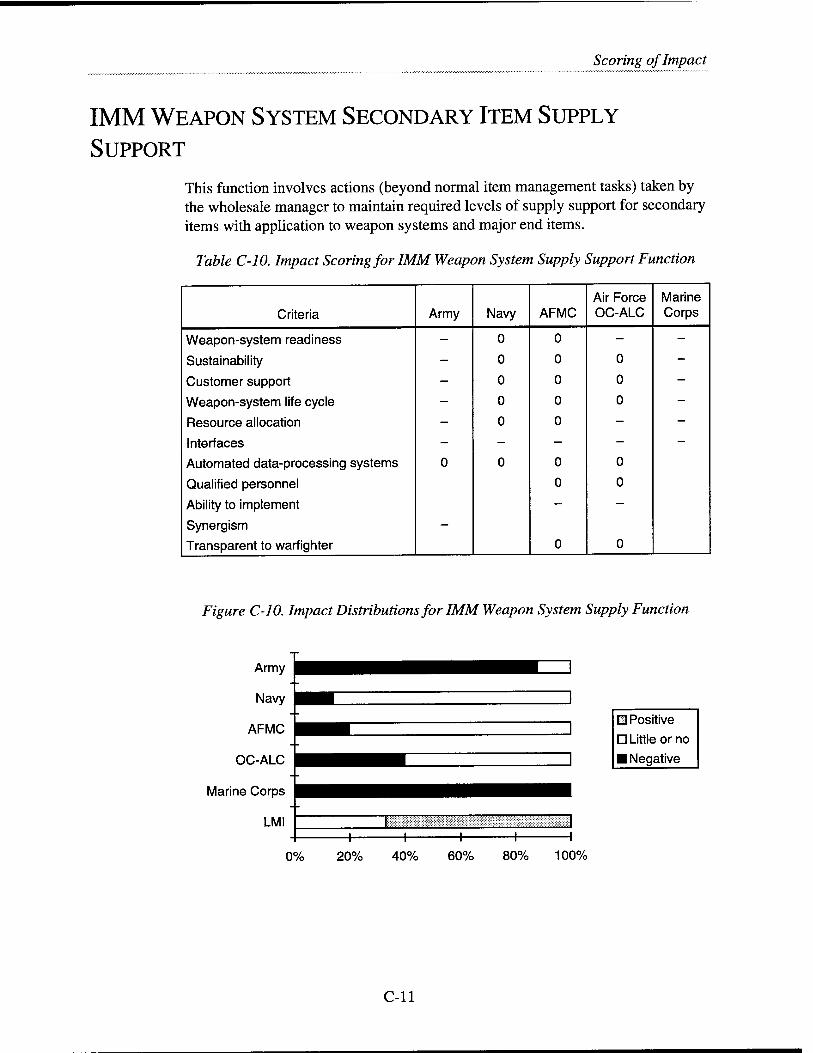
Scoring of Impact
IMM WEAPON SYSTEM SECONDARY ITEM SUPPLY
SUPPORT
This function involves actions (beyond normal item management tasks) taken by the wholesale manager to maintain required levels of supply support for secondary items with application to weapon systems and major end items.
Table C-10. Impact Scoring for IMM Weapon System Supply Support Function
Air Force Marine Criteria Army Navy AFMC OC-ALC Corps
Weapon-system readiness - 0 0 - -
Sustainability - 0 0 0 -
Customer support - 0 0 0 -
Weapon-system life cycle - 0 0 0 -
Resource allocation - 0 0 - -
Interfaces - - - - -
Automated data-processing systems 0 0 0 0
Qualified personnel 0 0
Ability to implement - -
Synergism -
Transparent to warfighter 0 0
Figure C-10. Impact Distributions for IMM Weapon System Supply Function
Army
Navy
AFMC
OC-ALC
Marine Corps
LMI 4- H
II Positive
D Little or no
■ Negative
0% 20% 40% 60% 80% 100%
C-ll
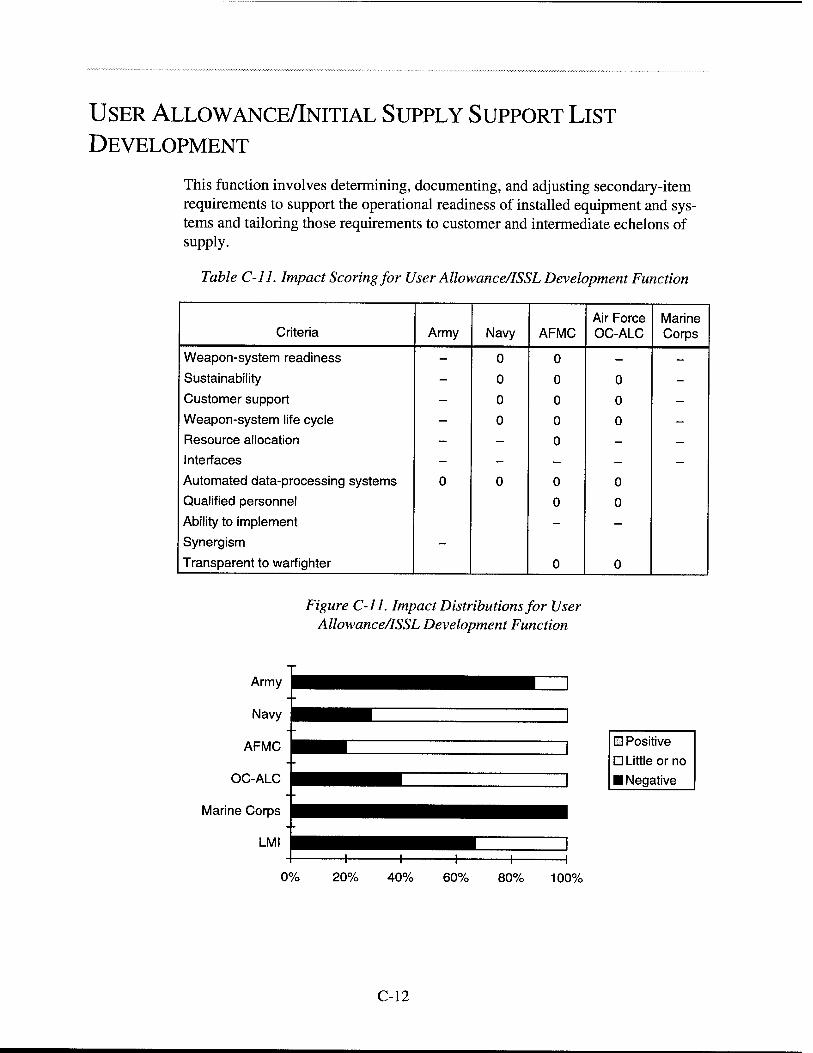
USER ALLOWANCE/INITIAL SUPPLY SUPPORT LIST
DEVELOPMENT
This function involves determining, documenting, and adjusting secondary-item requirements to support the operational readiness of installed equipment and sys- tems and tailoring those requirements to customer and intermediate echelons of supply.
Table C-ll. Impact Scoring for User Allowance/ISSL Development Function
Air Force Marine Criteria Army Navy AFMC OC-ALC Corps
Weapon-system readiness - 0 0 - -
Sustainability - 0 0 0 -
Customer support - 0 0 0 -
Weapon-system life cycle - 0 0 0 - Resource allocation - - 0 - —
Interfaces - - - — —
Automated data-processing systems 0 0 0 0
Qualified personnel 0 0
Ability to implement - -
Synergism -
Transparent to warfighter 0 0
Figure C-ll. Impact Distributions for User Allowance/ISSL Development Function
M Positive
D Little or no
■ Negative
100%
C-12
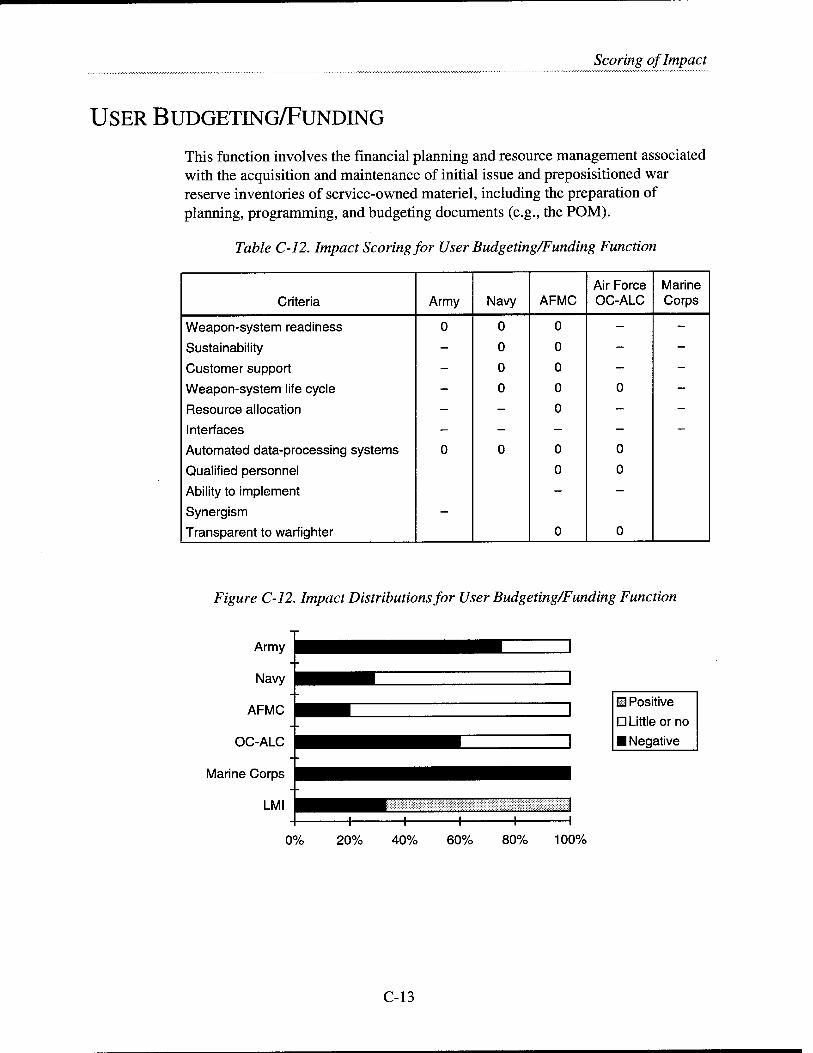
Scoring of Impact
USER BUDGETING/FUNDING
This function involves the financial planning and resource management associated with the acquisition and maintenance of initial issue and preposisitioned war reserve inventories of service-owned materiel, including the preparation of planning, programming, and budgeting documents (e.g., the POM).
Table C-12. Impact Scoring for User Budgeting/Funding Function
Air Force Marine Criteria Army Navy AFMC OC-ALC Corps
Weapon-system readiness 0 0 0 - -
Sustainability - 0 0 - -
Customer support - 0 0 - -
Weapon-system life cycle - 0 0 0 -
Resource allocation - - 0 - -
Interfaces - - - - -
Automated data-processing systems 0 0 0 0
Qualified personnel 0 0
Ability to implement - -
Synergism -
Transparent to warfighter 0 0
Figure C-12. Impact Distributions for User Budgeting/Funding Function
0% 20% 40% 60% 80% 100%
H Positive
D Little or no
■ Negative
C-13
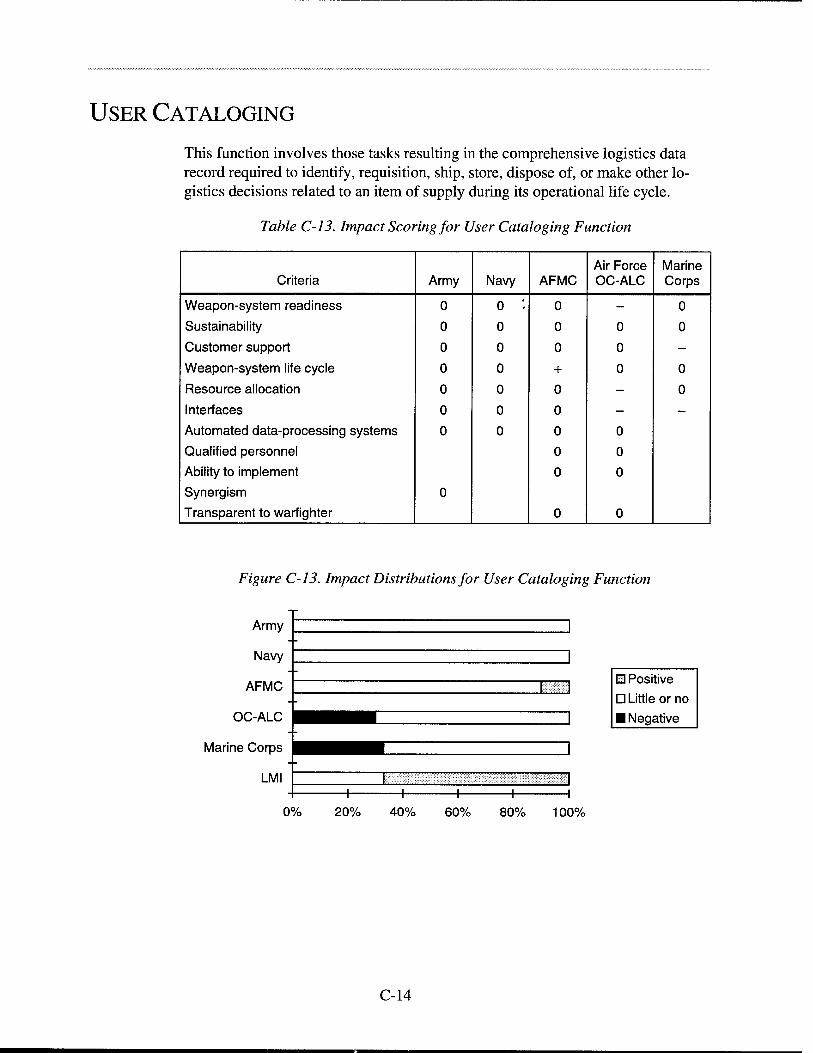
USER CATALOGING
This function involves those tasks resulting in the comprehensive logistics data record required to identify, requisition, ship, store, dispose of, or make other lo- gistics decisions related to an item of supply during its operational life cycle.
Table C-13. Impact Scoring for User Cataloging Function
Air Force Marine Criteria Army Navy AFMC OC-ALC Corps
Weapon-system readiness 0 0 '. 0 - 0
Sustainability 0 0 0 0 0
Customer support 0 0 0 0 -
Weapon-system life cycle 0 0 + 0 0
Resource allocation 0 0 0 - 0
Interfaces 0 0 0 - -
Automated data-processing systems 0 0 0 0
Qualified personnel 0 0
Ability to implement 0 0
Synergism 0
Transparent to warfighter 0 0
Figure C-13. Impact Distributions for User Cataloging Function
Army
Navy
AFMC
OC-ALC
Marine Corps
LMI
rzi
+ 0% 20%
A
H Positive
D Little or no
■ Negative
40% 60% 80% 100%
C-14
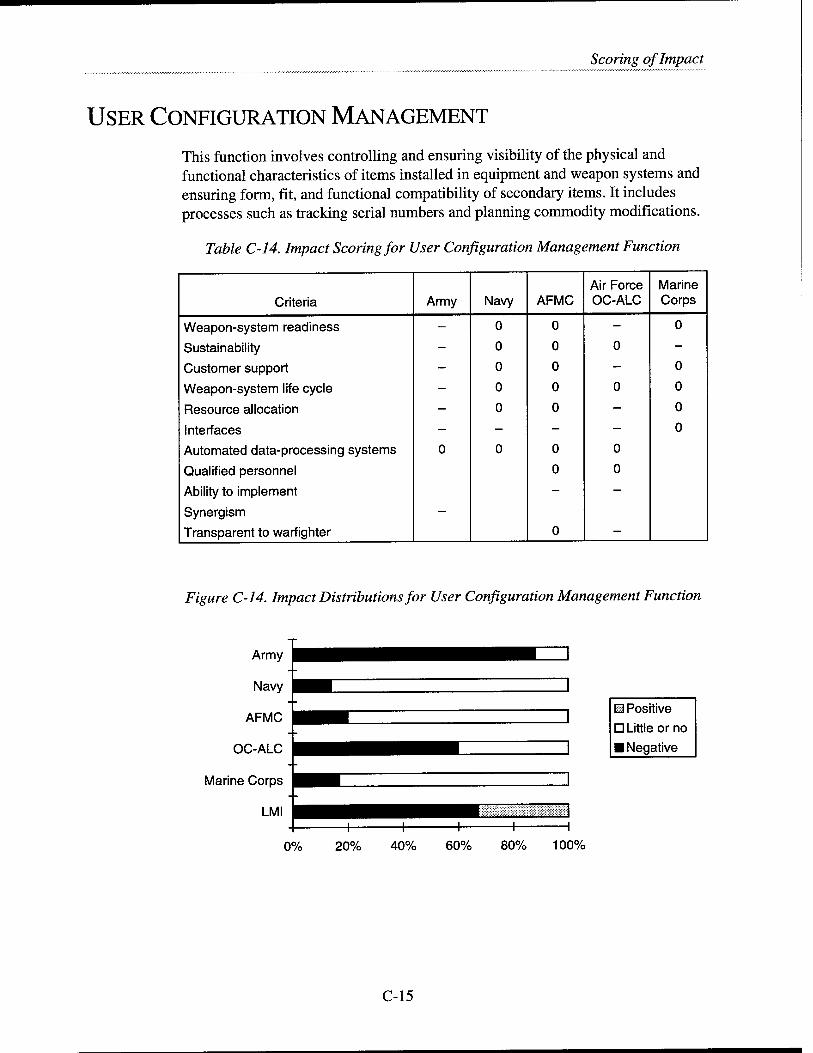
Scoring of Impact
USER CONFIGURATION MANAGEMENT
This function involves controlling and ensuring visibility of the physical and functional characteristics of items installed in equipment and weapon systems and ensuring form, fit, and functional compatibility of secondary items. It includes processes such as tracking serial numbers and planning commodity modifications.
Table C-14. Impact Scoring for User Configuration Management Function
Air Force Marine Criteria Army Navy AFMC OC-ALC Corps
Weapon-system readiness - 0 0 - 0
Sustainability - 0 0 0 -
Customer support - 0 0 - 0
Weapon-system life cycle - 0 0 0 0
Resource allocation - 0 0 - 0
Interfaces - - - - 0
Automated data-processing systems 0 0 0 0
Qualified personnel 0 0
Ability to implement - -
Synergism -
Transparent to warfighter 0 -
Figure C-14. Impact Distributions for User Configuration Management Function
H Positive
D Little or no
■ Negative
0% 20% 40% 60% 80% 100%
C-15
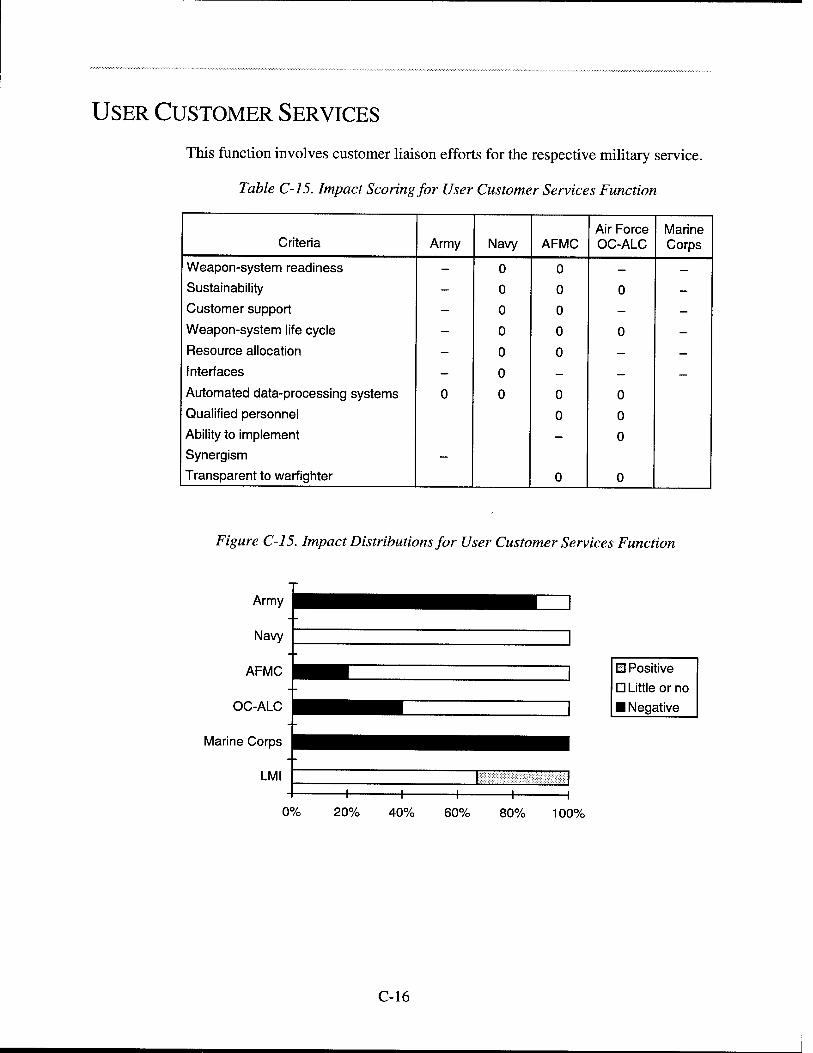
USER CUSTOMER SERVICES
This function involves customer liaison efforts for the respective military service.
Table C-15. Impact Scoring for User Customer Services Function
Air Force Marine Criteria Army Navy AFMC OC-ALC Corps
Weapon-system readiness - 0 0 — —
Sustainability - 0 0 0 —
Customer support - 0 0 - -
Weapon-system life cycle - 0 0 0 -
Resource allocation - 0 0 — —
Interfaces - 0 — — —
Automated data-processing systems 0 0 0 0 Qualified personnel 0 0 Ability to implement - 0 Synergism -
Transparent to warfighter 0 0
Figure C-15. Impact Distributions for User Customer Services Function
Army
Navy
AFMC
OC-ALC
Marine Corps
LMI
Ü Positive
D Little or no
■ Negative
20% 40% 60% 80% 100%
C-16
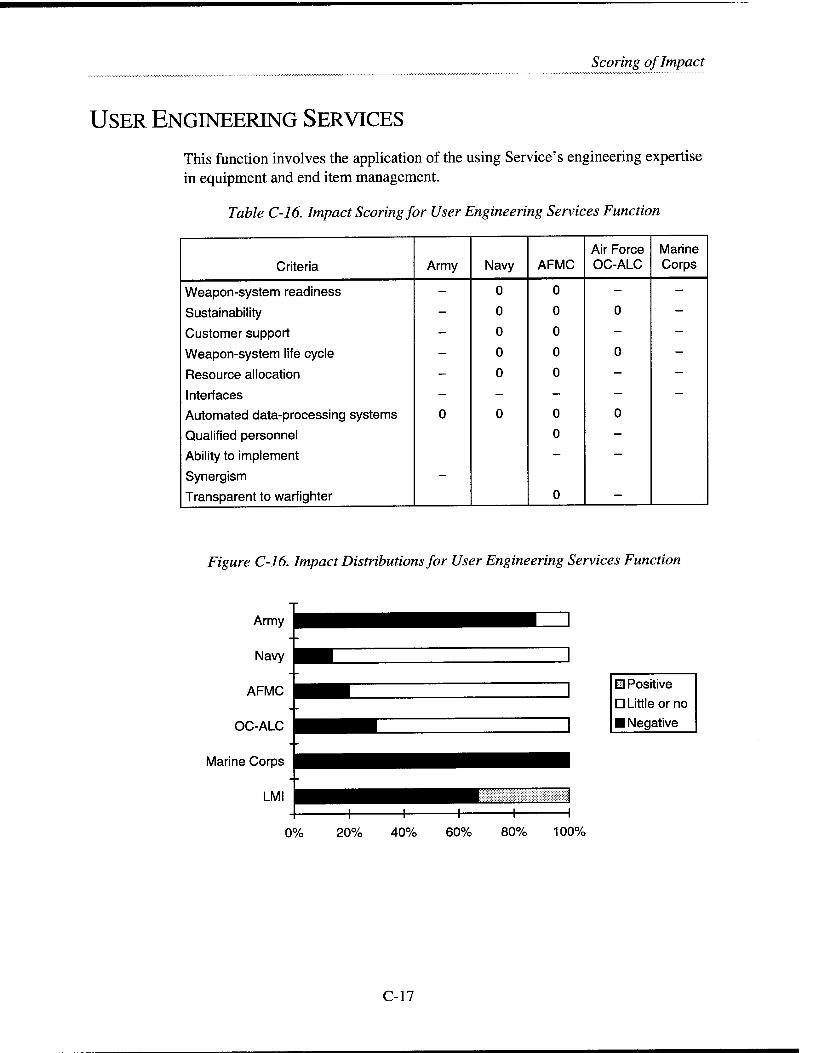
Scoring of Impact
USER ENGINEERING SERVICES
This function involves the application of the using Service's engineering expertise in equipment and end item management.
Table C-16. Impact Scoring for User Engineering Services Function
Air Force Marine Criteria Army Navy AFMC OC-ALC Corps
Weapon-system readiness - 0 0 - -
Sustainability - 0 0 0 -
Customer support - 0 0 - —
Weapon-system life cycle - 0 0 0 -
Resource allocation - 0 0 - -
Interfaces - - - - -
Automated data-processing systems 0 0 0 0
Qualified personnel 0 -
Ability to implement - -
Synergism -
Transparent to warfighter 0 -
Figure C-16. Impact Distributions for User Engineering Services Function
H Positive
D Little or no ■ Negative
0% 20% 40% 60% 80% 100%
C-17
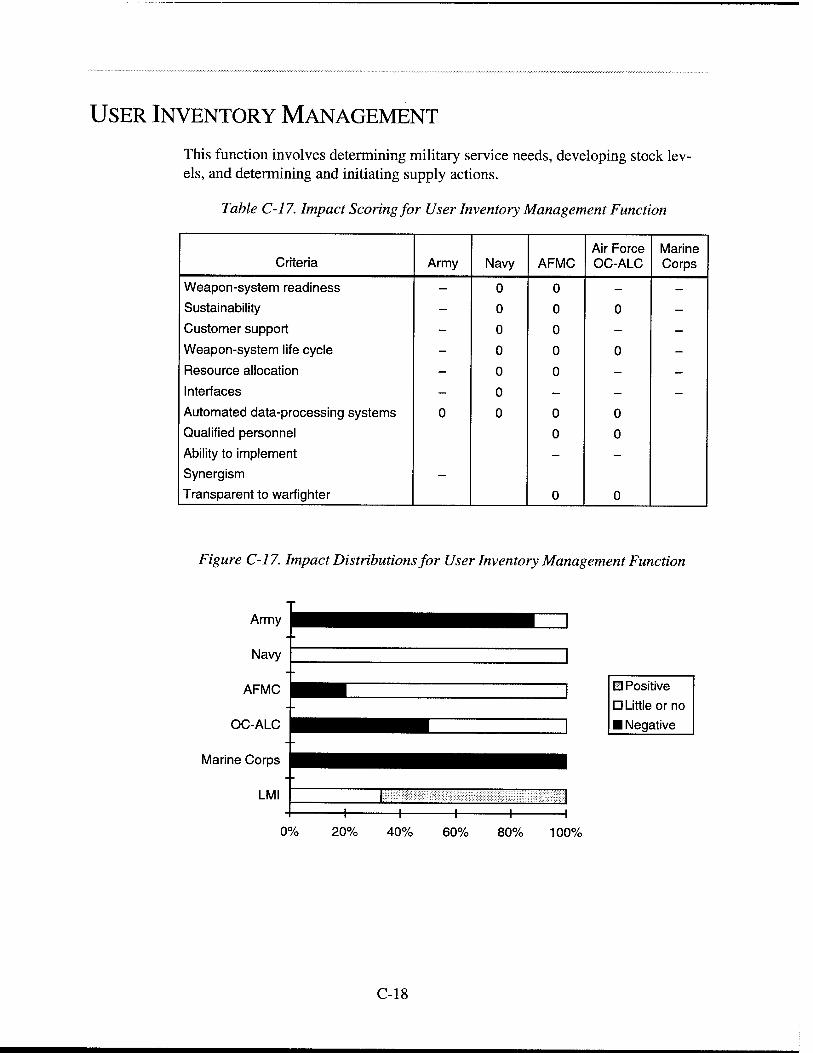
USER INVENTORY MANAGEMENT
This function involves determining military service needs, developing stock lev- els, and determining and initiating supply actions.
Table C-17. Impact Scoring for User Inventory Management Function
Air Force Marine Criteria Army Navy AFMC OC-ALC Corps
Weapon-system readiness - 0 0 - -
Sustainability - 0 0 0 -
Customer support - 0 0 - -
Weapon-system life cycle - 0 0 0 -
Resource allocation - 0 0 - —
Interfaces - 0 - - —
Automated data-processing systems 0 0 0 0
Qualified personnel 0 0
Ability to implement - - Synergism -
Transparent to warfighter 0 0
Figure C-17. Impact Distributions for User Inventory Management Function
0%
Army ^m^^mu^^^mm i Navy i
AFMC
OC-ALC
™™ ^^^^^M
Marine Corps
LMI t 1 1 1 1 1 (
H Positive D Little or no
■ Negative
20% 40% 60% 80% 100%
C-18
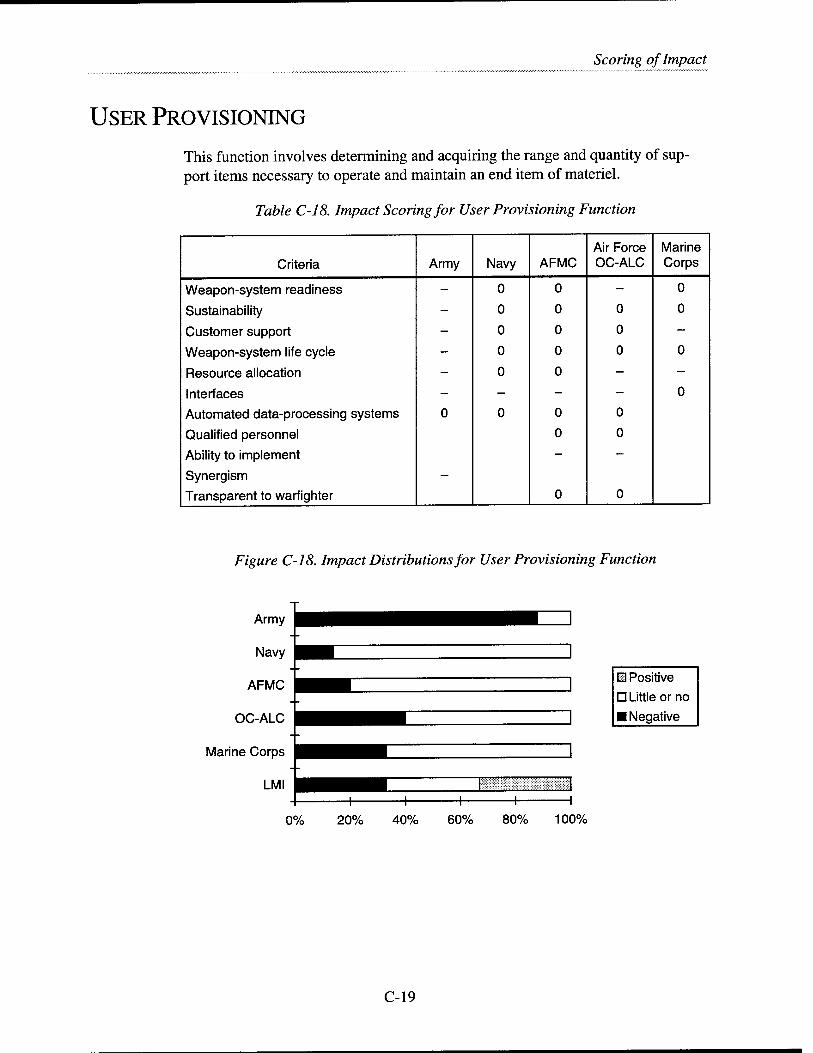
Scoring of Impact
USER PROVISIONING
This function involves determining and acquiring the range and quantity of sup- port items necessary to operate and maintain an end item of materiel.
Table C-18. Impact Scoring for User Provisioning Function
Air Force Marine Criteria Army Navy AFMC OC-ALC Corps
Weapon-system readiness - 0 0 - 0
Sustainability - 0 0 0 0
Customer support - 0 0 0 -
Weapon-system life cycle - 0 0 0 0
Resource allocation - 0 0 - -
Interfaces - - - - 0
Automated data-processing systems 0 0 0 0
Qualified personnel 0 0
Ability to implement - -
Synergism -
Transparent to warfighter 0 0
Figure C-18. Impact Distributions for User Provisioning Function
0% 20% 40% 60% 80% 100%
H Positive
D Little or no
■ Negative
C-19
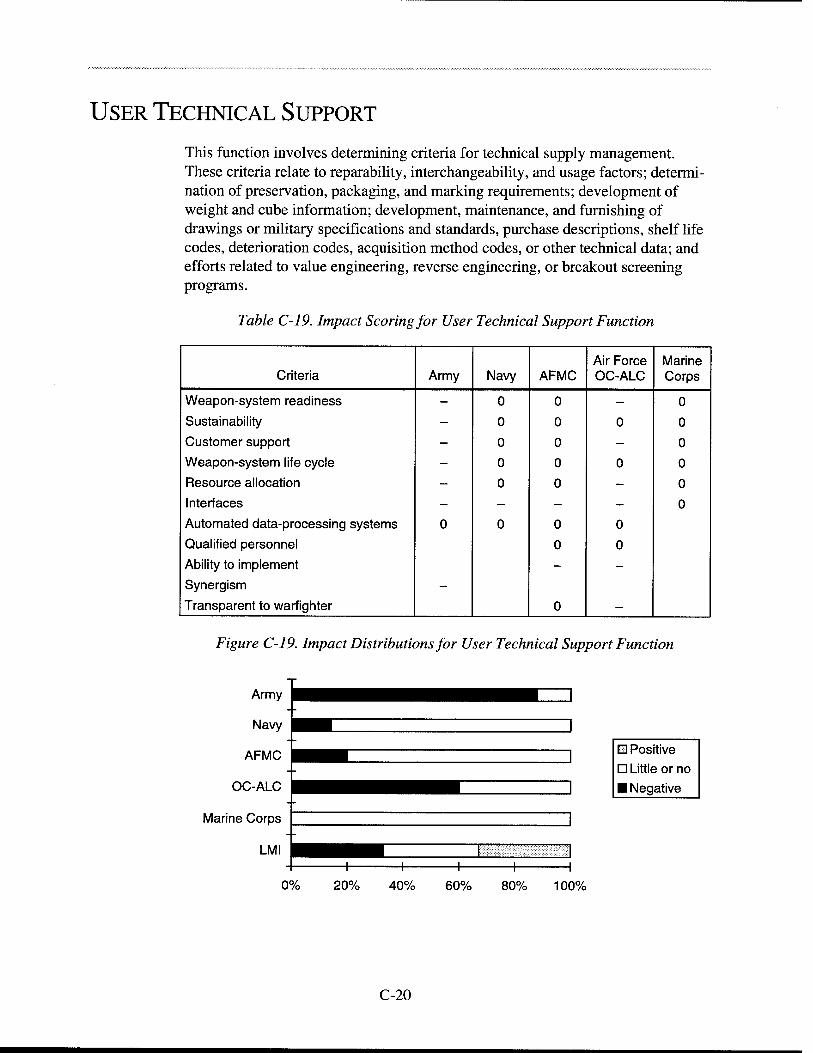
USER TECHNICAL SUPPORT
This function involves determining criteria for technical supply management. These criteria relate to reparability, interchangeability, and usage factors; determi- nation of preservation, packaging, and marking requirements; development of weight and cube information; development, maintenance, and furnishing of drawings or military specifications and standards, purchase descriptions, shelf life codes, deterioration codes, acquisition method codes, or other technical data; and efforts related to value engineering, reverse engineering, or breakout screening programs.
Table C-19. Impact Scoring for User Technical Support Function
Air Force Marine Criteria Army Navy AFMC OC-ALC Corps
Weapon-system readiness - 0 0 - 0
Sustainability - 0 0 0 0
Customer support - 0 0 - 0
Weapon-system life cycle - 0 0 0 0
Resource allocation - 0 0 - 0
Interfaces - - - - 0
Automated data-processing systems 0 0 0 0
Qualified personnel 0 0
Ability to implement - -
Synergism -
Transparent to warfighter 0 -
Figure C-19. Impact Distributions for User Technical Support Function
Army
Navy
AFMC
OC-ALC
i^B
^■B" ^^^■■^^^M
Marine Corps 1
LMI ^■■^H 1 1 1 1 i
0% 20% 40% 60% 80% 100%
H Positive
D Little or no
■ Negative
C-20
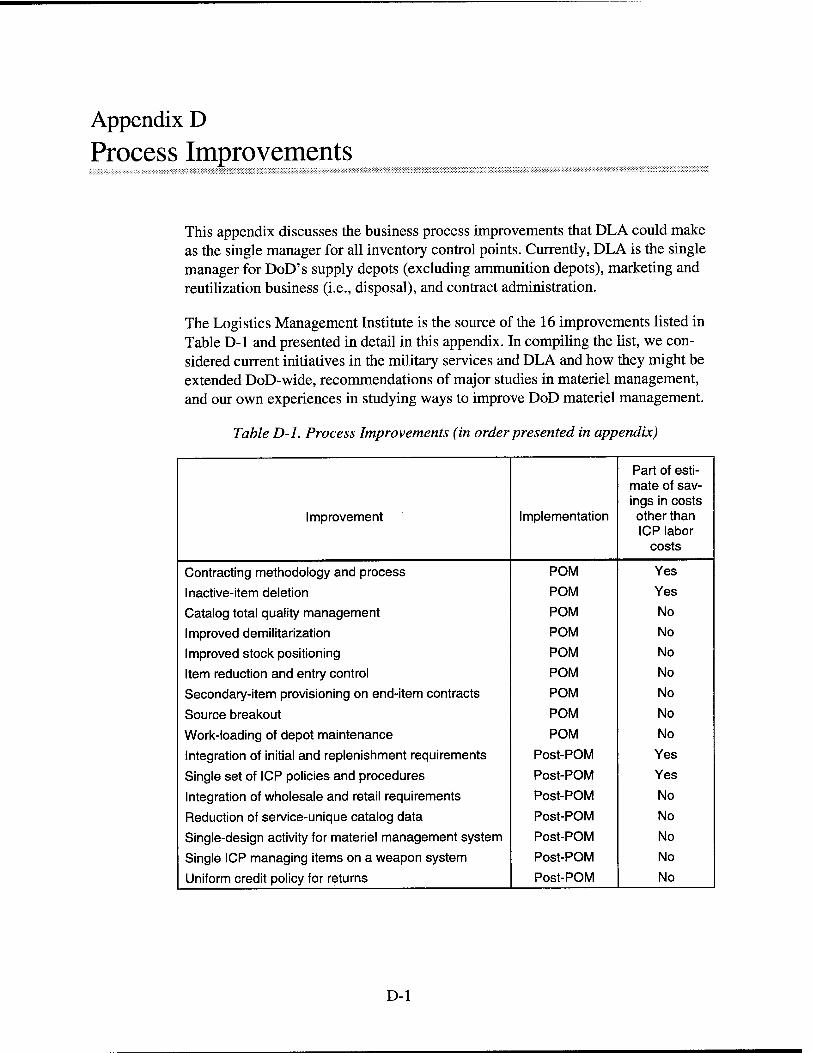
Appendix D
Process Improvements
This appendix discusses the business process improvements that DLA could make as the single manager for all inventory control points. Currently, DLA is the single manager for DoD's supply depots (excluding ammunition depots), marketing and reutilization business (i.e., disposal), and contract administration.
The Logistics Management Institute is the source of the 16 improvements listed in Table D-l and presented in detail in this appendix. In compiling the list, we con- sidered current initiatives in the military services and DLA and how they might be extended DoD-wide, recommendations of major studies in materiel management, and our own experiences in studying ways to improve DoD materiel management.
Table D-l. Process Improvements (in order presented in appendix)
Part of esti- mate of sav- ings in costs
Improvement Implementation other than ICP labor
costs
Contracting methodology and process POM Yes
Inactive-item deletion POM Yes
Catalog total quality management POM No
Improved demilitarization POM No
Improved stock positioning POM No
Item reduction and entry control POM No
Secondary-item provisioning on end-item contracts POM No
Source breakout POM No
Work-loading of depot maintenance POM No
Integration of initial and replenishment requirements Post-POM Yes
Single set of ICP policies and procedures Post-POM Yes
Integration of wholesale and retail requirements Post-POM No
Reduction of service-unique catalog data Post-POM No
Single-design activity for materiel management system Post-POM No
Single ICP managing items on a weapon system Post-POM No
Uniform credit policy for returns Post-POM No
D-l
CONTRACTING METHODOLOGY AND PROCESS
This process improvement would improve the efficiency of contracting by empha- sizing corporate contracting (i.e., combining all military service and DLA pro- curement requirements from a vendor on a contract that all can use) and reduced lead times in policies and procedures. Savings from this improvement are in- cluded in our bottom-up estimate of savings in costs other than ICP labor costs.
Description of Improvement
For purposes of this improvement, items and their procurements fall into two categories—those that lend themselves to multiple-year, multiple-item, indefinite- delivery contracts and those that do not. We will refer to these items and procure- ments as Category A and Category B, respectively.
For Category A, DLA would review all of the items that are normally procured from common industry sources and establish individual 4- to 5-year contracts with those sources. The contracts would be either requirement or indefinite-quantity type (when maintaining more than one source is desirable, indefinite-quantity contracts would be used). To maximize the number of contracts reduced during the POM phase, in those instances where both a former military service ICP and a current DLA ICP have a significant number of items from a common source, one ICP would be designated as the lead activity for awarding a single contract. Im- plementation would take from 4 to 6 years and would not begin until at least year 2 of the POM period.
Once Category A contracts are in place, orders could be placed frequently (e.g., daily for direct delivery orders, weekly or monthly for stock orders). Administra- tive lead-time (ALT) for these orders would be one or two days, a considerable reduction over the normal administrative time for a procurement. We would also anticipate a substantial reduction in production lead-time (PLT), as the commer- cial source would be supplying smaller and more regular orders.
Category A contracting offers several advantages:
♦ The transition from multiple contracts to a single contract for a source of supply would reduce contracting and contract administration workload by several orders of magnitude.
♦ The transition from multiple procurements to multiple delivery orders against a single contract should also significantly reduce inventory man- agement and technical workload, since the labor required to process a pro- curement is much greater than that required for a direct order.
♦ As previously noted, ALT would become insignificant and PLT would be reduced significantly.
D-2
Process Improvements
♦ Establishing a broad-based, long-term relationship with sources of supply should result in lower acquisition prices.
♦ A one-time postponement of obligations should occur, as a one-time delay in procurements would take place to account for shorter production lead- times and that delay will cause funds to be obligated later.
♦ The reductions in ALT and PLT, coupled with direct vendor delivery, would reduce safety-level requirements.
♦ The lower cost of processing a delivery order versus a procurement will reduce order quantities and this in turn will reduce on-hand inventory and inventory holding costs.
♦ ALT and PLT reductions would cause orders to be placed closer in time to actual demand and the results could be less overstockage and understock- age and more responsiveness to customer orders with less inventory in- vestment.
For Category B items and their procurements, we anticipate that DLA processes (not requiring major system changes) would be applied to reduce ALT. We would also anticipate that DLA would include, for bid evaluation, PLT factors as well as price in their invitations to bid and this would provide incentives to contractors to reduce delivery times. We would also foresee the use of phased deliveries to re- duce production lead-times.
Category B contracting offers two advantages:
♦ Reductions in ALT and PLT will result in lower safety levels with associ- ated reductions in inventory and holding costs.
♦ The lower times would also result in a contracting system that is more re- sponsive to changing materiel requirements.
Costs and Benefits
For Category A contracts, DLA would incur the cost of establishing multiple-year, multiple-item contracts. We foresee no additional costs for Category B contract- ing, as those actions could be taken within current staffing levels.
Tangible benefits from both categories of improvement would include savings in direct and indirect personnel (in the functions of inventory management, con- tracting, and technical support), inventory investment, and acquisition costs. (Less tangible savings could occur in contract administration costs.)
D-3

Intangible benefits would include a more responsive acquisition process to changing materiel requirements and less paperwork for the government and prime contractors as the number of contracts between the two parties decreases.
Expected Period of Savings
We assumed that it would take DLA one year (FY98) to promulgate new con- tracting policies and another year (FY99) to award the first indefinite delivery contracts. Therefore, costs would start to accrue in year 2 of the POM period, while savings would start to accrue in year 3 of the POM period (FYOO) and con- tinue into the post-POM period.
Analysis of Savings
To estimate savings, we used the following data sources:
♦ The September 1995 budget estimate submissions (BESs) of the military services provided the dollar value and number of days for each of their re- quirement levels (i.e., safety levels, ALT and PLT levels, and procure- ment-cycle quantities). For the Army, consumable and reparable item levels are combined, but we were able to use March 1994 stratification re- ports to obtain the consumable-to-reparable ratios to split the levels.
♦ The number and value of procurement actions were obtained from the DMRD 926, ICP Consolidation Study, data; the CORM data for the mili- tary services; and data provided to OSD ICP benchmarking study and pro- vided by DLA.
Table D-2 summarizes our savings estimates in ICP labor costs. We did not in- clude these savings separately in our process improvement estimates but used them to justify our process improvement savings percentages in ICP labor costs during the POM and post-POM periods.
Table D-2. Category A Labor Savings
Dollar savings Overall reduction in Fiscal year FTE reduction (in millions) procurement related labor
1999 (33) $(1.6) -1% 2000 113 $5.6 2% 2001 260 $12.8 5% 2002 406 $20.0 8% 2003 553 $27.2 10% 2004- 670 $33.0 13% Note: Numbers in parentheses are negative.
D-4
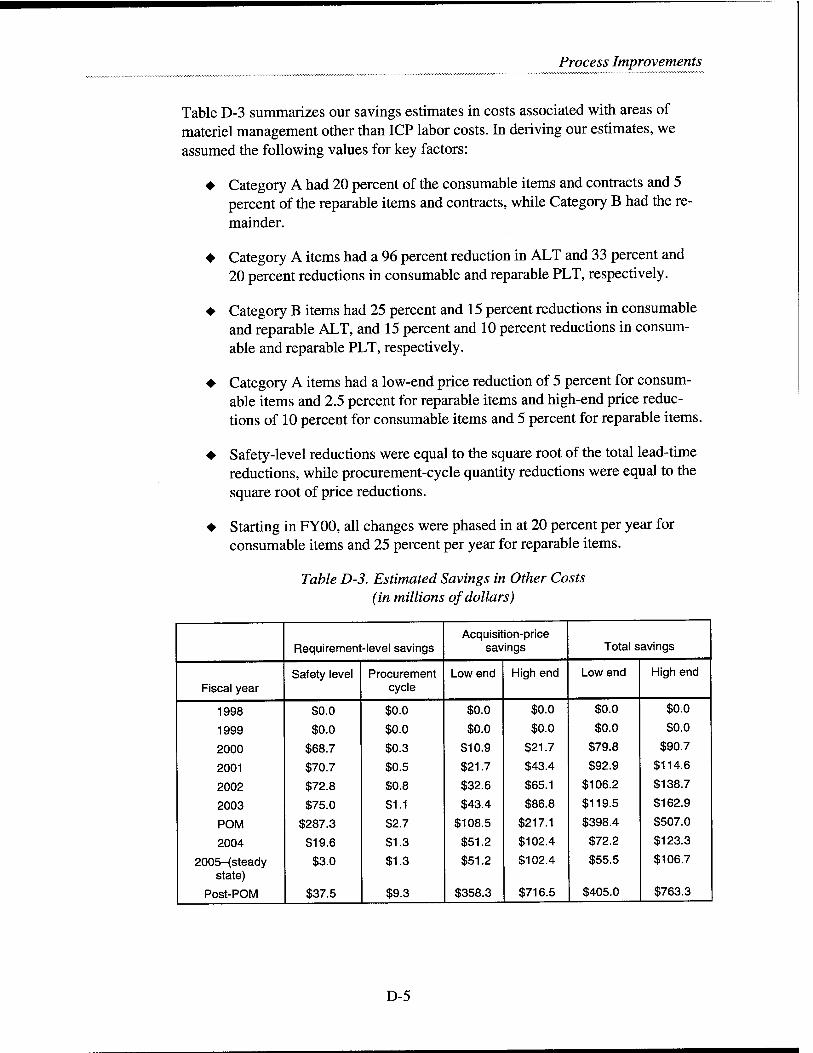
Process Improvements
Table D-3 summarizes our savings estimates in costs associated with areas of materiel management other than ICP labor costs. In deriving our estimates, we assumed the following values for key factors:
♦ Category A had 20 percent of the consumable items and contracts and 5 percent of the reparable items and contracts, while Category B had the re- mainder.
♦ Category A items had a 96 percent reduction in ALT and 33 percent and 20 percent reductions in consumable and reparable PLT, respectively.
♦ Category B items had 25 percent and 15 percent reductions in consumable and reparable ALT, and 15 percent and 10 percent reductions in consum- able and reparable PLT, respectively.
♦ Category A items had a low-end price reduction of 5 percent for consum- able items and 2.5 percent for reparable items and high-end price reduc- tions of 10 percent for consumable items and 5 percent for reparable items.
♦ Safety-level reductions were equal to the square root of the total lead-time reductions, while procurement-cycle quantity reductions were equal to the square root of price reductions.
♦ Starting in FY00, all changes were phased in at 20 percent per year for consumable items and 25 percent per year for reparable items.
Table D-3. Estimated Savings in Other Costs (in millions of dollars)
Requirement -level savings Acquisition-price
savings Total savings
Fiscal year Safety level Procurement
cycle Low end High end Low end High end
1998 $0.0 $0.0 $0.0 $0.0 $0.0 $0.0
1999 $0.0 $0.0 $0.0 $0.0 $0.0 $0.0
2000 $68.7 $0.3 $10.9 $21.7 $79.8 $90.7
2001 $70.7 $0.5 $21.7 $43.4 $92.9 $114.6
2002 $72.8 $0.8 $32.6 $65.1 $106.2 $138.7
2003 $75.0 $1.1 $43.4 $86.8 $119.5 $162.9
POM $287.3 $2.7 $108.5 $217.1 $398.4 $507.0
2004 $19.6 $1.3 $51.2 $102.4 $72.2 $123.3
2005-(steady state)
Post-POM
$3.0
$37.5
$1.3
$9.3
$51.2
$358.3
$102.4
$716.5
$55.5
$405.0
$106.7
$763.3
D-5
INACTIVE-ITEM DELETION
This process improvement would involve a one-time major action to delete the number of inactive items and thus reduce the staffing requirements associated with item management and the costs associated with maintaining unneeded mate- riel. Savings from this improvement are included in our bottom-up post-POM es- timate of savings in costs other than ICP labor costs.
Description of Improvement
A significant portion of the items in the DoD catalog have had no demands for one or more years. The Defense Inactive Item Program (DIIP) is supposed to re- view and delete inactive items annually. However, the current organizational boundaries between DLA item managers and military service ICP personnel who are managing user application files tends to reduce emphasis on the program and thereby favors the retention of inactive items.
DLA could strengthen the program by promoting mechanized processes that would enable registered users of an inactive item to identify current applications and expected life of the applications. For example, items that have Air Force reg- istered users would be checked against the Air Force Stock Number User Direc- tory files, while Navy registered items would be checked against Navy allowance files (i.e., shipboard, aviation, and shore-based allowances). Items without de- mands would be checked for assets. Those items with assets would be further checked against procurement histories for date of last procurement, transaction registers for date of last activity, catalog records for date of entry into the catalog system, and provisioning records to try to identify item applications. Items that fail to pass any mechanized processes for activity identification would be prime candidates for deletion from the catalog.
The number of inactive items could be as high as 1 million items. A major reduc- tion in this number of items could
♦ improve management information by eliminating items without applica- tion or use and simplify the cataloging workload,
♦ dispose of the inventory of those items no longer used by DoD,
♦ reduce the number of items assigned to inventory managers, and
♦ lead to improvement in the quality of application data as DIIP increases the attention given to those data.
D-6
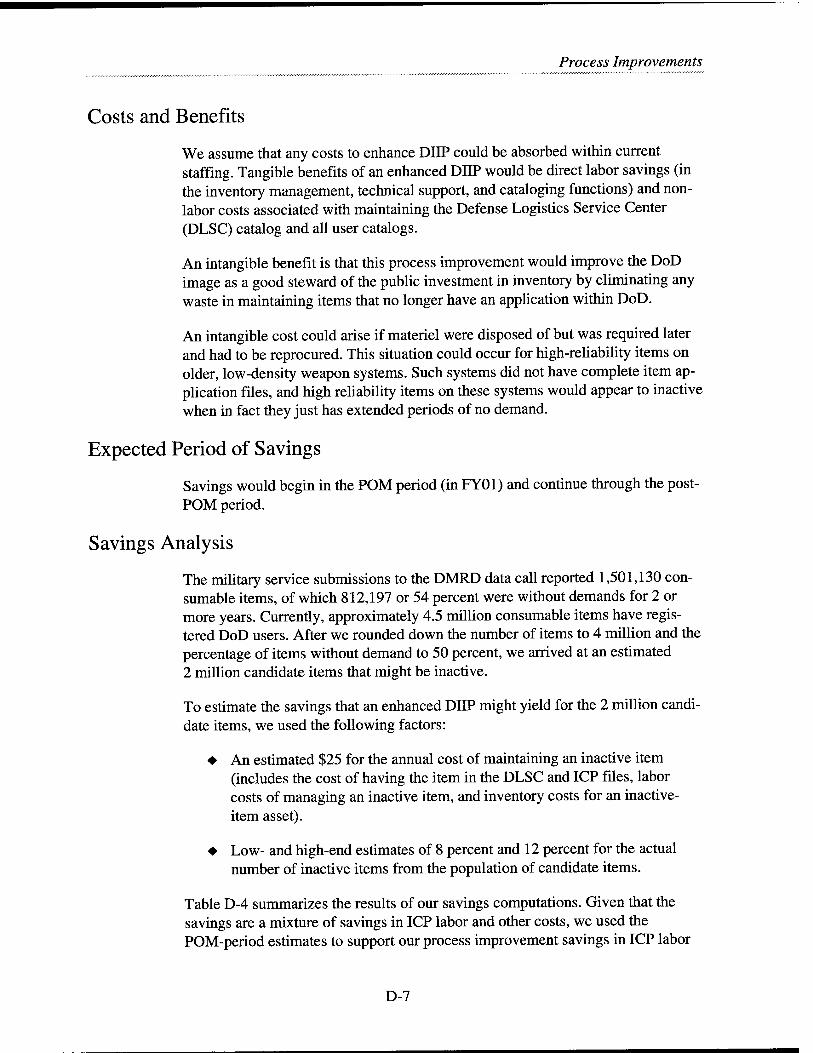
Process Improvements
Costs and Benefits
We assume that any costs to enhance DIIP could be absorbed within current staffing. Tangible benefits of an enhanced DIIP would be direct labor savings (in the inventory management, technical support, and cataloging functions) and non- labor costs associated with maintaining the Defense Logistics Service Center (DLSC) catalog and all user catalogs.
An intangible benefit is that this process improvement would improve the DoD image as a good steward of the public investment in inventory by eliminating any waste in maintaining items that no longer have an application within DoD.
An intangible cost could arise if materiel were disposed of but was required later and had to be reprocured. This situation could occur for high-reliability items on older, low-density weapon systems. Such systems did not have complete item ap- plication files, and high reliability items on these systems would appear to inactive when in fact they just has extended periods of no demand.
Expected Period of Savings
Savings would begin in the POM period (in FY01) and continue through the post- POM period.
Savings Analysis
The military service submissions to the DMRD data call reported 1,501,130 con- sumable items, of which 812,197 or 54 percent were without demands for 2 or more years. Currently, approximately 4.5 million consumable items have regis- tered DoD users. After we rounded down the number of items to 4 million and the percentage of items without demand to 50 percent, we arrived at an estimated 2 million candidate items that might be inactive.
To estimate the savings that an enhanced DIIP might yield for the 2 million candi- date items, we used the following factors:
♦ An estimated $25 for the annual cost of maintaining an inactive item (includes the cost of having the item in the DLSC and ICP files, labor costs of managing an inactive item, and inventory costs for an inactive- item asset).
♦ Low- and high-end estimates of 8 percent and 12 percent for the actual number of inactive items from the population of candidate items.
Table D-4 summarizes the results of our savings computations. Given that the savings are a mixture of savings in ICP labor and other costs, we used the POM-period estimates to support our process improvement savings in ICP labor
D-7
costs during the POM period and used the post-POM estimates as part of our post-POM savings in other costs.
Table D-4.Estimated Savings for Inactive-Item Process Improvement
Period Low-end estimate High-end estimate
POM
Post-POM
Annual steady state
$4.8
$27.2
$4.0
$7.2
$40.8
$6.0
CATALOG TOTAL QUALITY MANAGEMENT
This process improvement builds on a special program developed by DLSC to review all coding in the item catalog for consistency among the data elements and to ensure that all codes and combinations are authorized. Savings from this im- provement are not included in our bottom-up estimate of savings in costs other than ICP labor costs.
Description of Improvement
To correctly make requirement computations, process requisitions, and make re- pair or procurement recommendations, materiel management systems depend on the accuracy of the catalog data. However, many erroneous and inconsistent data elements exist within the catalog. Items are coded as depot-level reparable items and principal items but have low unit prices and improper acquisition advice codes.
As the single ICP manager, and therefore the single cataloger within DoD, DLA could move to strengthen the program and thereby correct a much larger number of these errors. The enhanced program would eliminate "user data" when the sup- plier of that data is not a registered user. It would identify apparent inconsistencies and refer them to the proper source for review and correction.
Costs and Benefits
The cost of an enhanced program could be absorbed within current staffing. In- tangible savings would arise from better decision-making by materiel manage- ment personnel using the catalog data.
Expected Period of Savings
Savings would begin in year 2 of the POM period and continue on through the post-POM period.
D-8
Process Improvements
IMPROVED DEMILITARIZATION
This process improvement would attack demilitarization coding and funding problems that are cited in the 1995 report of a DoD inventory review task force. Savings from this improvement are not included in our bottom-up estimate of savings in costs other than ICP labor costs.
Description of Improvement
Before being disposed of, some items must be demilitarized. Currently, the mili- tary services equipment specialists are responsible for assigning demilitarization codes, while DLA's defense reutilization and marketing offices are responsible for funding and accomplishing demilitarization.
Historically, confusion has existed about who is responsible for funding demilita- rization, and ICPs were reluctant to dispose of materiel in the belief that they lacked funding. However, because DLA is now requiring ICPs to reimburse the agency for the cost of storing their materiel, incentive exists to transfer potential excess materiel to disposal. Therefore, to avoid unnecessary demilitarization costs or delays in disposing of materiel, demilitarization codes need to be validated be- fore materiel disposal. As both the manager of the demilitarization process and the manager of equipment specialists setting demilitarization codes, DLA could act to ensure that all codes are valid and up-to-date before materiel disposal.
Costs and Benefits
A new demilitarization and disposal process could reduce demilitarization costs through better need verification and reduce inventory holding costs through faster processing of disposal actions.
Expected Period of Savings
We would anticipated that this process improvement could be implemented in year 2 of the POM period, with the first savings occurring in year 3 of the POM period and continuing through the post-POM period.
IMPROVED STOCK POSITIONING
This process improvement would combine DLA's joint responsibilities of ICP materiel management and depot distribution to better integrate the stock- positioning policies for materiel management with objectives for distribution
1 Inventory Review Task Force, Final Report to the Deputy Under Secretary of Defense (Logistics), March 1995, pp. 3-6 and 3-7.
D-9
depots. Savings from this improvement are not included in our bottom-up esti- mate of savings in costs other than ICP labor costs.
Description of Improvement
Currently, DLA manages all distribution depots. However, ICPs store their mate- riel in a limited number of depots and no coordination exists among the military services on where support for particular customers is coming from.
If DLA controlled all the ICPs, it could institute new stock-positioning policies and procedures that would coordinate the storage and distribution of materiel for all customers. These new policies and procedures would consider special condi- tions, such as the Navy's tidewater requirements; depot maintenance require- ments, including receipt, storage, and issue of depot-level reparable items at storage sites collocated with the depot maintenance point; and the possibility of wholesale warehouse locations within the maintenance facilities to minimize the cost and time to transfer materiel to and from maintenance.
The advantages of these new policies and procedures would be
♦ increased shipment consolidation, resulting in reduced transportation costs and response time;
♦ reduced response time, through better positioning of stock; and
♦ better depot planning, which could result in reduced storage costs through decreasing the number of occupied buildings and/or installations.
Costs and Benefits
This improvement would reduce distribution costs and retail inventory costs in- volved in maintaining inventory to cover wholesale response times.
Expected Period of Savings
We would anticipate that the new policies and procedures would be implemented in year 2 of the POM period, with savings starting in year 3 of the POM period and continuing until warehouse and depot reduction and repositioning of stock are complete.
ITEM REDUCTION AND ENTRY CONTROL
This process improvement would extend the DLA program to review items for possible reduction from several items to one item. It would build on the closer re- lationship between DLA and weapon-system program managers after the transfer to reduce the introduction of new items during the design phase of weapon-system
D-10
Process Improvements
development. Savings from this improvement are not included in our bottom-up estimate of savings in costs other than ICP labor costs.
Description of Improvement
The current ICP infrastructure causes some proliferation of items, as one or more military service could be managing items that are the same or substitutable but with different national stock numbers and different nomenclatures. Often this problem occurs during the design phase of a new weapon system, when a new item is established although an equivalent item is already in the system.
As the single manager for all secondary items, DLA could act to reduce any item duplication. It could establish better processes during weapon-system design to ensure that all equivalent items are identified.
The advantages of such a program would be
♦ a reduction in the number of items cataloged and managed, and the amount of technical data purchased;
♦ an associated reduction in both wholesale and retail inventory investment; and
♦ a lower disposal rate when equivalent items become obsolete.
Costs and Benefits
This improvement would reduce the number of items and thereby reduce the in- ventory-management, contracting, technical, cataloging, and engineering person- nel involved in managing those items. It would also reduce the amount of inventory and related holding costs in stocks for equivalent items. Lower disposal rates would lower the surcharge that goes into customer purchase prices.
Expected Period of Savings
We would anticipate that DLA would begin to implement the program in year 2 of the POM period, with first results in year 3 of the POM period. The program would be ongoing for new items, but the overall savings-to-cost ratio should de- crease as the number of existing duplicates are reduced.
SECONDARY-ITEM PROVISIONING ON THE END-ITEM
CONTRACT
This process improvement would establish a DoD program that would include provisioning line items in the end-item contract for the purchase of sole-source
D-ll
secondary items from the prime contractor rather than preparing separate con- tracts. Savings from this improvement are not included in our bottom-up estimate of savings in costs other than ICP labor costs.
Description of Improvement
Currently, provisioning often is divided between military service ICPs and DLA ICPs. Within a military service ICP that has collocated weapon-system program managers (i.e., Army and Air Force ICPs), secondary-item managers take advan- tage of provisioning contracts for end items and include additional lines for the secondary items they manage. This improvement would extend that advantage across all ICPs so that initial parts procurement would be obtained by writing modifications (provisioning orders) against the prime contract rather than negoti- ating a separate contract.
The advantages of this improvement are
♦ fewer procurement contracts and, therefore, lower labor requirements and
♦ potential price reductions as contractor administrative costs are reduced when more items are on a single contractual vehicle.
Costs and Benefits
This improvement would produce tangible savings in direct-contracting FTEs and, potentially, in acquisition prices. It may also have intangible benefits in that qual- ity should be less of a problem if prime contractors were used.
Expected Period of Savings
We would anticipate that DLA would begin to implement the program in year 2 of the POM period, with first results occurring in year 3 and continuing thereafter.
SOURCE BREAKOUT
This improvement would strengthen DLA's program to review items procured from prime contractors for procurement from subcontractor or competitive sources. Savings from this improvement are not included in our bottom-up esti- mate of savings in costs other than ICP labor costs.
Description of Improvement
Once an item has been established as an active item in the DoD supply system, its DoD manager should look for alternative sources of supply to the prime contrac- tors, i.e., subcontractors or competitive sources. The advantages of having
D-12
Process Improvements
alternative sources is lower acquisition cost, resulting in lower inventory invest- ment and reduced prices to customers.
Costs and Benefits
Although source breakout will reduce materiel purchase costs, it does require per- sonnel to research alternative sources. We would anticipate that DLA would es- tablish a program that, at a minimum, would pay for itself.
Expected Period of Savings
We would expect that a program could be put in place by year 2 of the POM pe- riod, with first results beginning in year 3 and continuing thereafter.
WORK LOADING OF DEPOT MAINTENANCE
This process improvement would accelerate the implementation of changes to de- pot work loading that improve its flexibility and result in amount of materiel un- der- and overinducted. Savings from this improvement are not included in our bottom-up estimate of savings in costs other than ICP labor costs.
Description of Improvement
Currently, maintenance depots negotiate with a number of ICPs on future work- load. If DLA were responsible for all depot workloading, it could consolidate and coordinate requirements and establish a program that would provide depots with an induction schedule that is more closely related to current requirements and cur- rent awaiting of repair parts.
The advantages of such a program are
♦ reduced inventory investment in depot repair-cycle times and
♦ a one-time postponement of repair and procurement; reflecting the new times.
Costs and Benefits
Savings would come from the reduced inventory investment and reductions in the ICP and depot personnel costs involved in quarterly and semiannual program ne- gotiation.
D-13
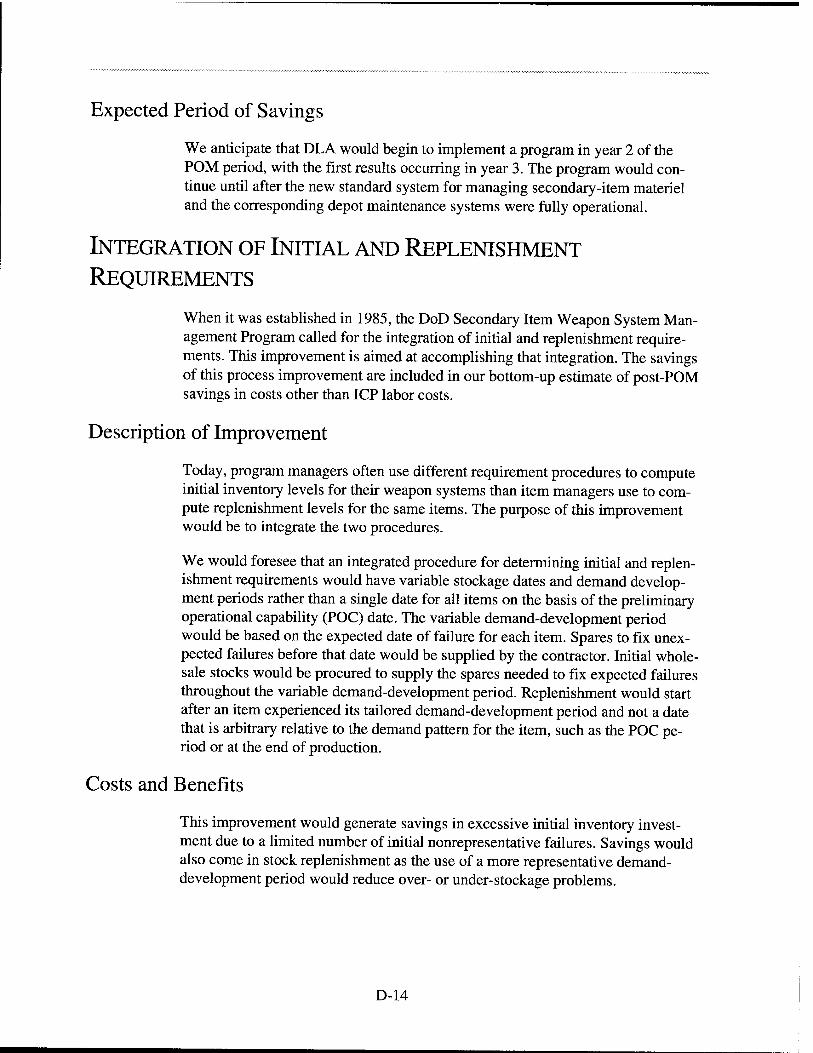
Expected Period of Savings
We anticipate that DLA would begin to implement a program in year 2 of the POM period, with the first results occurring in year 3. The program would con- tinue until after the new standard system for managing secondary-item materiel and the corresponding depot maintenance systems were fully operational.
INTEGRATION OF INITIAL AND REPLENISHMENT
REQUIREMENTS
When it was established in 1985, the DoD Secondary Item Weapon System Man- agement Program called for the integration of initial and replenishment require- ments. This improvement is aimed at accomplishing that integration. The savings of this process improvement are included in our bottom-up estimate of post-POM savings in costs other than ICP labor costs.
Description of Improvement
Today, program managers often use different requirement procedures to compute initial inventory levels for their weapon systems than item managers use to com- pute replenishment levels for the same items. The purpose of this improvement would be to integrate the two procedures.
We would foresee that an integrated procedure for determining initial and replen- ishment requirements would have variable stockage dates and demand develop- ment periods rather than a single date for all items on the basis of the preliminary operational capability (POC) date. The variable demand-development period would be based on the expected date of failure for each item. Spares to fix unex- pected failures before that date would be supplied by the contractor. Initial whole- sale stocks would be procured to supply the spares needed to fix expected failures throughout the variable demand-development period. Replenishment would start after an item experienced its tailored demand-development period and not a date that is arbitrary relative to the demand pattern for the item, such as the POC pe- riod or at the end of production.
Costs and Benefits
This improvement would generate savings in excessive initial inventory invest- ment due to a limited number of initial nonrepresentative failures. Savings would also come in stock replenishment as the use of a more representative demand- development period would reduce over- or under-stockage problems.
D-14

Process Improvements
Expected Period of Savings
We would anticipate that the integration of processes for determining initial and replenishment requirements would coincide with the implementation of a single secondary-item management policy and appropriate portions of a standard man- agement system for secondary-item materiel.
Savings Analysis
We priced out the following two types of savings that occur with this process im- provement:
♦ Avoidance of procuring items whose design will change so that they no longer fit in the system before they are in demand (and are thus obsolete). We estimated that, of the annual provisioning budget, a low of 3.75 per- cent and a high of 7.5 percent of the procurements could have been com- pletely avoided.
♦ Reduced storage costs as procurements are delayed to dates closer to item true demand dates. On the basis of the percent of items and quantities for the F-16 provisioning that did not experience their first demand in six months (89 percent) and 30 months (41 percent), we computed high-end holding costs that would be avoided if we delayed those procurements.
Tables D-5 and D-6 show the results of our computations of low-end and high- end estimates, respectively.
Table D-5. Low-End Estimate for Integration of Initial and Replenishment Requirements (in millions of dollars)
Conservative Estimate
Year Obsolescence
Storage
Subtotal Total 04 Buy 05 Buy 06 Buy 07 Buy 08 Buy 09 Buy 10 Buy
FY04 $42.0 $3.5 0 0 0 0 0 0 $3.5 $45.5
FY05 $42.0 $5.0 $3.5 0 0 0 0 0 $8.6 $50.6
FY06 $42.0 $3.0 $5.0 $3.5 0 0 0 0 $11.6 $53.6
FY07 $42.0 $1.0 $3.0 $5.0 $3.5 0 0 0 $12.6 $54.6
FY08 $42.0 $0.0 $1.0 $3.0 $5.0 $3.5 0 0 $12.6 $54.6
FY09 $42.0 $0.0 $0.0 $1.0 $3.0 $5.0 $3.5 0 $12.6 $54.6
FY10 $42.0 $0.0 $0.0 $0.0 $1.0 $3.0 $5.0 $3.5 $12.6 $54.6
Total $293.9 $12.6 $12.6 $12.6 $12.6 $11.6 $8.6 $3.5 $74.1 $368.0
D-15
Table D-6. High-End Estimate for Integration of Initial and Replenishment Item Requirements (in millions of dollars)
Optimistic Estimate
Year Obsolescence
Storage
Subtotal Total 04 Buy 05 Buy 06 Buy 07 Buy 08 Buy 09 Buy 10 Buy
FY04 $84.0 $4.6 0 0 0 0 0 0 $4.6 $88.5
FY05 $84.0 $6.4 $4.6 0 0 0 0 0 $11.0 $95.0
FY06 $84.0 $3.8 $6.4 $4.6 0 0 0 0 $14.8 $98.7
FY07 $84.0 $1.1 $3.8 $6.4 $4.6 0 0 0 $15.8 $99.8
FY08 $84.0 $0.0 $1.1 $3.8 $6.4 $4.6 0 0 $15.8 $99.8
FY09 $84.0 $0.0 $0.0 $1.1 $3.8 $6.4 $4.6 0 $15.8 $99.8
FY10 $84.0 $0.0 $0.0 $0.0 $1.1 $3.8 $6.4 $4.6 $15.8 $99.8
Total $587.9 $15.8 $15.8 $15.8 $15.8 $14.8 $11.0 $4.6 $93.6 $681.5
SINGLE SET OF MATERIEL MANAGEMENT POLICIES
AND PROCEDURES
A single ICP manager would establish a single set of materiel management poli- cies and procedures for secondary items. Savings from this improvement are in- cluded in our bottom-up estimate of post-POM savings in costs other than ICP labor costs.
Description of Improvement
In addition to eliminating the duplication of policies and procedures among the military services and DLA, the consolidation of ICP management under a single manager would undoubtedly spawn the establishment of major new DoD-wide materiel management policies and procedures. These policies and procedures would include those involving integration of initial and replenishment require- ments and integration of the computations for wholesale and retail requirements. In general, the time required to coordinate and implement new DoD policies would be greatly reduced, since coordination and implementation would be within one organization.
Costs and Benefits
This improvement would produce savings in DLA headquarters personnel (current personnel and those transferred from the military services) who are involved in maintaining military service and DLA policies during the POM period.
D-16
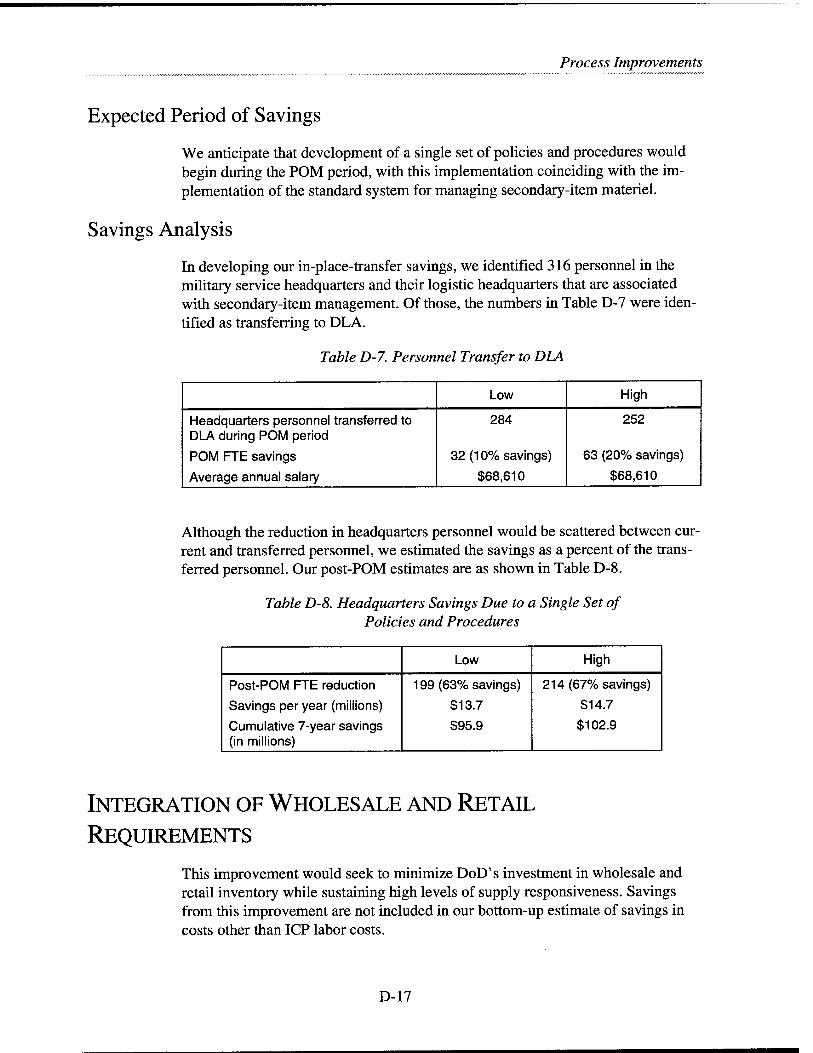
Process Improvements
Expected Period of Savings
We anticipate that development of a single set of policies and procedures would begin during the POM period, with this implementation coinciding with the im- plementation of the standard system for managing secondary-item materiel.
Savings Analysis
In developing our in-place-transfer savings, we identified 316 personnel in the military service headquarters and their logistic headquarters that are associated with secondary-item management. Of those, the numbers in Table D-7 were iden- tified as transferring to DLA.
Table D-7. Personnel Transfer to DLA
Low High
Headquarters personnel transferred to DLA during POM period
POM FTE savings
Average annual salary
284
32 (10% savings)
$68,610
252
63 (20% savings)
$68,610
Although the reduction in headquarters personnel would be scattered between cur- rent and transferred personnel, we estimated the savings as a percent of the trans- ferred personnel. Our post-POM estimates are as shown in Table D-8.
Table D-8. Headquarters Savings Due to a Single Set of Policies and Procedures
Low High
Post-POM FTE reduction 199 (63% savings) 214 (67% savings)
Savings per year (millions) $13.7 $14.7
Cumulative 7-year savings (in millions)
$95.9 $102.9
INTEGRATION OF WHOLESALE AND RETAIL
REQUIREMENTS
This improvement would seek to minimize DoD's investment in wholesale and retail inventory while sustaining high levels of supply responsiveness. Savings from this improvement are not included in our bottom-up estimate of savings in costs other than ICP labor costs.
D-17
Description of Improvements
Today, the Air Force minimizes its investment in depot-level reparable items that support aircraft operational availability by using a multiple-echelon requirement model. The objective of this model is to trade off wholesale and retail levels of stock to provide an overall level of responsiveness for supply systems. Another way of achieving the same objective is to set wholesale response times that result in the minimum total wholesale and retail levels of inventory that meet a given level of responsiveness.
If DLA were established as the single wholesale manager for all secondary items that support weapon systems, it could establish procedures that integrate its re- sponsiveness and inventory costs with retail responsiveness and inventory costs.
Costs and Benefits
Savings from this improvement would come from a reduction in inventory in- vestment and in inventory storage costs, since integrated wholesale goals would yield smaller, more optimal levels of stock. An intangible benefit might be im- proved customer confidence, since wholesale and retail levels of supply would work together to guarantee required levels of supply support to DoD customers.
Expected Period of Savings
We anticipate that the integration of wholesale and retail supply would coincide with the implementation of a single policy for secondary-item management and integration of appropriate portions of a standard system for managing secondary- item materiel.
REDUCTION OF SERVICE-UNIQUE CATALOG DATA
This improvement would arise from the implementation of the single secondary- item management policies and a more standard materiel management system. Savings from this improvement are not included in our bottom-up estimate of savings in costs other than ICP labor costs.
Description of Improvement
Under a standard set of policies and procedures, the need for many of the current unique service management codes will no longer exist. In particular, that portion of the item catalog will no longer be required. However, some standard codes may need to be converted into service-unique codes for retail systems until they are updated.
D-18
Process Improvements
Costs and Benefits
The reductions in codes should reduce cataloging direct labor costs associated with entering data for new items and maintaining those data for established items. Nonlabor costs involved in maintaining the catalog would also be reduced.
Expected Period of Savings
We would anticipate that code reduction and associated savings would begin in the post-POM period.
SINGLE DESIGN ACTIVITY FOR SECONDARY-ITEM
MATERIEL MANAGEMENT
If DLA were to implement a standard system for managing secondary-item mate- riel during the post-POM period, the agency would only require one design activ- ity for continuing software support. Savings from this improvement are not included in our bottom-up estimate of savings in costs other than ICP labor costs.
Description of Improvement
Maintenance of a single system for the management of all secondary items will reduce the cost of system development and maintenance, facilitate the implemen- tation of new policies, and provide uniform management information.
Costs and Benefits
DoD already has an initiative to develop a common operating environment for its materiel management systems. The transfer would only strengthen this initiative by eliminating organizational barriers to standardization and promoting greater exchange of procedures and technologies. We are not in a position to estimate what, if any, reductions this benefit might have on the future costs of developing a standard system.
However, it is reasonable to assume that changing to having one design activity would reduce current personnel (direct, indirect, and general and administrative) costs and nonlabor costs at DoD design centers. It would also reduce the number of headquarters personnel required to oversee system development for multiple systems at multiple locations.
An intangible benefit of moving to a single system is that it would facilitate the implementation of new procedures and the introduction of new technologies.
D-19
Expected Period of Savings
We anticipate that, as modules of the standard system for managing secondary- item materiel are completed, the total number of personnel required for system maintenance will be reduced. This reduction will begin in the post-POM period and continue until all modules are operational.
SINGLE ICP MANAGING ITEMS ON A WEAPON SYSTEM
Site consolidation during the post-POM period would spawn a program to con- solidate management for all items in a given weapon system at a single site. Sav- ings from this improvement are not included in our bottom-up estimate of savings in costs other than ICP labor costs.
Description of Improvements
As sites are consolidated during the post-POM period, a logical approach to rea- ligning item management would be along weapon-system lines. Positioning all items supporting a weapon system at one site would have the advantages of
♦ eliminating duplication of customer services and technical files,
♦ facilitating requirement computation using weapon-system readiness goals, and
♦ facilitating corporate contracting and the use of end-item contracts for provisioning.
Costs and Benefits
Besides the normal savings from site consolidation, we also foresee additional savings in direct personnel and nonlabor costs from a more comprehensive weapon-system orientation in ICP materiel management.
Expected Period of Savings
We would anticipate that savings would begin after the consolidated materiel- management sites are determined and the weapon systems and commodities as- signed to each are determined. These determinations would probably not begin before FY02 and actual site consolidation would not begin until FY04. We would assume that only those items unique to weapon systems would be initially trans- ferred.
D-20
Process Improvements
UNIFORM RETURN-CREDIT POLICY
This improvement would implement a uniform set of procedures for giving credit to returns. Savings from this improvement are not included in our bottom-up es- timate of savings in costs other than ICP labor costs.
Description of Improvement
DoD has long had as a policy goal the implementation of a single method of ap- plying credit for the return of materiel to wholesale ownership. Under a single wholesale manager, the multiple accounts that exist under the Defense Business Operating Fund would be reduced. In their place, a single account with standard procedures for billing and crediting would evolve. These procedures would pro- vide for a single method of determining credit and surcharges for depot-level repa- rable items and thereby simplify operations and maintenance budgeting and accounting at the customer level.
Costs and Benefits
This improvement would reduce the requirement for budgeting and accounting personnel at the ICP level and within the Defense Finance and Accounting Serv- ice.
Expected Period of Savings
Although it could be accomplished with changes in current systems, at a mini- mum, we would expect this improvement to be implemented as part of a standard materiel-management system, beginning with the post-POM period.
D-21
Appendix E
Glossary
ACALA
AFMC
ALC
ALT
ATCOM
BES
BOS
BRAC
CECOM
CORM
DBOF
DFSC
DIIP
DLA
DLSC
DMRD
DSCC
DSCR
FMS
FSC
FTE
G&A
GSA
I&S
ICP
IMM
ISSL
Armament and Chemical Acquisition and Logistics Activity
Air Force Materiel Command
Air Logistics Center
administrative lead-time
Aviation and Troop Command
budget estimate submission
base operating supplier
base realignment and closure
Communications and Electronics Command
Commission on Roles and Missions
Defense Business Operating Fund
Defense Fuel Supply Center
Defense Inactive Item Program
Defense Logistics Agency
Defense Logistics Service Center
Defense Management Review Decision
Defense Supply Center Columbus
Defense Supply Center Richmond
Foreign Military Sales
Federal Supply Class
full-time equivalent
general and administrative
General Services Administration
interchangeability and substitutability
inventory control point
integrated materiel manager
initial supply support list
E-l
MCLB
MICOM
NAVICP
O&M
OC-ALC
OO-ALC
OSD
PA
PICA
PLT
POC
POM
PPWR
SA-ALC
SICA
SM-ALC
SPCCA&ASO
SSR
TACOM
TAV
WAN
WR-ALC
WSSP
Marine Corps Logistics Base
Missile Command
Naval ICP
operations and maintenance
Oklahoma City Air Logistics Center
Ogden Air Logistics Center
Office of the Secretary of Defense
procurement account
Primary Inventory Control Activity
production lead-time
preliminary operational capability
program objective memorandum
prepositioned war reserves
San Antonio Air Logistics Center
Secondary Inventory Control Activity
Sacramento Air Logistics Center
Ships Parts Control Center and Aviation Supply Office
supply support request
Tank-automotive and Armaments Command
total asset visibility
wide area network
Warner Robins Air Logistics Center
Weapon System Support Program
E-2