Embed Size (px)
Citation preview
An analysis of the Pluit polder, Jakarta
Written by: Niek van der Sleen Supervisor: MSc. Juan Pablo Aguilar Lopez 16 augustus 2013

2
PREFACE
This bachelor thesis is the final part of my bachelor Civil Engineering at the University of Twente. Some students are doing their internship, which is part of this final assignment, in the Netherlands, others are going abroad. My time in Indonesia and the writing of this research was a great experience, which would not have been possible without a number of people. Therefore I would like to thank my supervisor Juan Pablo Aguilar Lopez for his time and the advice he gave me, Daniël Tollenaar for his advice to my thesis and creating the opportunity to do my internship in Indonesia, ibu Ika Agustin Ningrum and pak Edo Sianturi for letting me do my internship at Dinas Pekerjaan Umum and for finding the answers to my questions while I was in Jakarta. Last but not least I would like to thank my parents, brother and sister for their support.
3
CONTENTS
Preface ........................................................................................................................................................................................................... 2
Summary ....................................................................................................................................................................................................... 5
1. Introduction ..................................................................................................................................................................................... 6
1.1 Context ..................................................................................................................................................................................... 6
1.2 Problem definition .............................................................................................................................................................. 6
1.3 Research objective .............................................................................................................................................................. 7
1.4 Research questions ............................................................................................................................................................. 7
2. Description of the Research methods ................................................................................................................................... 8
2.1 Rainfall data collection ..................................................................................................................................................... 8
2.2 Analysis of the Pluit drainage system ........................................................................................................................ 9
2.3 Calculations ............................................................................................................................................................................ 9
3. Original rainfall design criteria ............................................................................................................................................. 11
3.1 Macro system ..................................................................................................................................................................... 11
3.2 Micro system ...................................................................................................................................................................... 11
3.3 Floodways ............................................................................................................................................................................ 11
3.4 Return periods with corresponding amount of rainfall .................................................................................. 12
4. Current Rainfall design criteria ............................................................................................................................................ 13
4.1 Current design criteria for urban drainage .......................................................................................................... 13
4.2 Current design criteria for a polder in Jakarta .................................................................................................... 13
4.3 Return periods with corresponding amount of rainfall .................................................................................. 14
5. Implementation of minimum return periods ................................................................................................................. 15
5.1 Return periods used in DKI 3-8 and JICA 1991................................................................................................... 15
5.2 Return periods used in DKI 3-9 ................................................................................................................................. 15
5.3 Return periods used by Dinas Pekerjaan Umum ............................................................................................... 15
5.4 Rainfall return periods used in this research ...................................................................................................... 16
6. Current and future situation in the Pluit polder ........................................................................................................... 17
6.1 Subcatchment areas ........................................................................................................................................................ 17
6.2 Current pumping stations ............................................................................................................................................ 18
6.3 Current projects ................................................................................................................................................................ 20
7. Flood hazard mapping model ................................................................................................................................................ 21
7.1 Model changes for the Current situation ............................................................................................................... 21
7.2 Model changes for the Future situation ................................................................................................................. 23
8. Required amount of storage capacity ................................................................................................................................ 25
8.1 Current situation .............................................................................................................................................................. 25
8.2 Future situation ................................................................................................................................................................ 26
9. January 2013 flood event ........................................................................................................................................................ 28
9.1 Rainfall .................................................................................................................................................................................. 28
9.2 Inflow from embankment failure .............................................................................................................................. 28

4
9.3 Pumping capacity ............................................................................................................................................................. 29
10. Discussion ................................................................................................................................................................................. 31
11. Conclusions .............................................................................................................................................................................. 32
12. Reccomendations................................................................................................................................................................... 33
References ................................................................................................................................................................................................. 34
Appendix .................................................................................................................................................................................................... 36
A. Rainfall design events by Deltares ...................................................................................................................................... 36
B. Flood hazard mapping model ................................................................................................................................................ 39
5
SUMMARY
Since 1997, the capital city of Indonesia, Jakarta, was hit by five major floods. In January of 2013 the Pluit polder, with 215.000 residents, in the north of Jakarta was hit by a severe flood. One of the causes of the flooding was the failure at the Pluit pumping station. A few hours after the flooding all the three pumping houses at the Pluit pumping station were broke down. The waduk (lake) in front of the pumping station was not able to store the total amount of water that was flowing towards waduk Pluit. As a result, a great part of the Pluit polder was inundated. This event raised the question if the storage capacity of the Pluit polder is sufficient. The research is done about what measures are required to let the Pluit polder meet the current applicable design criteria regarding the storage- and pumping capacity.
By studying several documents original design criteria and current design criteria are examined. Amongst these documents was the “Flood control manual” by W-E-R Agra Limited in 1993 and the “Masterplan for drainage and flood control for Jakarta” by NEDECO in 1973. The first document is made to create a more consistent approach in the Public Works departments in Indonesia. The second document is the original design plan for the Pluit polder and includes information about the design criteria used when the polder was initially designed.
Thereafter the current situation in the Pluit polder is analyzed. This is done by field trips towards some of the pumping stations, gates and drains in Pluit. These fieldtrips created a global understanding of the drainage system. The technical details about the capacities and standard operation procedures of the pumping stations were found in documents of Dinas Pekerjaan Umum. From the Flood Hazard Mapping (FHM) model by Deltares mostly geographical information about gates and pumping stations is taken. The technical information from DPU was compared to the FHM and some corrections in the FHM were made.
With all the gathered information and the FHM model, the discharges towards the pumping stations are calculated. With the discharges and the pumping capacities of the pumping stations known, the amount of water that has to be stored is calculated. From these results it becomes clear if the current design still meets the applicable design criteria.
The drainage system in the Pluit polder is originally designed with return periods of 2 years for the minor drainage system and 25 years for the major drainage system. In Pluit, the minor drainage system consists of all the drains except for some designated rivers (the kali Cideng, kali Besar and AK Ciliwung Kota). Dinas Pekerjaan Umum (DPU) still uses the same return periods for the major drainage system. For the minor drainage system they use a 10- or 25-year return period, depending on the local situation (obstacles can be illegal housing, high land prices etc.).
In the Pluit polder are three major pumping stations (pompa Pluit (now 34 m3/s, in the future 49 m3/s), pompa Cideng (40.2 m3/s) and pompa Melati (13.6 m3/s). In the future the pumps of Pasar Ikan (30 m3/s) and Duri (6 m3) will be build. The system exists of several sub drainage systems which are connected by gates. These gates will be opened towards Pluit when the water level in another sub drainage system will become too high. The pumping stations and the storage capacities in the Pluit polder are enough to handle a 25-year rainfall return event and therefore meet the design criteria. In the current situation there is 8.35 m3/s of unused pumping and storage capacity (calculated to a 24-hour pumping capacity). In the future situation this will be 30.2 m3/s. This means in the future situation a total pumping capacity of 30.2 m3/s can break down and Pluit will still meet the design criteria. Since the storage and pumping capacities in the Pluit polder are enough to handle a 25-year return period with still some backup capacities left, it is recommended to DPU that the future focus should be on the maintenance of the pumping stations and waduks instead of building new pumping stations and waduks. As long as the current system is functioning as it should be, the Pluit polder meet the 25-year return period. If the parts of the system are not fully functioning, it is not guaranteed that the system will meet the design criteria.
6
1. INTRODUCTION
1.1 CONTEXT
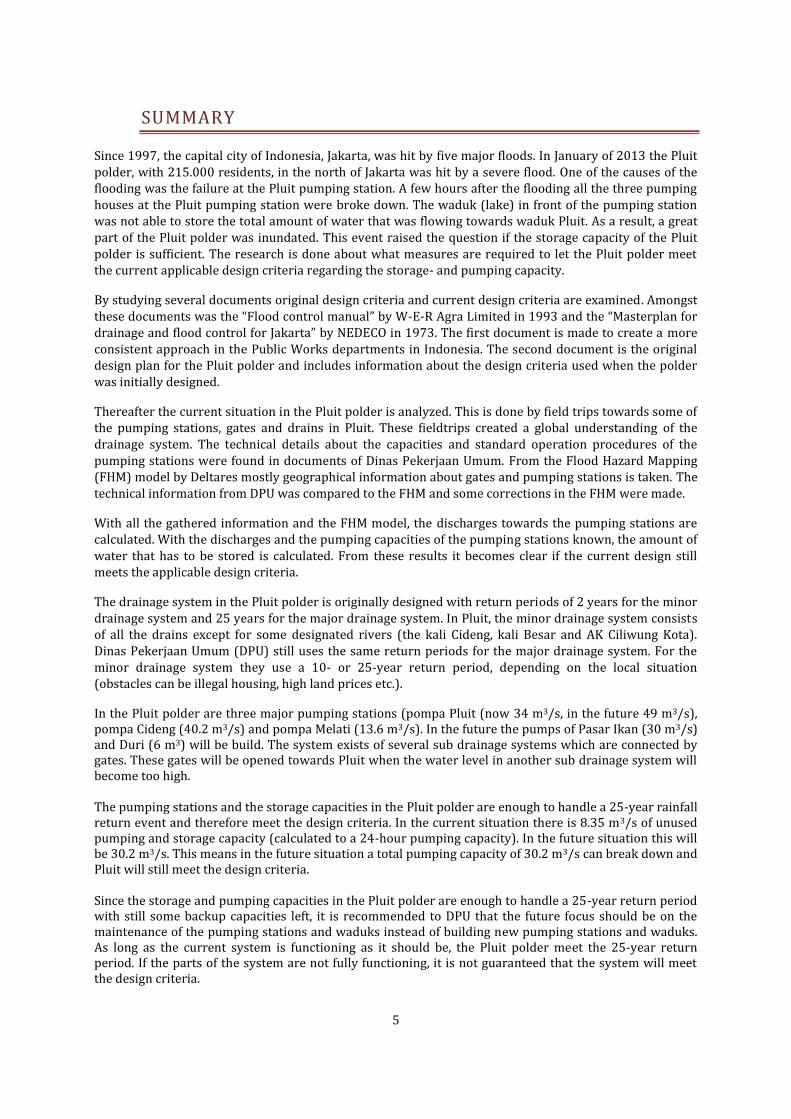
Jakarta, the capital city of Indonesia has a total population of 9 million inhabitants in 2009 (Central Intelligence Agency, 2013). There are thirteen rivers flowing through the city. These rivers create the main drainage system. This drainage system is causing a widespread flooding which creates a yearly inundation of up to 40 % of Jakarta (Nasrul, Schultz, Sustanto, & Suryadi, 2010). There is also a ground subsidence of 10 cm or more each year causing the risk of flood increasing every year (Brinkman & Hartman, 2009). In the past there were several major floods in Jakarta, during 1997, 2002, 2007 (Tanuwidjaja, 2010) and 2013. In the north of Jakarta lies the Pluit polder. The polder was developed around 1970 and its area is mainly used for housing. It is de oldest urban polder in Indonesia. The population density in 2007 was 10.300 persons / km2, with 215.000 people in total living in the polder ((Indonesia Statistics Board, 2007) in (Nasrul et al., 2010)). The Pluit polder is actually divided into three smaller sub polders, Pluit, Melati and Cideng. The sub polder Pluit is the biggest of these three. There is a waduk (lake) and a pumping station in the north of Pluit. These are storing and pumping the water directly into the sea. In Cideng the water is pumped out of the polder into the Banjir Kanal Barat (BKB). The BKB is a storm drain which drains the water of the Ciliwung towards the sea. The BKB is the border at the south and west side of the Pluit polder. Sub polder Melati has a small waduk before it pumps out the water into the BKB.
1.2 PROBLEM DEFINITION
In January of 2013, the Pluit polder in Jakarta was again heavily flooded. This particular flood was caused by a combination of circumstances. Some of the major causes were:
1. Heavy rainfall. The polders Melati and Cideng are polders located upstream from the Pluit polder. In the 8 days previous to the actual flooding heavy rainfall occurred over Jakarta (Bricker, Kure, Muhari, Fututani & Hanan, 2013). This rain caused the water levels of the flows in the polders Melati, Cideng and Pluit to be quite high already.
2. Human decision, opening of gates. The pumping and storage capacity of the Cideng and Melati pumps was not sufficient. To prevent a rise in the water levels in the Melati and Cideng polders, Dinas Pekerjaan Umum DKI Jakarta (Department of Public Works in the province of Jakarta) made the decision to open the gates of these two polders. This made it possible that the water flew towards waduk Pluit and the Pluit pumps.
3. Trash. In most of the drains in Jakarta trash is common appearance. Gates and bridges are places that collect a lot of trash. The Banjir Kanal Barat (western flood channel) storm drain runs along the polders and drains water from the uphill river Ciliwung towards the sea. Also in the BKB there was a lot of trash in the river during the flood of 2013. Deltares reported that 3 of the 4 openings at Karet gate were entirely clogged by trash during the flood event (Bricker et al., 2013).
FIGURE 1 - STUDY AREA: THE PLUIT POLDER
7
The flow rate in the BKB channel towards the Karet gate was about 300-500 m3/s. The clogged openings at the gate resulted in a reduced capacity of the drainage system. This reduced capacity of drainage system caused overtopping of the embankment at Latuharhari, which collapsed afterwards. The water flowed via the Melati and Cideng polders towards the Pluit polder. This was possible because the gates in Melati and Cideng were opened.
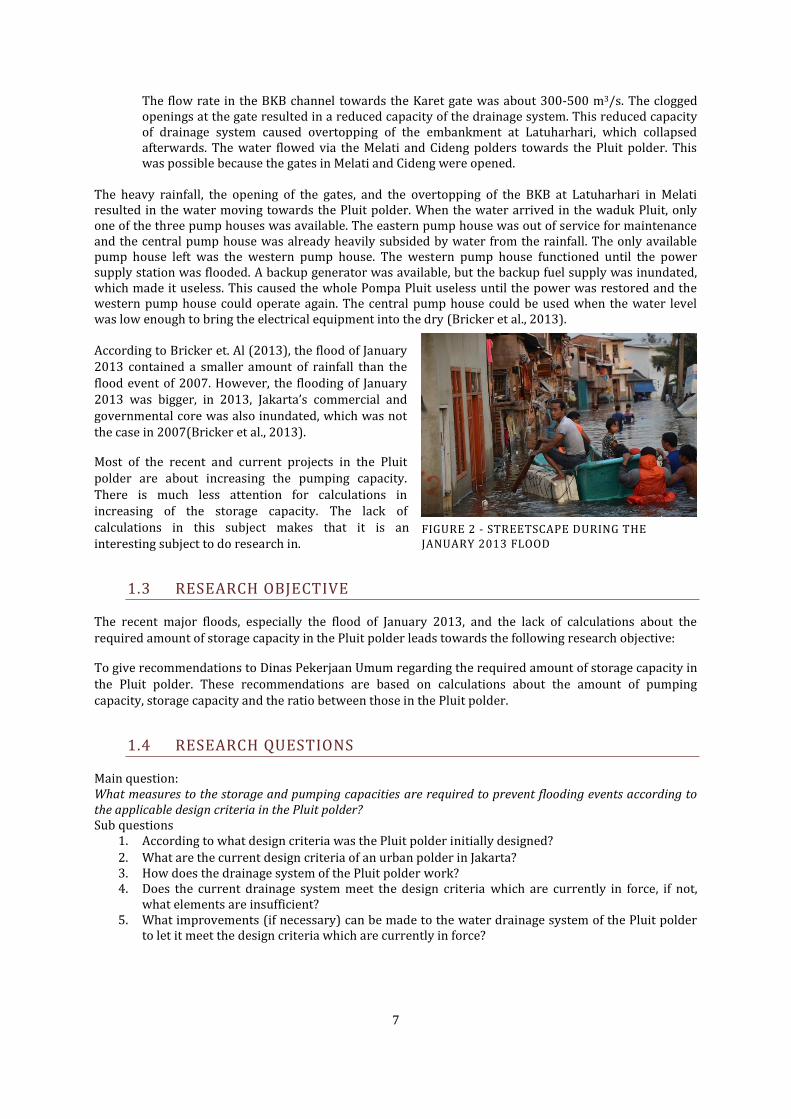
The heavy rainfall, the opening of the gates, and the overtopping of the BKB at Latuharhari in Melati resulted in the water moving towards the Pluit polder. When the water arrived in the waduk Pluit, only one of the three pump houses was available. The eastern pump house was out of service for maintenance and the central pump house was already heavily subsided by water from the rainfall. The only available pump house left was the western pump house. The western pump house functioned until the power supply station was flooded. A backup generator was available, but the backup fuel supply was inundated, which made it useless. This caused the whole Pompa Pluit useless until the power was restored and the western pump house could operate again. The central pump house could be used when the water level was low enough to bring the electrical equipment into the dry (Bricker et al., 2013).
According to Bricker et. Al (2013), the flood of January 2013 contained a smaller amount of rainfall than the flood event of 2007. However, the flooding of January 2013 was bigger, in 2013, Jakarta’s commercial and governmental core was also inundated, which was not the case in 2007(Bricker et al., 2013).
Most of the recent and current projects in the Pluit polder are about increasing the pumping capacity. There is much less attention for calculations in increasing of the storage capacity. The lack of calculations in this subject makes that it is an interesting subject to do research in.
1.3 RESEARCH OBJECTIVE
The recent major floods, especially the flood of January 2013, and the lack of calculations about the required amount of storage capacity in the Pluit polder leads towards the following research objective:
To give recommendations to Dinas Pekerjaan Umum regarding the required amount of storage capacity in the Pluit polder. These recommendations are based on calculations about the amount of pumping capacity, storage capacity and the ratio between those in the Pluit polder.
1.4 RESEARCH QUESTIONS
Main question: What measures to the storage and pumping capacities are required to prevent flooding events according to the applicable design criteria in the Pluit polder? Sub questions
1. According to what design criteria was the Pluit polder initially designed?
2. What are the current design criteria of an urban polder in Jakarta? 3. How does the drainage system of the Pluit polder work? 4. Does the current drainage system meet the design criteria which are currently in force, if not,
what elements are insufficient? 5. What improvements (if necessary) can be made to the water drainage system of the Pluit polder
to let it meet the design criteria which are currently in force?
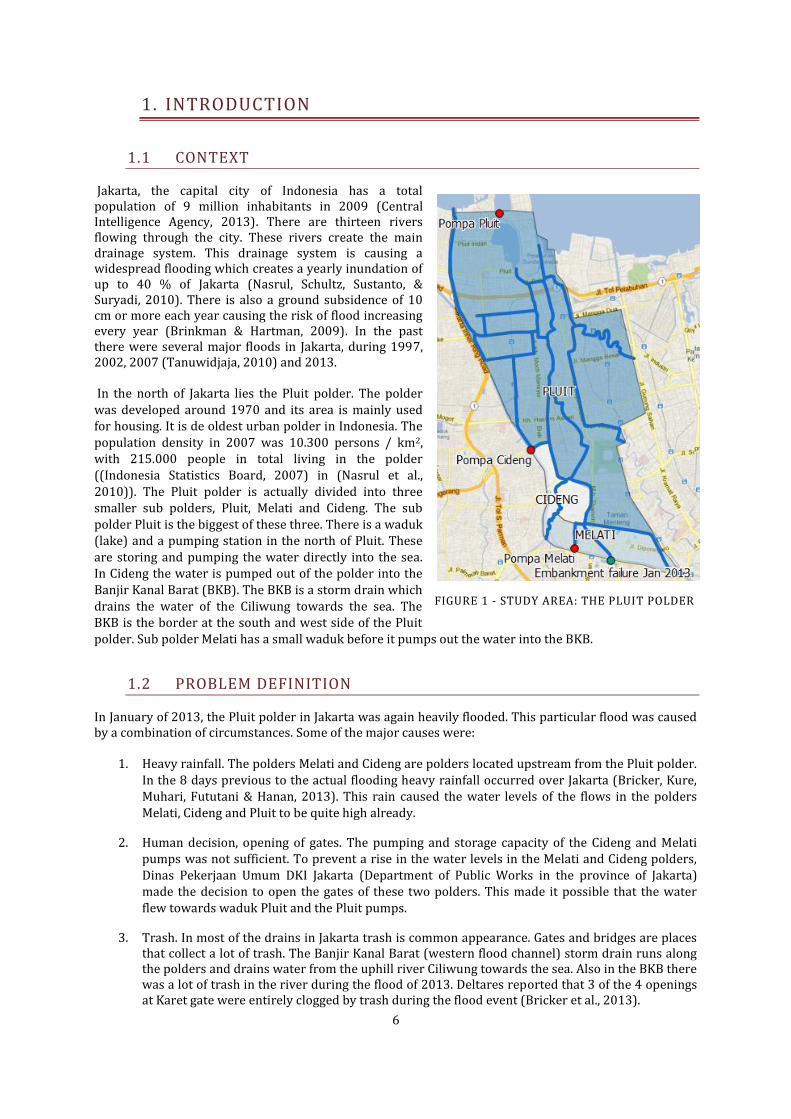
FIGURE 2 - STREETSCAPE DURING THE JANUARY 2013 FLOOD
8
2. DESCRIPTION OF THE RESEARCH METHODS
2.1 RAINFALL DATA COLLECTION
Several documents were used to look for the amounts of rainfall that Pluit should be able to handle. Amongst these documents were the “Flood Control Manual” and the NEDECO 1973 “Masterplan for drainage and flood control for Jakarta”.
These documents are studied separately in chapter 3 and 4. The amount of daily rainfall and the return periods used in the documents were taken and compared in chapter 5. Based on this information, the rainfall return periods and the amount of rainfall used in this research is chosen.
2.1.1 FLOOD CONTROL MANUAL
To discover the current design criteria of an urban polder in Jakarta the “Flood Control Manual” is studied. This document was found at the ministry of Public Works. The design criteria in this manual are applicable for every drainage system in Indonesia, therefore also applicable for the Pluit polder in Jakarta.
The “Flood Control Manual” is finished in 1993 by the company of W-E-R Agra Earth Limited on behalf of the Ministry of Public Works, government of Indonesia. The Directorate of Rivers in Indonesia ordered to make the Flood control manual because there were no uniform standards in Indonesia. Foreign companies mostly used the design standard with which they were familiar and agencies of the government of Indonesia did not use a consistent approach on all projects they worked on either. This inconsistency had led to a degree of inefficiency and unbalanced allocation of capital resources. Therefore the Flood Control Manual has been made with guidelines to assist engineers of the Ministry of Public Works, Provincial Dinas or Sub-Dinas engineers and Indonesian consulting engineers (W-E-R Agra Earth Limited, 1993).
This document describes the amount of rainfall in a certain return period. The return period for a metropolitan city is found. The amount of rainfall associated with this return period is found in a database from Deltares with recent information about rainfall data is the past years. In this way, the amount rainfall with a certain return period is determined by Deltares and will be used in the research.
2.1.2 MASTERPLAN FOR DRAINAGE AND FLOOD CONTROL FOR JAKARTA
The second important document is the original design plan for the Pluit polder. This is described in NEDECO 1973 “Rencana induk untuk pengeringan dan pengendalian banjir di Jakarta” or in English “Masterplan for drainage and flood control for Jakarta”. The NEDECO 1973 was found at the planning department of Dinas Pekerjaan Umum. Although an English and an Indonesian version of this document were made, only the Indonesian version was available at Dinas Pekerjaan Umum. At the ministry of Public Works, they could not find the document either, even after several requests. Some parts of the Indonesian document have been translated using Google Translate or by asking one of the staff members of DPU. The NEDECO 1973 contains the whole initial master plan for the drainage system in Jakarta.
From this document the return periods of the initial design are taken. In the document is also described what the corresponding amount of is with this return period. In the calculations, both, the rainfall event from the FHM model and the rainfall event from NEDECO 1973 will be calculated.
2.1.3 PROJECT DOCUMENTS
Other documents that have been consulted are mostly project documents. Amongst these documents is the DKI 3-8 project. This is the Western Java Environment Management Project and will concentrate on urban drainage management issues within the DKI-area (Lois Berger Inc. and PT. Indah Karya, 2004).
9
Also the JICA 1991 and the DKI 3-9 documents have been studied. The JICA 1991 is a study on urban drainage and wastewater disposal in Jakarta. The DKI 3-9 is a project for a drainage management program in the DKI Jakarta region.
2.2 ANALYSIS OF THE PLUIT DRAINAGE SYSTEM
2.2.1 FIELDWORK
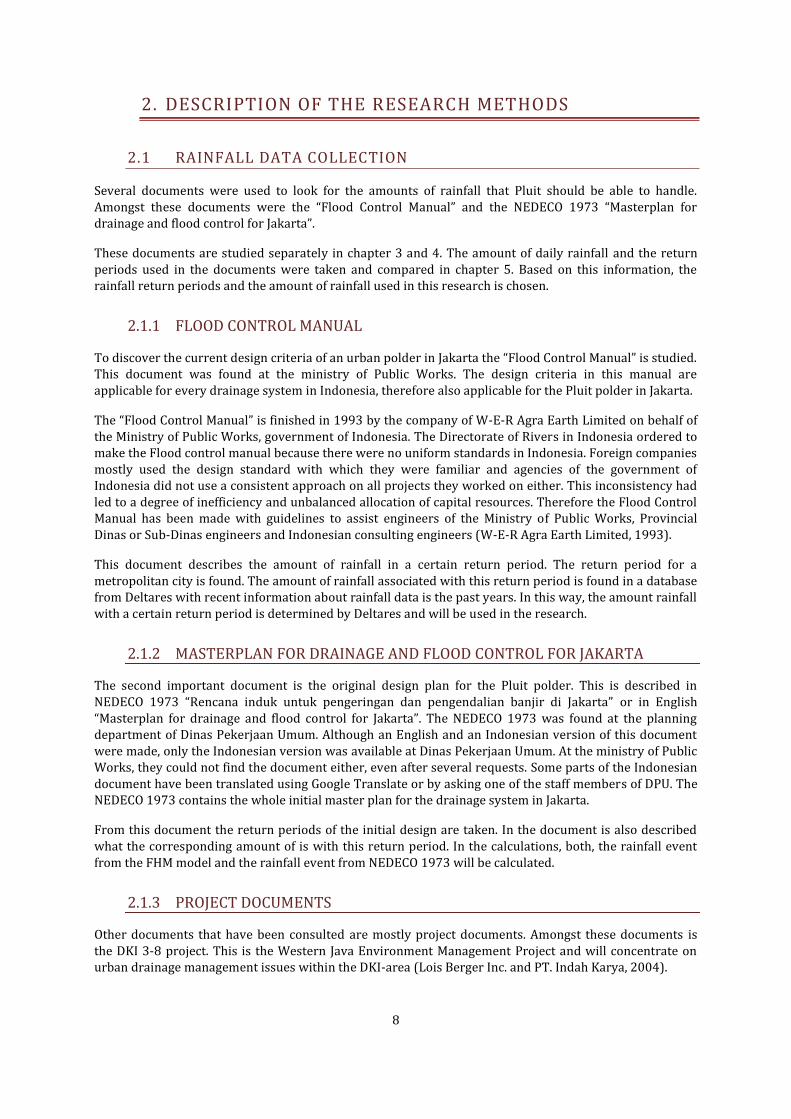
The analysis of the Pluit polder is mostly done by going on field trips. Several field trips have been made to different places of the Pluit polder. As can be seen in Figure 3, the most important places that were visited are gates or pumping stations. These places are the most interesting because they determine the routes the water will take. During the field trips many photos have been taken so that the situation can also be checked afterwards.
The main purpose of the field trips was to create a global understanding of the whole Pluit drainage system by seeing where the pumping stations are, where the gates are and how the drains look like. Another goal of the field trips is to see what other problems are occurring in the Pluit polder.
2.2.2 THEORATICAL INFORMATION GATHERING
More technical details about the capacities of the pumping stations were found in documents written by Dinas Pekerjaan Umum. DPU has documents in which the capacities and standard operation procedures
of the pumping stations are described. There were however, some documents who were contradicting with each other. In these cases further research had to be done. This extra research could be asking head of the water resources of DPU and / or looking in other, more reliable documents.
Also the existing Flood Hazard Mapping model made by Deltares contained a lot of information. In this model, all the existing gates, weirs and pumping stations were already modeled. Geographical information from the model is taken to locate these. There is also information available in the model about the pumping capacity of the pumping stations, this information is checked with the standard operation procedures found at Dinas Pekerjaan Umum. The catchment areas are based on the GIS shapefiles in the FHM model.
2.3 CALCULATIONS
2.3.1 MODEL IN SOBEK
The calculations in this research are mostly done with data provided by the FHM model in Sobek. The used model is a cut out of the FHM 2012 situation, including the updates from the FMIS project (2012). The cut out includes the Pluit polder, Banjir Kanal Barat and the Lower Ciliwung. By using the cut out, problems occurring upstream are eliminated. Also the running time of the simulation is much shorter, approximately 5 minutes vs. 10 hours for the whole model. From the basic cut out model, two adapted models will be built. The first model will be representative for the current situation of the Pluit polder. The second model represents the future situation in which several ongoing projects will be finished. In Figure 4 all the drains modeled in the SOBEK software are shown. A detailed description of the FHM model is given in appendix A.
FIGURE 3 - VISITED PLACES
10
For the changes to the model, the information found in the previous chapters, like Standard Operation Procedures and pump capacities is used. For the future situation, the SOP of pompa Duri and pompa Pasar Ikan was not available. For these two pumping stations, assumptions have been made to get a standard operation procedure.
2.3.1 MEASURING POINTS OF THE DISCHARGES AT THE PUMPING STATIONS
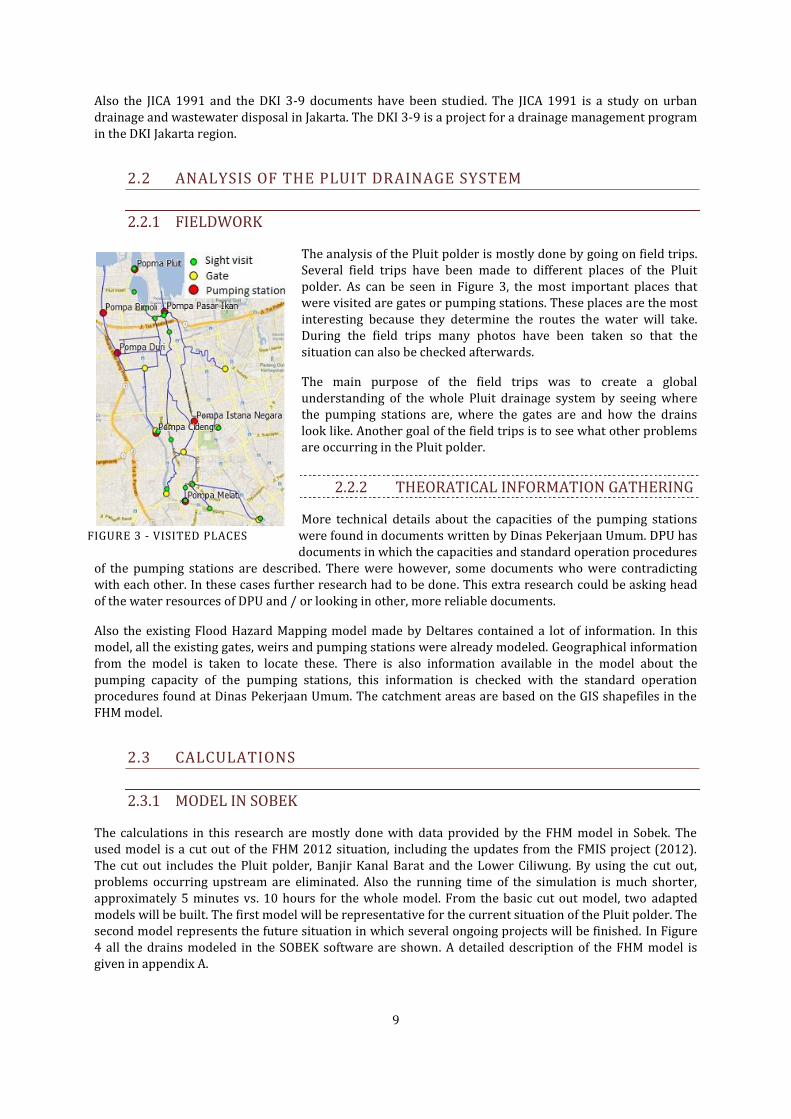
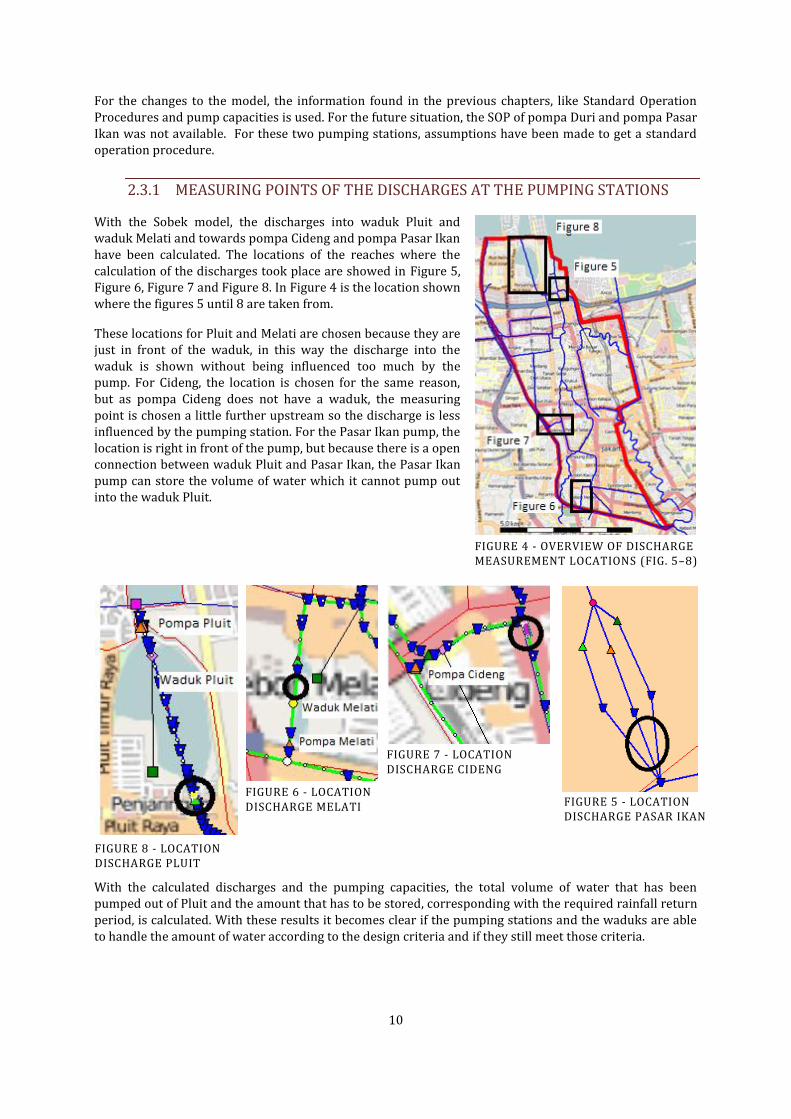
With the Sobek model, the discharges into waduk Pluit and waduk Melati and towards pompa Cideng and pompa Pasar Ikan have been calculated. The locations of the reaches where the calculation of the discharges took place are showed in Figure 5, Figure 6, Figure 7 and Figure 8. In Figure 4 is the location shown where the figures 5 until 8 are taken from.
These locations for Pluit and Melati are chosen because they are just in front of the waduk, in this way the discharge into the waduk is shown without being influenced too much by the pump. For Cideng, the location is chosen for the same reason, but as pompa Cideng does not have a waduk, the measuring point is chosen a little further upstream so the discharge is less influenced by the pumping station. For the Pasar Ikan pump, the location is right in front of the pump, but because there is a open connection between waduk Pluit and Pasar Ikan, the Pasar Ikan pump can store the volume of water which it cannot pump out into the waduk Pluit.
With the calculated discharges and the pumping capacities, the total volume of water that has been pumped out of Pluit and the amount that has to be stored, corresponding with the required rainfall return period, is calculated. With these results it becomes clear if the pumping stations and the waduks are able to handle the amount of water according to the design criteria and if they still meet those criteria.
FIGURE 6 - LOCATION DISCHARGE MELATI
FIGURE 7 - LOCATION DISCHARGE CIDENG
FIGURE 8 - LOCATION DISCHARGE PLUIT
FIGURE 5 - LOCATION DISCHARGE PASAR IKAN
FIGURE 4 - OVERVIEW OF DISCHARGE MEASUREMENT LOCATIONS (FIG. 5–8)
11
3. ORIGINAL RAINFALL DESIGN CRITERIA
The original master plan for the whole Jakarta drainage system dates from 1973. In this year the NEDECO 1973 ‘Master plan for drainage and flood control in Jakarta’ is finished. The NEDECO 1973 has different rainfall return periods for macro and micro drains.
3.1 MACRO SYSTEM
The macro system described in NEDECO 1973 consists of several of the major rivers in Jakarta. It is not clearly described which rivers are included and which rivers are not. The rivers that are belonging to the macro system are amongst others the Kali (river) Ciliwung, Kali Cideng, Kali Krukut, Kali Grogol, Kali Secretaris and Kali Anke (NEDECO 1973). Three of these rivers are flowing through the Pluit polder, namely, the Kali Ciliwung, kali Krukut and Kali Cideng. The rivers belonging to the macro system are designed with on a rainfall event with a return period of 25 years.
3.2 MICRO SYSTEM
The micro drains in this document contain all the smaller drains / channels other than the rivers in the macro system. The capacity of these micro drains is based on the maximum rainfall that is expected to occur every 2 year. When the water level in the micro system channel reach the level of a t = 25 year rainfall event, the water can reach the ground surface elevation. This will cause a flood will occur, but not for a very long time (NEDECO, 1973). The height of an eventual flood occurring in the micro system channels or a definition of ‘not a very long time’ is not given in the NEDECO 1973.
3.3 FLOODWAYS
According to the NEDECO 1973, the Floodways in Jakarta are designed for the 100-year return period. Also the Banjir Kanal Barat is designed for this 100 year return rainfall event.
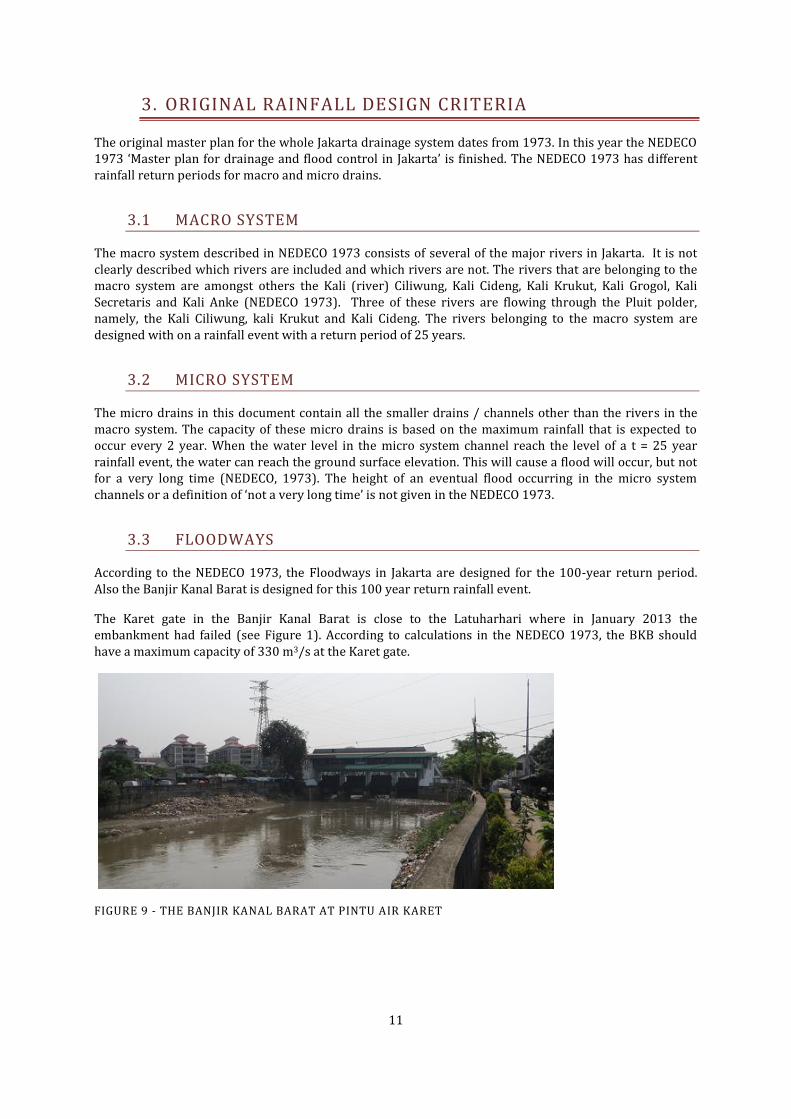
The Karet gate in the Banjir Kanal Barat is close to the Latuharhari where in January 2013 the embankment had failed (see Figure 1). According to calculations in the NEDECO 1973, the BKB should have a maximum capacity of 330 m3/s at the Karet gate.
FIGURE 9 - THE BANJIR KANAL BARAT AT PINTU AIR KARET
12
3.4 RETURN PERIODS WITH CORRESPONDING AMOUNT OF RAINFALL
The data used to get the corresponding amount of rainfall with the return periods is gathered by the Indonesian Meteorology and Geophysics agency in Jakarta (Lembaga Metorologi dan Geofisikan di Jakarta) (NEDECO, 1973).
In the whole master plan, historical rainfall data from 38 rainfall stations have been used. Continuous data from 1879 to 1916, hourly data since 1917 to 1950 (with an exception in the years 1945 and 1947) and daily rainfall records from 1959 and 1960 has been available to the NEDECO 1973. This data has been used by NEDECO to create the daily rainfall amounts with different corresponding design return periods using the Gumbel method.
This resulted in the daily rainfall amounts for the ‘Jakarta’ rainfall station, which is the closest rainfall station to Pluit, which are shown in Table 1.
TABLE 1 – DAILY RAINFALL IN MM (NEDECO, 1973)
Return period: Station: 2 5 10 20 25 50 100
Jakarta (station Nr. 27) 102 mm 137 mm 160 mm 182 mm 189 mm 210 mm 232 mm
To create the representative 24-hour rainfall from the data in Table 1 a factor has to be applied. NEDECO has calculated different factors for the different return periods (NEDECO 1973). These factors are shown in Table 2.
TABLE 2 – 24-HOUR RAINFALL FACTORS (NEDECO 1973)
Return period 2 5 10 20 25 50 100
24-hours rainfall factor 10 % 11 % 12 % 12 % 12 % 13 % 13 %
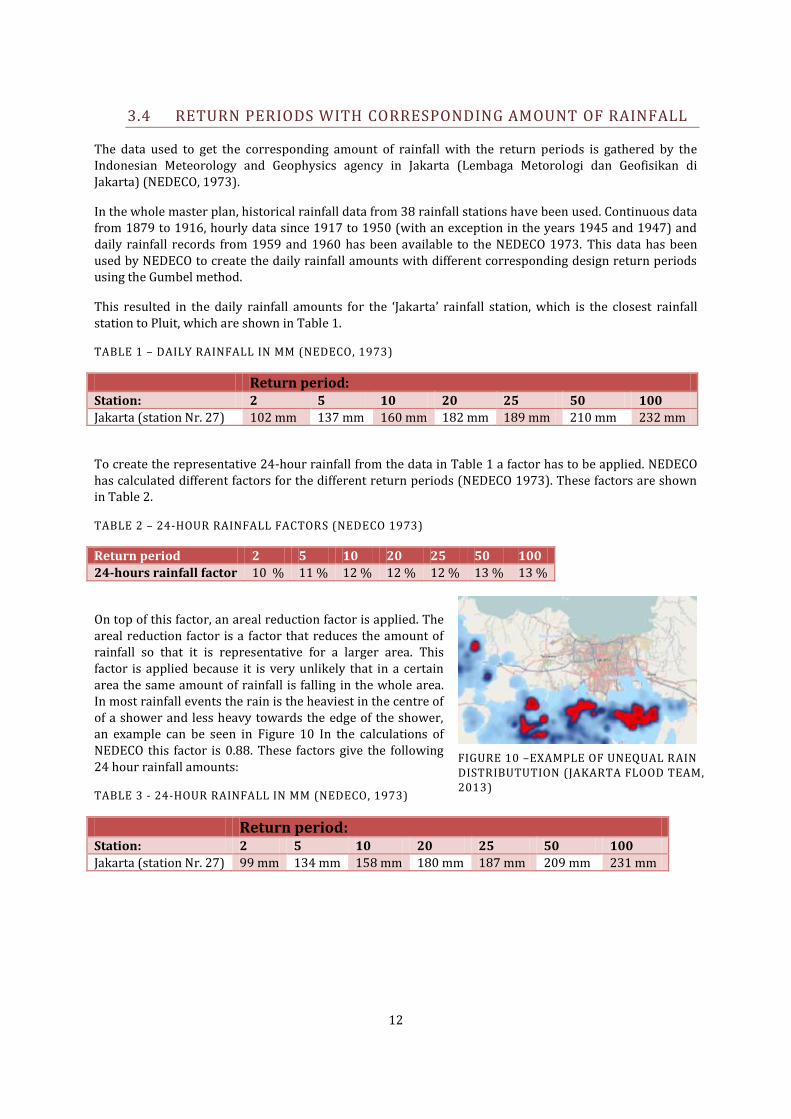
On top of this factor, an areal reduction factor is applied. The areal reduction factor is a factor that reduces the amount of rainfall so that it is representative for a larger area. This factor is applied because it is very unlikely that in a certain area the same amount of rainfall is falling in the whole area. In most rainfall events the rain is the heaviest in the centre of of a shower and less heavy towards the edge of the shower, an example can be seen in Figure 10 In the calculations of NEDECO this factor is 0.88. These factors give the following 24 hour rainfall amounts:
TABLE 3 - 24-HOUR RAINFALL IN MM (NEDECO, 1973)
Return period: Station: 2 5 10 20 25 50 100
Jakarta (station Nr. 27) 99 mm 134 mm 158 mm 180 mm 187 mm 209 mm 231 mm
FIGURE 10 –EXAMPLE OF UNEQUAL RAIN DISTRIBUTUTION (JAKARTA FLOOD TEAM, 2013)
13
4. CURRENT RAINFALL DESIGN CRITERIA
4.1 CURRENT DESIGN CRITERIA FOR URBAN DRAINAGE
In the Flood Control Manual design storm return periods are given for the design of an urban drainage system in Indonesia. There are two variables: the class (building density) of the city and the catchment area. The corresponding return periods can be seen in Table 4.
The design flood standards for urban drainage in Table 4 have been developed by Haskoning and Rayakonsult for the Directorate General Water Resources Development (W-E-R Agra Earth Limited, 1993). A 1-year return period in this table means that the average probability that this event is likely to happen is 1,00 each year (Hoekstra, 2010).
TABLE 4 - DESIGN STORM RETURN PERIODS FOR URBAN DRAINAGE BY HASKONING AND RAYAKONSULT (W-E-R AGRA EARTH LIMITED, 1993)
Class of City Design Storm Return Period (years)
Catchments Area < 10 ha
Catchments Area 10 - 100 ha
Catchments Area 100 - 500 ha
Catchments Area > 500 ha
Metropolitan 1 - 2 2-5 5-10 10-25 Large 1-2 2-5 2-5 5-15 Medium 1-2 2-5 2-5 5-10 Small 1-2 1-2 1-2 2-5 Very Small 1 1 1
- -
These return periods are applicable to so called ‘design storms’, this is just another word for a rainfall event. In the flood control manual are no standards available for a flood because of the failure of an embankment. Therefore the assumption has been made that in the Flood Control Manual the assumption has been made that embankments never fail. So a possible flood from the adjacent Banjir Kanal Barat is not included in these design return periods.
For the Pluit polder with an area of 3500 ha and lying in one of the biggest metropolitan areas in the world, the 10 – 25 year return period is applicable according to the Flood control manual.
4.2 CURRENT DESIGN CRITERIA FOR A POLDER IN JAKARTA
Although the Flood control Manual describes the return periods for an urban drainage system, there are no design criteria specifically for polders in Jakarta. In de DKI 3-9 project, NEDECO has therefore proposed the following safety level (NEDECO, 2004):
TABLE 5 - RETURN PERIODS FOR POLDER DESIGN IN THE DKI 3-9 PROJECT (NEDECO, 2004)
Element
Return Period [T]
River / major drain dike or boundary embankments
25
Waduk / retention basin 10
Pumping station 10
Culvert 5-10
Channel/drains 5
14
A difference from the Flood Control Manual is that in this table none of the return periods are specified by the size of the catchment area or the building density. It is also remarkable that the different elements in a polder have different design return periods. In this way it is still possible that a flooding in the polder occurs if for example a channel / drain is flooding while the rivers or waduks in the polder are designed for a return period that should be able to handle the amount of water. In the DKI 3-9 document are no definitions given for the different elements Table 5.
4.3 RETURN PERIODS WITH CORRESPONDING AMOUNT OF RAINFALL
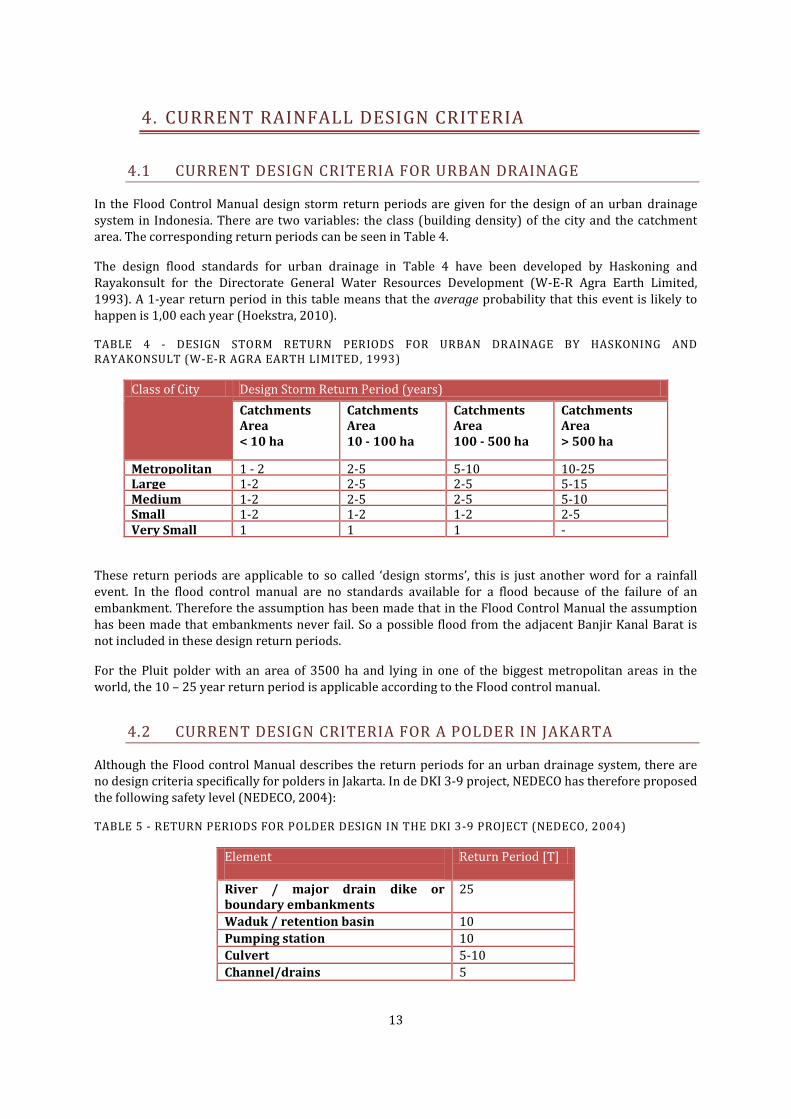
For the amount of rainfall in mm, the design events from the FHM-model from Deltares will be used. These design events represent the maximum hydraulic load on the system in a given return period. The design events which will be used contain a combination of rainfall and sea water levels. From 29 weather stations in the Jakarta basin, different plausible rainfall scenarios were created. These scenarios can be considered representative for the T-year event (where values of T = 1, 2, 5, 10, 25, 50, 100, 150, 200, 250, 500 and 1,000 years are considered) (Deltares, 2010).
These scenarios were created by simulating first three days of rainfall to create wet initial conditions in the model before the real extreme rainfall occurs.
The amount of rainfall on the day that the extreme rainfall occurs is constructed by deriving the rainfall from each individual rainfall station. Then the rainfall is spatially interpolated over the basin using Thiessen polygons. After that an area reduction factor of 0.9 and a multiplication factor of 1.12 is applied to create a representative 24-hour rainfall instead of the daily rainfall. Finally a standard hyetograph is applied to obtain the rainfall for each hour (Deltares, 2010). In appendix A is a detailed description about how these scenarios were created by Deltares.
These steps lead towards the following amounts of rainfall in mm / day for the rainfall stations which are representative for the amount of rainfall sub catchment areas in the Pluit, Melati and Cideng polders:
TABLE 6 – DAILY RAINFALL IN MM (DELTARES, 2010)
Return period
Station: 1 2 5 10 25 50 100 150 200 250 500 1000
Batavia/Jakarta Pusat 91 107 130 147 172 190 208 219 226 232 250 268
Tanahabang 87 102 124 140 163 181 198 208 215 221 238 255
Kemayoran 112 124 144 157 178 192 207 216 222 227 241 256
TABLE 7 - 24-HOUR RAINFALL IN MM AFTER AREAL REDUCTION FACTOR
Return period
Station: 1 2 5 10 25 50 100 150 200 250 500 1000
Batavia/Jakarta Pusat 92 108 131 148 173 192 210 221 228 234 252 270
Tanahabang 88 103 125 141 164 182 200 210 217 223 240 257
Kemayoran 113 125 145 158 179 194 209 218 224 229 243 258
FIGURE 11 - AVAILABLE RAINFALL STATIONS (DELTARES, 2010)
15
5. IMPLEMENTATION OF MINIMUM RETURN PERIODS
5.1 RETURN PERIODS USED IN DKI 3-8 AND JICA 1991
The Drainage Management for Jakarta Priority Assistance (DKI 3-8) project describes the micro and sub micro drains in Pluit as channels with an area from 10 to 400 ha (Lois Berger Inc. and PT. Indah Karya, 2004). According to Table 4 the 10- 100 ha Catchment areas should have a 2 – 5- year return period and the 100 – 500 ha catchment areas should have a 5 – 10-year return period. The DKI 3-8 project has implemented the 5-year return period which is corresponding with the return periods advised in the Flood Control Manual by W-E-R Agra Limited (NEDECO, 2003). Also the JICA Master Plan from 1991 recommended a design frequency of 5 years for the urban drainage systems in Jakarta which are lying between the Banjir Kanal Barat and Banjir Kanal Timur. Also this 5-year return period corresponds with the Flood Control Manual for areas between 10 and 500 ha.
5.2 RETURN PERIODS USED IN DKI 3-9
In the “Drainage Management for Jakarta: Strategic Action Program Development DKI 3-9” project the 5-year return was taken as the minimum return period because they are anticipating on a higher level of development in the urban catchments in the future. In consultation with DKI Jakarta there was decided that in areas where the flood-risk was considered high the 10-year return period was applied (NEDECO, 2004). Bricker et al. confirm this expectation of the development in the urban catchments of Jakarta, the land use has changed a lot since 1995. In 2009 almost the whole city was urbanized (Bricker et al., 2013).
5.3 RETURN PERIODS USED BY DINAS PEKERJAAN UMUM
Dinas Pekerjaan Umum DKI Jakarta uses return periods of 10 and 25 years. There are 13 rivers in Jakarta originating outside of the DKI Jakarta border (province border), these rivers are under the supervision of the ministry of Public Works in Indonesia and considered as major drains with a return period of 25 years. Eighteen other rivers in Jakarta (under the supervision of DPU Jakarta) are also appointed as major drains and therefore have the 25-year return period. In the Pluit polder, the rivers with a 25-year return period are the Kali Cideng, Kali Besar and the AK Ciliwung Kota.
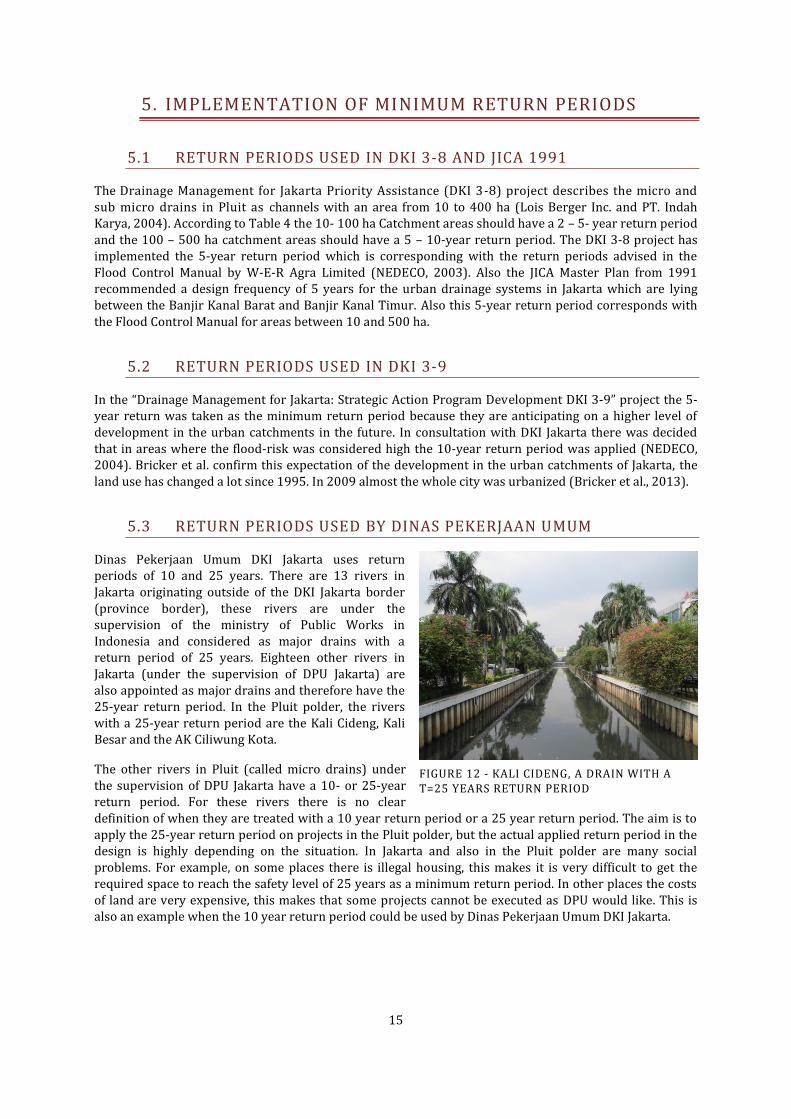
The other rivers in Pluit (called micro drains) under the supervision of DPU Jakarta have a 10- or 25-year return period. For these rivers there is no clear definition of when they are treated with a 10 year return period or a 25 year return period. The aim is to apply the 25-year return period on projects in the Pluit polder, but the actual applied return period in the design is highly depending on the situation. In Jakarta and also in the Pluit polder are many social problems. For example, on some places there is illegal housing, this makes it is very difficult to get the required space to reach the safety level of 25 years as a minimum return period. In other places the costs of land are very expensive, this makes that some projects cannot be executed as DPU would like. This is also an example when the 10 year return period could be used by Dinas Pekerjaan Umum DKI Jakarta.
FIGURE 12 - KALI CIDENG, A DRAIN WITH A T=25 YEARS RETURN PERIOD
16
5.4 RAINFALL RETURN PERIODS USED IN THIS RESEARCH
The Kali Ciliwung and Kali Cideng are both part of the macro system in the Pluit polder which is proposed by NEDECO in 1973. The macro-micro system is still used by Dinas Pekerjaan Umum. Both, the Kali Ciliwung and and the Kali Cideng which both belong to the macro system are flowing towards the waduk Pluit. Also the waduk Melati is part of the Kali Ciliwung. Because both waduks are part of the macro system, the return periods in this research will also get the return period of the macro system. In 1973 the return period was 25 years and at the moment also the 25-year is still applied. The return period that will be used in this research will also be the 25-year return period.
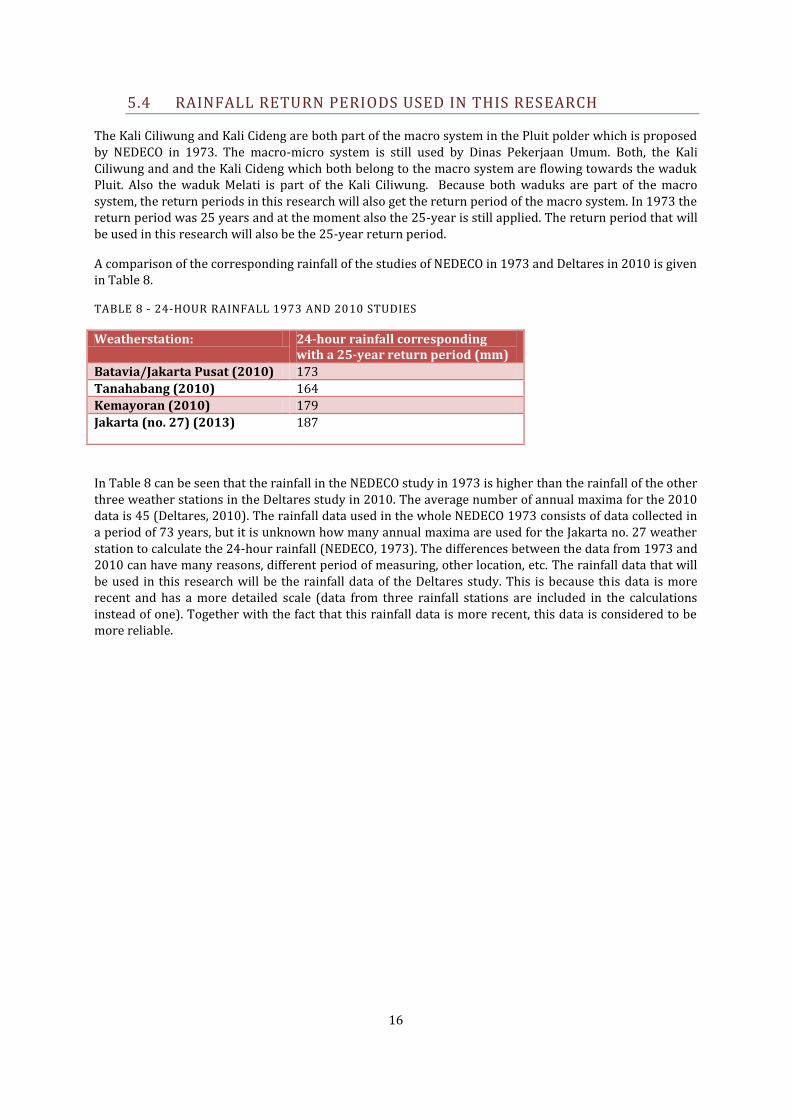
A comparison of the corresponding rainfall of the studies of NEDECO in 1973 and Deltares in 2010 is given in Table 8.
TABLE 8 - 24-HOUR RAINFALL 1973 AND 2010 STUDIES
Weatherstation: 24-hour rainfall corresponding with a 25-year return period (mm)
Batavia/Jakarta Pusat (2010) 173
Tanahabang (2010) 164
Kemayoran (2010) 179
Jakarta (no. 27) (2013) 187
In Table 8 can be seen that the rainfall in the NEDECO study in 1973 is higher than the rainfall of the other three weather stations in the Deltares study in 2010. The average number of annual maxima for the 2010 data is 45 (Deltares, 2010). The rainfall data used in the whole NEDECO 1973 consists of data collected in a period of 73 years, but it is unknown how many annual maxima are used for the Jakarta no. 27 weather station to calculate the 24-hour rainfall (NEDECO, 1973). The differences between the data from 1973 and 2010 can have many reasons, different period of measuring, other location, etc. The rainfall data that will be used in this research will be the rainfall data of the Deltares study. This is because this data is more recent and has a more detailed scale (data from three rainfall stations are included in the calculations instead of one). Together with the fact that this rainfall data is more recent, this data is considered to be more reliable.
17
6. CURRENT AND FUTURE SITUATION IN THE PLUIT POLDER
6.1 SUBCATCHMENT AREAS
6.1.1 CURRENT SUBCATCHMENT AREAS
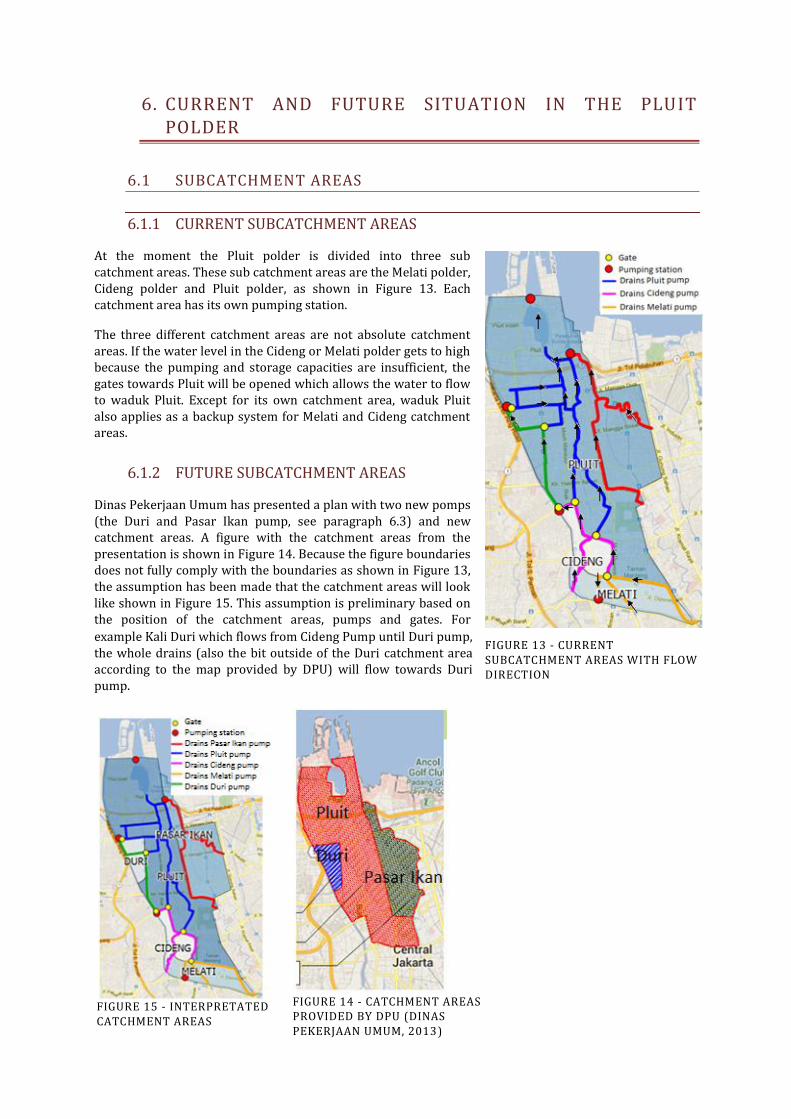
At the moment the Pluit polder is divided into three sub catchment areas. These sub catchment areas are the Melati polder, Cideng polder and Pluit polder, as shown in Figure 13. Each catchment area has its own pumping station.
The three different catchment areas are not absolute catchment areas. If the water level in the Cideng or Melati polder gets to high because the pumping and storage capacities are insufficient, the gates towards Pluit will be opened which allows the water to flow to waduk Pluit. Except for its own catchment area, waduk Pluit also applies as a backup system for Melati and Cideng catchment areas.
6.1.2 FUTURE SUBCATCHMENT AREAS
Dinas Pekerjaan Umum has presented a plan with two new pomps (the Duri and Pasar Ikan pump, see paragraph 6.3) and new catchment areas. A figure with the catchment areas from the presentation is shown in Figure 14. Because the figure boundaries does not fully comply with the boundaries as shown in Figure 13, the assumption has been made that the catchment areas will look like shown in Figure 15. This assumption is preliminary based on the position of the catchment areas, pumps and gates. For
example Kali Duri which flows from Cideng Pump until Duri pump, the whole drains (also the bit outside of the Duri catchment area according to the map provided by DPU) will flow towards Duri pump.
FIGURE 15 - INTERPRETATED CATCHMENT AREAS
FIGURE 14 - CATCHMENT AREAS PROVIDED BY DPU (DINAS PEKERJAAN UMUM, 2013)
FIGURE 13 - CURRENT SUBCATCHMENT AREAS WITH FLOW DIRECTION
18
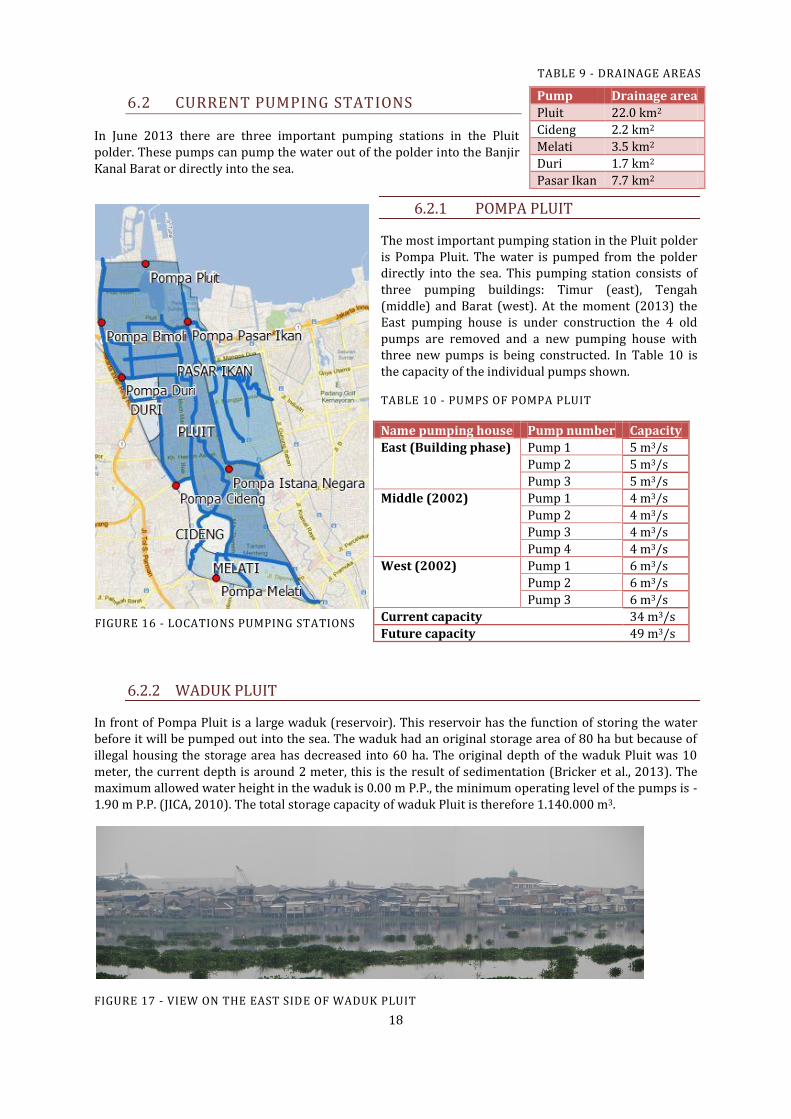
6.2 CURRENT PUMPING STATIONS
In June 2013 there are three important pumping stations in the Pluit polder. These pumps can pump the water out of the polder into the Banjir Kanal Barat or directly into the sea.
6.2.1 POMPA PLUIT
The most important pumping station in the Pluit polder is Pompa Pluit. The water is pumped from the polder directly into the sea. This pumping station consists of three pumping buildings: Timur (east), Tengah (middle) and Barat (west). At the moment (2013) the East pumping house is under construction the 4 old pumps are removed and a new pumping house with three new pumps is being constructed. In Table 10 is the capacity of the individual pumps shown.
TABLE 10 - PUMPS OF POMPA PLUIT
Name pumping house Pump number Capacity
East (Building phase) Pump 1 5 m3/s
Pump 2 5 m3/s
Pump 3 5 m3/s
Middle (2002) Pump 1 4 m3/s
Pump 2 4 m3/s
Pump 3 4 m3/s
Pump 4 4 m3/s
West (2002) Pump 1 6 m3/s
Pump 2 6 m3/s
Pump 3 6 m3/s
Current capacity 34 m3/s
Future capacity 49 m3/s
6.2.2 WADUK PLUIT
In front of Pompa Pluit is a large waduk (reservoir). This reservoir has the function of storing the water before it will be pumped out into the sea. The waduk had an original storage area of 80 ha but because of illegal housing the storage area has decreased into 60 ha. The original depth of the waduk Pluit was 10 meter, the current depth is around 2 meter, this is the result of sedimentation (Bricker et al., 2013). The maximum allowed water height in the waduk is 0.00 m P.P., the minimum operating level of the pumps is -1.90 m P.P. (JICA, 2010). The total storage capacity of waduk Pluit is therefore 1.140.000 m3.
FIGURE 17 - VIEW ON THE EAST SIDE OF WADUK PLUIT
Pump Drainage area
Pluit 22.0 km2
Cideng 2.2 km2
Melati 3.5 km2
Duri 1.7 km2
Pasar Ikan 7.7 km2
FIGURE 16 - LOCATIONS PUMPING STATIONS
TABLE 9 - DRAINAGE AREAS
19
6.2.3 POMPA CIDENG
The Pompa Cideng is located in the east of the Pluit polder. This pumping station has a service area of 750 ha. The pump house with six pumps was built in 1988, in 2010 four additional pumps were build (Dinas Pekerjaan Umum, 2009). If the capacity of the pumps at Pompa Cideng is lower than the flow rate towards Pompa Cideng, the gates towards Pompa Duri and Pompa Cideng will be opened, this will lower the water level in the Cideng polder. The new (2010) pumps are not able to operate when pumping on full capacity, the pump chamber is not large enough to handle more water than 40.2 m3/s (DPU, 2009).
TABLE 11 - PUMPS OF POMPA CIDENG
Pumps Pump number Capacity
Old pumps (1988) Pump 1 6.7 m3/s
Pump 2 6.7 m3/s
Pump 3 6.7 m3/s
Pump 4 6.7 m3/s
Pump 5 6.7 m3/s
Pump 6 6.7 m3/s
New pumps (2010) Pump 1 2 m3/s
Pump 2 2 m3/s
Pump 3 2 m3/s
Pump 4 2 m3/s
Total capacity 40.2 m3/s
6.2.4 POMPA MELATI
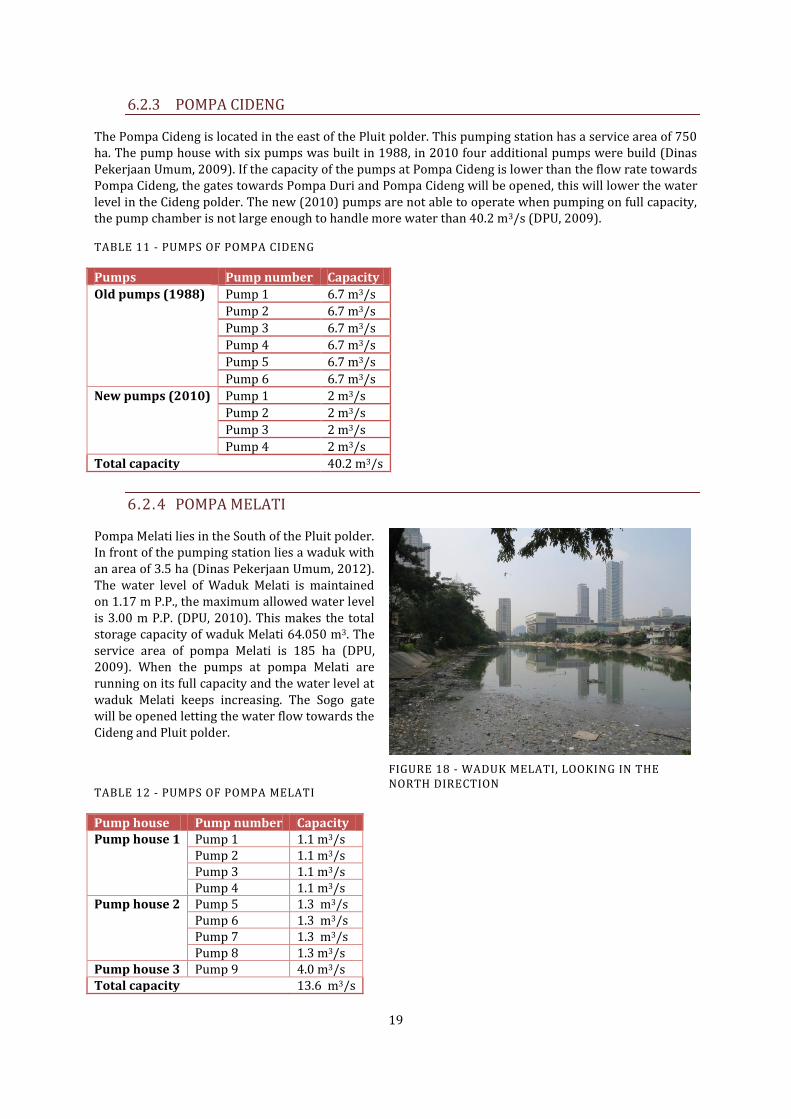
Pompa Melati lies in the South of the Pluit polder. In front of the pumping station lies a waduk with an area of 3.5 ha (Dinas Pekerjaan Umum, 2012). The water level of Waduk Melati is maintained on 1.17 m P.P., the maximum allowed water level is 3.00 m P.P. (DPU, 2010). This makes the total storage capacity of waduk Melati 64.050 m3. The service area of pompa Melati is 185 ha (DPU, 2009). When the pumps at pompa Melati are running on its full capacity and the water level at waduk Melati keeps increasing. The Sogo gate will be opened letting the water flow towards the Cideng and Pluit polder.
TABLE 12 - PUMPS OF POMPA MELATI
Pump house Pump number Capacity Pump house 1 Pump 1 1.1 m3/s
Pump 2 1.1 m3/s Pump 3 1.1 m3/s Pump 4 1.1 m3/s
Pump house 2 Pump 5 1.3 m3/s Pump 6 1.3 m3/s Pump 7 1.3 m3/s Pump 8 1.3 m3/s
Pump house 3 Pump 9 4.0 m3/s Total capacity 13.6 m3/s
FIGURE 18 - WADUK MELATI, LOOKING IN THE NORTH DIRECTION
20
6.2.5 POMPA ISTANA NEGARA
The pompa Istana Negara is a small pump with a capacity of 1 m3/s (Dinas Pekerjaan Umum, 2010). The pump is located at the presidential palace.
6.2.6 POMPA BIMOLI
Pompa Bimoli is a small pump in the north east of the Pluit polder with a total pumping capacity of 1 m3/s. The pump only pumps water from a small sub catchment area into the Kali Karang (Dinas Pekerjaan Umum, 2010).
6.3 CURRENT PROJECTS
At the moment there are two new pumping stations being constructed. Also the waduk Pluit is being dredged.
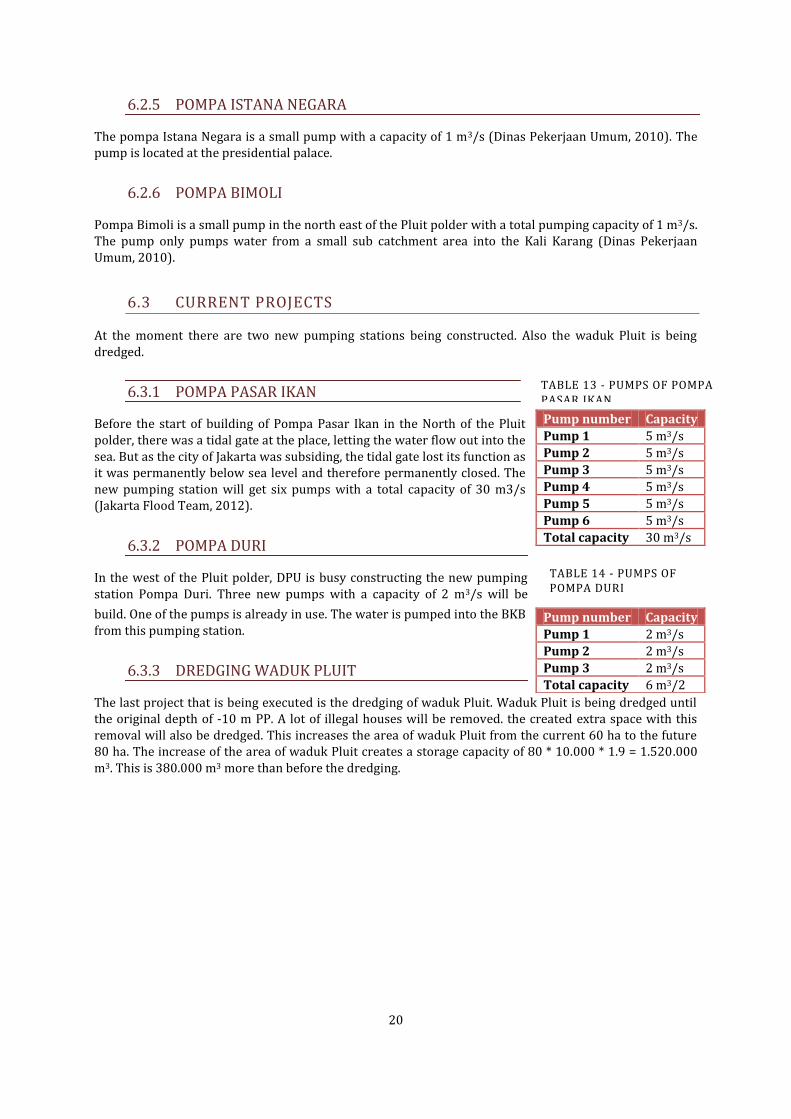
6.3.1 POMPA PASAR IKAN
Before the start of building of Pompa Pasar Ikan in the North of the Pluit polder, there was a tidal gate at the place, letting the water flow out into the sea. But as the city of Jakarta was subsiding, the tidal gate lost its function as it was permanently below sea level and therefore permanently closed. The new pumping station will get six pumps with a total capacity of 30 m3/s (Jakarta Flood Team, 2012).
6.3.2 POMPA DURI
In the west of the Pluit polder, DPU is busy constructing the new pumping station Pompa Duri. Three new pumps with a capacity of 2 m3/s will be
build. One of the pumps is already in use. The water is pumped into the BKB from this pumping station.
6.3.3 DREDGING WADUK PLUIT
The last project that is being executed is the dredging of waduk Pluit. Waduk Pluit is being dredged until the original depth of -10 m PP. A lot of illegal houses will be removed. the created extra space with this removal will also be dredged. This increases the area of waduk Pluit from the current 60 ha to the future 80 ha. The increase of the area of waduk Pluit creates a storage capacity of 80 * 10.000 * 1.9 = 1.520.000 m3. This is 380.000 m3 more than before the dredging.
Pump number Capacity
Pump 1 5 m3/s
Pump 2 5 m3/s
Pump 3 5 m3/s
Pump 4 5 m3/s
Pump 5 5 m3/s
Pump 6 5 m3/s
Total capacity 30 m3/s
Pump number Capacity
Pump 1 2 m3/s
Pump 2 2 m3/s
Pump 3 2 m3/s
Total capacity 6 m3/2
TABLE 13 - PUMPS OF POMPA PASAR IKAN
TABLE 14 - PUMPS OF POMPA DURI
21
7. FLOOD HAZARD MAPPING MODEL
In this chapter all the changes that have been made to the cut out of the Flood Hazard Mapping model to create two models (one for the current situation and one for the future situation) of the Pluit polder are explained. All the standard operation procedures (SOP) mentioned in this chapter are applied in the model. The standard operation procedures for the current situation are in m P.P., this is the reference height level of Indonesia. Although the place where the P.P. level is defined is subsiding, this reference level is still used.
7.1 MODEL CHANGES FOR THE CURRENT SITUATION
7.1.1 POMPA PLUIT
In the latest version of the FHM 2012 situation the eastern pumping house at Pompa Pluit is still modeled with the old pumping house. At the moment a new eastern pumping house is being built, therefore the eastern pumping house is not operating. Because the eastern pumping house is not operating, the whole standard operation procedure for Pompa Pluit is changed.
7.1.1.1 MIDDLE PUMPING HOUSE
For the middle pumping house the following standard operation procedure is implemented in the FHM model (JICA, 2010):
TABLE 15 - STANDARD OPERATION PROCEDURE (SOP) OF THE MIDDLE PLUIT PUMPING HOUSE
Stage Capacity Switch on level (m P.P.) Switch off level (m P.P.) 1 6 -1.4 -1.5 2 12 -1 -1.1 3 18 -0.9 -1
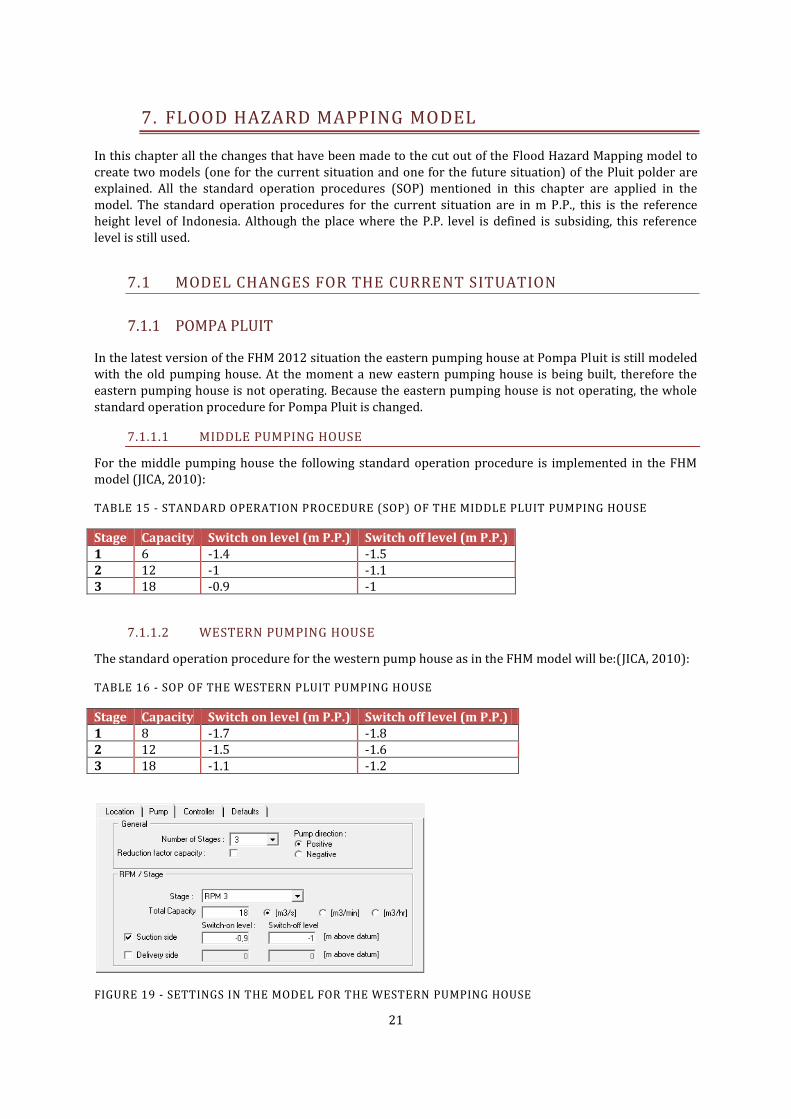
7.1.1.2 WESTERN PUMPING HOUSE
The standard operation procedure for the western pump house as in the FHM model will be:(JICA, 2010):
TABLE 16 - SOP OF THE WESTERN PLUIT PUMPING HOUSE
Stage Capacity Switch on level (m P.P.) Switch off level (m P.P.) 1 8 -1.7 -1.8 2 12 -1.5 -1.6 3 18 -1.1 -1.2
FIGURE 19 - SETTINGS IN THE MODEL FOR THE WESTERN PUMPING HOUSE
22
7.1.1.1 EASTERN PUMPING HOUSE
In the model the shutdown of the eastern pump house is implemented by changing the settings of the pump of the eastern pumping house to a fixed capacity of 0 m3/s.
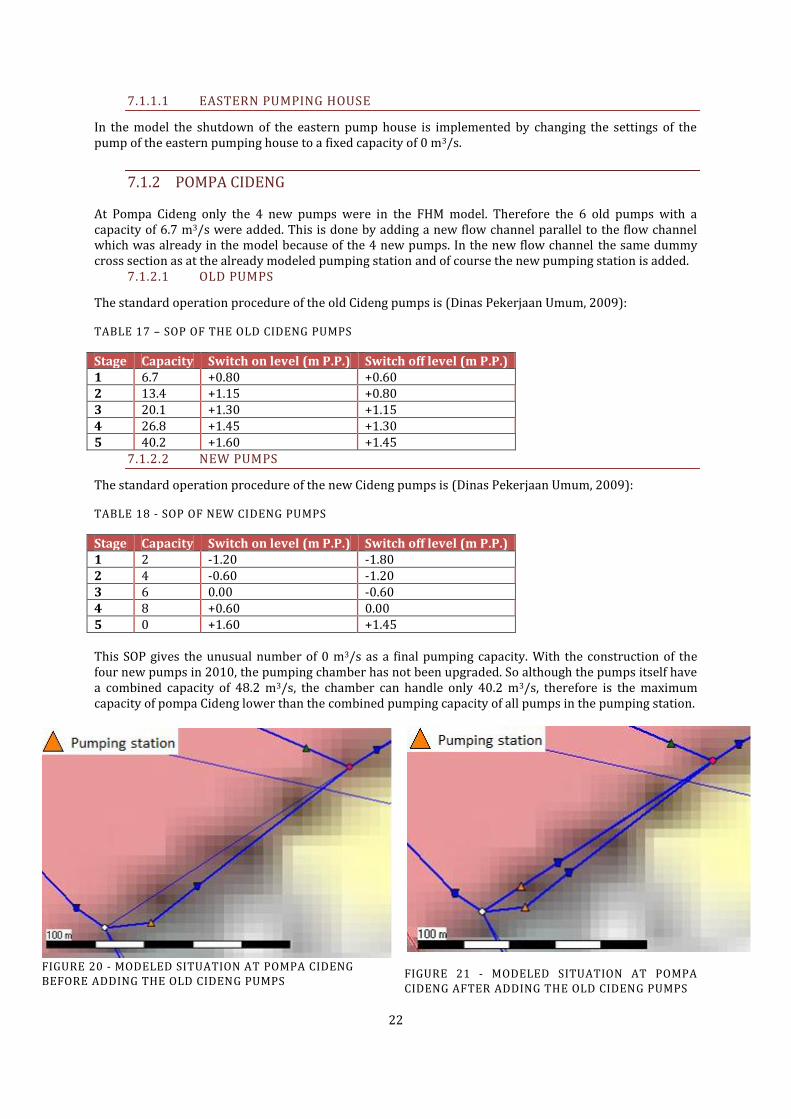
7.1.2 POMPA CIDENG
At Pompa Cideng only the 4 new pumps were in the FHM model. Therefore the 6 old pumps with a capacity of 6.7 m3/s were added. This is done by adding a new flow channel parallel to the flow channel which was already in the model because of the 4 new pumps. In the new flow channel the same dummy cross section as at the already modeled pumping station and of course the new pumping station is added.
7.1.2.1 OLD PUMPS
The standard operation procedure of the old Cideng pumps is (Dinas Pekerjaan Umum, 2009):
TABLE 17 – SOP OF THE OLD CIDENG PUMPS
Stage Capacity Switch on level (m P.P.) Switch off level (m P.P.) 1 6.7 +0.80 +0.60 2 13.4 +1.15 +0.80 3 20.1 +1.30 +1.15 4 26.8 +1.45 +1.30 5 40.2 +1.60 +1.45
7.1.2.2 NEW PUMPS
The standard operation procedure of the new Cideng pumps is (Dinas Pekerjaan Umum, 2009):
TABLE 18 - SOP OF NEW CIDENG PUMPS
Stage Capacity Switch on level (m P.P.) Switch off level (m P.P.) 1 2 -1.20 -1.80 2 4 -0.60 -1.20 3 6 0.00 -0.60 4 8 +0.60 0.00 5 0 +1.60 +1.45 This SOP gives the unusual number of 0 m3/s as a final pumping capacity. With the construction of the four new pumps in 2010, the pumping chamber has not been upgraded. So although the pumps itself have a combined capacity of 48.2 m3/s, the chamber can handle only 40.2 m3/s, therefore is the maximum capacity of pompa Cideng lower than the combined pumping capacity of all pumps in the pumping station.
FIGURE 21 - MODELED SITUATION AT POMPA CIDENG AFTER ADDING THE OLD CIDENG PUMPS
FIGURE 20 - MODELED SITUATION AT POMPA CIDENG BEFORE ADDING THE OLD CIDENG PUMPS
23
7.2 MODEL CHANGES FOR THE FUTURE SITUATION
In the future situation the projects described in chapter 6.3 will be finished. Some of the measures are already implemented in the ‘AM 2012 including all measures – 2007 simulation’ model made by Deltares. When information about the future situation cannot be found at Dinas Pekerjaan Umum DKI Jakarta, the measures as modeled in this version will adopted.
7.2.1 POMPA PLUIT
When the construction of the eastern Pluit pumping house will be finished, the total capacity of the pumping station will go up to 49 m3/s. When the eastern pumping house is working, the standard operation procedure of the pumps will change, therefore they will also be changed in the FHM model. The Standard Operation Procedure of the Pluit pumps when the new pump is finished is are found in the construction report of the East Pumping house.
7.2.1.1 EASTERN PUMPING HOUSE
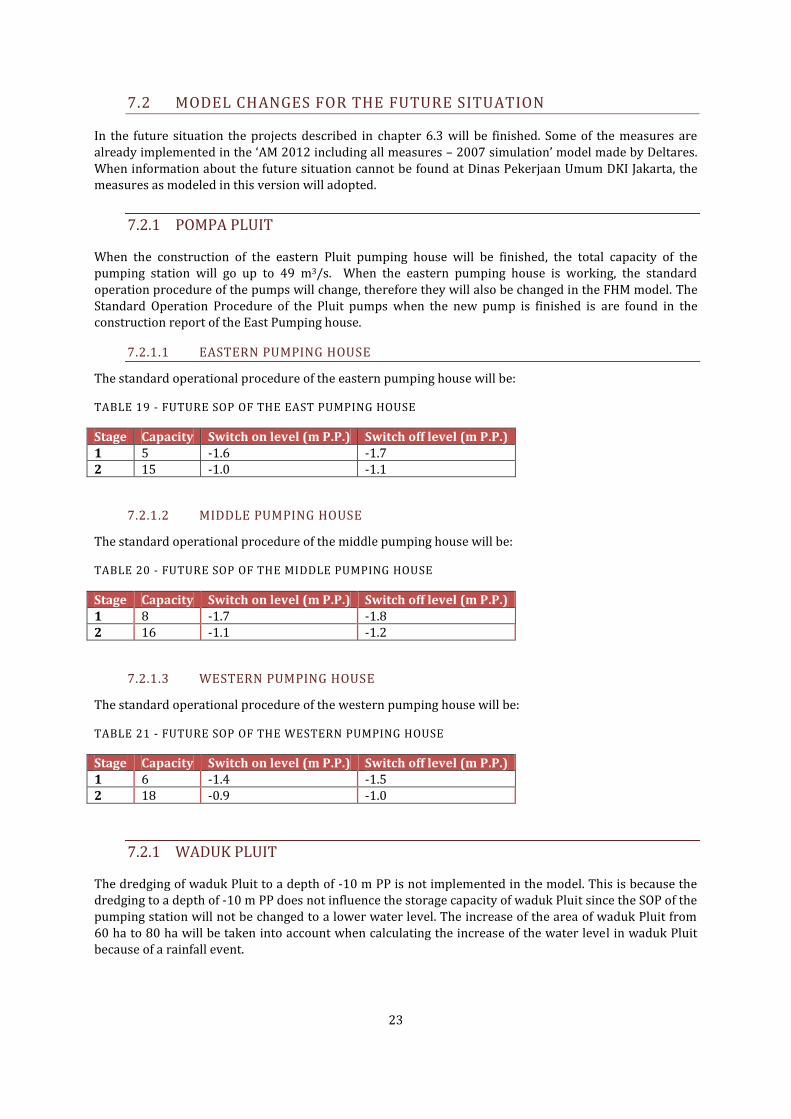
The standard operational procedure of the eastern pumping house will be:
TABLE 19 - FUTURE SOP OF THE EAST PUMPING HOUSE
Stage Capacity Switch on level (m P.P.) Switch off level (m P.P.) 1 5 -1.6 -1.7 2 15 -1.0 -1.1
7.2.1.2 MIDDLE PUMPING HOUSE
The standard operational procedure of the middle pumping house will be:
TABLE 20 - FUTURE SOP OF THE MIDDLE PUMPING HOUSE
Stage Capacity Switch on level (m P.P.) Switch off level (m P.P.) 1 8 -1.7 -1.8 2 16 -1.1 -1.2
7.2.1.3 WESTERN PUMPING HOUSE
The standard operational procedure of the western pumping house will be:
TABLE 21 - FUTURE SOP OF THE WESTERN PUMPING HOUSE
Stage Capacity Switch on level (m P.P.) Switch off level (m P.P.) 1 6 -1.4 -1.5 2 18 -0.9 -1.0
7.2.1 WADUK PLUIT
The dredging of waduk Pluit to a depth of -10 m PP is not implemented in the model. This is because the dredging to a depth of -10 m PP does not influence the storage capacity of waduk Pluit since the SOP of the pumping station will not be changed to a lower water level. The increase of the area of waduk Pluit from 60 ha to 80 ha will be taken into account when calculating the increase of the water level in waduk Pluit because of a rainfall event.
24
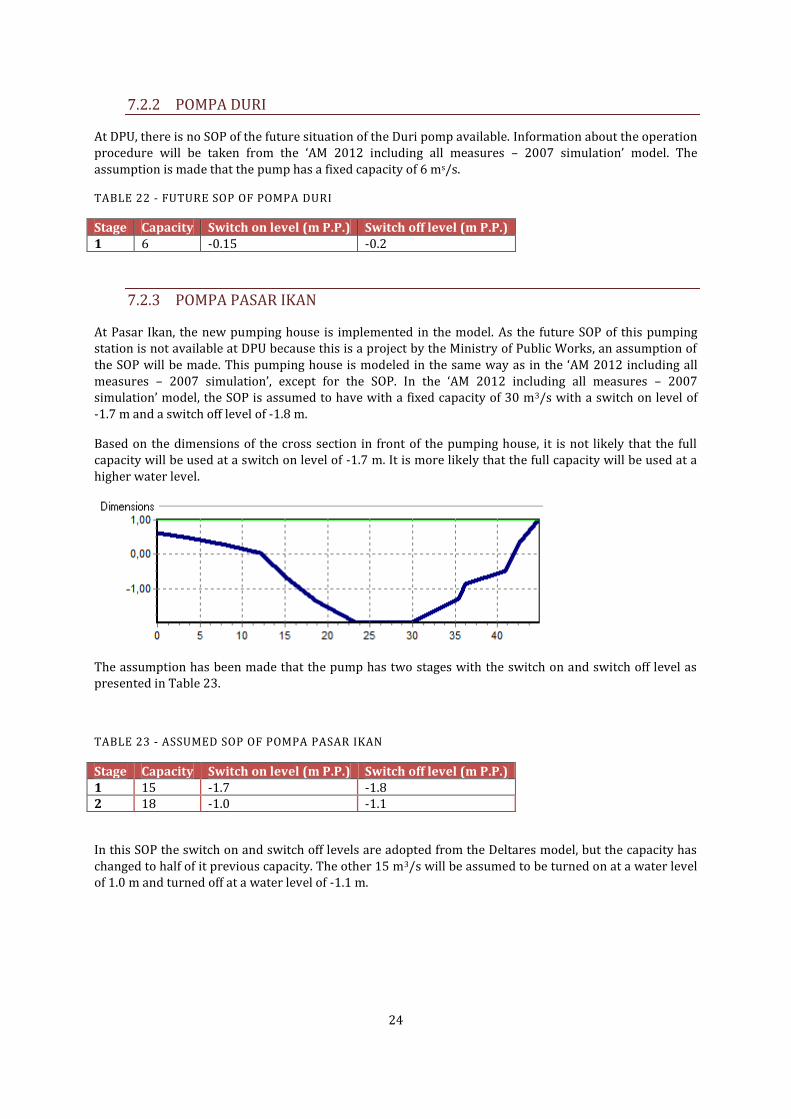
7.2.2 POMPA DURI
At DPU, there is no SOP of the future situation of the Duri pomp available. Information about the operation procedure will be taken from the ‘AM 2012 including all measures – 2007 simulation’ model. The assumption is made that the pump has a fixed capacity of 6 ms/s.
TABLE 22 - FUTURE SOP OF POMPA DURI
Stage Capacity Switch on level (m P.P.) Switch off level (m P.P.) 1 6 -0.15 -0.2
7.2.3 POMPA PASAR IKAN
At Pasar Ikan, the new pumping house is implemented in the model. As the future SOP of this pumping station is not available at DPU because this is a project by the Ministry of Public Works, an assumption of the SOP will be made. This pumping house is modeled in the same way as in the ‘AM 2012 including all measures – 2007 simulation’, except for the SOP. In the ‘AM 2012 including all measures – 2007 simulation’ model, the SOP is assumed to have with a fixed capacity of 30 m3/s with a switch on level of -1.7 m and a switch off level of -1.8 m.
Based on the dimensions of the cross section in front of the pumping house, it is not likely that the full capacity will be used at a switch on level of -1.7 m. It is more likely that the full capacity will be used at a higher water level.
The assumption has been made that the pump has two stages with the switch on and switch off level as presented in Table 23.
TABLE 23 - ASSUMED SOP OF POMPA PASAR IKAN
Stage Capacity Switch on level (m P.P.) Switch off level (m P.P.) 1 15 -1.7 -1.8 2 18 -1.0 -1.1
In this SOP the switch on and switch off levels are adopted from the Deltares model, but the capacity has changed to half of it previous capacity. The other 15 m3/s will be assumed to be turned on at a water level of 1.0 m and turned off at a water level of -1.1 m.
25
8. REQUIRED AMOUNT OF STORAGE CAPACITY
With the 25-year return period from chapter 5, the required amount of storage capacity will be calculated. These calculations will be made for the current situation and the future situation with the new pumps Pompa Pasar Ikan and Pompa Duri.
To calculate the required amount of storage, a cut out of the Flood Hazard Mapping model by Deltares is used like described in chapter 2.3.
8.1 CURRENT SITUATION
In this situation all the water gates are closed except for pintu air Sogo. According to DPU, this gate is opened in case of a flood so therefore it is also modeled as open. This situation creates two sub catchment systems, a shared system for the Melati and Cideng pump and an own catchment area for the Pluit pump and corresponds with a real flood situation.
8.1.1 PLUIT
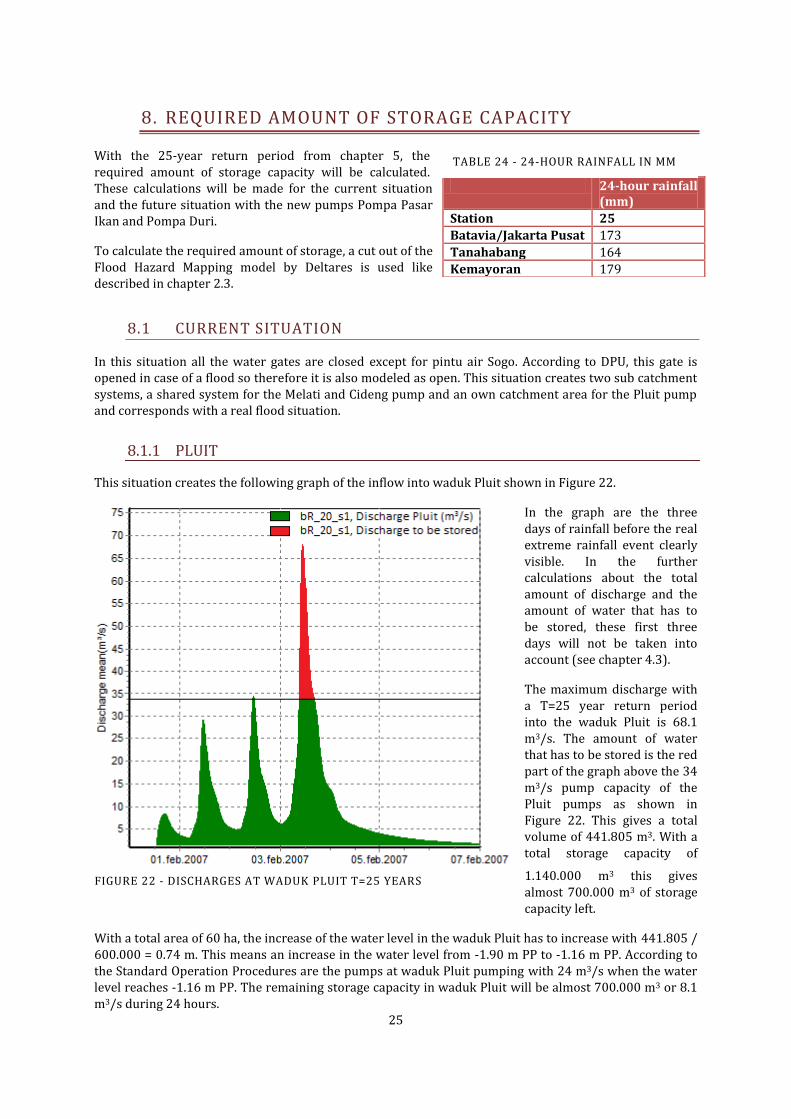
This situation creates the following graph of the inflow into waduk Pluit shown in Figure 22.
In the graph are the three days of rainfall before the real extreme rainfall event clearly visible. In the further calculations about the total amount of discharge and the amount of water that has to be stored, these first three days will not be taken into account (see chapter 4.3).
The maximum discharge with a T=25 year return period into the waduk Pluit is 68.1 m3/s. The amount of water that has to be stored is the red part of the graph above the 34 m3/s pump capacity of the Pluit pumps as shown in Figure 22. This gives a total volume of 441.805 m3. With a total storage capacity of
1.140.000 m3 this gives almost 700.000 m3 of storage capacity left.
With a total area of 60 ha, the increase of the water level in the waduk Pluit has to increase with 441.805 / 600.000 = 0.74 m. This means an increase in the water level from -1.90 m PP to -1.16 m PP. According to the Standard Operation Procedures are the pumps at waduk Pluit pumping with 24 m3/s when the water level reaches -1.16 m PP. The remaining storage capacity in waduk Pluit will be almost 700.000 m3 or 8.1 m3/s during 24 hours.
24-hour rainfall (mm)
Station 25
Batavia/Jakarta Pusat 173
Tanahabang 164
Kemayoran 179
TABLE 24 - 24-HOUR RAINFALL IN MM
FIGURE 22 - DISCHARGES AT WADUK PLUIT T=25 YEARS
26
8.1.2 CIDENG
The 25 year rainfall event gives the following discharges towards pompa Cideng.:
The discharges to pompa Cideng have a maximum of 34.0 m3/s. Since this maximum discharge is below the maximum pump capacity of 40.2 m3/s, this means that because of the big pumping capacity no storage capacity is necessary at pompa Cideng.
8.1.3 MELATI
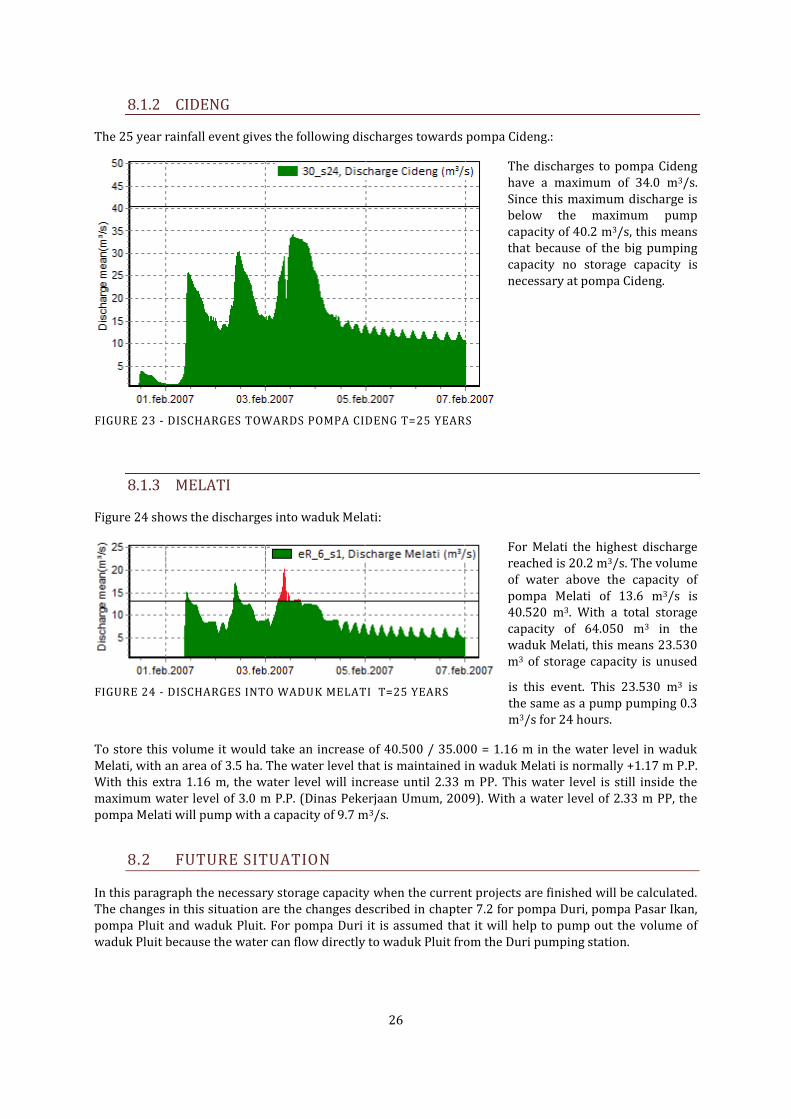
Figure 24 shows the discharges into waduk Melati:
For Melati the highest discharge reached is 20.2 m3/s. The volume of water above the capacity of pompa Melati of 13.6 m3/s is 40.520 m3. With a total storage capacity of 64.050 m3 in the waduk Melati, this means 23.530 m3 of storage capacity is unused
is this event. This 23.530 m3 is the same as a pump pumping 0.3 m3/s for 24 hours.
To store this volume it would take an increase of 40.500 / 35.000 = 1.16 m in the water level in waduk Melati, with an area of 3.5 ha. The water level that is maintained in waduk Melati is normally +1.17 m P.P. With this extra 1.16 m, the water level will increase until 2.33 m PP. This water level is still inside the maximum water level of 3.0 m P.P. (Dinas Pekerjaan Umum, 2009). With a water level of 2.33 m PP, the pompa Melati will pump with a capacity of 9.7 m3/s.
8.2 FUTURE SITUATION
In this paragraph the necessary storage capacity when the current projects are finished will be calculated. The changes in this situation are the changes described in chapter 7.2 for pompa Duri, pompa Pasar Ikan, pompa Pluit and waduk Pluit. For pompa Duri it is assumed that it will help to pump out the volume of waduk Pluit because the water can flow directly to waduk Pluit from the Duri pumping station.
FIGURE 23 - DISCHARGES TOWARDS POMPA CIDENG T=25 YEARS
FIGURE 24 - DISCHARGES INTO WADUK MELATI T=25 YEARS
27
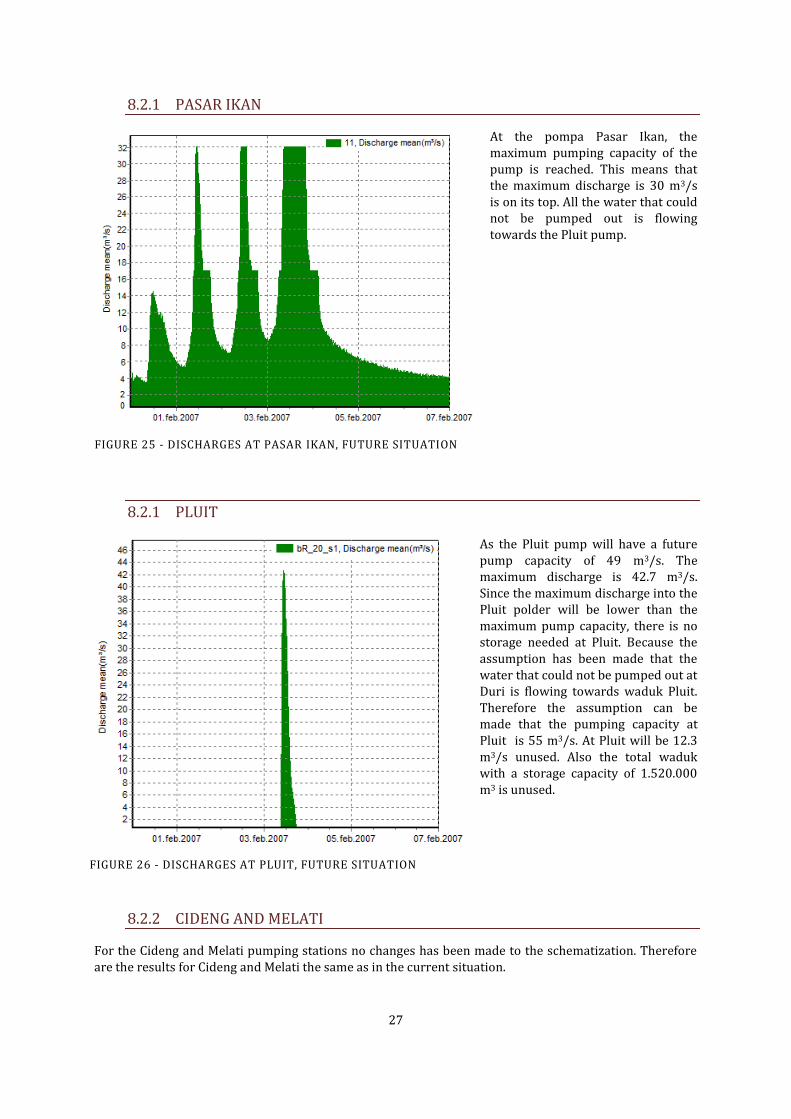
8.2.1 PASAR IKAN
At the pompa Pasar Ikan, the maximum pumping capacity of the pump is reached. This means that the maximum discharge is 30 m3/s is on its top. All the water that could not be pumped out is flowing towards the Pluit pump.
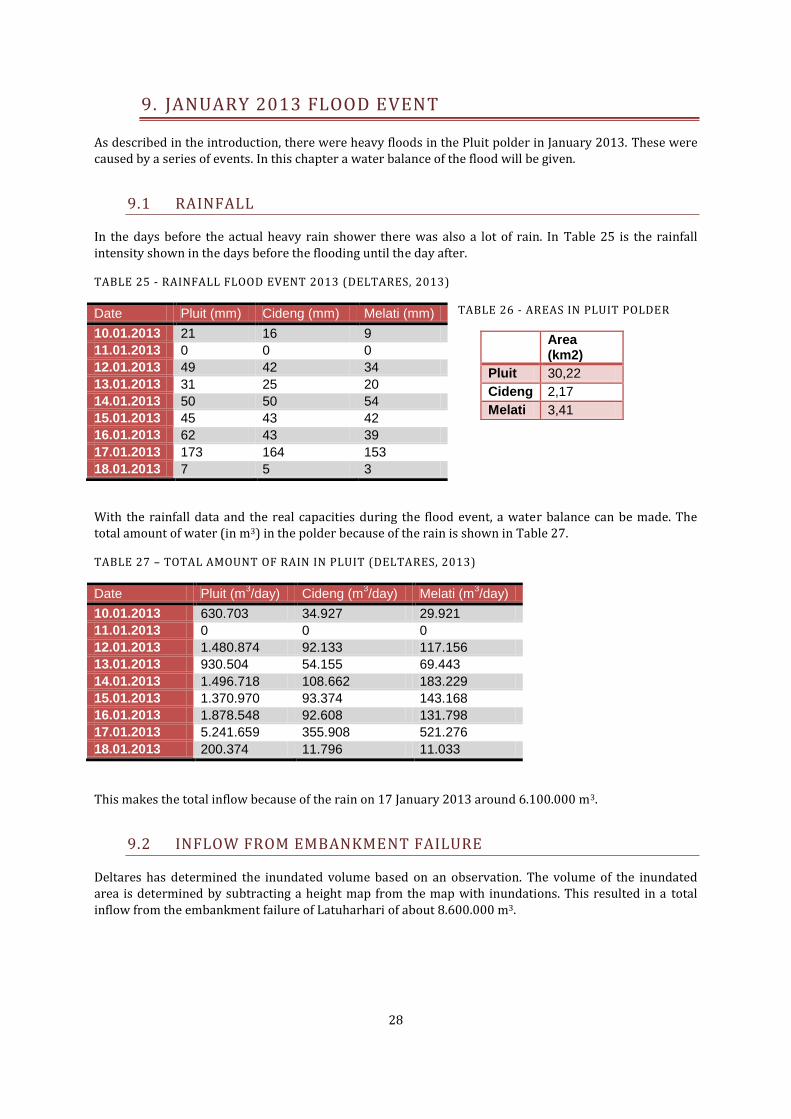
8.2.1 PLUIT
As the Pluit pump will have a future pump capacity of 49 m3/s. The maximum discharge is 42.7 m3/s. Since the maximum discharge into the Pluit polder will be lower than the maximum pump capacity, there is no storage needed at Pluit. Because the assumption has been made that the water that could not be pumped out at Duri is flowing towards waduk Pluit. Therefore the assumption can be made that the pumping capacity at Pluit is 55 m3/s. At Pluit will be 12.3 m3/s unused. Also the total waduk with a storage capacity of 1.520.000 m3 is unused.
8.2.2 CIDENG AND MELATI
For the Cideng and Melati pumping stations no changes has been made to the schematization. Therefore are the results for Cideng and Melati the same as in the current situation.
FIGURE 26 - DISCHARGES AT PLUIT, FUTURE SITUATION
FIGURE 25 - DISCHARGES AT PASAR IKAN, FUTURE SITUATION
28
9. JANUARY 2013 FLOOD EVENT
As described in the introduction, there were heavy floods in the Pluit polder in January 2013. These were caused by a series of events. In this chapter a water balance of the flood will be given.
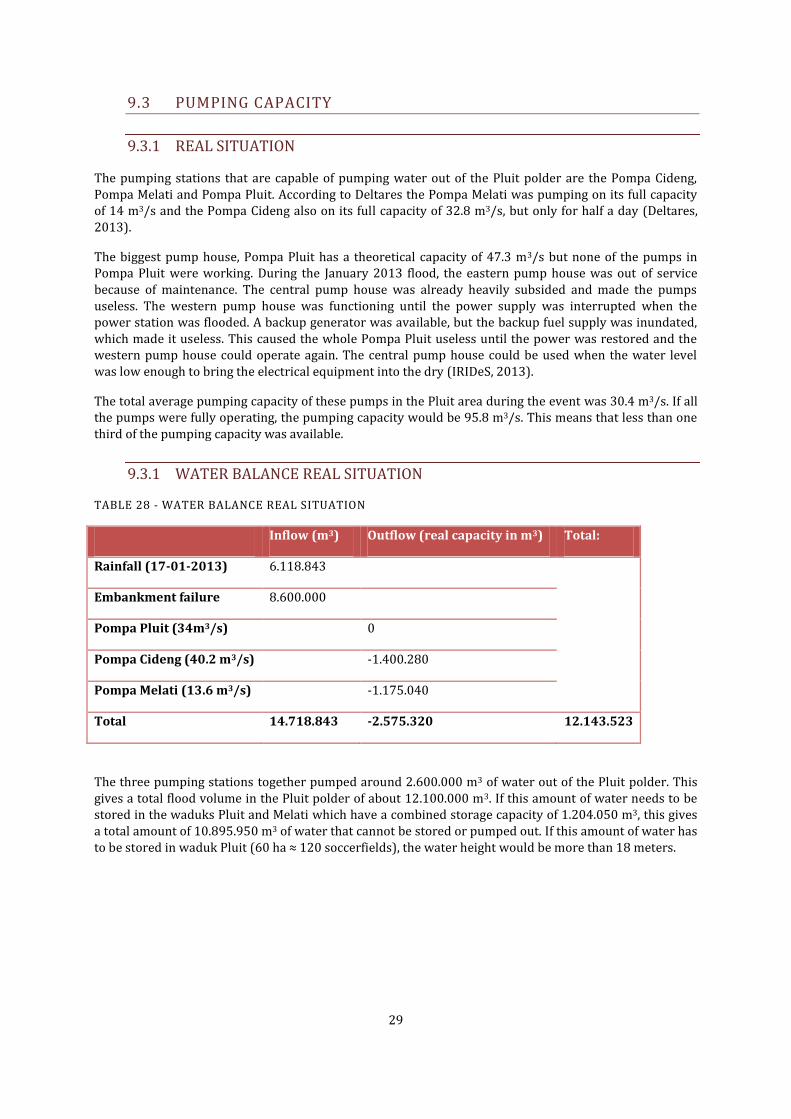
9.1 RAINFALL
In the days before the actual heavy rain shower there was also a lot of rain. In Table 25 is the rainfall intensity shown in the days before the flooding until the day after.
TABLE 25 - RAINFALL FLOOD EVENT 2013 (DELTARES, 2013)
TABLE 26 - AREAS IN PLUIT POLDER
With the rainfall data and the real capacities during the flood event, a water balance can be made. The total amount of water (in m3) in the polder because of the rain is shown in Table 27.
TABLE 27 – TOTAL AMOUNT OF RAIN IN PLUIT (DELTARES, 2013)
Date Pluit (m3/day) Cideng (m
3/day) Melati (m
3/day)
10.01.2013 630.703 34.927 29.921
11.01.2013 0 0 0
12.01.2013 1.480.874 92.133 117.156
13.01.2013 930.504 54.155 69.443
14.01.2013 1.496.718 108.662 183.229
15.01.2013 1.370.970 93.374 143.168
16.01.2013 1.878.548 92.608 131.798
17.01.2013 5.241.659 355.908 521.276
18.01.2013 200.374 11.796 11.033
This makes the total inflow because of the rain on 17 January 2013 around 6.100.000 m3.
9.2 INFLOW FROM EMBANKMENT FAILURE
Deltares has determined the inundated volume based on an observation. The volume of the inundated area is determined by subtracting a height map from the map with inundations. This resulted in a total inflow from the embankment failure of Latuharhari of about 8.600.000 m3.
Date Pluit (mm) Cideng (mm) Melati (mm)
10.01.2013 21 16 9
11.01.2013 0 0 0
12.01.2013 49 42 34
13.01.2013 31 25 20
14.01.2013 50 50 54
15.01.2013 45 43 42
16.01.2013 62 43 39
17.01.2013 173 164 153
18.01.2013 7 5 3
Area (km2)
Pluit 30,22
Cideng 2,17
Melati 3,41
29
9.3 PUMPING CAPACITY
9.3.1 REAL SITUATION
The pumping stations that are capable of pumping water out of the Pluit polder are the Pompa Cideng, Pompa Melati and Pompa Pluit. According to Deltares the Pompa Melati was pumping on its full capacity of 14 m3/s and the Pompa Cideng also on its full capacity of 32.8 m3/s, but only for half a day (Deltares, 2013).
The biggest pump house, Pompa Pluit has a theoretical capacity of 47.3 m3/s but none of the pumps in Pompa Pluit were working. During the January 2013 flood, the eastern pump house was out of service because of maintenance. The central pump house was already heavily subsided and made the pumps useless. The western pump house was functioning until the power supply was interrupted when the power station was flooded. A backup generator was available, but the backup fuel supply was inundated, which made it useless. This caused the whole Pompa Pluit useless until the power was restored and the western pump house could operate again. The central pump house could be used when the water level was low enough to bring the electrical equipment into the dry (IRIDeS, 2013).
The total average pumping capacity of these pumps in the Pluit area during the event was 30.4 m3/s. If all the pumps were fully operating, the pumping capacity would be 95.8 m3/s. This means that less than one third of the pumping capacity was available.
9.3.1 WATER BALANCE REAL SITUATION
TABLE 28 - WATER BALANCE REAL SITUATION
Inflow (m3) Outflow (real capacity in m3) Total:
Rainfall (17-01-2013) 6.118.843
Embankment failure 8.600.000
Pompa Pluit (34m3/s) 0
Pompa Cideng (40.2 m3/s) -1.400.280
Pompa Melati (13.6 m3/s) -1.175.040
Total 14.718.843 -2.575.320 12.143.523
The three pumping stations together pumped around 2.600.000 m3 of water out of the Pluit polder. This gives a total flood volume in the Pluit polder of about 12.100.000 m3. If this amount of water needs to be stored in the waduks Pluit and Melati which have a combined storage capacity of 1.204.050 m3, this gives a total amount of 10.895.950 m3 of water that cannot be stored or pumped out. If this amount of water has to be stored in waduk Pluit (60 ha ≈ 120 soccerfields), the water height would be more than 18 meters.
30
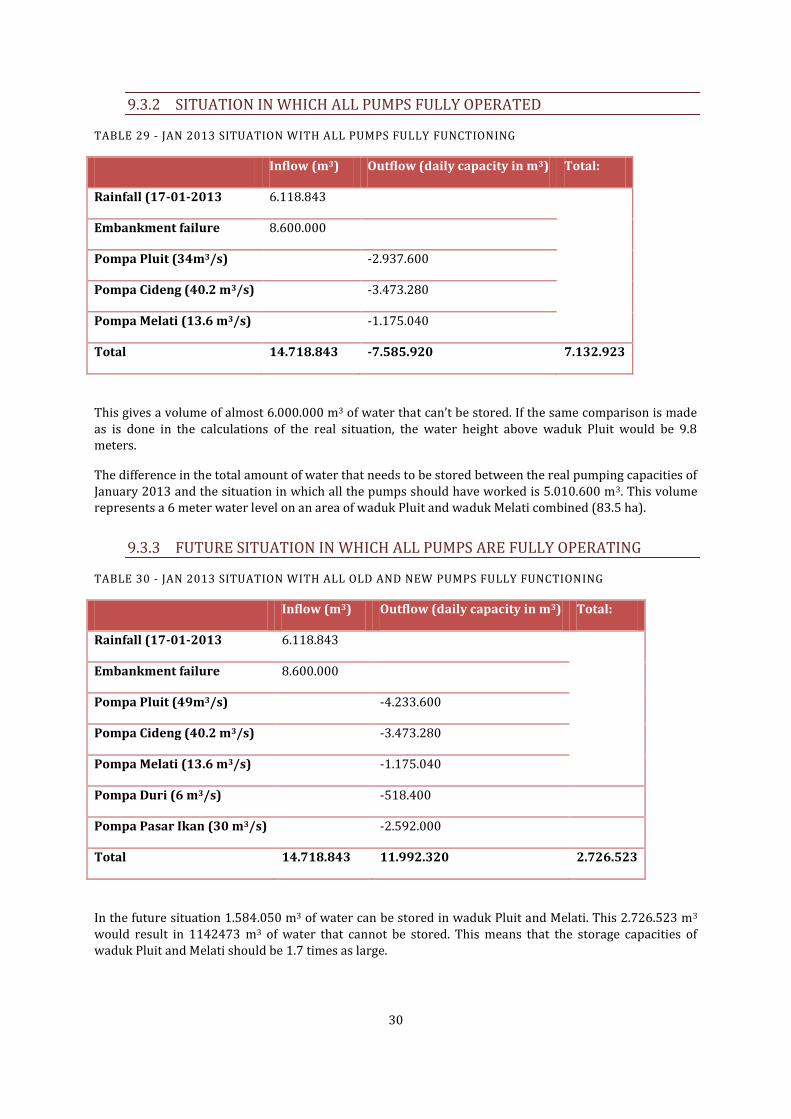
9.3.2 SITUATION IN WHICH ALL PUMPS FULLY OPERATED
TABLE 29 - JAN 2013 SITUATION WITH ALL PUMPS FULLY FUNCTIONING
Inflow (m3) Outflow (daily capacity in m3) Total:
Rainfall (17-01-2013 6.118.843
Embankment failure 8.600.000
Pompa Pluit (34m3/s) -2.937.600
Pompa Cideng (40.2 m3/s) -3.473.280
Pompa Melati (13.6 m3/s) -1.175.040
Total 14.718.843 -7.585.920 7.132.923
This gives a volume of almost 6.000.000 m3 of water that can’t be stored. If the same comparison is made as is done in the calculations of the real situation, the water height above waduk Pluit would be 9.8 meters.
The difference in the total amount of water that needs to be stored between the real pumping capacities of January 2013 and the situation in which all the pumps should have worked is 5.010.600 m3. This volume represents a 6 meter water level on an area of waduk Pluit and waduk Melati combined (83.5 ha).
9.3.3 FUTURE SITUATION IN WHICH ALL PUMPS ARE FULLY OPERATING
TABLE 30 - JAN 2013 SITUATION WITH ALL OLD AND NEW PUMPS FULLY FUNCTIONING
Inflow (m3) Outflow (daily capacity in m3) Total:
Rainfall (17-01-2013 6.118.843
Embankment failure 8.600.000
Pompa Pluit (49m3/s) -4.233.600
Pompa Cideng (40.2 m3/s) -3.473.280
Pompa Melati (13.6 m3/s) -1.175.040
Pompa Duri (6 m3/s) -518.400
Pompa Pasar Ikan (30 m3/s) -2.592.000
Total 14.718.843 11.992.320 2.726.523
In the future situation 1.584.050 m3 of water can be stored in waduk Pluit and Melati. This 2.726.523 m3 would result in 1142473 m3 of water that cannot be stored. This means that the storage capacities of waduk Pluit and Melati should be 1.7 times as large.
31
10. DISCUSSION
In this research some assumptions were done. The most important assumptions are about Standard Operation Procedures. The SOP of Pluit was from the report of the new East pumping house at Pluit. The new and old SOP of pompa Pluit was described in the document. However, the SOP of the pumping station with the old East pumping house was not correct, this makes the new SOP for the pumping station also less reliable. This would cause a small effect in the results as a different SOP is used. The size of the difference in the results is depending of the actual SOP.
The Standard Operation Procedures of the Duri pump and Pasar Ikan pump were not available, for these pumping station assumptions about the SOP has been made. The discharges into waduk Pluit are most of the time zero when the Pasar Ikan pump is running. In the real future situation, this will probably not be the case. It is more likely that the SOP of Pasar Ikan will be made in such a way that pompa Pluit and pompa Pasar Ikan will start pumping at about the same time. The effect in the results can be seen in Figure 25 and Figure 26. Pasar Ikan is doing most of the pumping while pompa Pluit is only pumping for a very short time. This does not really matter because both pumping stations are pumping from the same drainage area.
During the research a flaw in the rainfall runoff part of the FHM model was discovered. In the northern part is an area of which it looks unrealistic that the water will flow like it is modeled. This only causes a small error in the results because only the rainfall from a small sub-sub catchment area is modeled to flow towards a wrong reach. Because of the lack of time this could not be fixed.
32
11. CONCLUSIONS
The Pluit drainage system is designed by NEDECO in 1973. The design criteria that have been used in this master plan contain a 25-year return period for the major drains. These major drains are defined as a number of designated rivers in Jakarta, for the Pluit drainage system only the kali Cideng, kali Besar and AK Ciliwung Kota belong to this group. All of the other drains which are not appointed as major drains are so called micro drains. These drains have a 2-year return period.
Since 1973, the used return periods in projects increased. In the DKI 3-9 project, the 5-year return period was applied. In areas that were considered to have a ‘high flood risk’, a 10-year return period was applied in consultation with DKI Jakarta for some of the minor drains. The 5- and the higher 10-year return period were chosen because in this project they were anticipating on a higher level of development in the future. For new projects, DPU is trying to use the higher 25-year return period for the drains in the micro drainage system, but this is not an absolute criterion. If the conditions, like illegal housing or high land prices make it very difficult or even impossible to implement the 25-year return period, the 10-year return period is maintained. The 25-year return period for the major drains is still applied by Dinas Pekerjaan Umum (DPU) and the Ministry of Public Works.
At this moment, the pompa Melati is not capable of pumping the inflow into waduk Melati out into the BKB by itself. This means that water has to be stored in the waduk Melati in case of a 25-year return year rainfall event. 63 % of the storage capacity of waduk Melati will be used. If the Melati pump would not be able to drain all the rain by itself the pintu air (water gate) Sogo will be opened and the water will flow to the Cideng pump. This pump with a total capacity of 40.2 m3/s is able to drain the rainfall of a 25-year return year by itself. The Pluit pump cannot pump out all the water by itself, but the waduk in front of the Pluit pump is big enough to store this volume of water, 39 % of the storage capacity of waduk Pluit will be used after a 25-year rainfall event. We can conclude that if all the pumps in the Pluit polder are working on their full capacity, the pump- and storage capacity meet the design criteria to handle a rainfall event with a 25-year return period. The total unused storage capacity of the waduks will be 721.725 m3. This requires a pumping capacity of 8.35 m3/s running for 24-hours. In the current situation a total pumping capacity of 8.35 m3/s can be down in Pluit during a 25-year rainfall return period without any flooding. If the pumps with a combined pumping capacity of more than 8.35 m3/s are broke down, floodings will occur.
In the future situation the extra pumps of Duri and Pasar Ikan will add more pump capacity. Also the waduk Pluit will get a bigger area, from 60 ha to 80 ha. These projects will increase the pumping capacity and storage capacity of the Pluit polder. At pompa Pluit, 12.3 m3/s of pumping capacity is unused and the total of 1.520.000 m3 of storage capacity unused. At Melati the same 23.530 m3 are available as in the current situation. These unused pumping capacities and storage capacities create a safety zone of 30.2 m3/s. So if the pumps with a combined pumping capacity of more than 30.2 m3/s are broke down, floodings will occur.
From the calculations about the January 2013 event can be seen that it is very important that all the pumps are able to operate at any time. If the pumps are operating like they did during the January 2013 flood event, the capacity of the pumps is reduced with more than 5 million m3 / day.

33
12. RECCOMENDATIONS
The pumping capacities in the Pluit polder are enough to handle a 25-year return period. There is even some backup capacity left. Because of this situation, it is recommended to DPU that they make sure that the system is functioning as it is designed, with the level of breakdowns kept to a minimum. It is recommended to DPU that the future focus should be on the maintenance of the pumping stations and waduks instead of building new pumping stations and waduks. In the current situation no more than 8.35 m3/s of pumping capacity may break down at the same moment. For the future situation no more than 30.2 m3/s may break down at the same moment. If the unavailable pumping capacities are more than these numbers it is not be guaranteed that the system meets the design criteria.
34
REFERENCES
Bricker, J.D., Kure, S., Muhari, A., Fututani, Y., Hanan, F. (2013) Second report of IRIDeS Fact-finding mission to Jakarta, Indonesia. IRIDeS
Central Intelligence Agency. (2013, April 1). World Fact Book. Retrieved from East & Southeast Asia Indonesia: https://www.cia.gov/library/publications/the-world-factbook/geos/id.html
Deltares (2010). Design events for the Ciliwung catchment.
Deltares (2009). Online monitoring and Flood Early Warning, Flood Hazard Mapping 2, Jakarta Flood Management 2.
Deltares (2013). Water balance Pluit.
Dinas Pekerjaan Umum (2009). Pedoman siaga banjir provinski DKI Jakarta.
Dinas Pekerjaan Umum (2010). Paparan pakwishnu gabungan master air 210907 sore dari bigram.
Dinas Pekerjaan Umum (2013). Proposal rencana penataan waduk Pluit.
Dinas Pekerjaan Umum (2012). Sistem dan pola pengendalian banjir di provinsi DKI Jakarta.
Guarín, G.P. (2008) Integrating local knowledge into GIS-based flood risk assessment.
Hoekstra, A.Y. (2010). Water. Dictaat faculteit construerende technische wetenschappen, Universiteit Twente.
Jakarta Flood Team (2013). FMIS – Main Report.
Jakarta Flood Team (2012). Flood management information system (FMIS) – Annex B Evaluation monitoring network.
Jakarta Flood Team (2007). Dutch assistance with non-structural measures Jakarta Flood Main Report (FHM1).
JICA (2010). Prepatory survey report on the project for urgent reconstruction of east pump station of Pluit in Jakarta the republic of Indonesia.
Lois Berger Inc. and PT. Indah Karya (2004), Drainage management for Jakarta: Priority assistance, WJEMP DKI3-8.
NEDECO (2004). Drainage management for Jakarta: Strategic action program development, DKI 3-9.
Nasrul, F. A., Schultz, B., Sustanto, R. H., & Suryadi, F. X. (2010). Impacts of changes on flood protection systems Case study of Indonesia and the Netherlands in comparative perspective.
Tanuwidjaja, G. (2010). Challenges in Creating Sustainable Urban Polder in DevelopingCountries, Case Study: Development of Pluit Polder, Jakarta.
Wagemaker, J., Miltenburg, M., Hartman, M., & Meidityawati, B. D. (2011). Gotong Royong in the Digital Age: Data and knowledge sharing for flood management in Jakarta. HKV.
Wisner Hydrology Consulting & Agra Earth & Environmental Limited (1994). Urban drainage guidelines and technical design standards.
W-E-R Agra Earth Limited, (1993). Flood control manual volume I summary of flood control criteria and guidelines.

35
W-E-R Agra Earth Limited, (1993). Flood control manual volume II manual for planning and surveys.
WL | Delft Hydraulics & HKV Consultants (2007). Dutch assistance with non-structural measures Jakarta flood management hydraulics
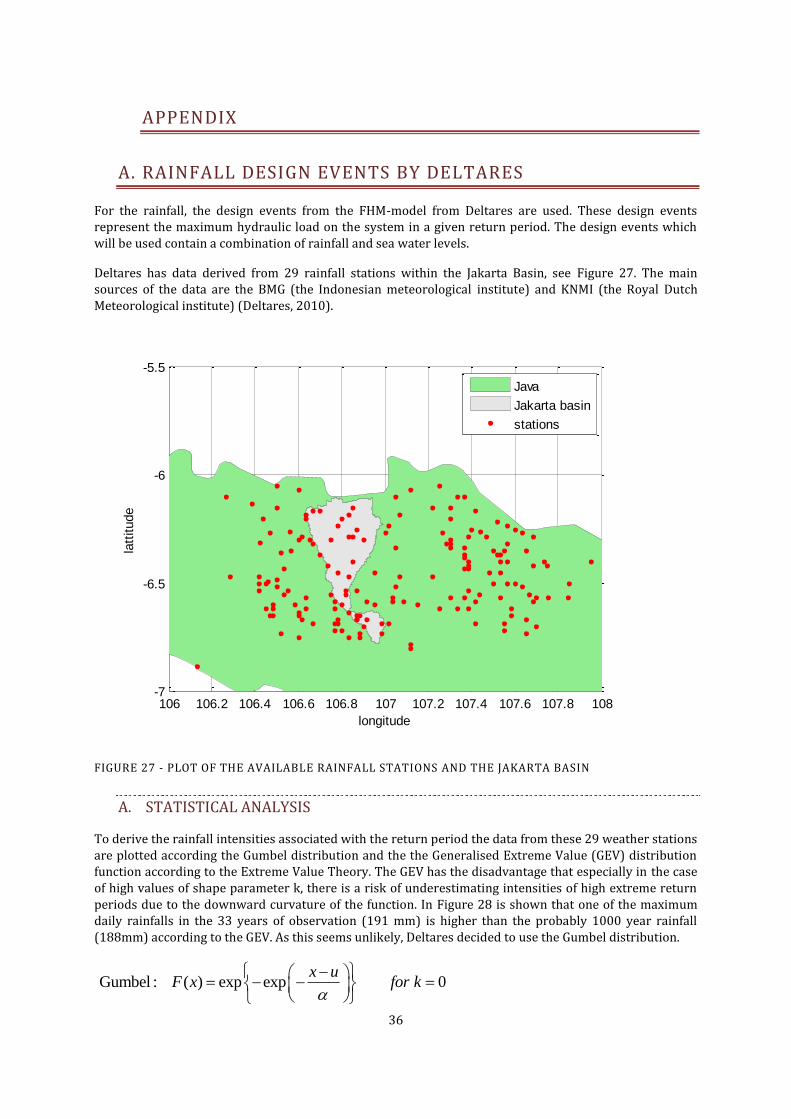
36
APPENDIX
A. RAINFALL DESIGN EVENTS BY DELTARES
For the rainfall, the design events from the FHM-model from Deltares are used. These design events represent the maximum hydraulic load on the system in a given return period. The design events which will be used contain a combination of rainfall and sea water levels.
Deltares has data derived from 29 rainfall stations within the Jakarta Basin, see Figure 27. The main sources of the data are the BMG (the Indonesian meteorological institute) and KNMI (the Royal Dutch Meteorological institute) (Deltares, 2010).
FIGURE 27 - PLOT OF THE AVAILABLE RAINFALL STATIONS AND THE JAKARTA BASIN
A. STATISTICAL ANALYSIS
To derive the rainfall intensities associated with the return period the data from these 29 weather stations are plotted according the Gumbel distribution and the the Generalised Extreme Value (GEV) distribution function according to the Extreme Value Theory. The GEV has the disadvantage that especially in the case of high values of shape parameter k, there is a risk of underestimating intensities of high extreme return periods due to the downward curvature of the function. In Figure 28 is shown that one of the maximum daily rainfalls in the 33 years of observation (191 mm) is higher than the probably 1000 year rainfall (188mm) according to the GEV. As this seems unlikely, Deltares decided to use the Gumbel distribution.
Gumbel : ( ) exp exp 0x u
F x for k
106 106.2 106.4 106.6 106.8 107 107.2 107.4 107.6 107.8 108-7
-6.5
-6
-5.5
longitude
latt
itude
Java
Jakarta basin
stations
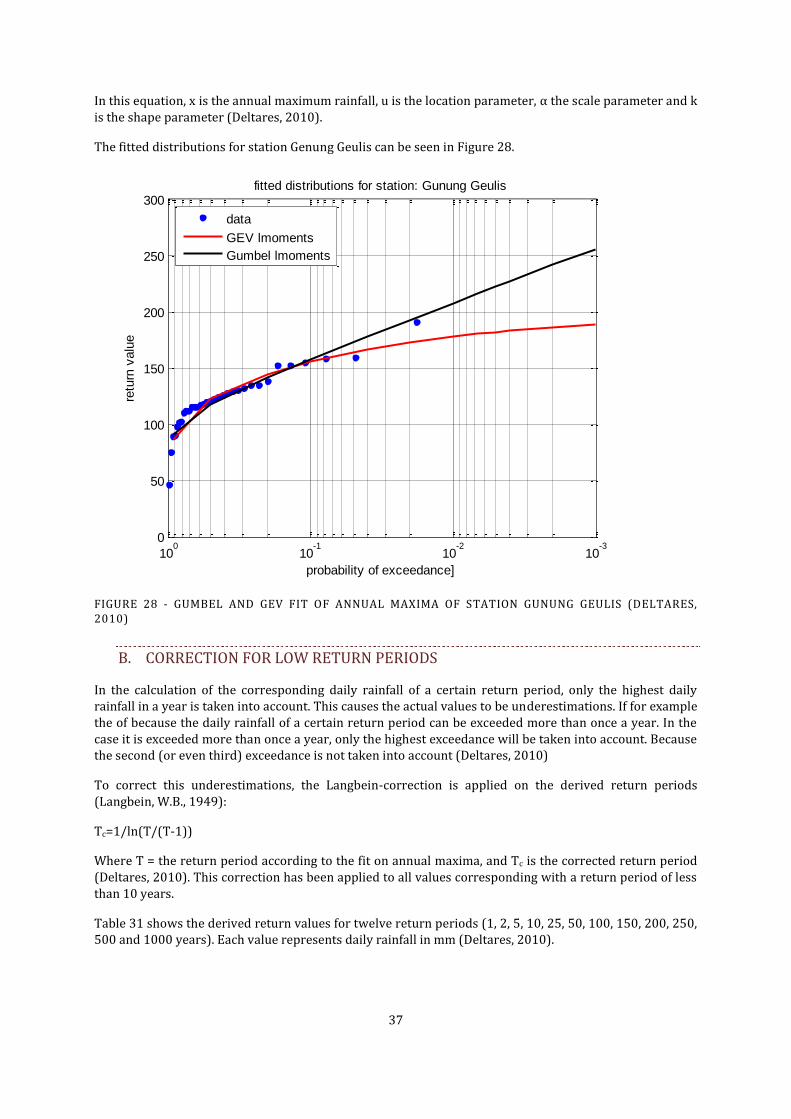
37
In this equation, x is the annual maximum rainfall, u is the location parameter, α the scale parameter and k is the shape parameter (Deltares, 2010).
The fitted distributions for station Genung Geulis can be seen in Figure 28.
FIGURE 28 - GUMBEL AND GEV FIT OF ANNUAL MAXIMA OF STATION GUNUNG GEULIS (DELTARES, 2010)
B. CORRECTION FOR LOW RETURN PERIODS
In the calculation of the corresponding daily rainfall of a certain return period, only the highest daily rainfall in a year is taken into account. This causes the actual values to be underestimations. If for example the of because the daily rainfall of a certain return period can be exceeded more than once a year. In the case it is exceeded more than once a year, only the highest exceedance will be taken into account. Because the second (or even third) exceedance is not taken into account (Deltares, 2010)
To correct this underestimations, the Langbein-correction is applied on the derived return periods (Langbein, W.B., 1949):
Tc=1/ln(T/(T-1))
Where T = the return period according to the fit on annual maxima, and Tc is the corrected return period (Deltares, 2010). This correction has been applied to all values corresponding with a return period of less than 10 years.
Table 31 shows the derived return values for twelve return periods (1, 2, 5, 10, 25, 50, 100, 150, 200, 250, 500 and 1000 years). Each value represents daily rainfall in mm (Deltares, 2010).
10-3
10-2
10-1
100
0
50
100
150
200
250
300
probability of exceedance]
retu
rn v
alu
e
fitted distributions for station: Gunung Geulis
data
GEV lmoments
Gumbel lmoments
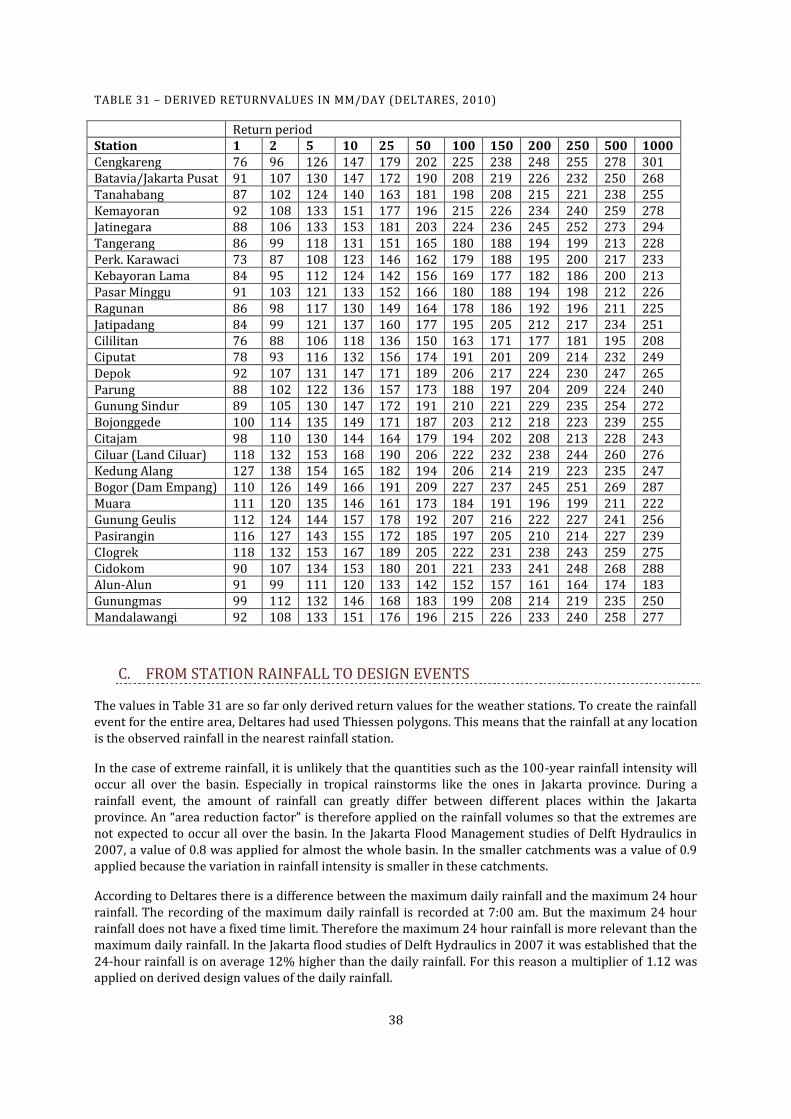
38
TABLE 31 – DERIVED RETURNVALUES IN MM/DAY (DELTARES, 2010)
Return period Station 1 2 5 10 25 50 100 150 200 250 500 1000 Cengkareng 76 96 126 147 179 202 225 238 248 255 278 301 Batavia/Jakarta Pusat 91 107 130 147 172 190 208 219 226 232 250 268 Tanahabang 87 102 124 140 163 181 198 208 215 221 238 255 Kemayoran 92 108 133 151 177 196 215 226 234 240 259 278 Jatinegara 88 106 133 153 181 203 224 236 245 252 273 294 Tangerang 86 99 118 131 151 165 180 188 194 199 213 228 Perk. Karawaci 73 87 108 123 146 162 179 188 195 200 217 233 Kebayoran Lama 84 95 112 124 142 156 169 177 182 186 200 213 Pasar Minggu 91 103 121 133 152 166 180 188 194 198 212 226 Ragunan 86 98 117 130 149 164 178 186 192 196 211 225 Jatipadang 84 99 121 137 160 177 195 205 212 217 234 251 Cililitan 76 88 106 118 136 150 163 171 177 181 195 208 Ciputat 78 93 116 132 156 174 191 201 209 214 232 249 Depok 92 107 131 147 171 189 206 217 224 230 247 265 Parung 88 102 122 136 157 173 188 197 204 209 224 240 Gunung Sindur 89 105 130 147 172 191 210 221 229 235 254 272 Bojonggede 100 114 135 149 171 187 203 212 218 223 239 255 Citajam 98 110 130 144 164 179 194 202 208 213 228 243 Ciluar (Land Ciluar) 118 132 153 168 190 206 222 232 238 244 260 276 Kedung Alang 127 138 154 165 182 194 206 214 219 223 235 247 Bogor (Dam Empang) 110 126 149 166 191 209 227 237 245 251 269 287 Muara 111 120 135 146 161 173 184 191 196 199 211 222 Gunung Geulis 112 124 144 157 178 192 207 216 222 227 241 256 Pasirangin 116 127 143 155 172 185 197 205 210 214 227 239 CIogrek 118 132 153 167 189 205 222 231 238 243 259 275 Cidokom 90 107 134 153 180 201 221 233 241 248 268 288 Alun-Alun 91 99 111 120 133 142 152 157 161 164 174 183 Gunungmas 99 112 132 146 168 183 199 208 214 219 235 250 Mandalawangi 92 108 133 151 176 196 215 226 233 240 258 277
C. FROM STATION RAINFALL TO DESIGN EVENTS
The values in Table 31 are so far only derived return values for the weather stations. To create the rainfall event for the entire area, Deltares had used Thiessen polygons. This means that the rainfall at any location is the observed rainfall in the nearest rainfall station.
In the case of extreme rainfall, it is unlikely that the quantities such as the 100-year rainfall intensity will occur all over the basin. Especially in tropical rainstorms like the ones in Jakarta province. During a rainfall event, the amount of rainfall can greatly differ between different places within the Jakarta province. An “area reduction factor” is therefore applied on the rainfall volumes so that the extremes are not expected to occur all over the basin. In the Jakarta Flood Management studies of Delft Hydraulics in 2007, a value of 0.8 was applied for almost the whole basin. In the smaller catchments was a value of 0.9 applied because the variation in rainfall intensity is smaller in these catchments.
According to Deltares there is a difference between the maximum daily rainfall and the maximum 24 hour rainfall. The recording of the maximum daily rainfall is recorded at 7:00 am. But the maximum 24 hour rainfall does not have a fixed time limit. Therefore the maximum 24 hour rainfall is more relevant than the maximum daily rainfall. In the Jakarta flood studies of Delft Hydraulics in 2007 it was established that the 24-hour rainfall is on average 12% higher than the daily rainfall. For this reason a multiplier of 1.12 was applied on derived design values of the daily rainfall.
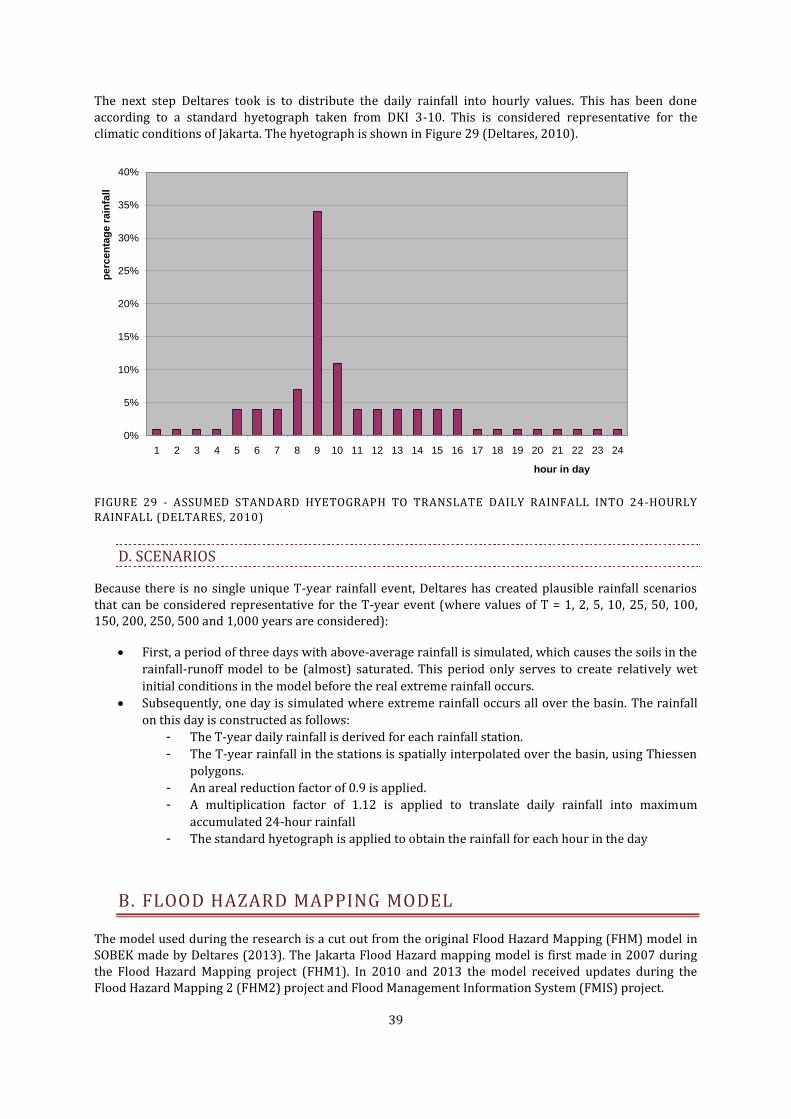
39
The next step Deltares took is to distribute the daily rainfall into hourly values. This has been done according to a standard hyetograph taken from DKI 3-10. This is considered representative for the climatic conditions of Jakarta. The hyetograph is shown in Figure 29 (Deltares, 2010).
FIGURE 29 - ASSUMED STANDARD HYETOGRAPH TO TRANSLATE DAILY RAINFALL INTO 24-HOURLY RAINFALL (DELTARES, 2010)
D. SCENARIOS
Because there is no single unique T-year rainfall event, Deltares has created plausible rainfall scenarios that can be considered representative for the T-year event (where values of T = 1, 2, 5, 10, 25, 50, 100, 150, 200, 250, 500 and 1,000 years are considered):
First, a period of three days with above-average rainfall is simulated, which causes the soils in the
rainfall-runoff model to be (almost) saturated. This period only serves to create relatively wet
initial conditions in the model before the real extreme rainfall occurs.
Subsequently, one day is simulated where extreme rainfall occurs all over the basin. The rainfall
on this day is constructed as follows:
- The T-year daily rainfall is derived for each rainfall station.
- The T-year rainfall in the stations is spatially interpolated over the basin, using Thiessen
polygons.
- An areal reduction factor of 0.9 is applied.
- A multiplication factor of 1.12 is applied to translate daily rainfall into maximum
accumulated 24-hour rainfall
- The standard hyetograph is applied to obtain the rainfall for each hour in the day
B. FLOOD HAZARD MAPPING MODEL
The model used during the research is a cut out from the original Flood Hazard Mapping (FHM) model in SOBEK made by Deltares (2013). The Jakarta Flood Hazard mapping model is first made in 2007 during the Flood Hazard Mapping project (FHM1). In 2010 and 2013 the model received updates during the Flood Hazard Mapping 2 (FHM2) project and Flood Management Information System (FMIS) project.
0%
5%
10%
15%
20%
25%
30%
35%
40%
1 2 3 4 5 6 7 8 9 10 11 12 13 14 15 16 17 18 19 20 21 22 23 24
hour in day
perc
en
tag
e r
ain
fall
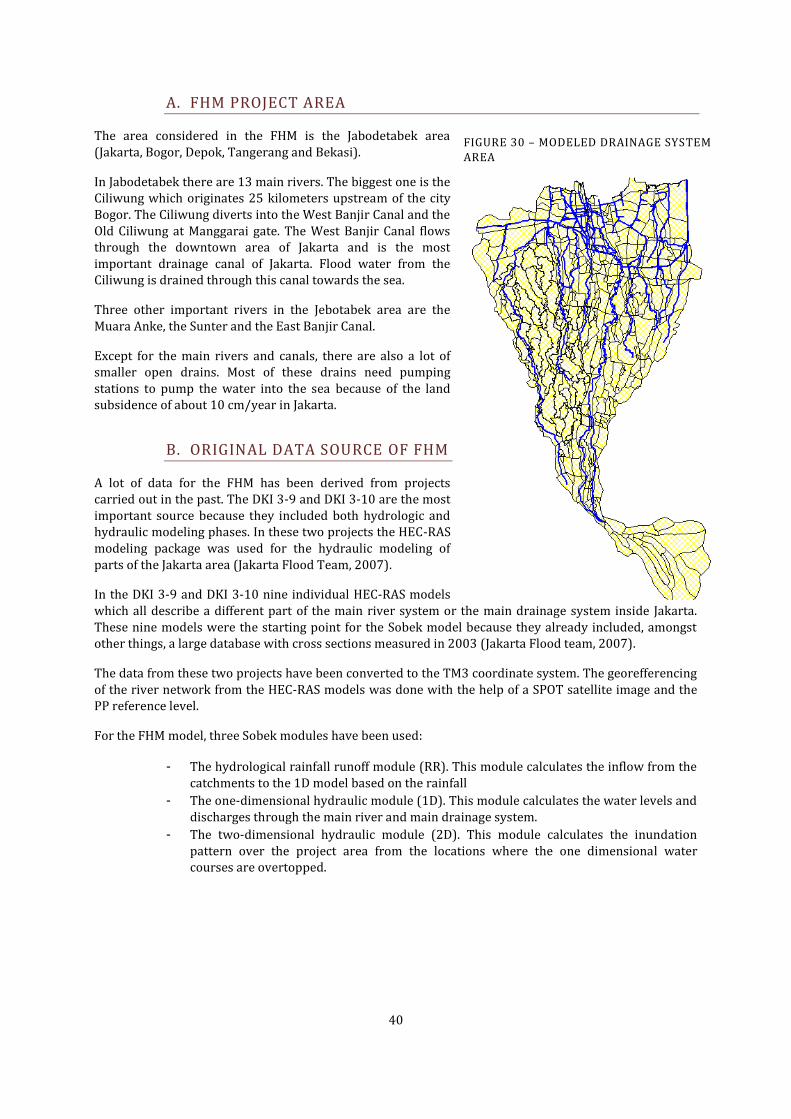
40
A. FHM PROJECT AREA
The area considered in the FHM is the Jabodetabek area (Jakarta, Bogor, Depok, Tangerang and Bekasi).
In Jabodetabek there are 13 main rivers. The biggest one is the Ciliwung which originates 25 kilometers upstream of the city Bogor. The Ciliwung diverts into the West Banjir Canal and the Old Ciliwung at Manggarai gate. The West Banjir Canal flows through the downtown area of Jakarta and is the most important drainage canal of Jakarta. Flood water from the Ciliwung is drained through this canal towards the sea.
Three other important rivers in the Jebotabek area are the Muara Anke, the Sunter and the East Banjir Canal.
Except for the main rivers and canals, there are also a lot of smaller open drains. Most of these drains need pumping stations to pump the water into the sea because of the land subsidence of about 10 cm/year in Jakarta.
B. ORIGINAL DATA SOURCE OF FHM
A lot of data for the FHM has been derived from projects carried out in the past. The DKI 3-9 and DKI 3-10 are the most important source because they included both hydrologic and hydraulic modeling phases. In these two projects the HEC-RAS modeling package was used for the hydraulic modeling of parts of the Jakarta area (Jakarta Flood Team, 2007).
In the DKI 3-9 and DKI 3-10 nine individual HEC-RAS models which all describe a different part of the main river system or the main drainage system inside Jakarta. These nine models were the starting point for the Sobek model because they already included, amongst other things, a large database with cross sections measured in 2003 (Jakarta Flood team, 2007).
The data from these two projects have been converted to the TM3 coordinate system. The georefferencing of the river network from the HEC-RAS models was done with the help of a SPOT satellite image and the PP reference level.
For the FHM model, three Sobek modules have been used:
- The hydrological rainfall runoff module (RR). This module calculates the inflow from the catchments to the 1D model based on the rainfall
- The one-dimensional hydraulic module (1D). This module calculates the water levels and discharges through the main river and main drainage system.
- The two-dimensional hydraulic module (2D). This module calculates the inundation pattern over the project area from the locations where the one dimensional water courses are overtopped.
FIGURE 30 – MODELED DRAINAGE SYSTEM AREA
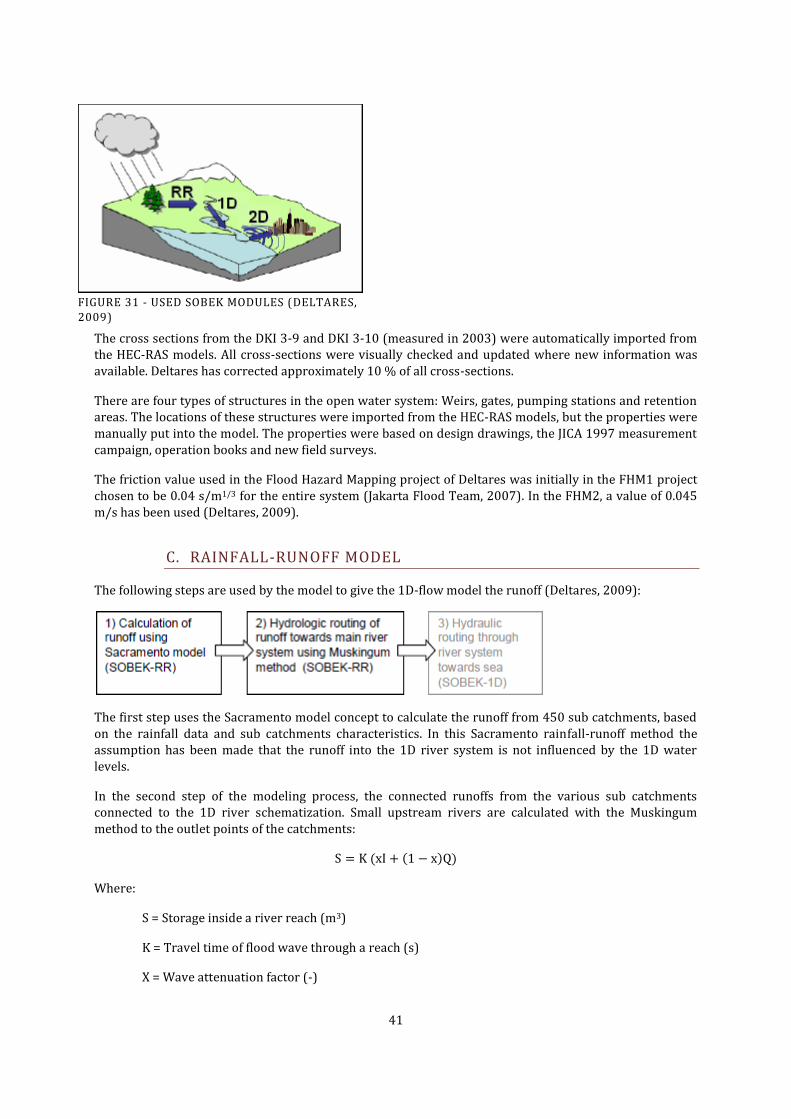
41
The cross sections from the DKI 3-9 and DKI 3-10 (measured in 2003) were automatically imported from the HEC-RAS models. All cross-sections were visually checked and updated where new information was available. Deltares has corrected approximately 10 % of all cross-sections.
There are four types of structures in the open water system: Weirs, gates, pumping stations and retention areas. The locations of these structures were imported from the HEC-RAS models, but the properties were manually put into the model. The properties were based on design drawings, the JICA 1997 measurement campaign, operation books and new field surveys.
The friction value used in the Flood Hazard Mapping project of Deltares was initially in the FHM1 project chosen to be 0.04 s/m1/3 for the entire system (Jakarta Flood Team, 2007). In the FHM2, a value of 0.045 m/s has been used (Deltares, 2009).
C. RAINFALL-RUNOFF MODEL
The following steps are used by the model to give the 1D-flow model the runoff (Deltares, 2009):
The first step uses the Sacramento model concept to calculate the runoff from 450 sub catchments, based on the rainfall data and sub catchments characteristics. In this Sacramento rainfall-runoff method the assumption has been made that the runoff into the 1D river system is not influenced by the 1D water levels.
In the second step of the modeling process, the connected runoffs from the various sub catchments connected to the 1D river schematization. Small upstream rivers are calculated with the Muskingum method to the outlet points of the catchments:
Where:
S = Storage inside a river reach (m3)
K = Travel time of flood wave through a reach (s)
X = Wave attenuation factor (-)
FIGURE 31 - USED SOBEK MODULES (DELTARES, 2009)
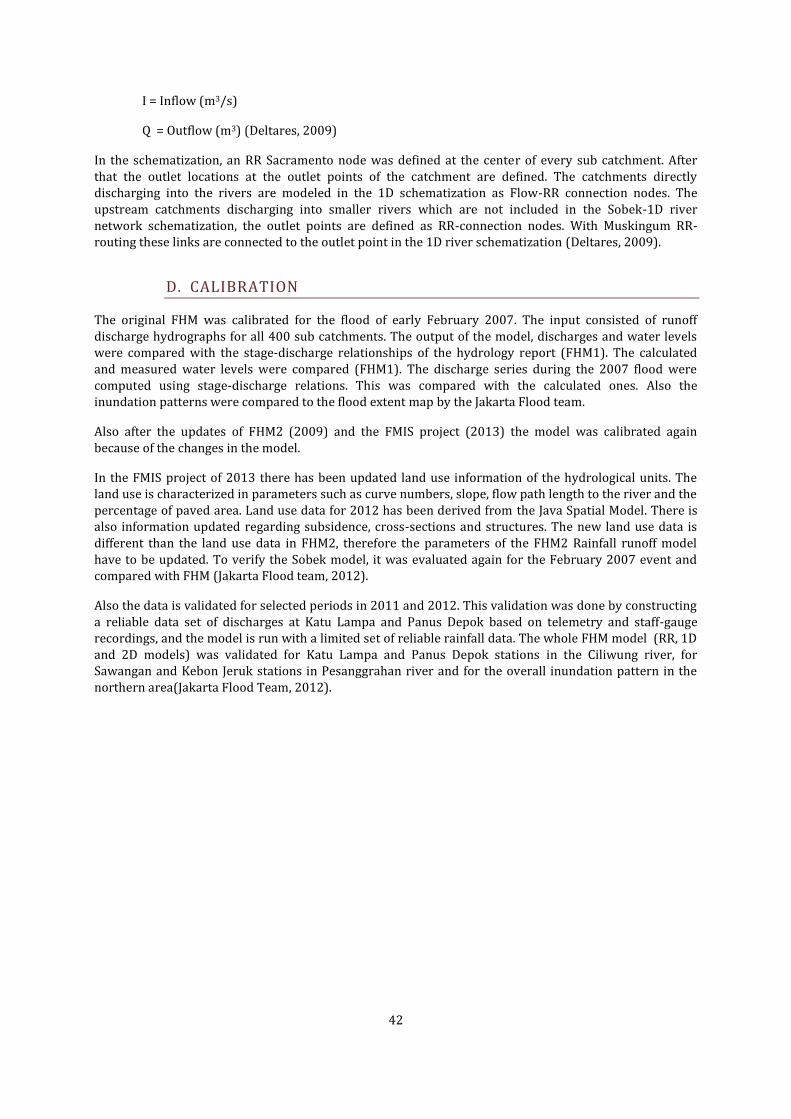
42
I = Inflow (m3/s)
Q = Outflow (m3) (Deltares, 2009)
In the schematization, an RR Sacramento node was defined at the center of every sub catchment. After that the outlet locations at the outlet points of the catchment are defined. The catchments directly discharging into the rivers are modeled in the 1D schematization as Flow-RR connection nodes. The upstream catchments discharging into smaller rivers which are not included in the Sobek-1D river network schematization, the outlet points are defined as RR-connection nodes. With Muskingum RR-routing these links are connected to the outlet point in the 1D river schematization (Deltares, 2009).
D. CALIBRATION
The original FHM was calibrated for the flood of early February 2007. The input consisted of runoff discharge hydrographs for all 400 sub catchments. The output of the model, discharges and water levels were compared with the stage-discharge relationships of the hydrology report (FHM1). The calculated and measured water levels were compared (FHM1). The discharge series during the 2007 flood were computed using stage-discharge relations. This was compared with the calculated ones. Also the inundation patterns were compared to the flood extent map by the Jakarta Flood team.
Also after the updates of FHM2 (2009) and the FMIS project (2013) the model was calibrated again because of the changes in the model.
In the FMIS project of 2013 there has been updated land use information of the hydrological units. The land use is characterized in parameters such as curve numbers, slope, flow path length to the river and the percentage of paved area. Land use data for 2012 has been derived from the Java Spatial Model. There is also information updated regarding subsidence, cross-sections and structures. The new land use data is different than the land use data in FHM2, therefore the parameters of the FHM2 Rainfall runoff model have to be updated. To verify the Sobek model, it was evaluated again for the February 2007 event and compared with FHM (Jakarta Flood team, 2012).
Also the data is validated for selected periods in 2011 and 2012. This validation was done by constructing a reliable data set of discharges at Katu Lampa and Panus Depok based on telemetry and staff-gauge recordings, and the model is run with a limited set of reliable rainfall data. The whole FHM model (RR, 1D and 2D models) was validated for Katu Lampa and Panus Depok stations in the Ciliwung river, for Sawangan and Kebon Jeruk stations in Pesanggrahan river and for the overall inundation pattern in the northern area(Jakarta Flood Team, 2012).