Embed Size (px)
Citation preview
By David Disch and
Jasmien Bronckaers
July 2012
An analysis of the off-grid lighting market in
Rwanda: sales, distribution and marketing
Published by:
GVEP International cc Fifth Floor - Totara Park House
34-36 Gray’s Inn Road
London WC1X 8HR
United Kingdom
www.gvepinternational.org
Authors:
David Disch and Jasmien Bronckaers
GVEP International – Africa Regional Office
P.O. Box 76580 – 00508
Nairobi, Kenya
www.gvepinternational.org
July 2012
ACKNOWLEDGEMENTS
We would like to thank the all enterprises that have been interviewed for this study for their time
and their willingness to share their company’s information. Thanks also belong to Tubura (One
Acre Fund Rwanda) for sharing the results of their consumer survey and pilot for solar lanterns
for publication in this report.
This study has been funded by the Energy SME Trust Fund administered by the World Bank and
financed by the Russian Federation (Grant No. TF094542-3A). The views expressed in this report
do not necessarily reflect the views of the World Bank or the Russian Federation.
No part of this publication may be reprinted or reproduced or utilised in any form or by any
electronic, mechanical, or other means, now known or hereafter invented, including photocopying
and recording, or in any information storage or retrieval system, without the written permission of
GVEP International.
GVEP International and the authors of this report made every reasonable effort to ensure the
accuracy and validity of the information provided, however, neither GVEP International nor the
authors accept any legal responsibility or liability for any errors or omissions that may be made.
Also, we want to thank Roman Meyer for GIS support on the maps as well as Nuru Energy East
Africa Ltd. for the title picture.
TABLE OF CONTENTS
Executive Summary ................................................................................................. 6
Chapter 1: Introduction ........................................................................................... 7
1.1 Scope .............................................................................................................................. 7
Chapter 2: The potential market ............................................................................. 8
2.1 Household energy expenditure in Rwanda...................................................................... 9
2.2 Lanterns ....................................................................................................................... 11
2.3 Micro-systems .............................................................................................................. 11
2.4 Solar Home Systems ..................................................................................................... 12
2.5 Institutional market ...................................................................................................... 12
2.6 Historic comparison ...................................................................................................... 12
Chapter 3: Companies engaged in the market ...................................................... 14
Chapter 4: Products and Pricing ............................................................................ 18
4.1 Available Products ........................................................................................................ 18
4.2 Market segmentations .................................................................................................. 19
4.3 Warranty Schemes ....................................................................................................... 26
Chapter 5: Distribution .......................................................................................... 28
5.1 Distribution models in the different market segments .................................................. 28
5.2 Product availability ....................................................................................................... 32
Chapter 6: Marketing and promotion ................................................................... 35
6.1 Marketing and promotion activities .............................................................................. 37
6.2 Marketing messages ..................................................................................................... 38
Chapter 7: Growth targets and challenges ............................................................ 41
7.1 Targets ......................................................................................................................... 41
7.2 Barriers to growth ........................................................................................................ 41
Background: The Energy SME support programme in Rwanda............................. 44
Grants for marketing off-grid lighting solutions ....................................................................... 44
Table of figures
Figure 1: Number of employees and affiliated agents .......................................................................... 14
Figure 2: Turnover of companies trading solar products. ..................................................................... 15
Figure 3: The contribution of different product lines in the companies’ revenue structure. ............... 16
Figure 4: Availability of brands across different distributors. ............................................................... 18
Figure 5: The estimated market share per brand.. ................................................................................ 19
Figure 6: Sales volumes by market segment ......................................................................................... 20
Figure 7: Sales of portable lanterns compared to all other products per month ................................. 21
Figure 8: Comparison of sales figures for different solar systems sizes ................................................ 22
Figure 9: Market share of the different segments according to revenue created ................................ 24
Figure 10- Market share of the different segments .............................................................................. 25
Figure 11: The share of monthly sales by distribution method ............................................................. 28
Figure 12: Revenue by distribution method. ......................................................................................... 29
Figure 13: Geographical spread of revenue in the off-grid lighting market .......................................... 32
Figure 14: Geographical spread of sales across the country. ................................................................ 33
Figure 15: Geographical spread of dealers across the country ............................................................. 34
Figure 16: Marketing budgets of the involved companies. ................................................................... 35
Figure 17: Marketing budgets of the companies as a fraction of their turnover .................................. 36
Figure 18: Frequently cited marketing activities ................................................................................... 38
Figure 19: Frequently cited marketing messages. ................................................................................. 39
Figure 20: Frequently cited barriers to growth. .................................................................................... 42
Abbreviations
EARP Energy Access Rollout Project
ESME Energy SME Project
EWSA Energy Water and Sanitation Authority
GVEP Global Village Energy Partnership
LED Light-emitting Diode
PV photovoltaic
RWF Rwandan Franc
SEDP Sustainable Energy Development Project
SHS Solar Home System
SPL Solar Portable Lantern
US$ United States Dollar
W Watt
Executive Summary | 6
Executive Summary
This market assessment provides an overview of the off-grid lighting market in Rwanda at the end of
2011. Ten companies active in supplying low-cost lighting solutions were interviewed on their products
and sales data, their distribution channels and marketing activities. It also gives insights in product
availability and affordability with a focus on off-the-shelf lighting products.
Key findings and conclusions
• Despite ambitious government electrification programmes, more than 1 million households will
likely still require off-grid electricity by 2020. Nevertheless, sales of solar products are currently
still very low with lantern sales of around 1,000 and system sales of a few hundred per month
amongst all distributors.
• Survey results show that average off-grid household energy expenditures in Rwanda are
around RWF 500 or US$0.80 per week. Expenditures for households expressing an interest in
solar products were found to be slightly higher at around RWF600-675 or US$0.95-1.10. These
costs can be reduced by around 65% with the use of a solar lantern that also provides phone
charging.
• The nature of the companies engaged in the market varies widely from highly specialised start-
ups with international backing to broader retailers that deal with solar products as a side
business. Annual turnovers for solar products range between US$15,000 and US$1 million with
institutional installations and government tenders contributing the bulk of revenue for these
companies.
• 80% of the absolute sales by volume are portable lanterns with two specialised companies
dominating the market. But lantern sales alone contribute only 50% of revenues for the overall
market. Other products such as small off-the-shelf systems contribute disproportionately to
revenue. Dealer margins for lighting kits are around US$60, whereas lanterns only create
margins of around US$5 for most companies.
• Most companies sell from their premises with four having affiliated dealers or agents.. However,
around 80% of sales are achieved through active door-to-door marketing and distribution by
entrepreneurs and agents. Companies using door-to-door sales actively on average achieve
75% higher turnover on products below US$100 compared to companies that do not actively
market their products.
• Rural dealer networks and agents are expensive and marketing expenditures by the most
successful companies are currently only sustained through grant funding from donors and social
investors. Market growth is currently largely driven by this donor funded promotional activity.
Chapter 1: Introduction | 7
Chapter 1: Introduction
In November 2011, 10 companies that are actively selling and promoting off-grid lighting products
were interviewed as part of a baseline assessment of the off-grid lighting market in Rwanda. This
report summarises the findings of this research and provides an overview of the current status of the
market, the key players and their products.
The study provides insights into the structure of the market, the promotional strategies currently
employed by the active companies in the market, their routes to market, and the challenges
encountered by these businesses as they seek to increase sales. The report also describes the kinds
of products currently available in Rwanda, the segmentation of the market between smaller and larger
products and the geography of sales. It also looks at how marketing has influenced sales and what
lessons can be learned for the future.
1.1 Scope
This study collected information from all of the major companies currently selling off-grid lighting
solutions in Rwanda on market size and structure, on the type and brands of products stocked, their
sales volumes, revenues and margins. It gives also an overview of availability and affordability of solar
products in Rwanda.
Off-the-shelve lighting products
The report is focused on off-the-shelf consumer products as compared to larger traditional Solar
Home Systems (SHS) or institutional installations, both of which require more technical knowhow on
the part of installer to ensure proper sizing of the system and assembling of the different components
(battery, charge controller, inverter etc.) into a functioning system. Off-the-shelf products which
already combine these components allow a ‘plug and play’ type of installation and have become
increasingly available in sub-Saharan Africa.
The report assesses the degree to which these small systems and lanterns are contributing to the
overall market, both in terms of volume sales and their contribution to companies’ turnover and profit.
Different market players focus on different segments or combinations of segments so business
models vary significantly. The study looks at these different models and their key drivers.
Distribution and Marketing
The majority of the overall potential demand lies in areas outside of Kigali and to reach scale in
operations and sales, the products need to be distributed through a network of retailers accompanied
with awareness and promotional activities by the firms. The report looks at the various ways
companies have dealt with this and the current challenges in managing and financing the distribution
chain.
Chapter 2: The potential market | 8
Chapter 2: The potential market
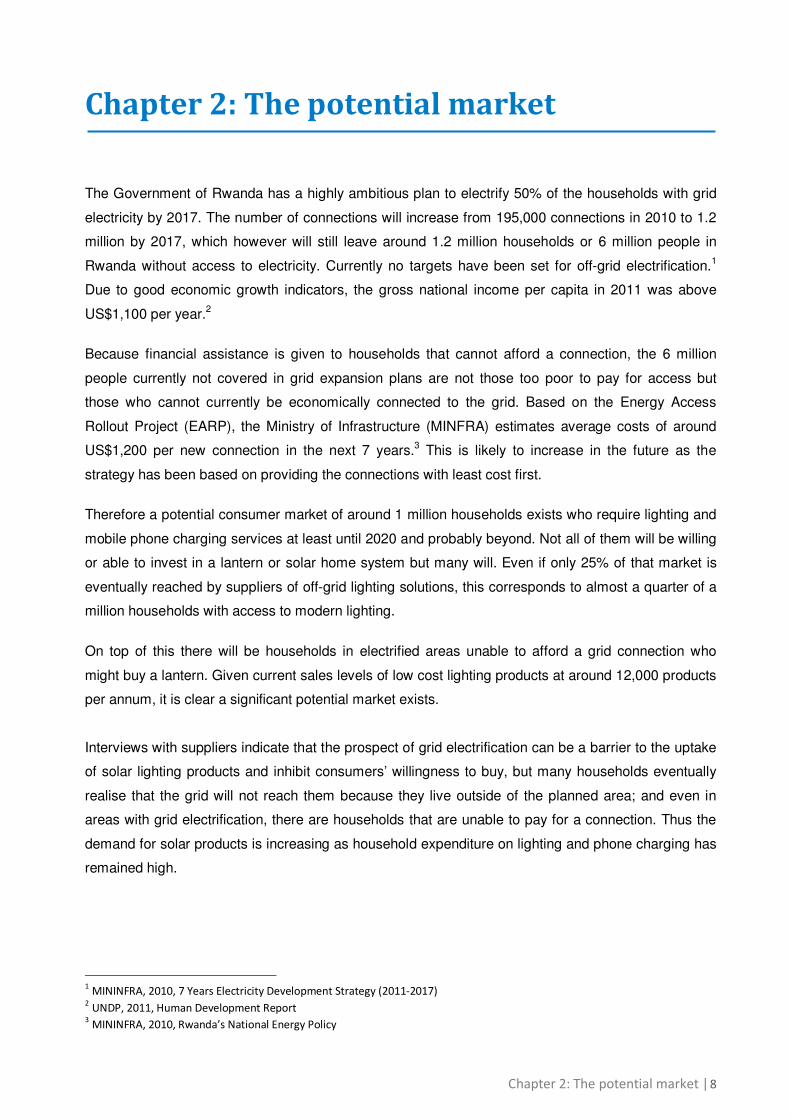
The Government of Rwanda has a highly ambitious plan to electrify 50% of the households with grid
electricity by 2017. The number of connections will increase from 195,000 connections in 2010 to 1.2
million by 2017, which however will still leave around 1.2 million households or 6 million people in
Rwanda without access to electricity. Currently no targets have been set for off-grid electrification.1
Due to good economic growth indicators, the gross national income per capita in 2011 was above
US$1,100 per year.2
Because financial assistance is given to households that cannot afford a connection, the 6 million
people currently not covered in grid expansion plans are not those too poor to pay for access but
those who cannot currently be economically connected to the grid. Based on the Energy Access
Rollout Project (EARP), the Ministry of Infrastructure (MINFRA) estimates average costs of around
US$1,200 per new connection in the next 7 years.3 This is likely to increase in the future as the
strategy has been based on providing the connections with least cost first.
Therefore a potential consumer market of around 1 million households exists who require lighting and
mobile phone charging services at least until 2020 and probably beyond. Not all of them will be willing
or able to invest in a lantern or solar home system but many will. Even if only 25% of that market is
eventually reached by suppliers of off-grid lighting solutions, this corresponds to almost a quarter of a
million households with access to modern lighting.
On top of this there will be households in electrified areas unable to afford a grid connection who
might buy a lantern. Given current sales levels of low cost lighting products at around 12,000 products
per annum, it is clear a significant potential market exists.
Interviews with suppliers indicate that the prospect of grid electrification can be a barrier to the uptake
of solar lighting products and inhibit consumers’ willingness to buy, but many households eventually
realise that the grid will not reach them because they live outside of the planned area; and even in
areas with grid electrification, there are households that are unable to pay for a connection. Thus the
demand for solar products is increasing as household expenditure on lighting and phone charging has
remained high.
1 MININFRA, 2010, 7 Years Electricity Development Strategy (2011-2017)
2 UNDP, 2011, Human Development Report
3 MININFRA, 2010, Rwanda’s National Energy Policy
Chapter 2: The potential market | 9
2.1 Household energy expenditure in Rwanda
A survey amongst 212 rural households in the Northern Province revealed that 85% of households
use kerosene, of which 46% spend less then RWF 500 (US$0.80) per week, 35% spend between
RWF 500 and 1,500 (US$0.80 and US$2.50), 19% spend more – corresponding to a median
expenditure of US$0.80 per week. Also, 36% of the population use candles with around 80%
spending less then US$0.80 per week.4 Additionally, mobile phones are popular with many people not
having the means to charge them. Phones users typically spend RWF 100-200 (US$0.16-0.30) per
charge in most rural areas. Many households are therefore spending US$1.50-2.00 a week on their
lighting and phone charging needs.
A recent survey by the agricultural NGO Tubura confirmed the average expenditure at around RWF
500 (US$0.80) in a different area of the country than the data above through interviewing almost
1,000 potential clients on their energy use. Average expenditures for households interested in solar
products were slightly higher at RWF 625-670 or US$1.00-1.10. The use of a lantern with phone
charging can reduce these costs by 65%.
Tubura Survey Results
Tubura is the brand name of the One Acre Fund in Rwanda, a
NGO focused on helping farmers in a number of countries in East
Africa through pre-financing farm inputs and advice to improve
farm output as well as farming income by better access to
markets. Using their existing loan structures and groups, Tubura is
expanding their portfolio of available products.
As part of this trial, Tubura conducted a survey among a random sample of trial participants to gather
data on client perceived impact of the products, client satisfaction with the products, and client use of the
products. Based on a sample of 73 clients or around 50% of the total the vast majority of clients are very
pleased with the product offered, in this case the Sun King Pro lantern, supplied by Great Lakes Energy.
Question Sun King Pro (n=73)
Improved Quality of Light (YES) 100%
Increased Hours of Light (YES) 99%
Increased Hours of Child Study (YES) 88%
Will Continue to Use the Product (YES) 100%
Would Like to Buy a Second Product of this Type (YES) 82%
Would Recommend this Product to Others (YES) 96%
4 Ezgi Berber, 2011, Baseline Study for Rubagabaga Project
Chapter 2: The potential market | 10
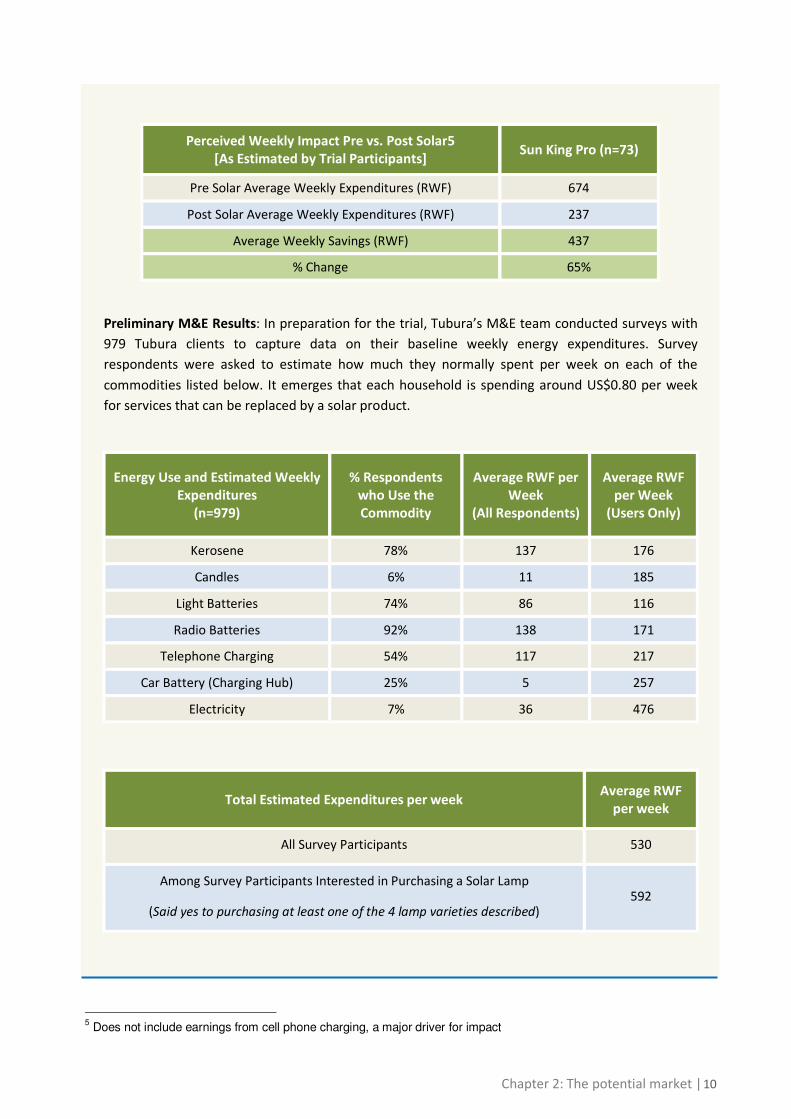
Preliminary M&E Results: In preparation for the trial, Tubura’s M&E team conducted surveys with
979 Tubura clients to capture data on their baseline weekly energy expenditures. Survey
respondents were asked to estimate how much they normally spent per week on each of the
commodities listed below. It emerges that each household is spending around US$0.80 per week
for services that can be replaced by a solar product.
Energy Use and Estimated Weekly
Expenditures
(n=979)
% Respondents
who Use the
Commodity
Average RWF per
Week
(All Respondents)
Average RWF
per Week
(Users Only)
Kerosene 78% 137 176
Candles 6% 11 185
Light Batteries 74% 86 116
Radio Batteries 92% 138 171
Telephone Charging 54% 117 217
Car Battery (Charging Hub) 25% 5 257
Electricity 7% 36 476
Total Estimated Expenditures per week Average RWF
per week
All Survey Participants 530
Among Survey Participants Interested in Purchasing a Solar Lamp
(Said yes to purchasing at least one of the 4 lamp varieties described) 592
Perceived Weekly Impact Pre vs. Post Solar5
[As Estimated by Trial Participants] Sun King Pro (n=73)
Pre Solar Average Weekly Expenditures (RWF) 674
Post Solar Average Weekly Expenditures (RWF) 237
Average Weekly Savings (RWF) 437
% Change 65%
5 Does not include earnings from cell phone charging, a major driver for impact
Chapter 2: The potential market | 11
As can be seen from these data and the above result from a field trial of Tubura, solar products can
pay for themselves in a matter of a few months. Nevertheless, challenges in affordability remain
despite the falling costs of solar lanterns. The availability of funds to invest in a product is the major
hurdle. In only 10 out of 30 districts in the country does the population have average expenditure of
more than US$1.25 per day6 and up front costs even as low as RWF16,000 (US$25) for a basic solar
lantern remain a barrier.
The solar market can be divided in several segments, which each have separate product categories
and often specialized companies that target a particular segment, although some businesses
participate in several market segments.
2.2 Lanterns
Solar lanterns are sold as an integrated system, with a panel, battery, wiring and one or two lamps.
Moreover, today lanterns often have an option for cell phone charging. They are small, relatively
cheap off-the-shelf products with a maximum size of around 3W. Due to the low complexity of the
product (it is simple plug-and-play) there is no need for professional installation. Also, the need for
after-sales service is limited as long as the product is of good quality and the client uses the system
under normal circumstances.
With an average retail price of around US$30, solar lanterns are affordable to a large share of the
population, including those at the bottom of the pyramid. The most popular product is also the
cheapest one with a unit price of US$ 6 but not being a solar PV product it requires continuous small
payments for recharge. The most expensive solar lantern costs US$70 but has an oversized panel for
cloudy conditions, allows phone charging and has a bigger storage capacity.
2.3 Micro-systems
Micro-systems vary in size from 2.5W to around 15W. Although these small solar systems are still “off-
the-shelf” products they are a bit more complex than solar lanterns, they have separate parts and
involve wiring of several rooms. Mobile phone charging is always an option and more than one room
can be illuminated. Additionally, small radios or energy efficient TVs can be powered by these
systems. Prices for small solar systems are proportional to power output and range from US$80 to
US$200.
6 National Institute of Statistics Rwanda, 2006, Enquête Intégrale sur les Conditions de Vie des Ménages 2005-2006 (EICV2)
Chapter 2: The potential market | 12
2.4 Solar Home Systems
SHS are systems bigger than 15W that are sometimes sold as a whole as plug-and-play systems, but
more commonly as separate components, which need to be installed by a technician. Given the large
size of these systems, proper estimation of the power demand, sizing of the system components and
a professional installation and maintenance is important. That is, more consumer education is
necessary to ensure proper use of the product. Also, after-sales support may be necessary if one of
the components (e.g. the battery) breaks down.
In addition to lighting and cell phone charging, these systems are able to power small electrical
appliances such as a TV, larger ones also fridges, razors etc., in which case an inverter may be
required where the appliance uses an AC current.
2.5 Institutional market
In terms of both installed capacity and turnover, the market for the off-grid electrification of institutions
such as schools, health centres, churches and public sector offices, has been the largest and is likely
to remain so for the foreseeable future.
Today around 80% of health centres have been electrified through the efforts of the government and
various donors, for example USAID and BTC. The European Union is also financing an on-going solar
electrification project that focuses on secondary schools with € 7 million. By 2017, all health centres,
schools and sector offices will be electrified, either through the grid or through solar PV. This still
means there is a considerable procurement market in the next five years although the number of
tenders and their size have sharply declined since 2010, according to some of the companies
specialised in this market segment because the big tenders on these projects have now been
awarded. A report by GTZ in 2009 that focused on this market segment estimated the demand at
60kW per annum.7
2.6 Historic comparison
Solar technology for electrification has been deployed in Rwanda at least since the 1980’s, often
through support of donors and NGOs. A study for an ESMAP/World Bank project in 1991 provides an
assessment of the market at that time.8
Back then, two companies were identified in dealing with small solar products, both of which were
assembling the product locally from imported parts. Sales of around 100-150 systems of 16 or 20Wp
for around US$720 were reported per year and totalled 700 systems by 1991. These powered three
lights and a radio. Credits for the systems were available through a large national bank but the total
system cost were 2.5 times the national average annual income. The repayment time for the loan was
also set at 2.5 years. Thus, these systems were only available to well off households.
7 GTZ, 2009, Target Market Analysis: The Solar Energy Market in Rwanda
8 F. Nieuwenhout, 1991, Status and potential of photovoltaic (PV) systems in Rwanda for ESMAP/DGIS
Chapter 2: The potential market | 13
Small portable lanterns for lighting only were also available but sales are likely to have been minimal
with US$190 for an imported 5W and US$360 for 11W lantern that was assembled locally with
support from GTZ.
Technical problems were common and all interviewed users of the 16Wp systems reported some
issues. Often these were due to the undersized panel that did not provide enough electricity to power
the three 8W CFLs and the radio that were part of the installation.9 The problem of properly estimating
the demand and sizing the system and it’s components correctly, is still an issue for systems that don’t
come ‘off-the-shelf’ and as recently as 2011 training was provided to local technicians through the
World Bank funded and administered Sustainable Energy Development Project (SEDP) for that
purpose, which will be expanded in 2012 and 2013.
The quality and availability of products has changed drastically since and prices have dropped, mainly
through advances in LED technology. In the lantern segment of the market technical problems due to
over or undercharged batteries are not common anymore because manufacturers moved away from
lead-acid batteries, which were a problem in earlier systems.
9 P. Simonis (GTZ) and J.D. Ngabonziza (MINITRAPE), 1990, "Evaluation de la première phase du Projet d’éclairage
par énergie solaire au milieu rural mené conjointement par l’Union des Banques Populaires et la Société CPQ"
Chapter 3: Companies engaged in the market | 14
Chapter 3: Companies engaged in the market
For this study 10 companies, which are all based in Rwanda were interviewed. Although this might not
be an exclusive list (particularly on institutional installations and larger donor contracts), it captures all
known major players of the commercial household segment of the market. There are other cheap
products on the market but these are mainly battery powered or grid charging 'hurricane lamp'
imitations, not necessarily solar products. These have not been considered in this report.
In general, sales volumes for the companies studied are small compared to the potential addressable
population and the market is at a very early stage of development. Some companies exclusively focus
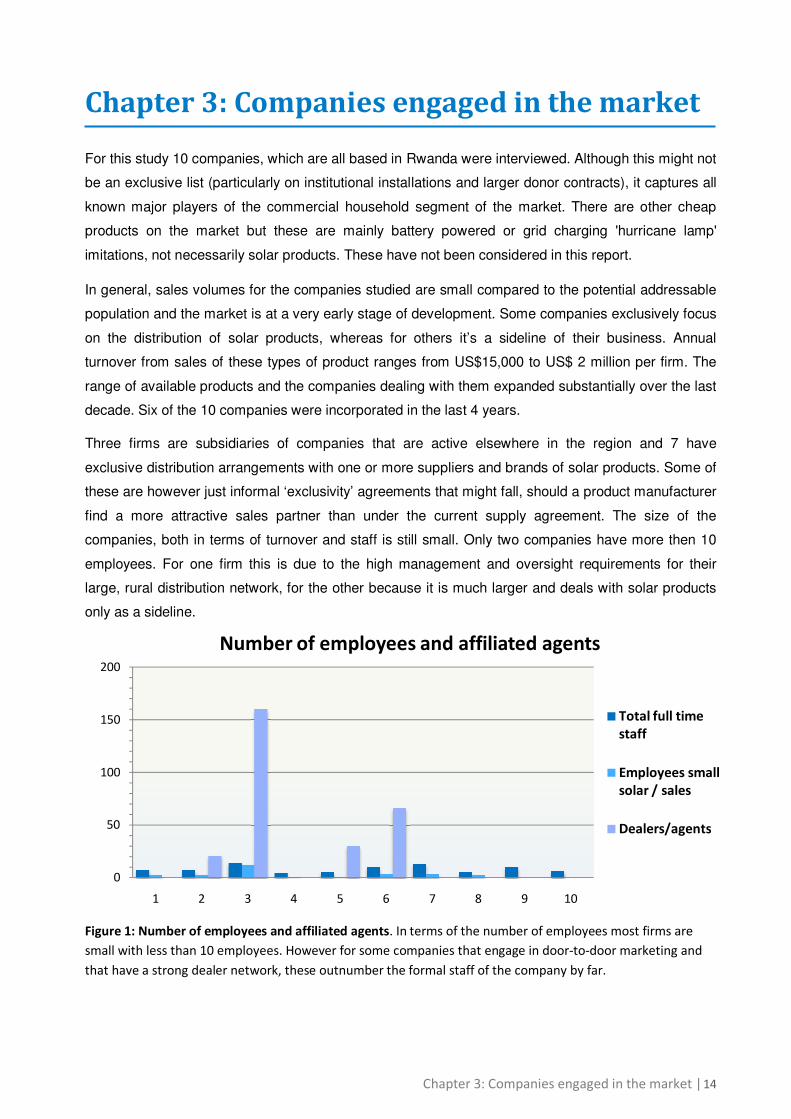
on the distribution of solar products, whereas for others it’s a sideline of their business. Annual
turnover from sales of these types of product ranges from US$15,000 to US$ 2 million per firm. The
range of available products and the companies dealing with them expanded substantially over the last
decade. Six of the 10 companies were incorporated in the last 4 years.
Three firms are subsidiaries of companies that are active elsewhere in the region and 7 have
exclusive distribution arrangements with one or more suppliers and brands of solar products. Some of
these are however just informal ‘exclusivity’ agreements that might fall, should a product manufacturer
find a more attractive sales partner than under the current supply agreement. The size of the
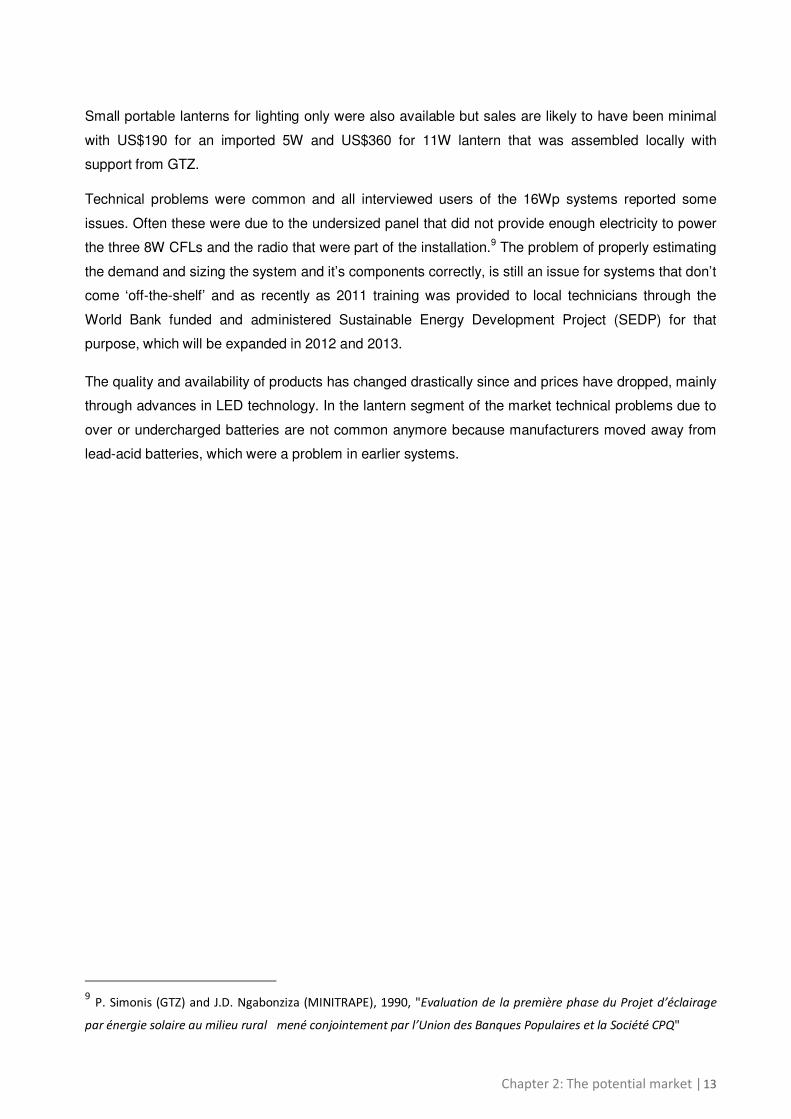
companies, both in terms of turnover and staff is still small. Only two companies have more then 10
employees. For one firm this is due to the high management and oversight requirements for their
large, rural distribution network, for the other because it is much larger and deals with solar products
only as a sideline.
Figure 1: Number of employees and affiliated agents. In terms of the number of employees most firms are
small with less than 10 employees. However for some companies that engage in door-to-door marketing and
that have a strong dealer network, these outnumber the formal staff of the company by far.
0
50
100
150
200
1 2 3 4 5 6 7 8 9 10
Number of employees and affiliated agents
Total full time
staff
Employees small
solar / sales
Dealers/agents
Chapter 3: Companies engaged in the market | 15
Figure 2: Turnover of companies trading solar products. The market players are very divers in nature. Some
companies are exclusively focused on solar products, even on lanterns, whereas for others solar products are
very much a side-line business.
We analysed both the intensity of engagement in the off-grid lighting market as well the product range
offered. The motivation and commitment of the firms to distribute off-grid lighting solutions differs, as
one might expect.
Three broad groups of companies can be distinguished. Five companies focus exclusively on the sale
of off-grid lighting products to the rural population and don’t provide any other service. On the other
hand, for two companies, this is just a small, almost neglected, sideline of their business. The third
segment is made up of firms that, while focusing on solar, are offering a range of services and
products from solar portable lanterns to large institutional installations of several kilowatts. In this
group, often other electrical products or services are offered alongside, such as generators or pumps,
but also biogas installations, Solar Water Heaters or agricultural machinery are available from some of
the companies. Thus, while a specialisation towards a specific market segment has occurred through
subsidiaries of manufacturers moving to the Rwandese market and opening specialised franchises,
most firms offer a broader range of products and services.
0
200,000
400,000
600,000
800,000
1,000,000
1,200,000
1,400,000
1,600,000
1,800,000
2,000,000
1 2 3 4 5 6 7 8 9 10
Turnover of companies trading solar products (USD)
Total turnover Turnover on solar Turnover on lanterns <$100
Chapter 3: Companies engaged in the market | 16
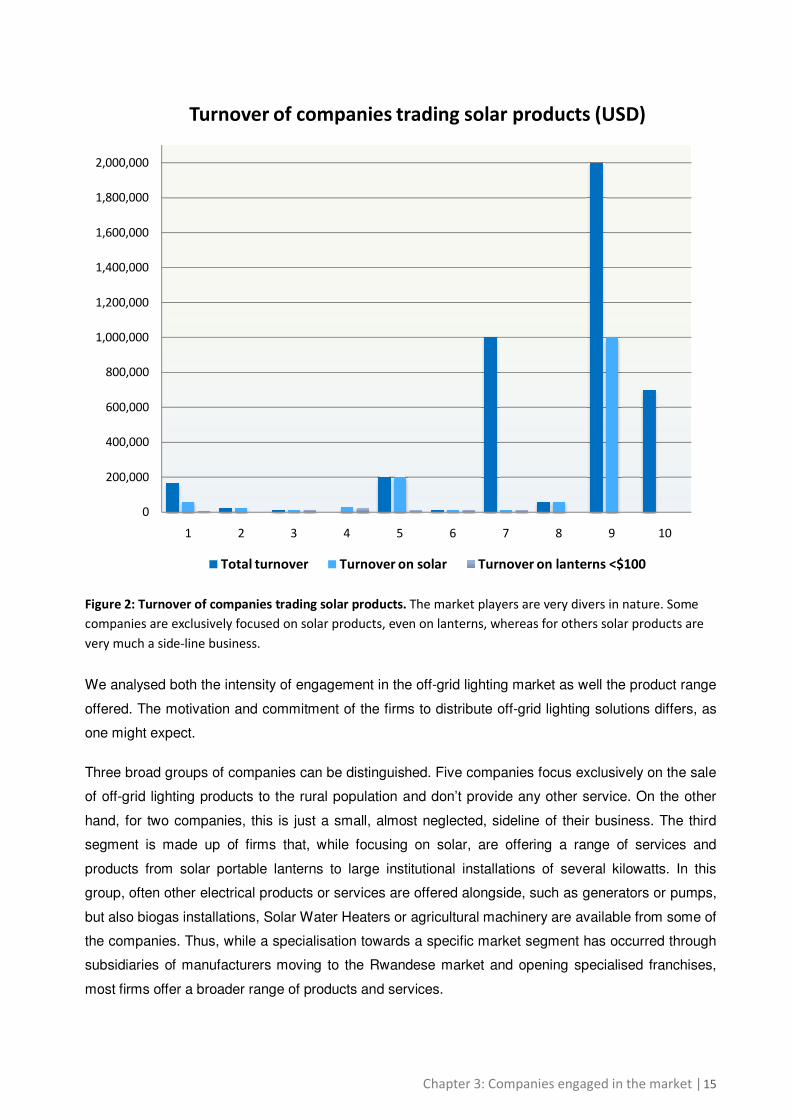
For four companies the average sale value per product is below US$50. Thus, roughly half of the
market players focus on the product segment of below US$50 with very little, if any options beyond
such products. On the other end, for three companies most sales have a value of around US$1,000 or
beyond. Even if a lot of marketing and effort is spent on the low cost consumer segment, these
companies live off the few large institutional installations for churches, schools or health centres that
they do per year.
This pattern is generally reflected in turnover. While the companies that have capable technicians to
install large systems achieve turnovers of more than US$100,000, none of the firms focused on the
low-cost consumer market has achieved such scale. Even those with high sales volumes don’t
achieve the revenue created by a few institutional installations secured through government or NGO
tenders, or through other contacts.
Figure 3: The contribution of different product lines in the companies’ revenue structure. 2 companies are
purely dealing in lantern products, other companies are more divers but an additional 3 are still purely solar PV
focused.
Three companies dominate sales of portable lanterns in Rwanda each with over 400 products sold per
month, although for one company sales levels have dropped substantially in the last year.
Interestingly, the key players in the lantern market rely heavily on outside support and the current
sales levels do not recover expenditures. The total social investment in form of grants or conditional
loans to build up sales has exceeded US$ 2 million in over the last 2 years. An additional three
companies have also taken up commercial loans but this has been restricted mainly to import
financing against government contracts.
0% 20% 40% 60% 80% 100%
1
2
3
4
5
6
7
8
9
10
Turnover on SPLs < $100
Turnover on kits, SHS and
installations
Turnover for unrelated
items
Chapter 3: Companies engaged in the market | 17
At the current stage and in the absence of donor funding, business models rely on off-grid lighting
products being a side business in which the expenditures associated with the import and distribution
become marginal, for example by importing and selling them together with other unrelated goods.
They can be sold with little additional cost from the shop whose overhead is covered through revenue
from big installations or other products. However, if the market has to rely on slow organic growth
sales will likely stay at levels below 100 products per month. None of the firms without big retail
networks or donor support have achieved high levels of sales.
Establishing sales outlets can help to grow sales levels to a point where the revenues cover the costs
of maintaining a large distribution network, but considerable investment is needed to reach sufficient
scale. One of the fast growing companies that has received substantial support expects to break even
in 1.5 years and despite occasional failures, all of the interviewed companies reported steadily
increasing sales, revenue growth of more than 50% and a strong confidence in the market.
Additionally, three firms are at advanced stages to capture carbon finance from the reductions in
kerosene use by their clients in order to help to sustain and grow their business. These companies
have applied with their country plans to the Clean Development Mechanism (CDM) but while their
registration process is more advanced in Kenya, Tanzania or Uganda, the registration of projects and
eventual income from carbon credits could still be some way off in Rwanda. First, the carbon savings
per product are very low (around 0.05tCO2 per year for a lantern), thus adding perhaps US$1 per
product, according to industry sources. Therefore it is a challenge to recover investment costs in the
carbon registration process.
The outlook however changes i) with scale and ii) with size of the system. If total sales of a particular
company of 1 million would be recorded throughout the East Africa region, this would bring
considerable long-term revenue from carbon finance if tracking systems can be efficiently organised
through IT and mobile technology. Secondly, whereas savings of lanterns are low, contributions from
carbon finance to micro-kits costing around US$60 that replace 4 kerosene lanterns with LEDs, can
improve the financial calculations on carbon finance.
Chapter 4: Products and Pricing | 18
Chapter 4: Products and Pricing
4.1 Available Products
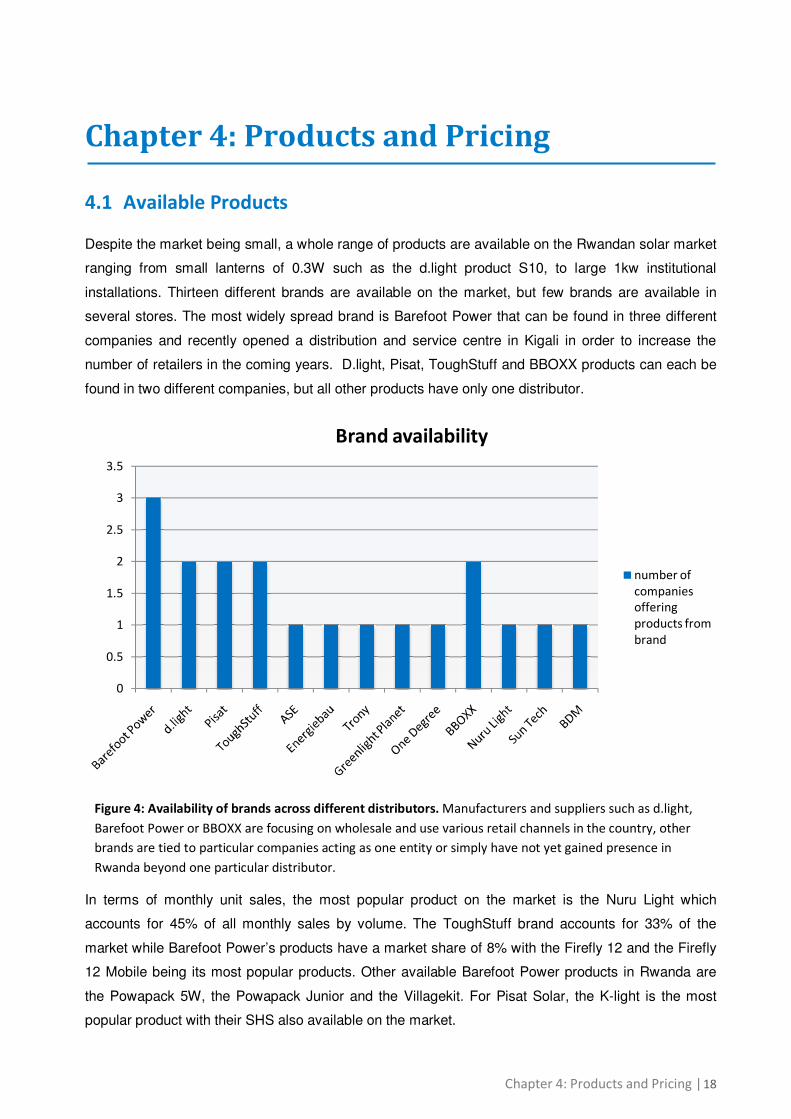
Despite the market being small, a whole range of products are available on the Rwandan solar market
ranging from small lanterns of 0.3W such as the d.light product S10, to large 1kw institutional
installations. Thirteen different brands are available on the market, but few brands are available in
several stores. The most widely spread brand is Barefoot Power that can be found in three different
companies and recently opened a distribution and service centre in Kigali in order to increase the
number of retailers in the coming years. D.light, Pisat, ToughStuff and BBOXX products can each be
found in two different companies, but all other products have only one distributor.
Figure 4: Availability of brands across different distributors. Manufacturers and suppliers such as d.light,
Barefoot Power or BBOXX are focusing on wholesale and use various retail channels in the country, other
brands are tied to particular companies acting as one entity or simply have not yet gained presence in
Rwanda beyond one particular distributor.
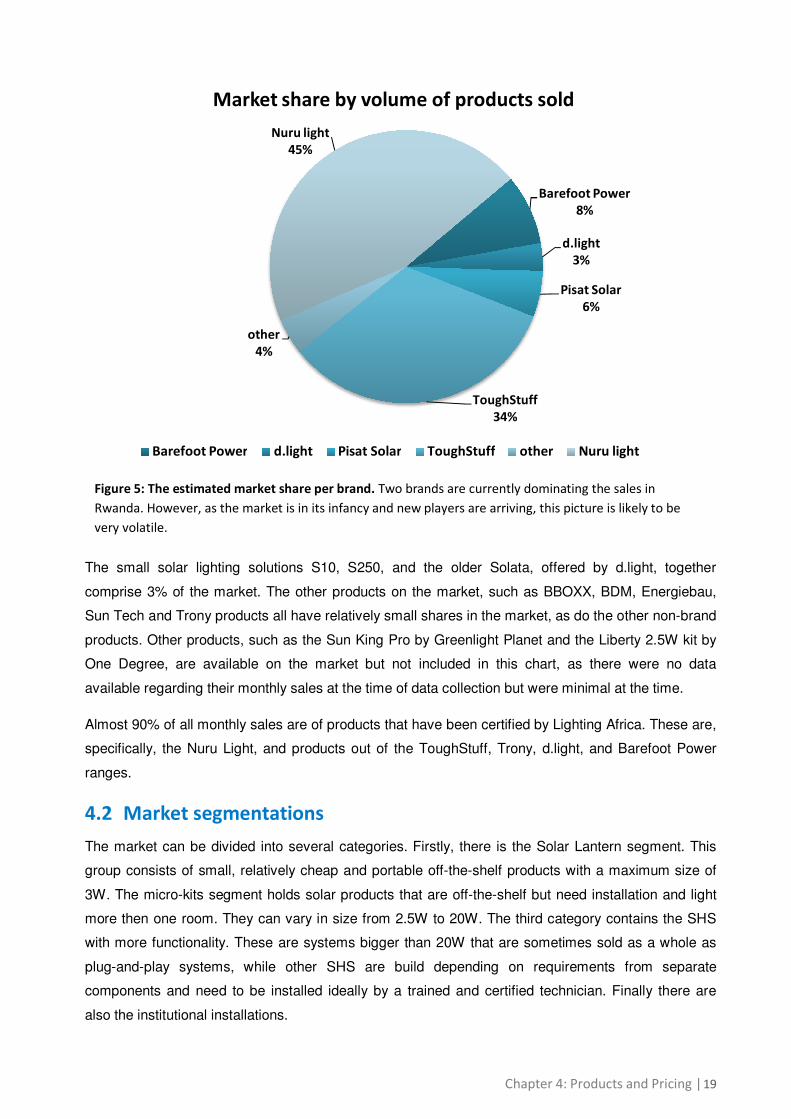
In terms of monthly unit sales, the most popular product on the market is the Nuru Light which
accounts for 45% of all monthly sales by volume. The ToughStuff brand accounts for 33% of the
market while Barefoot Power’s products have a market share of 8% with the Firefly 12 and the Firefly
12 Mobile being its most popular products. Other available Barefoot Power products in Rwanda are
the Powapack 5W, the Powapack Junior and the Villagekit. For Pisat Solar, the K-light is the most
popular product with their SHS also available on the market.
0
0.5
1
1.5
2
2.5
3
3.5
Brand availability
number of
companies
offering
products from
brand
Chapter 4: Products and Pricing | 19
Figure 5: The estimated market share per brand. Two brands are currently dominating the sales in
Rwanda. However, as the market is in its infancy and new players are arriving, this picture is likely to be
very volatile.
The small solar lighting solutions S10, S250, and the older Solata, offered by d.light, together
comprise 3% of the market. The other products on the market, such as BBOXX, BDM, Energiebau,
Sun Tech and Trony products all have relatively small shares in the market, as do the other non-brand
products. Other products, such as the Sun King Pro by Greenlight Planet and the Liberty 2.5W kit by
One Degree, are available on the market but not included in this chart, as there were no data
available regarding their monthly sales at the time of data collection but were minimal at the time.
Almost 90% of all monthly sales are of products that have been certified by Lighting Africa. These are,
specifically, the Nuru Light, and products out of the ToughStuff, Trony, d.light, and Barefoot Power
ranges.
4.2 Market segmentations
The market can be divided into several categories. Firstly, there is the Solar Lantern segment. This
group consists of small, relatively cheap and portable off-the-shelf products with a maximum size of
3W. The micro-kits segment holds solar products that are off-the-shelf but need installation and light
more then one room. They can vary in size from 2.5W to 20W. The third category contains the SHS
with more functionality. These are systems bigger than 20W that are sometimes sold as a whole as
plug-and-play systems, while other SHS are build depending on requirements from separate
components and need to be installed ideally by a trained and certified technician. Finally there are
also the institutional installations.
Barefoot Power
8%
d.light
3%
Pisat Solar
6%
ToughStuff
34%
other
4%
Nuru light
45%
Market share by volume of products sold
Barefoot Power d.light Pisat Solar ToughStuff other Nuru light
Chapter 4: Products and Pricing | 20
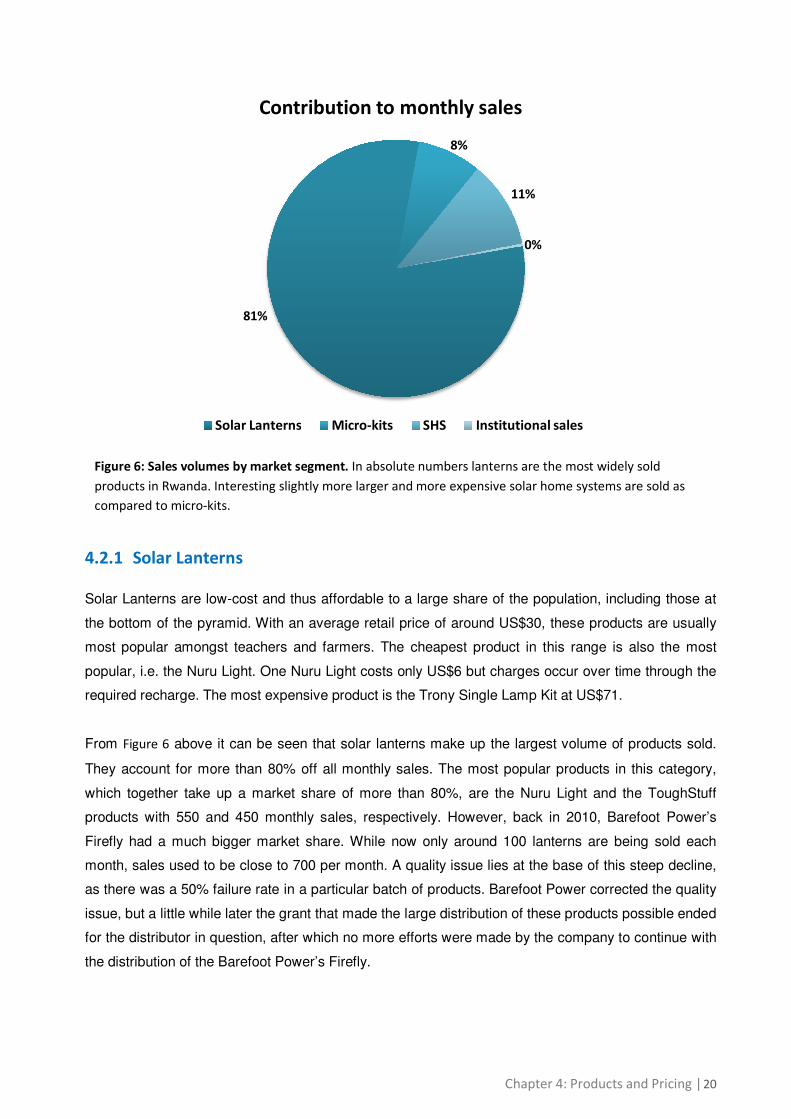
Figure 6: Sales volumes by market segment. In absolute numbers lanterns are the most widely sold
products in Rwanda. Interesting slightly more larger and more expensive solar home systems are sold as
compared to micro-kits.
4.2.1 Solar Lanterns
Solar Lanterns are low-cost and thus affordable to a large share of the population, including those at
the bottom of the pyramid. With an average retail price of around US$30, these products are usually
most popular amongst teachers and farmers. The cheapest product in this range is also the most
popular, i.e. the Nuru Light. One Nuru Light costs only US$6 but charges occur over time through the
required recharge. The most expensive product is the Trony Single Lamp Kit at US$71.
From Figure 6 above it can be seen that solar lanterns make up the largest volume of products sold.
They account for more than 80% off all monthly sales. The most popular products in this category,
which together take up a market share of more than 80%, are the Nuru Light and the ToughStuff
products with 550 and 450 monthly sales, respectively. However, back in 2010, Barefoot Power’s
Firefly had a much bigger market share. While now only around 100 lanterns are being sold each
month, sales used to be close to 700 per month. A quality issue lies at the base of this steep decline,
as there was a 50% failure rate in a particular batch of products. Barefoot Power corrected the quality
issue, but a little while later the grant that made the large distribution of these products possible ended
for the distributor in question, after which no more efforts were made by the company to continue with
the distribution of the Barefoot Power’s Firefly.
81%
8%
11%
0%
Contribution to monthly sales
Solar Lanterns Micro-kits SHS Institutional sales
Chapter 4: Products and Pricing | 21
Figure 7: Sales of portable lanterns compared to all other products per month Sales of lanterns are far
higher in volume than other products with sales of 3 companies having been above 400 per month.
0
100
200
300
400
500
600
700
1 2 3 4 5 6 7 8 9 10
Sales of lanterns compared to other market segments
Sales portable lanterns < 3W other solar products
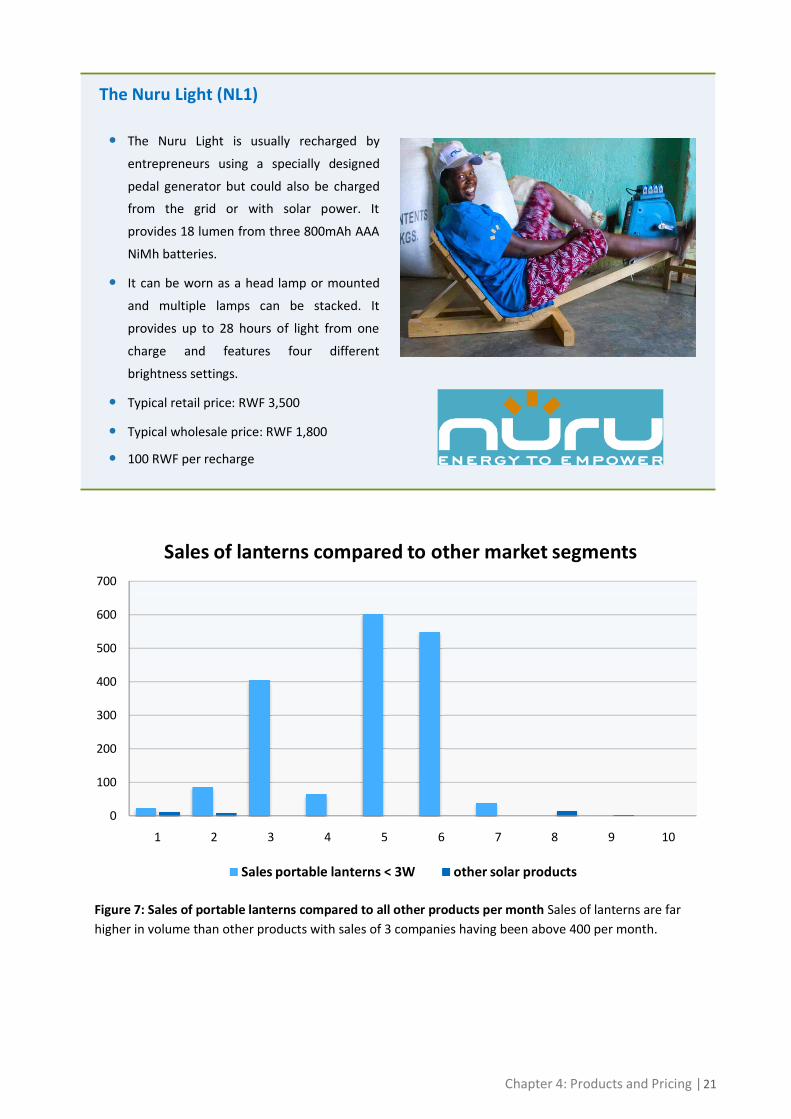
The Nuru Light (NL1)
• The Nuru Light is usually recharged by
entrepreneurs using a specially designed
pedal generator but could also be charged
from the grid or with solar power. It
provides 18 lumen from three 800mAh AAA
NiMh batteries.
• It can be worn as a head lamp or mounted
and multiple lamps can be stacked. It
provides up to 28 hours of light from one
charge and features four different
brightness settings.
• Typical retail price: RWF 3,500
• Typical wholesale price: RWF 1,800
• 100 RWF per recharge
Chapter 4: Products and Pricing | 22
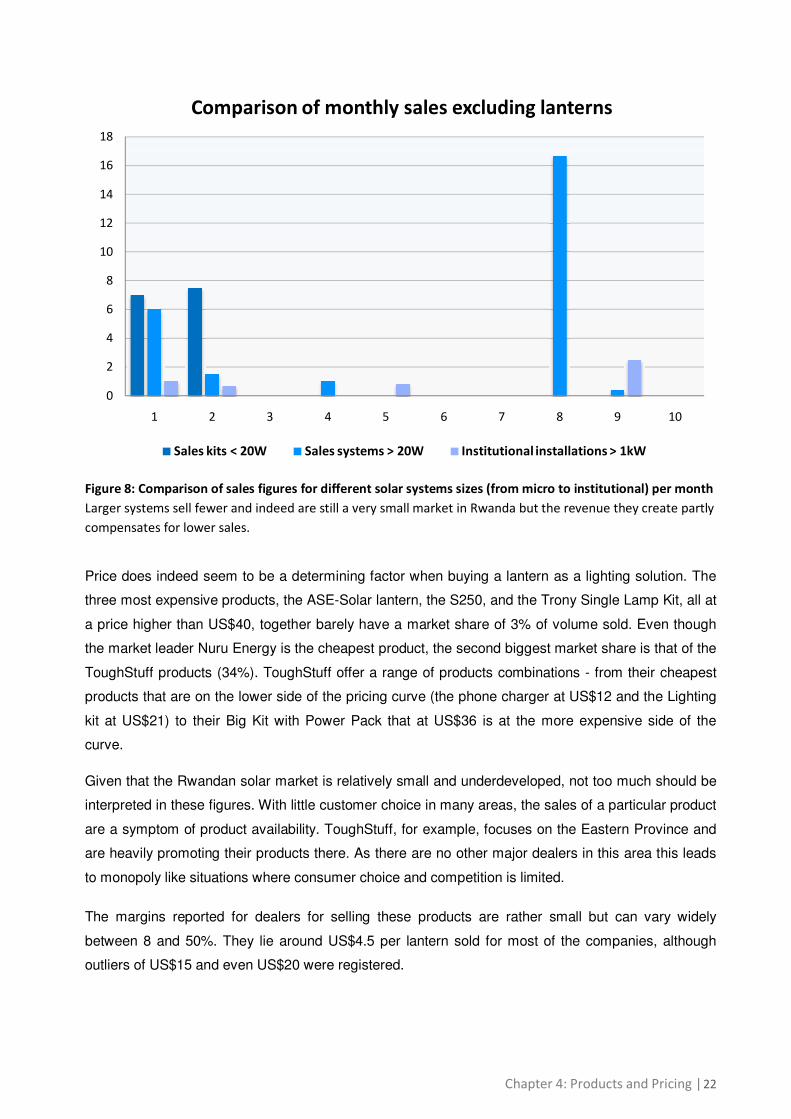
Figure 8: Comparison of sales figures for different solar systems sizes (from micro to institutional) per month
Larger systems sell fewer and indeed are still a very small market in Rwanda but the revenue they create partly
compensates for lower sales.
Price does indeed seem to be a determining factor when buying a lantern as a lighting solution. The
three most expensive products, the ASE-Solar lantern, the S250, and the Trony Single Lamp Kit, all at
a price higher than US$40, together barely have a market share of 3% of volume sold. Even though
the market leader Nuru Energy is the cheapest product, the second biggest market share is that of the
ToughStuff products (34%). ToughStuff offer a range of products combinations - from their cheapest
products that are on the lower side of the pricing curve (the phone charger at US$12 and the Lighting
kit at US$21) to their Big Kit with Power Pack that at US$36 is at the more expensive side of the
curve.
Given that the Rwandan solar market is relatively small and underdeveloped, not too much should be
interpreted in these figures. With little customer choice in many areas, the sales of a particular product
are a symptom of product availability. ToughStuff, for example, focuses on the Eastern Province and
are heavily promoting their products there. As there are no other major dealers in this area this leads
to monopoly like situations where consumer choice and competition is limited.
The margins reported for dealers for selling these products are rather small but can vary widely
between 8 and 50%. They lie around US$4.5 per lantern sold for most of the companies, although
outliers of US$15 and even US$20 were registered.
0
2
4
6
8
10
12
14
16
18
1 2 3 4 5 6 7 8 9 10
Comparison of monthly sales excluding lanterns
Sales kits < 20W Sales systems > 20W Institutional installations > 1kW
Chapter 4: Products and Pricing | 23
4.2.2 Small systems
The third largest segment in terms of absolute sales figures is the segment of micro-kits, which
accounts for 8% of the absolute monthly sales of solar products. The micro-kits from BBOXX,
Barefoot Power, and ASE all have an almost equal market share around 30%.
The products in this category have more power than the products in the Solar Lantern category and
can go up to 20W. These Micro-kits offer more in terms of use and power and this is reflected in the
price that can vary between US$80 and US$500. This big difference in price with the solar Lantern
segment, where the average price was around US$30, means that the micro-kits capture a
considerably smaller share of the overall market. The smallest product in this segment is Barefoot
Power’s Powapack Junior of only 2.5W, and it is also the cheapest at US$80. This trend is seen as
well with the other products; the higher the power output, the higher the price. The only exceptions to
this are the Barefoot Power products. The PowaPack 5W lies in the same price range with products
from other brands that have double the Watt power. Barefoot Power’s Village Kit, which is sold at an
average market price of around US$400, has 10W and is almost double the price of the bigger 15W
ASE Solar-15. It is no surprise then, that few sales have been recorded for the Village kit, as for the
same price a small off-the-shelf SHS of 30W to 50W can be bought.
The margins for dealers per product sold range from US$12 to around US$150, depending on the
product. The average margin per product for the dealers in this market study lies around US$60. This
is considerably more than for any of the lanterns where average profit is around US$4.5. Also most
products create far bigger revenue for the dealer than the products in the solar lantern segment.
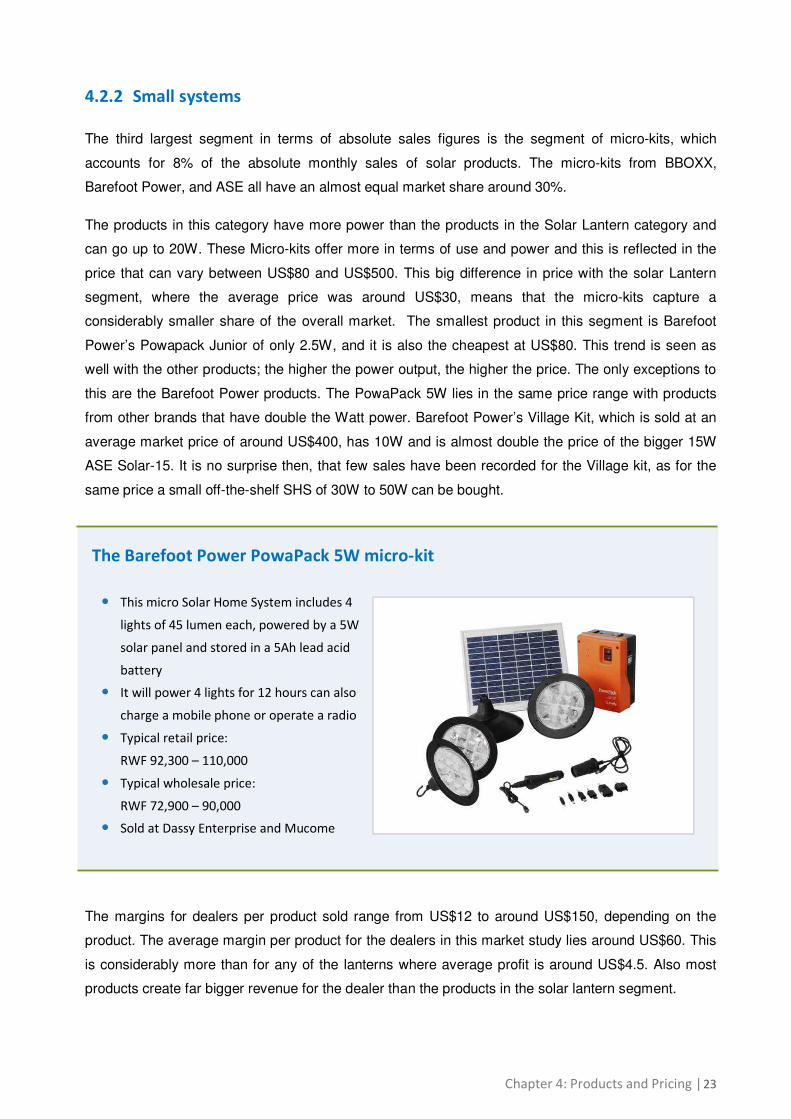
The Barefoot Power PowaPack 5W micro-kit
• This micro Solar Home System includes 4
lights of 45 lumen each, powered by a 5W
solar panel and stored in a 5Ah lead acid
battery
• It will power 4 lights for 12 hours can also
charge a mobile phone or operate a radio
• Typical retail price:
RWF 92,300 – 110,000
• Typical wholesale price:
RWF 72,900 – 90,000
• Sold at Dassy Enterprise and Mucome
Chapter 4: Products and Pricing | 24
The incentive to sell these systems is therefore much bigger then for lanterns. This market segment is
however not yet developed with just over 100 sales per year among all brands. This segment
contributes proportionally more to the revenue of the companies. Nevertheless, because the number
of sales is much lower, solar lanterns still provide dealers with a bigger revenue. About half of the total
revenue created in the market is coming from solar lanterns and whereas micro-kits do not account for
more then 10% of the sales, they are bring in considerable revenue for the companies.
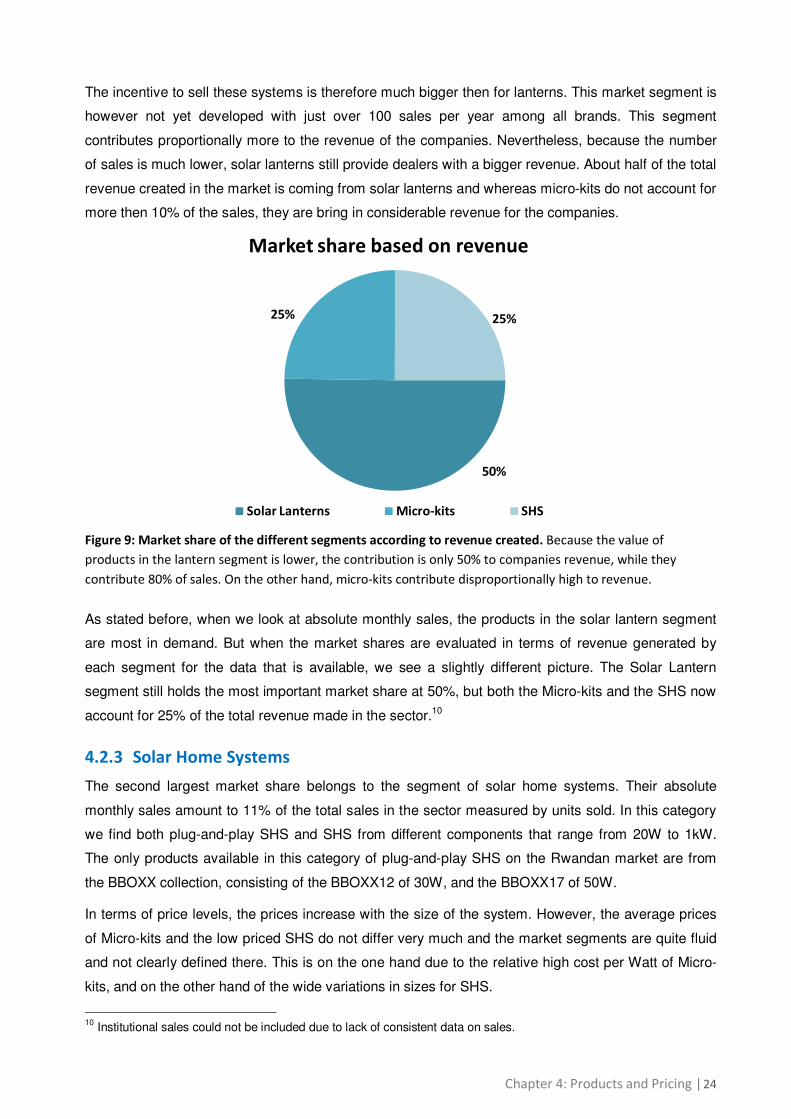
Figure 9: Market share of the different segments according to revenue created. Because the value of
products in the lantern segment is lower, the contribution is only 50% to companies revenue, while they
contribute 80% of sales. On the other hand, micro-kits contribute disproportionally high to revenue.
As stated before, when we look at absolute monthly sales, the products in the solar lantern segment
are most in demand. But when the market shares are evaluated in terms of revenue generated by
each segment for the data that is available, we see a slightly different picture. The Solar Lantern
segment still holds the most important market share at 50%, but both the Micro-kits and the SHS now
account for 25% of the total revenue made in the sector.10
4.2.3 Solar Home Systems
The second largest market share belongs to the segment of solar home systems. Their absolute
monthly sales amount to 11% of the total sales in the sector measured by units sold. In this category
we find both plug-and-play SHS and SHS from different components that range from 20W to 1kW.
The only products available in this category of plug-and-play SHS on the Rwandan market are from
the BBOXX collection, consisting of the BBOXX12 of 30W, and the BBOXX17 of 50W.
In terms of price levels, the prices increase with the size of the system. However, the average prices
of Micro-kits and the low priced SHS do not differ very much and the market segments are quite fluid
and not clearly defined there. This is on the one hand due to the relative high cost per Watt of Micro-
kits, and on the other hand of the wide variations in sizes for SHS.
10
Institutional sales could not be included due to lack of consistent data on sales.
50%
25% 25%
Market share based on revenue
Solar Lanterns Micro-kits SHS
Chapter 4: Products and Pricing | 25
The SHS available on the market in this segment range from 30W to 1kW. For SHS from different
components one can expect to pay around US$8 per Watt. For the plug-and-play SHS, the prices are
higher than most products in the Micro-kits, except for the Village Kit which is more expensive than
the BBOXX 12 and 17. The average price for a plug-and-play SHS product is around US$420. The
margins per product sold for these products are around US$ 70 per product.
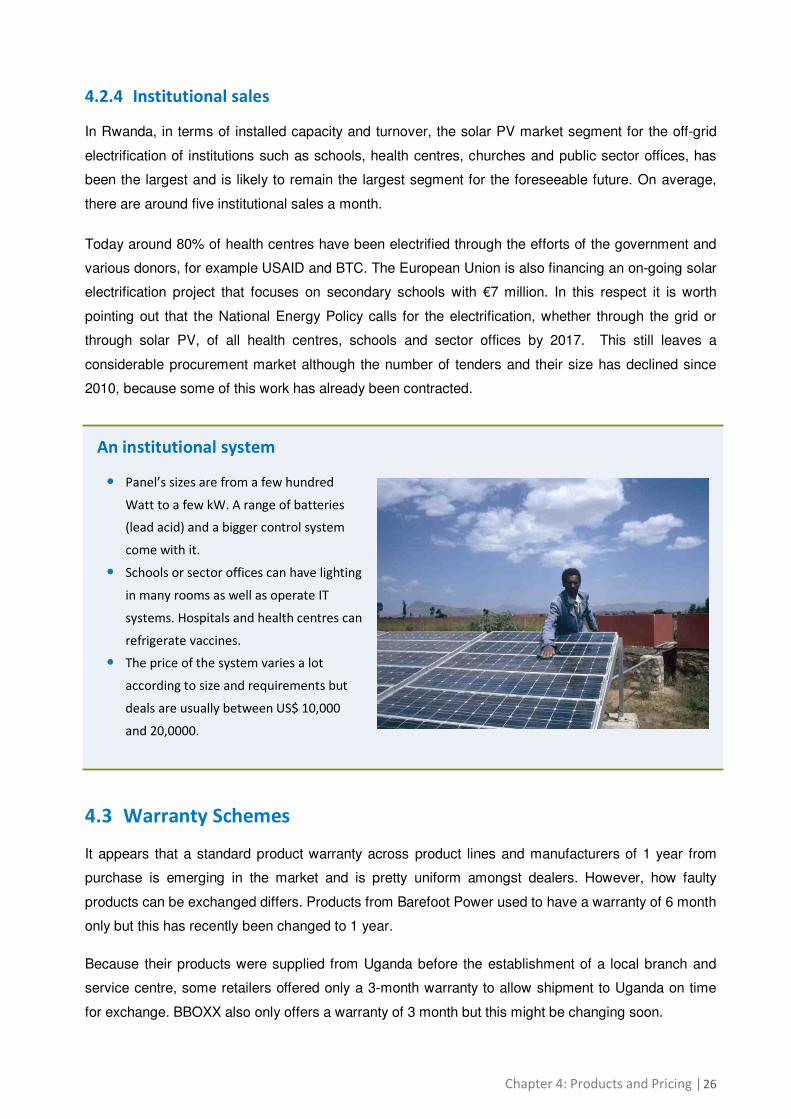
Figure 10- Market share of the different segments according to installed Watt.11
Whereas SHS make up only
around 10% of volume sales, the account for the vast majority of installed power.
11
No data available for institutional sales and they are therefore not reflected in this figure. However, it can safely
be assumed that the amount of installed Watt through institutional sales is overshadowing the sales from the
smaller segments by far.
7%
17%
76%
Market share Watt installed
lanterns small systems SHS
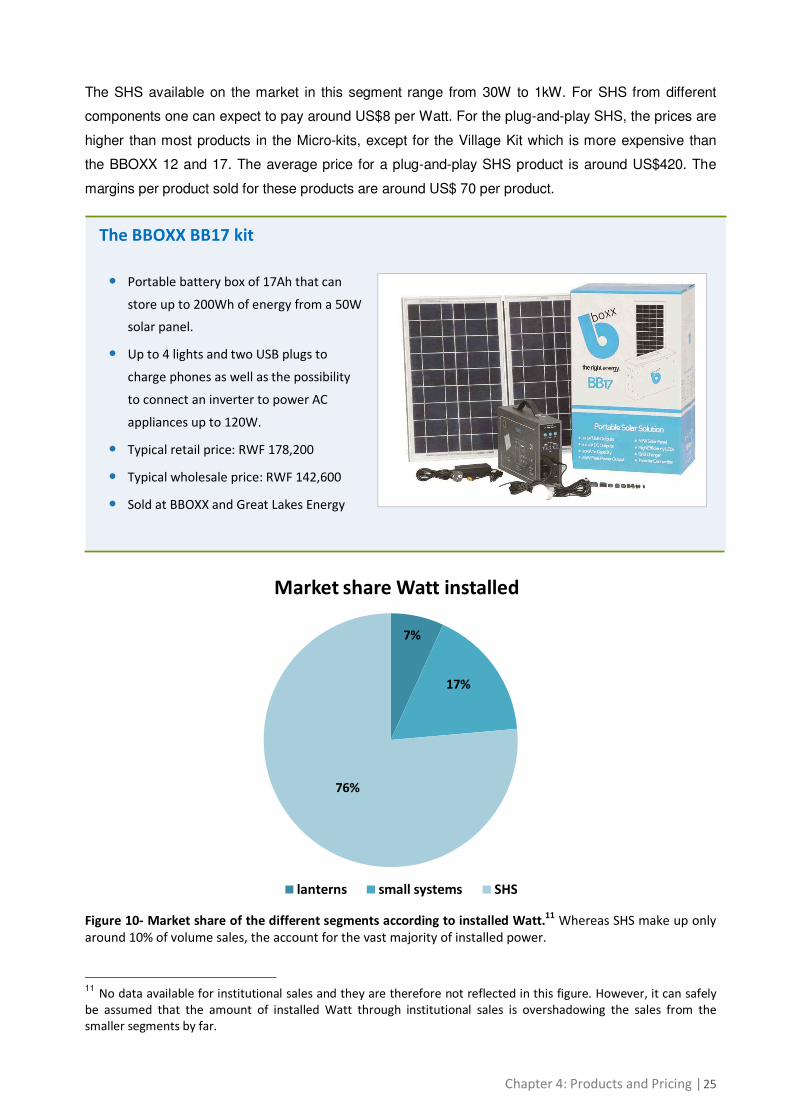
The BBOXX BB17 kit
• Portable battery box of 17Ah that can
store up to 200Wh of energy from a 50W
solar panel.
• Up to 4 lights and two USB plugs to
charge phones as well as the possibility
to connect an inverter to power AC
appliances up to 120W.
• Typical retail price: RWF 178,200
• Typical wholesale price: RWF 142,600
• Sold at BBOXX and Great Lakes Energy
Chapter 4: Products and Pricing | 26
4.2.4 Institutional sales In Rwanda, in terms of installed capacity and turnover, the solar PV market segment for the off-grid
electrification of institutions such as schools, health centres, churches and public sector offices, has
been the largest and is likely to remain the largest segment for the foreseeable future. On average,
there are around five institutional sales a month.
Today around 80% of health centres have been electrified through the efforts of the government and
various donors, for example USAID and BTC. The European Union is also financing an on-going solar
electrification project that focuses on secondary schools with €7 million. In this respect it is worth
pointing out that the National Energy Policy calls for the electrification, whether through the grid or
through solar PV, of all health centres, schools and sector offices by 2017. This still leaves a
considerable procurement market although the number of tenders and their size has declined since
2010, because some of this work has already been contracted.
4.3 Warranty Schemes
It appears that a standard product warranty across product lines and manufacturers of 1 year from
purchase is emerging in the market and is pretty uniform amongst dealers. However, how faulty
products can be exchanged differs. Products from Barefoot Power used to have a warranty of 6 month
only but this has recently been changed to 1 year.
Because their products were supplied from Uganda before the establishment of a local branch and
service centre, some retailers offered only a 3-month warranty to allow shipment to Uganda on time
for exchange. BBOXX also only offers a warranty of 3 month but this might be changing soon.
An institutional system
• Panel’s sizes are from a few hundred
Watt to a few kW. A range of batteries
(lead acid) and a bigger control system
come with it.
• Schools or sector offices can have lighting
in many rooms as well as operate IT
systems. Hospitals and health centres can
refrigerate vaccines.
• The price of the system varies a lot
according to size and requirements but
deals are usually between US$ 10,000
and 20,0000.
Chapter 4: Products and Pricing | 27
This stresses the importance of regional representations of the manufacturers. For example,
Greenlight Planet does not have a permanent presence in East Africa, therefore warranties given on a
product might fall back on the distributor as there is no cost-effective way to get the faulty product to
the supplier for repair. Warranty is currently given out of courtesy and in trust to the distributor that
correct figures are reported.
For most distributors, the warranty can be claimed at a dealer level or at least in a representation
office in the district. For the K-Light and the BBOXX product range however, customers need to come
to the office in Kigali. Currently, BBOXX also does not have a physical office in Rwanda anymore,
which is, however, likely to change again in the second half of 2012.
Chapter 5: Distribution | 28
Chapter 5: Distribution
5.1 Distribution models in the different market segments Three main distribution models can be differentiated when looking at the off-grid lighting market in
Rwanda. The first one is direct sales from the premises of the company itself, the second one is sales
through a dealer network, and the third one is door-to-door sales through dealers or agents that
involve much more active promotion of the product. In terms of overall sales, the sales on the
premises and the sales through a dealer network each account for 10% of the total sales. The
door-to-door sales method generates most total sales with 80%. This is mostly due to the fact that
most sales by number of products come from small lanterns, which are often sold door-to-door.
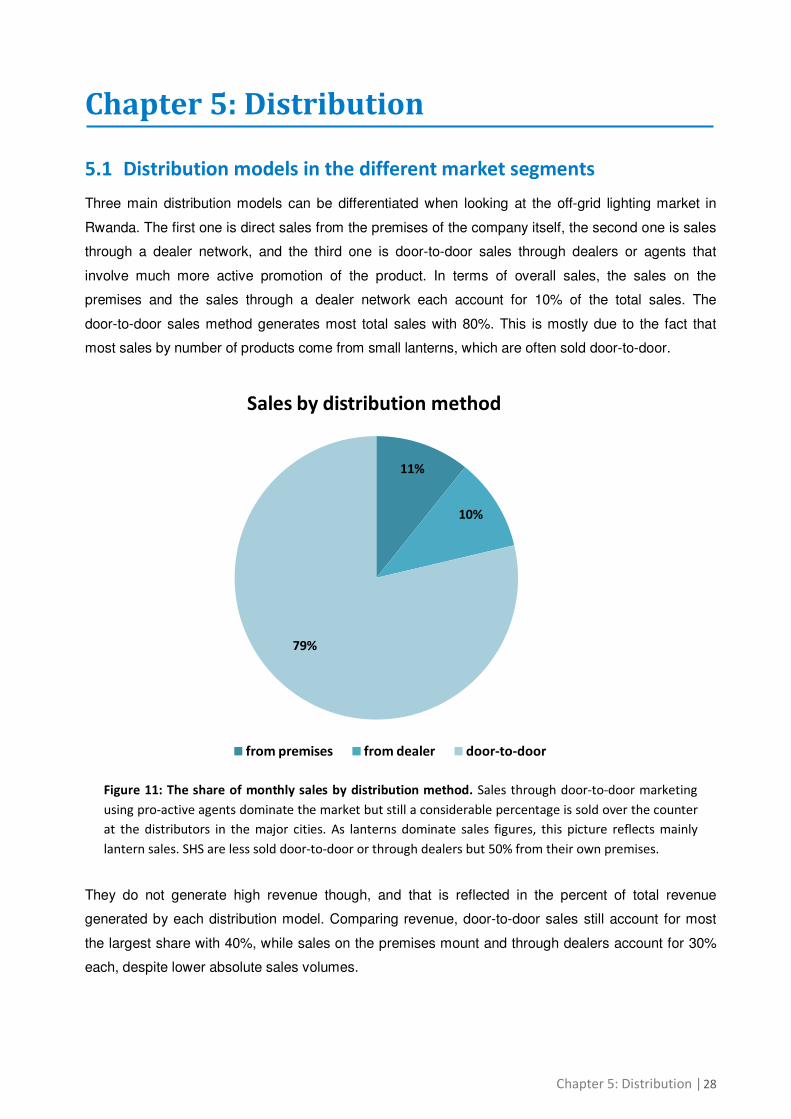
Figure 11: The share of monthly sales by distribution method. Sales through door-to-door marketing
using pro-active agents dominate the market but still a considerable percentage is sold over the counter
at the distributors in the major cities. As lanterns dominate sales figures, this picture reflects mainly
lantern sales. SHS are less sold door-to-door or through dealers but 50% from their own premises.
They do not generate high revenue though, and that is reflected in the percent of total revenue
generated by each distribution model. Comparing revenue, door-to-door sales still account for most
the largest share with 40%, while sales on the premises mount and through dealers account for 30%
each, despite lower absolute sales volumes.
11%
10%
79%
Sales by distribution method
from premises from dealer door-to-door
Chapter 5: Distribution | 29
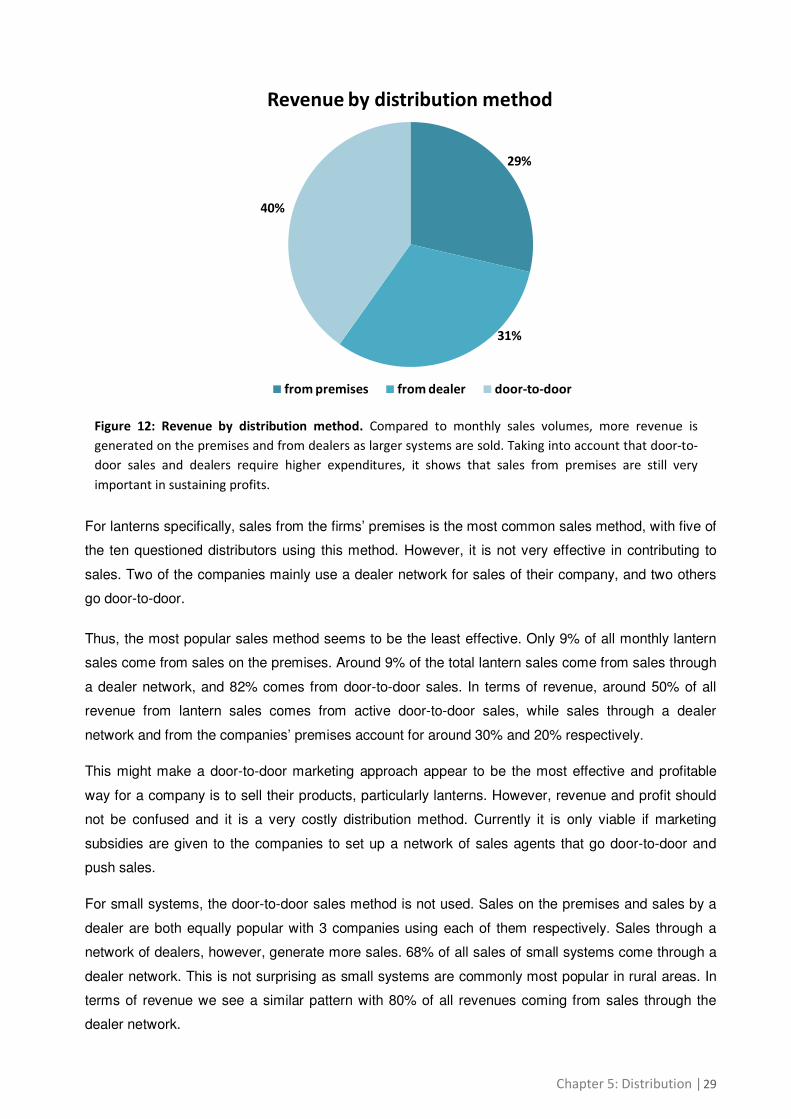
Figure 12: Revenue by distribution method. Compared to monthly sales volumes, more revenue is
generated on the premises and from dealers as larger systems are sold. Taking into account that door-to-
door sales and dealers require higher expenditures, it shows that sales from premises are still very
important in sustaining profits.
For lanterns specifically, sales from the firms’ premises is the most common sales method, with five of
the ten questioned distributors using this method. However, it is not very effective in contributing to
sales. Two of the companies mainly use a dealer network for sales of their company, and two others
go door-to-door.
Thus, the most popular sales method seems to be the least effective. Only 9% of all monthly lantern
sales come from sales on the premises. Around 9% of the total lantern sales come from sales through
a dealer network, and 82% comes from door-to-door sales. In terms of revenue, around 50% of all
revenue from lantern sales comes from active door-to-door sales, while sales through a dealer
network and from the companies’ premises account for around 30% and 20% respectively.
This might make a door-to-door marketing approach appear to be the most effective and profitable
way for a company is to sell their products, particularly lanterns. However, revenue and profit should
not be confused and it is a very costly distribution method. Currently it is only viable if marketing
subsidies are given to the companies to set up a network of sales agents that go door-to-door and
push sales.
For small systems, the door-to-door sales method is not used. Sales on the premises and sales by a
dealer are both equally popular with 3 companies using each of them respectively. Sales through a
network of dealers, however, generate more sales. 68% of all sales of small systems come through a
dealer network. This is not surprising as small systems are commonly most popular in rural areas. In
terms of revenue we see a similar pattern with 80% of all revenues coming from sales through the
dealer network.
29%
31%
40%
Revenue by distribution method
from premises from dealer door-to-door
Chapter 5: Distribution | 30
Most companies in our survey that sell SHS sell them from the premises. The door-to-door sales
method does not generate a lot of sales, with only 10% of the total sales of SHS, while the dealer
network from one company generates 45% of the total sales, as much as the sales from the premises
from 4 other companies. Surprisingly, in terms of revenue, sales through the dealer network only
account for 10%, while door-to-door sales accounts for 40% and sales from the premises adds up to
50% of the total revenue from sales of SHS. The reason behind this is that the sales from dealers
have been smaller SHS (30-50W) with a smaller price and revenue per system, while the systems
sold on the premises have been much larger (50-100W). Even though only 10% of the total sales of
SHS have been through a door-to-door sales network, they account for 40% of the revenue because
the systems sold in this method have been relatively big (200-1,000W). As for small systems, we thus
see that having a dealer network is a very effective way of distributing SHS in terms of sales numbers,
but as this is mostly used for smaller systems that are most popular in rural areas, this method is less
interesting in terms of revenue.
For institutional sales, dealer networks are not used. This is hardly surprising, as institutional buyers
are usually not based in the regions where dealers are present and would want the advice and
installation from the specialist. This is why sales on the premises are the most commonly used
method with around 95% of all institutional sales made this way. All 4 of the distributors who make
institutional sales do it from their premises. One of them also goes door-to-door to market the
products and make sales, and this accounts for 5% of all sales.
Out of all the companies that took part in this market research, 7 of them make wholesale sales, but
only 3 look for it actively. Some of this wholesale is for other countries, namely DRC and Burundi.
Those who look for it actively do so by going to trade fairs, visiting supermarket chains and by going
through the country identifying potential retailers.
5.1.1 Dealer networks
Even though dealer network only accounts for 10% of the total sales, it does generate 30% of revenue
for the companies. Also, half of the companies taking part in this market study actively make efforts to
find dealers to sell their products.
To sell solar products a certain degree of technical and commercial knowledge is required. To attain
this, 80% of the companies train their dealer network. The 20% that does not provide training does
this because they feel their product, mostly solar lanterns, is so easy to use it requires little of no
technical training. For those who do provide training, there is a large variation between the trainings.
For some, this can be a 30-minute training for each product, for others it’s a four-day training spread
over a month.
Chapter 5: Distribution | 31
To stimulate the activities of dealers, several companies offer credit arrangements to the dealers they
work with. If credit arrangements are made with dealers it’s mostly on lanterns. In total, five out of the
ten companies used to give credit to their dealers but two have stopped these arrangements on a
regular basis. They offer a month of supplier credit before full payment is required and two companies
consider giving credit arrangements only in the form of a payment delay of 2 weeks, with partial
advance payment and only in exceptional cases for good performing dealers. Credit is more likely in
wholesale deals to other established retailers but unlikely for the dealers in rural areas with low sales
and little collateral or trust.
However, these are the intermediaries in the distribution chain that are most dependent on financing
as their ability to pay upfront is very limited. Credit is also given by the suppliers themselves and not
through financial institutions. Nuru Energy used to have an arrangement with a micro-finance
institution but due to the change in the business model, under which the pedal generator remains
property of Nuru Energy, no credit from a third party is required anymore.
When we compare the average turnover on solar products with the average turnover for companies
that use a dealer network, we find that, even though sales through dealer networks account for 30% of
all revenue, companies that use a dealer network have on average a much lower turnover than
companies who do not use a dealer network. The reason for this is that the most profitable products
that have a high share in the turnover are large and often institutional installations. For these types of
installations, dealers are hardly ever used. Dealers are mostly used for solar lanterns and small
systems. When we look at the average turnover on solar products <US$100 we see that companies
that use a dealer network have an average turnover that is around 35% higher than the turnover of
companies without a dealer network, showing that dealer networks can increase sales.
5.1.2 Door-to-door sales
The most effective distribution method in terms of absolute sales and generated revenue, door-to-door
sales, is only actively used by three of the companies, all of which have a modest turnover. Only one
company uses its own employees to go directly to the clients, while others have sales agents or use
their dealer network.
Two additional companies were previously working with the door-to-door distribution method. One of
them tried the “business in a bag” model. They stopped working with this model as it was found
unreliable, did not create the income for the agent as expected and customers preferred a traditional
shopkeeper to return to for questions. Another business worked with a women’s co-operative, where
the women received 6 lanterns for free that they could sell through door-to-door marketing. The
money made from those sales they could be use to buy more lanterns from the company. Seventy-
five women were trained this way, but as this distribution network is not actively supported anymore, it
is unknown how many women are currently still active.
Chapter 5: Distribution | 32
Pro-active door-to-door distribution is mostly used for solar lanterns and indeed leads to increased
sales. The turnover for small solar products under US$100 of companies that currently use the door-
to-door distribution method is on average around 75% higher than the turnover for companies that use
neither dealer networks nor door-to-door distribution. They also make 30% more turnover than
companies using a dealer network without using door-to-door marketing activities. On the other hand,
costs for door-to-door marketing can be higher than for traditional shopkeepers and as mentioned
above, only companies with access to donor funding are using it currently at scale.
5.2 Product availability
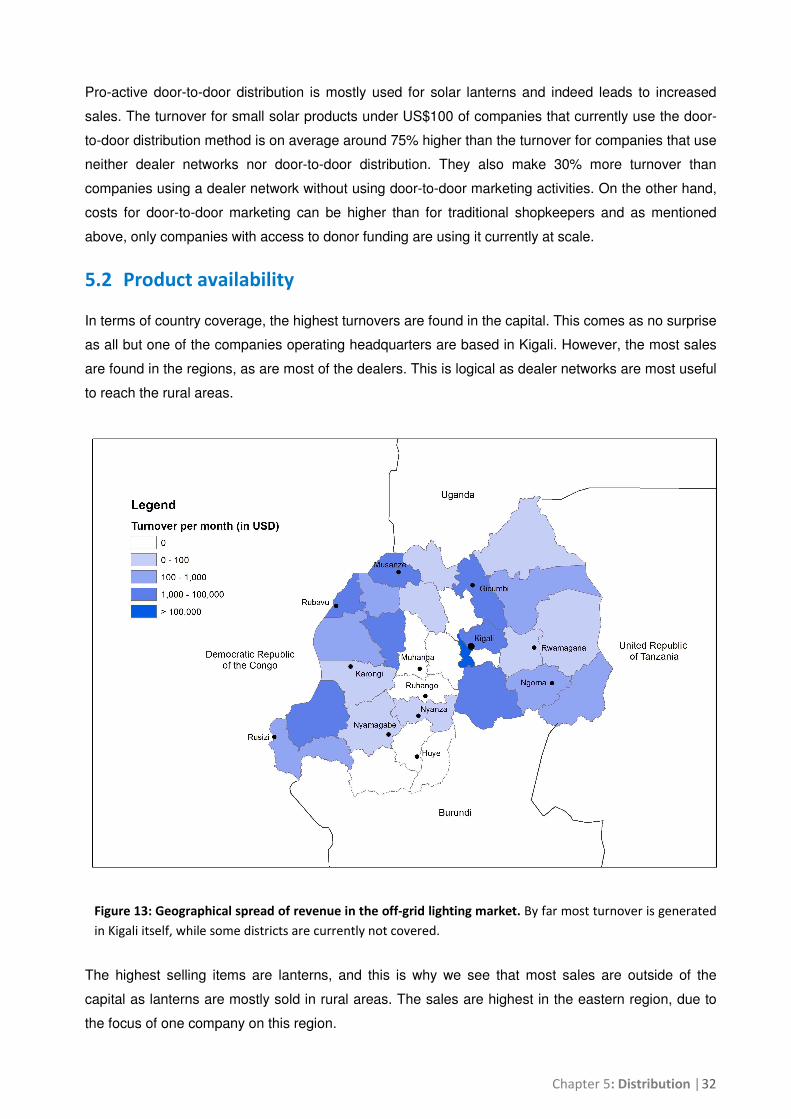
In terms of country coverage, the highest turnovers are found in the capital. This comes as no surprise
as all but one of the companies operating headquarters are based in Kigali. However, the most sales
are found in the regions, as are most of the dealers. This is logical as dealer networks are most useful
to reach the rural areas.
Figure 13: Geographical spread of revenue in the off-grid lighting market. By far most turnover is generated
in Kigali itself, while some districts are currently not covered.
The highest selling items are lanterns, and this is why we see that most sales are outside of the
capital as lanterns are mostly sold in rural areas. The sales are highest in the eastern region, due to
the focus of one company on this region.
Chapter 5: Distribution | 33
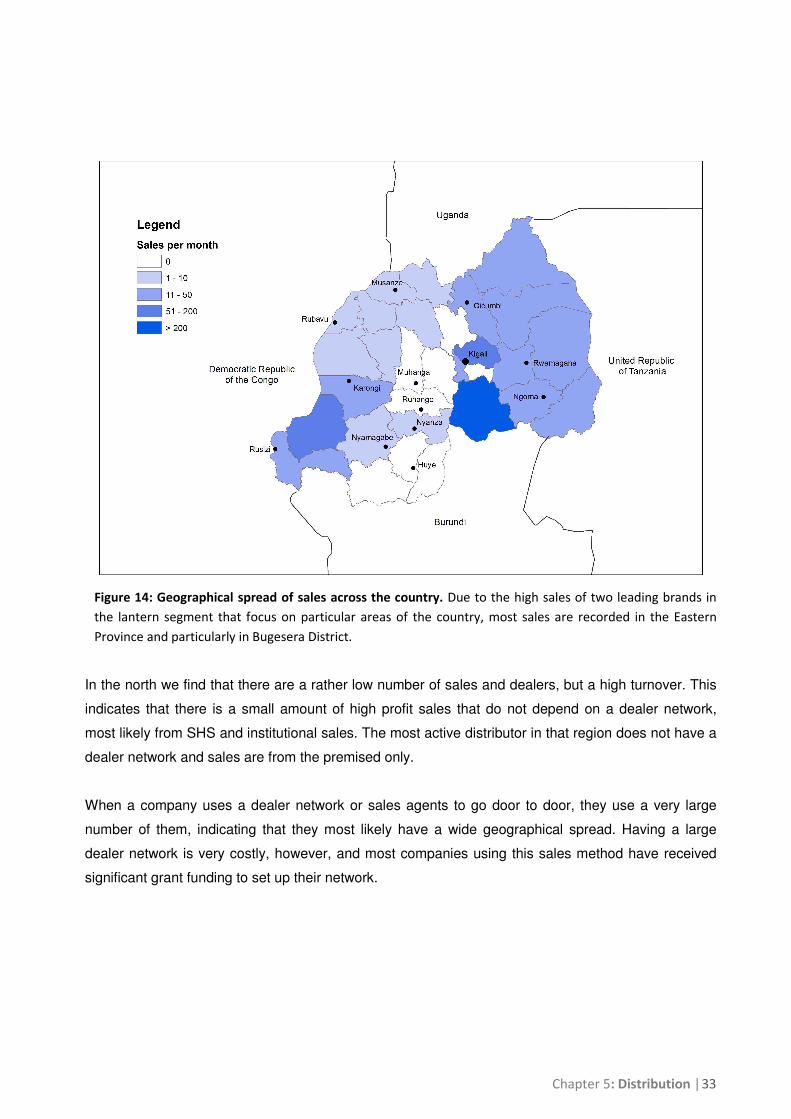
Figure 14: Geographical spread of sales across the country. Due to the high sales of two leading brands in
the lantern segment that focus on particular areas of the country, most sales are recorded in the Eastern
Province and particularly in Bugesera District.
In the north we find that there are a rather low number of sales and dealers, but a high turnover. This
indicates that there is a small amount of high profit sales that do not depend on a dealer network,
most likely from SHS and institutional sales. The most active distributor in that region does not have a
dealer network and sales are from the premised only.
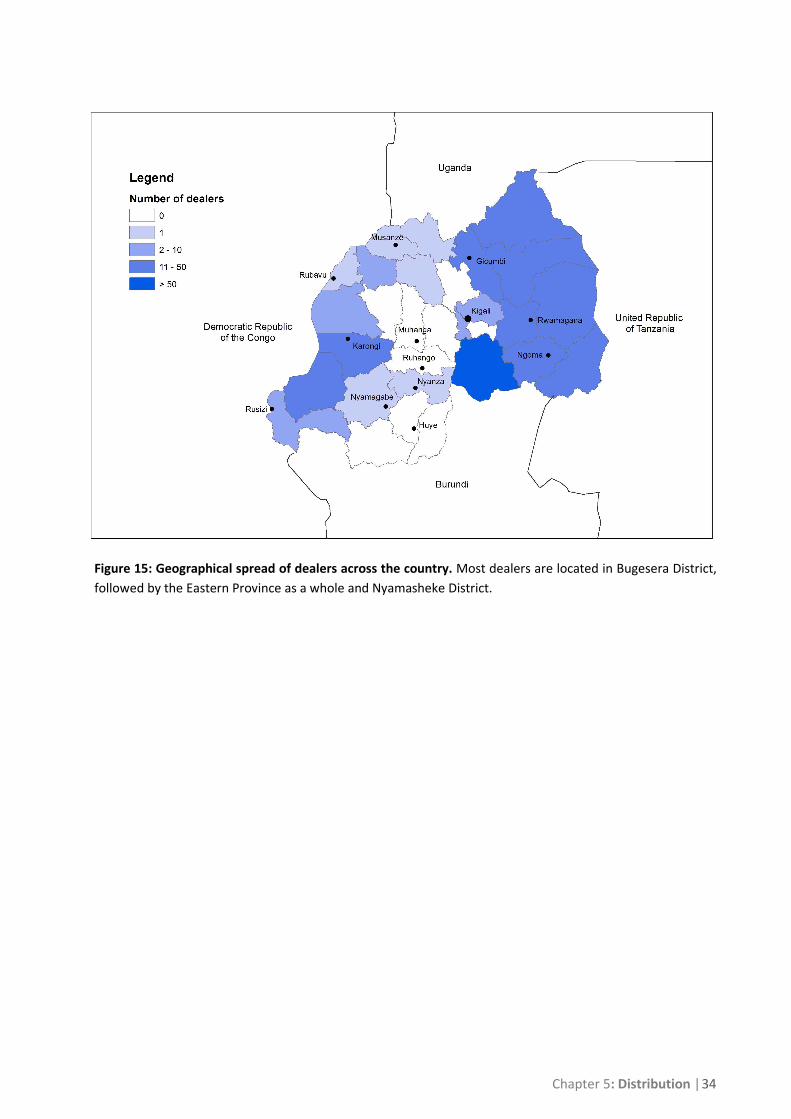
When a company uses a dealer network or sales agents to go door to door, they use a very large
number of them, indicating that they most likely have a wide geographical spread. Having a large
dealer network is very costly, however, and most companies using this sales method have received
significant grant funding to set up their network.
Chapter 5: Distribution | 34
Figure 15: Geographical spread of dealers across the country. Most dealers are located in Bugesera District,
followed by the Eastern Province as a whole and Nyamasheke District.
Chapter 6: Marketing and promotion | 35
Chapter 6: Marketing and promotion
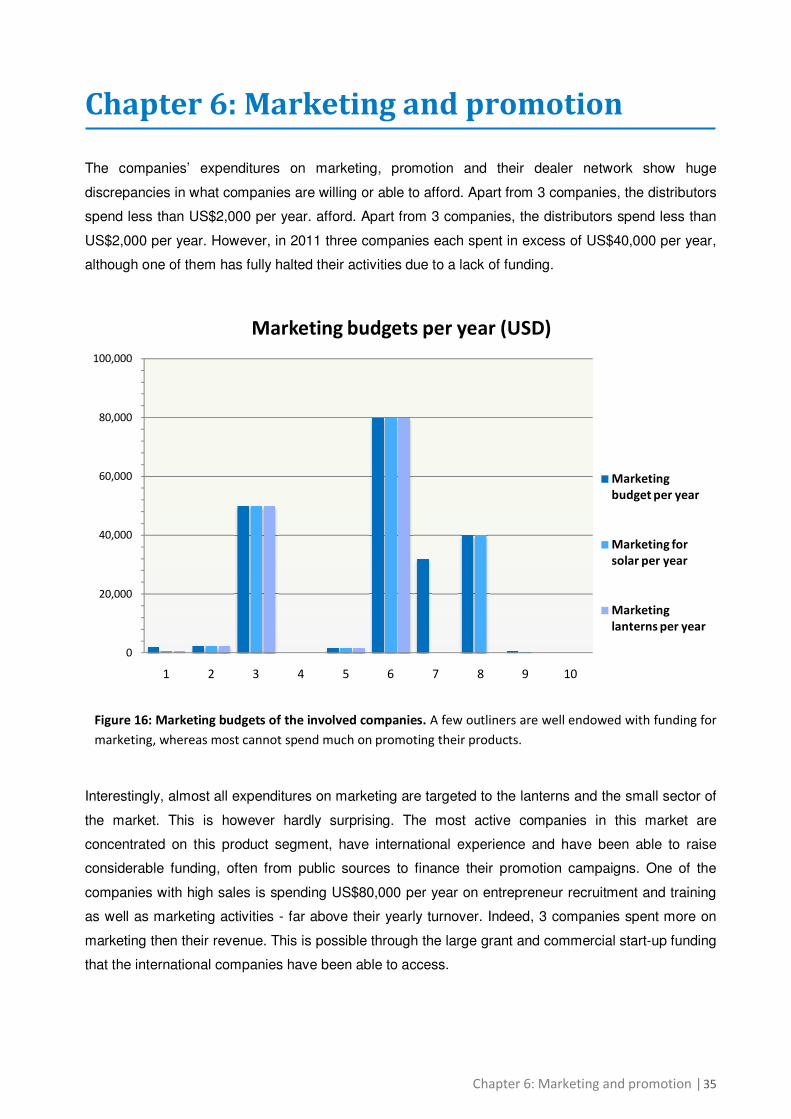
The companies’ expenditures on marketing, promotion and their dealer network show huge
discrepancies in what companies are willing or able to afford. Apart from 3 companies, the distributors
spend less than US$2,000 per year. afford. Apart from 3 companies, the distributors spend less than
US$2,000 per year. However, in 2011 three companies each spent in excess of US$40,000 per year,
although one of them has fully halted their activities due to a lack of funding.
Figure 16: Marketing budgets of the involved companies. A few outliners are well endowed with funding for
marketing, whereas most cannot spend much on promoting their products.
Interestingly, almost all expenditures on marketing are targeted to the lanterns and the small sector of
the market. This is however hardly surprising. The most active companies in this market are
concentrated on this product segment, have international experience and have been able to raise
considerable funding, often from public sources to finance their promotion campaigns. One of the
companies with high sales is spending US$80,000 per year on entrepreneur recruitment and training
as well as marketing activities - far above their yearly turnover. Indeed, 3 companies spent more on
marketing then their revenue. This is possible through the large grant and commercial start-up funding
that the international companies have been able to access.
0
20,000
40,000
60,000
80,000
100,000
1 2 3 4 5 6 7 8 9 10
Marketing budgets per year (USD)
Marketing
budget per year
Marketing for
solar per year
Marketing
lanterns per year
Chapter 6: Marketing and promotion | 36
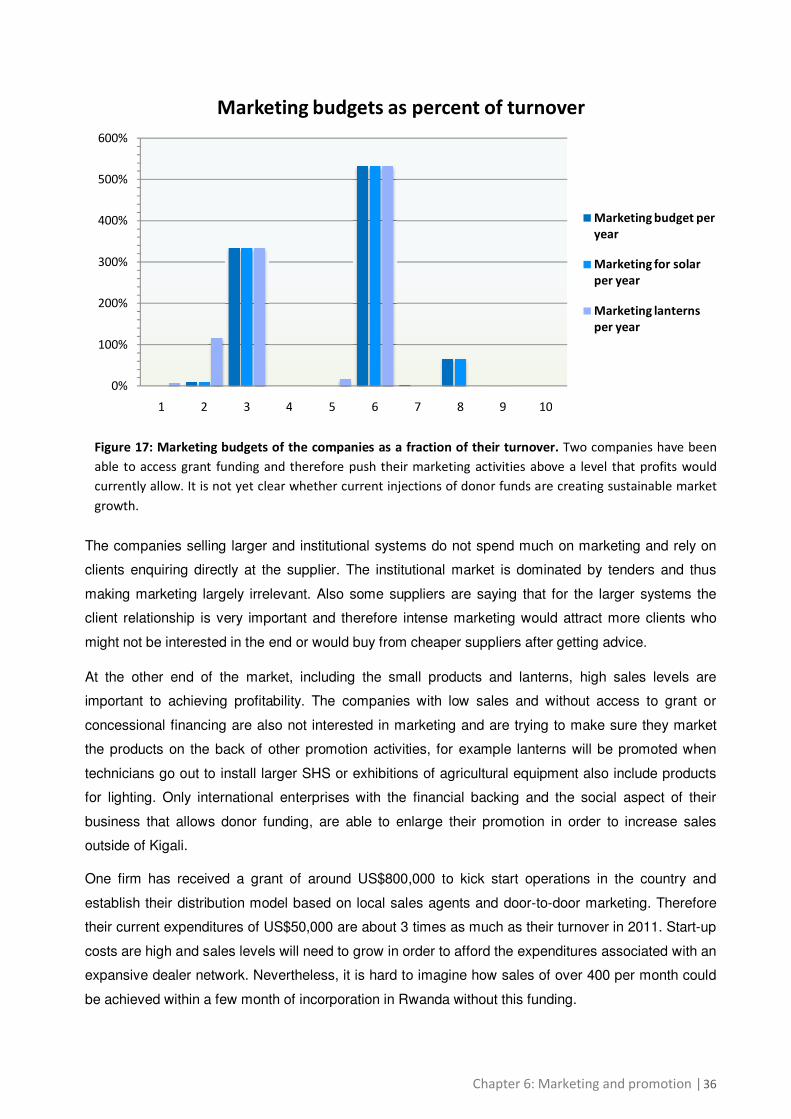
Figure 17: Marketing budgets of the companies as a fraction of their turnover. Two companies have been
able to access grant funding and therefore push their marketing activities above a level that profits would
currently allow. It is not yet clear whether current injections of donor funds are creating sustainable market
growth.
The companies selling larger and institutional systems do not spend much on marketing and rely on
clients enquiring directly at the supplier. The institutional market is dominated by tenders and thus
making marketing largely irrelevant. Also some suppliers are saying that for the larger systems the
client relationship is very important and therefore intense marketing would attract more clients who
might not be interested in the end or would buy from cheaper suppliers after getting advice.
At the other end of the market, including the small products and lanterns, high sales levels are
important to achieving profitability. The companies with low sales and without access to grant or
concessional financing are also not interested in marketing and are trying to make sure they market
the products on the back of other promotion activities, for example lanterns will be promoted when
technicians go out to install larger SHS or exhibitions of agricultural equipment also include products
for lighting. Only international enterprises with the financial backing and the social aspect of their
business that allows donor funding, are able to enlarge their promotion in order to increase sales
outside of Kigali.
One firm has received a grant of around US$800,000 to kick start operations in the country and
establish their distribution model based on local sales agents and door-to-door marketing. Therefore
their current expenditures of US$50,000 are about 3 times as much as their turnover in 2011. Start-up
costs are high and sales levels will need to grow in order to afford the expenditures associated with an
expansive dealer network. Nevertheless, it is hard to imagine how sales of over 400 per month could
be achieved within a few month of incorporation in Rwanda without this funding.
0%
100%
200%
300%
400%
500%
600%
1 2 3 4 5 6 7 8 9 10
Marketing budgets as percent of turnover
Marketing budget per
year
Marketing for solar
per year
Marketing lanterns
per year
Chapter 6: Marketing and promotion | 37
Another distributor also secured grants totalling US$300,000 from various funds and a concessional
loan of US$800,000. This allowed them to fund the high upfront costs of their business model.
Experience shows that expenditures on marketing can be turned into larger sales but the system
needs to be build sustainably. At the high point of a grant funded marketing campaign of one of the
distributors in 2010, they sold more than 600 products per month, more than have since been
recorded by any other company. However, this does not mean that sales levels can sustain an
expensive distribution network. The funding helped to get the products out but it was essentially a
supply push. The growth was too fast, and problems with the quality of the product and issues of
performance management of the dealers led to a scale down of operations. It was also clear dealers
had not been selected and screened carefully enough.
6.1 Marketing and promotion activities
All interviewed companies engage in marketing and spend a part of their revenue on it. In most cases
this is also targeted specifically at the smaller products that would appeal to a larger number of the
population.
Advertisements or interviews in the local radio stations seem to be very popular among the
companies, sometimes they even get invited for free. Dassy Enterprise made good experiences with a
radio talk, where listeners could call in and ask questions on the phone. Most time was spent
debunking some common myths about solar power, like low quality products, with an emphasis on the
economic savings. As a result, the distributor estimates that around 50 people have visited the shop.
For another company a radio advertisement brought 20 people to the shop. It appears that radio talks
can promote interest and awareness of the products but radio ads in the current form are unlikely to
have a considerable effect on sales.
Market days and small exhibitions can help to increase awareness of the products and demonstrate
their use. Seven companies engage in such activities as part of their promotions. For three, this
consists of a booth at the national EXPO in Kigali that is organised on a yearly basis by the Private
Sector Federation. While direct sales resulting from the participation make it worthwhile for the
companies to attend and use it for networking and finding wholesalers, it is unlikely to have an impact
on rural distribution. For those companies doing market fairs in rural areas, perhaps at a cost of a few
hundred dollars each, it’s not yet clear if they recover costs.
Marketing through agents who directly approach customers, rather than waiting for them in a shop,
can be very expensive and views among the market players on their usefulness are very diverse. Two
companies with large sales use this strategy as an integral part of their marketing plan and the results
might indicate that it works well, as they are selling most products on the market.
Chapter 6: Marketing and promotion | 38
On the other hand, a company tried and found it a bad business decision, as sales would not justify
the large management effort to deal with many small agents and to recover costs. The two companies
mentioned earlier are fortunate enough to have some grant financing support to contribute to these
outreach activities. Once agents have been recruited and trained, costs fall and revenues should
continue to come in from these dealers. Very important is an effective management system based on
performance, access to finance or stock, and clear incentives for agents to sell.
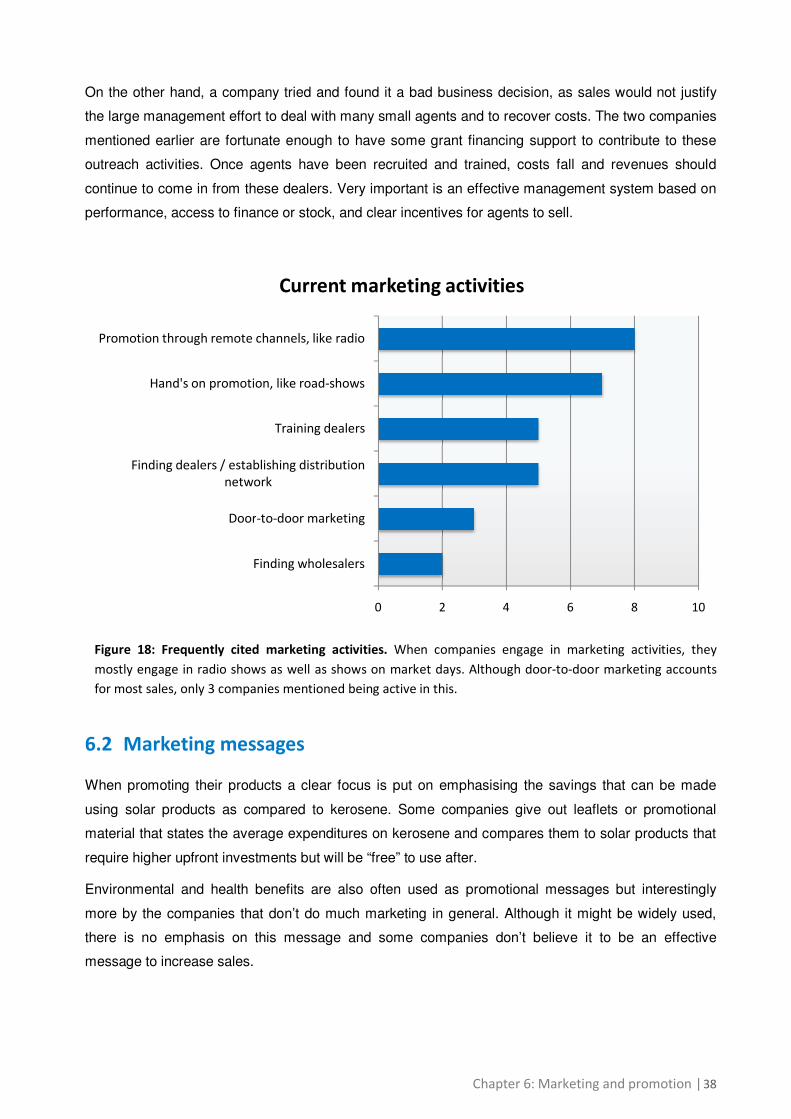
Figure 18: Frequently cited marketing activities. When companies engage in marketing activities, they
mostly engage in radio shows as well as shows on market days. Although door-to-door marketing accounts
for most sales, only 3 companies mentioned being active in this.
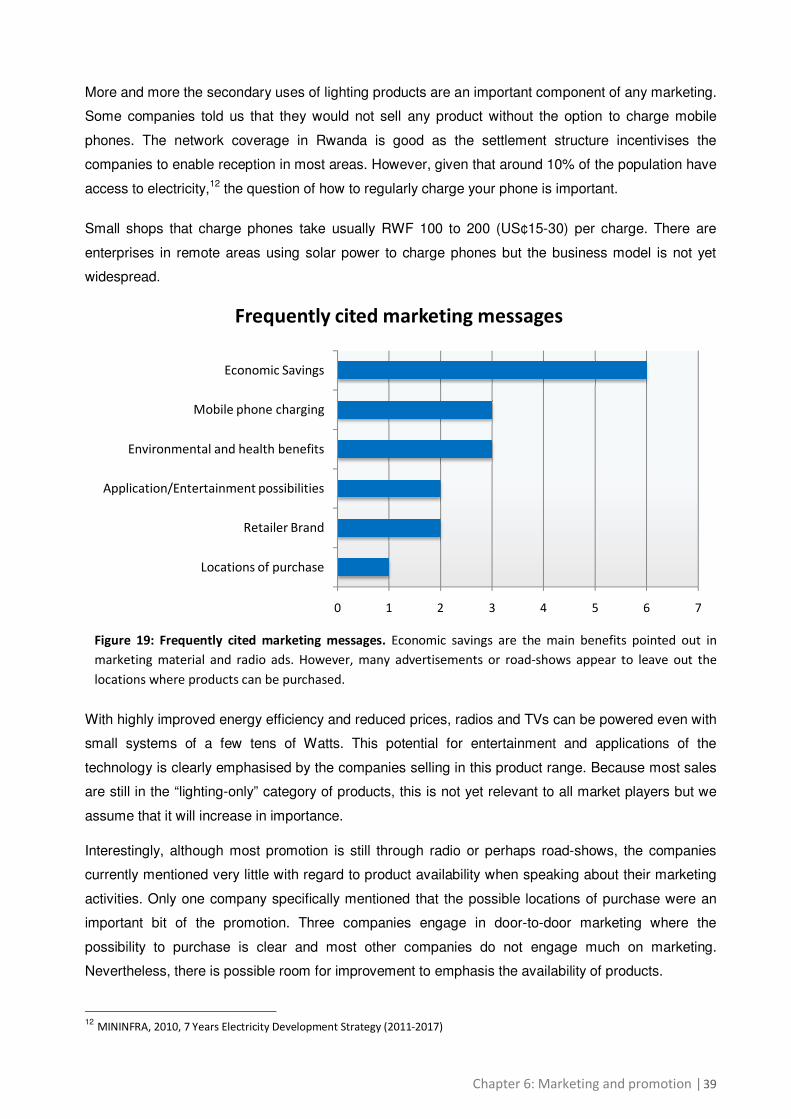
6.2 Marketing messages
When promoting their products a clear focus is put on emphasising the savings that can be made
using solar products as compared to kerosene. Some companies give out leaflets or promotional
material that states the average expenditures on kerosene and compares them to solar products that
require higher upfront investments but will be “free” to use after.
Environmental and health benefits are also often used as promotional messages but interestingly
more by the companies that don’t do much marketing in general. Although it might be widely used,
there is no emphasis on this message and some companies don’t believe it to be an effective
message to increase sales.
0 2 4 6 8 10
Finding wholesalers
Door-to-door marketing
Finding dealers / establishing distribution
network
Training dealers
Hand's on promotion, like road-shows
Promotion through remote channels, like radio
Current marketing activities
Chapter 6: Marketing and promotion | 39
More and more the secondary uses of lighting products are an important component of any marketing.
Some companies told us that they would not sell any product without the option to charge mobile
phones. The network coverage in Rwanda is good as the settlement structure incentivises the
companies to enable reception in most areas. However, given that around 10% of the population have
access to electricity,12 the question of how to regularly charge your phone is important.
Small shops that charge phones take usually RWF 100 to 200 (US¢15-30) per charge. There are
enterprises in remote areas using solar power to charge phones but the business model is not yet
widespread.
Figure 19: Frequently cited marketing messages. Economic savings are the main benefits pointed out in
marketing material and radio ads. However, many advertisements or road-shows appear to leave out the
locations where products can be purchased.
With highly improved energy efficiency and reduced prices, radios and TVs can be powered even with
small systems of a few tens of Watts. This potential for entertainment and applications of the
technology is clearly emphasised by the companies selling in this product range. Because most sales
are still in the “lighting-only” category of products, this is not yet relevant to all market players but we
assume that it will increase in importance.
Interestingly, although most promotion is still through radio or perhaps road-shows, the companies
currently mentioned very little with regard to product availability when speaking about their marketing
activities. Only one company specifically mentioned that the possible locations of purchase were an
important bit of the promotion. Three companies engage in door-to-door marketing where the
possibility to purchase is clear and most other companies do not engage much on marketing.
Nevertheless, there is possible room for improvement to emphasis the availability of products.
12
MININFRA, 2010, 7 Years Electricity Development Strategy (2011-2017)
0 1 2 3 4 5 6 7
Locations of purchase
Retailer Brand
Application/Entertainment possibilities
Environmental and health benefits
Mobile phone charging
Economic Savings
Frequently cited marketing messages
Chapter 6: Marketing and promotion | 40
Four companies have tailored their promotions to the particular range of products which they offer and
understand their target market well. Clearly, the market for a BBOXX product, which offers a range of
possibilities to charge phones, hook up an inverter or a TV, is different from a Firefly Mobile desk lamp
and thus different strategies can lead to success. However, there has been limited experience in
Rwanda and apart from active campaigns by ToughStuff and Great Lakes Energy, the internal
learning from marketing in Rwanda has been fairly limited and companies are still exploring the best
ways to market their products to the consumer.
Chapter 7: Growth targets and challenges | 41
Chapter 7: Growth targets and challenges
The companies are at very different stages of their development and therefore vary widely in terms of
their ambitions and targets. Some see targets as a distraction but others have a clear sales plan in
place, partly due to grant and financing requirements as well as investor expectations.
7.1 Targets
Modest growth targets are certainly not a quality of the market players. One of the companies that is
distributing solar products as a subsidiary activity has set itself a target to increase sales by 50%
within a year. The specialised firms that focus purely on the off-grid lighting market are more
ambitions with 3 companies aiming to quadruple monthly sales by the end of 2012. Boosted marketing
activities and more innovative ideas like leasing should contribute to that increase. A fourth wants to
double the turnover over the coming year with a stronger focus on the market for domestic micro-
systems. The rest of the companies have not set themselves targets.
While we expect increased competition over the coming years between the market players, each of
them is also becoming more aware of the niche they can serve best. Thus, the cited opportunities,
which they identified, cover a broad spectrum.
Dassy Enterprise are geographically focused on the Northern Province and want to focus on areas
that have recently been electrified but where many can’t afford a connection or are just a little too far
to receive a connection. Two companies hope to get larger international organisations and NGOs to
procure large quantities of lanterns. Also other related products at the side provide a business
opportunity, such as Solar Water Heaters, which are now subsidised by the government, or TVs that
can be powered by a small solar system.
7.2 Barriers to growth
In order to achieve these high goals, a range of challenges need to be overcome, all of which are well
known but some may be more profound in Rwanda than in other markets.
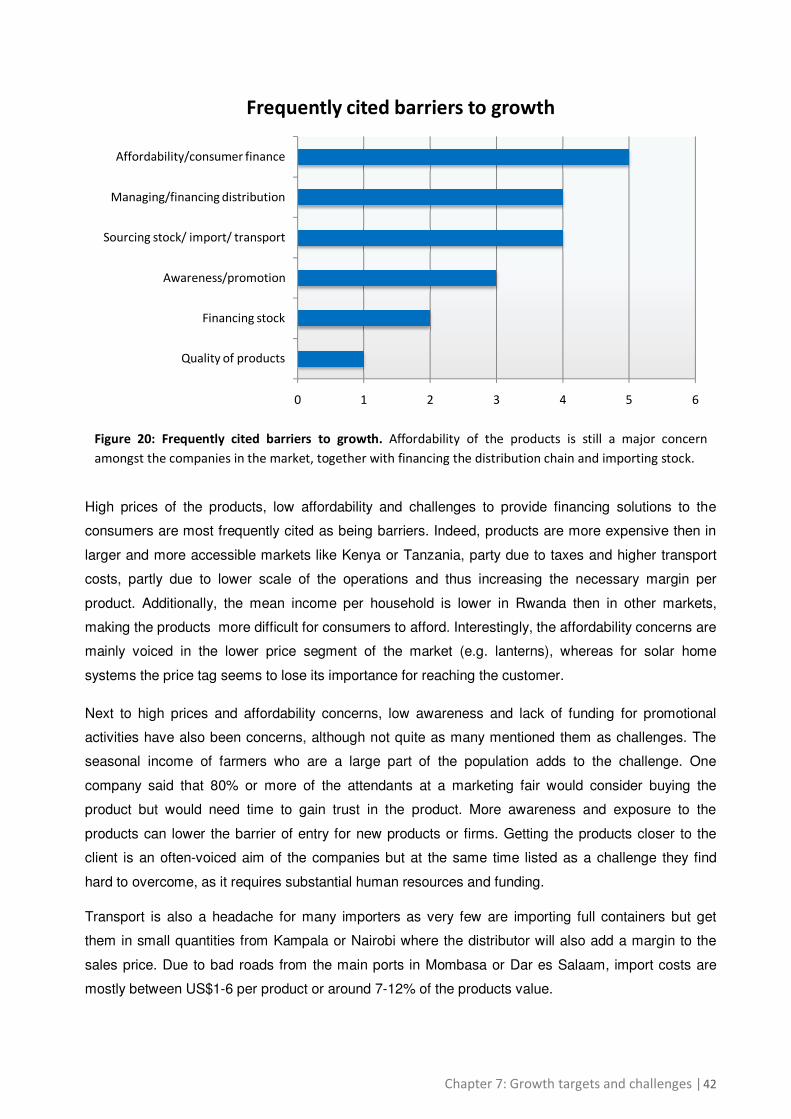
Chapter 7: Growth targets and challenges | 42
Figure 20: Frequently cited barriers to growth. Affordability of the products is still a major concern
amongst the companies in the market, together with financing the distribution chain and importing stock.
High prices of the products, low affordability and challenges to provide financing solutions to the
consumers are most frequently cited as being barriers. Indeed, products are more expensive then in
larger and more accessible markets like Kenya or Tanzania, party due to taxes and higher transport
costs, partly due to lower scale of the operations and thus increasing the necessary margin per
product. Additionally, the mean income per household is lower in Rwanda then in other markets,
making the products more difficult for consumers to afford. Interestingly, the affordability concerns are
mainly voiced in the lower price segment of the market (e.g. lanterns), whereas for solar home
systems the price tag seems to lose its importance for reaching the customer.
Next to high prices and affordability concerns, low awareness and lack of funding for promotional
activities have also been concerns, although not quite as many mentioned them as challenges. The
seasonal income of farmers who are a large part of the population adds to the challenge. One
company said that 80% or more of the attendants at a marketing fair would consider buying the
product but would need time to gain trust in the product. More awareness and exposure to the
products can lower the barrier of entry for new products or firms. Getting the products closer to the
client is an often-voiced aim of the companies but at the same time listed as a challenge they find
hard to overcome, as it requires substantial human resources and funding.
Transport is also a headache for many importers as very few are importing full containers but get
them in small quantities from Kampala or Nairobi where the distributor will also add a margin to the
sales price. Due to bad roads from the main ports in Mombasa or Dar es Salaam, import costs are
mostly between US$1-6 per product or around 7-12% of the products value.
0 1 2 3 4 5 6
Quality of products
Financing stock
Awareness/promotion
Sourcing stock/ import/ transport
Managing/financing distribution
Affordability/consumer finance
Frequently cited barriers to growth
Chapter 7: Growth targets and challenges | 43
Financing their dealers to allow them to purchase more stock is still a barrier that the companies have
struggled to fully address. One company had a relationship with the financing institution but the loan
assessment and other managerial issues led to the decision to change the business model, in which
less upfront financing from the dealer is required. While currently three companies give credit to
retailers, none of the companies that have a large dealer network or sales agents give credit or only in
exceptional circumstances. One firm that did this in the past but had difficulties in repayment because
the dealers did not sell as many products as intended in the given timeframe, leading to cash flow
problems for the firm. Managing a network of 100+ agents or targeting a network of 500 entrepreneurs
is a challenge. Managing contracts and payments as well as providing training to the affiliated retailers
requires sophisticated managerial systems, which the large companies have been able to test
elsewhere in the region or over some years in Rwanda.
Smaller players might not be able to manage such complex operations and may decide instead to
become affiliated with an importer/wholesaler in the country. Whereas suppliers often give credit for
larger wholesale deals, small dealers and agents do not have that option. They need the purchasing
power to stock products and the lack of this capacity limits overall sales of the distributor.
Interestingly, only two companies cited import financing for stock as a problem. The explanation might
be twofold, because first, companies that don’t have large sales volumes or turnover per month and
can purchase the products from Uganda or Kenya every few month with available capital. Secondly,
the large sellers have completed their capitalisation before starting the operations and are well
endowed with upfront capital. If the market grows, however, this could become a larger challenge then
it is currently.
The quality of products appears not to be a major concern anymore. While some distributors had
products with high failure rates one or two years back this seems to have been tackled by the
manufacturers because the three distributors that were unsatisfied with certain products in the past
did not voice this as a barrier of importance. Partially they have moved to different products, partially
the manufacturer has improved the product. The only firm that mentioned quality being an issue for
the scale up of the company is focusing on the institutional and SHS market where a larger range of
suppliers exist and no easily understandable and enforced quality standards or labels such as Lighting
Africa certification are available.
Background: The Energy SME support programme in Rwanda | 44
Background: The Energy SME support
programme in Rwanda
In 2009 the Russian Federation provided US$30 million to support energy enterprises in sub-Saharan
Africa. The objective of the Energy SME Trust Fund, which is administered by the World Bank, is to
provide additional financing and technical assistance to Small and Medium Enterprises (SMEs) in
selected countries in sub-Saharan Africa. It aims to foster local private sector entrepreneurship and
investment in the provision of energy services in remote, un-served and under-served regions in Sub-
Saharan Africa and to increase access to reliable, sustainable and affordable modern energy
services. For the preparation and implementation of the activities, the World Bank is collaborating with
GVEP (Global Village Energy Partnership) who directly support the enterprises in order to access this
funding.
Rwanda is one of the countries selected for support under the ESME Trust Fund. This support in the
form of grant funding, which supplements the existing Sustainable Energy Development Project
(SEDP), will be used to: a) provide funding to private developers for micro-hydropower projects and
associated mini-grid networks; b) build capacity aimed at strengthening the quality of the local pico-
hydro sector through business training and technical assistance and c) provide grants to local
businesses to support marketing and the development of a dealer network for low-cost off-grid lighting
solutions in rural areas. The Energy Water and Sanitation Authority (EWSA) is implementing the
project with assistance from GVEP, whereby GVEP will provide in-kind support in the pre-investment
phase to micro-hydro developers and assist suppliers of off-grid lighting products.
Grants for marketing off-grid lighting solutions
The ESME Project in Rwanda will provide small grants to local businesses to support the
development of retail networks for off-grid lighting products in rural areas and to scale-up their
marketing and awareness campaigns.
The project aims to promote the private sector to engage in rural markets for off-grid lighting solutions
as well as building consumer awareness and trust. It provides grants to local businesses to support
the development of a dealer network for low cost lighting solutions in rural areas. Low-cost solar
products are proving popular in East Africa and are affordable by large numbers of people. As this
report has shown, there is a significant potential market in Rwanda that remains undeveloped.
Nevertheless, the few companies currently dealing in these products are small and have limited cash
flow. Building consumer awareness and trust, and creating and training networks of local resellers is
time consuming and expensive but an important element to build up volume sales.
Background: The Energy SME support programme in Rwanda | 45
The social, health and environmental benefits, which accrue from replacing kerosene lanterns with
solar PV alternatives, justify the use of public funds to assist businesses in their marketing activities.
Most manufacturers or distributors do not have a marketing budget or for those who have, the costs of
informing and educating customers are prohibitive. Door-to-door or direct marketing is often seen as
most effective but the logistics involved are expensive.
The aim of the intervention is to allow enterprises dealing in those products to conduct marketing
activities at a large enough scale to have substantial impact and help them to reach a consumer base
high enough to operate financially sustainably and independent from government and donor funding in
the future. Support is expected to be phased-out by the end of the ESME Project by achieving
economies of scale and lower import and transaction costs to get a product sold in the rural market.
This market assessment provides an overview of the off-grid lighting market in Rwanda at the end of 2011. Ten active companies in supplying low-cost lighting solutions were interviewed on their products and sales data, their distribution channels and marketing activities as part of a baseline assessment of the off-grid lighting market in Rwanda. This report summarises the findings of this research and provides an overview of the current status of the market, the key players and their products. It also gives insights in product availability and
affordability with a focus on off-the-shelf lighting products.
The report also describes the kinds of products currently available in Rwanda, the segmentation of the market between smaller and
larger products and the geography of sales.
GVEP International Head Office
Fifth Floor - Totara Park House
34-36 Gray’s Inn Road
London WC1X 8HR
United Kingdom
Tel: +44 (0) 207 242 8602
Website: www.gvepinternational.org
Email: [email protected]